Introduction
Acute lymphocytic leukemia and breast cancer, both of which are auxotrophic for L-glutamine, are major causes of death worldwide. [
1]
Bacterial origins of L-glutaminase are cost-effective and efficient in cancer therapy, food industry, and synthesis of valuable chemicals like threonine. [
2]
Auxotrophic cancer cells, such as leukemic and breast cancer cells, are unable to generate the amino acid L-glutamine, which is required for life and growth. L-glutaminase is an amide that contributes significantly to cancer cells’ nitrogen metabolism. L-glutaminase is a taste and aroma enhancer used in the food industry. Another notable use is using L-glutaminase in biosensors to monitor L-glutamine levels in mammalian and hybridoma cell cultures without requiring separate L-glutamic acid tests. [
3]
It can, however, be synthesized by normal human cells. [
4] It is extremely advantageous to deplete these cancer cells of L-glutamine utilizing bacterial L-glutaminase. [
5]
The physiological relevance of L-glutamine for cancer cell biology involves the fact that normal cells can generate it. [
6] Still, cancer cells require it as a source of nitrogen for metabolism. [
7] L-glutaminase, a hydrolase enzyme, converts L-glutamine into ammonia and L-glutamate. [
8] L-glutaminase is an amidohydrolase that can be used as a chemotherapeutic agent to treat a wide range of malignancies. [
9] Different microbial sources of L-glutaminase have sparked significant interest in a wide range of biological activities.
Alcaligenes Faecalis L-glutaminase has been demonstrated to exhibit an anti-tumor effect against the HeLa cell line, [
10] as has
Bacillus cereus MTCC 1305 against the hepatocellular carcinoma (Hep-G2) cell line. [
11]
L-glutaminase from
Pseudomonas 7A decreases mRNA translation and lowers viral replication, demonstrating antiviral activity against retroviral disease. [
12]
Bacillus amyloliquefaciens L-glutaminase was also used in food to improve flavor. [
13] While the
Bacillus cereus LC13 L-glutaminase displayed antioxidant activity when coupled with ascorbic acid. [
14]
Exogenous L-glutamine is necessary for the survival of glutamine-dependent tumor cells. [
15] With regard to auxotrophic cancer cells, including those seen in leukemia and breast cancer, the current work aimed to find molecularly and produce bacterial L-glutaminase from several Egyptian bacterial soil habitats as an anticancer drug.
Methodology
Ethical Statement:
The current study adhered to all relevant institutional, international, national, and national guidelines for the use and care of animals. All study procedures, including the use of animals, were approved by the Cairo University Ethics Committee for Animal Handling (ECAHCU) at the Faculty of Pharmacy, Cairo University, Egypt. This approval was granted on August 2, 2023, and followed the recommendations of the weather-all report. The permission number for the study was VZ18. Every effort was made to minimize the suffering and quantity of animals involved in the research.
Place and Date of the Study:
The pharmacy program at Cairo University carried out this study in Egypt from February 2023 to July 2024.
Collection of the Samples:
One hundred soil samples were collected at a depth of twenty centimeters from several governorates in Egypt, including Menofia, Sharqia, Qalyobia, Alexandria, and Fayoum.
The Type of the Study:
Screening experimental study.
Source of Chemical Substances and Reagents:
All of the substances utilized in this investigation were bought from the Egyptian pharmaceutical chemical business Algomhuria. Analytical grades were used for all chemical reagents.
Equipment:
A list of the used instruments are comprised in
Table 1.
Identification of L-Glutaminase Producing Bacterial Isolates:
To identify and isolate bacteria that can use L-glutamine as their sole metabolic source of nitrogen, a selective medium known as mineral glutamine agar (MGA) was employed.
Table 2 lists the MGA plate’s constituent parts.
Following their combination, the ingredients were mixed in hot water and swirled frequently until the mixture was completely dissolved. After that, the medium was cooled in a water bath to a temperature of 37 ̊C and a pH 7.3. Once the ingredients were combined to a volume of 15-20 ml, the plates were instantly poured into dishes measuring 90 mm in diameter.
The bacterial isolates cultivated on MGA plates were identified by beta-hemolysis using blood agar enrichment plates, which allowed for the characterization of the L-glutaminase-producing species in addition to Gram staining, biochemical responses, and colony form.
Composition of Blood Agar:
Constitution of blood agar is incontestable in
Table 3.
After the components were blended and autoclaved at 121ˊC for 15 minutes, 5% sheep blood was added.
Molecular Detection of Potent L-Glutaminase Producing Bacterial Isolates:
This was accomplished by employing the 16S rRNA sequencing technology after the DNA extraction process.
Procedure of 16S rRNA Sequencing Technique:
QIAGEN, USA is the source of the QIAGEN MultiplexTM PCR Kit, catalog number 206143. The 16S rRNA sequence analysis was used to molecularly depict the L-glutaminase-producing bacterial isolates. The forward and reverse primers had the sequences 5--CAGCCGCGGTAATAC-3- and 5--ACGGGGGGTGTGTAC-3-, respectively. The 16S rRNA gene was cloned using the polymerase chain reaction (PCR) method. For five minutes, the first denaturation was at 98°C. 25 rounds of denaturation at 94°C for 30 seconds came next. The annealing step was placed for 30 seconds at 54°C. Ultimately, the extension phase was set for ten minutes at 72°C. The amplicons’ size was determined by repeatedly using Agarose gel electrophoresis.
Using the nucleotide basic local alignment search tool (BLASTn), the generated sequences were compared to sequences stored in the Gen-bank database of the National Center for Biotechnology Information (NCBI).
Purification of L-Glutaminase:
With the use of a BioPro IEX SmartSep Q kit (purchased from YMC, USA), this was accomplished by partial purification using 70% ammonium sulfate in conjunction with the Cation exchange resin chromatography method on nickel columns. The molecular mass of L-glutaminase was measured using a mass spectrometer (QUADRUPOLE MASS SPECTROMETER BELMASS II, MICROTRAC, USA).
Estimation of the L-Glutaminase Activity:
The L-glutamic acid assay’s UV photometric measurement was used to accomplish this. Samples of soil were diluted in steps of 10-1 to 10-6. Additionally, each 1 ml of aqueous soil sample in a test tube received 1 ml of 5 mM L-glutamine substrate. The mixture was incubated at 37 ̊ C and pH 7 for eighteen hours. The mixed test tubes were then centrifuged for three minutes at 500 rpm. The supernatants were divided into different centrifuge tubes so that the absorbance of the L-glutamic acid that was liberated during the hydrolysis of L-glutamine by L-glutaminase could be measured at a wavelength of 216 nm using a UV spectrophotometer.
Determination of Apoptosis Evoked by L-Glutaminase:
The Caspase 3 assay was utilized for this purpose. The approach was used as previously documented, per the Kim RH et al., 2021 paper. [
16]
Invitro Synthesis of L-Glutaminase:
The coupled invitro transcription-translation method was used to accomplish this.
This was done using the 1-Step Human Coupled IVT Kit, which was bought from ThermoFisher Scientific, USA. The actions were performed in compliance with the kit’s manufacturer’s instructions. In summary, the genomic DNA encoding the target protein (L-glutaminase) was extracted from the soil samples using restriction endonuclease enzymes type II (purchased from Invitrogen, USA) such as GsuI and HaeII. Moreover, this gene was cloned using PCR. Primer Plus version 3 software was used to build the primers for PCR cloning. The desired gene was cloned using the forward primer 5--GCGTGATGGAAGAAACCATT-3- and the reverse primer 5--CATCCAGAATCGGGTTCACT-3-.
Afterwards, 0.5 µg of a PCR-generated fragment containing a T7 promoter was added to an aliquot of the 1-Step Human Coupled IVT kit in a test tube. The mixture was placed in a 100 µl reaction container and incubated for 100 minutes at 30 ̊C. Additional purification of the protein was not required.
The Nesslerization assay was used to assess the test enzyme’s effectiveness in the presence of several cofactors, including Ni+2, Mn+2, Mg+2, K+1, Fe+2, Cu+2, and Ba+2, as well as in a variety of pH values (2–13) and temperature conditions (20–80 ˊC).
Protein Content of L-Glutaminase Estimation:
Using Lowry’s method and bovine serum albumin as the reference, the protein content of the crude L-glutaminase enzyme source was assessed. The results were expressed as mg/ml.
In Vitro Cell Viability Assay:
The Vero cell line and human cancer cell lines, which included HepG-2 (liver), HCT-116 (colon), MCF-7 (breast), A-549 (lung), CCL-120 (lymphocytic), and Hela (cervical), were used to investigate the toxicological effects of the L-glutaminase enzyme. Every cell line was acquired from Accegen in the United States.
The cells containing the tumors were cultured in Dulbecco’s modified Eagle’s medium (DMEM-F12 and 10% heat-inactivated fetal calf serum [GIBO]), supplemented with 110 mcg/ml of penicillin and 115 mcg/ml of streptomycin, and maintained at 37 ̊̊C in a humidified atmosphere with 5% carbon dioxide.
Cells were seeded at a density of 2×10⁶ in a 30-ml tissue culture flask, and they were incubated at 37ˊC until 85–90 confluent sheets were formed.
The MTT ((diphenyl tetrazonium)dimethylthiazol-2-yl)cell viability evaluation of bacterial L-glutaminase as an oncolytic agent) the test was applied. The cell culture medium was thrown away. The medium was thoroughly aspirated for adhering cells. Before the media was cautiously aspirated, the 96-well plate was spined for suspended cells and placed in a microplate centrifuge set at 1,000 x g, 4 °C, for 5 minutes. Each well received 50 milliliters of serum-free media and 50 milliliters of MTT solution. For three hours, the plate was incubated at 37°C. 150 L of MTT solvent was added to each well during the incubation time. Covered with foil, the plate was shaken on an orbital shaker for fifteen minutes. It was necessary to occasionally pipette the liquid in order to completely dissolve the MTT formazan. The absorbance at OD=590 nm was measured in less than an hour.
Estimation of Antioxidant Activity of L-Glutaminase:
To do this, the DPPH[2, 2-diphenyl-2-picryl-hydroxyl] test was employed. The process was mixing two milliliters of DPPH solution (bought from Sigma Aldrich, Germany) with two milliliters of L-glutaminase extract solution. When the color of DPPH changed from purple to yellow in the corresponding hydrazine, the absorbance at 225 nm could be monitored to determine the antioxidants’ scavenging and reducing power towards the compound.
Determination of Kinetic Properties of L-Glutaminase:
This was achieved by plotting Michaelis Menten. A one-phase exponential association nonlinear regression curve was fitted to the data using GraphPad Prism version 5. L-glutamine at various concentrations (1–10 mM) was used as the substrate to calculate the kinetic characteristics of the pure L-glutaminase, such as the Michaelis–Menten constant (Km) and maximal velocity (Vmax). The Michaelis-Menten plot was utilized to assess the kinetic characteristics of L-glutaminase by measuring the rate of hydrolysis of L-glutamine under standard test conditions.
Statistical Analysis
Each culture was performed three times. The current study’s results were presented using the means and standard deviation (SD). Two methods for doing statistical analysis were one-way analysis of variance (P-value≤0.05) and statistical analysis utilizing Excel spreadsheet software. The F statistical test was used for this inquiry.
Results
On MGA, the only isolated bacteria that required L-glutamine for metabolic nitrogen thrived successfully. Fifty three bacterial isolates showed positive growth. The remaining 47 bacterial soil samples showed negative growth.
37 ̊C and pH 7.4 were the ideal values to produce positive bacterial isolates.
The main positive bacterial isolates that produced L-glutaminase were Bacillus subtilis subsp. niger (ATCC 9372), according to morphological and biochemical analyses of soil samples from various soil conditions in Egypt.
The activators KCL, ZnSO4, FeSO4, K2HPO4, and MgSO4 provided the best conditions for determining L-glutaminase synthesis at 37 °C and pH of 7.4.
Bacillus subtilis subsp. niger (ATCC 9372) L-glutaminase was found to be an effective and highly bioavailable anticancer medication.
The molecular mass of L-glutaminase was around 36 kDa. Total activity of 21,883 ± 15.67 (U), specific activity of 379.14 ± 7.35 (U/mg of protein), and purification fold of 1.82 ± 3.06 with final enzyme recovery 60.22 ± 2.17% were obtained from the purification of L-glutaminase. The original yield [productivity] from MGA was 6.3 U/ml, but invitro coupled transcription and translation production raised it to 89± 1 U/ml.
Ni2+ and Mg2+, two enzymatic activators, raised L-glutaminase activity by 20% and 27%, respectively.
IC50 values for the drug against cancer cell lines from the liver (HepG-2), colon (HCT-116), breast (MCF-7), lung (A-549), lymphocytic (CCL-120), and cervical (Hela) revealed substantial anticancer activity (IC50 = 38.72, 8.6, 6.41, 19.02, 49.83, and 9.45 μg/ml).
A greater affinity for the substrate was shown by the kinetic parameters Km and Vmax, which were 15.2^ 10-3 M and 119.86 μmol/ml/min, respectively.
At pH 6.5 and 35 degrees Celsius, the enzyme showed significant efficacy. Throughout an hour at 58 ̊̊C, the enzyme continued thermostable.
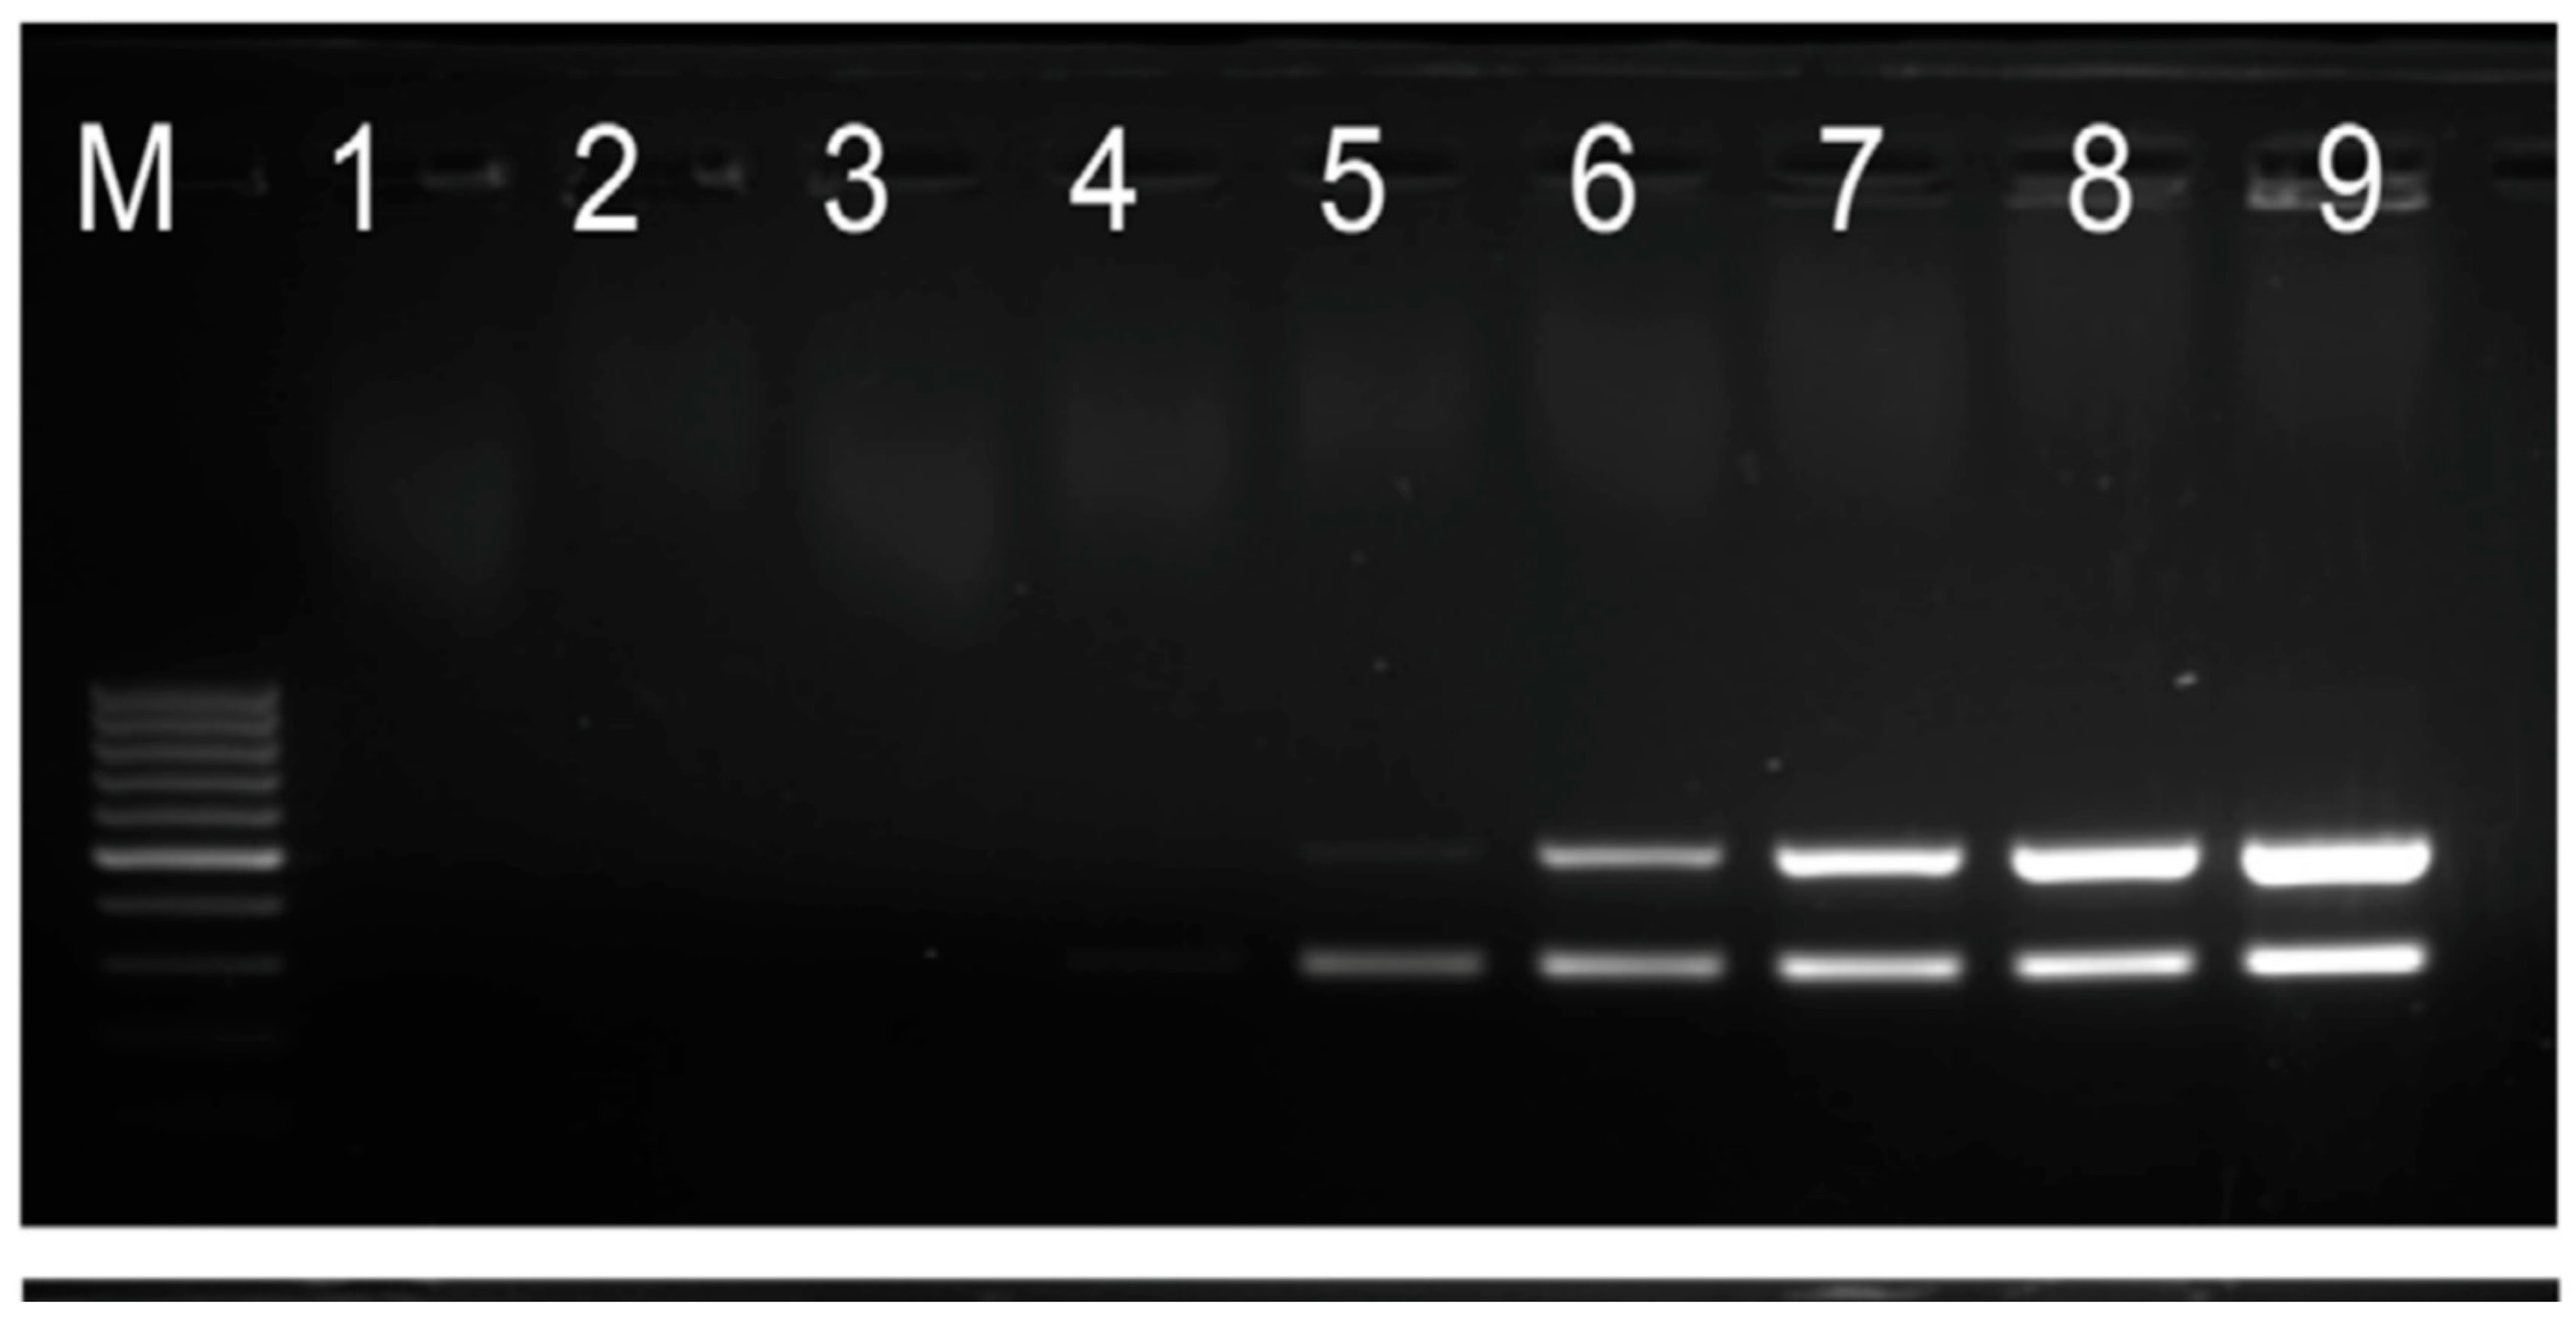
The PCR cloning of the gene encoding L-glutaminase, which was isolated from
Bacillus subtilis subsp. niger (ATCC 9372), is shown in
Figure 1.
The effects of various metal ions on L-gutaminase activity are displayed in
Table 8.
The effects of varying pH on L-glutaminase activity are shown in
Table 7.
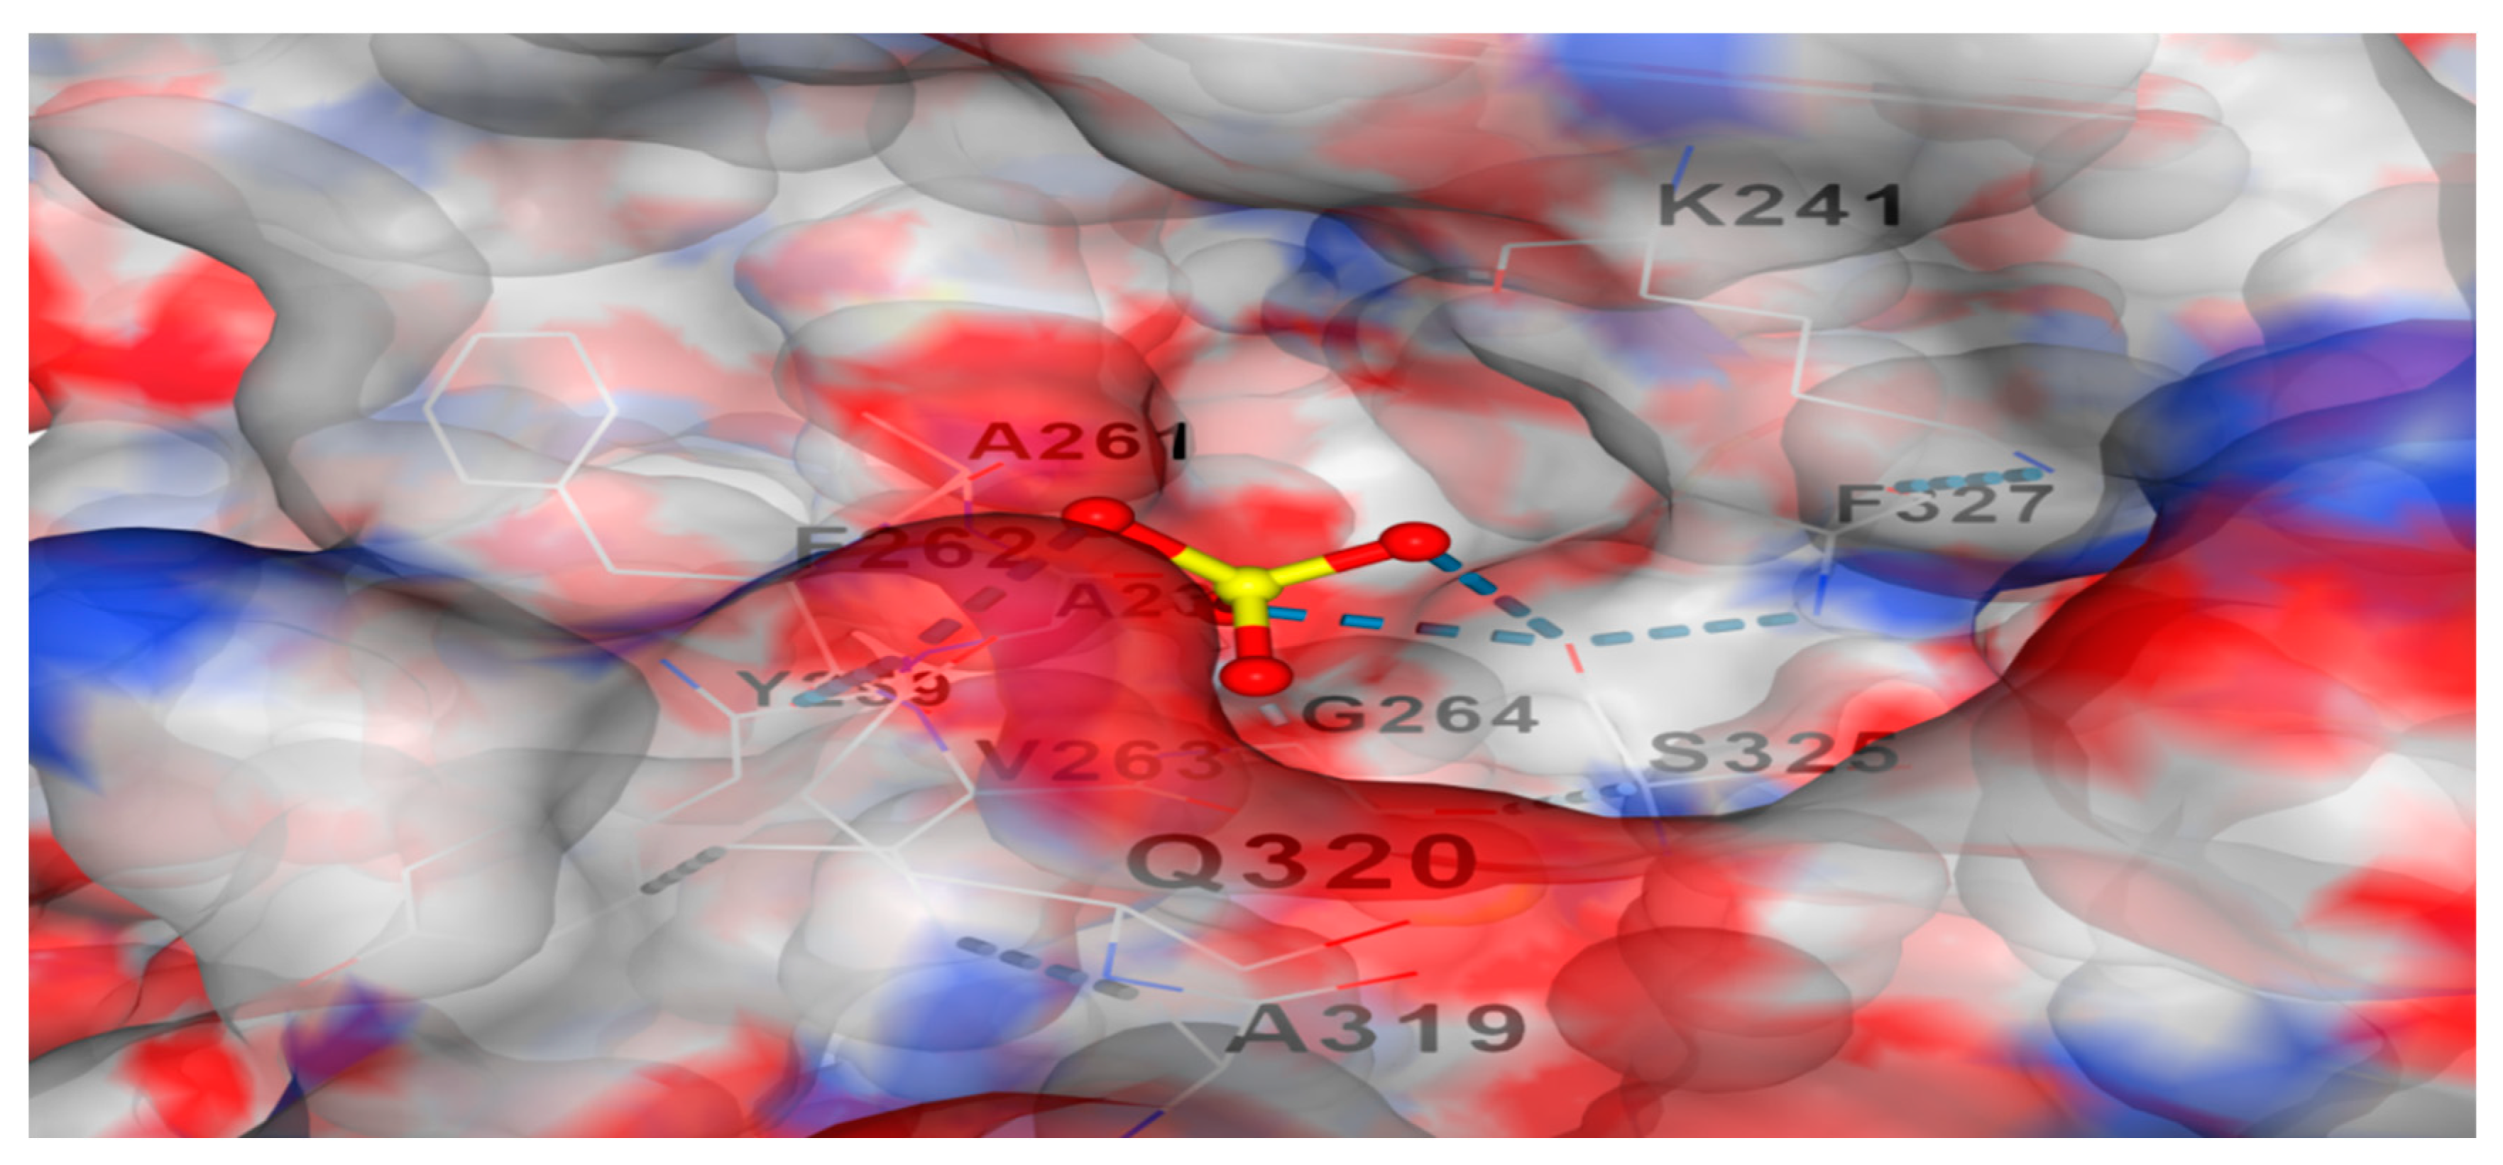
Table 6 displays how temperature affects L-glutaminase activity. The test L-glutaminase’s docking with the Ni
+2 cation is shown in
Figure 4. A strong bond exists between them.
Using NEBcutter
TM V3.0 software,
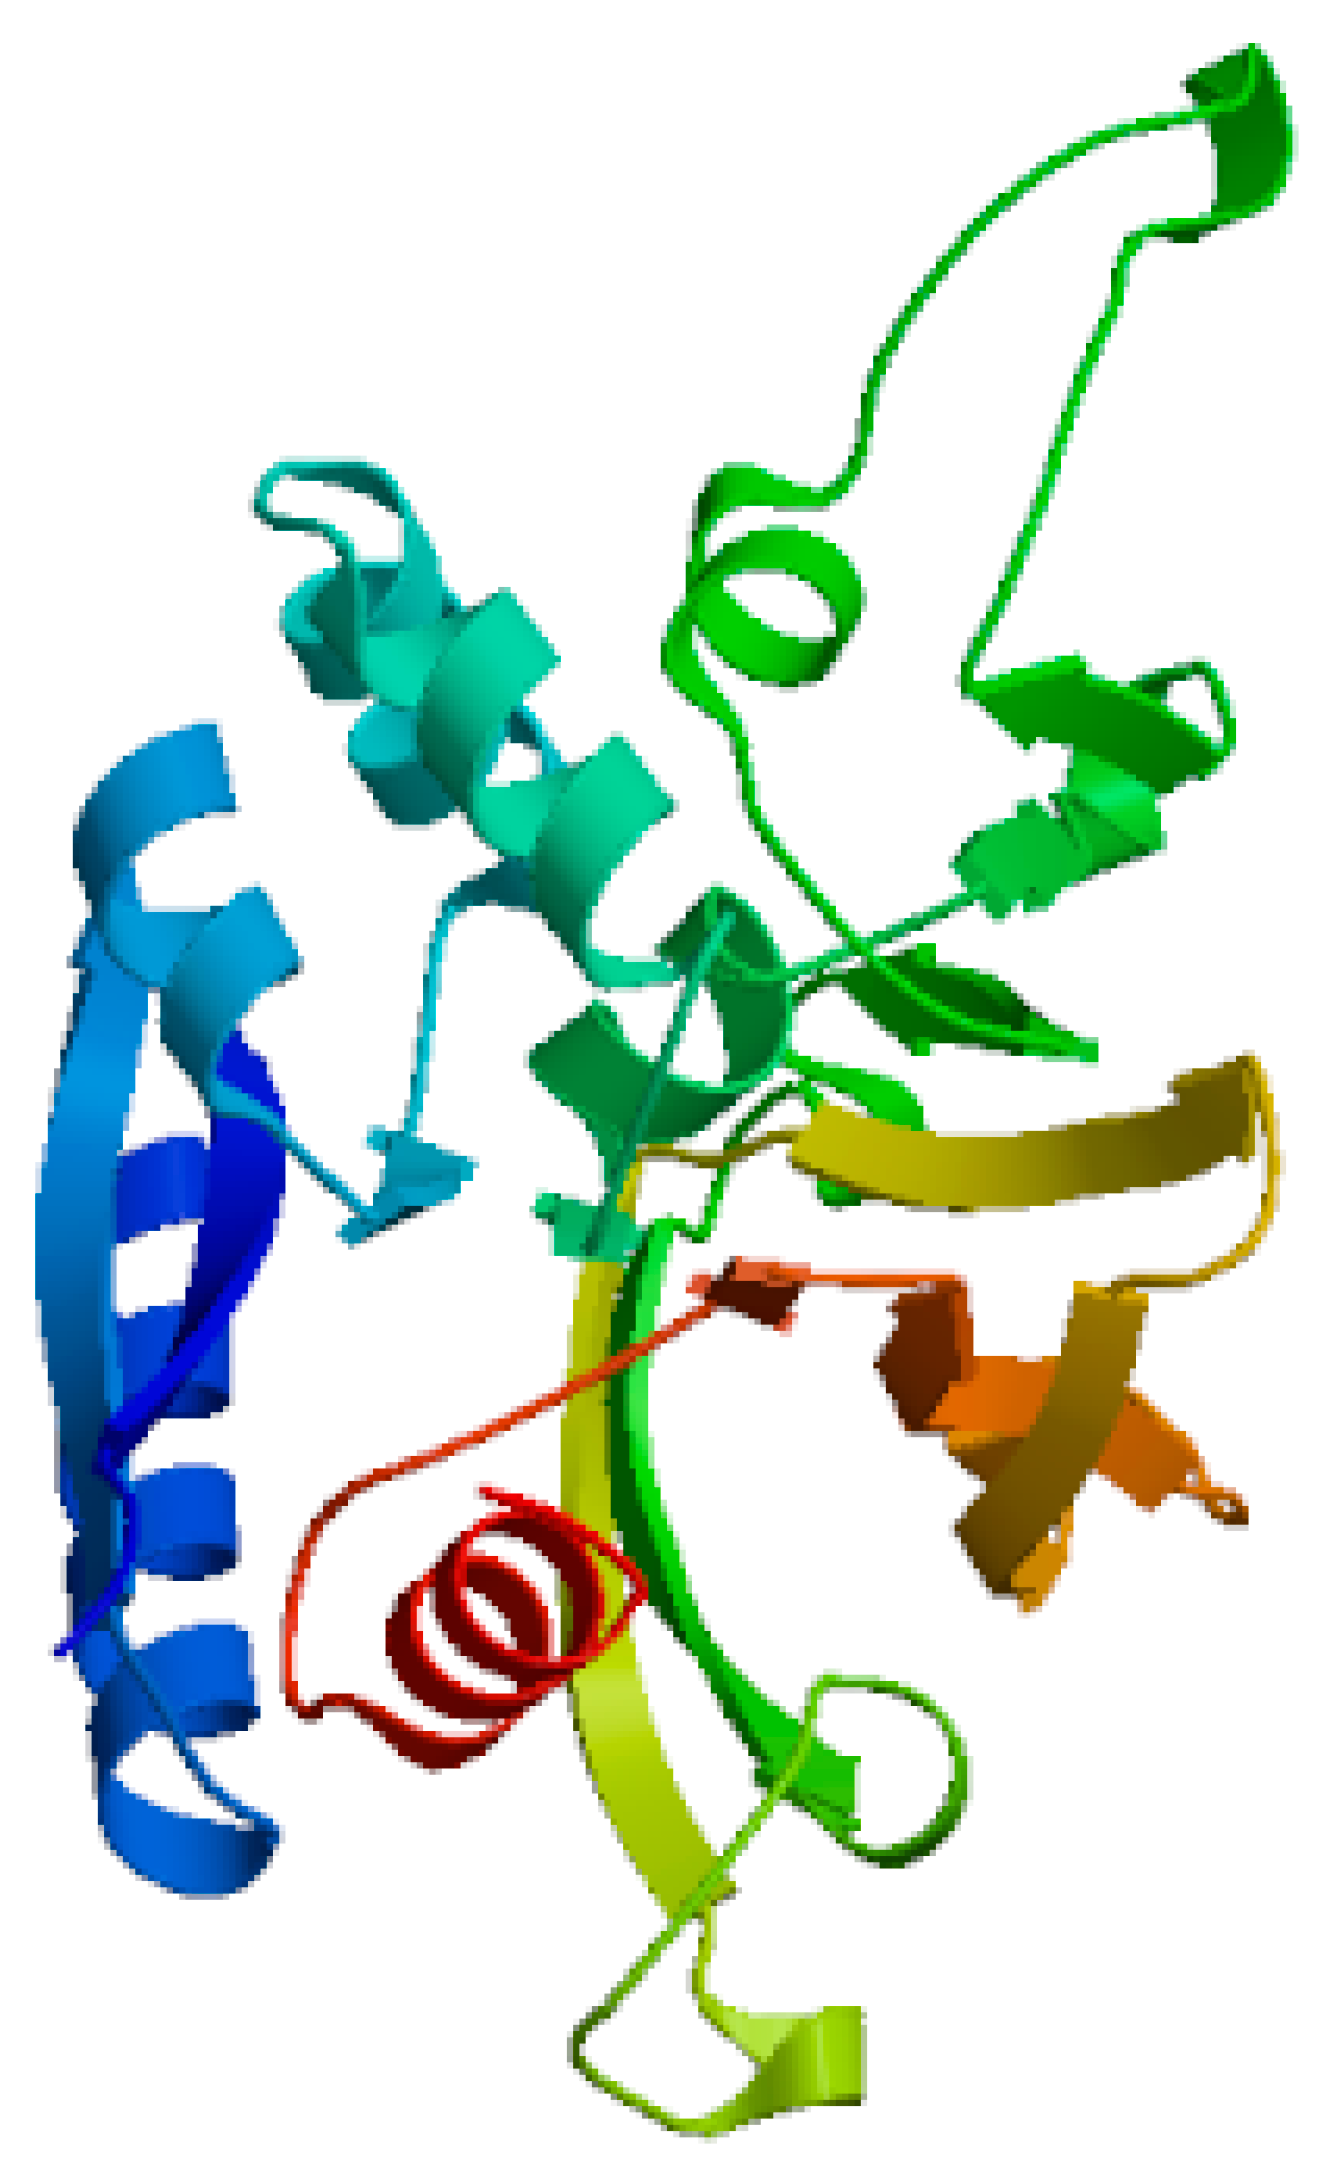
Figure 2 finds the cutting enzymes in the coding sequence (CDS) of L-glutaminase. The three-dimensional structure of L-glutaminase, produced using SWISS-MODEL software, is depicted in
Figure 3. Using BLASTn software,
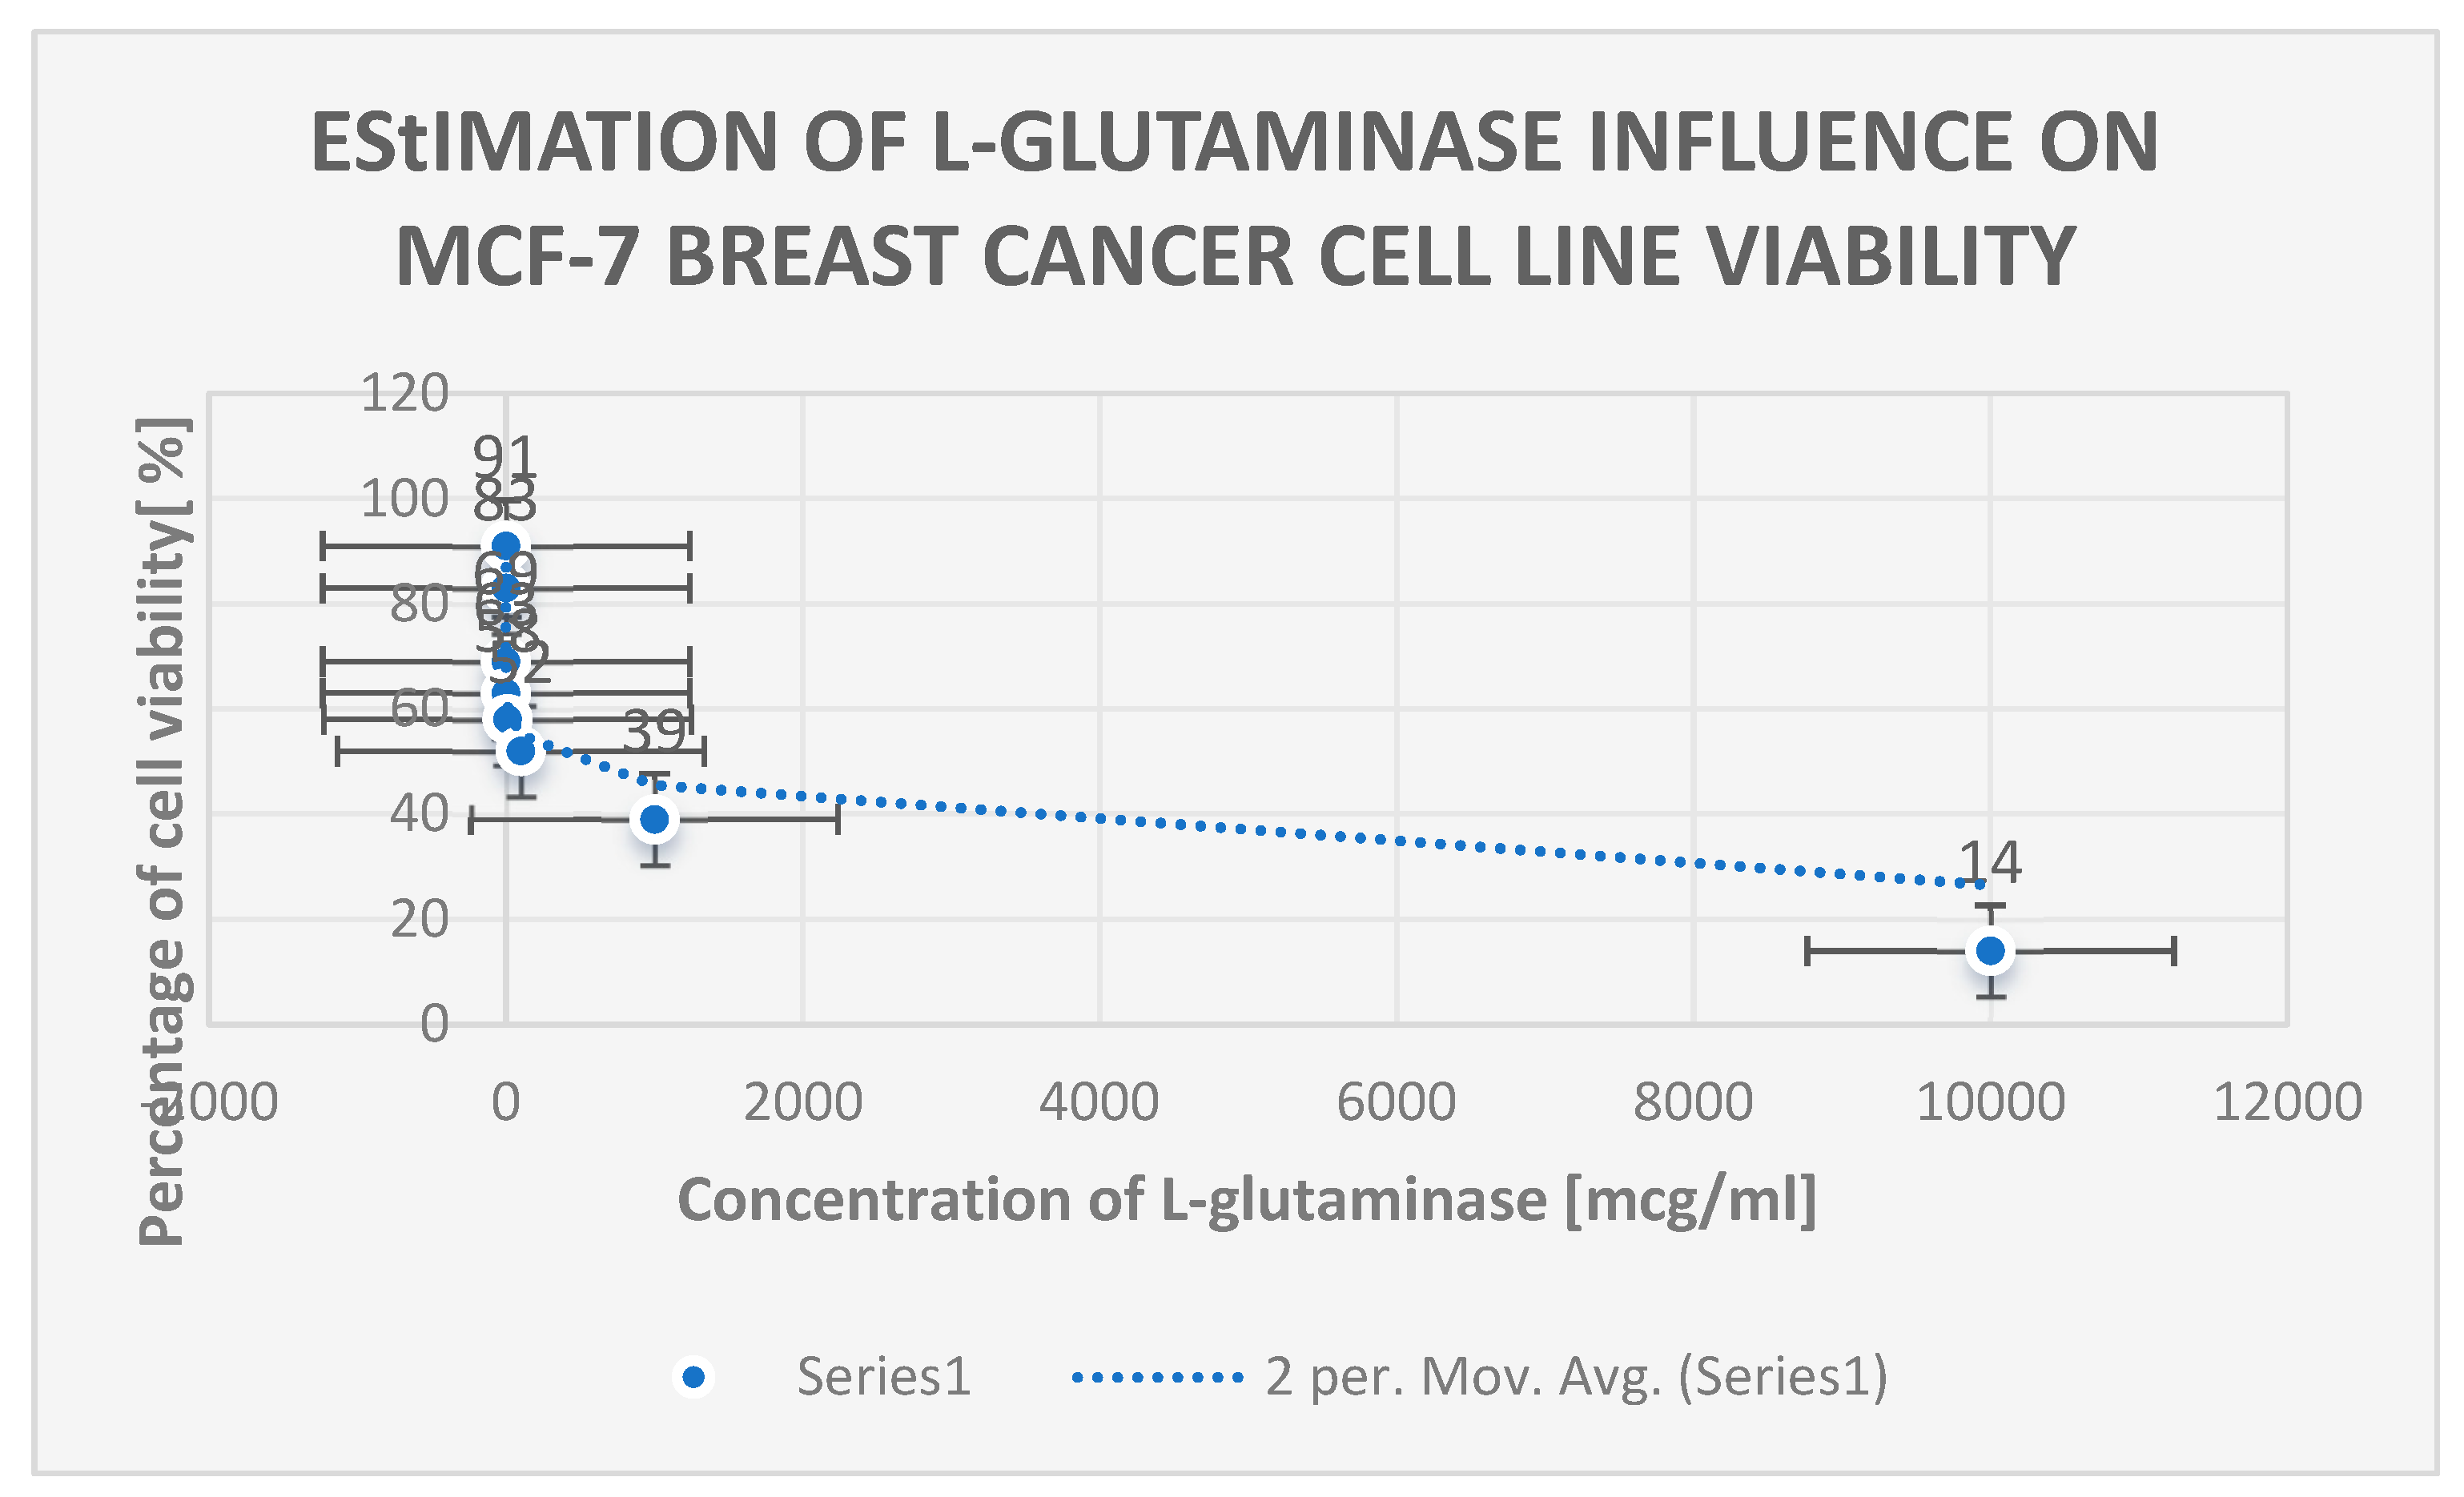
Table 5 displays the 16S rRNA homology of the most common L-glutaminase-producing bacterial isolates. The cytotoxic effect of L-glutaminase on the MCF-7 breast cancer cell line is seen in
Figure 16.
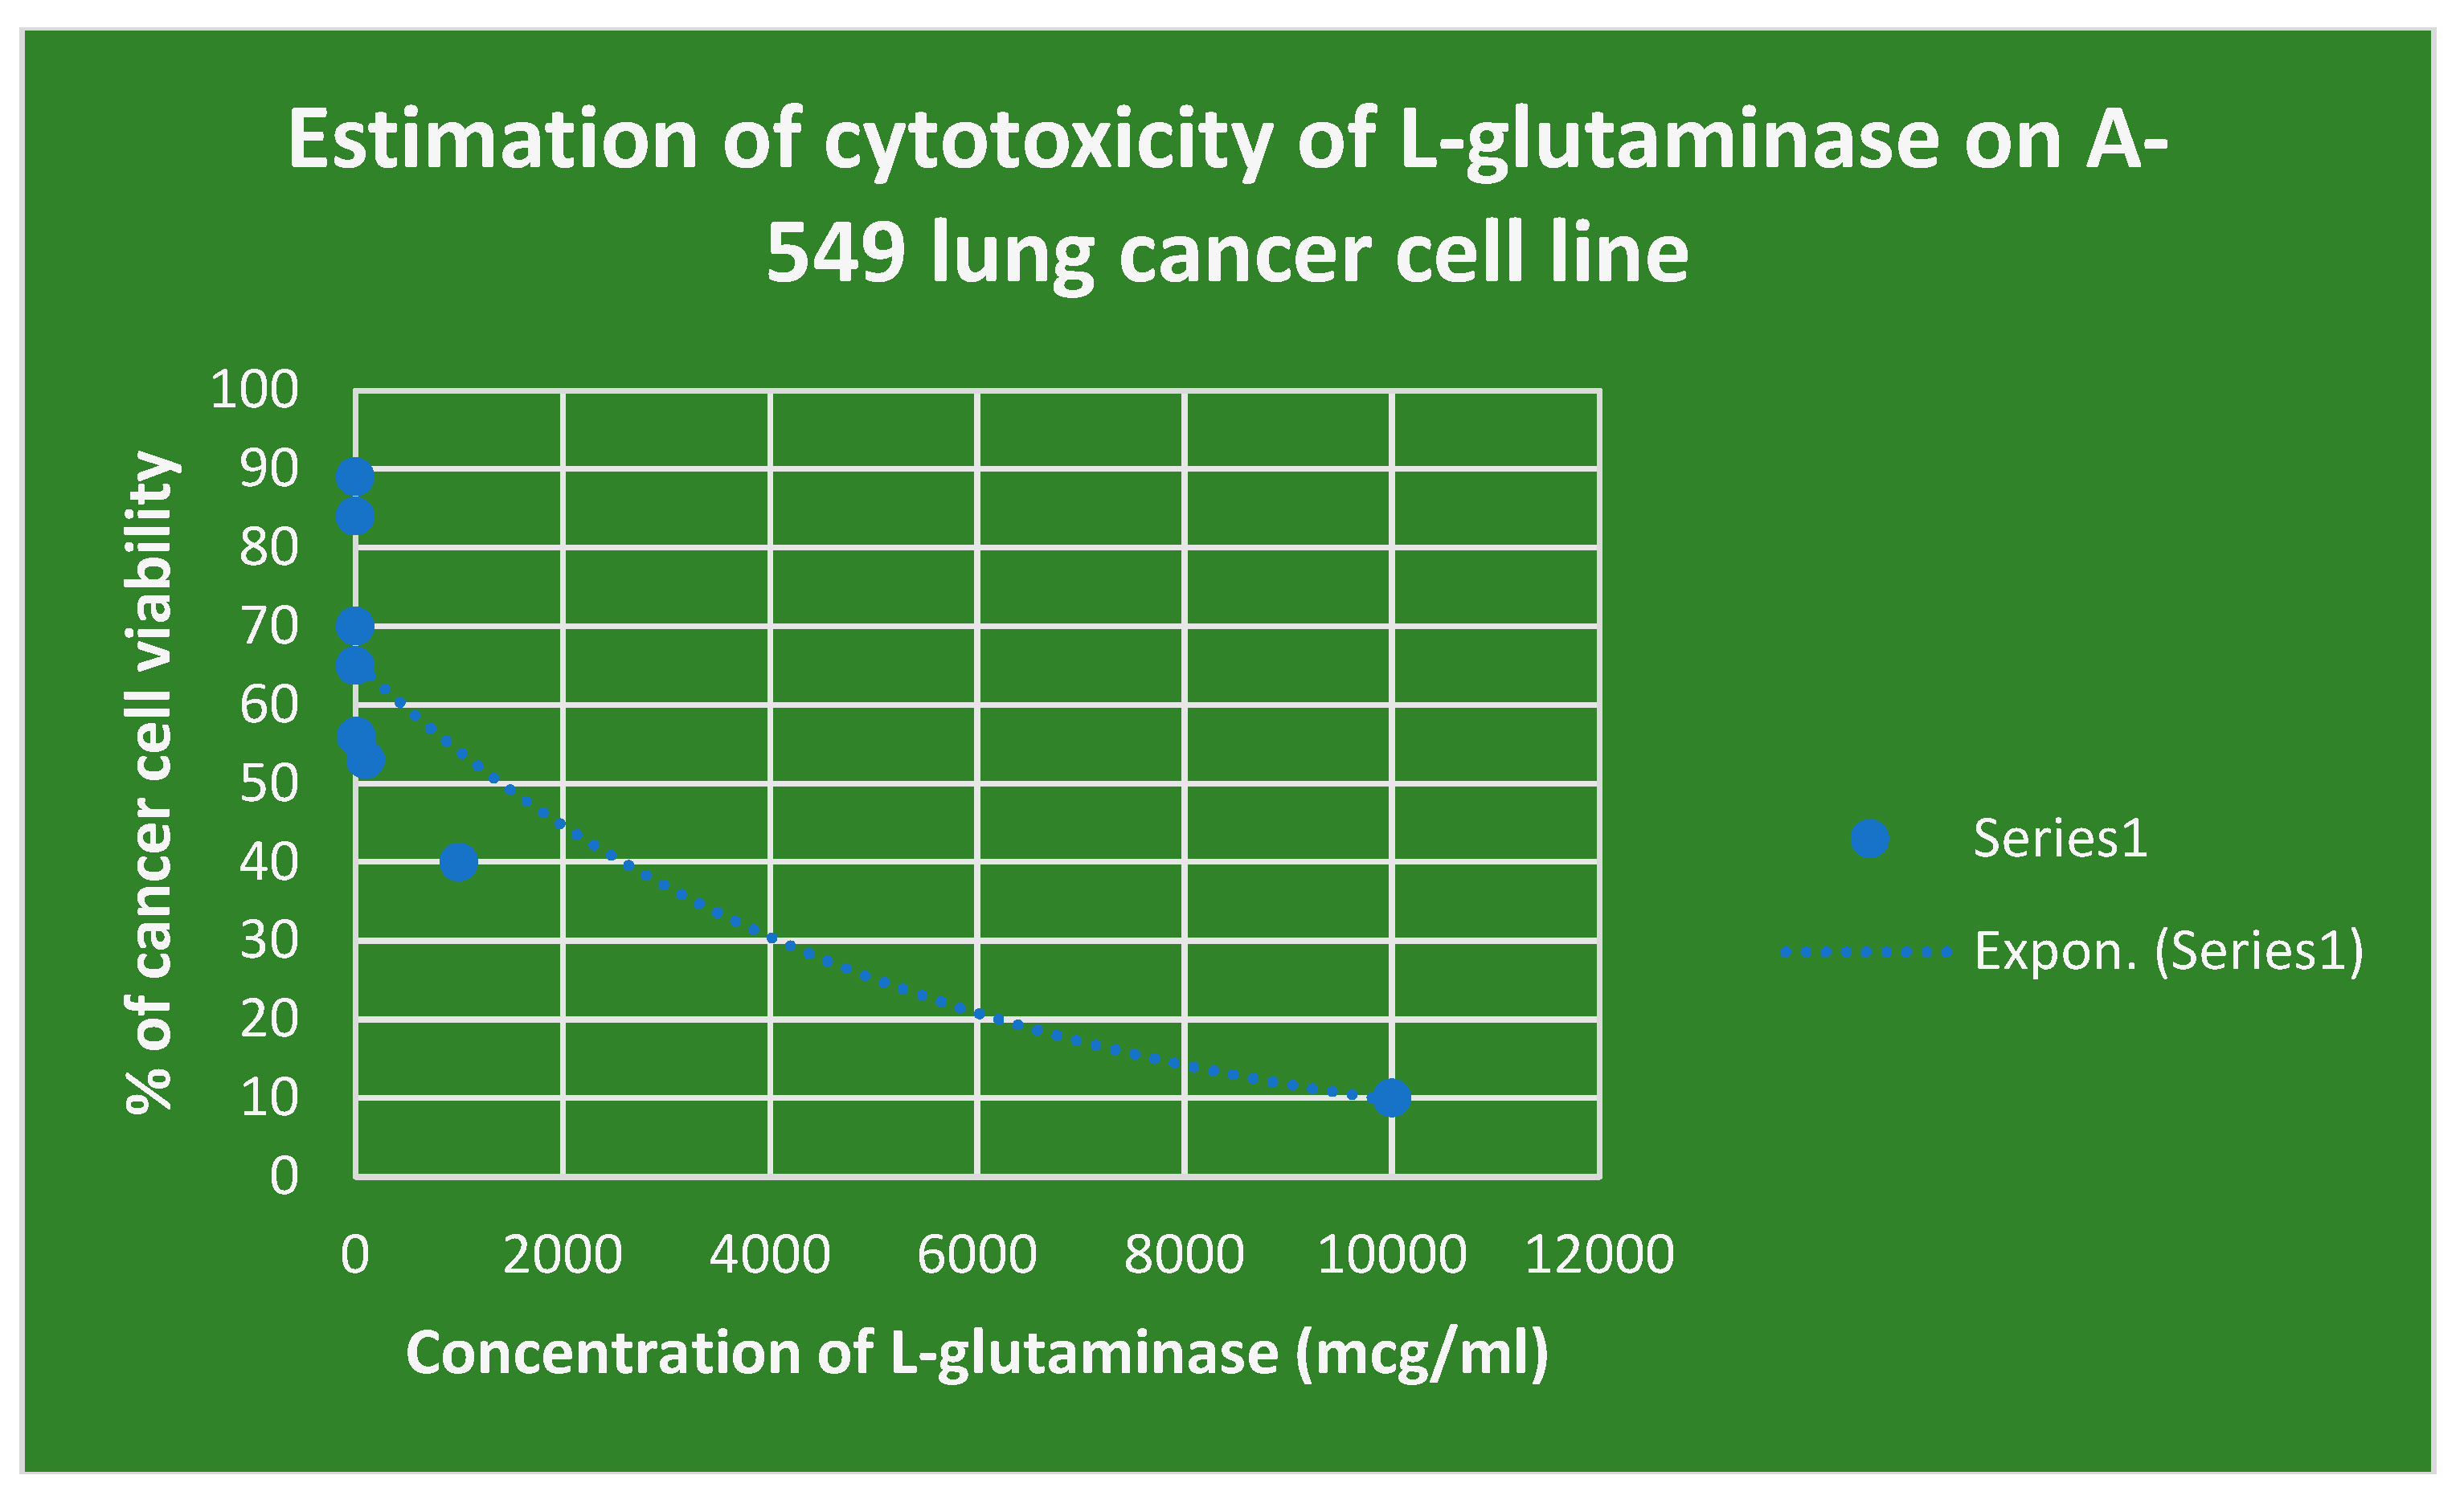
The cytotoxicity of L-glutaminase on the lung cancer cell line A-549 is shown in
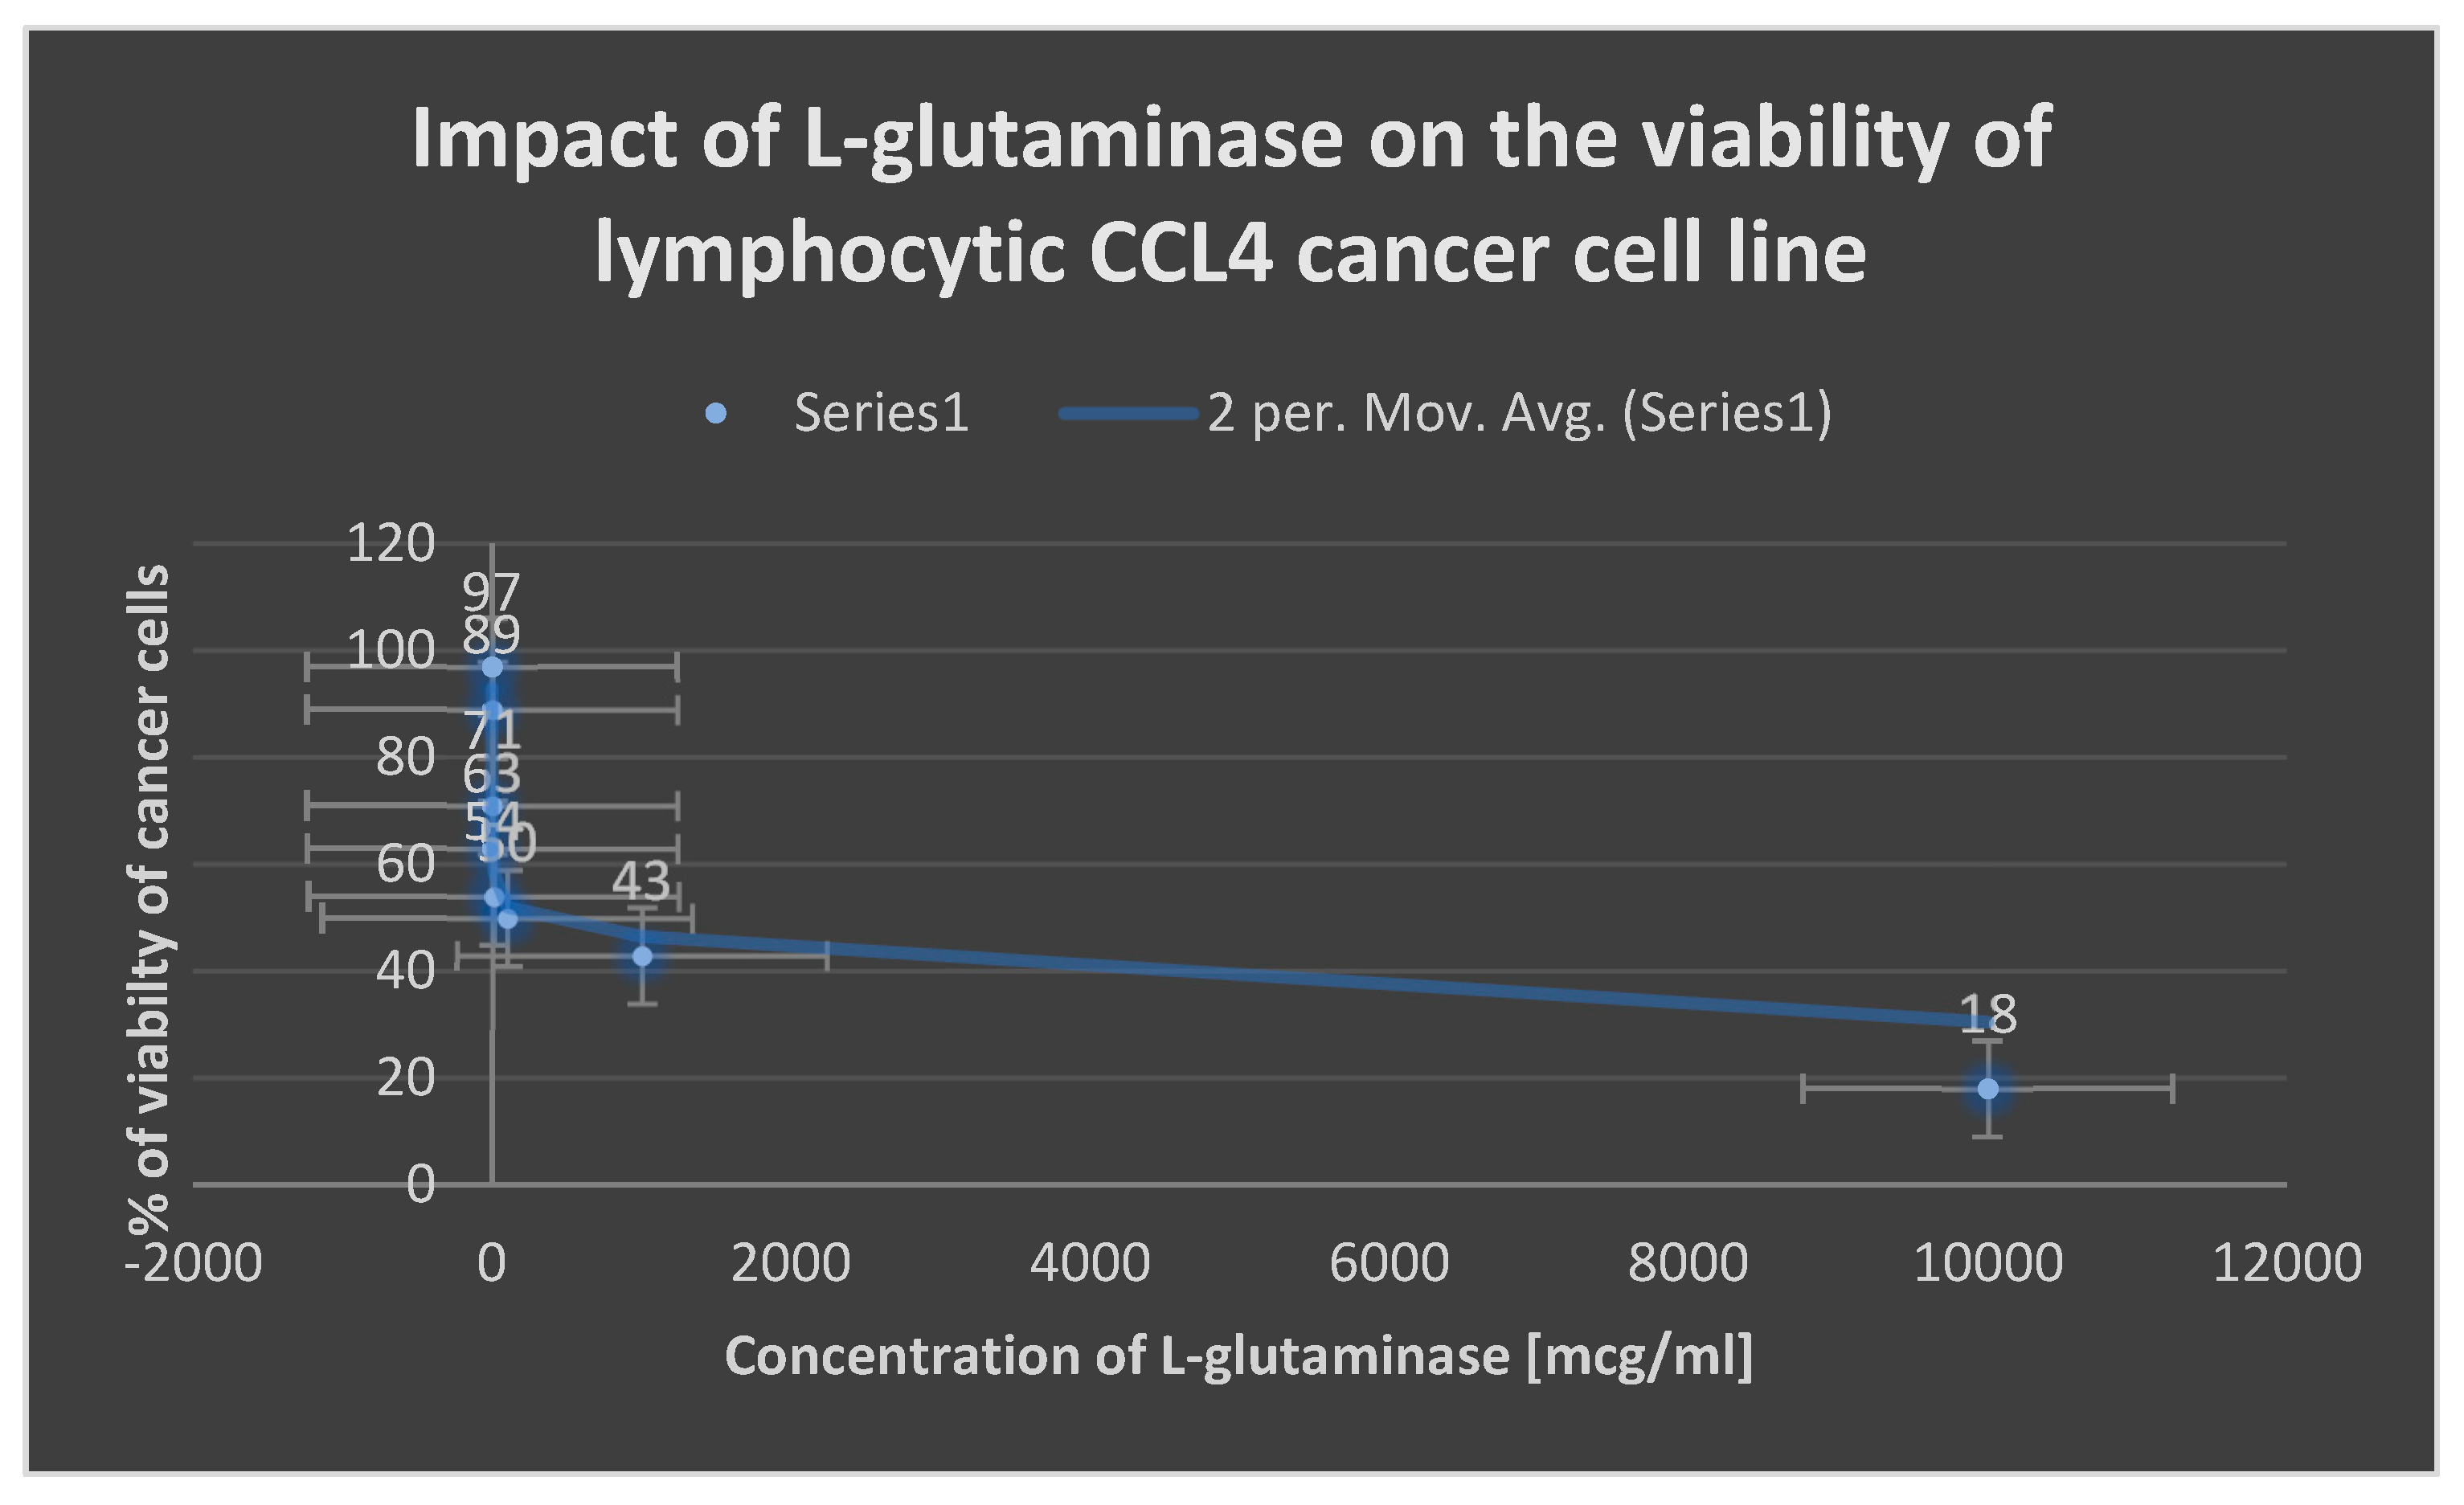
Figure 15. The cytotoxicity of L-glutaminase on lymphocytic CCL4 cancer cell line is depicted in
Figure 13.
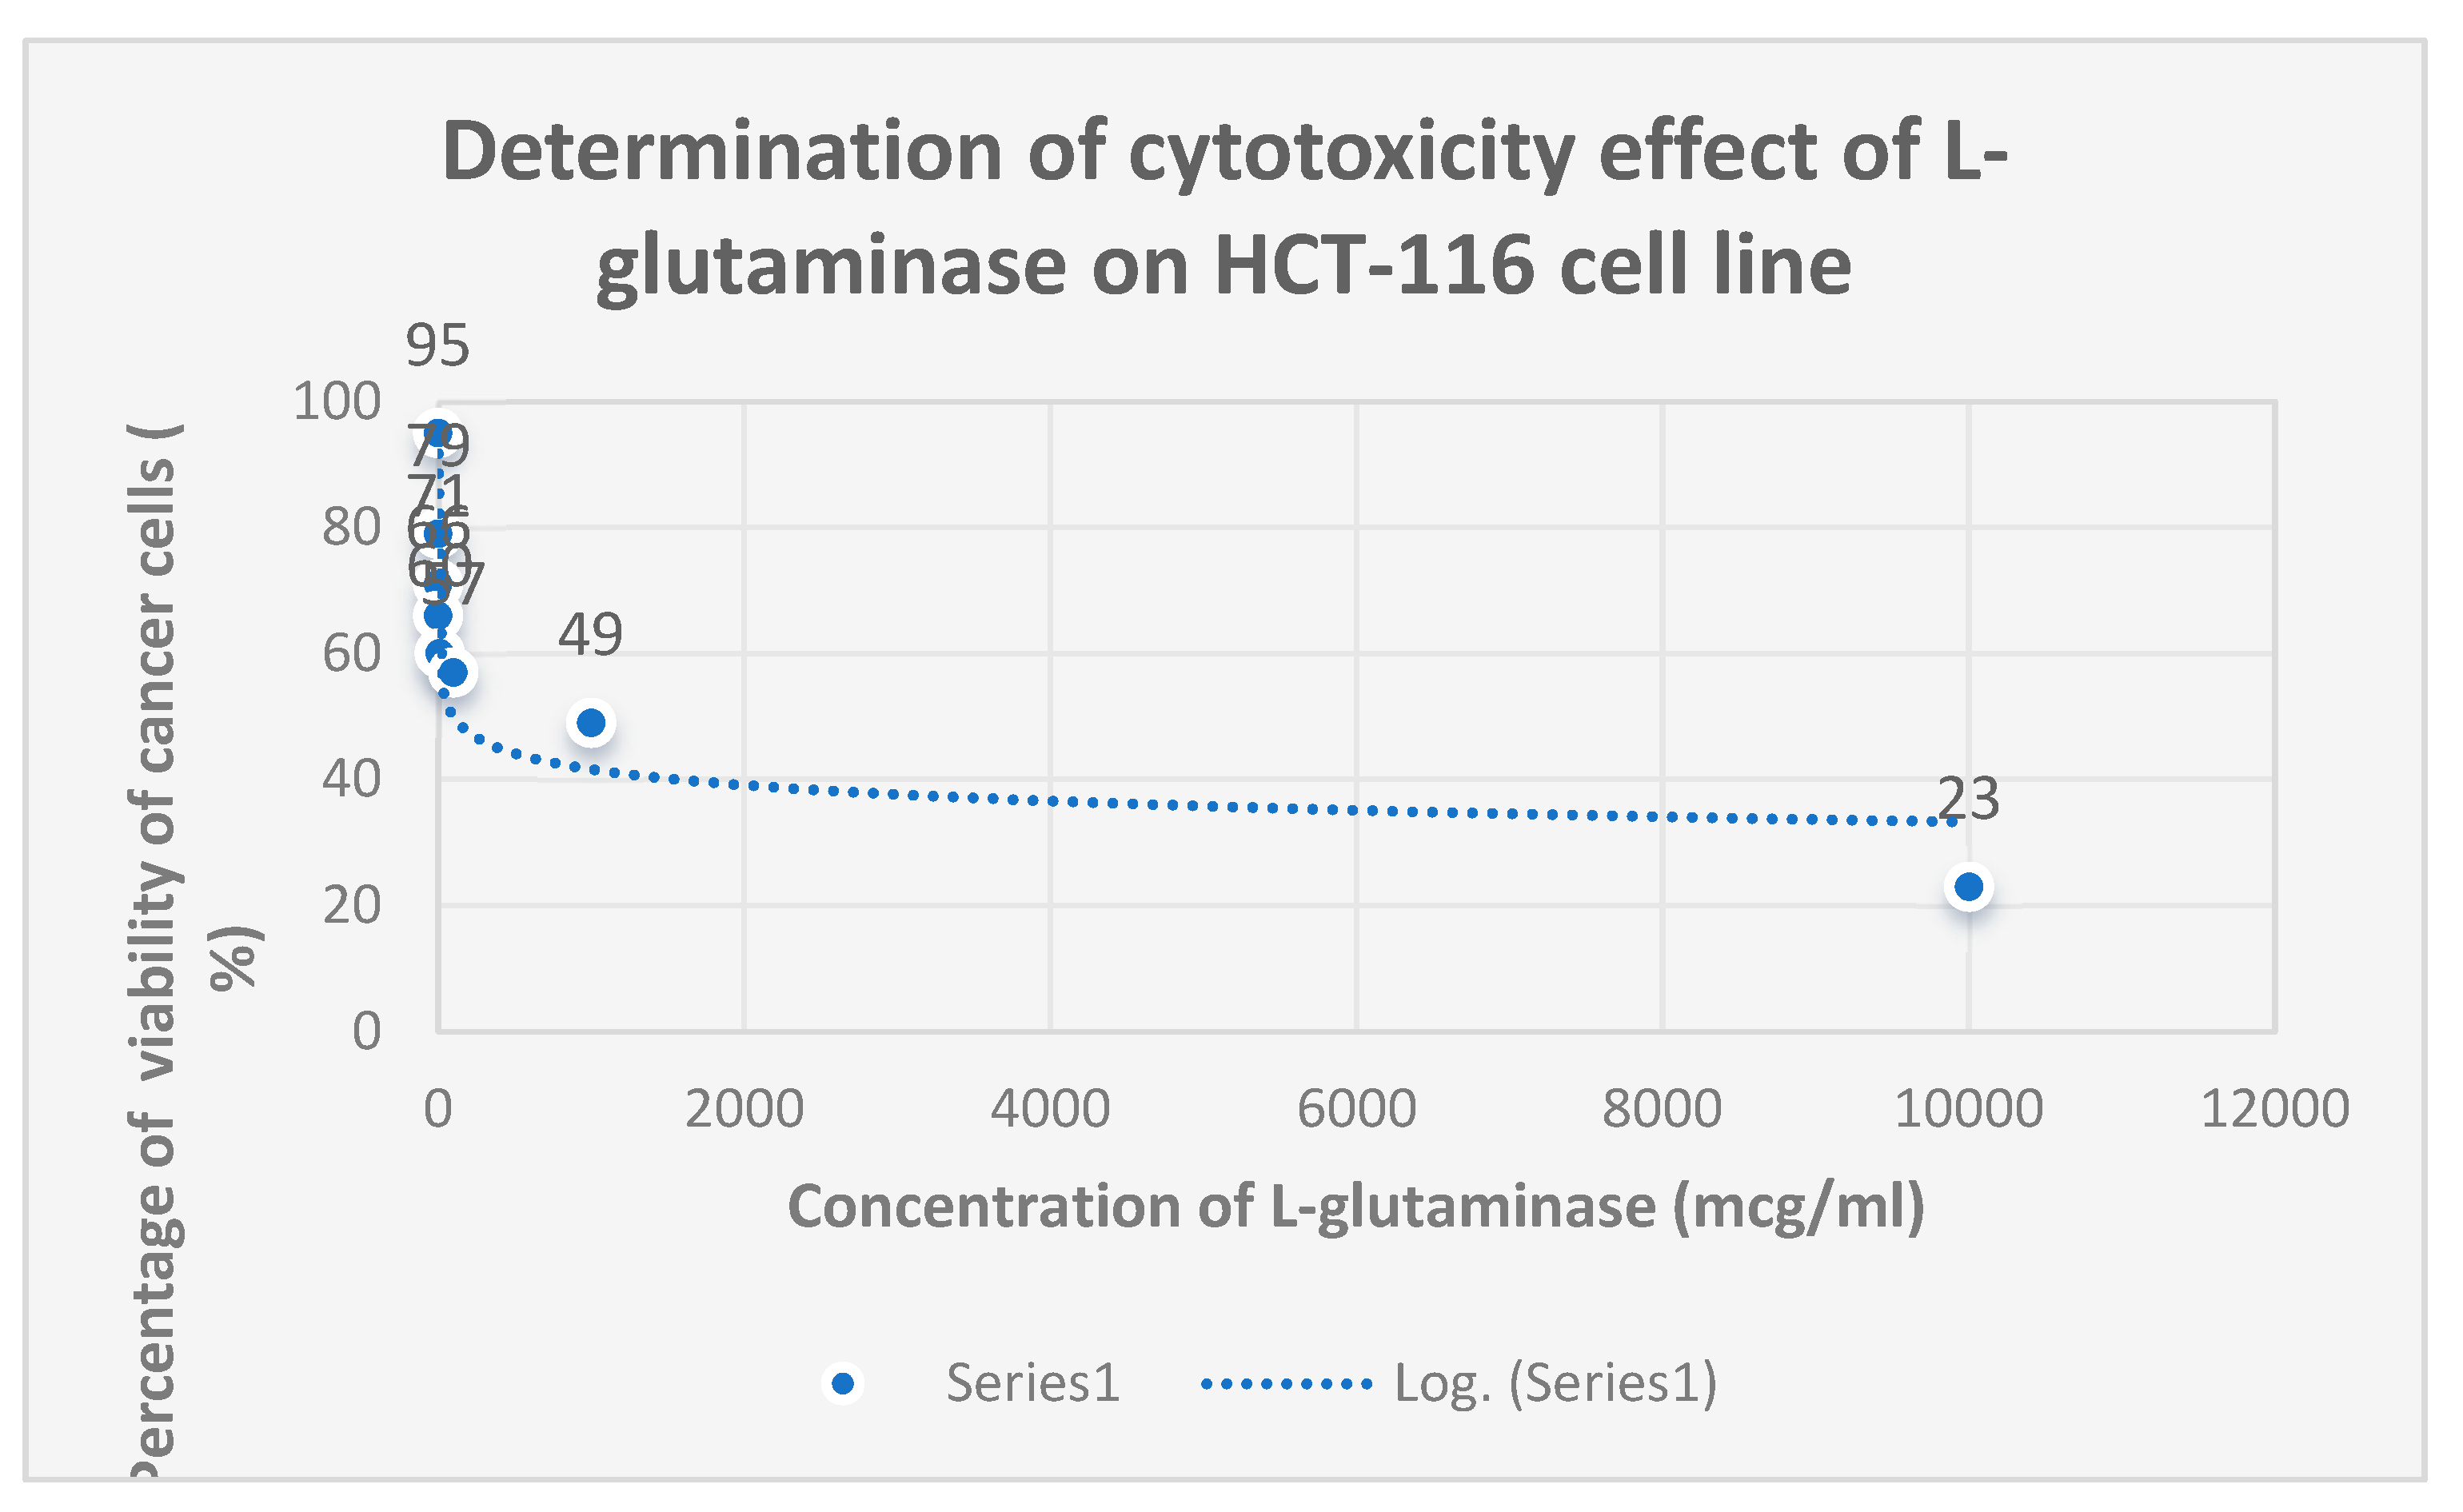
The cytotoxicity of L-glutaminase on the colon cancer cell line HCT-116 is shown in
Figure 14.
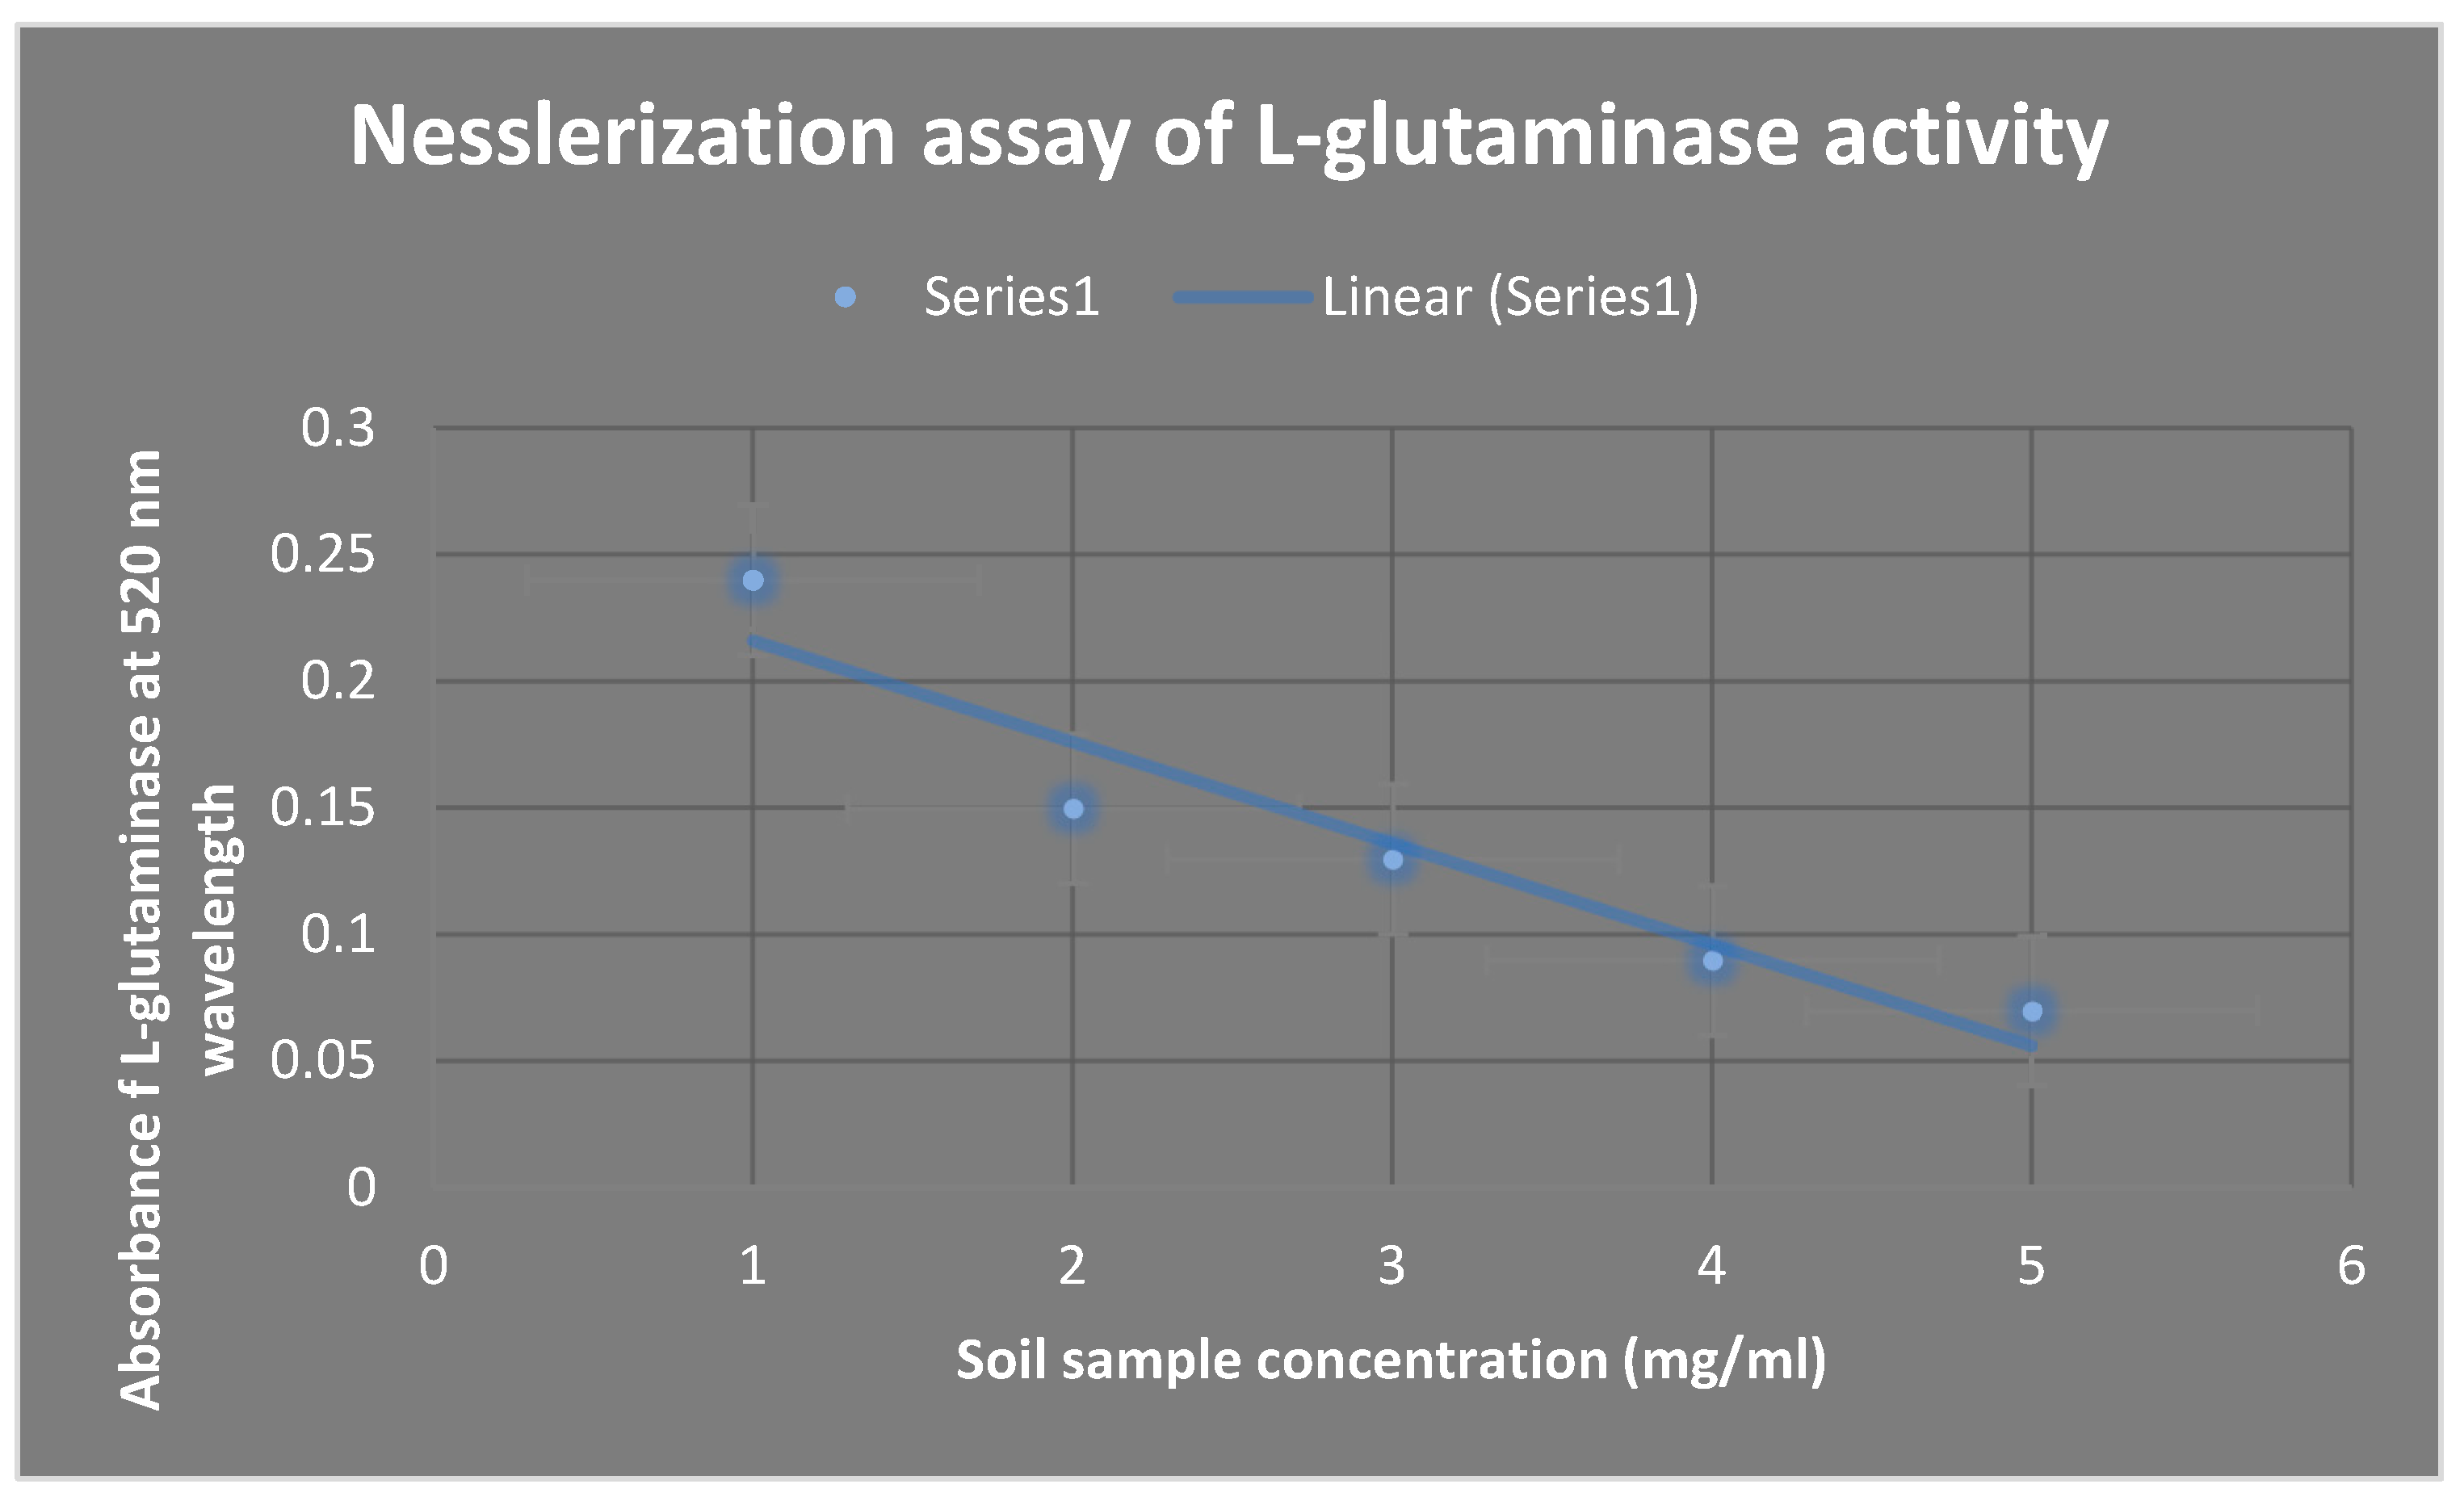
The Nesslerization test is used to estimate L-glutaminase activity, as shown in
Figure 5. The quantity of ammonia released as a result of L-glutaminase hydrolysis rose in direct proportion to the concentration of L-glutaminase in the soil sample solution.
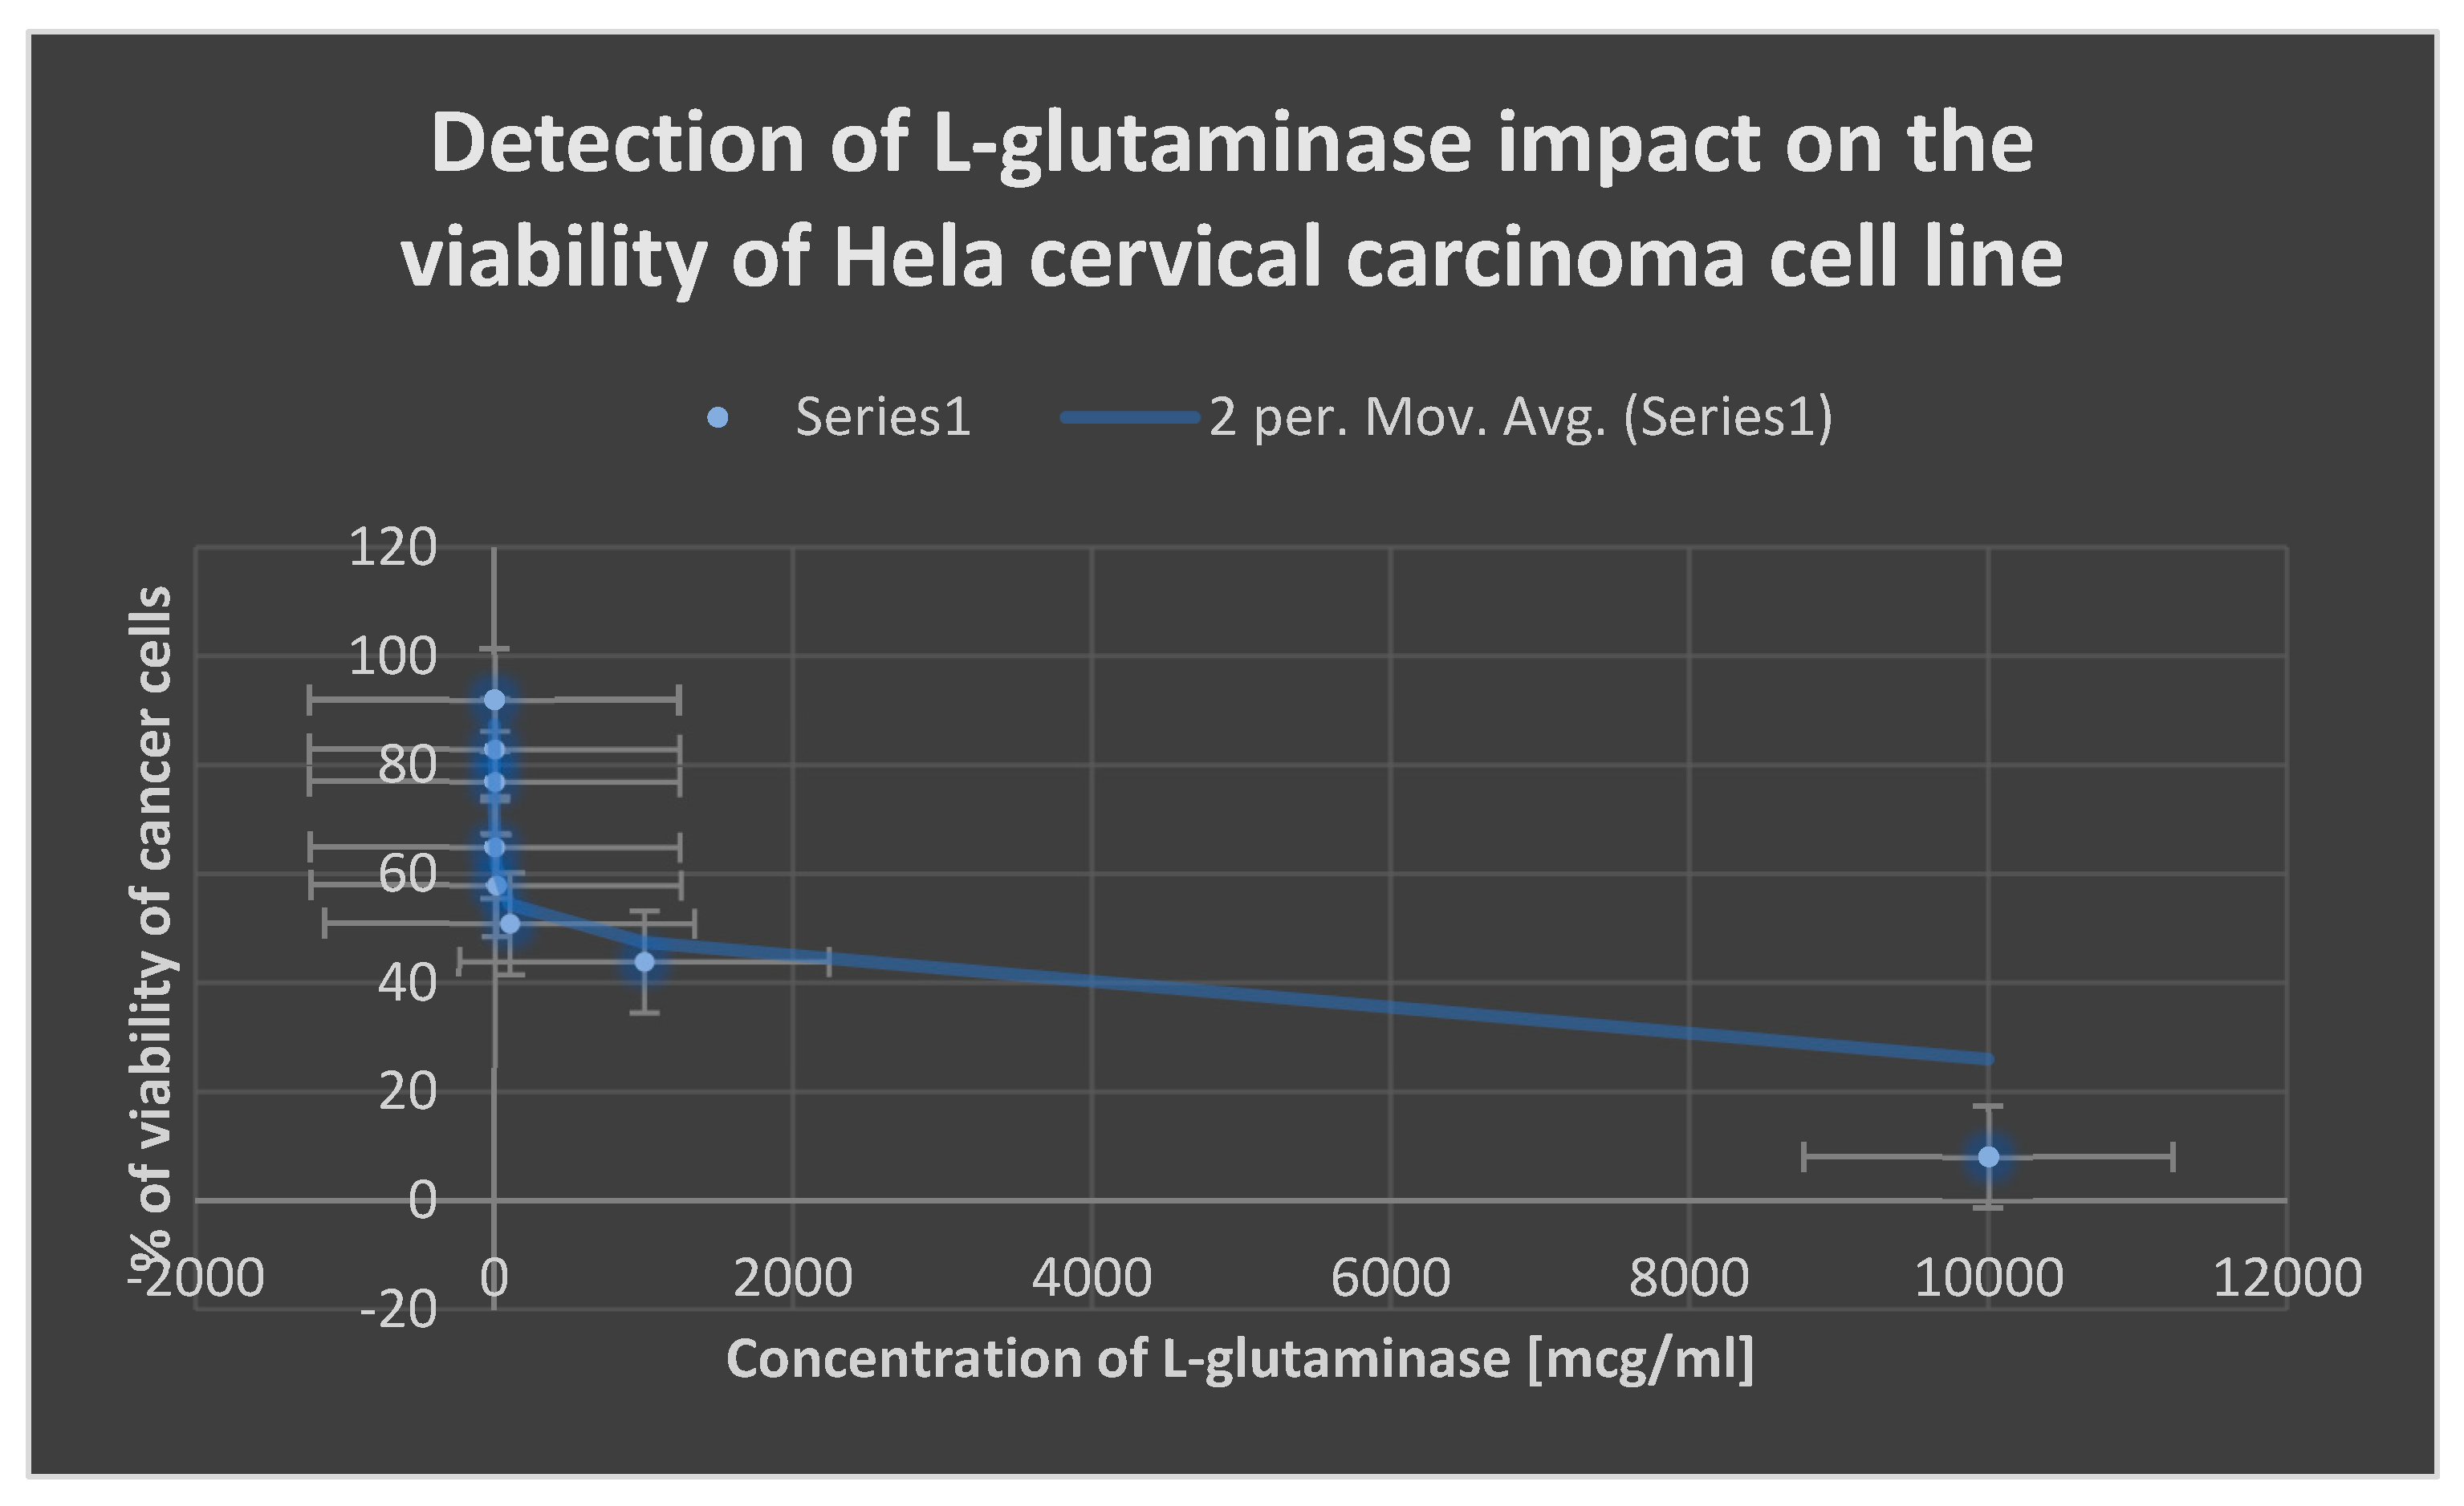
The cytotoxic impact of L-glutaminase on the cervical cancer cell line Hela is depicted in
Figure 12.
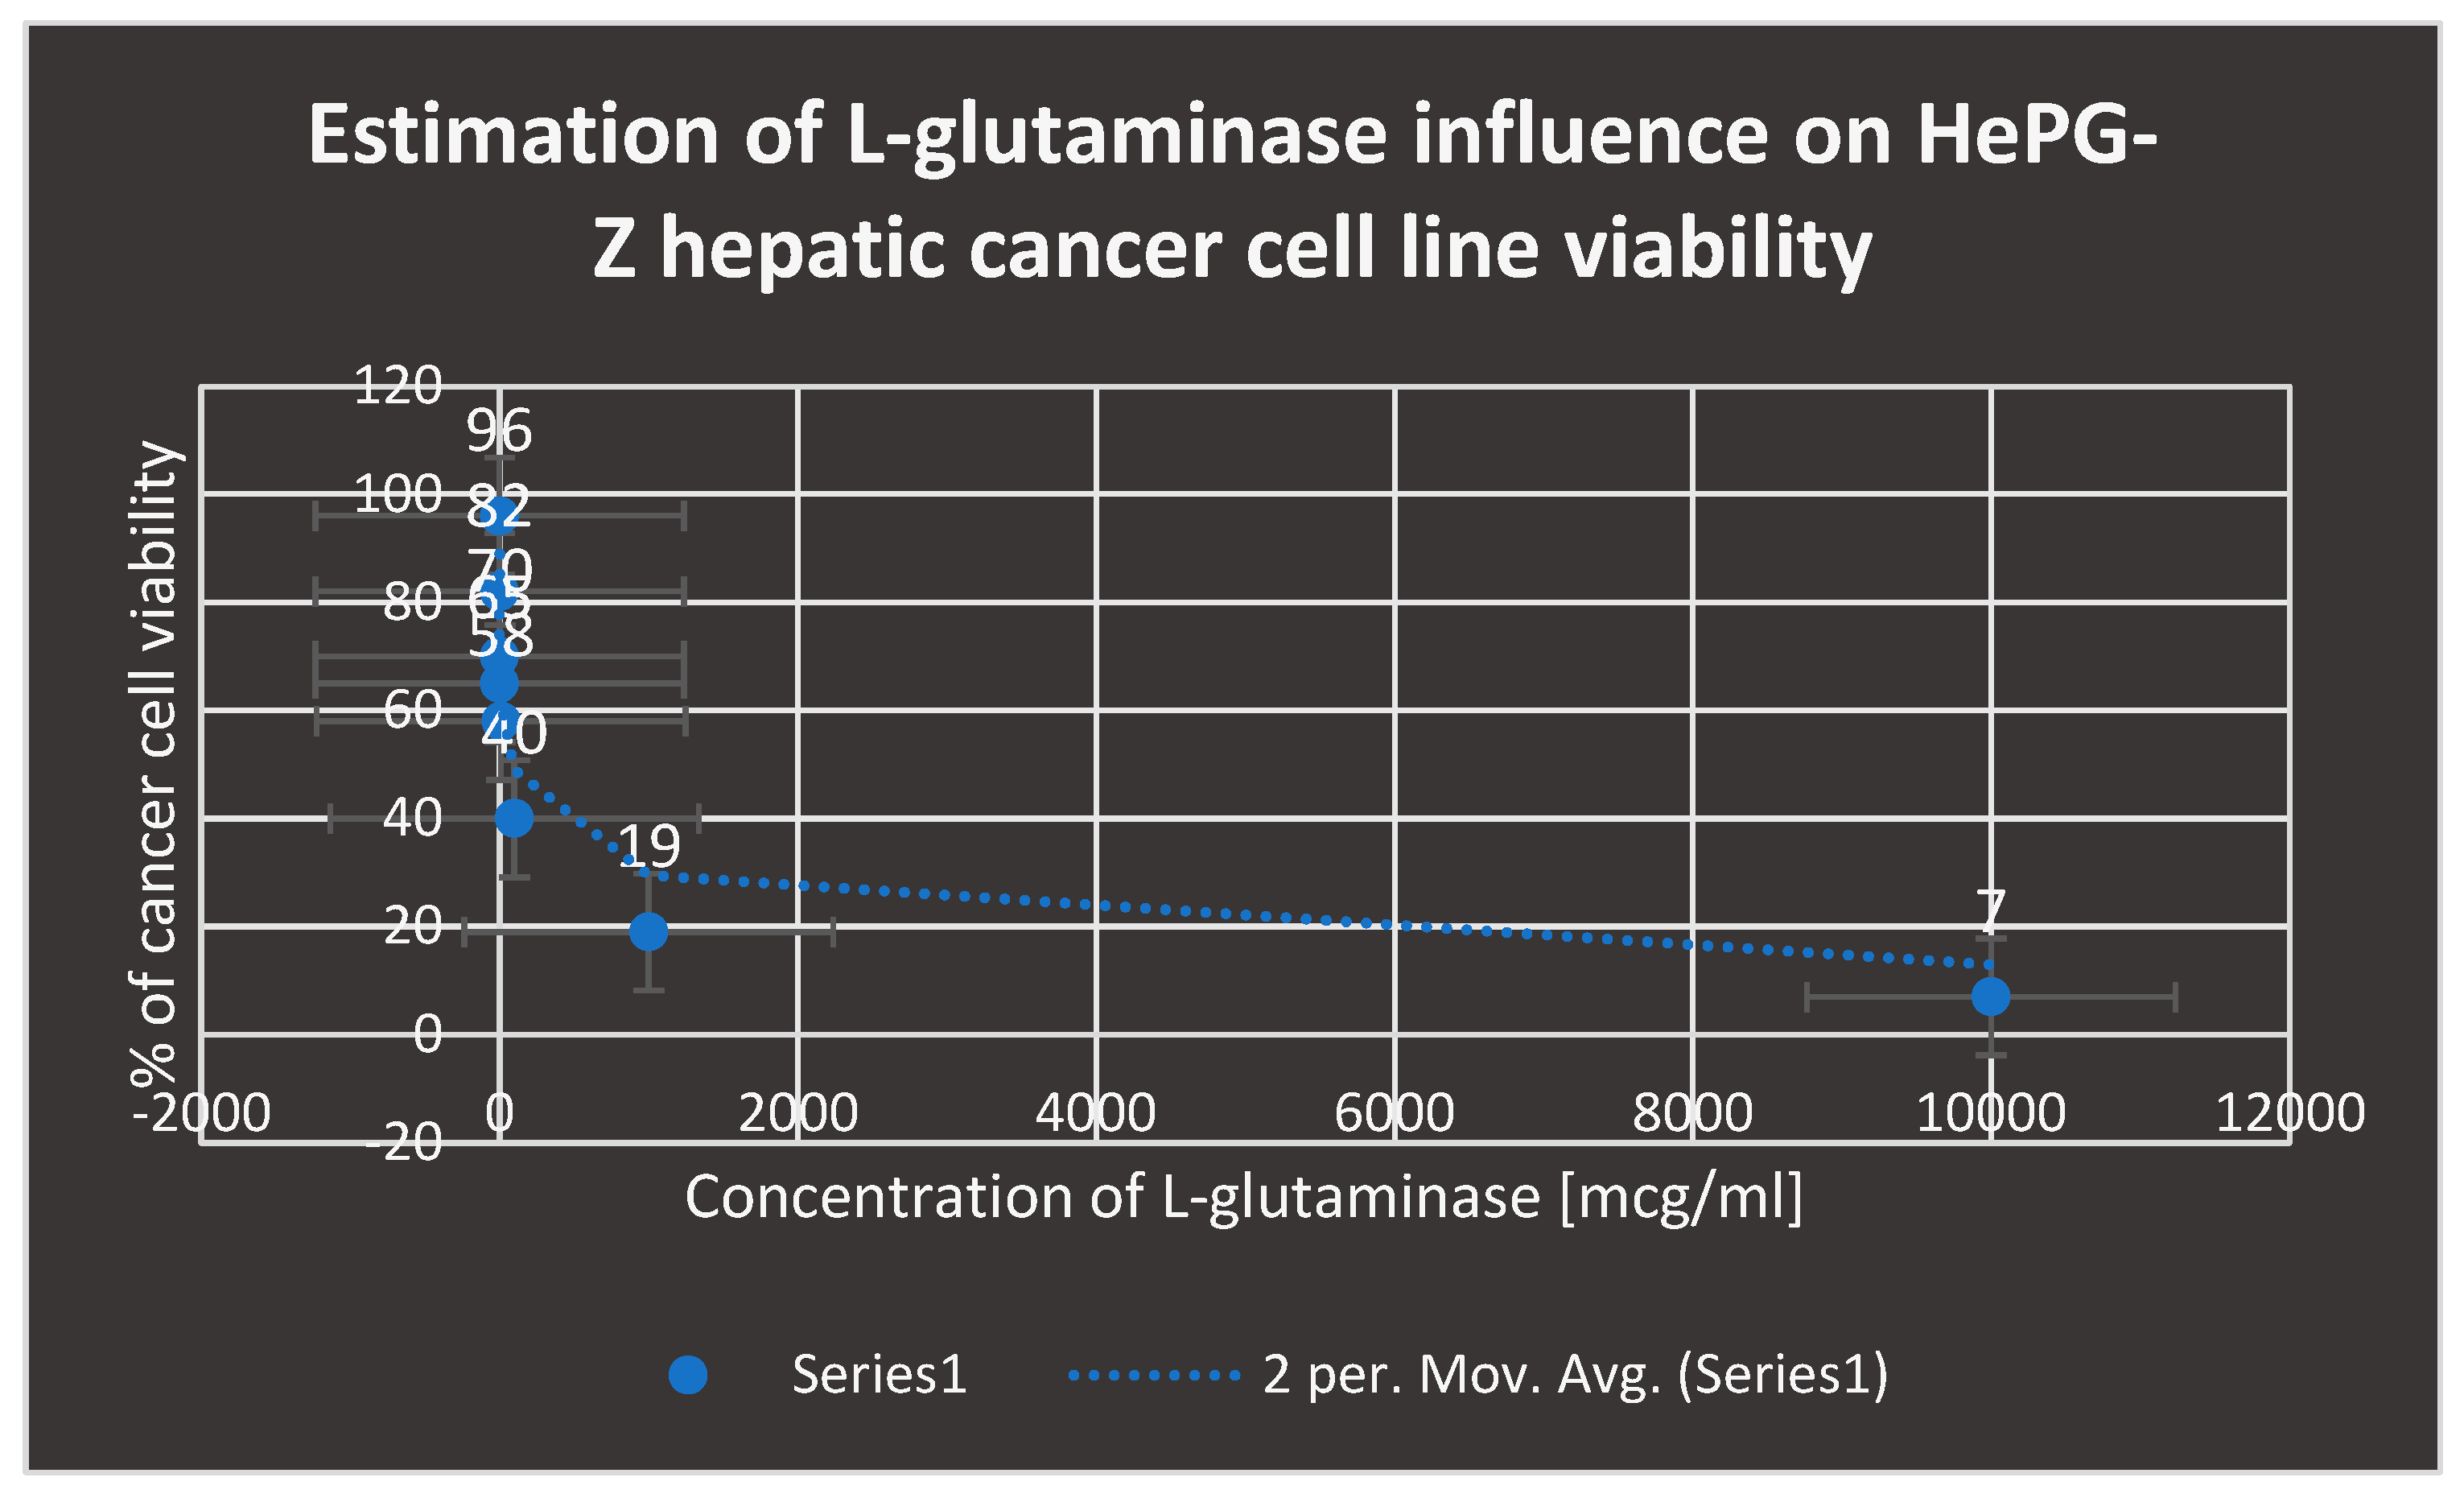
The influence of L-glutaminase inhibition on the viability of the HePG-Z hepatic cancer cell line is depicted in
Figure 11.
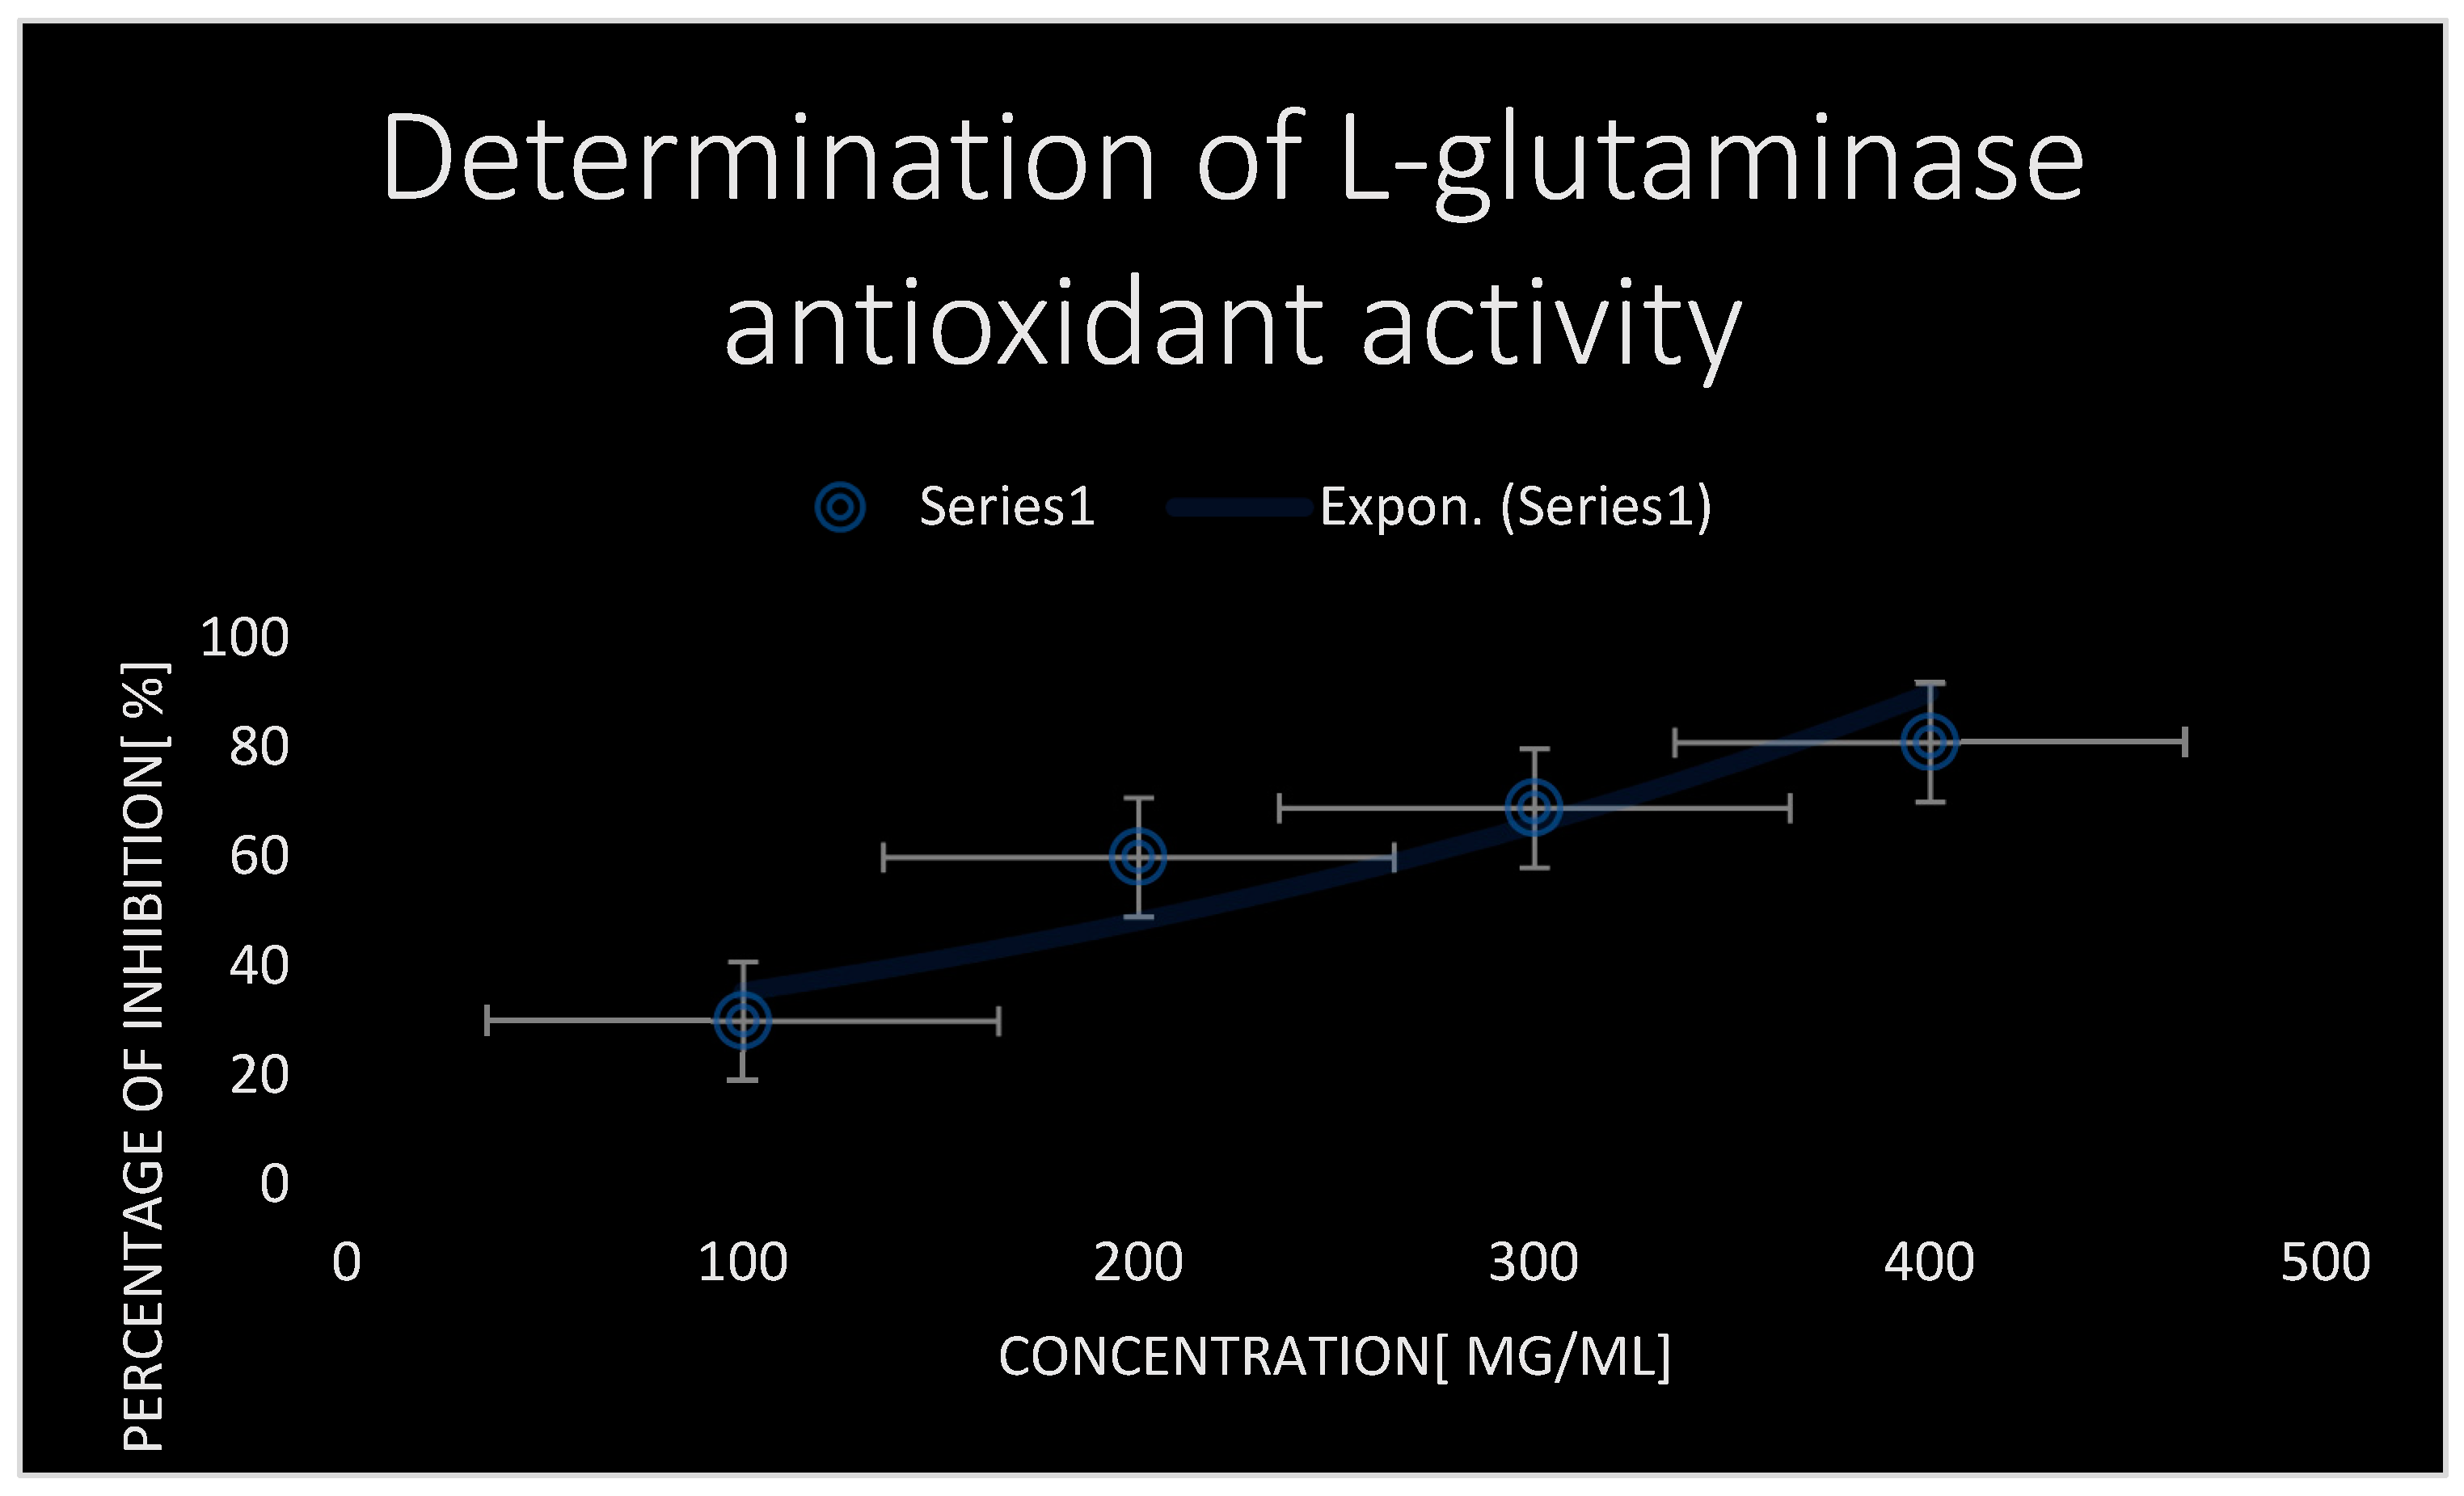
Using DPPH scavenging and antioxidant experiment,
Figure 6 shows the antioxidant and scavenging activity of test L-glutaminase. The L-glutaminase inhibitory antioxidant dose (IC
50) that inhibited 50% of oxidation processes was around 50±2 µg/ml.
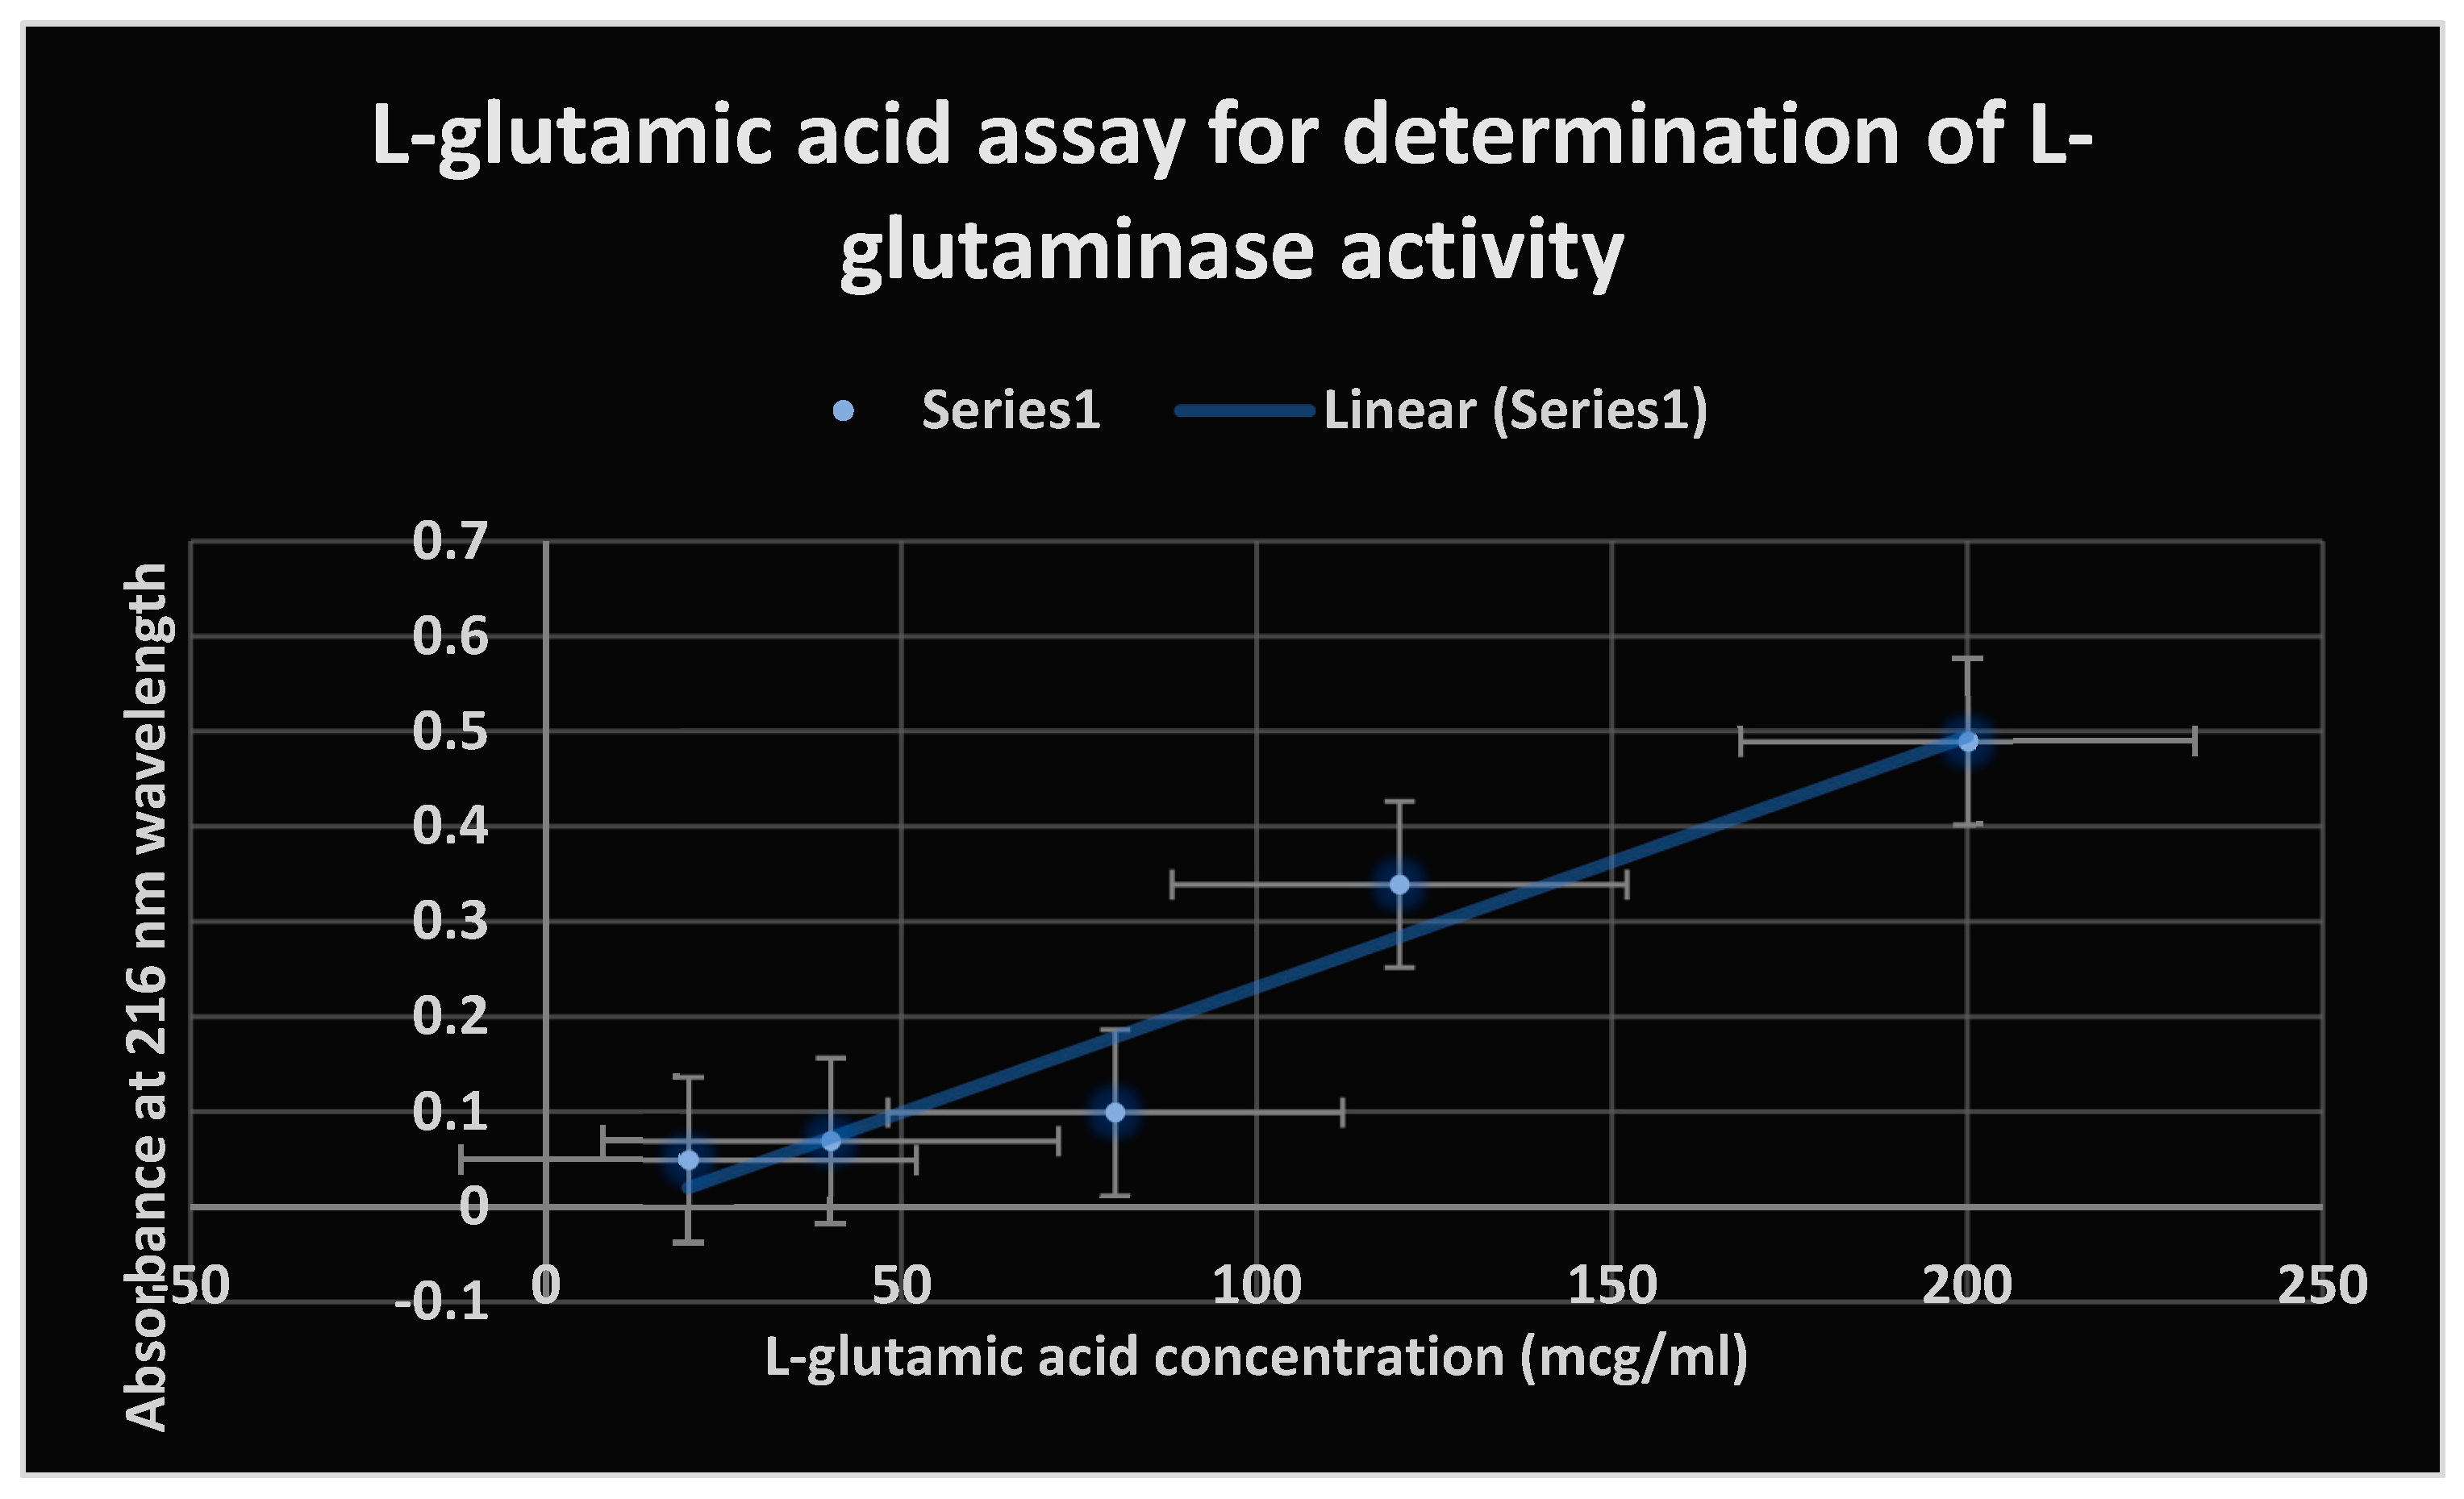
As a result of the test L-glutaminase lysing L-glutamine,
Figure 8 displays the absorbance of freed L-glutamic acid at 216 nm wavelength.
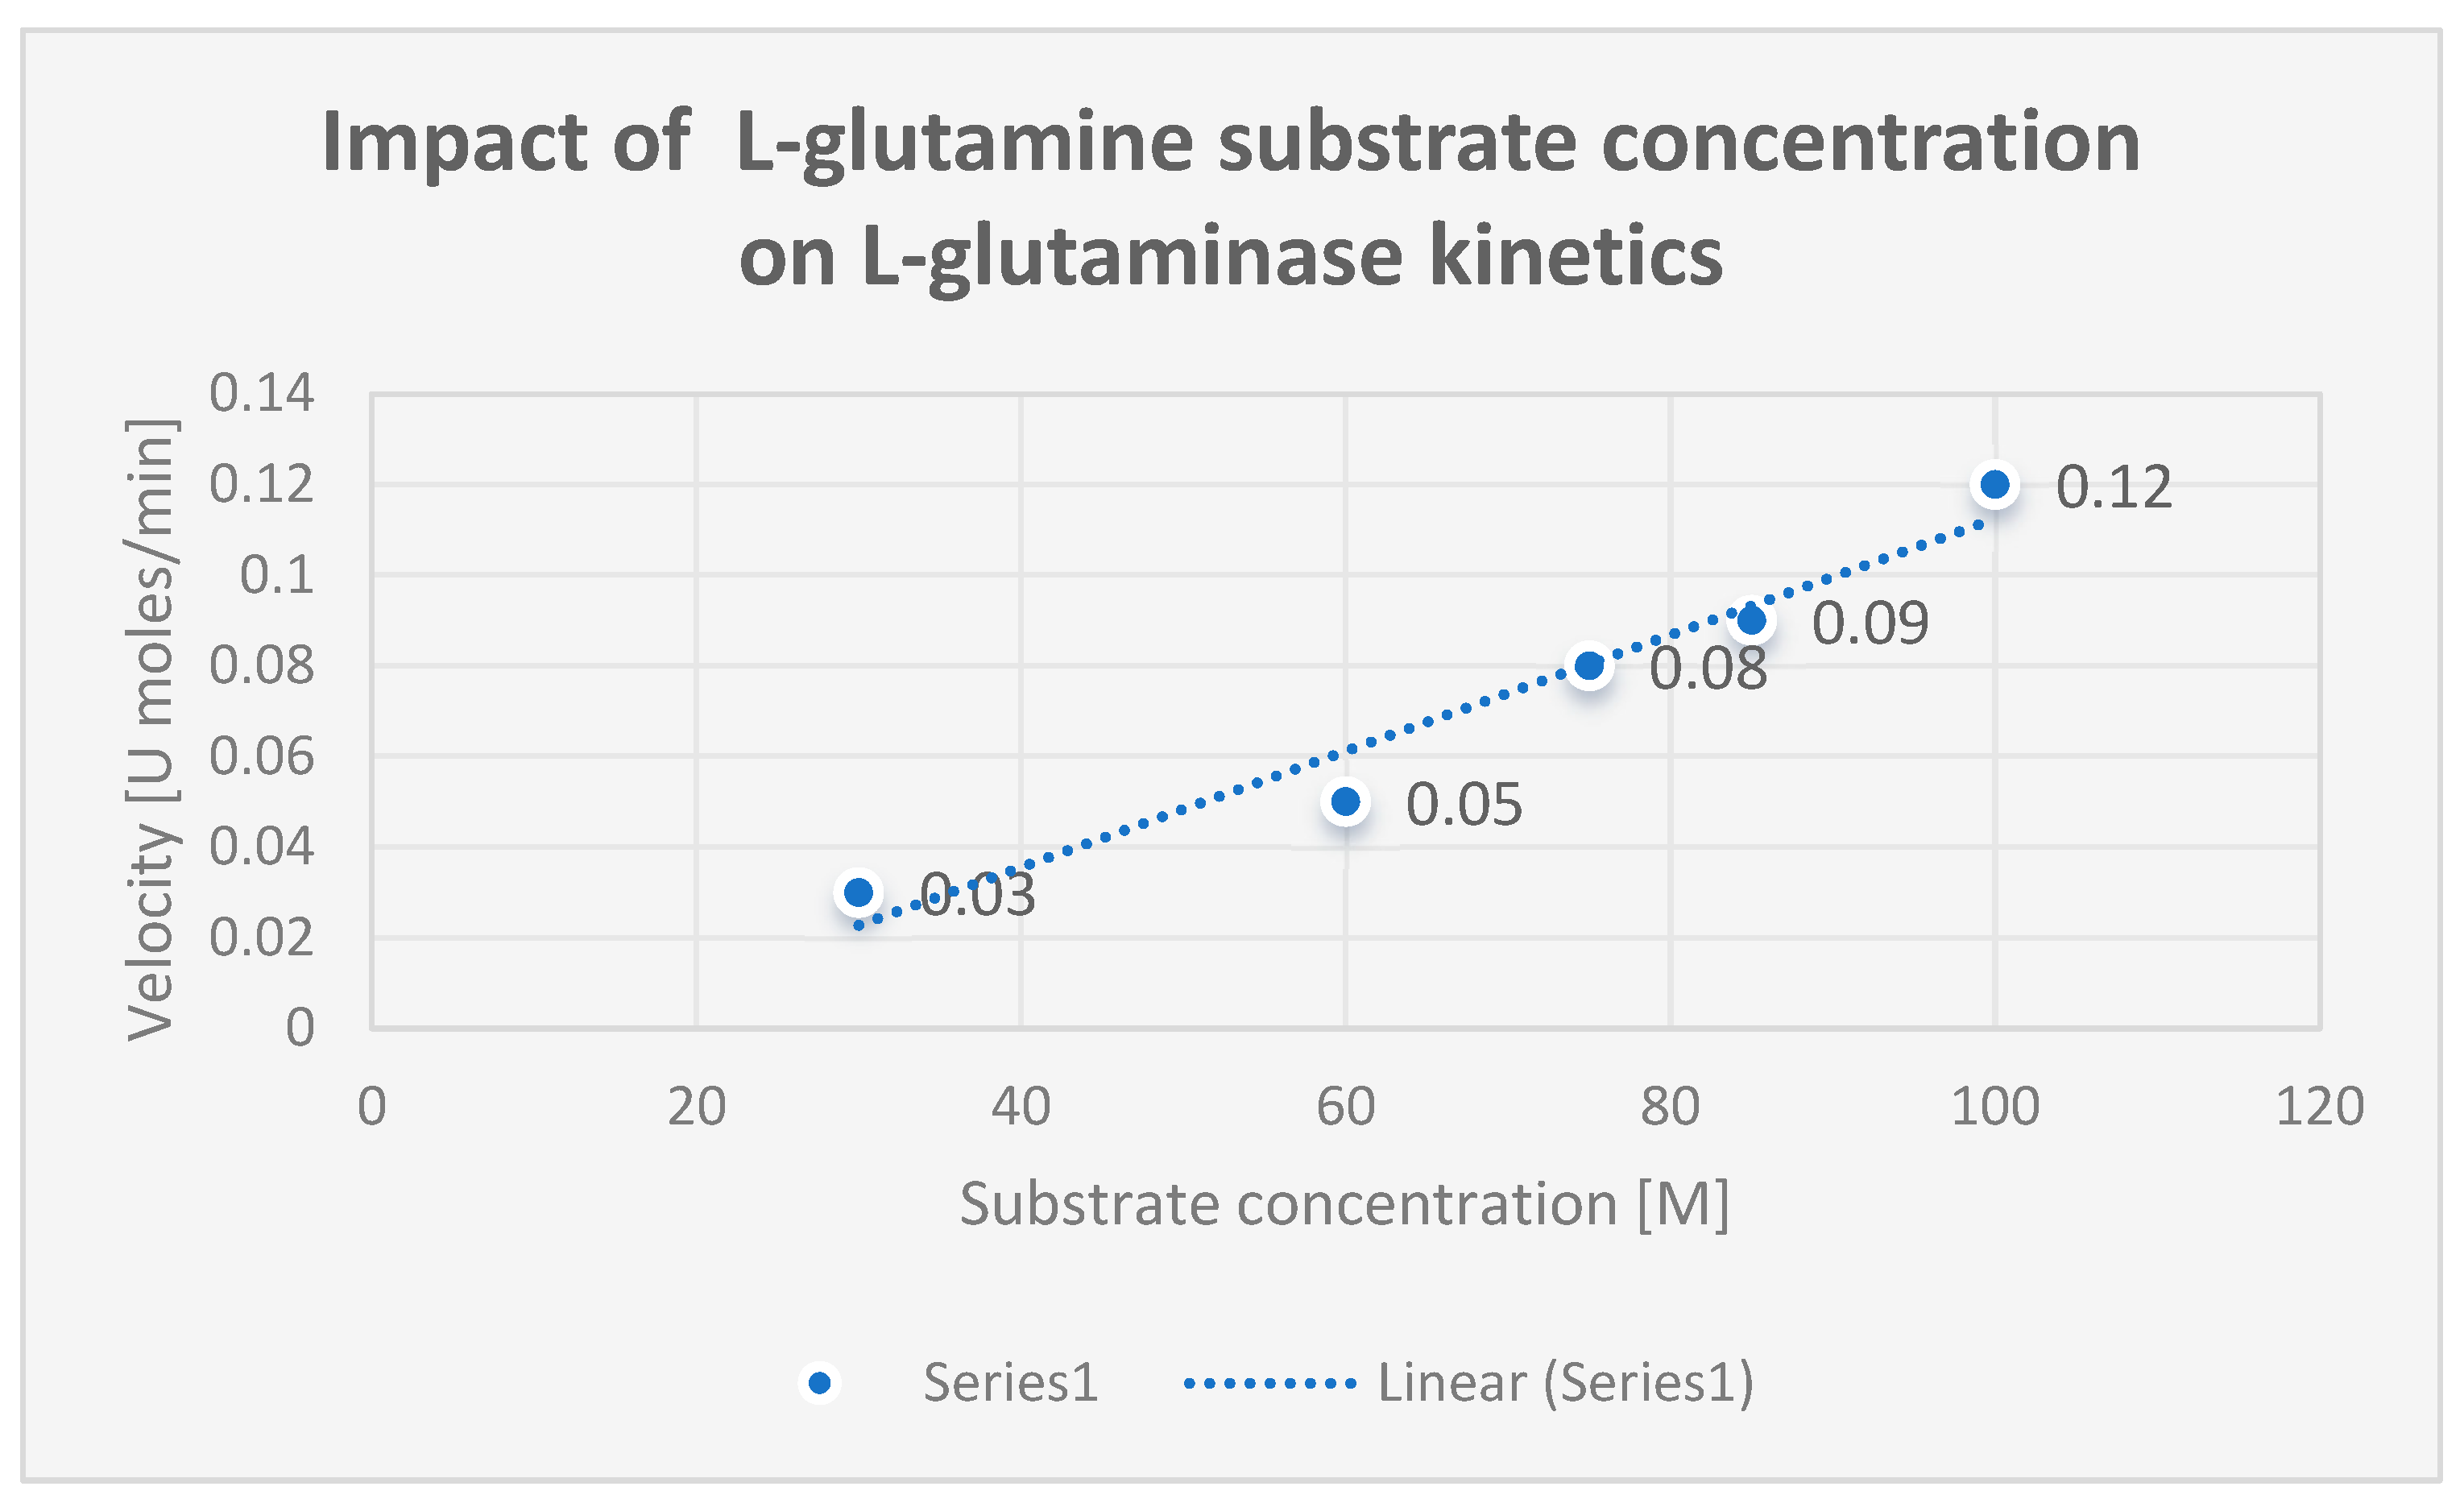
The kinetics of L-glutaminase are displayed in
Figure 7.
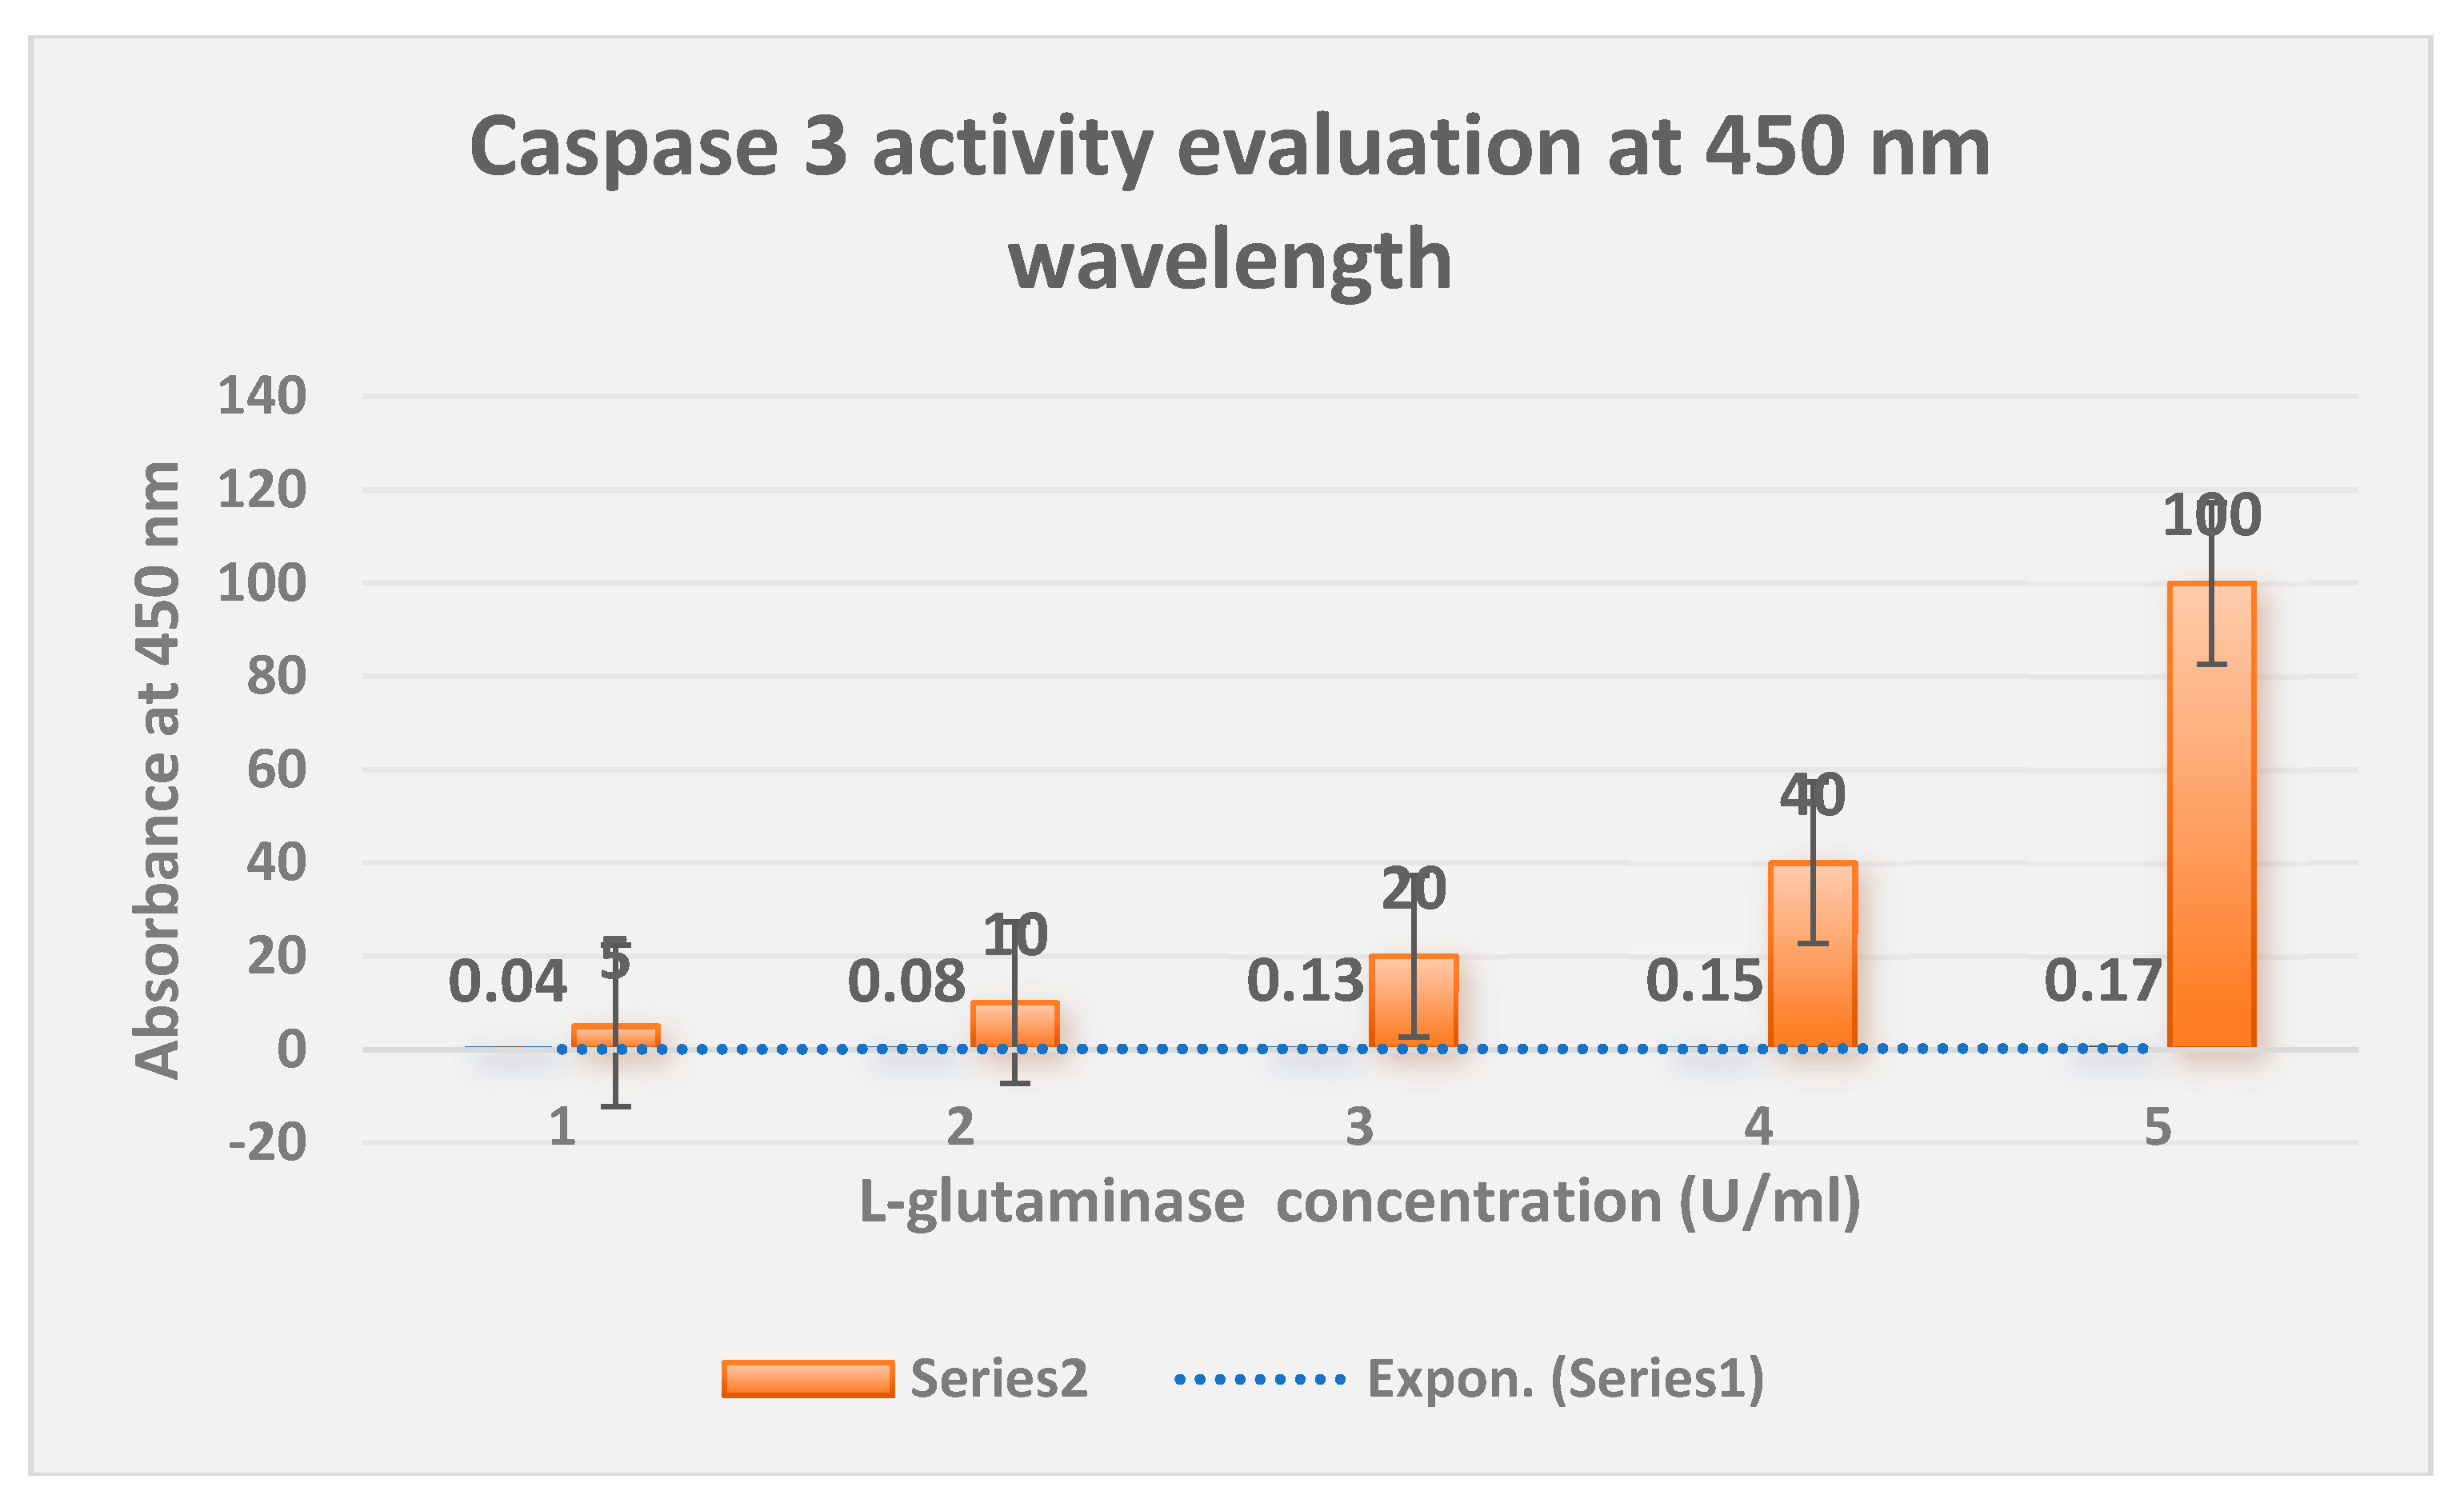
The measurement of L-glutaminase-induced apoptosis utilizing the Caspase 3 activity method is shown in
Figure 10.
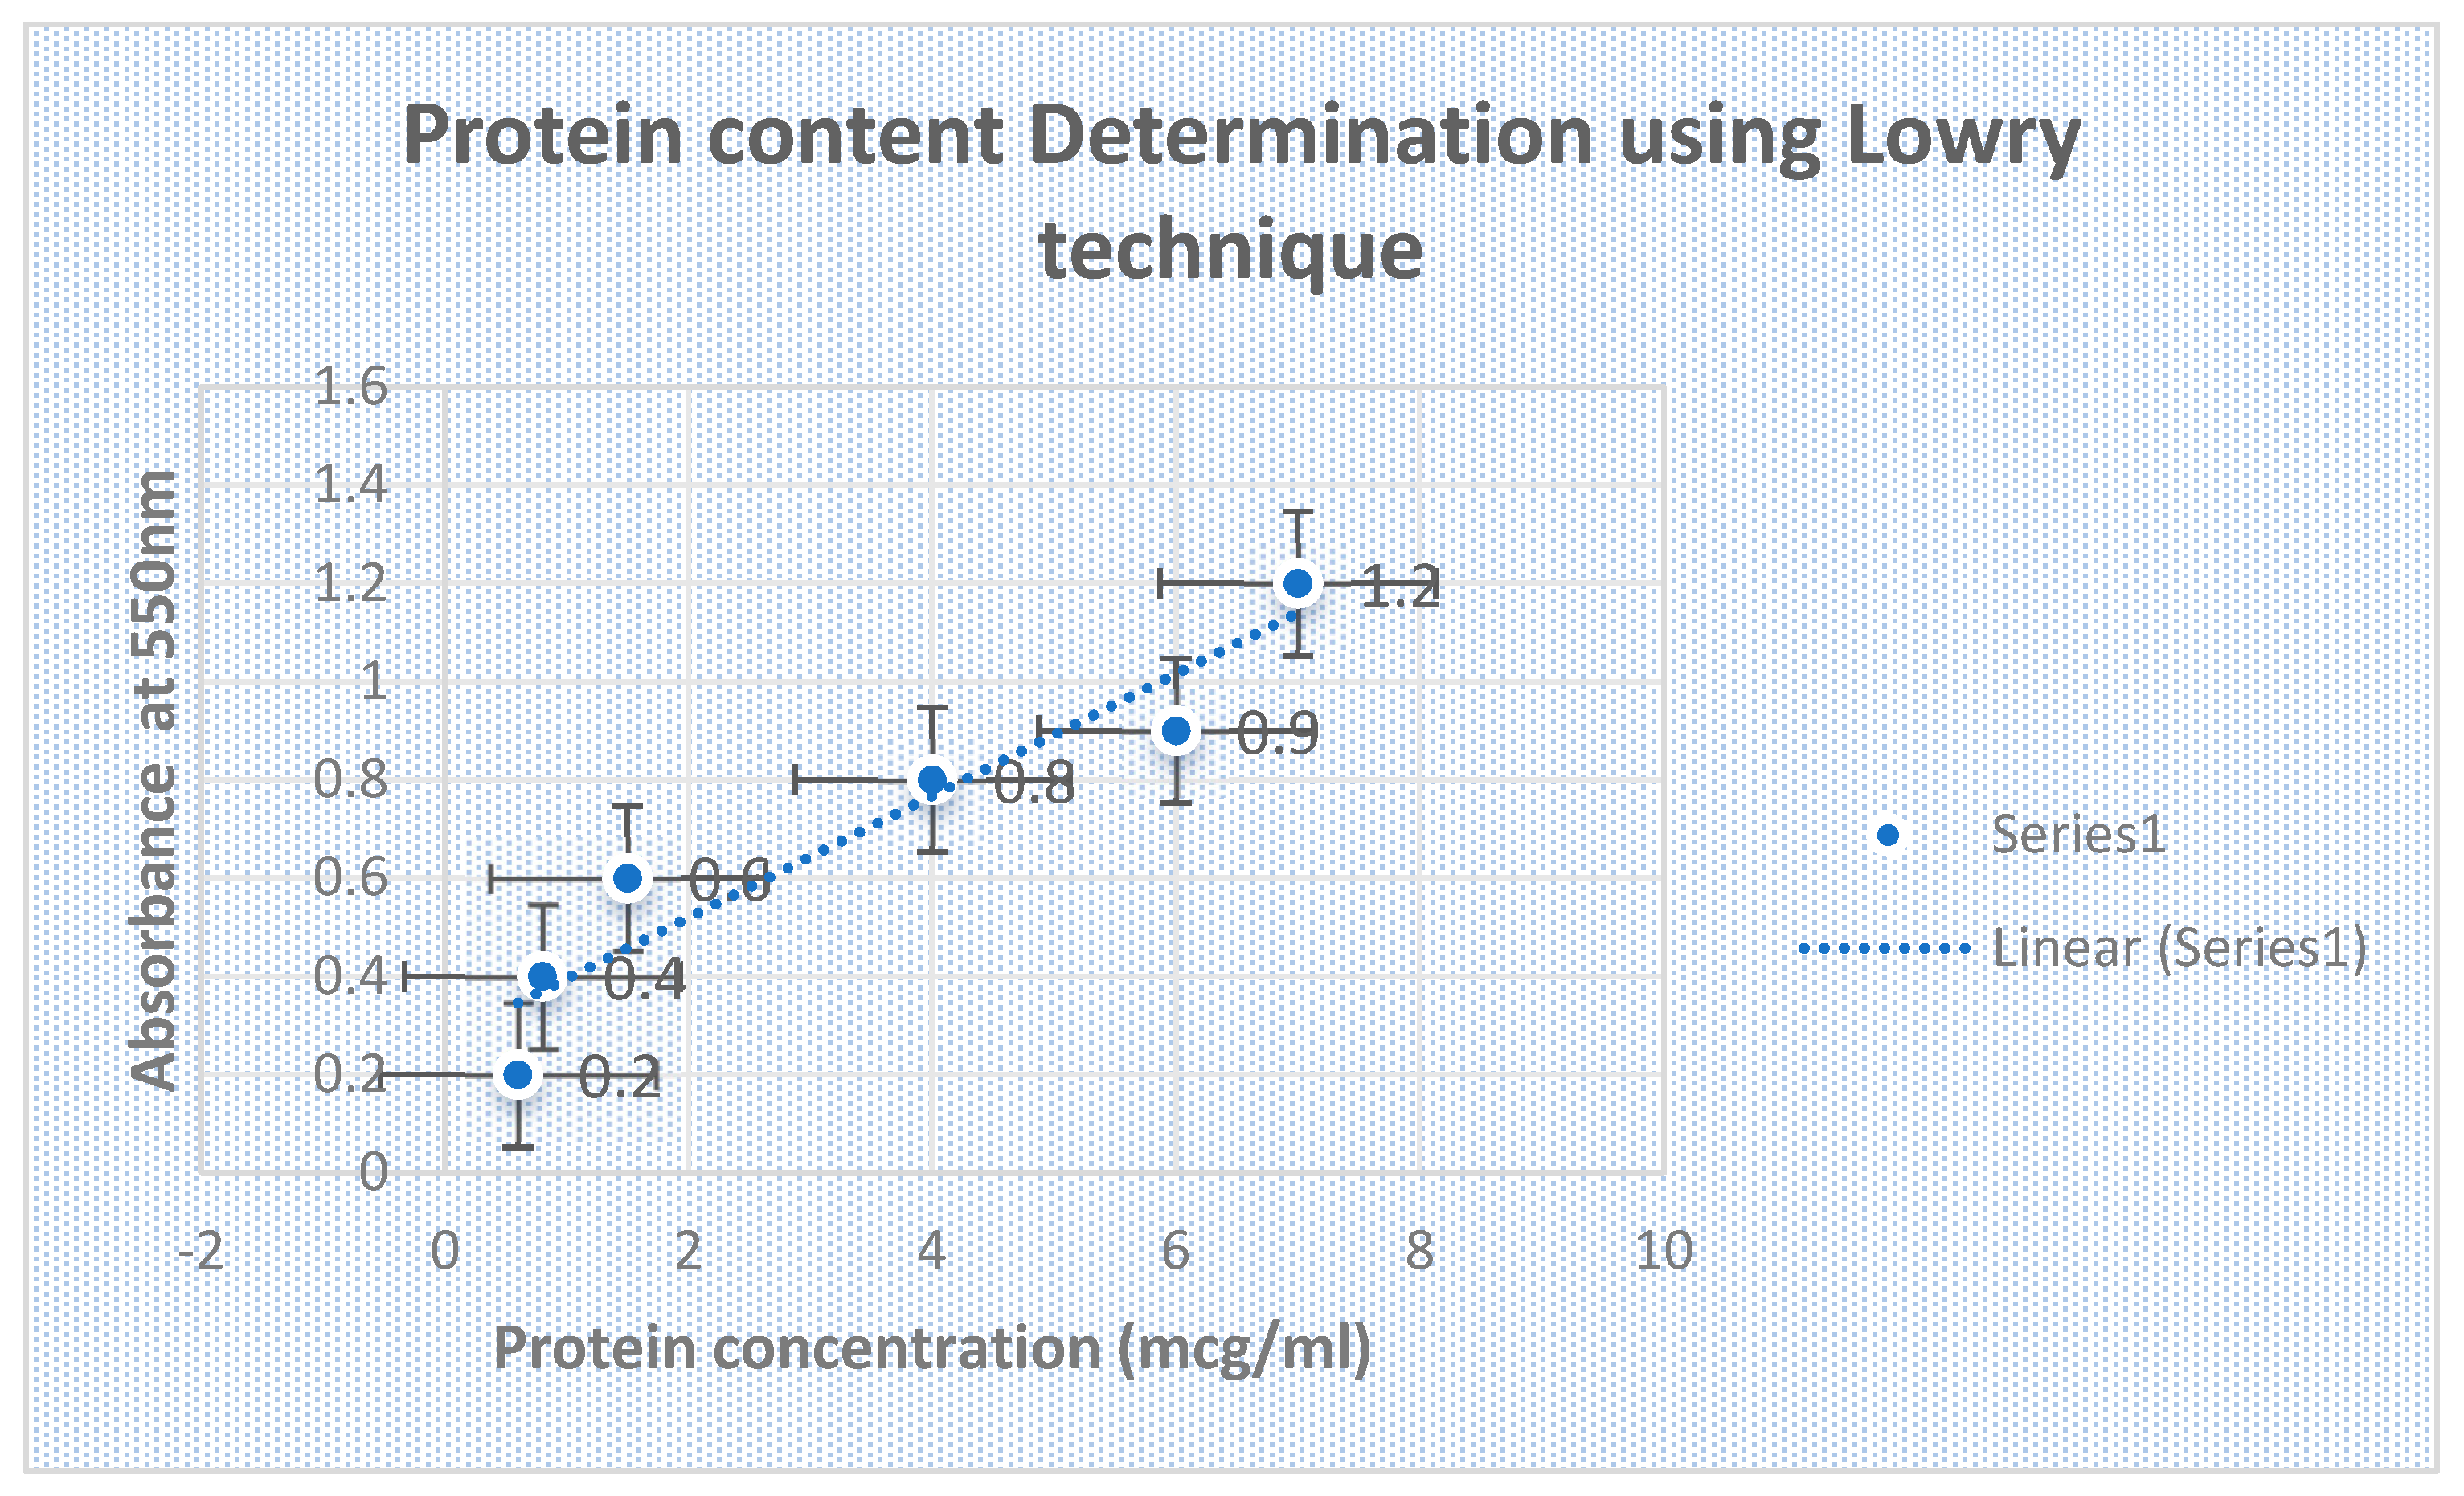
The Lowry test for the resolution of protein content is validated in
Figure 9. Morphology and biochemical characterization of the effectual bacterial isolates producing L-glutaminase is shown in
Table 9.
Disscussion
The goal of the current investigation was to extract the main L-glutaminase-producing bacterial isolates as an anticancer agent at a depth of 20 cm from various soil environments in Egypt.
The most powerful bacterial isolate that was discovered to be generating L-glutaminase was Bacillus subtilis niger (ATCC 9372).
The most favorable conditions for the development of the major bacterial isolates were 37 °C for 18 to 24 hours and a pH of 7.
The L-glutamic acid assay was used to measure the test enzyme activity.
L-glutamine in soil samples was transformed by the test enzyme amidohydrolase into L-glutamic acid and ammonia.
Restrictions endonuclease type II enzymes were used to extract the GLUT gene, which codes for L-glutaminase, in order to optimize the amount of L-glutaminase produced.
Afterwards, an invitro coupled transcription and translation method was used to create the enzyme. During the invitro manufacture of L-glutaminase, no purification step was needed, and the yield was about 90 µg/ml.
Additionally, the enzyme demonstrated anticancer properties throughout the MTT assay against auxotrophic malignancies for L-glutamine, including acute lymphocytic leukemia and hepatic carcinoma. All of the examined cancer cell lines had significant growth inhibition and a decline in cell viability, while the Vero normal cell lines exhibited very little of either.
Conversely, the Vero normal cell line had no impact from the test L-glutaminase, which was found to kill cancer cells by inducing programmed cell death (apoptosis) using the Caspase 3 assay.
Bacillus amyloliquefaciens strain AE-GT was shown to generate L-glutaminase, in accordance with a comparison with a prior investigation (EFSA Panel et al, 2024 study).17 In the current investigation, however, Bacillus subtilis niger (ATCC 9372) was used to manufacture it.
The DPPH experiment indicated that the test L-glutaminase enzyme exhibited substantial antioxidant activity.
Conclusions
The present study was a promising one due to the evolution of novel L-glutaminase producing bacterial isolates from different soil environments in Egypt. Optimization studies regarding the characterization of L-glutaminase are recommended in the future.
Abbreviations:
IM: Intramuscular, IV: Intravenous SC: Subcutaneous, IP: Intraperitoneal, Cmax: Maximum concentration, Tmax: Maximum time, t1/2: biological half life time of the drug. SDS-PAGE: Sodium dodecyl sulfate polyacrylamide gel electrophoresis, CL: Clearance. Vd: Volume of distribution.
Author Contributions
The present study was completely achieved via the single author prof. Mohammed Kassab, Faculty of Pharmacy, Cairo University, Egypt.
Funding
No funding was obtained.
Ethical Statement
The current study adhered to all relevant institutional, international, national, and national guidelines for the use and care of animals. All study procedures, including the use of animals, were approved by the Cairo University Ethics Committee for Animal Handling (ECAHCU) at the Faculty of Pharmacy, Cairo University, Egypt. This approval was granted on August 2, 2023, and followed the recommendations of the weather-all report. The permission number for the study was VZ18. Every effort was made to minimize the suffering and quantity of animals involved in the research.
Publication Consent
Not applicable.
Data and Material Availability
The datasets generated and/or analyzed during the current study are available in the Gen-bank repository, [accession numbers: PP946261].
Acknowledgments
The faculty of Pharmacy, Cairo University, Egypt is acknowledged for the support of the present study.
Conflicts of Interest
There is no conflict of interest.
References
- Bionod P et al [2017]. Recent developments in L-glutaminase production and applications- an overview. Journal of bioresource technology. 2017; 245( 2): 1766-1774. [CrossRef]
- Sajitha N et al [2014]. Antibacterial and antioxidant activities of L-glutaminase from seaweed endophytic fungi penicillium citrinum. Journal of international microbiology. 2014; Corpus ID: 85718144.
- Tung Duc Vo et al [2020]. Safety assessment of L-glutaminase from Aspergillus niger. Journal of food science and nutrition. 2020; 8(3): 1433-1450.
- Singh P et al. Biochemical characterization and antitumor study of L-glutaminase from Bacillus cereus MTCC 1305. Journal of applied biochemistry biotechnology. 2013; 171( 2): 522- 531. [CrossRef]
- Butheina A et al [2021]. Evidence of Antioxidant Activity of Novel L-Glutaminase Purified from L. Gasseri Brlhm. Journal of Applied Sciences and Nanotechnology. Vol. 1, No. 4 (2021). [CrossRef]
- Eman Z et al [2022]. Production, characterization and anti-tumor efficiency of L-glutaminase from halophilic bacteria. Journal of bulletin of the national research centre. 2022, 46[ 10]. [CrossRef]
- Nathiya et al [2011]. Screening of a high glutaminolytic enzyme producing strain and its extracellular production by solid state fermentation. International Journal of Pharma and Bio Sciences 2(3):297-302.
- Kiruthika Jambulingam et al [2013]. production of L- glutaminase ant its optimization from a novel marine isolate Vibrio azureus JK-79. African journal of biotechnology. Vol. 12, No. 50[ 2013].
- Hassan M Awad et al [2019]. Biochemical studies and biological activities on L-glutaminase from rhizosphere soil Streptomyces rochei SAH2_CWMSG. Egyptian pharmaceutical journal. 2019, 18[ 1]: 27-41. [CrossRef]
- Nagwa M et al [2019]. Anticancer L-glutaminase production and optimization using halo-tolerant Aspergillus flavus CZCU-9, F1H. Journal of Al-Azhar Bulletin of Science Vol. 30, No. 1, (June) 2019, pp. 1-9.
- Al-Zahrani NH[ 2020]. Screening L-Glutaminase producing some Pseudomonas sp. isolated from contact lenses by Rapid Plate Assay. Medical Science, 2020, 24( 105): 3647-3654.
- Nachimuthu S et al [2014]. Isolation and characterization of a novel L-glutaminase producing marine Bacillus subtilis strain JK-79. Asian Journal of Microbiology, Biotechnology and Environmental Sciences. January 2014.16( 3): 601-610.
- Pandian, S.R.K., Deepak, V., Sivasubramaniam, S.D. et al [2014]. Optimization and purification of anticancer enzyme L-glutaminase from Alcaligenes faecalis KLU102. Journal of Biologia. 2014; 69: 1644–1651. [CrossRef]
- Krisha k et al [2011]. Extracellular production of L-Glutaminase by marine alkalophilic Streptomyces sp.-SBU1 isolated from Cape Comorin coast. Indian Journal of Geo-Marine Sciences. 2011; 40(5).
- Zhang G et al[ 2021]. Protein-glutaminase: Research progress and prospect in food manufacturing. Journal of food bioscience. 2019; Volume 43, October 2021, 101314. [CrossRef]
- Kim SR, Tone A, Kim RH, Cesari M, Clarke BA, Eiriksson L, Hart TL, Aronson M, Holter S, Lytwyn A, Maganti M, Oldfield L, Gallinger S, Bernardini MQ, Oza AM, Djordjevic B, Lerner-Ellis J, Van de Laar E, Vicus D, Pugh TJ, Pollett A, Ferguson SE. Maximizing cancer prevention through genetic navigation for Lynch syndrome detection in women with newly diagnosed endometrial and nonserous/nonmucinous epithelial ovarian cancer. Cancer. 2021 Sep 1;127(17):3082-3091. Epub 2021 May 13. PMID: 33983630; PMCID: PMC8453540. [CrossRef]
- EFSA Panel on Food Contact Materials, Enzymes and Processing Aids (CEP); Silano V, Barat Baviera JM, Bolognesi C, Cocconcelli PS, Crebelli R, Gott DM, Grob K, Lambré C, Lampi E, Mengelers M, Mortensen A, Rivière G, Steffensen IL, Tlustos C, Van Loveren H, Vernis L, Zorn H, Andryszkiewicz M, Cavanna D, Liu Y, Lunardi S, Nielsen E, Norby K, di Piazza G, Roos Y, Chesson A. Safety evaluation of the food enzyme glutaminase from the non-genetically modified Bacillus amyloliquefaciens strain AE-GT. EFSA J. 2024 Feb 23;22(2):e8618. PMID: 38405110; PMCID: PMC10885168. [CrossRef]
Figure 1.
shows PCR cloning of gene encoding L-glutaminase extracted from Bacillus subtilis Bacillus subtilis subsp. niger (ATCC 9372).
Figure 1.
shows PCR cloning of gene encoding L-glutaminase extracted from Bacillus subtilis Bacillus subtilis subsp. niger (ATCC 9372).
Figure 2.
detects the cutting enzymes in coding sequence (CDS) of L-glutaminase using NEBcutterTM V3.0 software.
Figure 2.
detects the cutting enzymes in coding sequence (CDS) of L-glutaminase using NEBcutterTM V3.0 software.
Figure 3.
represents 3D structure of L-glutaminase generated using SWISS-MODEL software.
Figure 3.
represents 3D structure of L-glutaminase generated using SWISS-MODEL software.
Figure 4.
represents docking of the test L-glutaminase with Ni+2 cation. There is a potent affinity between them.
Figure 4.
represents docking of the test L-glutaminase with Ni+2 cation. There is a potent affinity between them.
Figure 5.
presents L-glutaminase activity estimation using Nesslerization assay. As the concentration of L-glutaminase inside the soil sample solution increased, the concentration of the liberated ammonia due to the hydrolysis of L-glutaminase increased proportionally.
Figure 5.
presents L-glutaminase activity estimation using Nesslerization assay. As the concentration of L-glutaminase inside the soil sample solution increased, the concentration of the liberated ammonia due to the hydrolysis of L-glutaminase increased proportionally.
Figure 6.
indicates antioxidant and scavenging activity of test L-glutaminase using DPPH scavenging and antioxidant assay.
Figure 6.
indicates antioxidant and scavenging activity of test L-glutaminase using DPPH scavenging and antioxidant assay.
Figure 7.
shows the kinetics of L-glutaminase.
Figure 7.
shows the kinetics of L-glutaminase.
Figure 8.
shows the absorbance of liberated L-glutamic acid at 216 nm wavelength due to the lysis of L-glutamine by the test L-glutaminase.
Figure 8.
shows the absorbance of liberated L-glutamic acid at 216 nm wavelength due to the lysis of L-glutamine by the test L-glutaminase.
Figure 9.
confirms Lowry assay for the resolution of protein content.
Figure 9.
confirms Lowry assay for the resolution of protein content.
Figure 10.
displays the determination of L-glutaminase induced apoptosis using the Caspase 3 activity technique.
Figure 10.
displays the determination of L-glutaminase induced apoptosis using the Caspase 3 activity technique.
Figure 11.
shows the inhibition impact of L-glutaminase on HePG-Z hepatic carcinoma cell line viability.
Figure 11.
shows the inhibition impact of L-glutaminase on HePG-Z hepatic carcinoma cell line viability.
Figure 12.
illustrates the cytotoxic effect of L-glutaminase on Hela cervical cancer cell line.
Figure 12.
illustrates the cytotoxic effect of L-glutaminase on Hela cervical cancer cell line.
Figure 13.
indicates the cytotoxicity of L-glutaminase on lymphocytic CCL4 cancer cell line.
Figure 13.
indicates the cytotoxicity of L-glutaminase on lymphocytic CCL4 cancer cell line.
Figure 14.
presents the detection of the cytotoxicity of L-glutaminase on HCT-116 colon cancer cell line.
Figure 14.
presents the detection of the cytotoxicity of L-glutaminase on HCT-116 colon cancer cell line.
Figure 15.
detects the cytotoxicity of L-glutaminase on A-549 lung cancer cell line.
Figure 15.
detects the cytotoxicity of L-glutaminase on A-549 lung cancer cell line.
Figure 16.
shows the cytotoxic impact of L-glutaminase on MCF-7 breast cancer cell line.
Figure 16.
shows the cytotoxic impact of L-glutaminase on MCF-7 breast cancer cell line.
Table 1.
List of instruments.
Table 1.
List of instruments.
| Instrument |
Model and Manufacturer |
| Autoclaves |
Tomy, japan |
| Aerobic incubator |
Sanyo, Japan |
| Digital balance |
Mettler Toledo, Switzerland |
| Oven |
Binder, Germany |
| Deep freezer -70 ̊̊C |
Artiko |
| Refrigerator 5 |
whirlpool |
| PH meter electrode |
Mettler-toledo,UK |
| Deep freezer -20 ̊̊C |
whirlpool |
| Gyrator shaker |
Corning gyrator shaker, Japan |
| 190-1100nm Ultraviolet visible spectrophotometer |
UV1600PC, China |
| Light( optical) microscope |
Amscope 120X-1200X, China |
Table 2.
It indicates to Ingredients of Mineral Glutamine Agar.
Table 2.
It indicates to Ingredients of Mineral Glutamine Agar.
| Ingredient |
Concentration (g/L) |
| Potassium chloride |
0.5 |
| Magnesium sulfate |
0.5 |
| KH2PO4 |
1.0 |
| Ferrous sulfate |
0.1 |
| Zinc sulfate |
0.1 |
| L.glutamine |
2.5 |
| agar |
20 |
Table 3.
It shows a list of ingredients of blood agar at 25 ℃, pH 6.5.
Table 3.
It shows a list of ingredients of blood agar at 25 ℃, pH 6.5.
| Ingredients |
Concentration (g/L) |
| Peptone |
10.0 g/ L |
| Tryptone |
10.0 g/ L |
| Sodium chloride |
5.0 g/ L |
| Agar |
15.0 g/ L |
| Distilled water |
Up to 1 litre |
Table 4.
It displays the formulation of L-glutaminase as a sterile solution at pH 7.3.
Table 4.
It displays the formulation of L-glutaminase as a sterile solution at pH 7.3.
| Ingredient |
Concentration (mg/ml) |
| L-glutaminase |
10 mg |
| PEG20 |
50 mg |
| Mono-basic sodium phosphate |
USP, 1 mg |
| Di-basic sodium phosphate |
USP, 2 mg |
| Sodium chloride |
USP, 5 mg |
| Water for injection |
Query size to 1 ml |
Table 5.
shows 16S rRNA homology of predominant L-glutaminase producing bacterial isolates using BLASTn software.
Table 5.
shows 16S rRNA homology of predominant L-glutaminase producing bacterial isolates using BLASTn software.
| Description |
Scientific Name |
Max Score |
Total Score |
Query Cover |
Per. Identity |
| glutaminase A [Bacillus subtilis] |
Bacillus subtilis |
634 |
634 |
100% |
99.68 |
| glutaminase A [Bacillus subtilis] |
Bacillus subtilis |
634 |
634 |
100% |
99.68 |
| glutaminase A [Bacillus subtilis] |
Bacillus subtilis |
634 |
634 |
100% |
99.68 |
| glutaminase A [Bacillus subtilis] |
Bacillus subtilis |
634 |
634 |
100% |
99.68 |
| glutaminase A [Bacillus subtilis] |
Bacillus subtilis |
633 |
633 |
100% |
99.68 |
| glutaminase A [Bacillus] |
Bacillus |
633 |
633 |
100% |
99.68 |
| glutaminase [Bacillus subtilis] |
Bacillus subtilis |
633 |
633 |
100% |
99.68 |
| glutaminase A [Bacillus] |
Bacillus |
633 |
633 |
100% |
99.68 |
| glutaminase A [Bacillales] |
Bacillales |
633 |
633 |
100% |
99.68 |
| glutaminase A [Bacillus subtilis] |
Bacillus subtilis |
633 |
633 |
100% |
99.68 |
| glutaminase A [Bacillus subtilis] |
Bacillus subtilis |
633 |
633 |
100% |
99.68 |
| glutaminase A [Bacillus subtilis] |
Bacillus subtilis |
633 |
633 |
100% |
99.68 |
| glutaminase A [Bacillus subtilis] |
Bacillus subtilis |
633 |
633 |
100% |
99.68 |
| glutaminase A [Bacillus] |
Bacillus |
633 |
633 |
100% |
99.68 |
| glutaminase A [Bacillus subtilis] |
Bacillus subtilis |
633 |
633 |
100% |
99.68 |
| glutaminase A [Bacillus subtilis] |
Bacillus subtilis |
633 |
633 |
100% |
99.68 |
| glutaminase A [Bacillus subtilis] |
Bacillus subtilis |
633 |
633 |
100% |
99.68 |
| glutaminase A [Bacillus subtilis] |
Bacillus subtilis |
633 |
633 |
100% |
99.68 |
| glutaminase A [Bacillus] |
Bacillus |
633 |
633 |
100% |
99.68 |
| glutaminase A [Bacillus sp. 204(2023)] |
Bacillus sp. 204(2023) |
632 |
632 |
100% |
99.68 |
| glutaminase A [Bacillus subtilis] |
Bacillus subtilis |
632 |
632 |
100% |
99.35 |
| glutaminase A [Bacillus] |
Bacillus |
632 |
632 |
100% |
99.68 |
| glutaminase A [Bacillus subtilis] |
Bacillus subtilis |
632 |
632 |
100% |
99.35 |
| glutaminase A [Bacillus] |
Bacillus |
632 |
632 |
100% |
99.68 |
| glutaminase A [Bacillus subtilis] |
Bacillus subtilis |
632 |
632 |
100% |
99.35 |
| glutaminase A [Bacillus subtilis] |
Bacillus subtilis |
632 |
632 |
100% |
99.35 |
| glutaminase A [Bacillus] |
Bacillus |
632 |
632 |
100% |
99.35 |
| glutaminase A [Bacillus subtilis] |
Bacillus subtilis |
631 |
631 |
100% |
99.03 |
Table 6.
It shows the effects of temperatures on the activity of L-glutaminase.
Table 6.
It shows the effects of temperatures on the activity of L-glutaminase.
|
Temperature (℃)
|
Enzyme Activity (U/ml) |
| 20 |
8 |
| 25 |
12 |
| 30 |
15 |
| 35 |
21 |
| 40 |
16 |
| 60 |
2 |
| 80 |
0 |
Table 7.
It demonstrates the effects of different pH on the activity of L-glutaminase.
Table 7.
It demonstrates the effects of different pH on the activity of L-glutaminase.
| pH |
Enzyme Activity (U/ml) |
| 2 |
0 |
| 3 |
0.1± .05 |
| 4 |
0.2± 0.3 |
| 6 |
21± 0.5 |
| 7 |
18± 0.2 |
| 9 |
14± 0.1 |
| 12 |
6± 0.2 |
| 13 |
0.09± 0.03 |
Table 8.
It shows the effects of different metal ions on the activity of L-gutaminase.
Table 8.
It shows the effects of different metal ions on the activity of L-gutaminase.
| Metal Ion (5mM) |
Enzyme Activity ( U/ml) |
| Na+
|
8± 2 |
| K+
|
10± 1 |
| Mg+2
|
21± 2 |
| Cu+2
|
14± 1 |
| Ni+2
|
18± 3 |
| Mn+2
|
15± 1 |
| Co+2
|
12± 1 |
Table 9.
Morphological characters and biochemical reactions profile of the potent bacterial isolates producing L-glutaminase.
Table 9.
Morphological characters and biochemical reactions profile of the potent bacterial isolates producing L-glutaminase.
| Gram Staining |
Biochemical Reactions |
Morphology of Bacterial Colony |
| Rod shaped bacterial isolates that formed small clumps and short chains. |
The predominant bacterial isolates producing L-glutaminase demonstrated + ve biochemical reactions towards amylase, catalase and Voges Proskauer and beta hemolysis and citrate. +ve bacterial growth was observed at 6.5% W/V Nacl salt solution. |
Circular, white, fuzzy, rough and opaque colony with jagged edges. |
|
Disclaimer/Publisher’s Note: The statements, opinions and data contained in all publications are solely those of the individual author(s) and contributor(s) and not of MDPI and/or the editor(s). MDPI and/or the editor(s) disclaim responsibility for any injury to people or property resulting from any ideas, methods, instructions or products referred to in the content. |
© 2024 by the authors. Licensee MDPI, Basel, Switzerland. This article is an open access article distributed under the terms and conditions of the Creative Commons Attribution (CC BY) license (http://creativecommons.org/licenses/by/4.0/).
