Submitted:
08 August 2024
Posted:
12 August 2024
You are already at the latest version
Abstract
Keywords:
1. Introduction
2. Results and Discussion
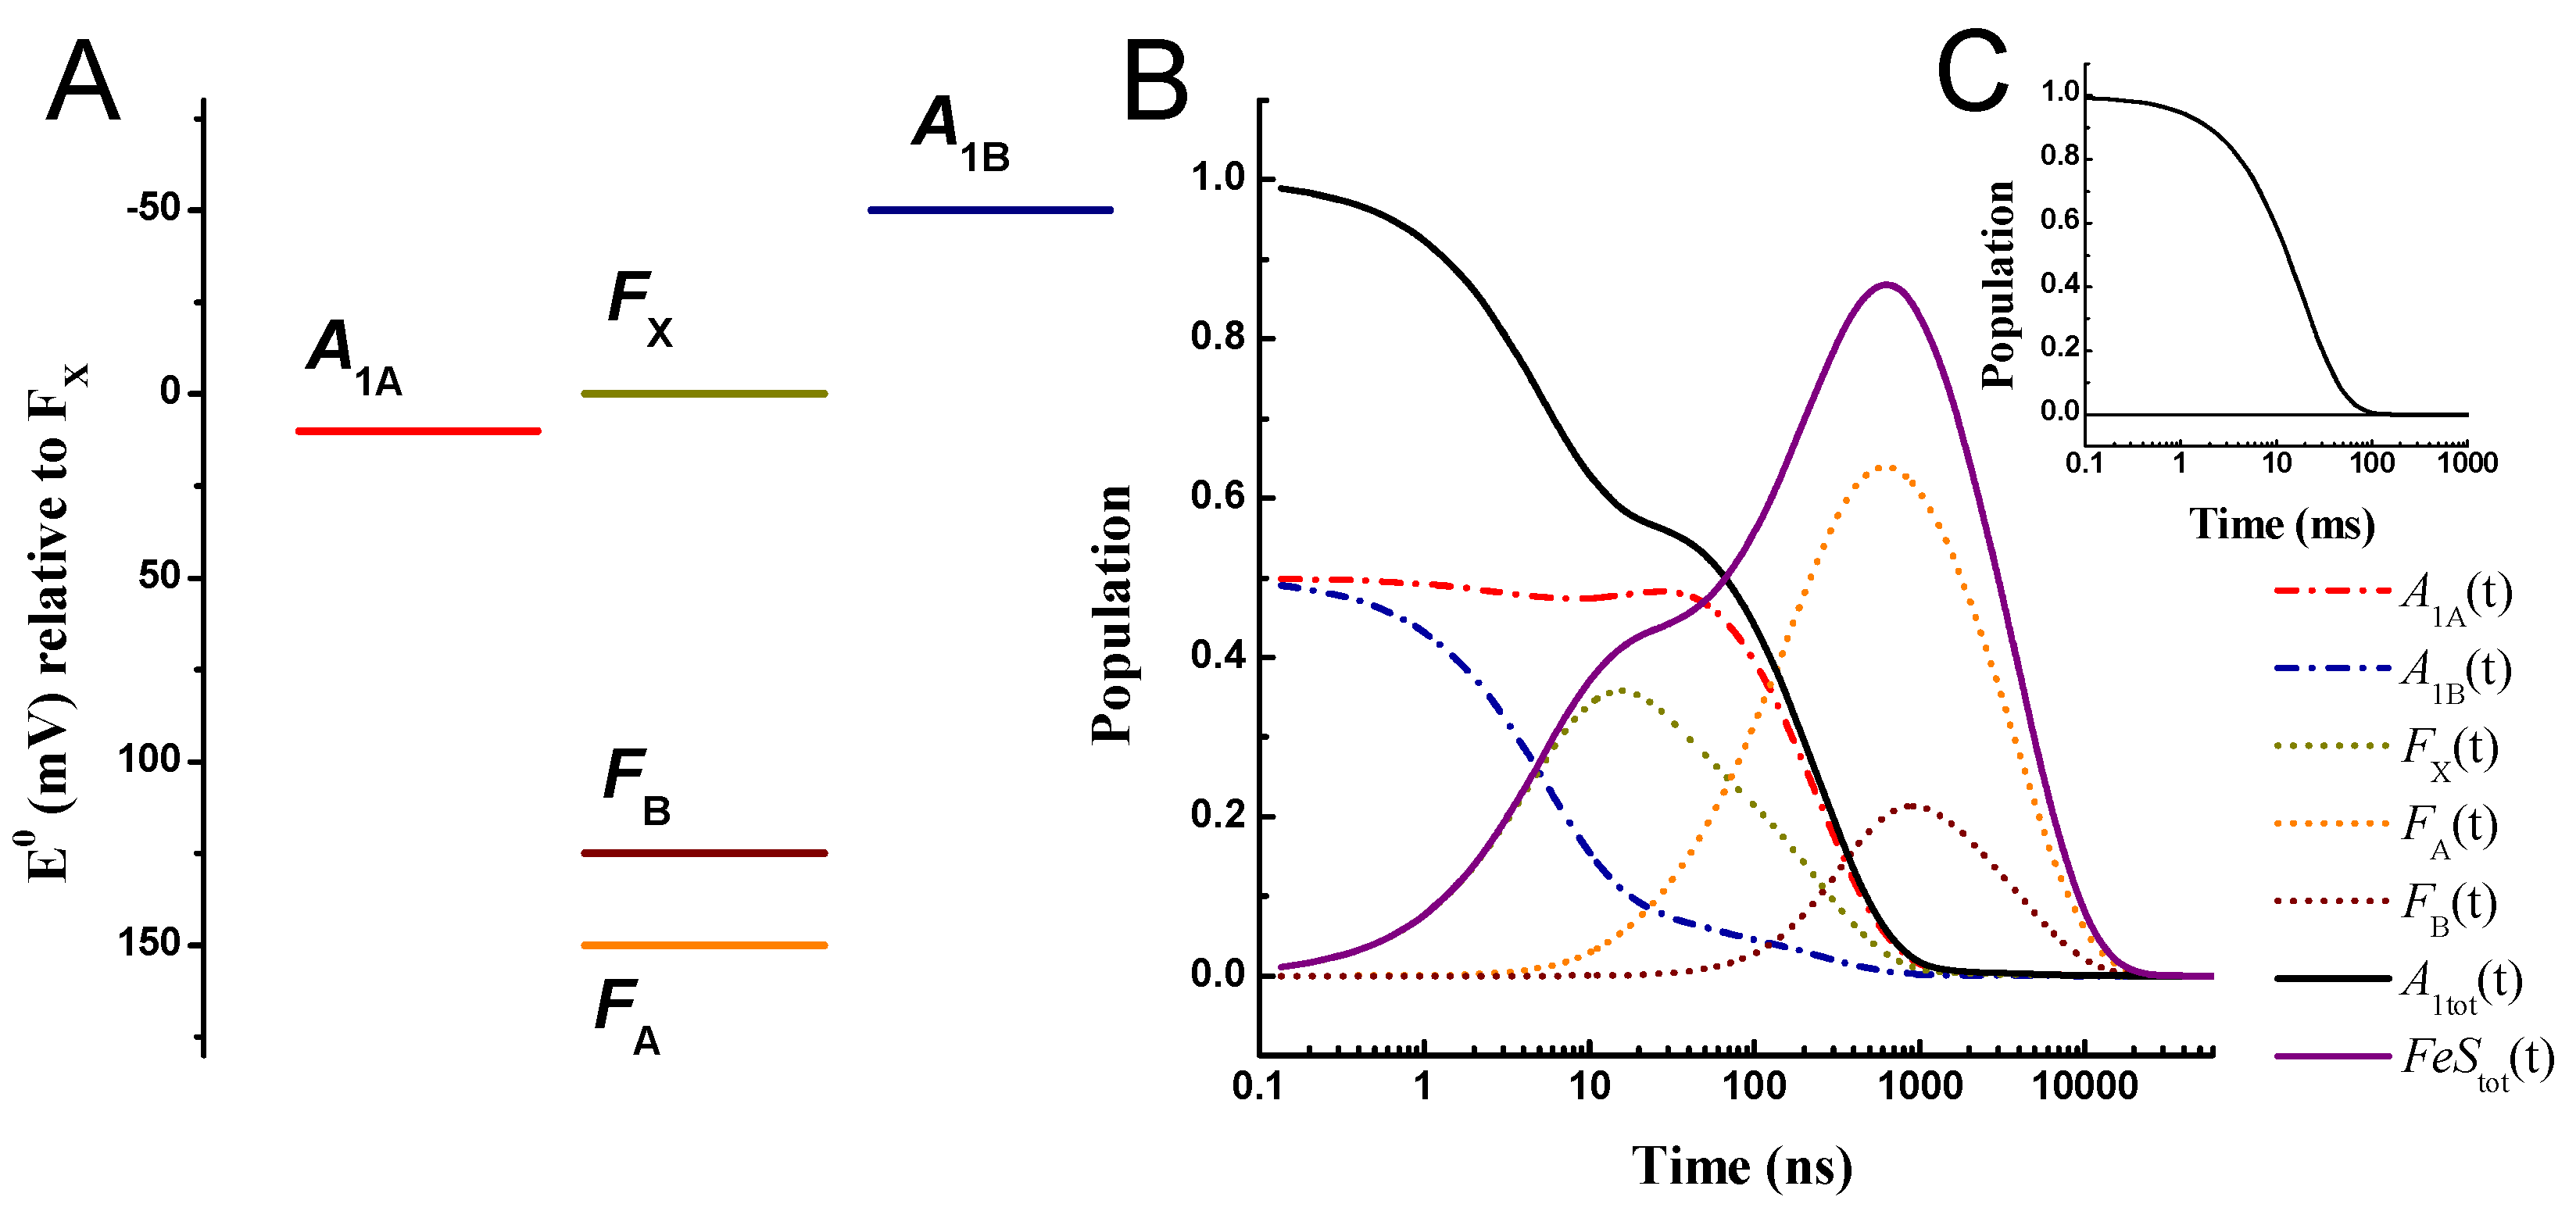
| Rate Determining Parameters | Electron Transfer Simulated Parameters | ||||||||||||
| Amplitudes | |||||||||||||
| Reaction |
(Å) |
(eV) |
(eV) |
(eV/cm-1) |
(ns-1) |
(ns) | |||||||
| 9.1 |
0.01 | 0.700 |
0.022 (175) |
0.0181 | 5.26 | 0.0754 | 0.382 | -0.489 | 0.033 | 0.000 | 0.457 | -0.457 | |
| 9.0 |
-0.05 | 0.700 |
0.046 (375) |
0.145 | 22.5 | -0.173 | 0.051 | 0.172 | -0.051 | 0.003 | -0.123 | 0.123 | |
| 11.6 | -0.15 | 0.700 | 0.034 (275) |
0.0126 | 136 | 0.0035 | 0.000 | 0.001 | -0.295 | 0.336 | 0.004 | 0.042 | |
| 9.5 | 0.025 | 0.900 | 0.034 (275) |
0.0019 | 243 | 0.587 | 0.067 | 0.312 | -0.489 | -0.628 | 0.654 | -0.806 | |
| – | – | – | – | 0.00100 | 3808 | 0.0068 | 0.001 | 0.005 | 0.803 | 0.290 | 0.008 | 1.098 | |
2.2. Large Driving Force Scenario for Oxidation
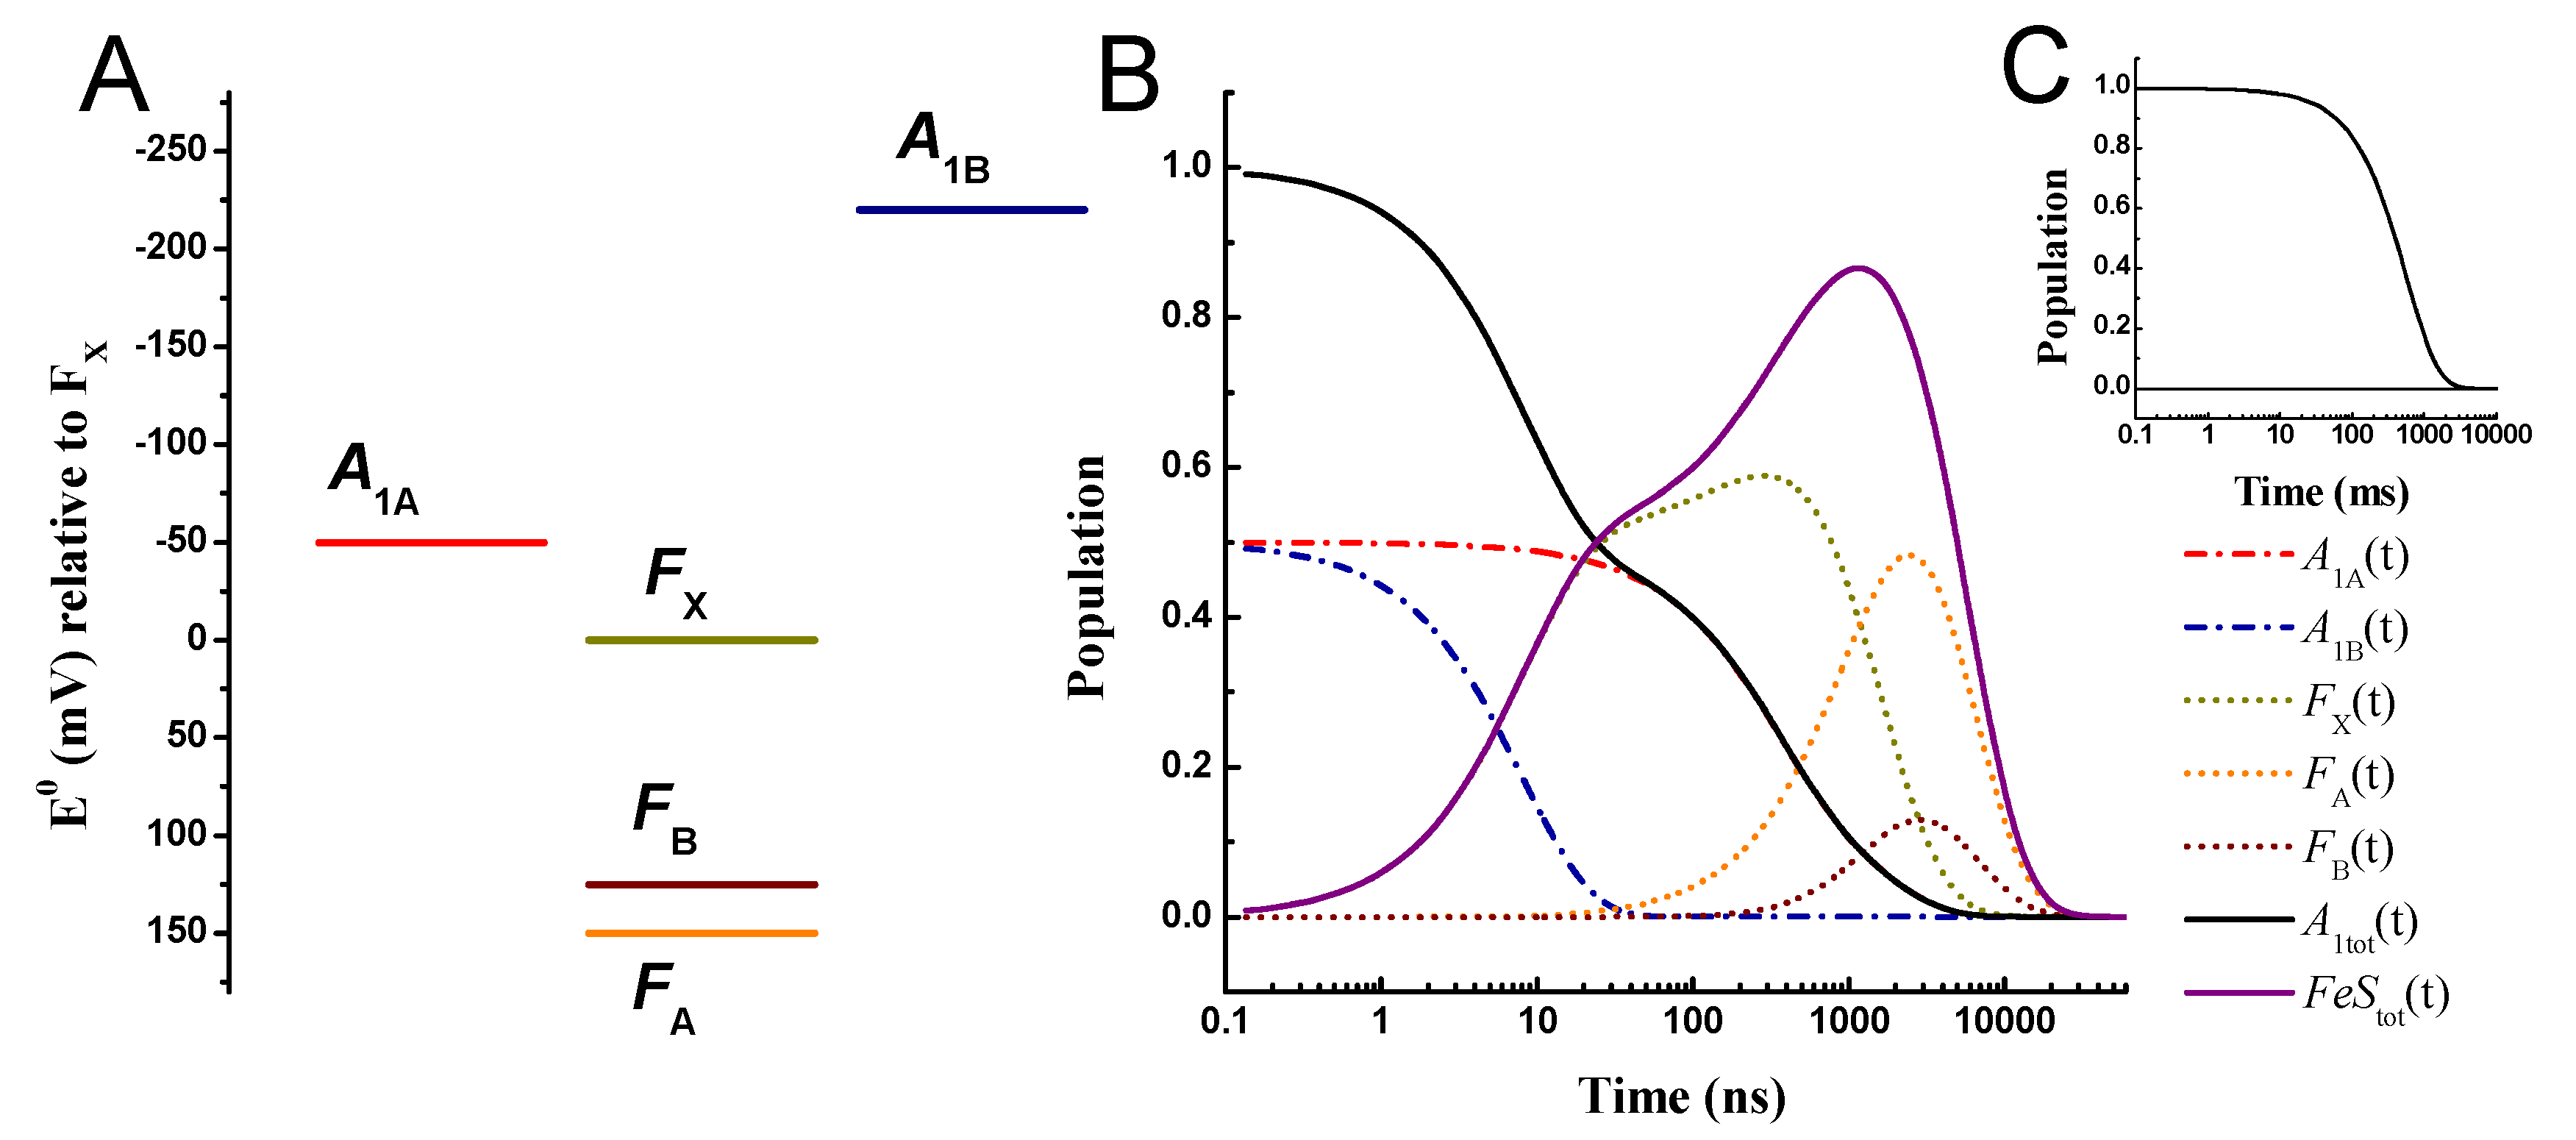
2.3. Effect of Changing the Driving Force of Oxidation ()
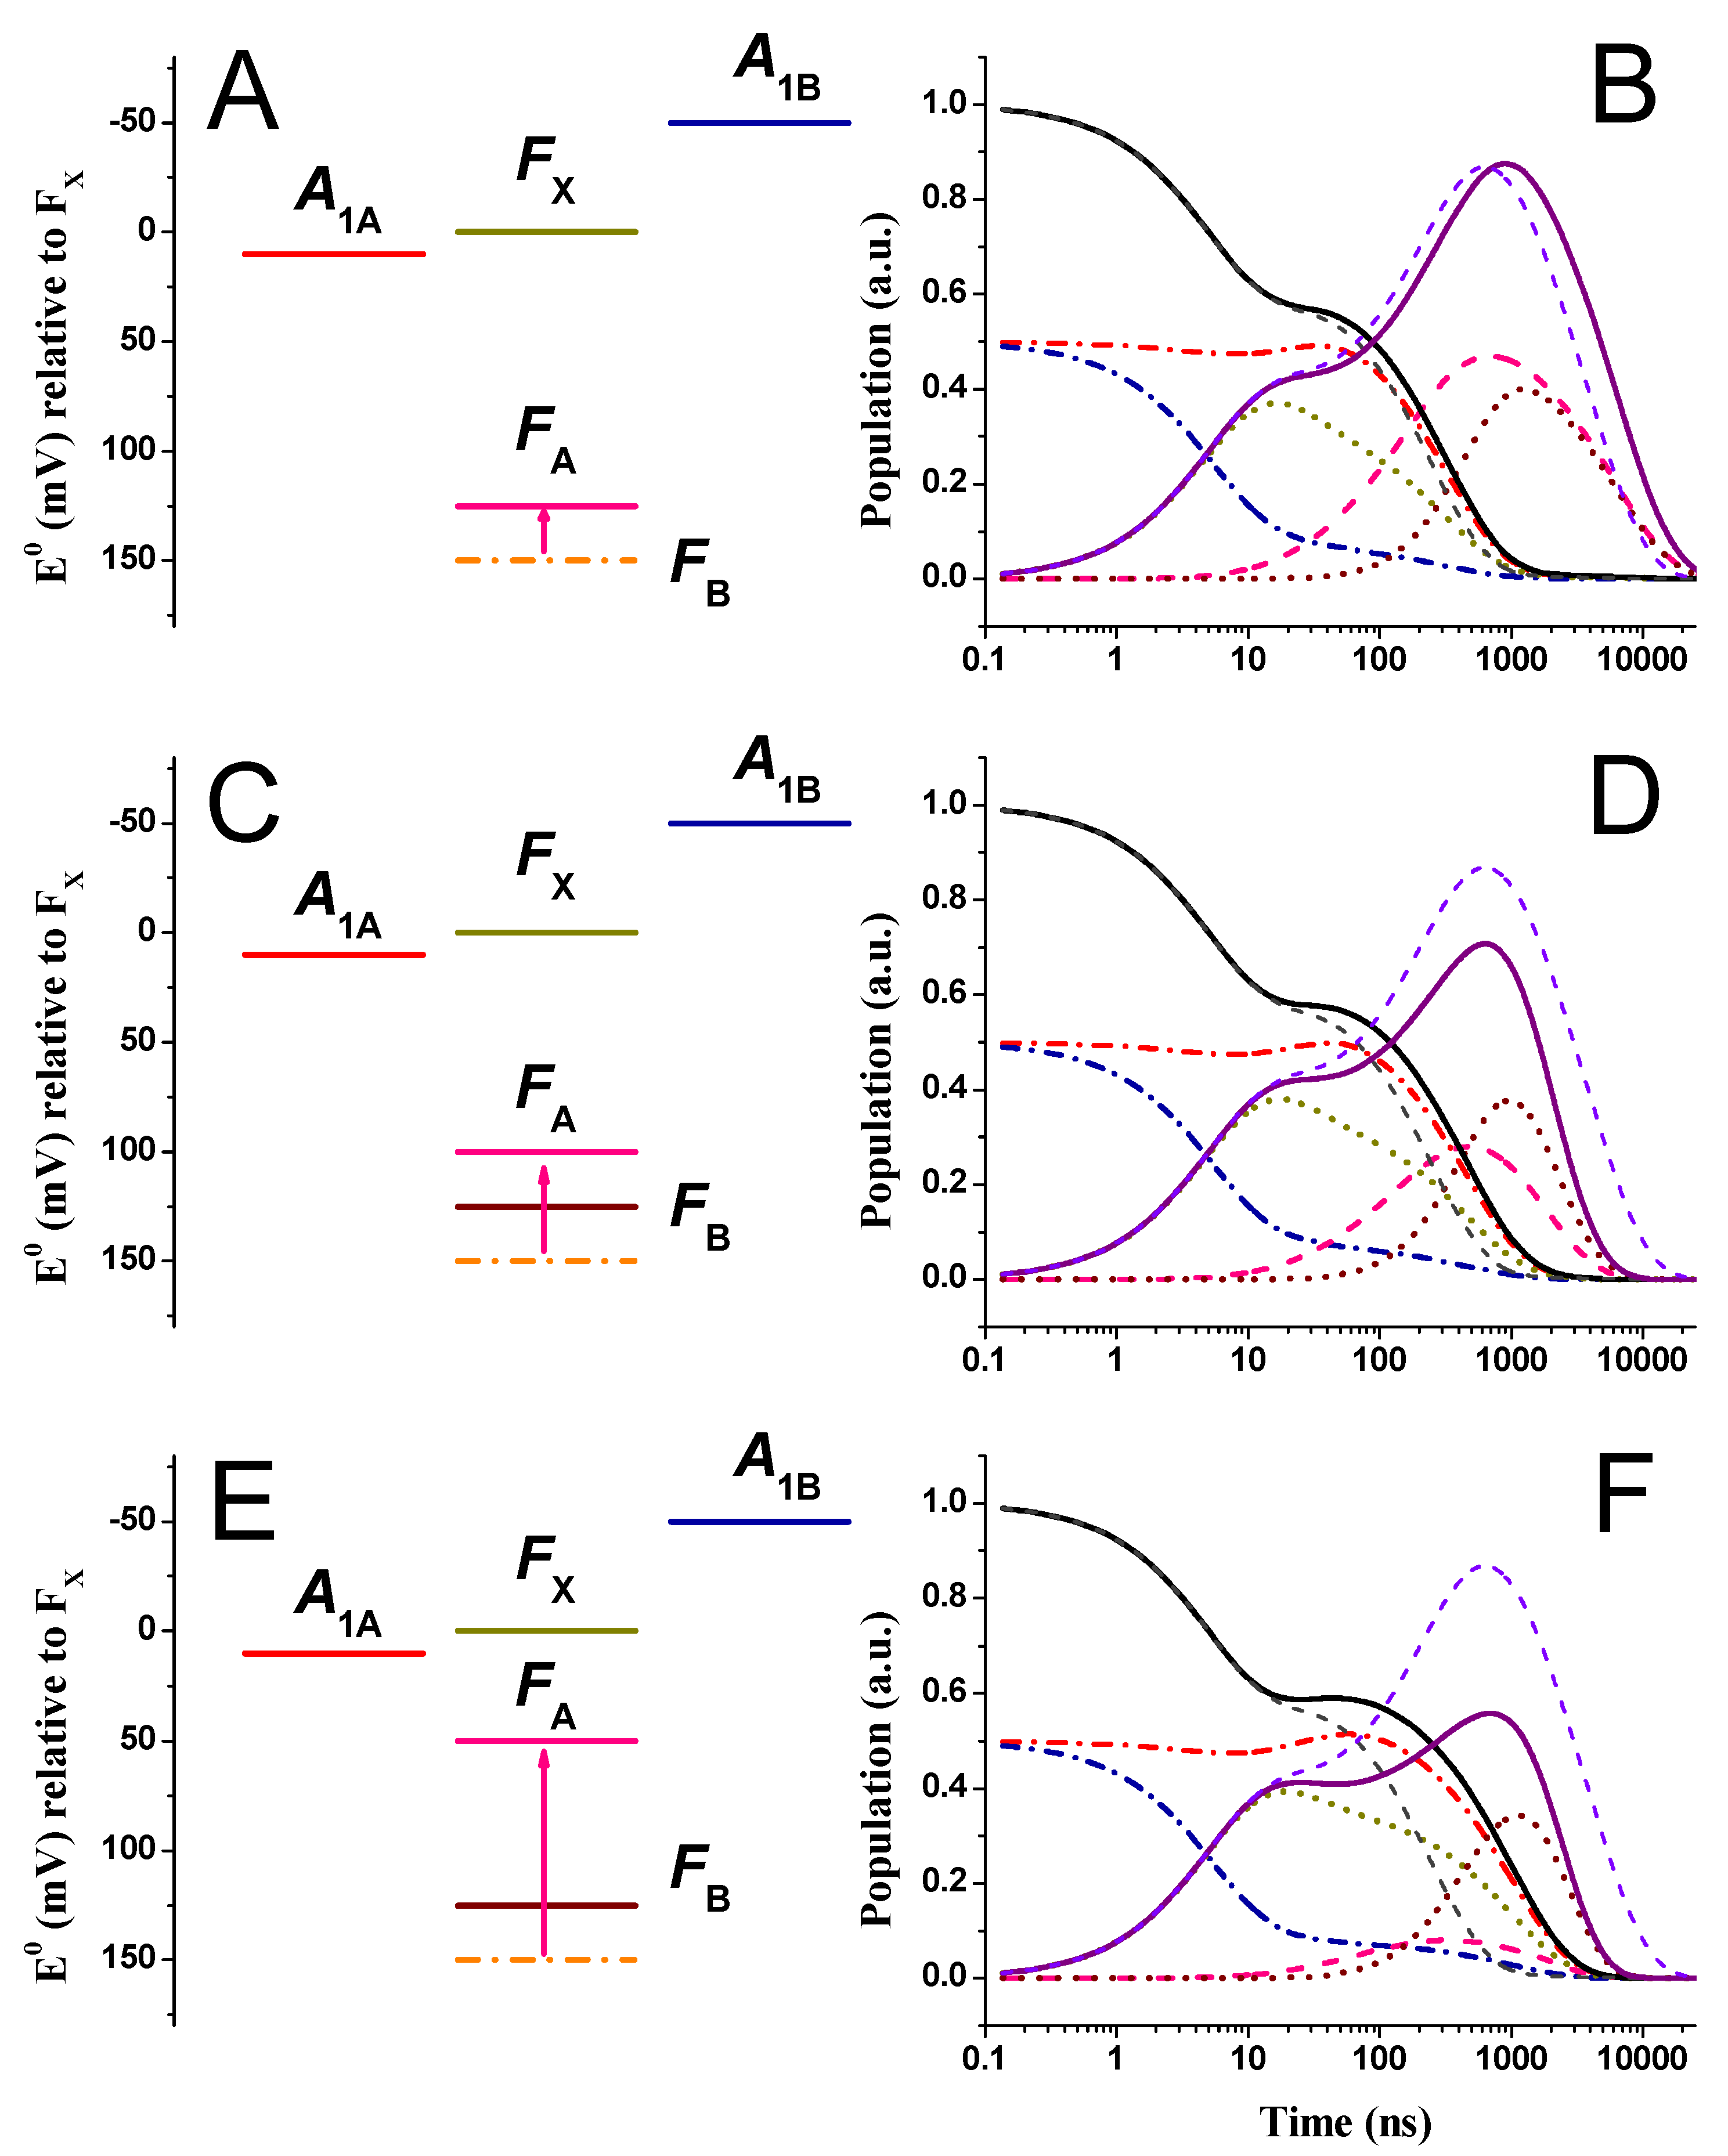
2.4. Effect of Changing the Driving Force of Oxidation ()
3. Materials and Methods
4. Conclusions
Supplementary Materials
Author Contributions
Funding
Data Availability Statement
Conflicts of Interest
References
- Caffarri, S.; Tibiletti, T.; Jennings, R.C.; Santabarbara, S. A comparison between plant photosystem I and photosystem II architecture and functioning. Curr Protein Pept Sci 2014, 15, 296–331. [Google Scholar] [CrossRef]
- Srinivasan, N.; Golbeck, J.H. Protein-cofactor interactions in bioenergetic complexes: The role of the A1A and A1B phylloquinones in Photosystem I. Biochim Biophys Acta 2009, 1787, 1057–1088. [Google Scholar] [CrossRef] [PubMed]
- Jordan, P.; Fromme, P.; Witt, H.T.; Klukas, O.; Saenger, W.; Krauss, N. Three-dimensional structure of cyanobacterial photosystem I at 2.5 angstrom resolution. Nature 2001, 411, 909–917. [Google Scholar] [CrossRef] [PubMed]
- Mazor, Y., Borovikova, A., Caspy, I., Nelson, N. (2017) Structure of the plant photosystem I supercomplex at 2.6 Å resolution. Nat. Plants 3:17014. [CrossRef]
- Qin, X. , Suga, M., Kuang, T., Shen, J.R. (2015) Photosynthesis. Structural basis for energy transfer pathways in the plant PSI-LHCI supercomplex. Science. [CrossRef]
- Brettel, K. (1997) Electron transfer and arrangement of the redox cofactors in photosystem I. Biochim. Biophys. Acta 1318, 322–373. [Google Scholar] [CrossRef]
- Santabarbara, S., Heathcote, P., Evans, M.C.W. (2005) Modelling of the electron transfer reactions in Photosystem I by electron tunnelling theory. Biochim. Biophys. Acta 1708, 283–310. [CrossRef]
- Rappaport, F. , Diner, B.A., Redding, K.E. (2006) “Optical Measurements of Secondary Electron Transfer in Photosystem I,” in Photosystem I: The Light–Driven Plastocyanin:Ferredoxin Oxidoreductase, ed. J.H. Golbeck (Dordrecht, Kluwer Academic Publishers), 223–244. [CrossRef]
- Redding, K.E. , van der Est, A. (2006). “The Directionality of Electron Transport in Photosystem I,” in Photosystem I: The Light–Driven Plastocyanin:Ferredoxin Oxidoreductase, ed. J.H. Golbeck (Dordrecht, Kluwer Academic Publishers), 413–437. [CrossRef]
- Santabarbara, S., Galuppini, L., Casazza, A.P. (2010). Bidirectional electron transfer in the reaction centre of photosystem I. J. Integr. Plant. Biol. 52, 735–749. [CrossRef]
- Makita, H., Hastings, G. (2016) Modeling electron transfer in photosystem I. Biochim. Biophys. Acta 1857, 723–733. [CrossRef]
- Santabarbara, S.; Casazza, A.P.; Hastings, G. Modelling electron transfer in photosystem I: limits and perspectives. Physiol. Plant. 2019, 166, 73–87. [Google Scholar] [CrossRef] [PubMed]
- Santabarbara, S., Kuprov, I., Fairclough, W.V., Purton, S., Hore, P.J., Heathcote, P., Evans, M.C.W. (2005) Bidirectional electron transfer in photosystem I: determination of two distances between P700+ and A1- in spin-correlated radical pairs. Biochemistry 44, 2119–2128. [CrossRef]
- Poluektov, O.G., Paschenko, S.V., Utschig, L.M., Lakshmi, K.V., Thurnauer, M.C. (2005) Bidirectional electron transfer in photosystem I: direct evidence from high-frequency time-resolved EPR spectroscopy. J. Am. Chem. Soc. 127, 11910–11911. [CrossRef]
- Santabarbara, S., Kuprov, I., Hore, P.J., Casal, A., Heathcote, P., Evans, M.C.W. (2006) Analysis of the spin-polarized electron spin echo of the [P700+A1-] radical pair of photosystem I indicates that both reaction center subunits are competent in electron transfer in cyanobacteria, green algae, and higher plants. Biochemistry 45, 7389–7403. [CrossRef]
- Ramesh, V.M.; Gibasiewicz, K.; Lin, S.; Bingham, S.E.; Webber, A.N.A. Replacement of the methionine axial ligand to the primary electron acceptor A0 slows the A0− reoxidation dynamics in Photosystem I. Biochim. Biophys. Acta 2007, 1767, 151–160. [Google Scholar] [CrossRef]
- Giera, W.; Gibasiewicz, K.; Ramesh, V.M.; Lin, S.; Webber, A. Electron transfer from A0- to A1 in Photosystem I from Chlamydomonas reinhardtii occurs in both the A and B branch with 25-30-ps lifetime. Phys. Chem. Chem. Phys. 2009, 11, 5186–5191. [Google Scholar] [CrossRef]
- Santabarbara, S., Kuprov, I., Poluektov, O.G., Casal, A., Russell, C.A., Purton, S., Evans, M.C.W. (2010) Directionality of electron-transfer reactions in photosystem I of prokaryotes: universality of the bidirectional electron-transfer model. J. Phys. Chem. B 114, 15158–15171. [CrossRef]
- Poluektov, O.G.; Utschig, L.M. Directionality of Electron Transfer in Type I Reaction Center Proteins: High-Frequency EPR Study of PS I with Removed Iron−Sulfur Centers. J. Phys. Chem. B 2015, 119, 13771–13776. [Google Scholar] [CrossRef] [PubMed]
- Xu, W., Chitnis, P.R., Valeva, A., van der Est, A., Brettel, K., Guergova-Kuras, M. et al. (2003) Electron transfer in cyanobacterial photosystem I: II. Determination of forward electron transfer rates of site-directed mutants in a putative electron transfer pathway from A0 through A1 to FX. J. Biol. Chem. 278, 27876–27887. [CrossRef]
- Cohen, R.O., Shen, G., Golbeck, J.H., Xu, W., Chitnis, P.R., Valieva, A.I., van der Est, A., Pushkar, Y., Stehlik, D. (2004) Evidence for asymmetric electron transfer in cyanobacterial photosystem I: analysis of a methionine-to-leucine mutation of the ligand to the primary electron acceptor A0. Biochemistry 43, 4741–4754. [CrossRef]
- Dashdorj, N., Xu, W., Cohen, R.O., Golbeck, J.H., Savikhin, S. (2005) Asymmetric electron transfer in cyanobacterial Photosystem I: charge separation and secondary electron transfer dynamics of mutations near the primary electron acceptor A0. Biophys. J. 88, 1238–12349. [CrossRef]
- Sun, J., Hao, S., Radle, M., Xu, W., Shelaev, I., Nadtochenko, V., Shuvalov, V., Semenov, A.Yu., Gordon, H., van der Est, A., Golbeck, J.H. (2014) Evidence that histidine forms a coordination bond to the A0A and A0B chlorophylls and a second H-bond to the A1A and A1B phylloquinones in M688HPsaA and M668HPsaB variants of Synechocystis sp. PCC 6803. Biochim. Biophys. Acta. 1837, 1362–1375. [CrossRef]
- Milanovsky, G.E., Ptushenko, V.V., Golbeck, J.H., Semenov, A.Y., Cherepanov, D.A. (2014) Molecular dynamics study of the primary charge separation reactions in Photosystem I: effect of the replacement of the axial ligands to the electron acceptor A0. Biochim. Biophys. Acta 1837, 1472–1483. [CrossRef]
- Joliot, P., Joliot, A. (1999) In vivo analysis of the electron transfer within photosystem I: are the two phylloquinones involved? Biochemistry 38, 11130–11136. [CrossRef]
- Brettel, K.; Leibl, W. Electron transfer in photosystem I. Biochim Biophys Acta 2001, 1507, 100–114. [Google Scholar] [CrossRef] [PubMed]
- Guergova-Kuras, M., Boudreaux, B., Joliot, A., Joliot, P., Redding, K.E. (2001) Evidence for two active branches for electron transfer in photosystem I. Proc. Natl. Acad. Sci. U.S.A. 98, 4437–4442. [CrossRef]
- Fairclough, W.V.; Forsyth, A.; Evans, M.C.W.; Rigby, S.E.J.; Purton, S.; Heathcote, P. Bidirectional electron transfer in photosystem I: electron transfer on the PsaA side is not essential for phototrophic growth in Chlamydomonas. Biochim Biophys. Acta 2003, 1606, 43–55. [Google Scholar] [CrossRef] [PubMed]
- Purton, S. , Stevens, D.R., Muhiuddin, I.P., Evans, M.C., Carter, S., Rigby, S.E., Heathcote, P. (2001). Site-directed mutagenesis of PsaA residue W693 affects phylloquinone binding and function in the photosystem I reaction center of Chlamydomonas reinhardtii. Biochemistry 40, 2167–2175. [CrossRef]
- Byrdin, M., Santabarbara, S., Gu, F., Fairclough, V.W., Heathcote, P., Redding, K.E., Rappaport, F. (2006) Assignment of a kinetic component to electron transfer between iron-sulfur clusters FX and FA/B of Photosystem I. Biochim. Biophys. Acta 1757, 1529–1538. [CrossRef]
- Ali, K., Santabarbara, S., Heathcote, P., Evans, M.C.W., Purton, S. (2006) Bidirectional electron transfer in photosystem I: replacement of the symmetry-breaking tryptophan close to the PsaB-bound phylloquinone A1B with a glycine residue alters the redox properties of A1B and blocks forward electron transfer at cryogenic temperatures. Biochim. Biophys. Acta 1757, 1623–1633. [CrossRef]
- Ali, K., Santabarbara, S., Heathcote, P., Evans, M.C.W., Purton, S. (2006) Bidirectional electron transfer in photosystem I: replacement of the symmetry-breaking tryptophan close to the PsaB-bound phylloquinone A1B with a glycine residue alters the redox properties of A1B and blocks forward electron transfer at cryogenic temperatures. Biochim. Biophys. Acta 1757, 1623–1633. [CrossRef]
- Agalarov, R., and Brettel, K. (2003). Temperature dependence of biphasic forward electron transfer from the phylloquinone(s) A1 in photosystem I: only the slower phase is activated. Biochim. Biophys. Acta 1604, 7–12. [CrossRef]
- Santabarbara, S., Redding, K.E., Rappaport, F. (2009). Temperature dependence of the reduction of P700+ by tightly bound plastocyanin in vivo. Biochemistry 48, 10457–10466. [CrossRef]
- Marcus, R.A., and Sutin, N. (1985). Electron transfer in chemistry and biology. Biochim. Biophys. Acta 811, 265–322. [CrossRef]
- Devault, D. (1980). Quantum mechanical tunnelling in biological systems. Cambridge University Press.
- Moser, C.C., and Dutton, P.L. (1992). Engineering protein structure for electron transfer function in photosynthetic reaction centers. Biochim. Biophys. Acta 1101, 171–176. [CrossRef]
- Moser, C.C., and Dutton, P.L. (2006). “Application of Marcus Theory to Photosystem I Electron Transfer,” in Photosystem I: The Light–Driven Plastocyanin:Ferredoxin Oxidoreductase, ed. J.H. Golbeck (Dordrecht, Kluwer Academic Publishers), 583–594.
- Milanovsky, G.E., Petrova, A.A., Cherepanov, D.A, Semenov A.Yu. (2017) Kinetic modeling of electron transfer reactions in photosystem I complexes of various structures with substituted quinone acceptors. Photosynth. Res. 133, 185–199. [CrossRef]
- Munge, B., Das, S.K., Ilagan, R., Pendon, Z., Yang, J., Frank, H.A., Rusling, J.F. (2003) Electron transfer reactions of redox cofactors in spinach Photosystem I reaction centre proteins in lipid films on electrodes. J. Am. Chem. Soc. 125, 12457–12463. [CrossRef]
- Ke, B.; Dolan, E.; Sugahara, K.; Hawkridge, F.M.; Demeter, S.; Shaw, E. Electrochemical and kinetic evidence for a transient electron transfer acceptor in the photochemical charge separation in photosystem I. Plant Cell Physiol. 1977, 3–7, 187–199. [Google Scholar]
- Chamorowsky, S.K.; Cammack, R. Direct determination of the midpoint potential of the acceptor X in chloroplast Photosystem I by electrochemical reduction and electron spin resonance. Photochem. Photobiophys. 1982, 4, 195–200. [Google Scholar]
- Parrett, K.G., Mehari, T., Warren, P.G., Golbeck, J.H. (1989) Purification and properties of the intact P700- and Fx-containing Photosystem I core protein. Biochim. Biophys. Acta 973, 324–332. [CrossRef]
- Ptushenko, V.V., Cherepanov, D.A., Krishtalik, L.I., Semenov, A.Y. (2008). Semi-continuum electrostatic calculations of redox potentials in photosystem I. Photosynth. Res. 97, 55–74. [CrossRef]
- Ishikita, H.; Knapp, E.W. Redox potential of quinones in both electron transfer branches of photosystem I. J Biol Chem 2003, 278, 52002–52011. [Google Scholar] [CrossRef] [PubMed]
- Karyagina, I.; Pushkar, Y.; Stehlik, D.; van der Est, A.; Ishikita, H.; Knapp, E.W.; Jagannathan, B.; Agalarov, R.; Golbeck, J.H. Contributions of the protein environment to the midpoint potentials of the A1 phylloquinones and the Fx iron-sulfur cluster in photosystem I. Biochemistry 2007, 46, 10804–10816. [Google Scholar] [CrossRef] [PubMed]
- Kawashima, K.; Ishikita, H. Structural Factors That Alter the Redox Potential of Quinones in Cyanobacterial and Plant Photosystem I. Biochemistry 2017, 56, 3019–3028. [Google Scholar] [CrossRef] [PubMed]
- Santabarbara, S., Zucchelli, G. (2016) Comparative kinetic and energetic modelling of phyllosemiquinone oxidation in Photosystem I. Phys. Chem. Chem. Phys. 18, 9687–9701. [CrossRef]
- Santabarbara, S. Casazza, A.P. (2019) Kinetics and Energetics of Phylloquinone Reduction in Photosystem I: Insight From Modeling of the Site Directed Mutants. Front. Plant Sci. 10, 852. [CrossRef]
- Ke, B., Hansen, R.E., Beinert, H. (1973) Oxidation-reduction potentials of bound iron-sulfur proteins of photosystem I. Proc. Natl. Acad. Sci. U.S.A. 70, 2941–2945. [CrossRef]
- Evans, M.C.W., Reeves, S.G, Cammack, R. (1974) Determination of the oxidation-reduction potential of the bound iron–sulphur proteins of the primary electron acceptor complex of Photosystem I in spinach chloroplasts. FEBS Lett. 49, 111–114. [CrossRef]
- Evans, M.C.W., and Heathcote, P. (1980) Effects of glycerol on the redox properties of the electron acceptor complex in spinach photosystem I particles. Biochim Biophys Acta 590: 89–96. [CrossRef]
- Nugent, J.H., Moller, B.L., Evans, M.C.W. (1981) Comparison of the EPR properties of Photosystem I iron–sulphur centres A and B in spinach and barley. Biochim. Biophys. Acta 634, 249–255. [CrossRef]
- Hiyama, T.; Ke, B. A further study of P430: a possible primary electron acceptor of photosystem I. Arch. Biochem. Biophys. 1971, 147, 99–108. [Google Scholar] [CrossRef] [PubMed]
- Lüneberg, J.; Fromme, P.; Jekow, P.; Schlodder, E. Spectroscopic characterization of PS I core complexes from thermophilic Synechococcus sp. Identical reoxidation kinetics of A1− before and after removal of the iron–sulfur-clusters FA and FB. FEBS Lett. 1994, 338, 197–202. [Google Scholar] [CrossRef] [PubMed]
- Leibl, W.; Toupance, B.; Breton, J. Photoelectric characterization of forward electron transfer to iron–sulfur centers in photosystem I. Biochemistry 1995, 34, 10237–10244. [Google Scholar] [CrossRef]
- Diaz-Quintana, A.; Leibl, W.; Bottin, H.; Setif, P. Electron transfer in photosystem I reaction centers follows a linear pathway in which iron-sulfur cluster FB is the immediate electron donor to soluble ferredoxin. Biochemistry 1998, 37, 3429–3439. [Google Scholar] [CrossRef] [PubMed]
- Mamedov, M.D.; Gourovskaya, K.N.; Vassiliev, I.R.; Golbeck, J.H.; Semenov, A.Y. Electrogenicity accompanies photoreduction of the iron-sulfur clusters FA and FB in photosystem I. FEBS Lett. 1998, 431, 219–223. [Google Scholar]
- Mamedova, A.A.; Mamedov, M.D.; Gourovskaya, K.N.; Vassiliev, I.R.; Golbeck, J.H.; Semenov, A.Y. Electrometrical study of electron transfer from the terminal FA/FB iron-sulfur clusters to external acceptors in photosystem I. FEBS Lett. 1999, 462, 421–424. [Google Scholar] [CrossRef]
- Semenov, A.Y.; Mamedov, M.D.; Chamorovsky, S.K. Photoelectric studies of the transmembrane charge transfer reactions in photosystem I pigment-protein complexes. FEBS Lett. 2003, 553, 223–228. [Google Scholar] [CrossRef] [PubMed]
- Semenov, A. Y, Mamedov, M.D., Chamorovsky, S.K. (2006) “Electrogenic Reactions Associated with Electron Transfer in Photosystem I,” in Photosystem I: The Light–Driven Plastocyanin:Ferredoxin Oxidoreductase, ed. J.H. Golbeck (Dordrecht, Kluwer Academic Publishers), 319–338. [CrossRef]
- Santabarbara, S., Jasaitis, A., Byrdin, M., Gu, F., Rappaport, F., Redding, K.E. (2008) Additive effect of mutations affecting the rate of phylloquinone reoxidation and directionality of electron transfer within photosystem I. Photochem. Photobiol. 84, 1381–1387. [CrossRef]
- Santabarbara, S., Bullock, B., Rappaport, F., Redding, K.E. (2015). Controlling electron transfer between the two cofactor chains of photosystem I by the redox state of one of their components. Biophys. J. 108, 1537–1547. [CrossRef]
- Setif, P. (2001) Ferredoxin and flavodoxin reduction by photosystem I. Biochim. Biophys. Acta 1507, 161–179. [Google Scholar] [CrossRef]
- Hopfield, J.J. (1974). Electron transfer between biological molecules by thermally activated tunnelling. Proc. Natl. Acad. Sci. U.S.A. 71, 3640–3644. [CrossRef]
- Mula, S., McConnell, M.D., Ching, A., Zhao, N., Gordon, H.L., Hastings, G., et al. (2012) Introduction of a hydrogen bond between phylloquinone PhQA and a threonine side-chain OH group in photosystem I. J. Phys. Chem. B 116, 14008–14016. [CrossRef]
- Santabarbara, S., Reifschneider, K., Jasaitis, A., Gu, F., Agostini, G., Carbonera, D., et al. (2010) Interquinone electron transfer in photosystem I as evidenced by altering the hydrogen bond strength to the phylloquinone(s). J. Phys. Chem. B 114, 9300–9312. [CrossRef]
- Shinkarev, V.P.; Zybailov, B.; Vassiliev, I.R.; Golbeck, J.H. Modeling of the P700+ Charge Recombination Kinetics with Phylloquinone and Plastoquinone-9 in the A1 Site of Photosystem I. Biophys. J. 2002, 83, 2885–2897. [Google Scholar] [CrossRef]
- Makita, H., Hastings, G. (2017) Inverted-region electron transfer as a mechanism for enhancing photosynthetic solar energy conversion efficiency. Proc. Natl. Acad. Sci. U.S.A. 114, 9267–9272. [CrossRef]
- Kurashov, V.; Gorka, M.; Milanovsky, G.E.; Johnson, T.W.; Cherepanov, D.A.; Semenov, A.Y.; Golbeck, J.H. Critical evaluation of electron transfer kinetics in P700–FA/FB, P700–FX, and P700–A1 Photosystem I core complexes in liquid and in trehalose glass. Biochim. Biophys. Acta 2018, 1859, 1288–1301. [Google Scholar] [CrossRef] [PubMed]
- Milanovsky, G.; Gopta, O.; Petrova, A.A.; Mamedov, M.D.; Gorka, M.; Cherepanov, D.A.; Golbeck, J.H.; Semenov, A.Y. Multiple pathways of charge recombination revealed by the temperature dependence of electron transfer kinetics in cyanobacterial photosystem I. Biochim. Biophys. Acta 2019, 1860, 601–610. [Google Scholar] [CrossRef] [PubMed]
- Cherepanov, D.A., Milanovsky, G.E., Gopta, O.A., Balasubramanian, R., Bryant, D.A., Semenov, A.Yu., Golbeck, J.H. (2018) Electron-Phonon Coupling in Cyanobacterial Photosystem I. J. Phys. Chem. B. 122, 7943–7955. [CrossRef]
- Zhao, J., Li N., Warren, P.V., Golbeck, J.H., Bryant, D.A. (1992) Site-directed conversion of a cysteine to aspartate leads to the assembly of a [3Fe-4S] cluster in PsaC of photosystem I. The photoreduction of FA is independent of FB. Biochemistry 31, 5093-5099. [CrossRef]
- Rodday, S.M., Jun, S.S., Biggins, J. (1993) Interaction of the FAFB-containing subunit with the Photosystem 1 core heterodimer. Photosynth. Res. 36, 1-9. [CrossRef]
- Yu, L., Zhao, .J, Lu, W., Bryant, D.A., Golbeck, J.H. (1993) Characterization of the [3Fe-4S] and [4Fe-4S] clusters in unbound PsaC mutants C14D and C51D. Midpoint potentials of the single [4Fe-4S] clusters are identical to FA and FB in bound PsaC of photosystem I. Biochemistry 32, 8251-8258. [CrossRef]
- Yu, L., Bryant, D.A., Golbeck, J.H. (1995) Evidence for a mixed-ligand [4Fe-4S] cluster in the C14D mutant of PsaC. Altered reduction potentials and EPR spectral properties of the FA and FB clusters on rebinding to the P700-FX core. Biochemistry 34, 7861-7868. [CrossRef]
- Mehari, T. , Qiao, F., Scott, M.P., Nellis, D.F., Zhao, J., Bryant, D.A., Golbeck, J.H. (1995) Modified ligands to FA and FB in photosystem I. I. Structural constraints for the formation of iron-sulfur clusters in free and rebound PsaC. J. Biol. Chem. 270, 28108-28117. [CrossRef]
- Rodday, S.M., Do, L.T., Chynwat, V., Frank, H.A., Biggins, J. (1996) Site-directed mutagenesis of the subunit PsaC establishes a surface-exposed domain interacting with the photosystem I core binding site. Biochemistry 35, 11832-11838. [CrossRef]
- Jung, Y..S, Vassiliev, I.R., Qiao, F., Yang, F., Bryant, D.A., Golbeck, J.H. (1996) Modified ligands to FA and FB in photosystem I. Proposed chemical rescue of a [4Fe-4S] cluster with an external thiolate in alanine, glycine, and serine mutants of PsaC. J. Biol. Chem. 271, 31135-31144. [CrossRef]
- Yu, J., Vassiliev, I.R., Jung, Y.S., Golbeck, J.H., McIntosh, L. (1997) Strains of synechocystis sp. PCC 6803 with altered PsaC. I. Mutations incorporated in the cysteine ligands of the two [4Fe-4S] clusters FA and FB of photosystem I. J. Biol. Chem. 272, 8032-8039. [CrossRef]
- Jung, Y.S., Vassiliev, I.R., Yu, J., McIntosh, L., Golbeck, J.H. (1997) Strains of Synechocystis sp. PCC 6803 with altered PsaC. II. EPR and optical spectroscopic properties of FA and FB in aspartate, serine, and alanine replacements of cysteines 14 and 51. J. Biol. Chem. 272, 8040-8049. [CrossRef]
- Fischer, N.; Setif, P.; Rochaix, J.-D. Targeted Mutations in the psaC Gene of Chlamydomonas reinhardtii: Preferential reduction of FB at low temperature is not accompanied by altered electron flow from Photosystem I to Ferredoxin. Biochemistry 1997, 36, 93–102. [Google Scholar] [CrossRef]
- Fischer, N.; Setif, P.; Rochaix, J.-D. Site-directed Mutagenesis of the PsaC Subunit of Photosystem I. FB is the cluster interacting with soluble ferredoxin. J. Biol. Chem. 1999, 33, 23333–23340. [Google Scholar] [CrossRef]
- Pérez, A.A., Ferlez, B.H., Applegate, A.M., Walters, K., He, Z., Shen, G., Golbeck, J.H., Bryant, D.A. (2018) Presence of a [3Fe-4S] cluster in a PsaC variant as a functional component of the photosystem I electron transfer chain in Synechococcus sp. PCC 7002.. Photosynth Res. 136, 31–48. [CrossRef]
- Webber, A.N.; Gibbs, P.B.; Ward, J.B.; Bingham, S.E. Site-directed mutagenesis of the photosystem I reaction center in chloroplasts. The proline-cysteine motif. J. Biol. Chem. 1993, 268, 12990–12995. [Google Scholar] [CrossRef] [PubMed]
- Smart, L.B., Warren, P.V., Golbeck, J.H., McIntosh, L. (1993) Mutational analysis of the structure and biogenesis of the photosystem I reaction center in the cyanobacterium Synechocystis sp. PCC 6803. Proc. Natl. Acad. Sci. U.S.A. 90, 1132–1136. [CrossRef]
- Warren, P.V., Smart, L.B., McIntosh, L., Golbeck, J.H. (1993) Site-directed conversion of cysteine-565 to serine in PsaB of photosystem I results in the assembly of [3Fe-4S] and [4Fe-4S] clusters in Fx. A mixed-ligand [4Fe-4S] cluster is capable of electron transfer to FA and FB. Biochemistry 32, 4411–4419. [CrossRef]
- Rodday, S.M., Schulz, R., McLntosh, L., Biggins, J. (1994) Structure-function studies on the interaction of PsaC with the Photosystem 1 heterodimer : The site directed change R561E in PsaB destabilizes the subunit interaction in Synechocystis sp. PCC 6803. Photosynth. Res. 42, 185–190. [CrossRef]
- Rodday, S.M., Webber, A.N., Bingham, S.E., Biggins, J. (1995) Evidence that the FX domain in photosystem I interacts with the subunit PsaC: site-directed changes in PsaB destabilize the subunit interaction in Chlamydomonas reinhardtii. Biochemistry 34, 6328–6334. [CrossRef]
- Hallahan, B.J., Purton, S., Ivison, A., Wright, D., Evans, M.C.W. (1995) Analysis of the proposed Fe-SX binding region of Photosystem 1 by site directed mutation of PsaA in Chlamydomonas reinhardtii. Photosynth Res. 46, 257–264. [CrossRef]
- Vassiliev, I.R.; Jung, Y.-S.; Smart, L.B.; Schulz, R.; McIntosh, L.; Golbeck, J.H. A Mixed-Ligand Iron-Sulfur Cluster (C556SPSaB or C565SPSaB) in the FX-Binding Site Leads to a Decreased Quantum Efficiency of Electron Transfer in Photosystem I. Biophys. J. 1995, 69, 1544–1553. [Google Scholar] [CrossRef]
- Evans, M.C.W.; Purton SPatel, V.; Wright, D.; Heathcote, P.; Rigby, S.E.J. Modification of electron transfer from the quinone electron carrier, A1, of Photosystem 1 in a site directed mutant D576->L within the Fe-Sx binding site of PsaA and in second site suppressors of the mutation in Chlamydomonas reinhardtii. Photosynth. Res. 1999, 61, 33–42. [Google Scholar] [CrossRef]
- Vassiliev, I.R.; Yu, J.; Jung, Y.-S.; Schulz, R.; Ganago, A.O.; McIntosh, L.; Golbeck, J.H. The Cysteine-proximal Aspartates in the FX-binding Niche of Photosystem I. J. Biol. Chem. 1999, 274, 9993–10001. [Google Scholar] [CrossRef]
- Zeng, M.-T.; Gong, X.-M.; Evans, M.C.W.; Nelson, N.; Carmeli, C. Stabilization of iron–sulfur cluster FX by intra-subunit interactions unraveled by suppressor and second site-directed mutations in PsaB of Photosystem I. Biochim. Biophys. Acta 2002, 1556, 254–264. [Google Scholar] [CrossRef]
- Gong, X-M., Agalarov, R., Brettel, K., Carmeli, C. (2003) Control of Electron Transport in Photosystem I by the Iron-Sulfur Cluster FX in Response to Intra- and Intersubunit Interactions. J. Biol. Chem. 278, 19141–19150. [CrossRef]
- Kümmerle, R.; Gaillard JKyritis, P.; Moulis, J.-M. Intramolecular electron transfer in [4Fe-4S] proteins: estimates of the reoganisation energy and electronic coupling in Chromatium vinosum ferredoxin J. Biol. Inorg. Chem. 2001, 6, 446–451. [Google Scholar] [CrossRef]
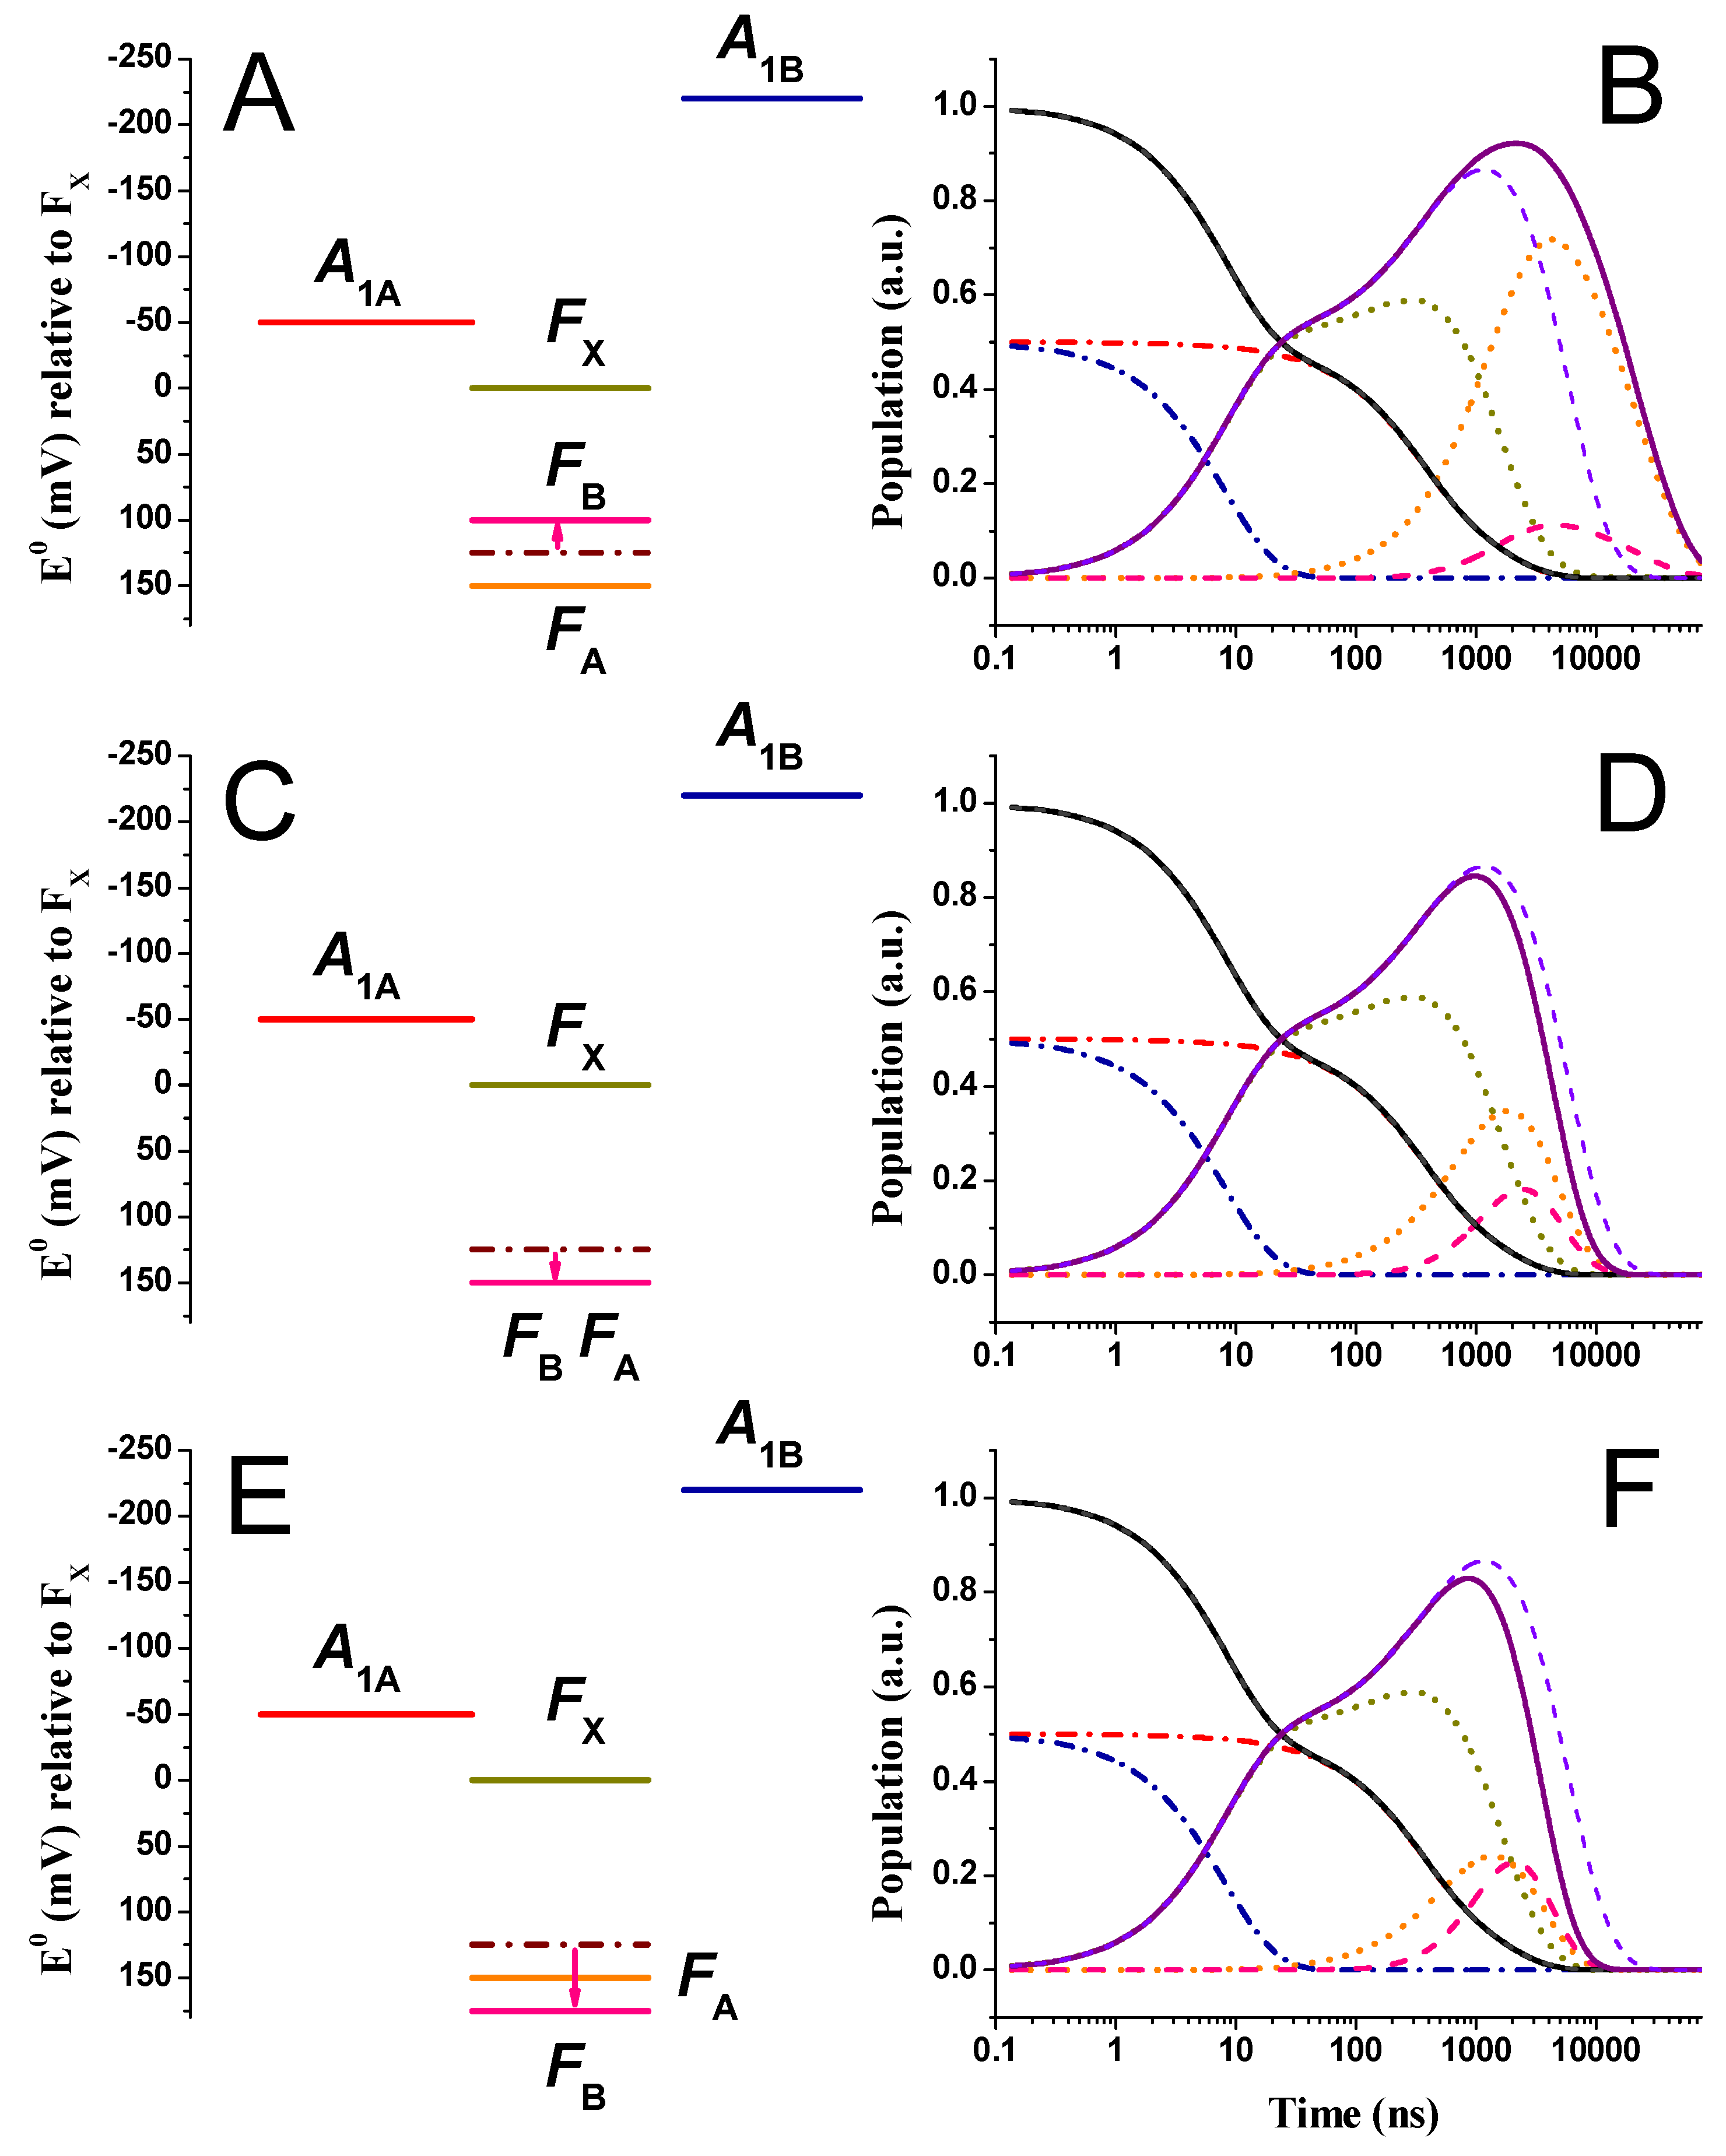
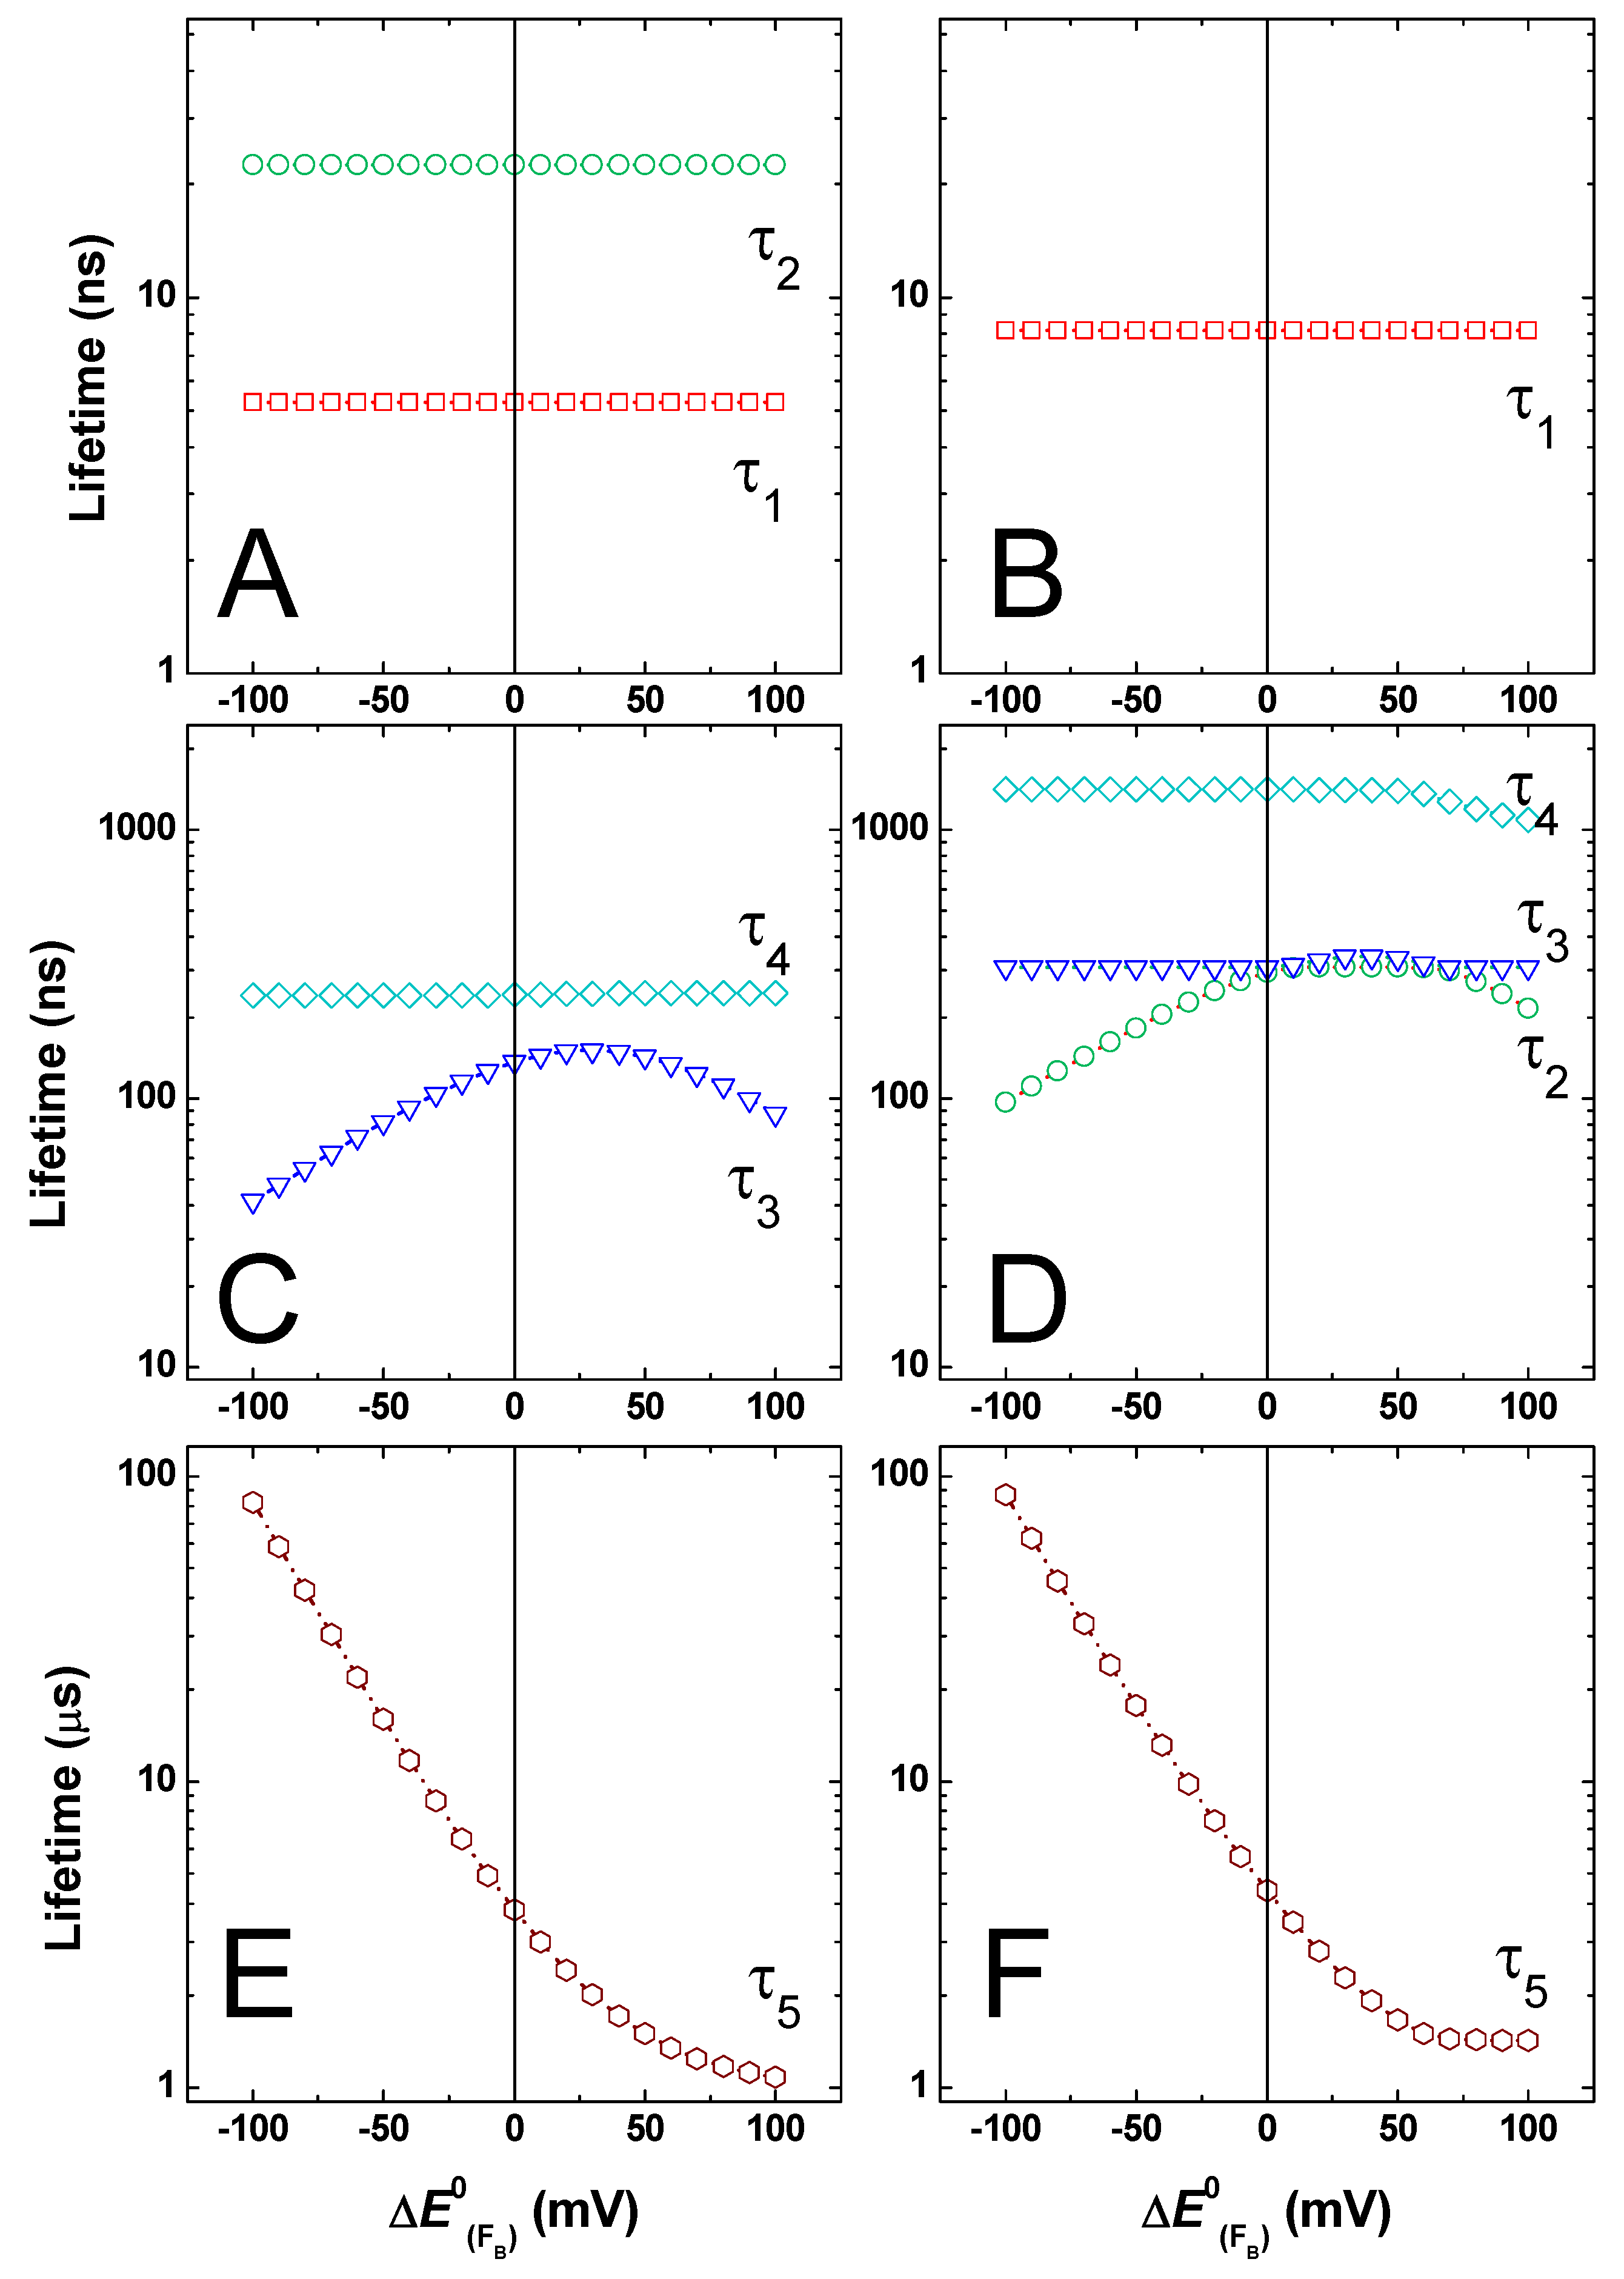
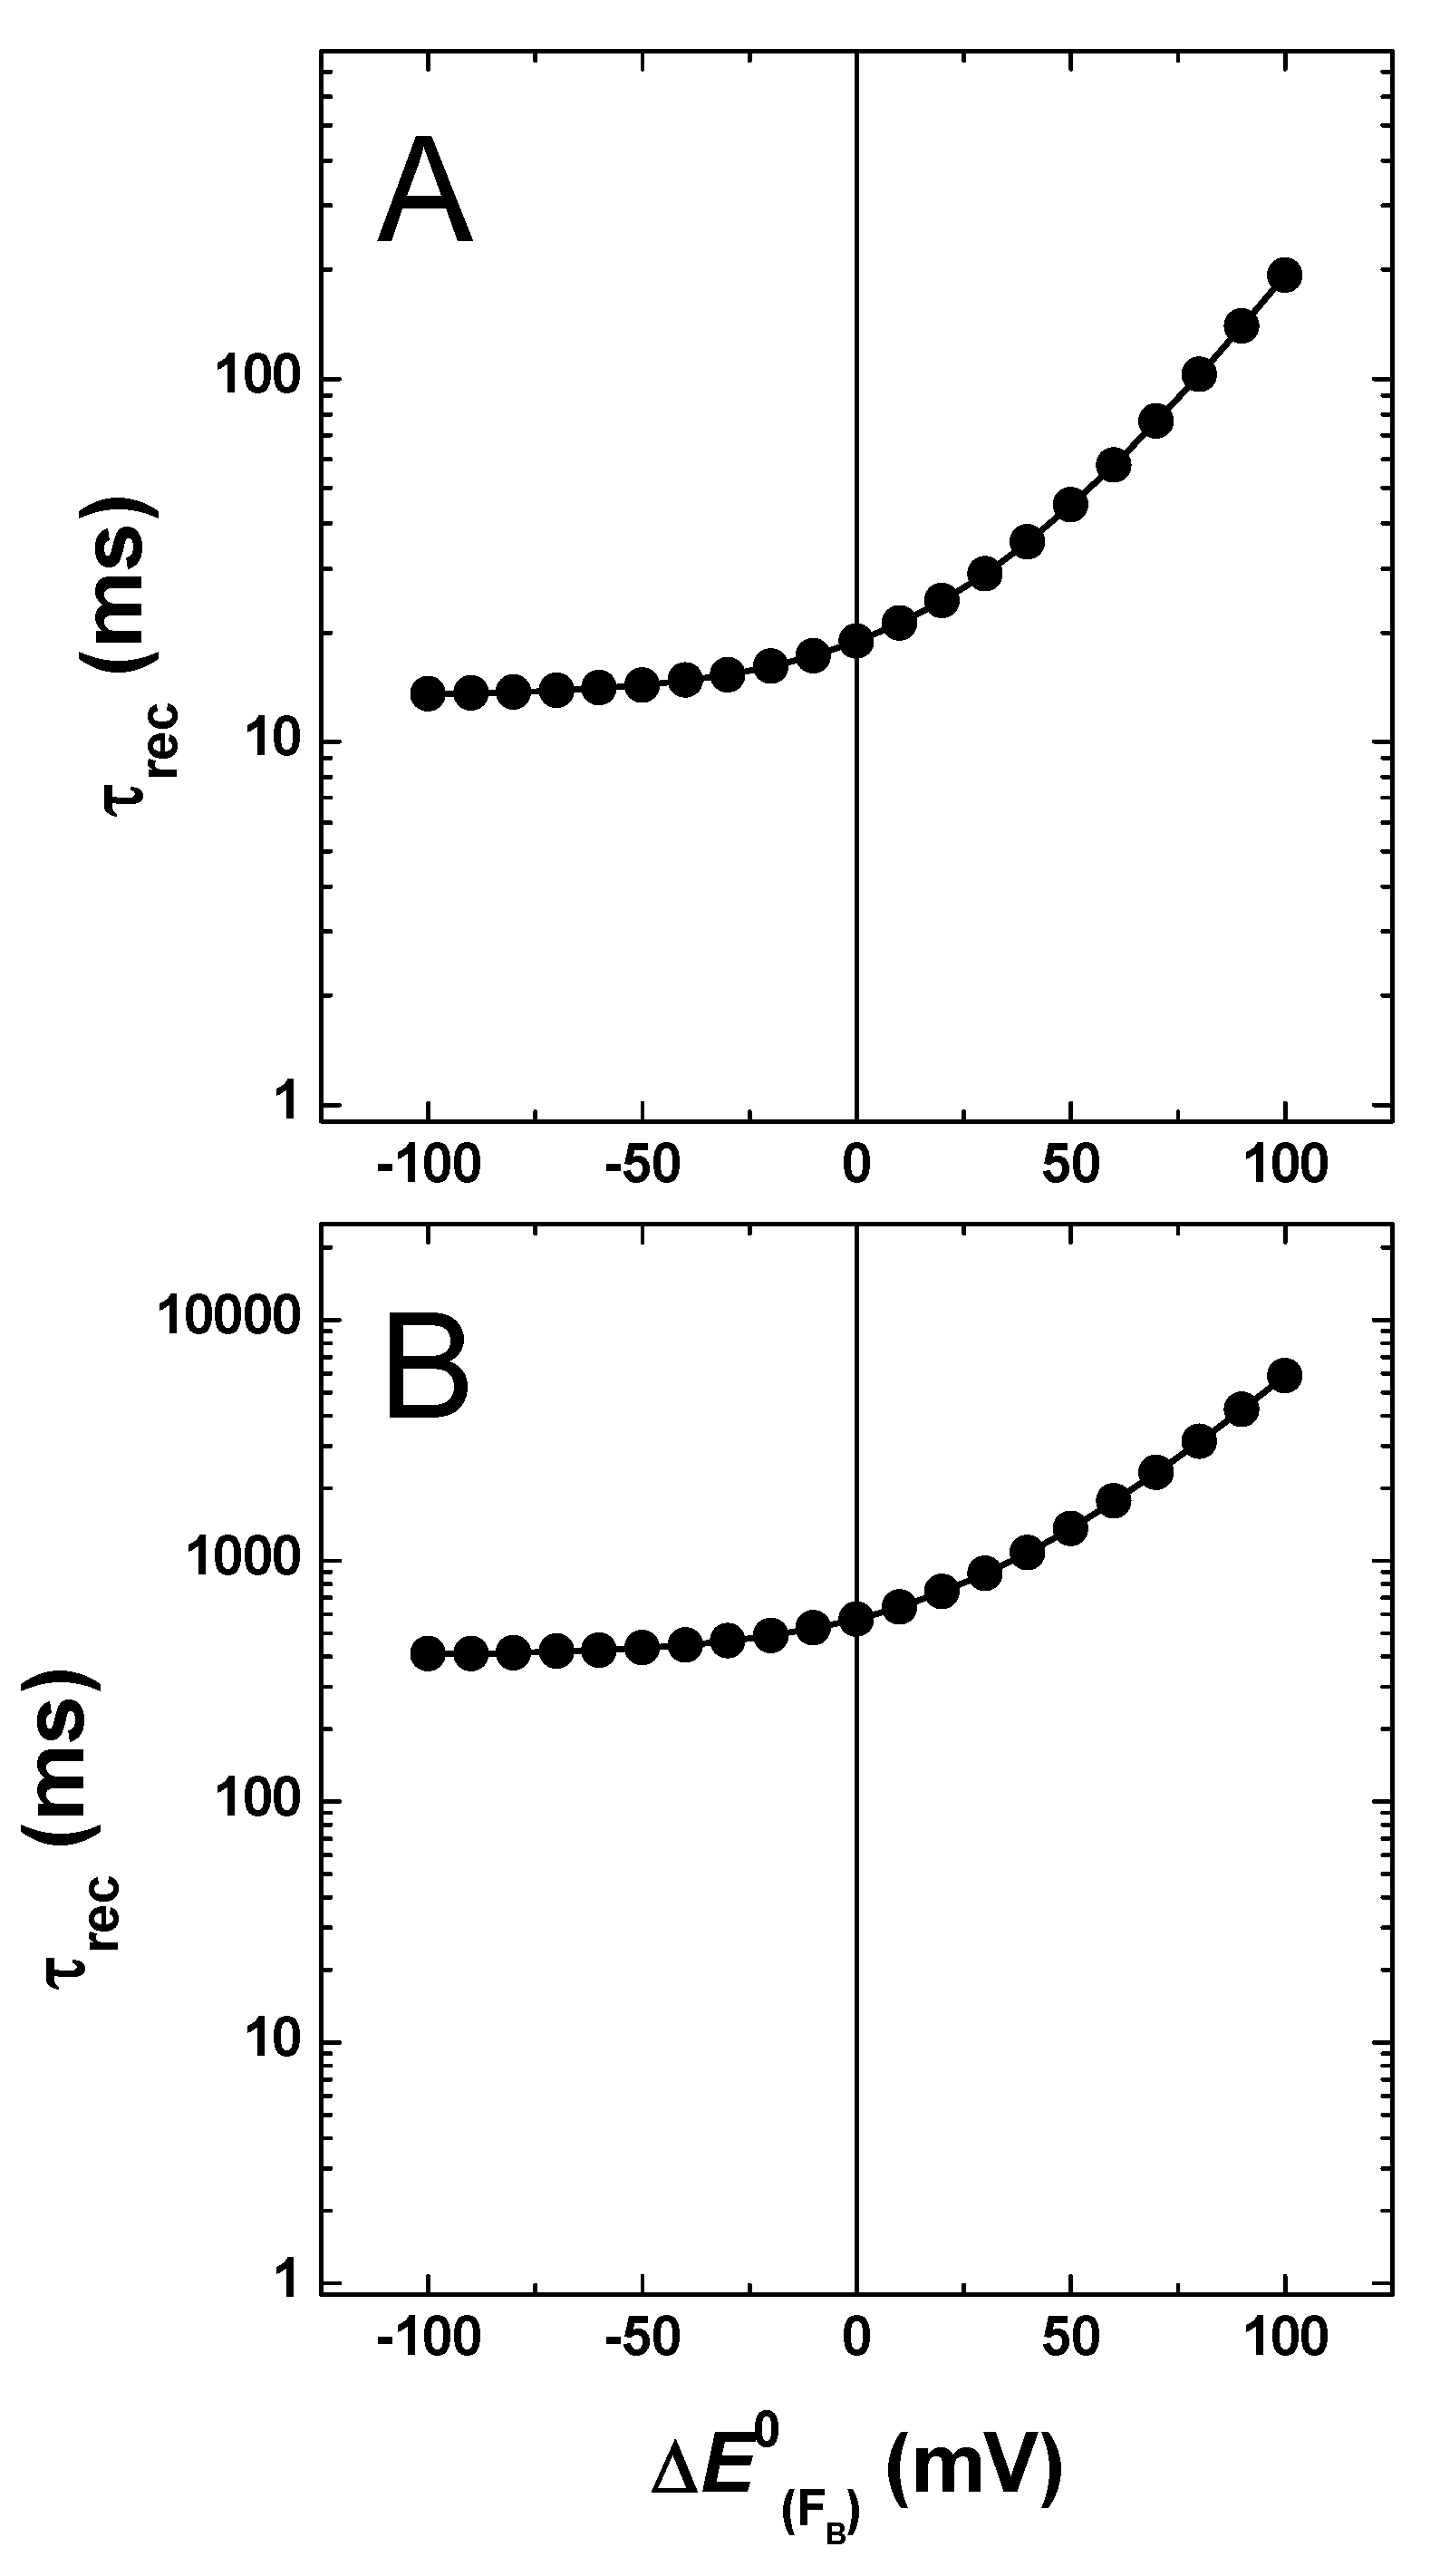
| Rate Determining Parameters | Electron Transfer Simulated Parameters | ||||||||||||
| Amplitudes | |||||||||||||
| Reaction |
(Å) |
(eV) |
(eV) |
(eV/cm-1) |
(ns-1) |
(ns) | |||||||
| 9.1 |
-0.05 | 1.0 | 0.022 (175) |
0.00270 | 8.15 | 0.002 | 0.500 | -0.504 | 0.0035 | 0.0000 | 0.501 | -0.501 | |
| 9.0 |
-0.22 | 1.0 | 0.046 (375) |
0.12249 | 294.7 | 0.0020 | 0.000 | -0.003 | 0.3891 | -0.550 | 0.002 | -0.164 | |
| 11.6 | -0.15 | 1.0 | 0.034 (275) |
0.00085 | 307.3 | 0.307 | 0.000 | -0.414 | -0.343 | 0.650 | 0.307 | -0.107 | |
| 9.5 | 0.025 | 1.0 | 0.034 (275) |
0.00077 | 1411 | 0.187 | 0.001 | 0.912 | -1.292 | -0.468 | 0.188 | -0.847 | |
| – | – | – | – | 0.00100 | 4415 | 0.002 | 0.000 | 0.001 | 1.242 | 0.367 | 0.002 | 1.619 | |
Disclaimer/Publisher’s Note: The statements, opinions and data contained in all publications are solely those of the individual author(s) and contributor(s) and not of MDPI and/or the editor(s). MDPI and/or the editor(s) disclaim responsibility for any injury to people or property resulting from any ideas, methods, instructions or products referred to in the content. |
© 2024 by the authors. Licensee MDPI, Basel, Switzerland. This article is an open access article distributed under the terms and conditions of the Creative Commons Attribution (CC BY) license (http://creativecommons.org/licenses/by/4.0/).


