In the numerical study, several scenarios are investigated. In these cases, different domain sizes and perforation parameters are analyzed. Specifically, three scenarios are considered: the first scenario is a 3 by 15 m domain with loadings exerted on the right boundary; the second scenario is a small near-perforation domain with 5 by 5 cm; the third scenario is 1 by 5 m where multiple perforations in a cluster are modeled.
3.1. Scenario 1
In the first case, a 3 by 15 m domain is used to denote the near-well and near-perforation reservoir. The domain length is 3 m in the x direction and 15 m in the y direction. In the base case, two perforations at (3 m, 5 m) and (3 m, 10 m) are prescribed on the right boundary. The loading on these two locations is 50 MPa/0.01 ms. The Young’s modulus of the reservoir rock is 30 GPa and the Poisson’s ratio is 0.2. Rock density is assumed as 2600 kg/m3. The cohesion is 8 MPa and the internal friction angle is 30°.
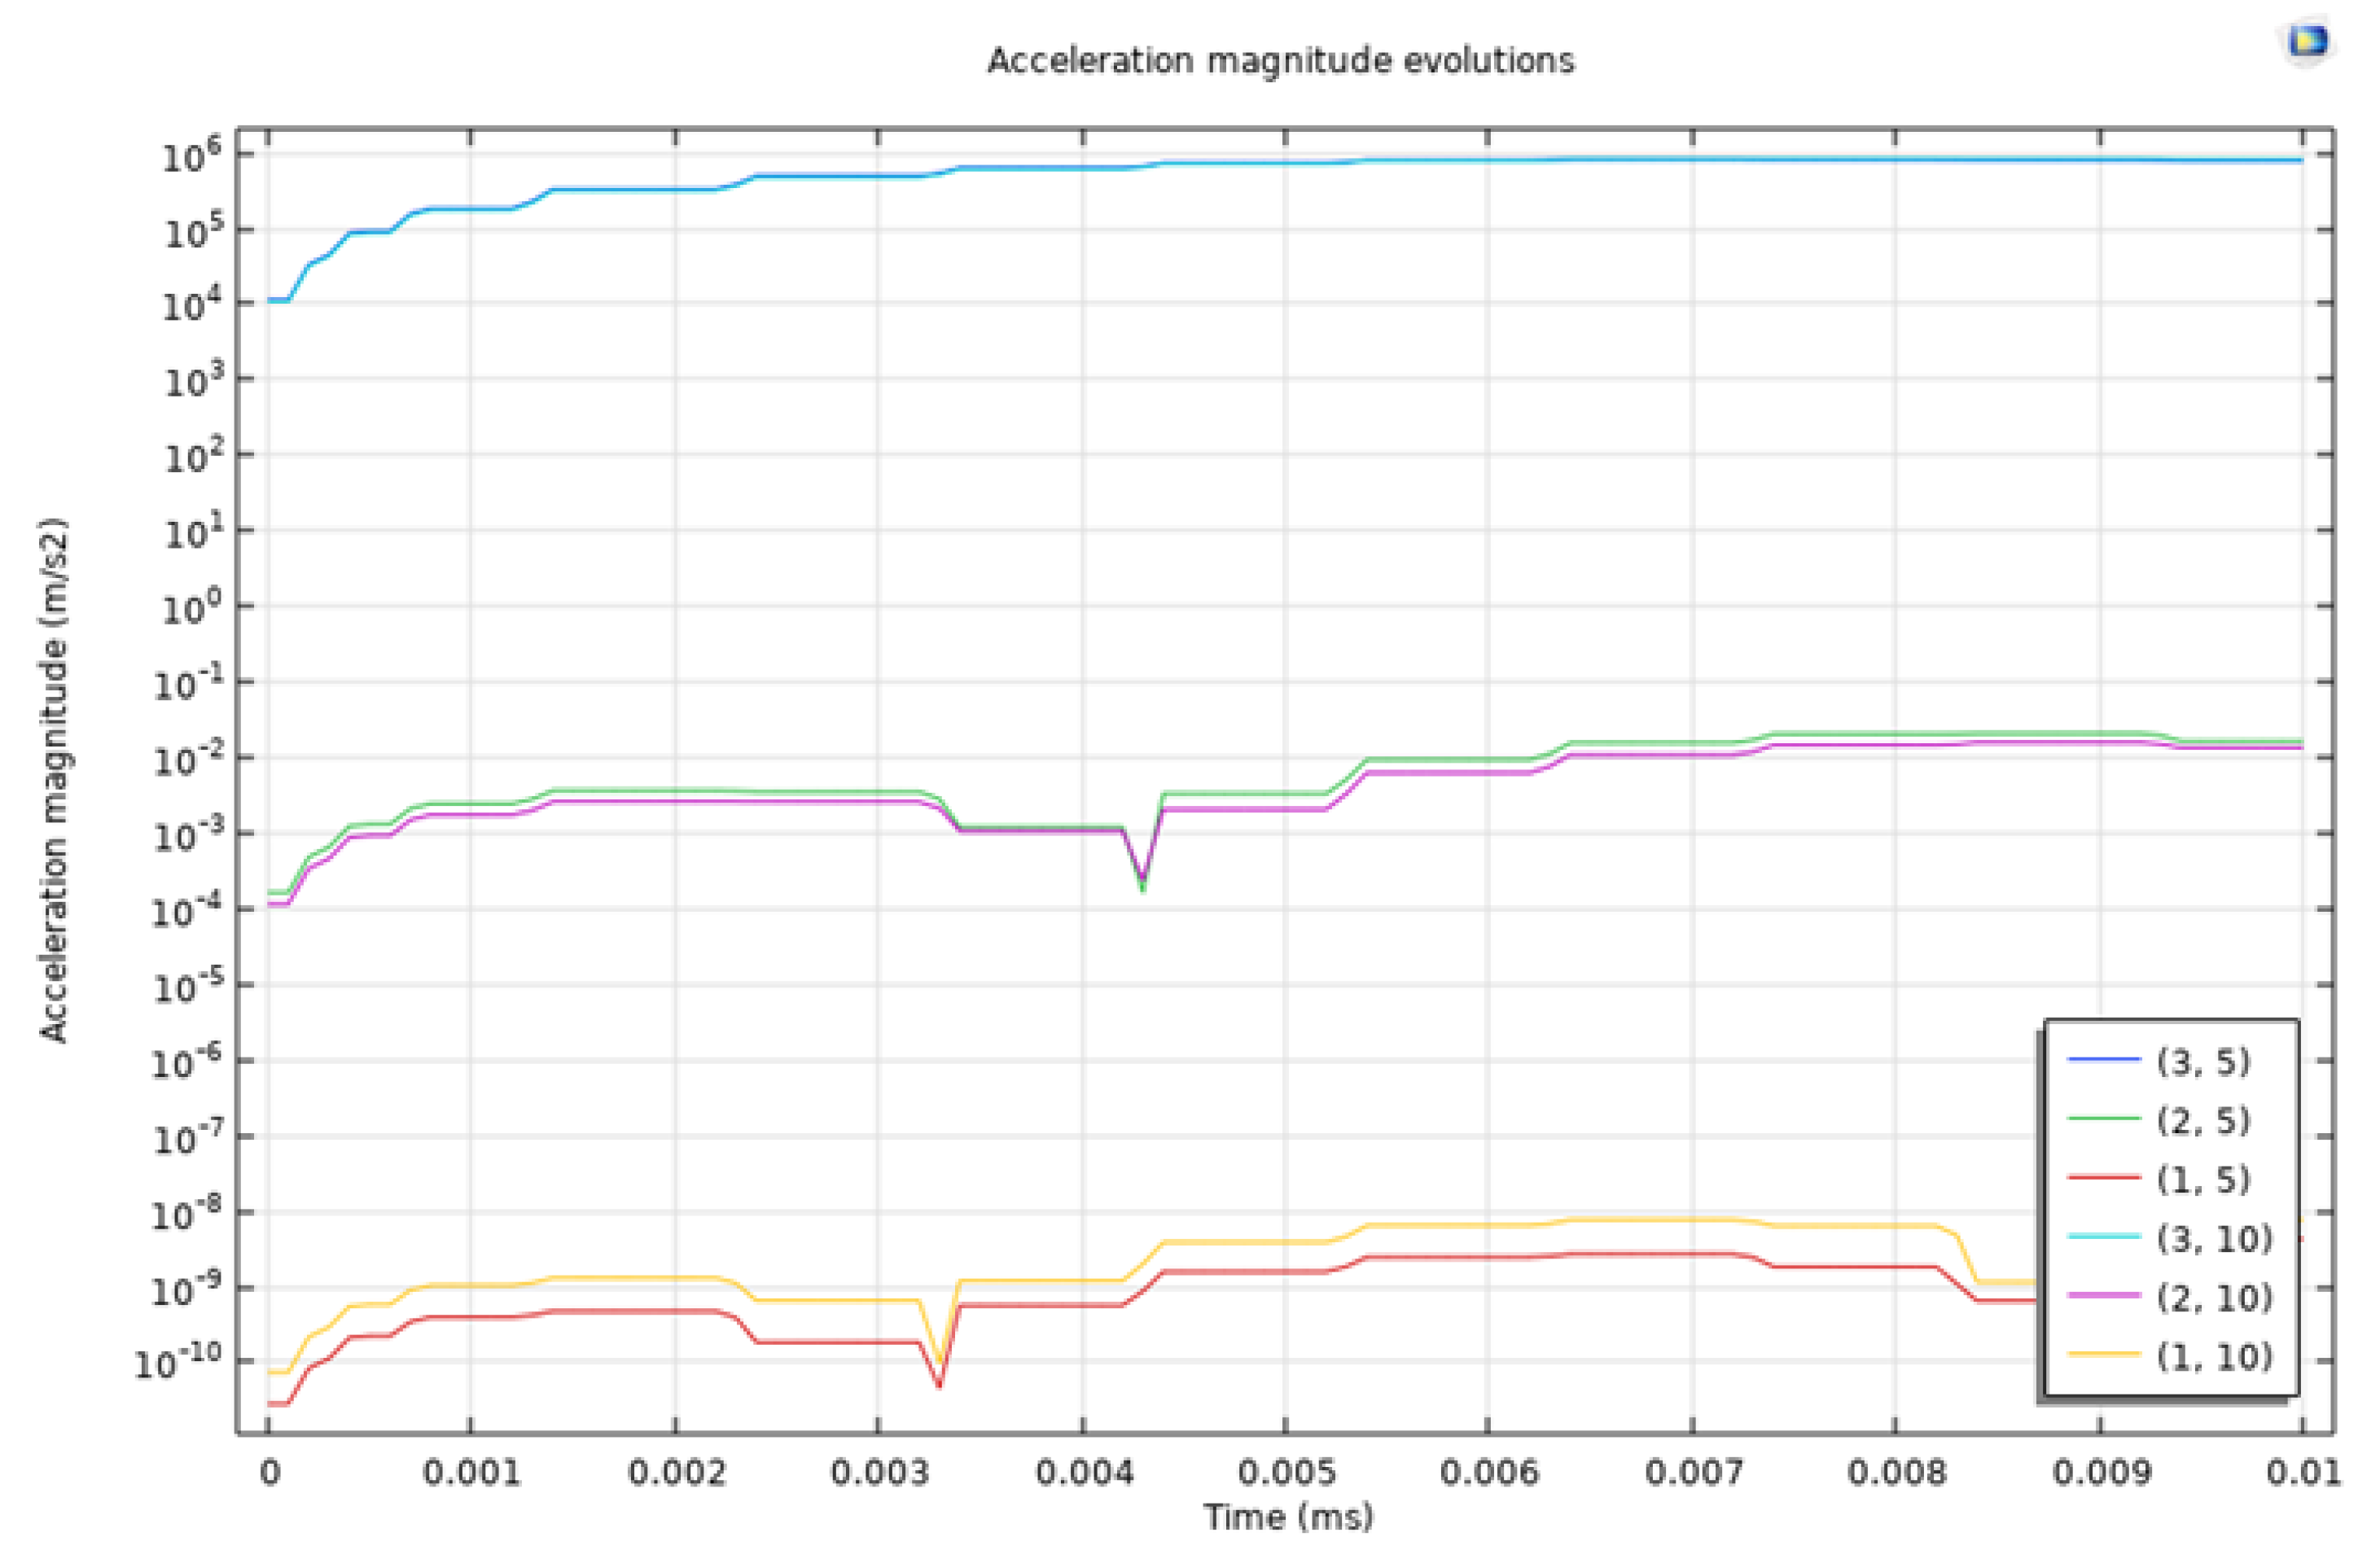
Figure 1 shows the temporal evolution of acceleration at six different monitoring points (1, 5), (2, 5), (3, 5), (1, 10), (2, 10), and (3, 10). Monitoring points (3, 5) and (3, 10) correspond to the two perforations exerting loadings. The graph illustrates the evolution of acceleration magnitudes over a duration of time 0 to 0.01 ms subjected to dynamic loading. The monitoring points (3, 5) and (3, 10) correspond to the highest acceleration magnitudes observed in these points. Specifically, the acceleration magnitude at point (3, 5) reaches values in the range of 106 m/s2, which indicates a significant impact due to the dynamic loading caused by fracturing operations. This high acceleration is attributed to the localized stress concentrations and rapid deformation near the perforation, which is driven by the sudden release of energy associated with the hydraulic fracturing process. In contrast, the other monitoring points (1, 5), (2, 5), and (1, 10) show relatively lower acceleration magnitudes, suggesting a more alleviated dynamic response. These points are positioned further away from the perforations. They experience less direct impact from the loadings, resulting in lower accelerations in the range of 10−10 m/s2 to 10−7 m/s2. The consistent acceleration curve patterns with small perturbations reflect the relatively consistent propagation of dynamic waves through the material. The observed curve dips at around 0.003 ms indicate interactions of stress waves within the reservoir rock medium, which can be attributed to the effect of domain boundaries.
Figure 1.
Acceleration of rock solid in the domain at monitoring points of (1, 5), (2, 5), (3, 5), (1, 10), (2, 10), and (3, 10).
Figure 1.
Acceleration of rock solid in the domain at monitoring points of (1, 5), (2, 5), (3, 5), (1, 10), (2, 10), and (3, 10).
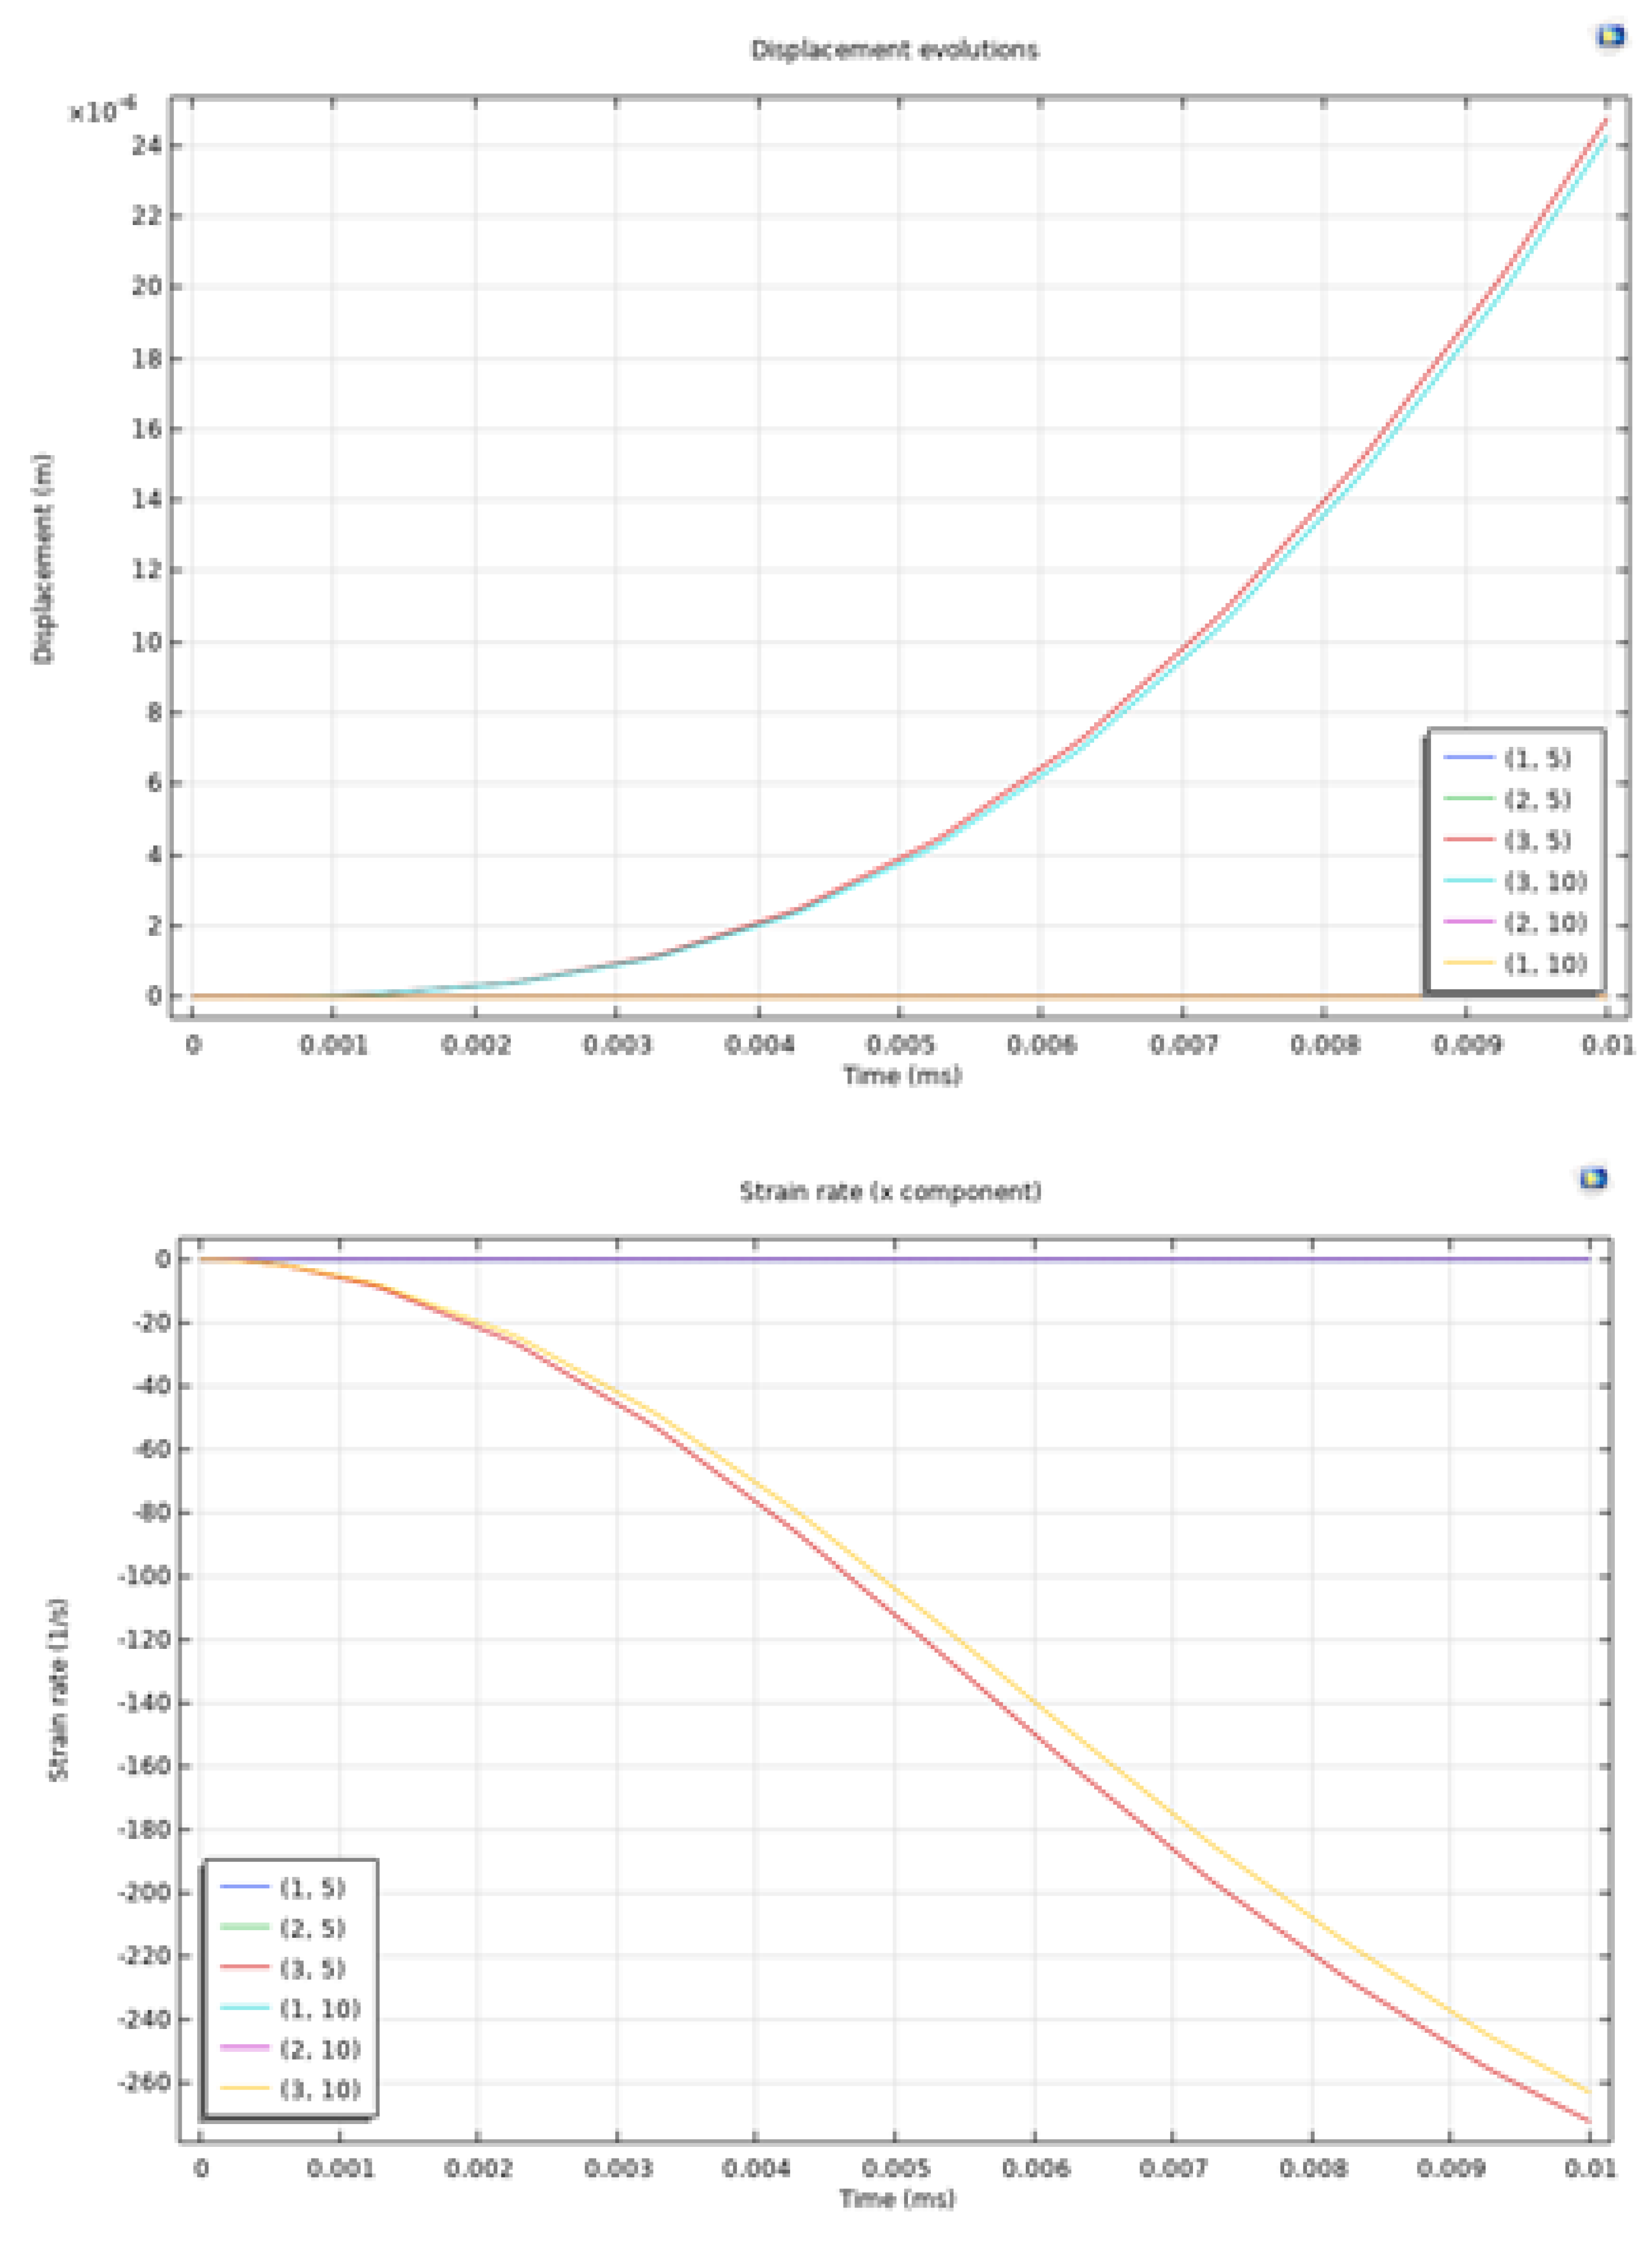
Figure 2 shows the displacement and strain rate in the x direction for these 6 monitoring points. The displacement evolution graph shows a clear trend of increasing displacement over time at various monitoring points, with the highest values observed for points (3, 5) and (3, 10), which are the locations of the perforations. The displacement magnitudes at these points exhibit an exponential growth pattern, reaching approximately 24×10−4 m at 0.01 ms. This rapid increase in displacement indicates significant deformation near the perforations due to the applied dynamic loadings, indicating the pronounced mechanical response in these regions. Other monitoring points (1, 5), (2, 5), and (1, 10) show similar exponential trends but with lower overall displacements, indicating that while the dynamic effects are existent throughout the medium, they are less intense further from the perforations. The strain rate evolution in the x direction is in accordance with the displacement observations. The graph indicates a decreasing strain rate trend over time, with the most significant changes at points (3, 5) and (3, 10). These points show strain rates decreasing from around -20 1/s to approximately -260 1/s in the same time period. This trend suggests a rapid rate of deformation at the beginning of dynamic loading exertion. The other monitoring points exhibit less rapid changes in strain rates, indicating their lower exposure to the dynamic loadings. All monitoring points experience similar strain rate evolution patterns, suggesting a uniform material response to the applied dynamic loadings. Also, perforation areas experience the most significant strain due to their proximity to the load application.
Figure 2.
Displacement and strain rate in the x direction of rock solid in the domain at monitoring points of (1, 5), (2, 5), (3, 5), (1, 10), (2, 10), and (3, 10).
Figure 2.
Displacement and strain rate in the x direction of rock solid in the domain at monitoring points of (1, 5), (2, 5), (3, 5), (1, 10), (2, 10), and (3, 10).
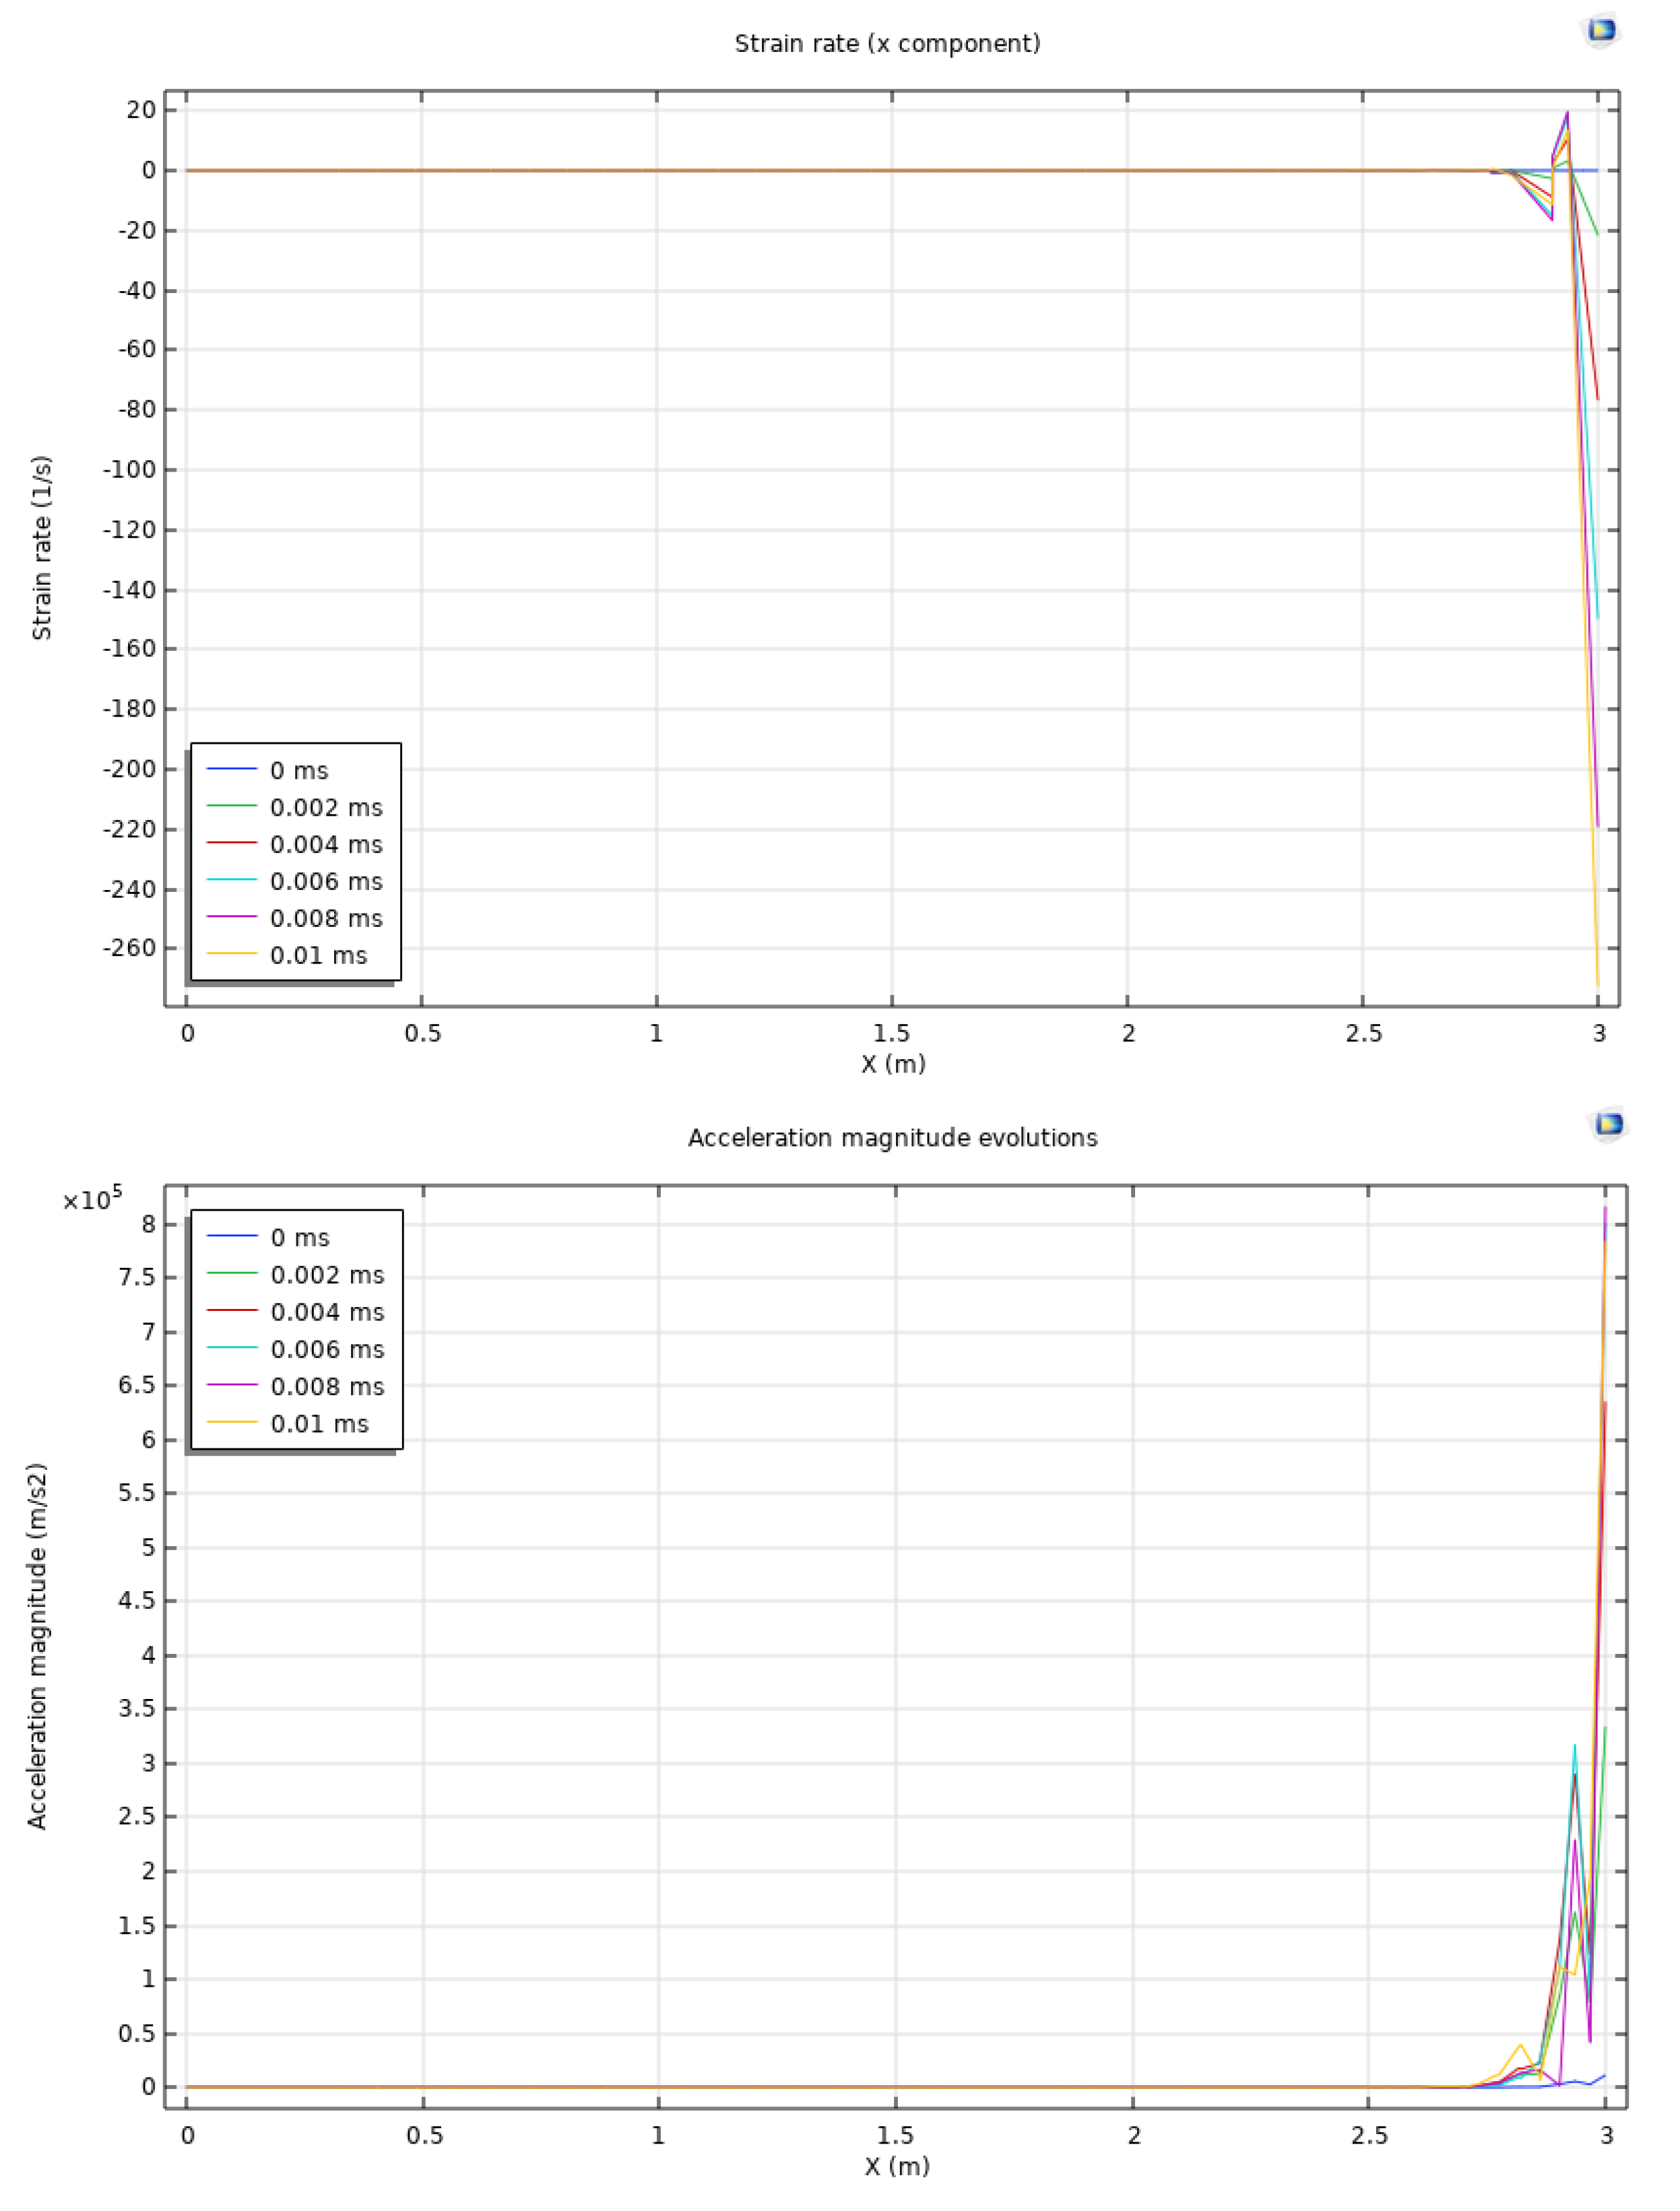
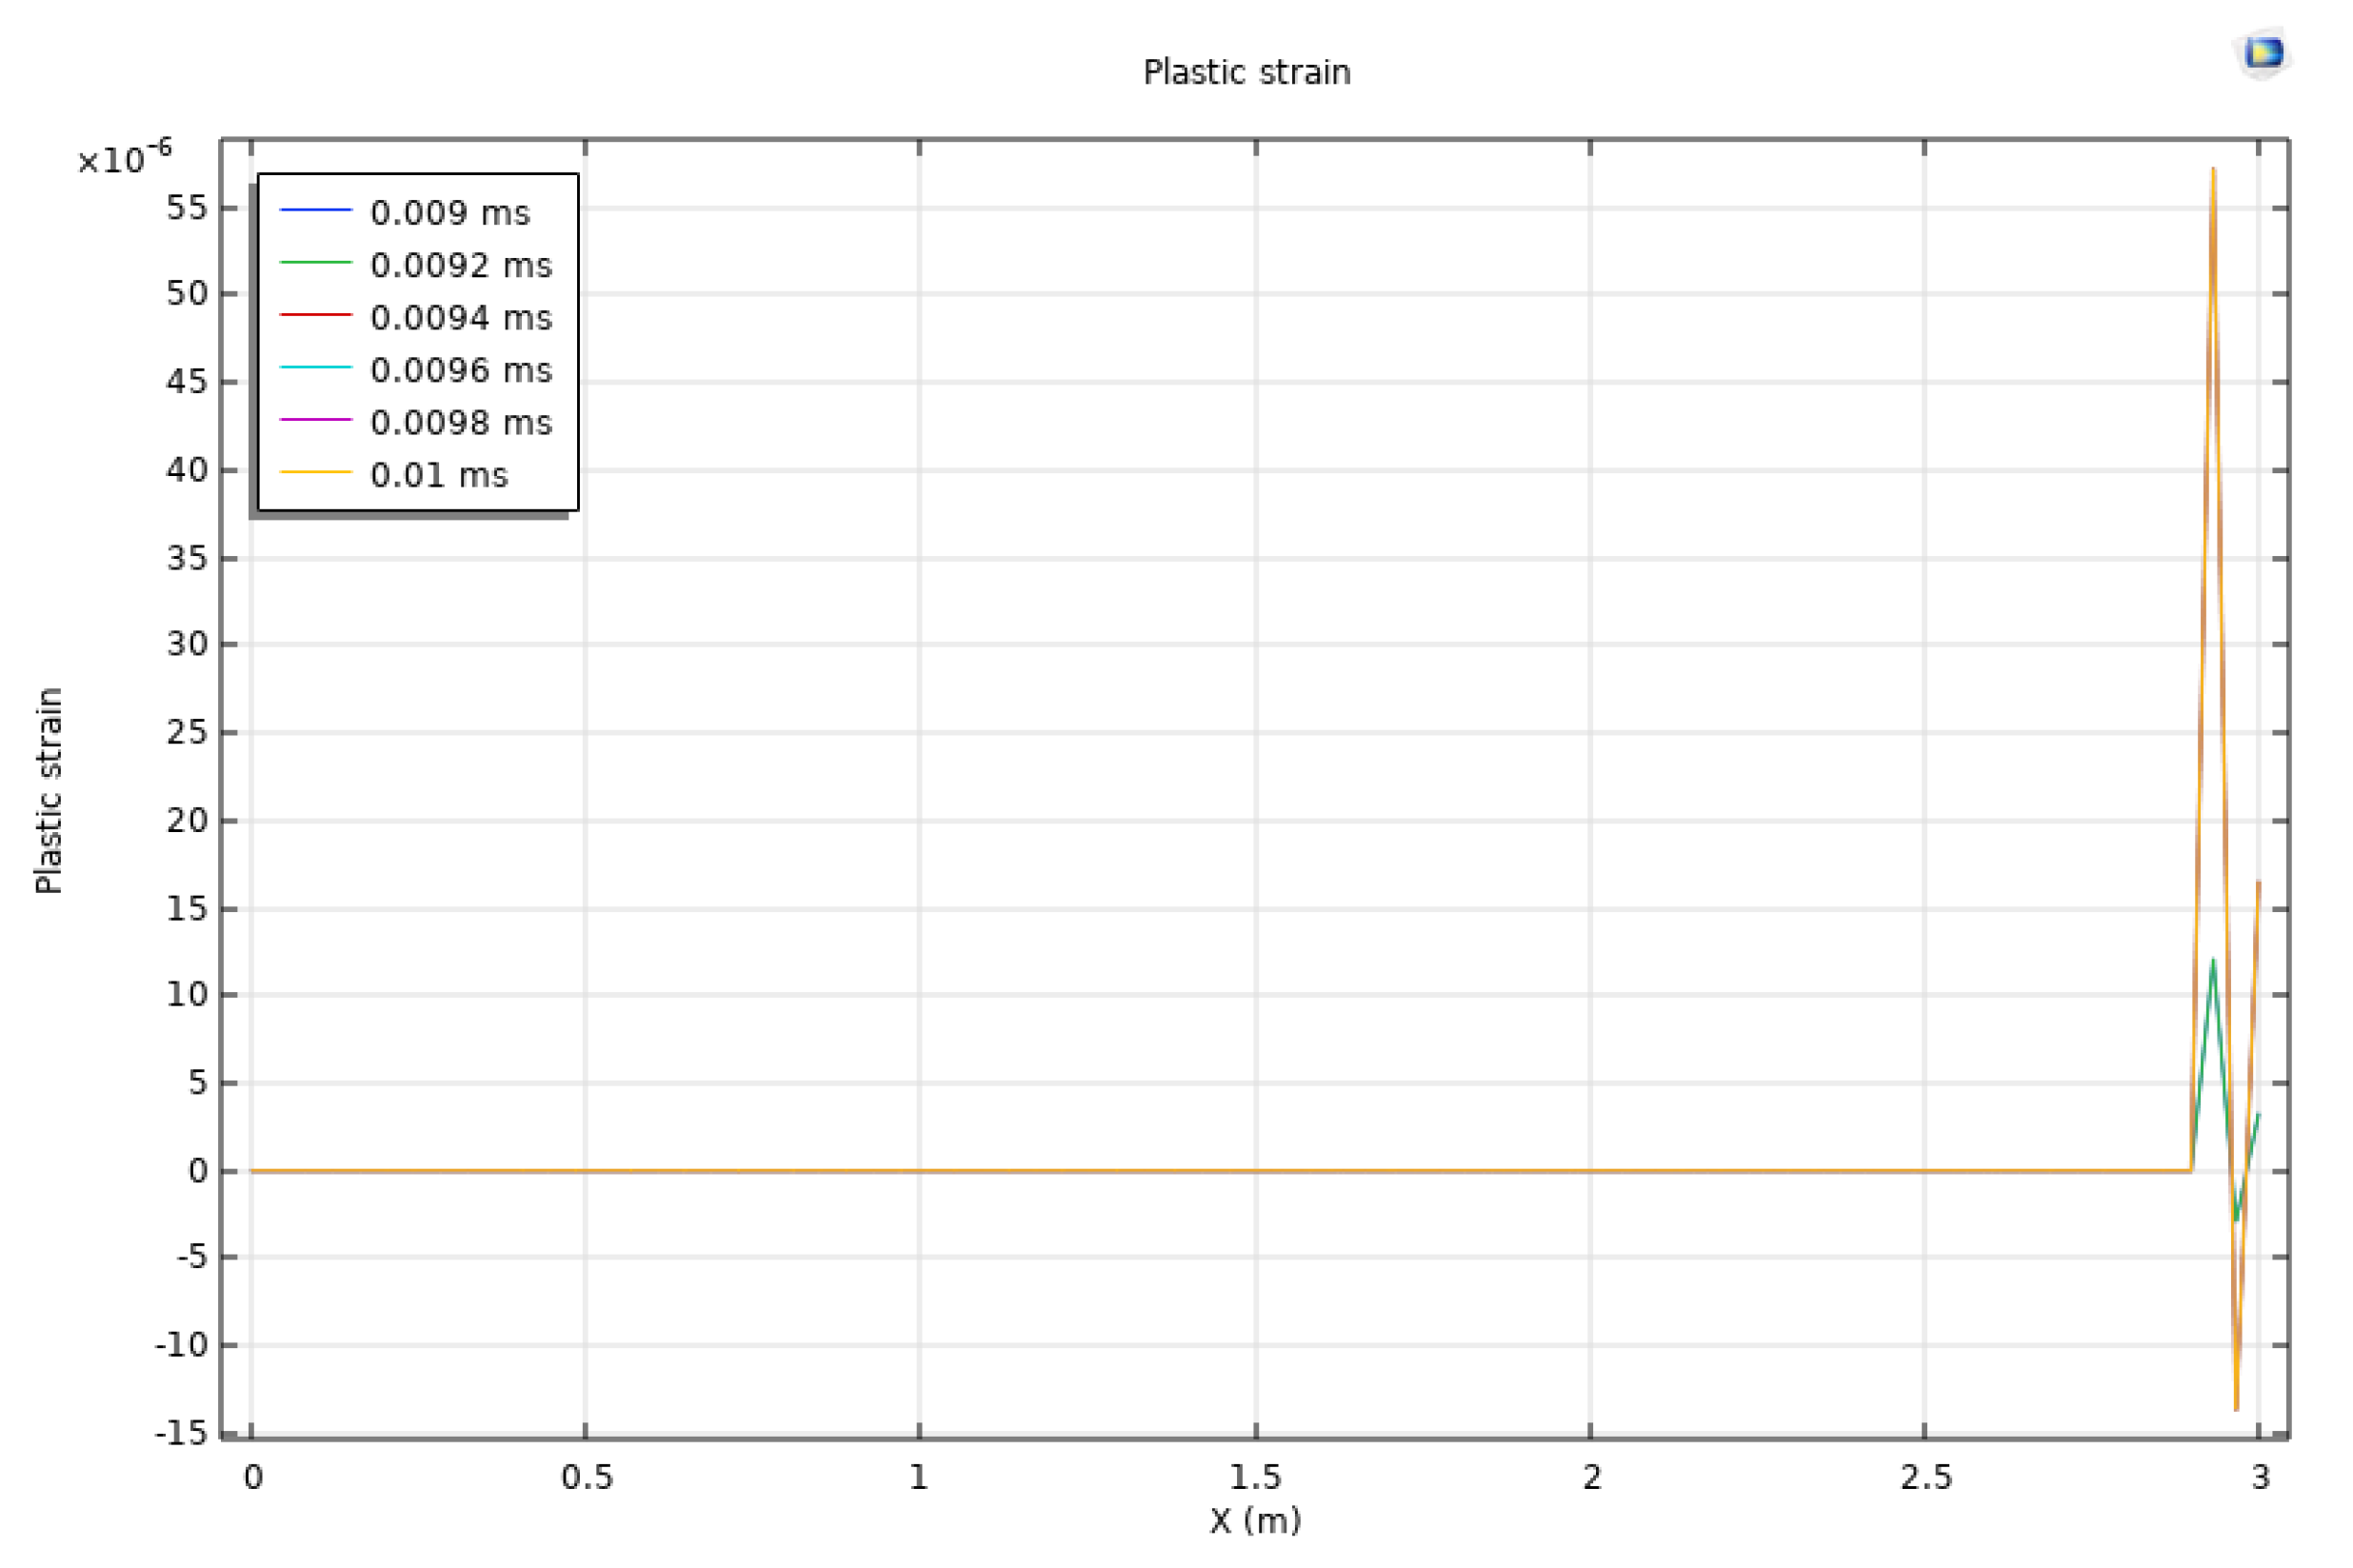
In Figure 3, a monitoring line at y = 6.5 m spanning from x = 0 to x = 3 m is involved. This line is used to examine the scale of the affected area after the exertion of dynamic loadings. Results of strain rate in the x direction, acceleration magnitude, and plastic strain are plotted at 0 ms, 0.002 ms, 0.004 ms, 0.006 ms, 0.008 ms, and 0.01 ms. The strain rate in the x direction shows an initial rapid increase near x=3 due to the location of the perforation. Over time, this strain rate decreases from -20 1/s at 0 ms to approximately -260 1/s by 0.01 ms, indicating that deformation is primarily localized near the perforation region. This sharp gradient in strain rate suggests the high impact of dynamic loading in a confined spatial region, with limited propagation into the reservoir. It also reflects the local stress concentration due to the loading exerted during hydraulic fracturing, while the affected area is limited to a narrow band near the perforations. The acceleration magnitude evolution also indicates the strong dynamic effects near the perforations. Initially, there is a sharp increase in acceleration magnitude, reaching 8×10⁵ m/s2 near x = 3 m, and this acceleration is existent over time. In addition, it gradually decreases as the energy dissipates. The acceleration magnitude result shows the immediate and localized nature of the dynamic response, with acceleration rapidly decreasing as it moves away from the two perforations on the right boundary. This trend is in accordance with the patterns from strain rate observations. The limited affected area that is confined to the vicinity of x = 3 m further confirms the localized impact of the dynamic loading. The plastic strain distribution then illustrates the permanent deformation characteristics (or damage) induced by the dynamic loading. Plastic strain is generally negligible throughout the majority of the domain, except near x = 3 m, where it suddenly increases sign to 55×10−6. This indicates that the reservoir rock has experienced irreversible deformation in the vicinity of the perforations, with the plastic strain accumulating primarily from 0.009 ms to 0.01 ms. The localized nature of plastic strain is substantiated by the substantial and lasting impact of dynamic loadings near the perforation regions. The affected area scale is rather limited, indicating that the structural impact of dynamic loading is restricted to a narrow band around the perforations.
Figure 3.
Strain rate in the x direction, acceleration magnitude, and plastic strain are plotted at 0 ms, 0.002 ms, 0.004 ms, 0.006 ms, 0.008 ms, and 0.01 ms. The monitoring line is at y = 6.5 m spanning from x = 0 to x = 3 m.
Figure 3.
Strain rate in the x direction, acceleration magnitude, and plastic strain are plotted at 0 ms, 0.002 ms, 0.004 ms, 0.006 ms, 0.008 ms, and 0.01 ms. The monitoring line is at y = 6.5 m spanning from x = 0 to x = 3 m.
3.2. Scenario 2
In the second case, a smaller model is investigated to understand the effect of perforation size on the dynamic rock mechanical response in the reservoir rock. In this case, a 5 cm by 5 cm domain is modeled while a perforation with a width of 1 cm and a length of 3 cm is explicitly analyzed. All other modeling inputs are the same as the previous scenario.
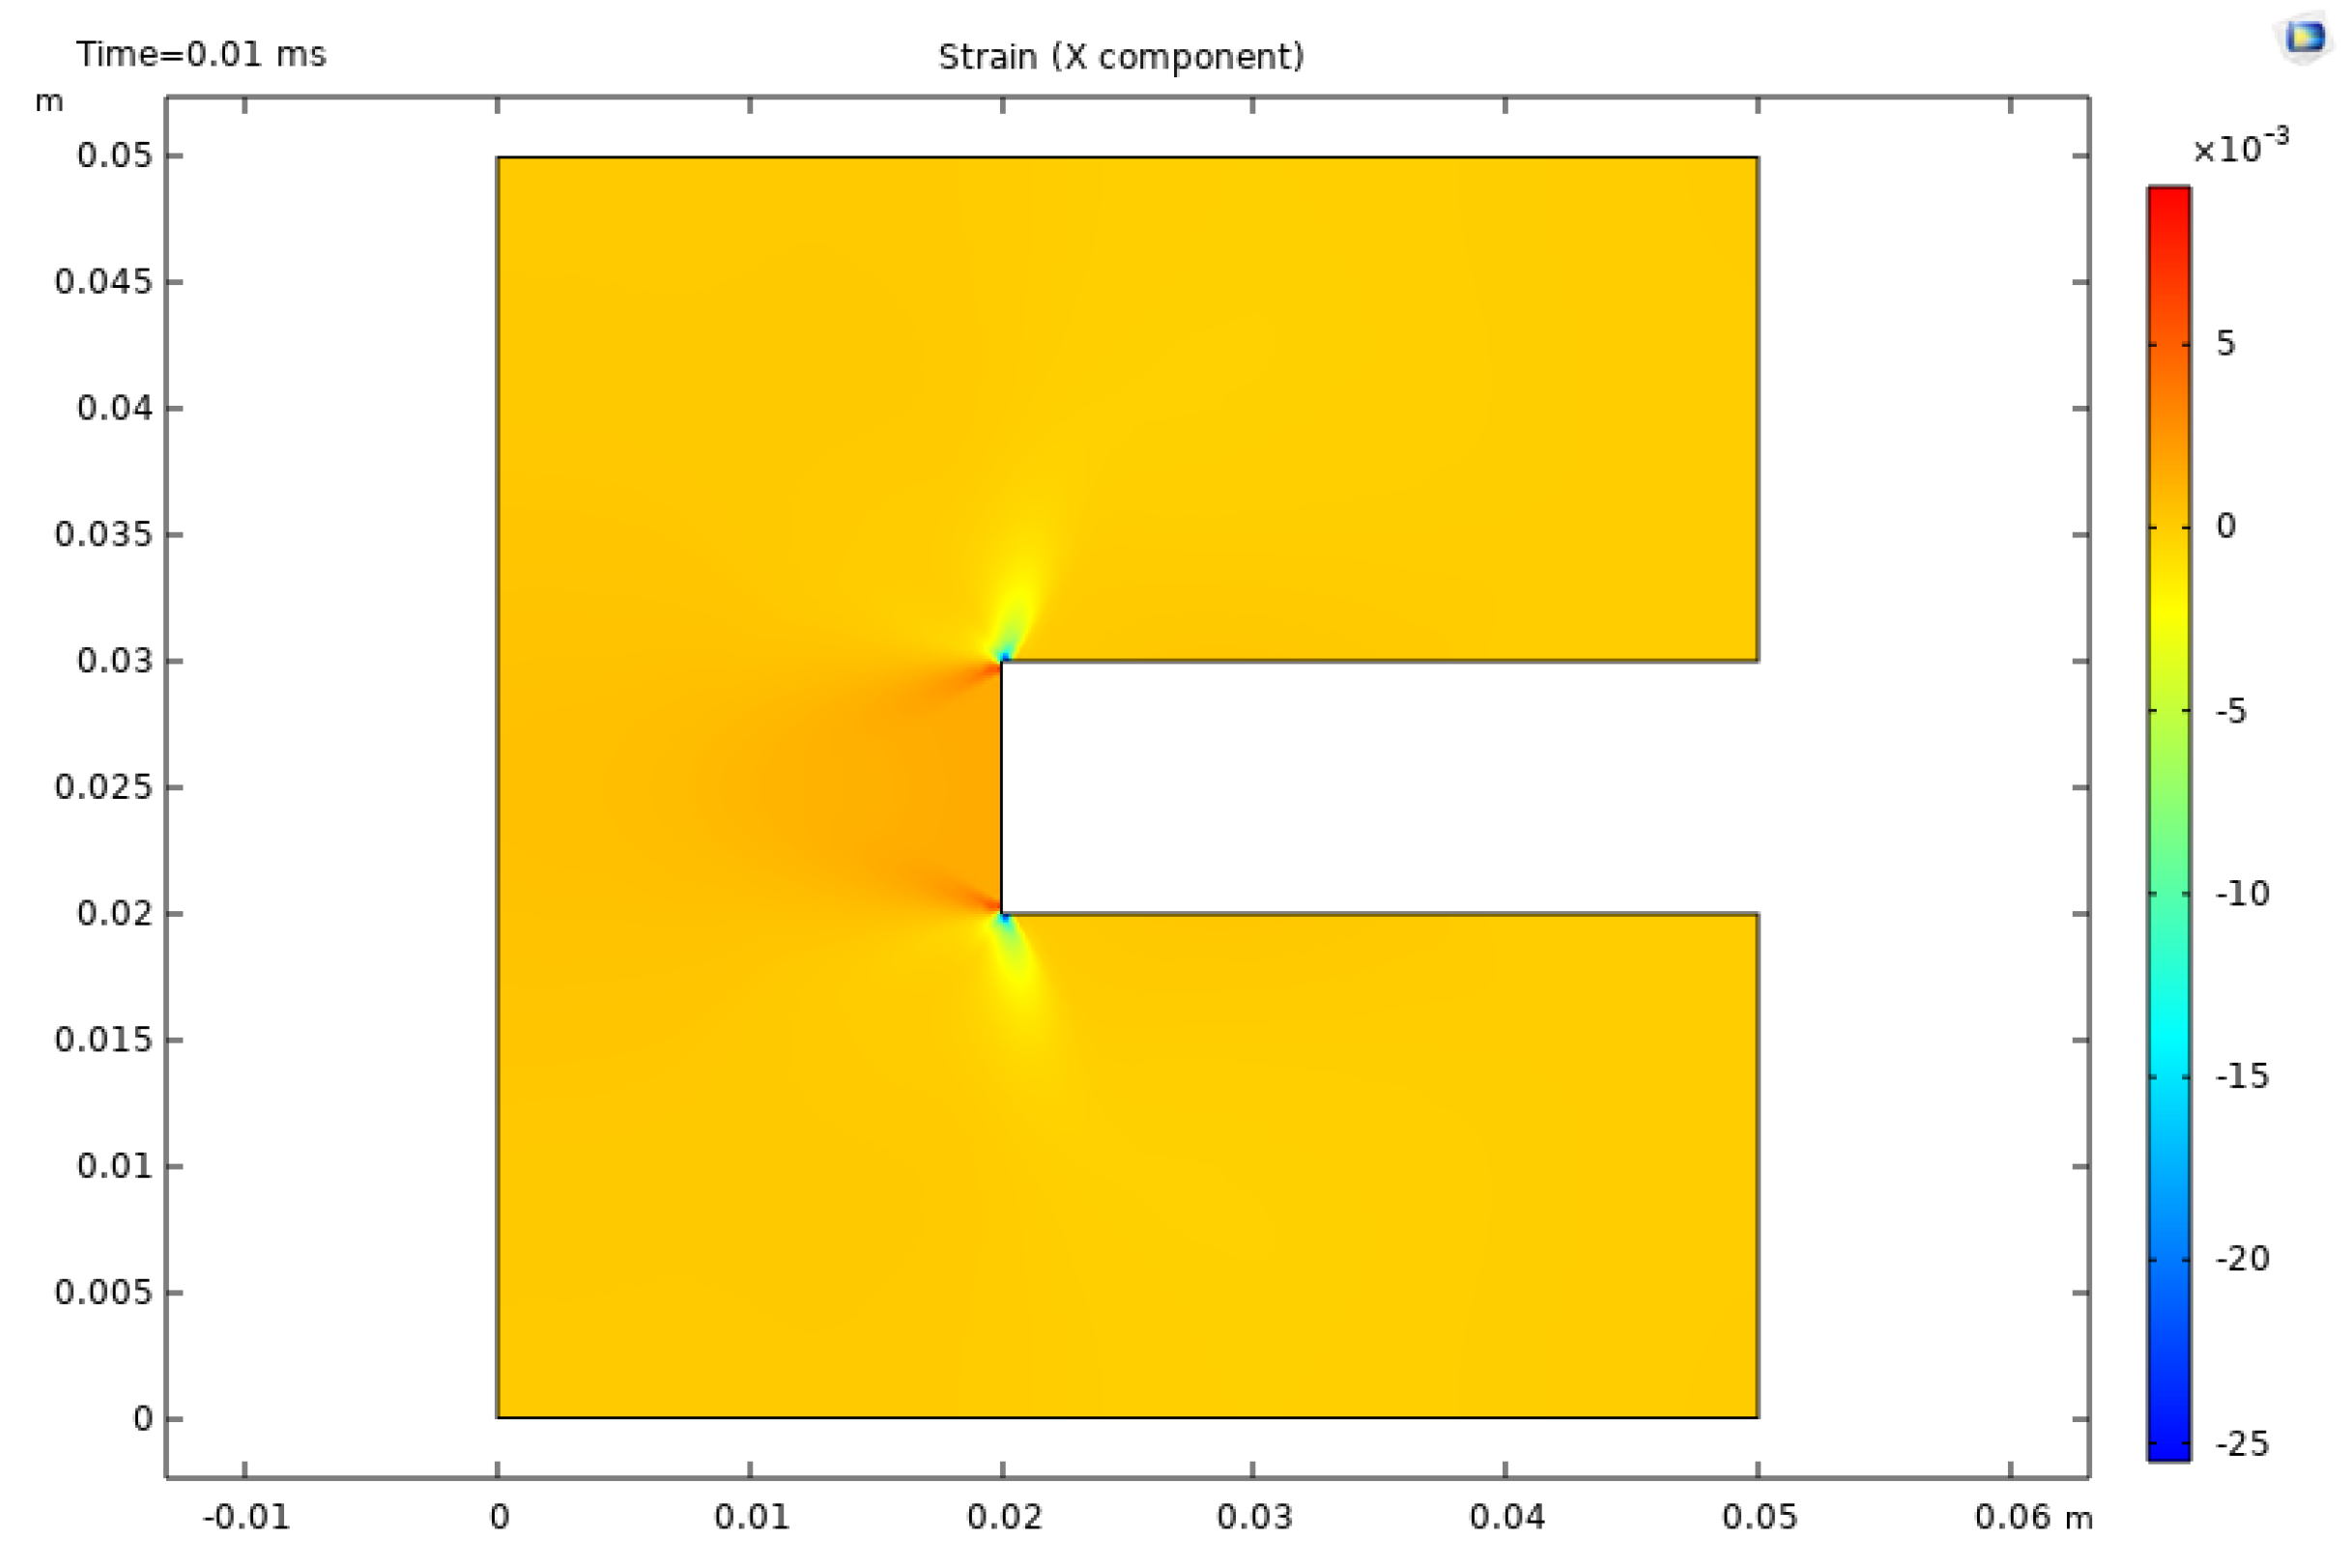
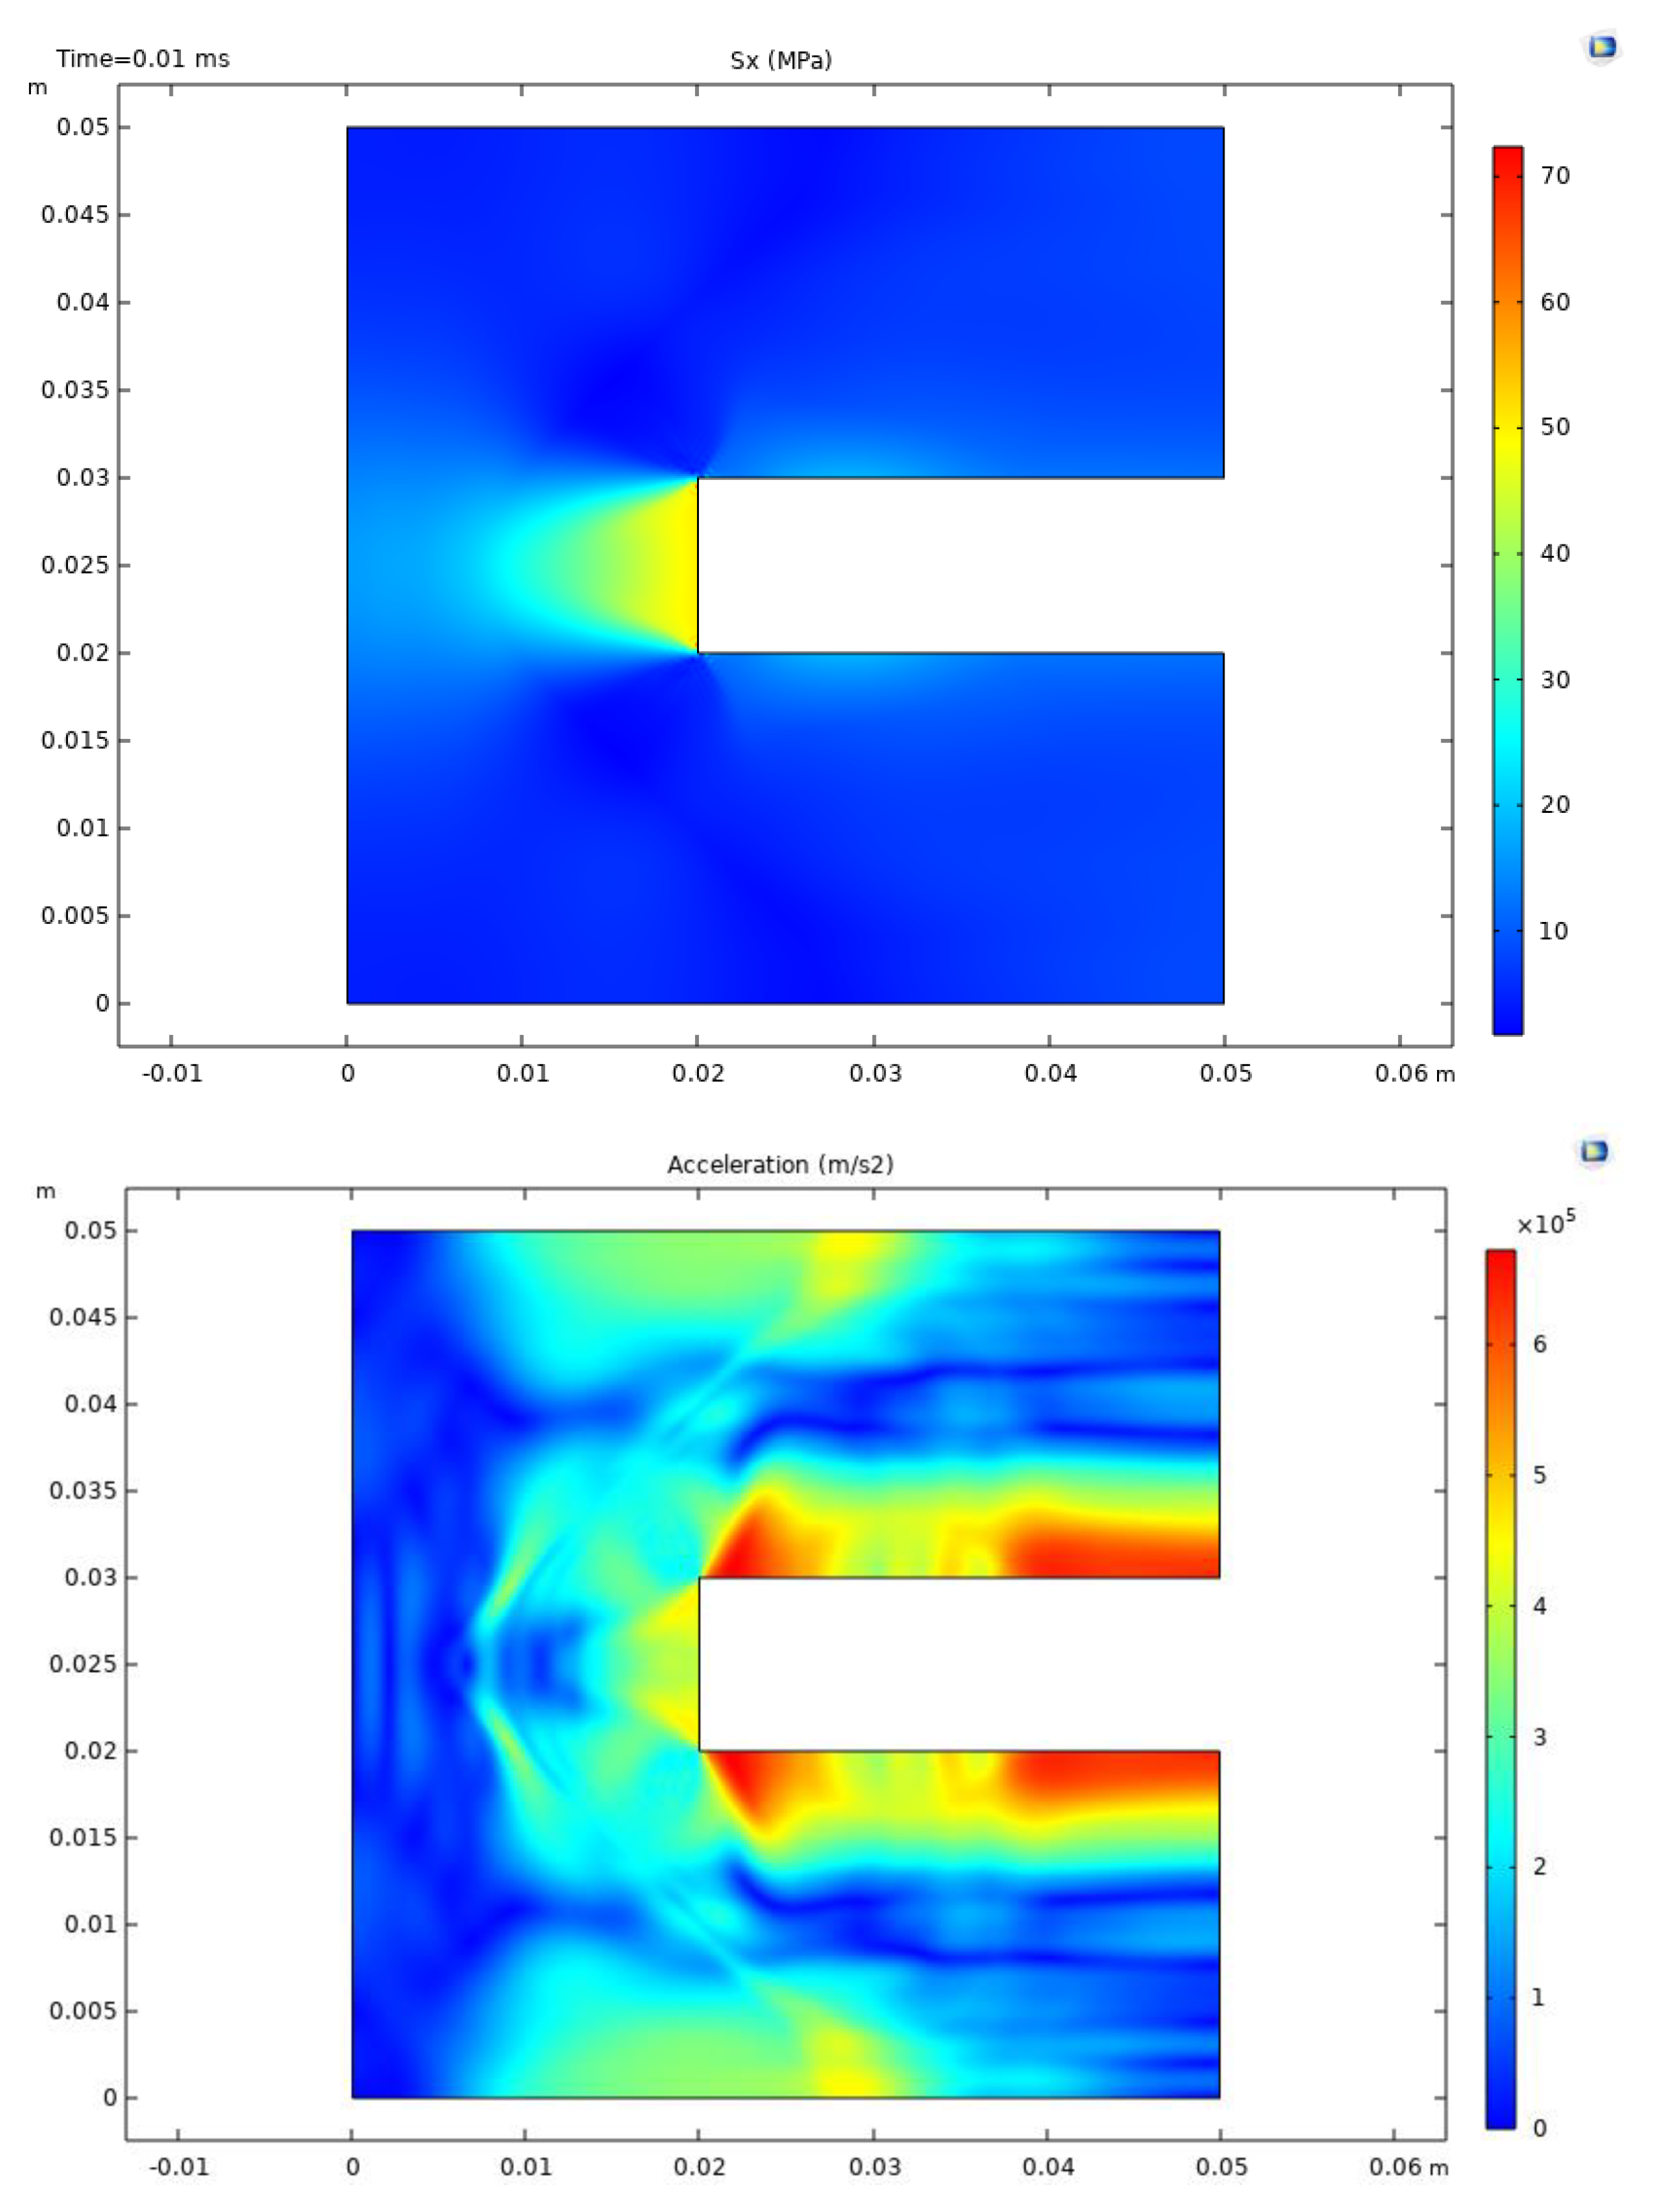
Figure 4 shows the strain in the x direction, stress in the x direction, and acceleration after 0.01 ms of loading. The perforation is explicitly represented by the rectangle. Sharp strain perturbations are observed at the two tips of the perforation with sudden change from positive strains to negative strains. Results of stress in the x direction are largely orientation-dependent, as strong stress increases are observed in the x direction extending from the perforation tip. The acceleration results further indicate the wavy propagation pattern caused by the boundary loading.
Figure 4.
Strain, stress, and acceleration results after 0.01 ms of loading in scenario 2.
Figure 4.
Strain, stress, and acceleration results after 0.01 ms of loading in scenario 2.
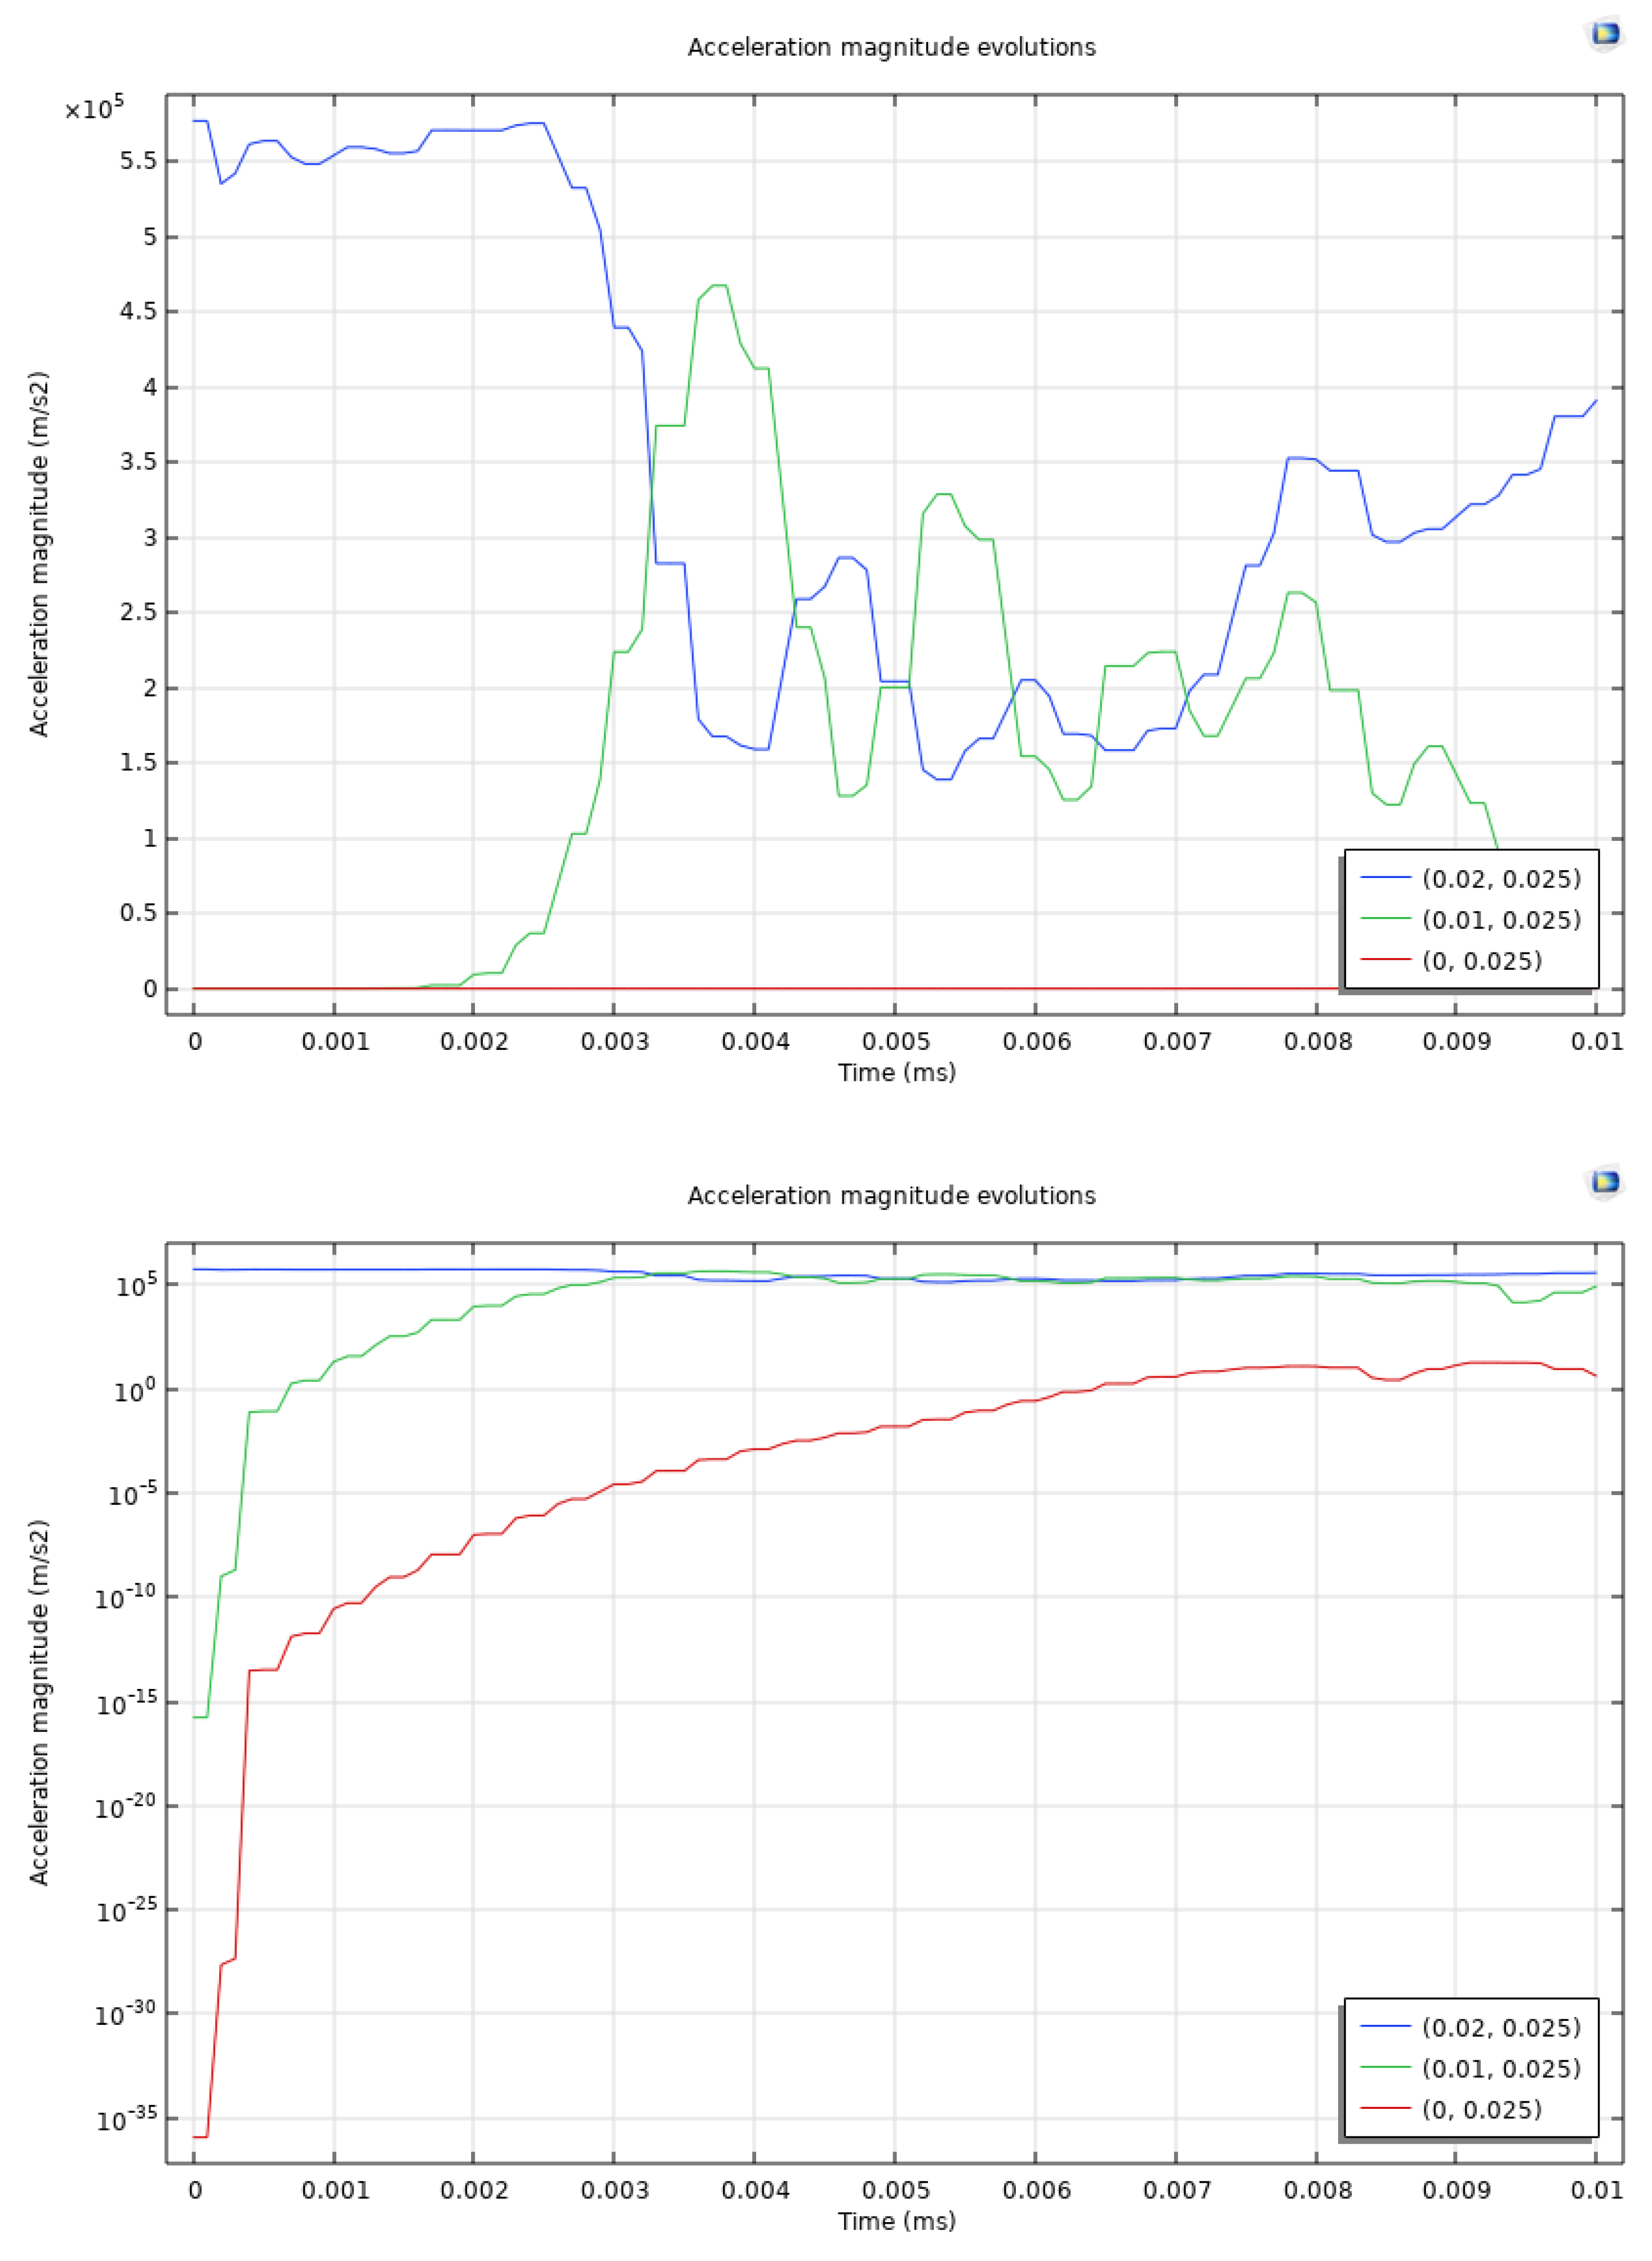
In Figure 5, acceleration of rock solid in the domain at monitoring points of (0.02, 0.025), (0.01, 0.025), and (0, 0.025). In order to better visualize the temporal trends, both Cartesian and semi-log plots are presented. In the Cartesian plot, it is observed that the acceleration magnitude at point (0.02, 0.025) exhibits the highest values, reaching approximately 5.5×10⁵ m/s2 within the initial 0.002 ms. This is attributed to the fact that this point at the boundary load experiences the most significant impact due to the dynamic loading, reflecting the high stress and rapid deformation in this region. The acceleration then shows fluctuations, indicating non-uniform interactions and wave propagations within the rock. Similarly, point (0.01, 0.025) experiences great acceleration magnitudes slightly lower than (0.02, 0.025), reaching around 4.5×10⁵ m/s2. This indicates that the dynamic effects are still significant but attenuated as the distance from the load increases. In contrast, point (0, 0.025) shows negligible acceleration, remaining nearly constant at a very low value, indicating minimal impact from the dynamic loading at this farthest point. The semi-log plot provides additional visualization of the acceleration evolution trends. It especially quantifies the orders of magnitude differences between the three monitoring points. The initial rapid increase in acceleration for points (0.02, 0.025) and (0.01, 0.025) is also honored, indicating the effect of high dynamic stresses. The acceleration at point (0, 0.025) is orders of magnitude lower, indicating the localized nature of the dynamic loading effects and the limited area affected. These results show the high acceleration values near the perforation, indicating significant local stress and risk for rock failure.
Figure 5.
Acceleration of rock solid in the domain at monitoring points of (0.02, 0.025), (0.01, 0.025), and (0, 0.025) plotted in Cartesian and semi-log plots.
Figure 5.
Acceleration of rock solid in the domain at monitoring points of (0.02, 0.025), (0.01, 0.025), and (0, 0.025) plotted in Cartesian and semi-log plots.
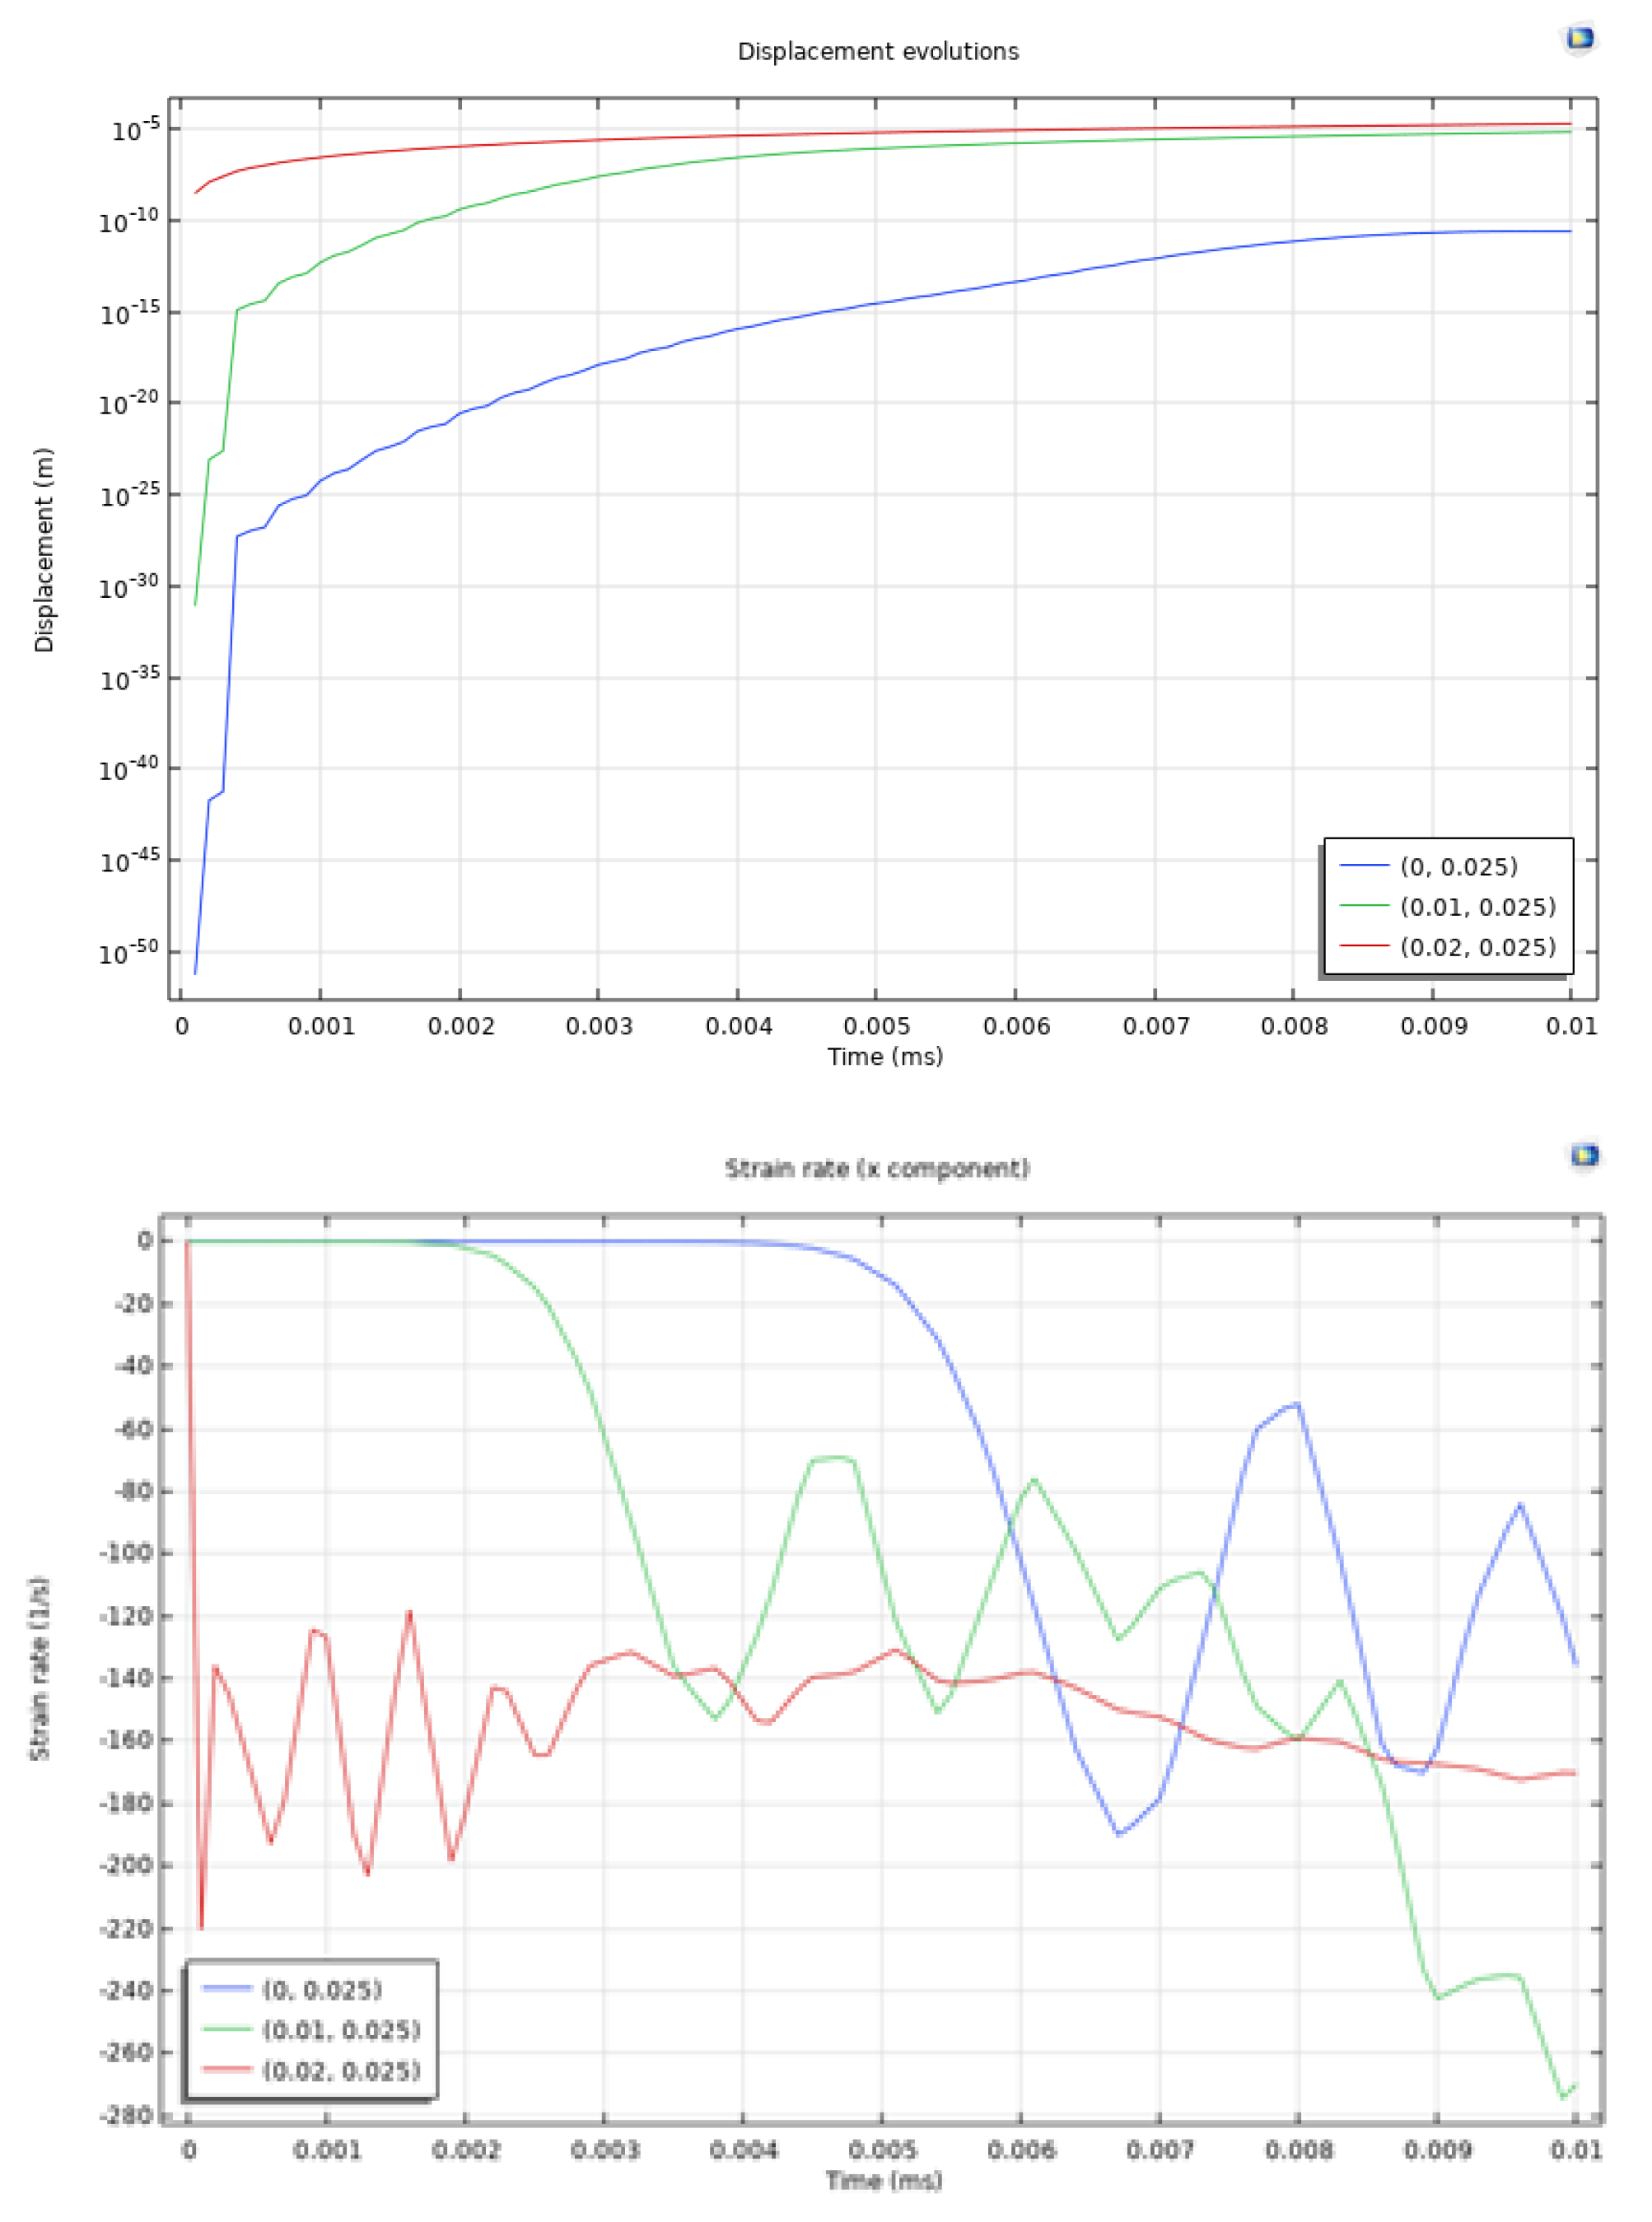
In Figure 6, the displacement and strain rate in the x direction for the rock solid in the domain at the monitoring points (0.02, 0.025), (0.01, 0.025), and (0, 0.025) are presented to understand the rock mechanical response under dynamic loading boundary conditions. The semi-log plot of displacement evolutions demonstrates significant differences in displacement magnitudes at the three monitoring points. Point (0.02, 0.025), located closest to the boundary load, exhibits the highest displacement values, reaching up to 10−5 m. This rapid increase in displacement indicates significant deformation due to the applied dynamic load. Point (0.01, 0.025) also exhibits significant displacement, indicating an attenuation of the dynamic effects with distance from the loading boundary. In contrast, point (0, 0.025) displays negligible displacement, remaining constant at very values close to zero throughout the time, indicating the limited impact region of the dynamic load. The overall trend suggests that the dynamic loading effects are very localized, with significant deformation confined to areas near the load application. In addition, the strain rate evolution in the x direction helps to further quantify the deformation responses. At point (0.02, 0.025), the strain rate experiences the most significant fluctuation: it initially reaches -100 1/s and then oscillates between -240 1/s and 20 1/s. This indicates the complex wave interaction and stress redistribution near the loading point of the perforation. Point (0.01, 0.025) shows similar patterns while the strain rates are lower, indicating that dynamic effects attenuate as it moves away from the loading boundary. Like previous cases, the strain rate at point (0, 0.025) remains relatively stable, oscillating around -20 1/s, which again substantiates the fact that the dynamic loading boundary can only affect certain localized areas. The displacement and strain rate results indicate that the dynamic responses are highly localized near the perforations. The displacement magnitudes show that the boundary loading regions undergo the most significant deformation, while the strain rate oscillations indicate complex stress redistributions and wave interactions in these areas.
Figure 6.
Displacement and strain rate in the x direction of rock solid in the domain at monitoring points of (0.02, 0.025), (0.01, 0.025), and (0, 0.025).
Figure 6.
Displacement and strain rate in the x direction of rock solid in the domain at monitoring points of (0.02, 0.025), (0.01, 0.025), and (0, 0.025).
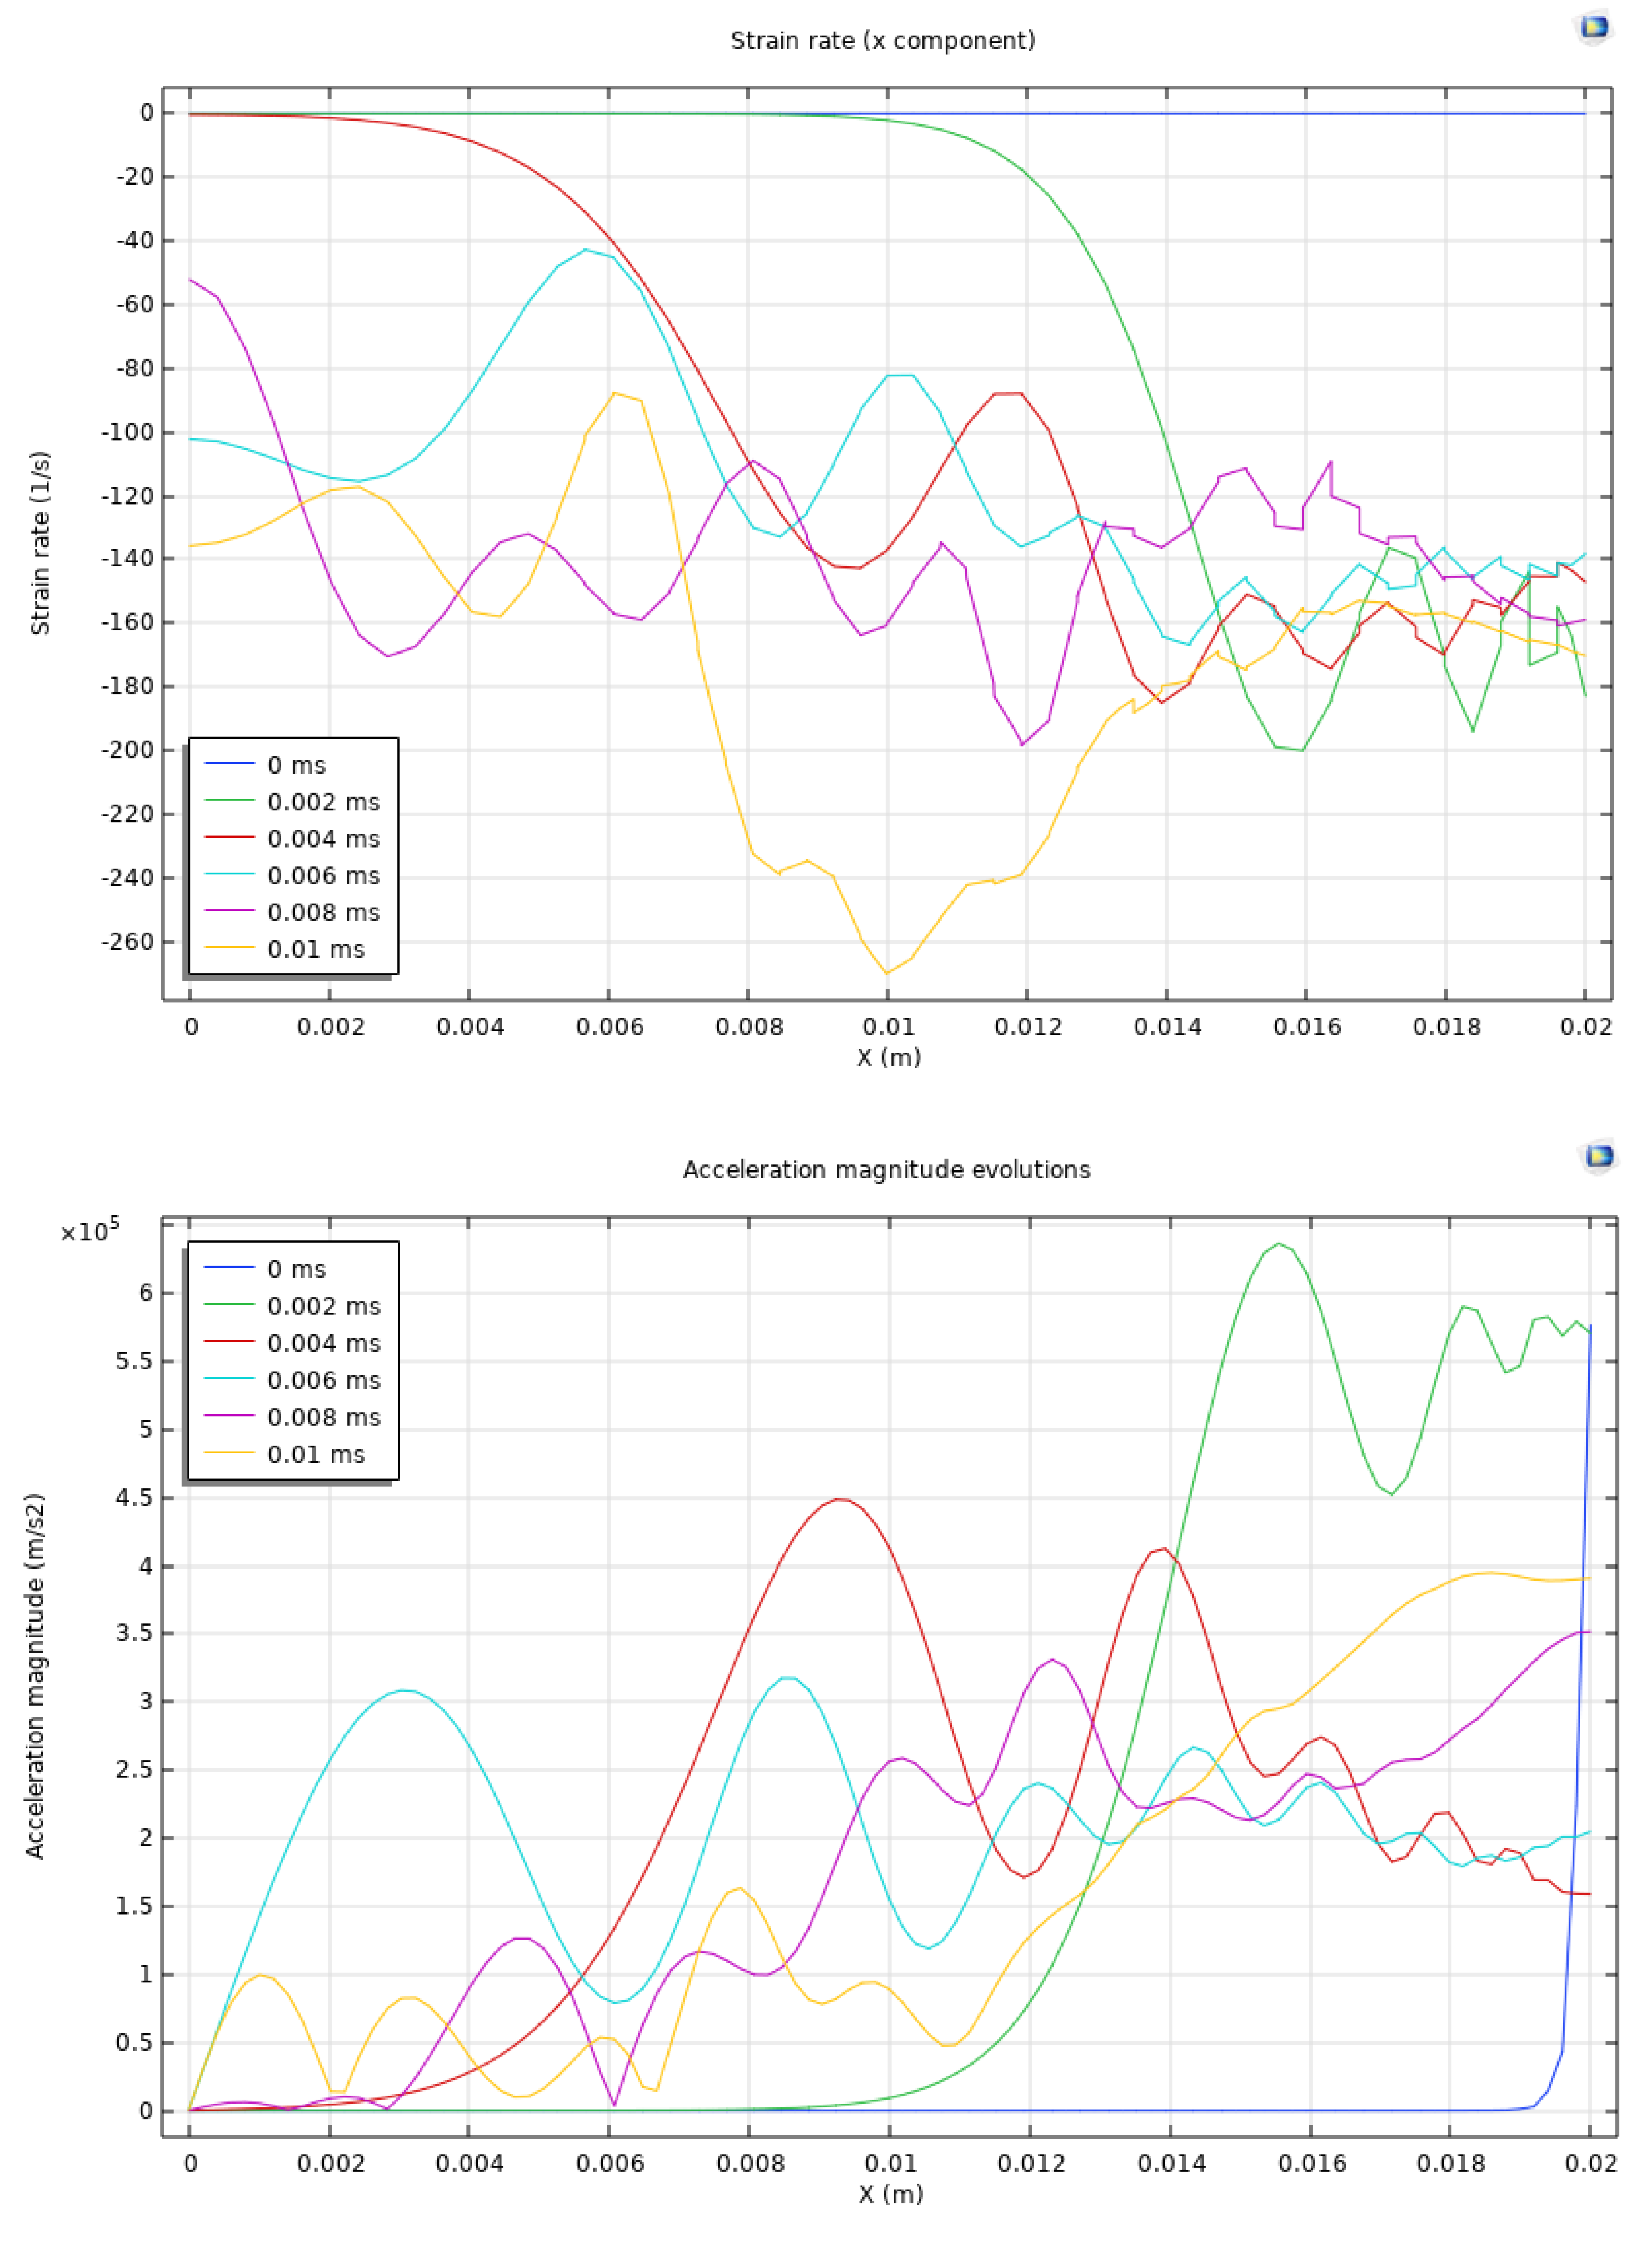
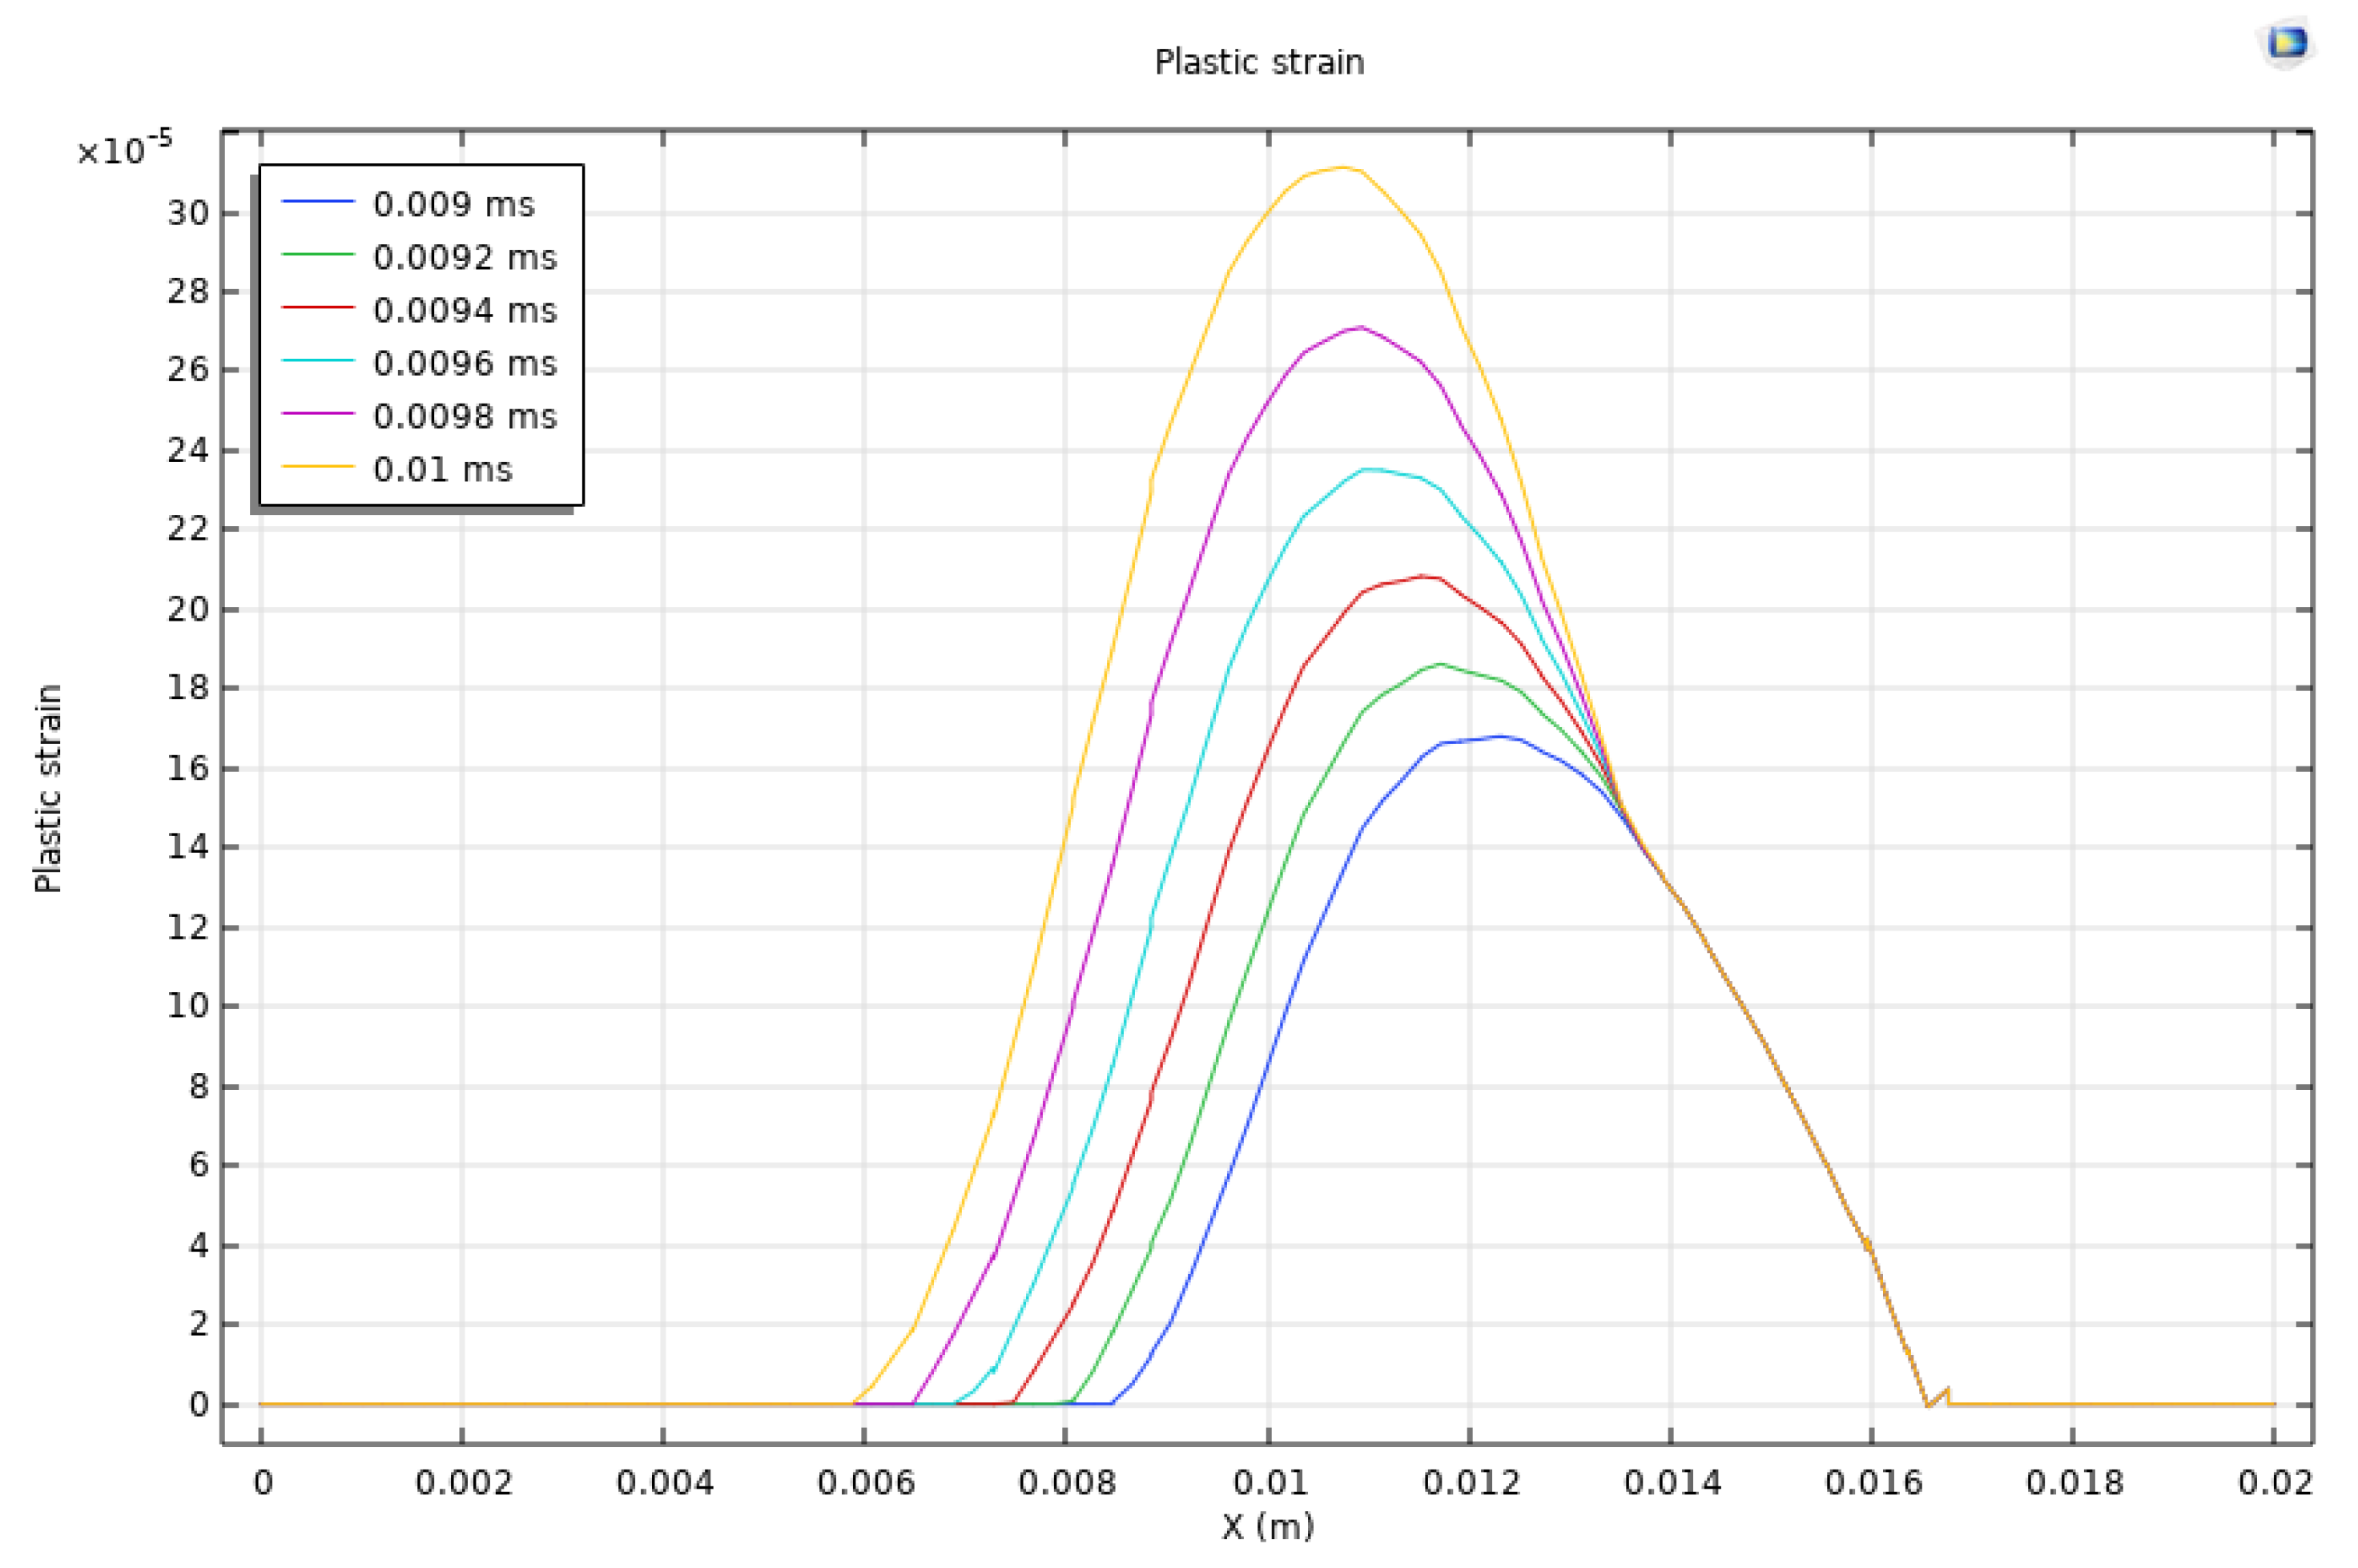
After discussing the temporal evolution patterns at several monitoring points, the spatial distribution patterns at the monitoring line of y = 0.025 m and x spanning from 0 to 0.02 m are investigated in Figure 7. Strain rate in the x direction and acceleration magnitude are plotted at 0 ms, 0.002 ms, 0.004 ms, 0.006 ms, 0.008 ms, and 0.01 ms. The plastic strain is plotted at 0.009 ms, 0.0092 ms, 0.0094 ms, 0.0096 ms, 0.0098 ms, and 0.01 ms. The monitoring line is at y = 0.025 m spanning from x = 0 to x = 0.02 m. Plastic strain results are limited to the later stages due to the fact that plastic strains and irreversible damage are not captured at the beginning.
The strain rate in the x direction displays noticeable variations along the x-axis at different time steps. At early time steps of 0.002 ms and 0.004 ms, the strain rate exhibits strong fluctuations near the boundaries of the perforation. At time steps between 0.006 ms and 0.01 ms, these oscillatory patterns become more pronounced, which reflects the fierce and heterogeneous stress redistribution and wave propagations within the reservoir rock. The acceleration magnitude along the monitoring line shows the dynamic response at various time steps. At 0.002 ms, there is a sudden increase at and around x = 0.01 m reaching 6×10⁵ m/s2. It indicates the simultaneous response to the exertion of the applied dynamic load. Over the entire loading time, the acceleration patterns are generally oscillatory. The plastic strain evolution provides quantification of the induced irreversible damage. Note that only results after 0.009 ms are shown as plasticity is only captured at later stages of loading exertion. At time steps of 0.009 ms and 0.0096 ms, the plastic strain gradually increases at and near x = 0.01 m, indicating the onset of permanent deformation and damage. As 0.01 ms, the plastic strain reaches its peak at around 3×10⁻⁵. A nearly normal distribution centered around x = 0.01 m is observed. This pattern indicates that, instead of the boundary loading region, the oscillatory and wavy dynamic responses lead to the most prominent damage within the reservoir rock away from the boundary loading region.
Figure 7.
Strain rate in the x direction and acceleration magnitude are plotted at 0 ms, 0.002 ms, 0.004 ms, 0.006 ms, 0.008 ms, and 0.01 ms. The plastic strain is plotted at 0.009 ms, 0.0092 ms, 0.0094 ms, 0.0096 ms, 0.0098 ms, and 0.01 ms. The monitoring line is at y = 0.025 m spanning from x = 0 to x = 0.02 m.
3.3. Scenario 3
In the third case, a more realistic scenario is considered where multiple perforations are modeled. In this case, a cluster with 11 openings is considered where each perforation opening has a length of 0.63 m and a diameter of 0.01 m. The domain size is 1 m by 5 m and the perforations are placed at the right boundary. These parameters are used to represent perforations created by the perforating gun. Other modeling parameters remain the same.
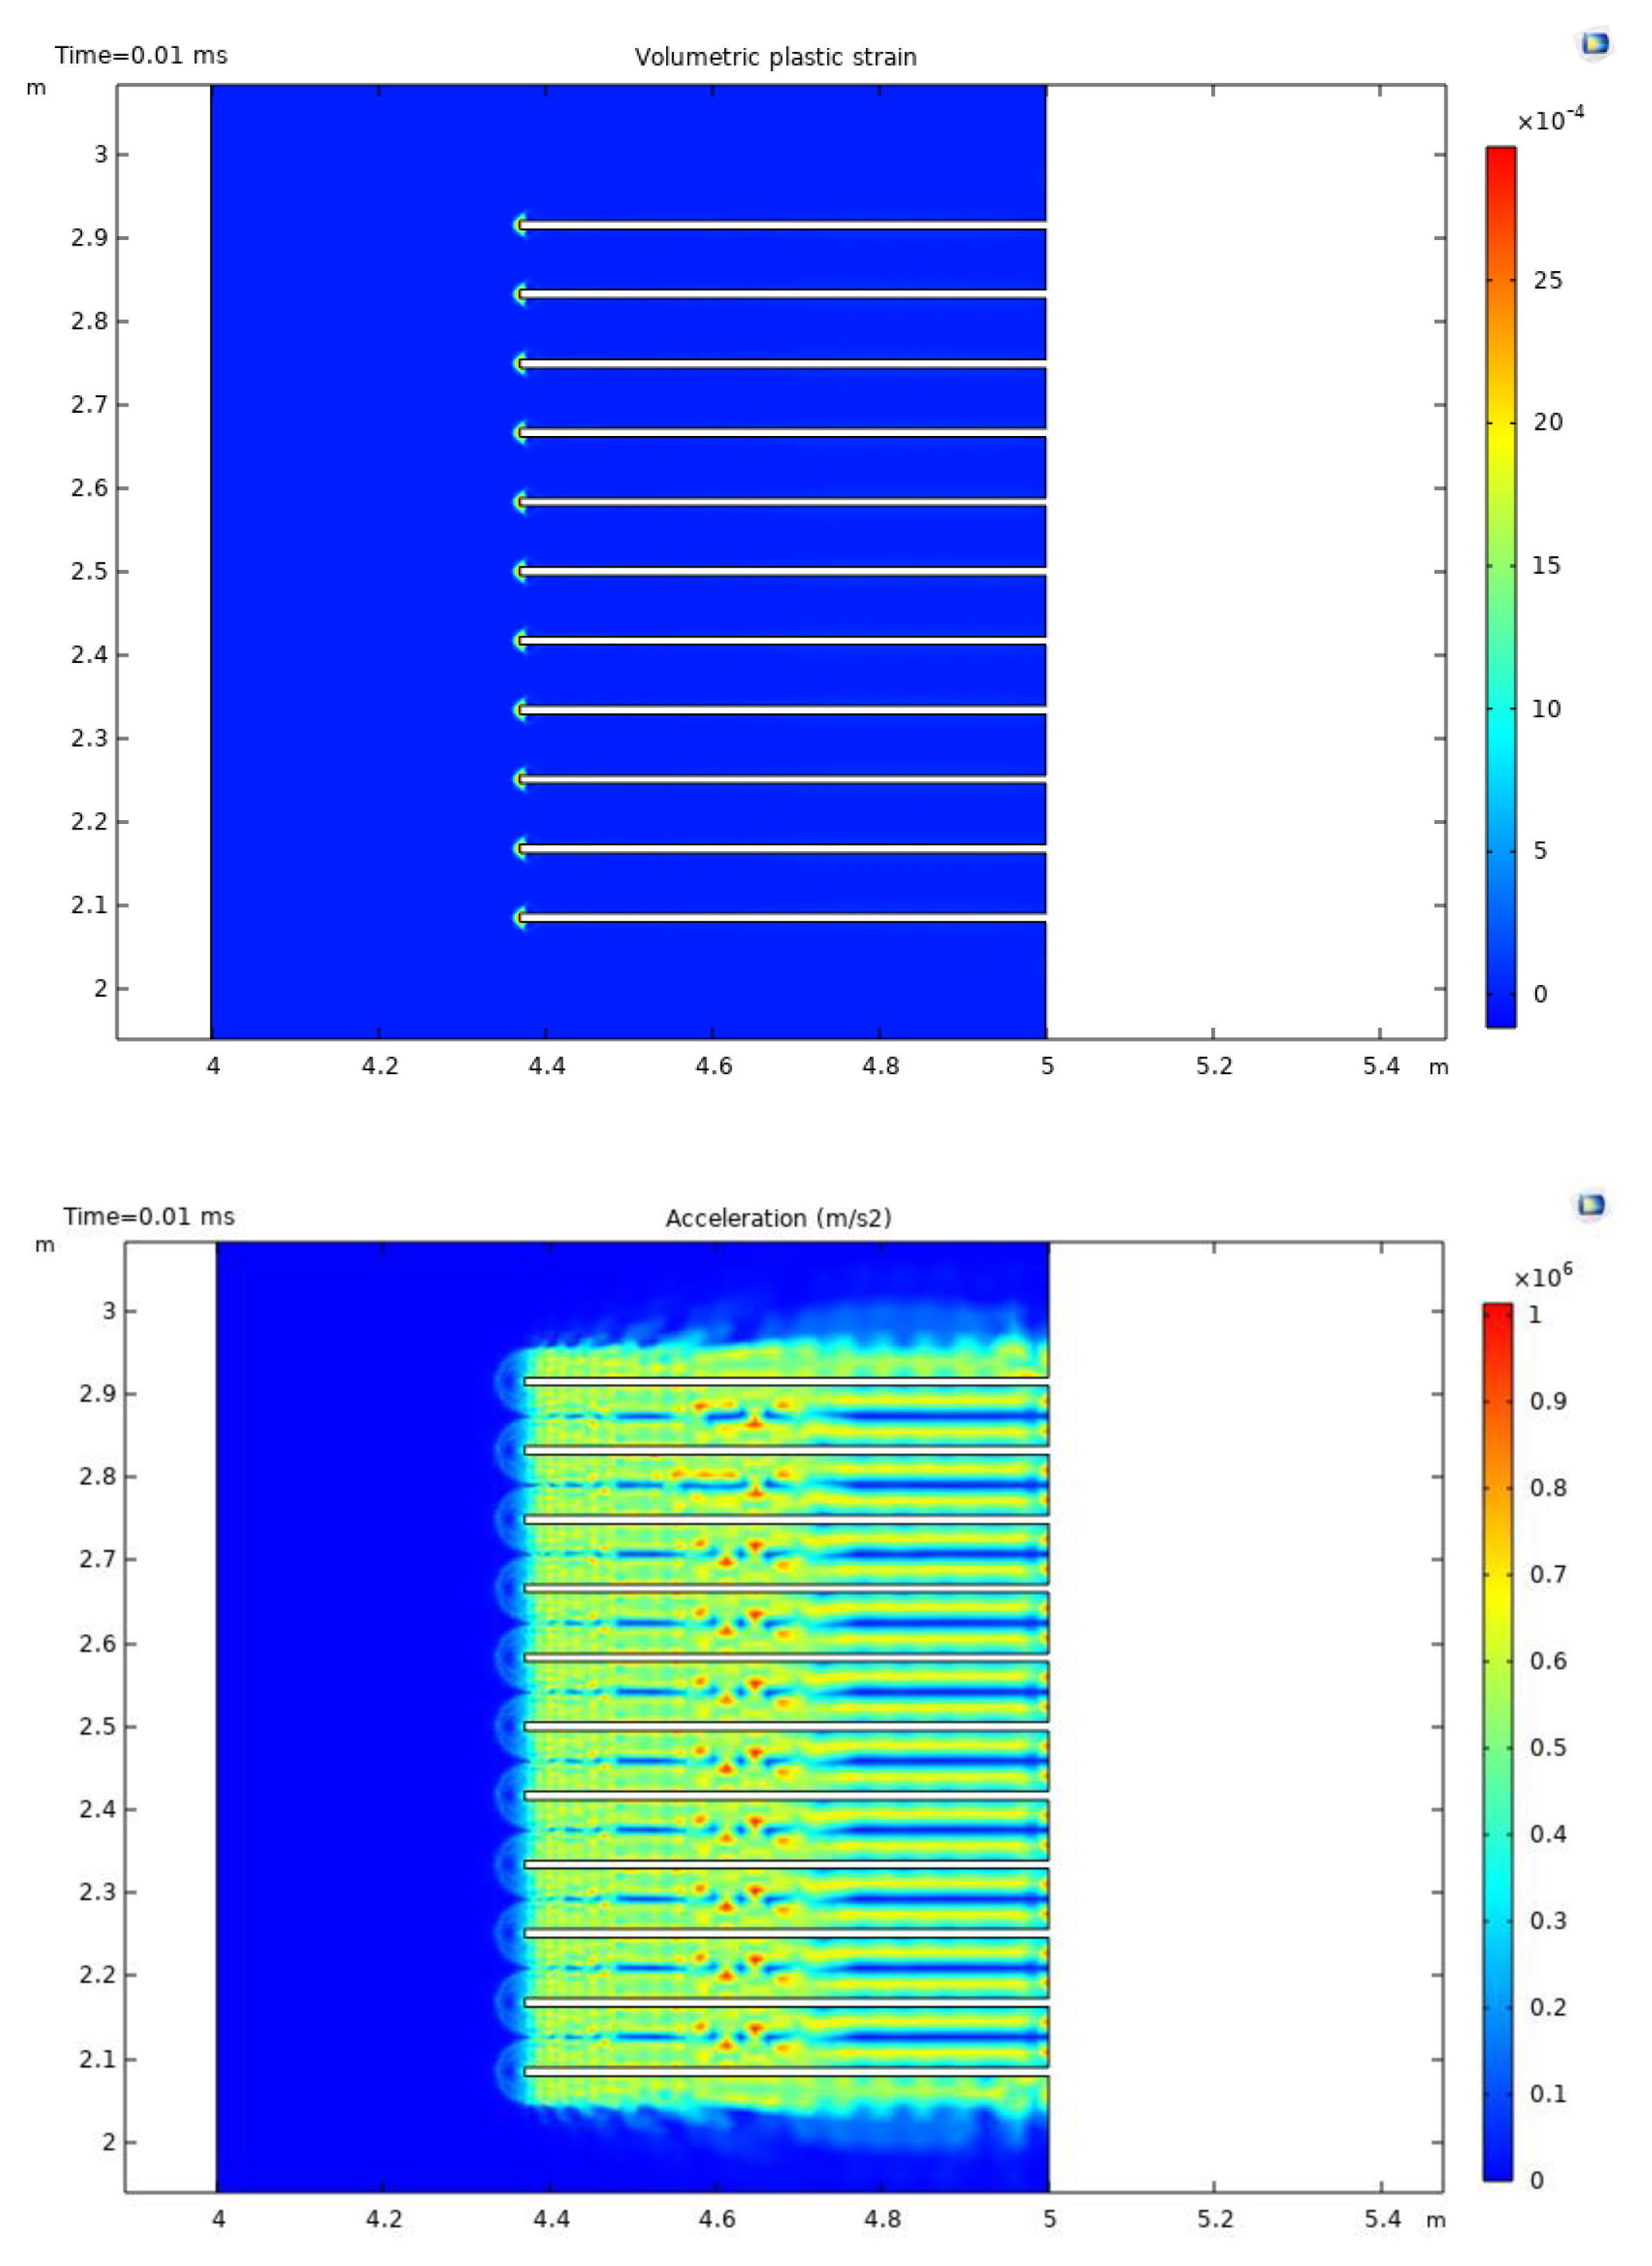
The spatial distribution of volumetric plastic strain and acceleration is plotted in Figure 8. Results show that the irreversible damage is primarily observed at and near tips of perforations, while acceleration magnitudes are relatively significant at and in between perforations. The clustering of perforations does not lead to significant plastic strain overlapping, indicating that irreversible damage is mainly caused individually around each perforation. In contrast, the acceleration contours expand radially around each perforation with strong overlapping effects.
Figure 8.
Volumetric plastic strain and acceleration results after 0.01 ms of loading in scenario 3.
Figure 8.
Volumetric plastic strain and acceleration results after 0.01 ms of loading in scenario 3.
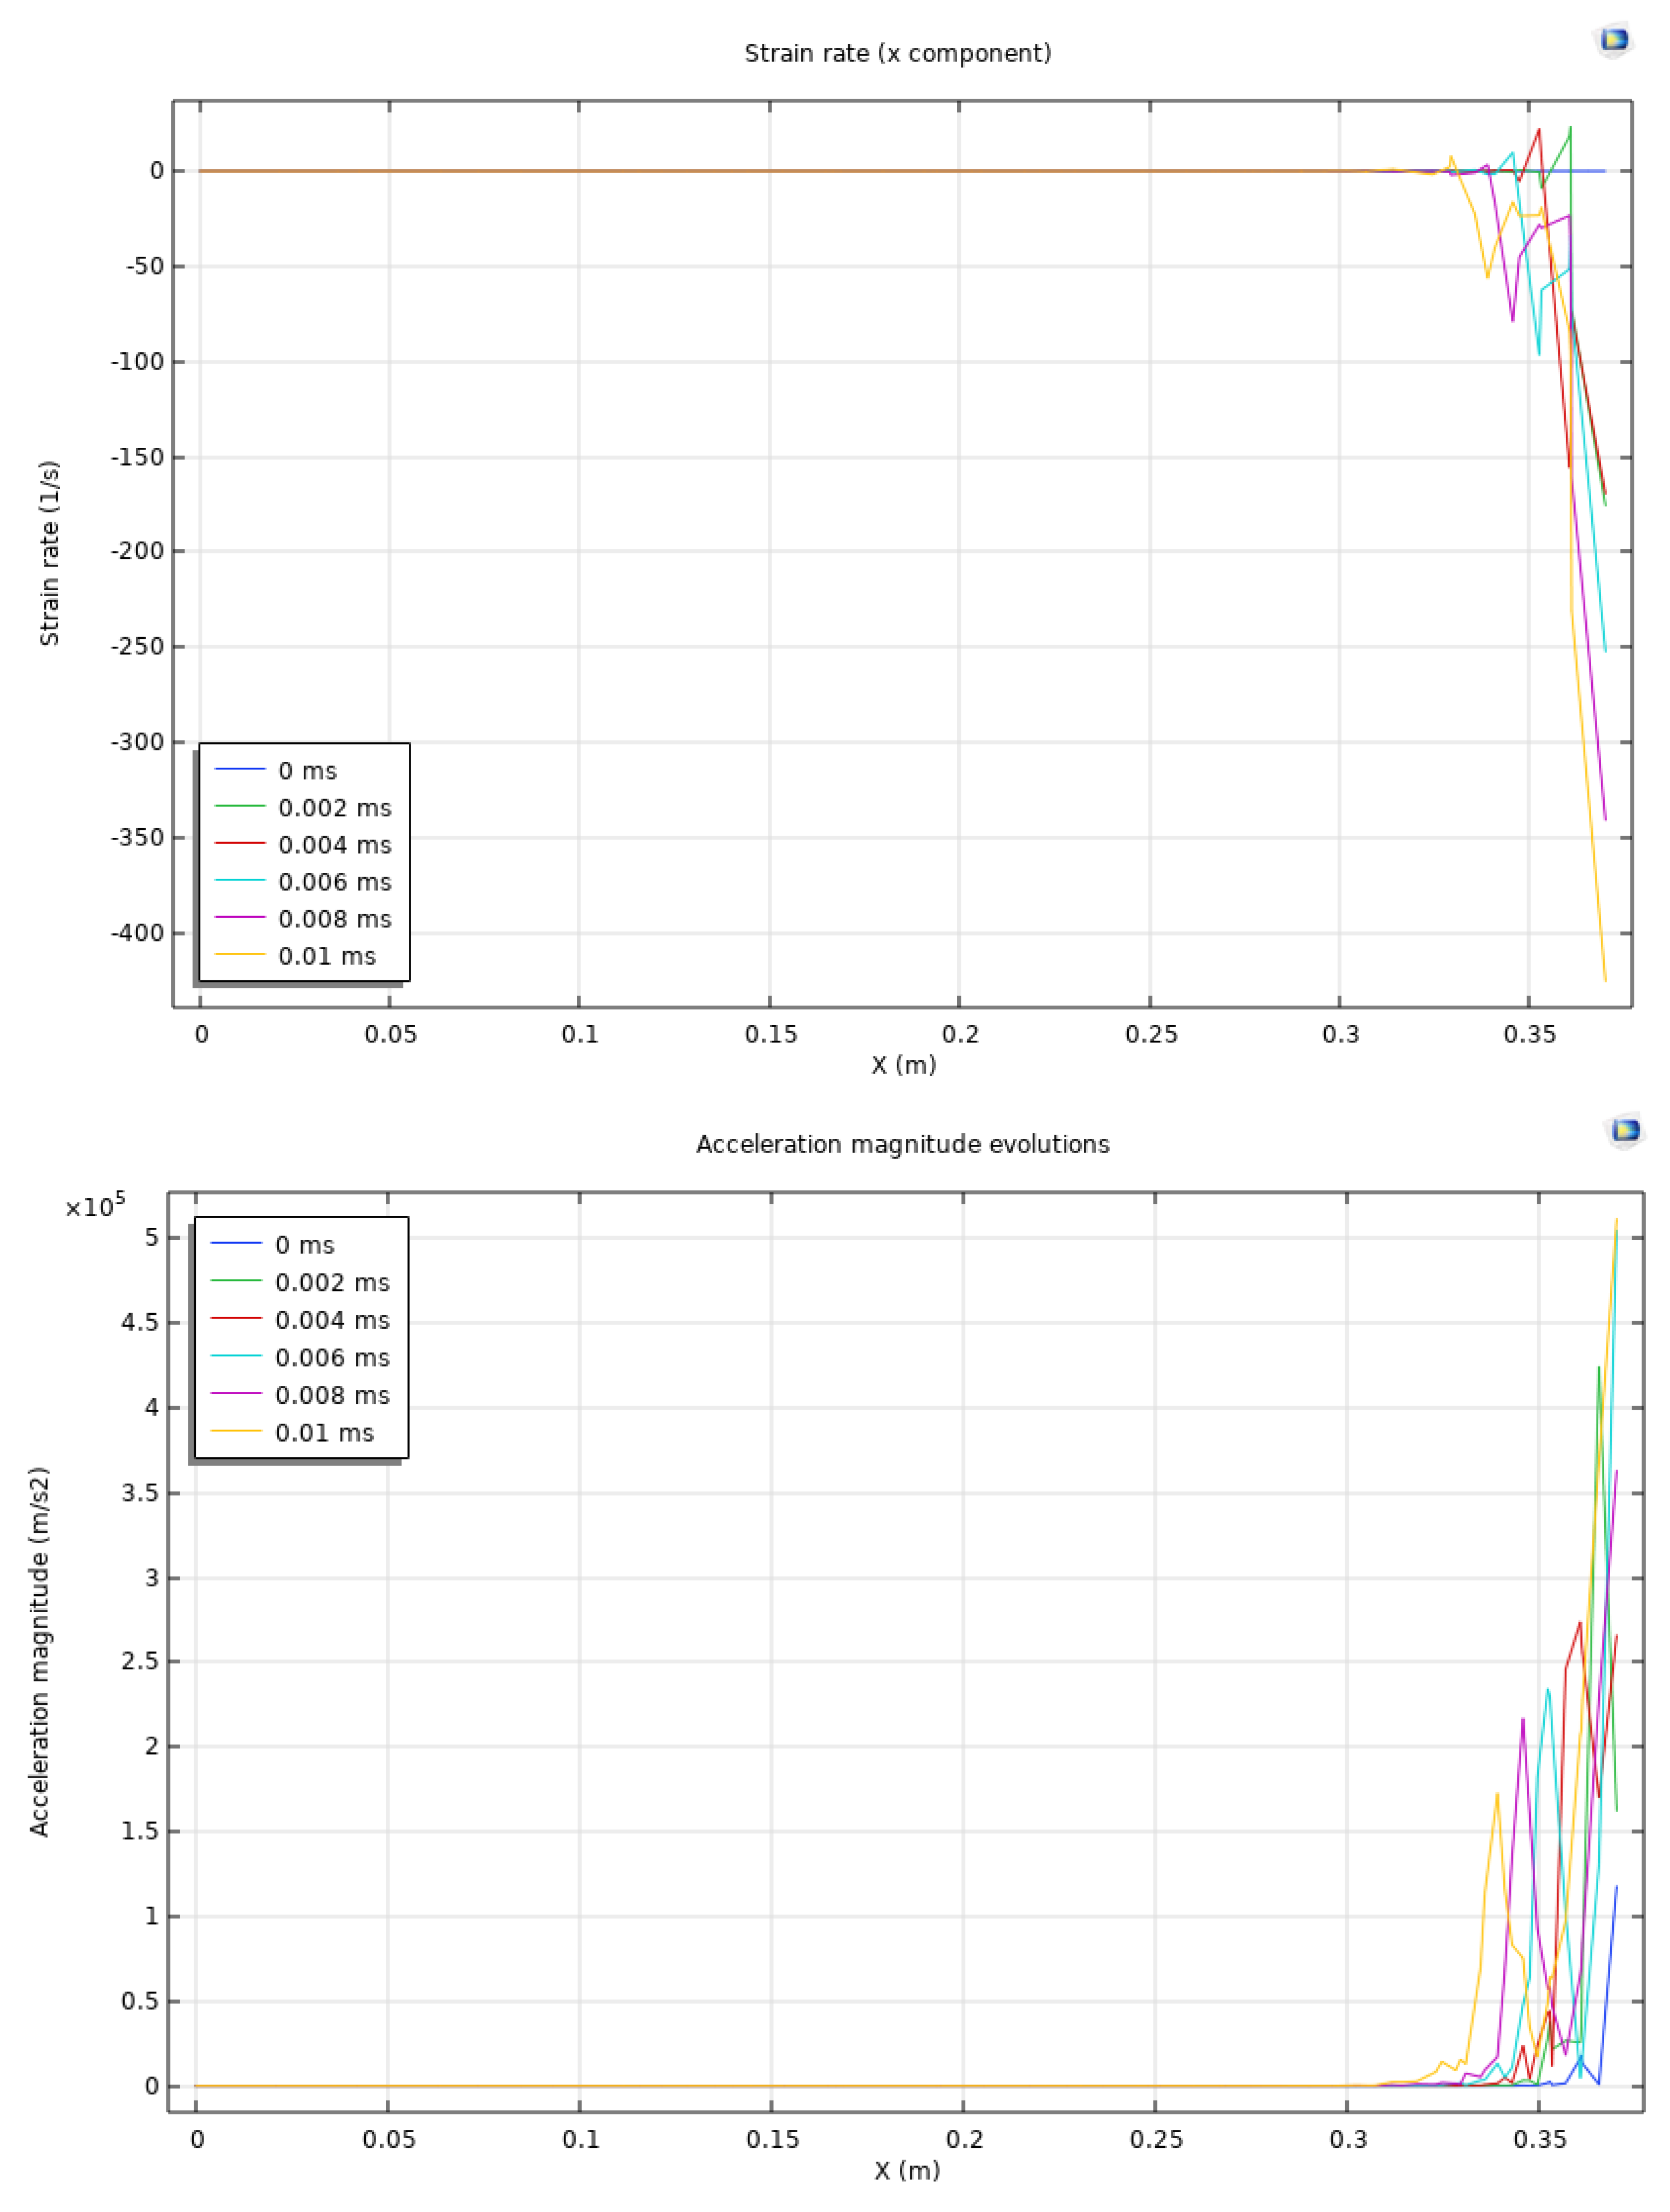
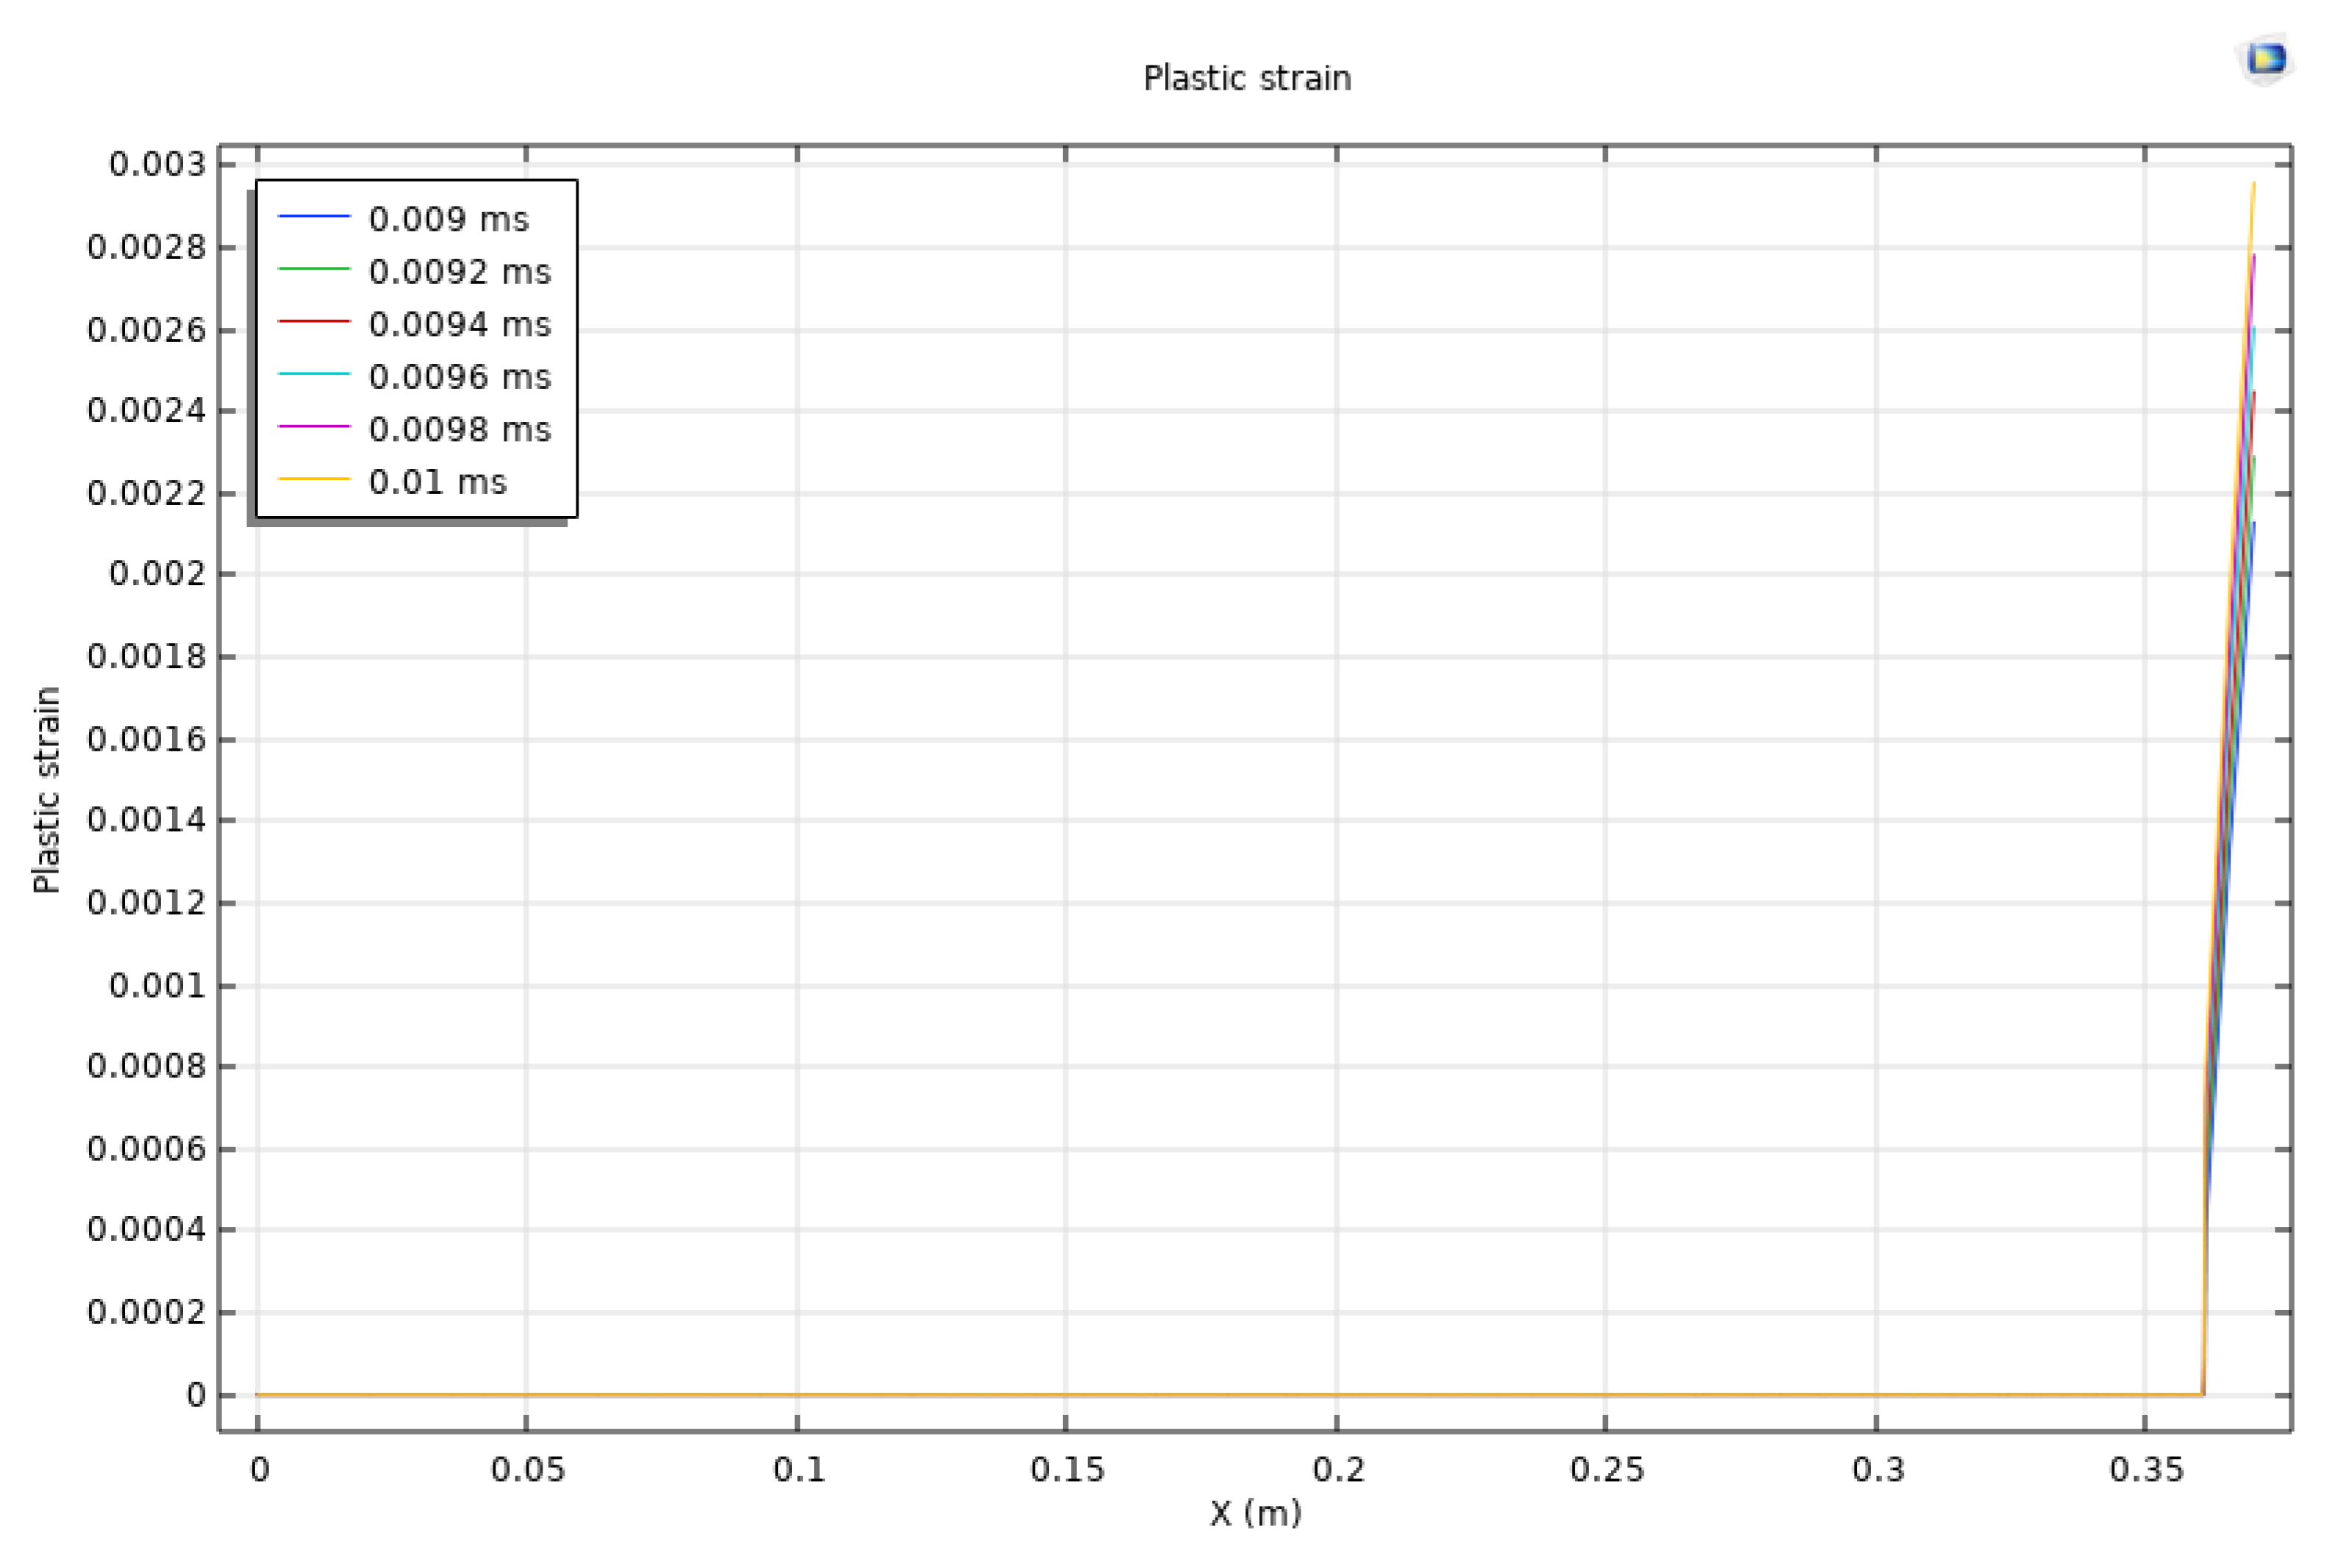
Similarly, the 1D distribution of strain rate in the x direction, acceleration, and plastic strain at 0 ms, 0.002 ms, 0.004 ms, 0.006 ms, 0.008 ms, and 0.01 ms along the monitoring line at y = 2.5 m is plotted in Figure 9. The line at y = 2.5 m is along the center perforation. The strain rate in the x direction shows significant magnitudes near the perforations at and around x=0.35 indicating an obvious compressive state in this region. The strain rate starts near zero at the left boundary at t = 0 ms and rapidly decreases as it approaches the perforations. At 0.01 ms, the strain rate reaches -400 1/s, suggesting intense deformation tendency. The change in strain rate over time indicates the propagation of stress waves and the resultant heterogeneous strain responses in the near-perforation rocks. The acceleration magnitude along the monitoring line exhibits a sharp increase near the perforations, which indicates the fast response of the reservoir rock to the dynamic boundary loading. It is noted that high acceleration magnitudes are concentrated near the perforations. The plastic strain distribution is also plotted along the monitoring line at later time steps. The plastic strain is negligible across most of the domain but shows a steep increase near the perforations. This increase indicates irreversible deformation localized around the perforations. However, the temporal evolution is not very significant in this scenario.
Figure 9.
Strain rate in the x direction and acceleration magnitude are plotted at 0 ms, 0.002 ms, 0.004 ms, 0.006 ms, 0.008 ms, and 0.01 ms. The plastic strain is plotted at 0.009 ms, 0.0092 ms, 0.0094 ms, 0.0096 ms, 0.0098 ms, and 0.01 ms. The monitoring line is at y = 2.5 m in scenario 3.
Figure 9.
Strain rate in the x direction and acceleration magnitude are plotted at 0 ms, 0.002 ms, 0.004 ms, 0.006 ms, 0.008 ms, and 0.01 ms. The plastic strain is plotted at 0.009 ms, 0.0092 ms, 0.0094 ms, 0.0096 ms, 0.0098 ms, and 0.01 ms. The monitoring line is at y = 2.5 m in scenario 3.
