Preprint
Article

Influence of Flow Channel Structural Parameters on the Hy-draulic Performance and Anti–clogging Performance of Variable Flow Emitters

Altmetrics

Downloads

62

Views

35

Comments

0

A peer-reviewed article of this preprint also exists.

This version is not peer-reviewed

Submitted:

09 August 2024

Posted:

10 August 2024

You are already at the latest version

Alerts
Abstract
Variable flow emitters are a new type of emitter for underground drip irrigation that are used in locations where soil moisture is difficult to transport to the surface, which leads to crop emer-gence difficulties. The flow channel structure parameters of emitters affect the hydraulic per-formance of the emitter and its anticlogging ability. In this study, the variable flow emitter at the conventional low–flow water supply stage is taken as the research object. A combination of CFD numerical simulation of a two–phase flow of water and sand and clear water testing of test samples is applied to study the influence laws of 10 groups of variable flow emitter structural combinations on the effluent flow rate (q), flow index (x), particle passage rate and flow field inside the flow channel. The results show that the Realizable k–ε turbulence model can be used to simulate the flow field inside the variable flow emitter flow channel. The nRMSE between the measured and simulated values of q is 11.23%, and the relative error between the measured and simulated values of x is 4.66%, which gives a high simulation accuracy. The polar analysis shows that the tooth angle A has the smallest effect on the effluent flow rate q0.1 under 0.1 MPa, x, and particle passage rate of the variable flow emitter. The depth of the flow channel D, the spacing of the teeth B, and the height of the teeth E have a different order of precedence in the influence of the three indices, which are D > B > E > A, B > E > D > A, and E > B > D > A, respectively. The value of particle passage rate is positively correlated with the mean flow velocity (v) and the mean turbulent kinetic energy (k) in the flow channel, and particle passage rate tends to increase and then decrease with the increase of x. The retention time (t) of the particles in the flow channel is closely related to the magnitude of v and k. Three multivariate linear regression equations (R2 = 0.883 ~ 0.995) were constructed for q0.1, x, and particle passage rate versus the flow channel structural parameters. Using the scipy.optimize.minimize function in Python, we de-termined the three optimal combinations of flow channel structural parameters corresponding to better hydraulic performance: q0.1 is 1.5 or 2 L/h (objective function y = min x), better clogging resistance (y = max particle passage rate), and both (y = min (0.5 x - 0.5 particle passage rate)). The research results can provide a ref-erence for the optimal design of variable flow emitters.
Keywords: 
Subject: Biology and Life Sciences  -   Agricultural Science and Agronomy

1. Introduction

Subsurface drip irrigation (SDI) buried in the soil, in addition to integrating the existing surface drip irrigation technology that has achieved labor savings and automatic irrigation, provides the right amount of irrigation at the right time with outstanding advantages. SDI reduces the evaporation surface area, inhibits weed growth, reduces the risk of soil contamination and crop pests and diseases, extends the service life of the pipeline network without the need to replace the pipeline system every year, and other significant advantages. SDI is the existing irrigation technology with the greatest water–saving potential and is one of the most obvious ways to increase production and improve quality [1,2,3,4,5]. In recent years, SDI has been widely studied in Northwest China [5,6], North China [7,8], and South China [9], but the following problems exist: (1) To avoid soil tillage damage to SDI systems, it is necessary to bury the SDI systems below the soil tillage layer [10]; additionally, the upward transport of soil moisture is less than the downward transport due to gravity [11], which causes delayed crop emergence or nonemergence of seedlings, leading to reduced yields [12,13,14]. (2) Compared with center pivot sprinklers, SDI systems must operate for more than 7 years to be economically competitive [15], which implies a substantial increase in the risk of emitter clogging. The enhancement of emitter clogging resistance in SDI systems is critical.
In response to problem (1), Mo et al. [16] proposed a variable flow emitter for SDI that automatically switches the operating phase according to the inlet pressure to achieve a step change in the outlet flow rate. A regular outlet flow rate of 1–2 L/h is provided during working stage I (regular flow water supply stage), which is used to supply water to the crop during most of its reproductive period. In work stage II (high–flow water–supply stage), by increasing the water–supply pressure, a stepwise increase in the water–output flow rate is realized, which promotes the upward movement of soil moisture, improves the soil moisture environment of the seed bed, and thus promotes seedling emergence. Gao et al. [17] took a variable flow emitter as the research object to study its hydraulic performance response law (flow rate and flow index) to the parameters of the runner structure and determined the optimal combination of the runner structure corresponding to the outlet flow rate of 1.5 L/h at 0.1 MPa by using the traversal optimization algorithm. However, scholars have neglected the influence of a variable flow emitter runner structure on anti–clogging performance.
The hydraulic performance of the emitter determines the uniformity of water and fertilizer application in the whole drip irrigation system [18,19]. The flow rate (q) and flow index (x) are the two main hydraulic performance indices of the emitter, and a smaller x corresponds to a lower sensitivity of the emitter effluent flow rate to the inlet pressure and a greater laying distance [20,21,22]. Some scholars studying tooth–shaped runner emitters have reported that the runner width, number of cells, runner depth, and tooth height all have significant effects on q [23], that the q of tooth–shaped emitters increases with increasing tooth turning angle and tooth spacing, that the tooth width has a greater effect on q than does the bottom pitch of the tooth [24,25], and that q is positively correlated with the tooth tip angle and the tooth tip covariance and negatively correlated with the cusp angle and cusp parameter [26,27]. Moreover, most scholars have used hydraulic performance tests and numerical simulations to investigate the primary and secondary order of the influence of the flow channel structural parameters on x. For serrated runner emitters, the primary order is tooth spacing > tooth angle > tooth height > runner depth [28]. The primary order of the structural parameters affecting x changes when the structural parameter takes a different range of values, e.g., tooth base pitch > tooth height > tooth width[29], runner depth > tooth height > tooth angle > tooth base pitch [30]. For trapezoidal runner emitters, the primary order is runner width > number of runner cells > angle > runner depth [31,32]. For orthogonal labyrinth runners, x is minimized when the intertooth angle is 70° [27].
Reducing q is an important way to increase the length of drip tape laying and reduce the investment in drip irrigation systems per unit area [33,34]. Most drip irrigation equipment manufacturers reduce q only by reducing the depth of the flow path, but this drastically increases the risk of emitter clogging. According to the FAO, the probabilities of physical, chemical and biological clogging in the process of emitter clogging are 31%, 22% and 37%, respectively. Gilbert et al. [35] reported that 55% of emitter clogging is caused by physical factors, with physical clogging caused by solid particles being the most common form [36,37]. Numerous scholars have adopted laser Doppler velocimetry (LDV), particle image velocimetry (PIV), particle tracking velocimetry (PTV), computational fluid dynamics (CFD) and other methods to visualize the operation of particles inside the emitter flow channel and to analyze the response laws of the water flow velocity, turbulent kinetic energy in the flow channel, turbulent kinetic energy dissipation rate, and particle passage rate with the structural parameters of the emitter flow channel to increase the ability of the emitter to resist physical clogging. For rectangular and serrated runner emitters, some scholars have applied CFD two–phase flow numerical simulations and PIV technology to analyze the velocity vector, streamline distribution, and particle trajectory of the fluid, pointing out that the tip of the tooth is the most serious region of turbulent kinetic energy dissipation and that the low–speed vortex region at the sharp corners is the focus of the clogging location [38,39]. The clogging resistance of the emitters tends to decrease with increasing runner angle, and the emitters corresponding to a 60° angle were more resistant to clogging [40]. Yu et al. [41,42] used a combination of CFD‒DEM coupled numerical simulation and LS–CWM laser particle sizer tests to analyze the movement of particles in a flow channel. They proposed that increasing the flow velocity in the low velocity zone of the flow channel and the eddy zone can strengthen the ability of water scouring and sand hostage, reduce the risk of solid particle deposition in the flow channel, and reduce the probability of clogging the emitter. The resistance of toothed runners to clogging was better than that of trapezoidal and triangular runners [43]. For rectangular emitter runners, a runner with an internal tooth width × internal tooth height of 0.8 mm × 0.5 mm has the best clogging resistance [44].
These studies focused on the hydraulic performance and anti–clogging performance of the emitter, and few studies have focused on the optimization of the emitter runner structure while comprehensively considering these two properties. Wang [45] constructed a multiobjective optimization model of flow channel structural parameters for a bidirectional flow channel emitter with the optimization objectives of minimizing the steady flow index and maximizing the sediment particle passage rate and used an algorithm combining NSGA–II and a support vector machine to determine the distance between the diverter device and the sidewall, the tooth tip spacing from the retainer device, and the spacing between the retainer device and the sidewall at a rated flow rate of 3.0 L/h. Ensure an optimal combination of key structural parameters. Currently, the common intelligent optimization algorithms for mining the functional relationship between the objective function and each constraint parameter in optimization problems include the genetic algorithm (GA), particle swarm optimization algorithm (PSO), and ant colony algorithm (ACO) [46,47]. Compared with intelligent optimization algorithms, solving constrained optimization problems using the scipy.optimize.minimize function in Python is efficient and numerically stable and has been widely used in problems such as risk assessment in emergency decision–making for typhoon disasters [48], benefit distribution in military supply chains[49], and optimization of overhauling equipment in coal mining enterprises [50], and this function is widely used and more suitable than other methods for addressing common optimization problems.
The flow rate of commonly used emitters in China is 1 ~ 2 L/h [51,52], and the difficulty of improving the anti–clogging performance of emitters gradually increases as q decreases. In addition, for the new variable flow emitters, studying how to quickly determine the combination of flow channel structure parameters for scenarios such as better hydraulic performance, better clogging resistance, and better performance for a specific small flow rate is urgently needed. In this study, the variable flow emitter is taken as the research object, with the help of an orthogonal test to set up the tooth–shaped flow channel composed of different tooth heights (E), tooth spacings (B), tooth angles (A) and tooth depths (D). The sample is precision machined by CNC. The hydraulic and anticlogging performances of its working stage I are explored through numerical simulation and indoor tests. In addition, the evaluation indices of hydraulic and anticlogging performances are constructed with the structure. At the same time, a quantitative characterization mathematical model of hydraulic performance and anticlogging performance evaluation indices and structural parameters are constructed, and the optimized combination of structural parameters of the variable flow emitter flow channel under different scenarios is obtained by using the scipy.optimize.minimize function in Python.

2. Materials and Methods

2.1. Principle of Operation of a Variable Flow Emitter

When the pressure at the inlet of the variable flow emitter is less than the design step pressure, the water flow can only move in the flow channel of the emitter core, and the variable flow emitter is in the stage of regular flow water supply, i.e., working stage I, and the water supply flow rate is q0.1 (Figure 1a). When the inlet pressure is greater than the design step pressure, the pressure of the water flow in the flow channel of the core body makes the elastomer in the cavity formed by the emitter shell and the core body expand and deform, and the elastomer breaks away from the flow channel. When the elastomer is detached from the flow channel, the cross–section of the overflow channel suddenly increases, and the water flow rate from the emitter increases stepwise. This working stage is the high–flow water supply stage, i.e., working stage II, and the water supply flow rate is qmax (Figure 1b). Variable flow emitters are suitable for subsurface drip irrigation systems [17], with working stage I during most of a crop's reproductive period. They use working stage II during the seedling emergence period to accelerate the upward rate of soil moisture transport by increasing the water flow rate, improving the surface soil moisture environment, and promoting crop emergence.
In working stage I, the use of smaller flow rate emitters (q0.1 < 1.5 L/h) can increase the ultimate laying length of drip irrigation tape and reduce the amount of branch pipe and construction costs, which has received extensive attention from domestic and foreign scholars and drip irrigation equipment manufacturers in recent years. We often reduce q0.1 by reducing the size of the flow channel above the water cross section, but the risk of clogging the emitter increases with decreasing size of the flow channel [53,54]. Therefore, in this study, performance tests and structural optimization were carried out to test the hydraulic characteristics and clogging resistance of the emitter during the water supply phase at regular flow rates.

2.2. Experimental Design

The variable flow emitter core used in this study consists of three toothed runners (a, c, e) and two curved runners (b, d), with the toothed runners a, c, and e distributed around the axis of the core and connected by curved runners b and d. The water movement direction is left inlet → a → b → c → d → e → right outlet (Figure 2). The total length of the toothed runner is 57.2 mm.
The tooth height (E), tooth spacing (B), tooth angle (A) and runner depth (D) of the toothed runners were selected for the study (Figure 3). Three levels were set for each parameter, which were designed according to the orthogonal test L9(34), totaling nine combinations of runner structure parameters. The variable flow emitter finalized by [17] was added to correct the numerical simulation results with its measured values, which had a q0.1 of 1.5 L/h. The experimental design is detailed in Table 1. The total length of the toothed runners was affected mainly by B. To ensure the same total length of the toothed runners when runners a and c were composed of 11 and 10 toothed units, respectively, B had 1.8 mm, 2.0 mm and 2.2 mm emitters with 9, 6 and 4 toothed units, respectively.

2.3. Hydraulic Performance Tests

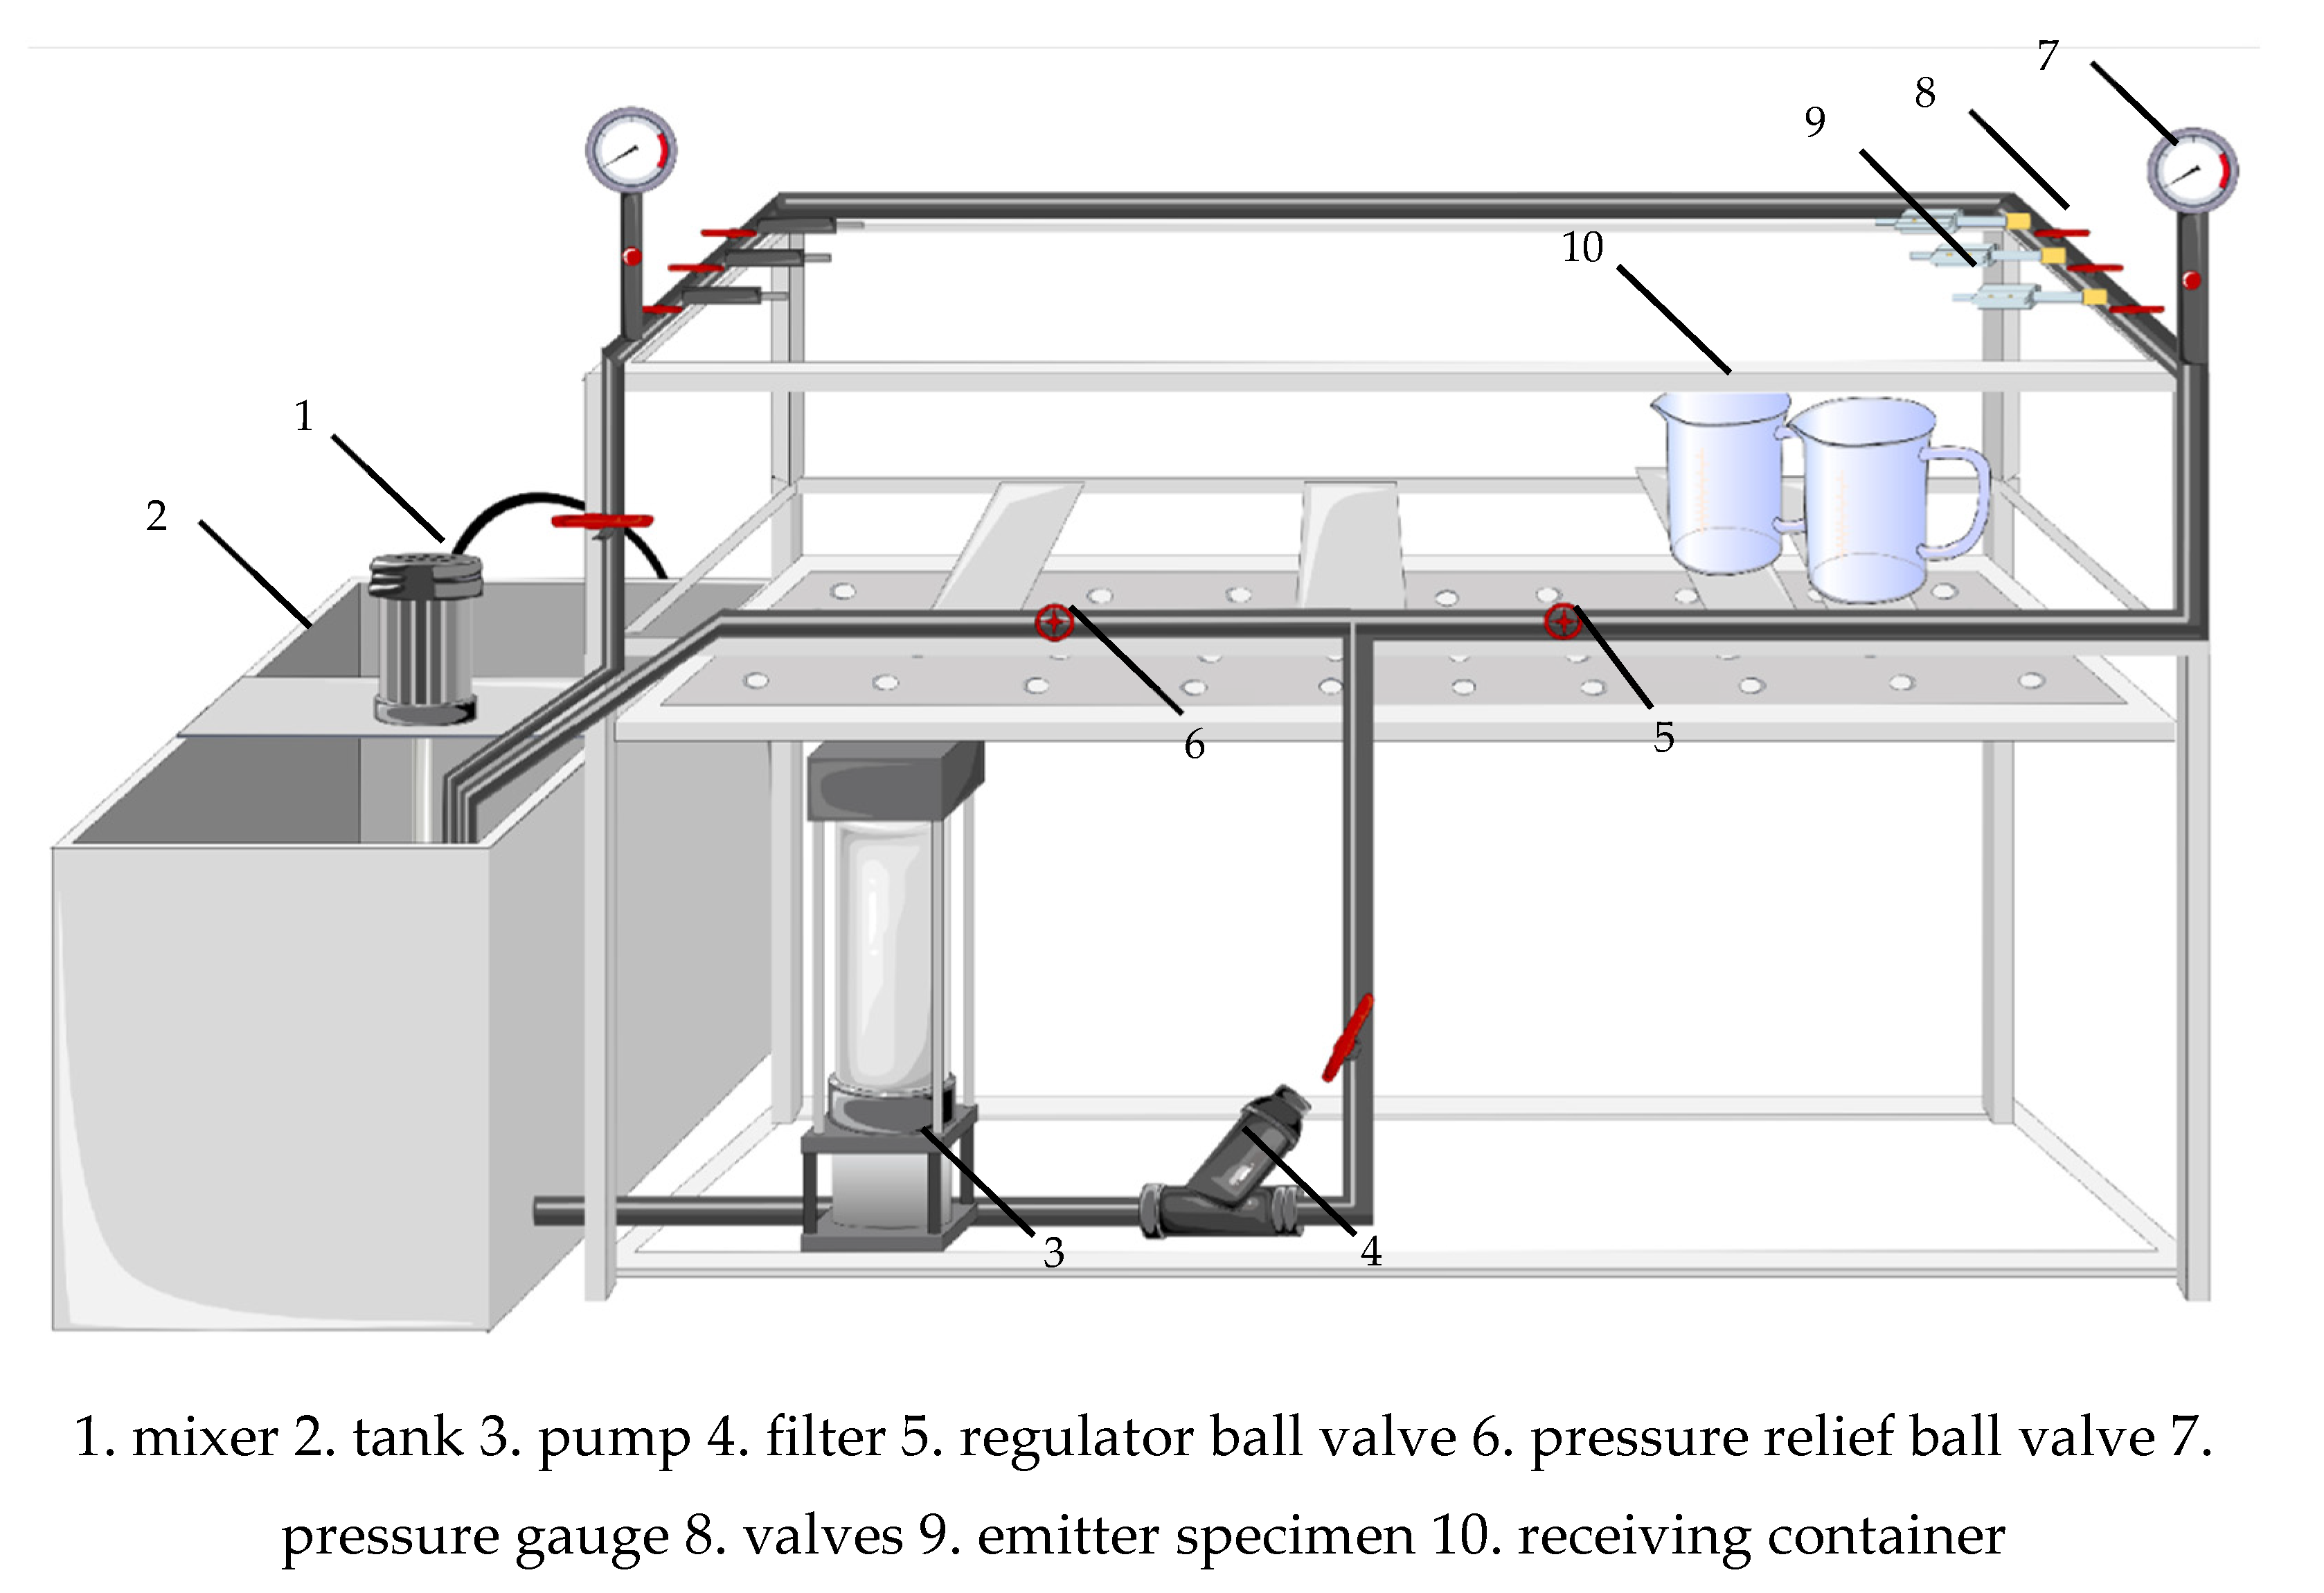
The hydraulic performance test experiment of the variable flow emitter was conducted at the China National Water Saving Irrigation Engineering and Technology Research Center (Beijing, Daxing). The test platform is shown in Figure 4, the test water source is local tap water, and the water temperature is maintained at 23 ± 2 °C. The 10# emitter in Table 1 was machined via a precision five–axis CNC machine (machining accuracy of 0.002 mm) using 304 stainless steel. The elastomer was chosen because it deforms very little and can form a good sealing PTFE hard tube (inner diameter of 4.8 mm, outer diameter of 7.8 mm; Taizhou Qingchen Rubber & Plastic Products Co., Ltd., China) to simulate the variable flow emitter in the regular flow of the water supply stage.
The test steps are as follows: The 10# emitter specimen was installed, the valve was closed, and the water receiving container was placed under the emitter. The water pump was turned on (CDLF4 10, flow rate 4 m³/h, head 0.81 MPa, Southern Pump Co., Ltd., China), and the pressure–regulating ball valve and the pressure relief ball valve were used to set the reading of the pressure gauge (with a range of 0 ~ 0.6 MPa and an accuracy of 0.002 grade) to H (H = 0.04, 0.06, 0.08, 0.10, 0.12, and 0.15 MPa). When the pressure gauge readings stabilized, the valve was opened, and when the water discharge from the emitter stabilized, the water discharge from the emitter was collected with the catchment container. The catchment time was 5 min, the volume was measured with a measuring cylinder (accuracy of 1 mL), the catchment was repeated three times at the same H, and the average was taken to calculate the flow rate q of the water discharge from the emitter.

2.4. Numerical Simulation

To carry out the rapid optimization design of the flow channel structure of the variable flow emitter, this study uses Fluent software to study hydraulic performance indices such as q and the flow index (x) of the variable flow emitter, as well as the response law of the anti–clogging performance indices such as the internal flow velocity (v), the turbulent kinetic energy (k), the particle retention time (t), and the particle passage rate (η) of the variable flow emitter to the structural parameters.

2.4.1. Grid Division

ICEM CFD was used to mesh the fluid region of the variable flow emitter, and an unstructured mesh was selected for the division method. Owing to the long and narrow structure of the three toothed runners and the zigzagging boundary, to simulate the flow of water and sand more accurately, the boundary layer mesh was set to 0.05 mm at runners a, c, and e, the remaining parts were set to 0.1 mm, and the number of meshes was 2.3 ~ 3.6 million.

2.4.2. Simulation Setup for Two–Phase Flow of Water and Sand

The turbulence model for the continuous–phase steady–state calculations was Realizable k–ε with the flow channel inlet pressures H set to 0.04, 0.06, 0.08, 0.10, 0.12, and 0.15 MPa and the outlet pressure H´ set to 0 MPa.
The water–sand two–phase flow simulation was carried out after the continuous–phase steady–state calculation, and the discrete–phase model (DPM) of the Euler‒Lagrange method was selected. The interphase coupling algorithm was used to simulate the effect of the discrete phase (sand) on the continuous phase without considering other additional forces, such as the gradient force, spurious mass force, Saffman uplift force, thermophoretic swimming force, and Basset force. The boundary conditions of the inlet and outlet were set as “escape”, and the wall boundary is set as “reflect”. H was set as 0.10 MPa, H´ was set as 0 MPa, the discrete phase particles were sand and silt, the density of the material was set as 2500 kg/m3, and the diameter of the sand and silt particles was set as 0.05 mm. These particles were injected vertically at the surface of the inlet, and the sand particles were injected into the inlet at the same speed as the flow rate of the inlet water. Considering the particle diffusion caused by the turbulent pulsation of the fluid, a random orbit model was used to track the trajectory of the particles in the flow field under the Lagrangian coordinate system.

2.5 Testing, Simulation and Calculation of Indicators

2.5.1 Emitter Flow and Flow Indices

The hydraulic performance tests under clear water conditions and Fluent simulation can be used to obtain q for emitters with different combinations of flow channel structural parameters at H = 0.04 ~ 0.15 MPa, and the corresponding x can be obtained based on the exponential function relationship between q and H (Equation 1).
q = k H x

2.5.2. Simulation of the Flow Field and Sediment Particle Movement Inside the Emitter Flow Channel

CFD–post was used to monitor the change patterns of fluid flow velocity (v)and turbulent kinetic energy (k) between the trajectory of sediment particles and the position of 1/2 depth of the flow channel. Among them, k is an index that describes the energy in turbulent fluid motion, mainly from time–averaged flow [55], which is driven by Reynolds shear; the larger k is, the more energy is extracted from the time–averaged flow, which is more conducive to promoting the transportation of sand particles in the flow channel, reducing the chances of retaining sand particles inside the flow channel, and improving the anticlogging performance of the emitter [43,56]. The particle movement trajectory is the path of particles moving in the fluid. Through the particle retention time (t), the particle residence distribution in the flow channel and residence time can be determined and then analyzed to obtain the deposition of particles in the flow channel. η is the percentage of the number of particles n flowing out from the outlet of the flow channel to the number of particles N entering the flow channel, which can directly reflect the anti–clogging performance of the emitter [45,57,58].

2.6 Model Validation

The agreement between the simulated and measured values of q corresponding to different H values under clear water conditions was evaluated via the normalized root mean square error (nRMSE), which was calculated as follows:
n R S M E = i = 1 n ( q m q ) 2 n × q a v e 2 × 100 %
The relative error is the relative amount of error between the simulated value and the measured value, which is usually used to indicate the accuracy of the simulation results, and its calculation equation is as follows:
R e l a t i v e   E r r o r = q m q q m × 100 %
In Equation (2) and (3), qm and q are the measured and simulated values when the system inlet pressure is Hi, respectively; qave is the average of the measured values; and n is the number of measured values. When nRMSE ≤ 10%, the simulation accuracy is very high; when 10% < nRMSE < 20%, the simulation accuracy is high; when 20% ≤ nRMSE ≤ 30%, the simulation accuracy is fair; and when nRMSE > 30%, the simulation accuracy is poor [59,60].

2.7. Data Analysis

The degree of influence on the indicators by the change in the level of the test factor can be obtained via extreme difference analysis to determine the optimal level of the factor and obtain the primary and secondary order of the influence indicators [61]. Based on the mathematical regression models of hydraulic performance indices (q0.1, x) and anticlogging performance indices (η) with runner structural parameters (E, B, A, D), the optimized combination of runner structural parameters to meet different demands can be quickly determined via the scipy.optimize.minimize function.
In the model, P < 0.05 means that the effect of the regression coefficients of the test factors on the regression equation of the indicator reached the level of significance, and P > 0.05 means that the effect of the test factors on the regression equation of the indicator did not reach the level of significance. All the data were analyzed via IBM SPSS Statistics 26 (International Business Machines Corporation, USA) and plotted via Microsoft Office Excel 2016 (Microsoft Corporation, USA) software.

3. Results

3.1. Model Validation

The qm and q values of 10# emitter at H = 0.04 ~ 0.15 MPa under clear water conditions are shown in Table 2. nRMSE of the measured and simulated values is 11.23%, Relative Error is 5.65% ~ 14.98%, the relative error of the measured value of the flow index xm and the simulated value of x is 4.8%, and the clear water conditions have a high Fluent simulation accuracy.

3.2. Hydraulic Performance of Emitters

The q0.1 values of variable flow emitter volumes from 1# to 9# ranged from 1.05 to 2.22 L/h, and x ranged from 0.487 to 0.515, with x being the smallest for the 4# and 8# emitters and the largest for 6# emitter (Table 3).
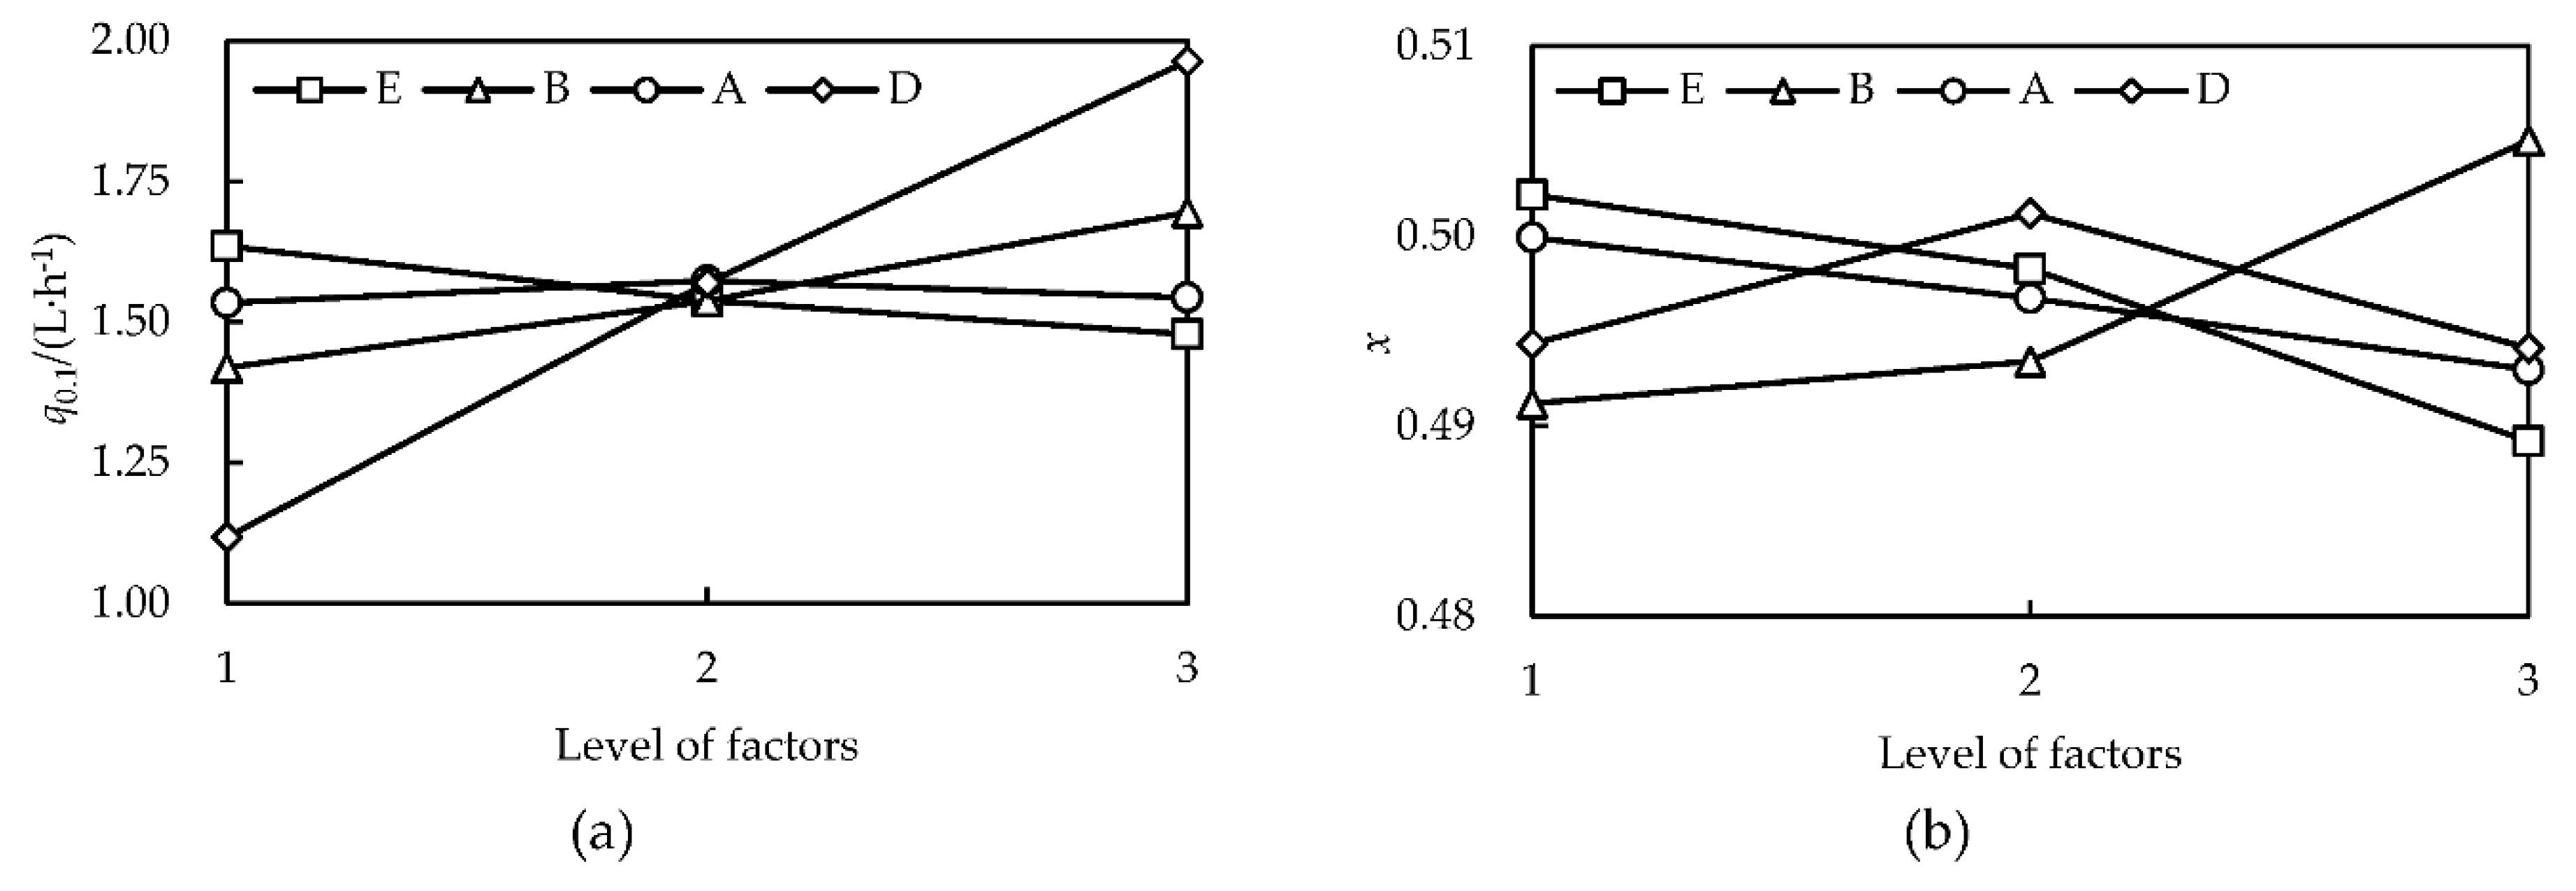
The extreme difference analysis of the hydraulic performance of the emitter is shown in Table 4. A larger R value indicates that a change in this test factor within the design range will lead to a greater change in the numerical value of the test index and a greater degree of influence of this factor on the hydraulic performance of the emitter. The order of influence of each factor on q0.1 is D > B > E > A, and the order of influence on x is B > E > D > A. Factor A is at the end of the order of influence of the two indicators, and its influence on the hydraulic performance of the emitter is the smallest.
Taking the test factors as the horizontal coordinates and the test indices as the vertical coordinates (Figure 5), q0.1 was negatively correlated with E, positively correlated with B and D, and changed less with A. x was positively correlated with B, negatively correlated with E and A, and tended to increase and then decrease with D. The results are summarized as follows.

3.3. Flow Field and Particle Motion Characteristics Inside the Emitter Flow Channel

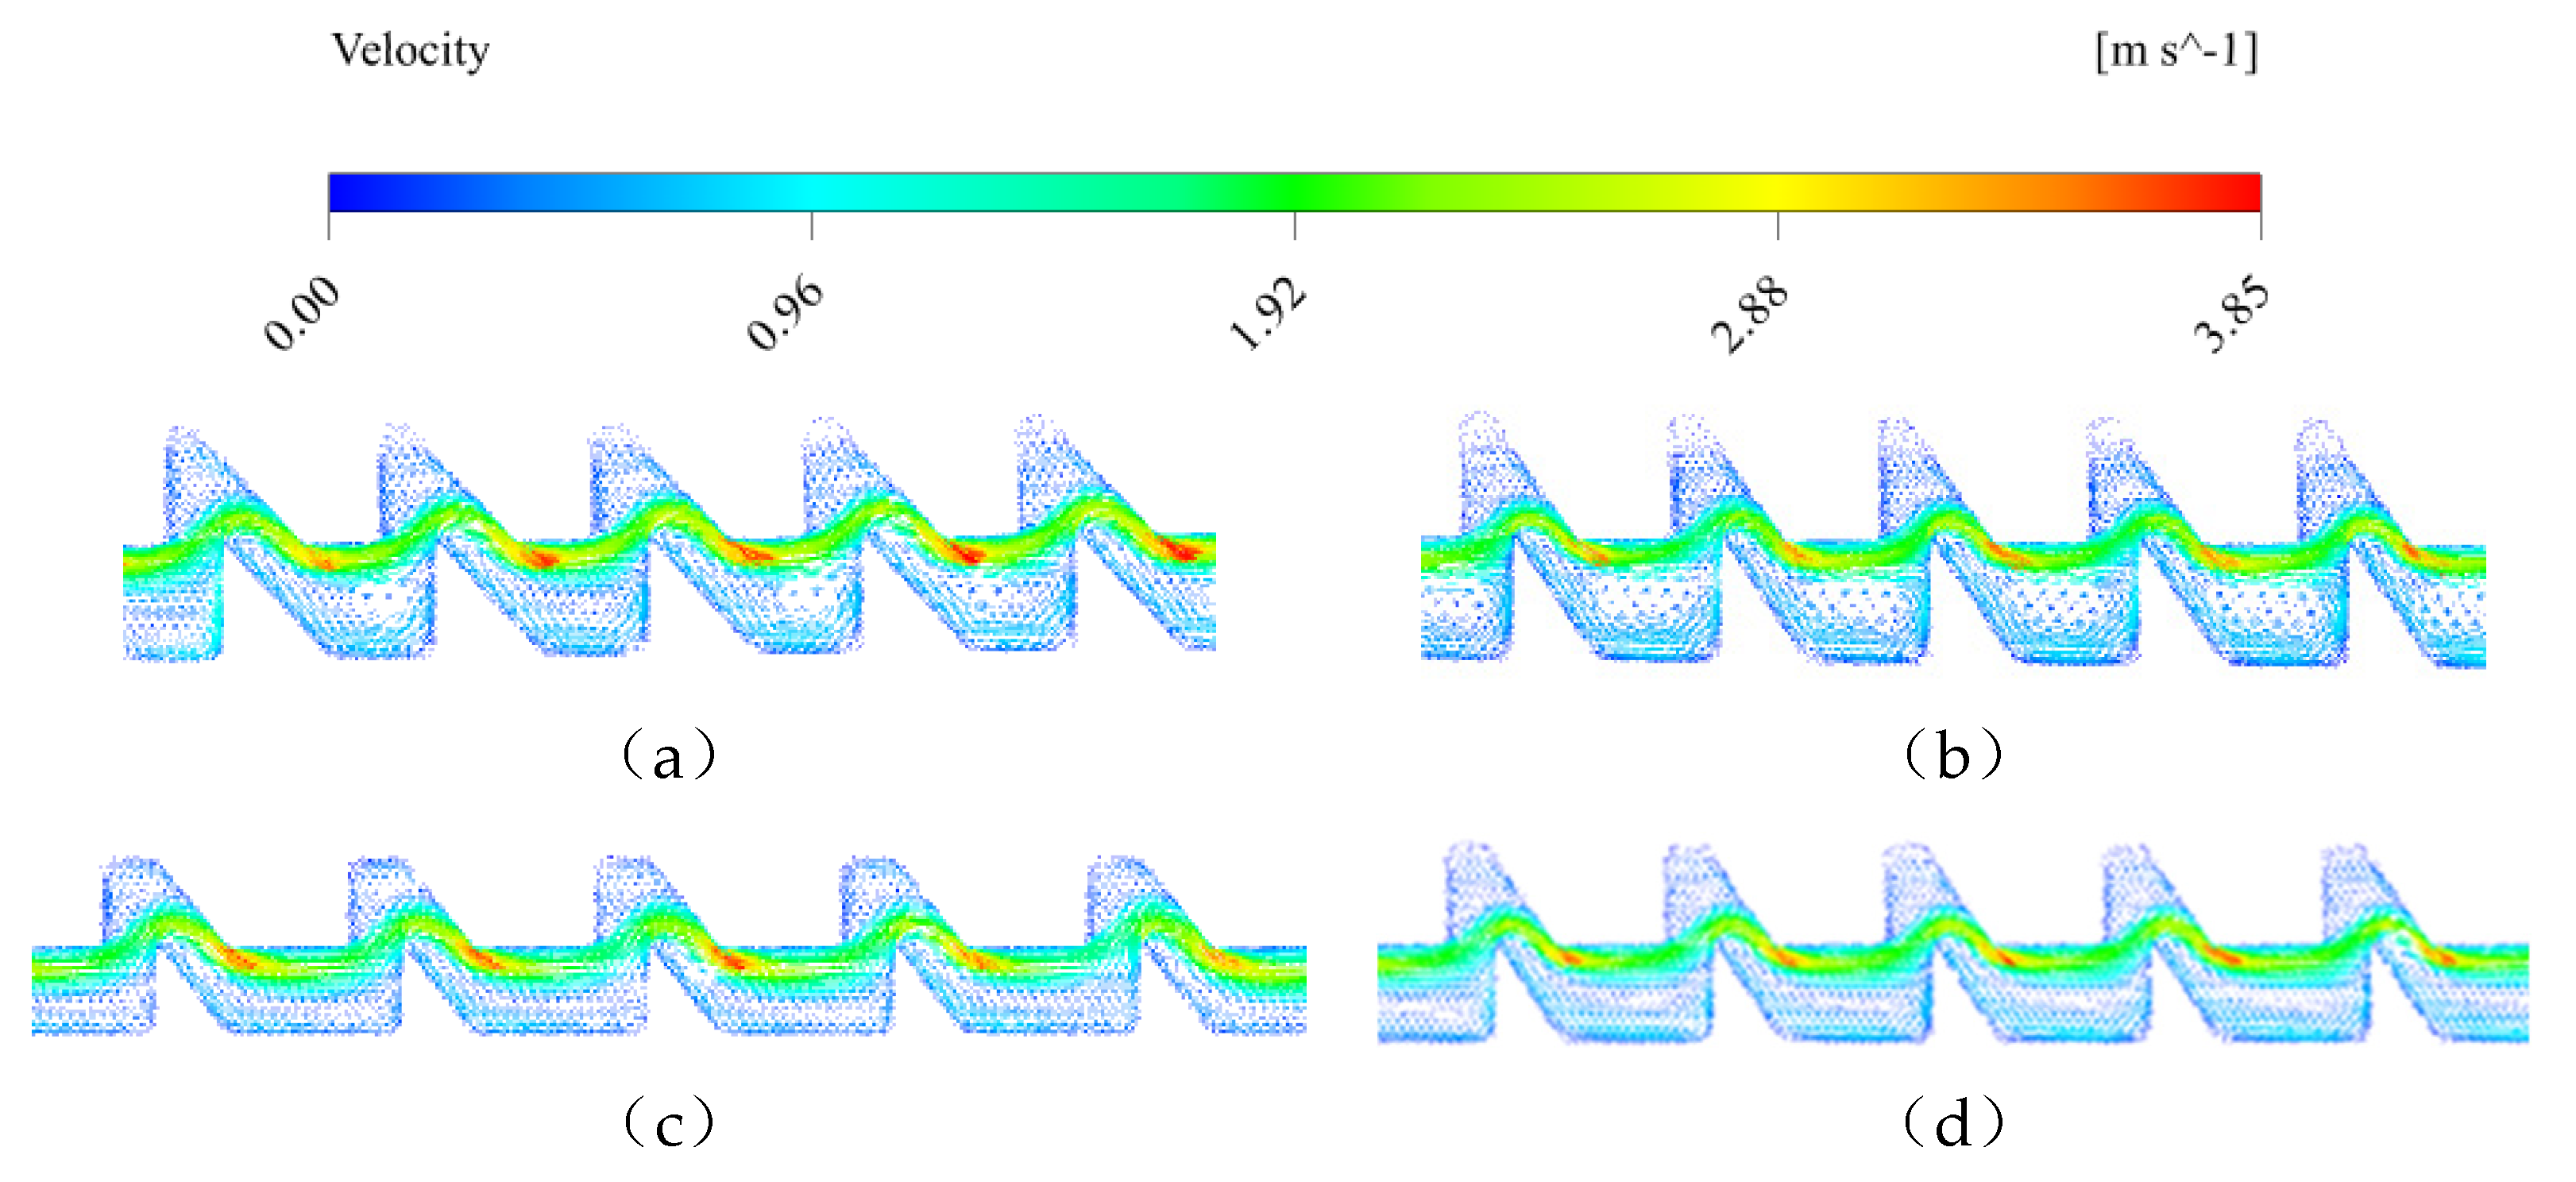
The flow velocity vector distributions of the 4# emitters (q0.1 = 1.81, x = 0.487) and 8# emitters (q0.1 = 1.86, x = 0.487), which had the smallest x, as well as the 3# emitters (q0.1 = 2.22, x = 0.508) and the 6# emitters (q0.1 = 1.69, x = 0.515), which had x > 0.50, were selected for the deeper 1/2 position of runner a. Starting from the 3rd runner cell at the inlet of runner a, 5 runner cells were taken for local analysis (Figure 6). The distribution law of the flow velocity vector in each runner unit was similar: the main flow area was concentrated mainly near the tooth tip on the water surface, which presented peak and trough flow states under the influence of the runner structure. At the same time, owing to the role of its own inertia, the peak and trough of the fluid and the toothed structure of the runner tended to follow each other. The maximum flow velocities vmax of these four groups of emitters were 3.49, 3.35, 3.85, and 3.73 m/s, respectively; the average flow velocity v was 0.701, 0.656, 0.799, and 0.704 m/s, respectively; and the order was 3# > 6# > 4# > 8#.
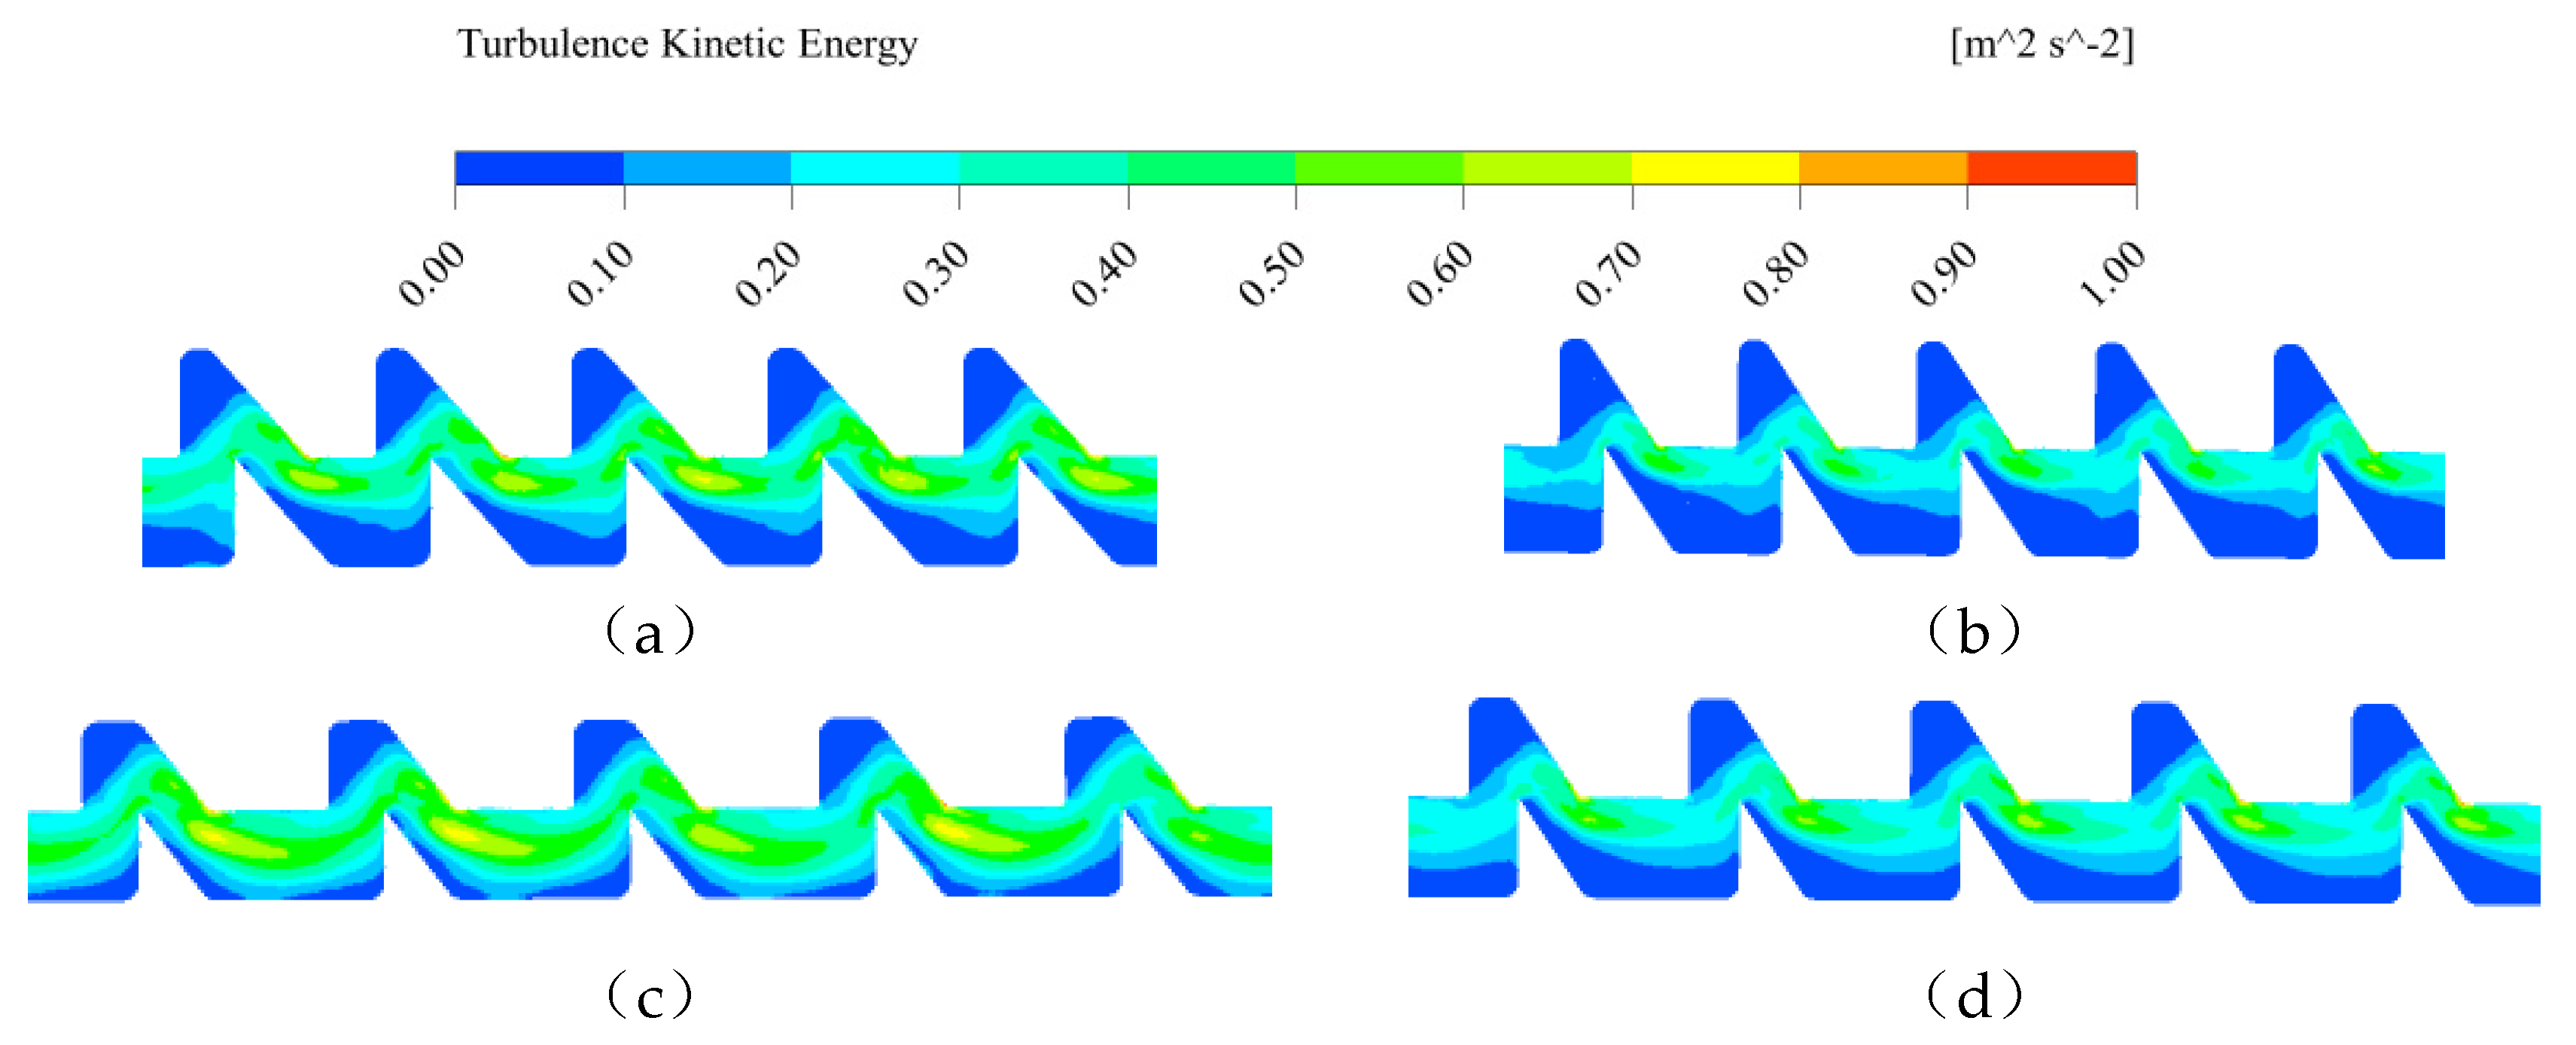
The turbulent kinetic energy distribution of the 4 groups of emitters at the deep 1/2 position of the runner structure is shown in Figure 7. The low turbulent kinetic energy (< 0.1 m2/s2) flow area was mainly at the bottom of the runners at the baffle wall surface and the tooth corners. The 3# emitter had the smallest area of low turbulent kinetic energy flow area in runner a. The area of the turbulent kinetic energy of the various emitters that was less than 0.1 m2/s2 was 44.05%, 52.57%, 22.42%, and 40.55%, and the order was 8 # > 4 # > 6 # > 3 #. High turbulent kinetic energy accounted for a larger proportion of 6 #, and 3 # runner tooth spacing was the same as that of the other 2.2 mm emitters. The average turbulent kinetic energy k values for 4 #, 8 #, 3 #, and 6 # in runner a were 0.170, 0.142, 0.227, and 0.172 m2/s2, and the order was 3 # > 6 # > 4 # > 8 #.
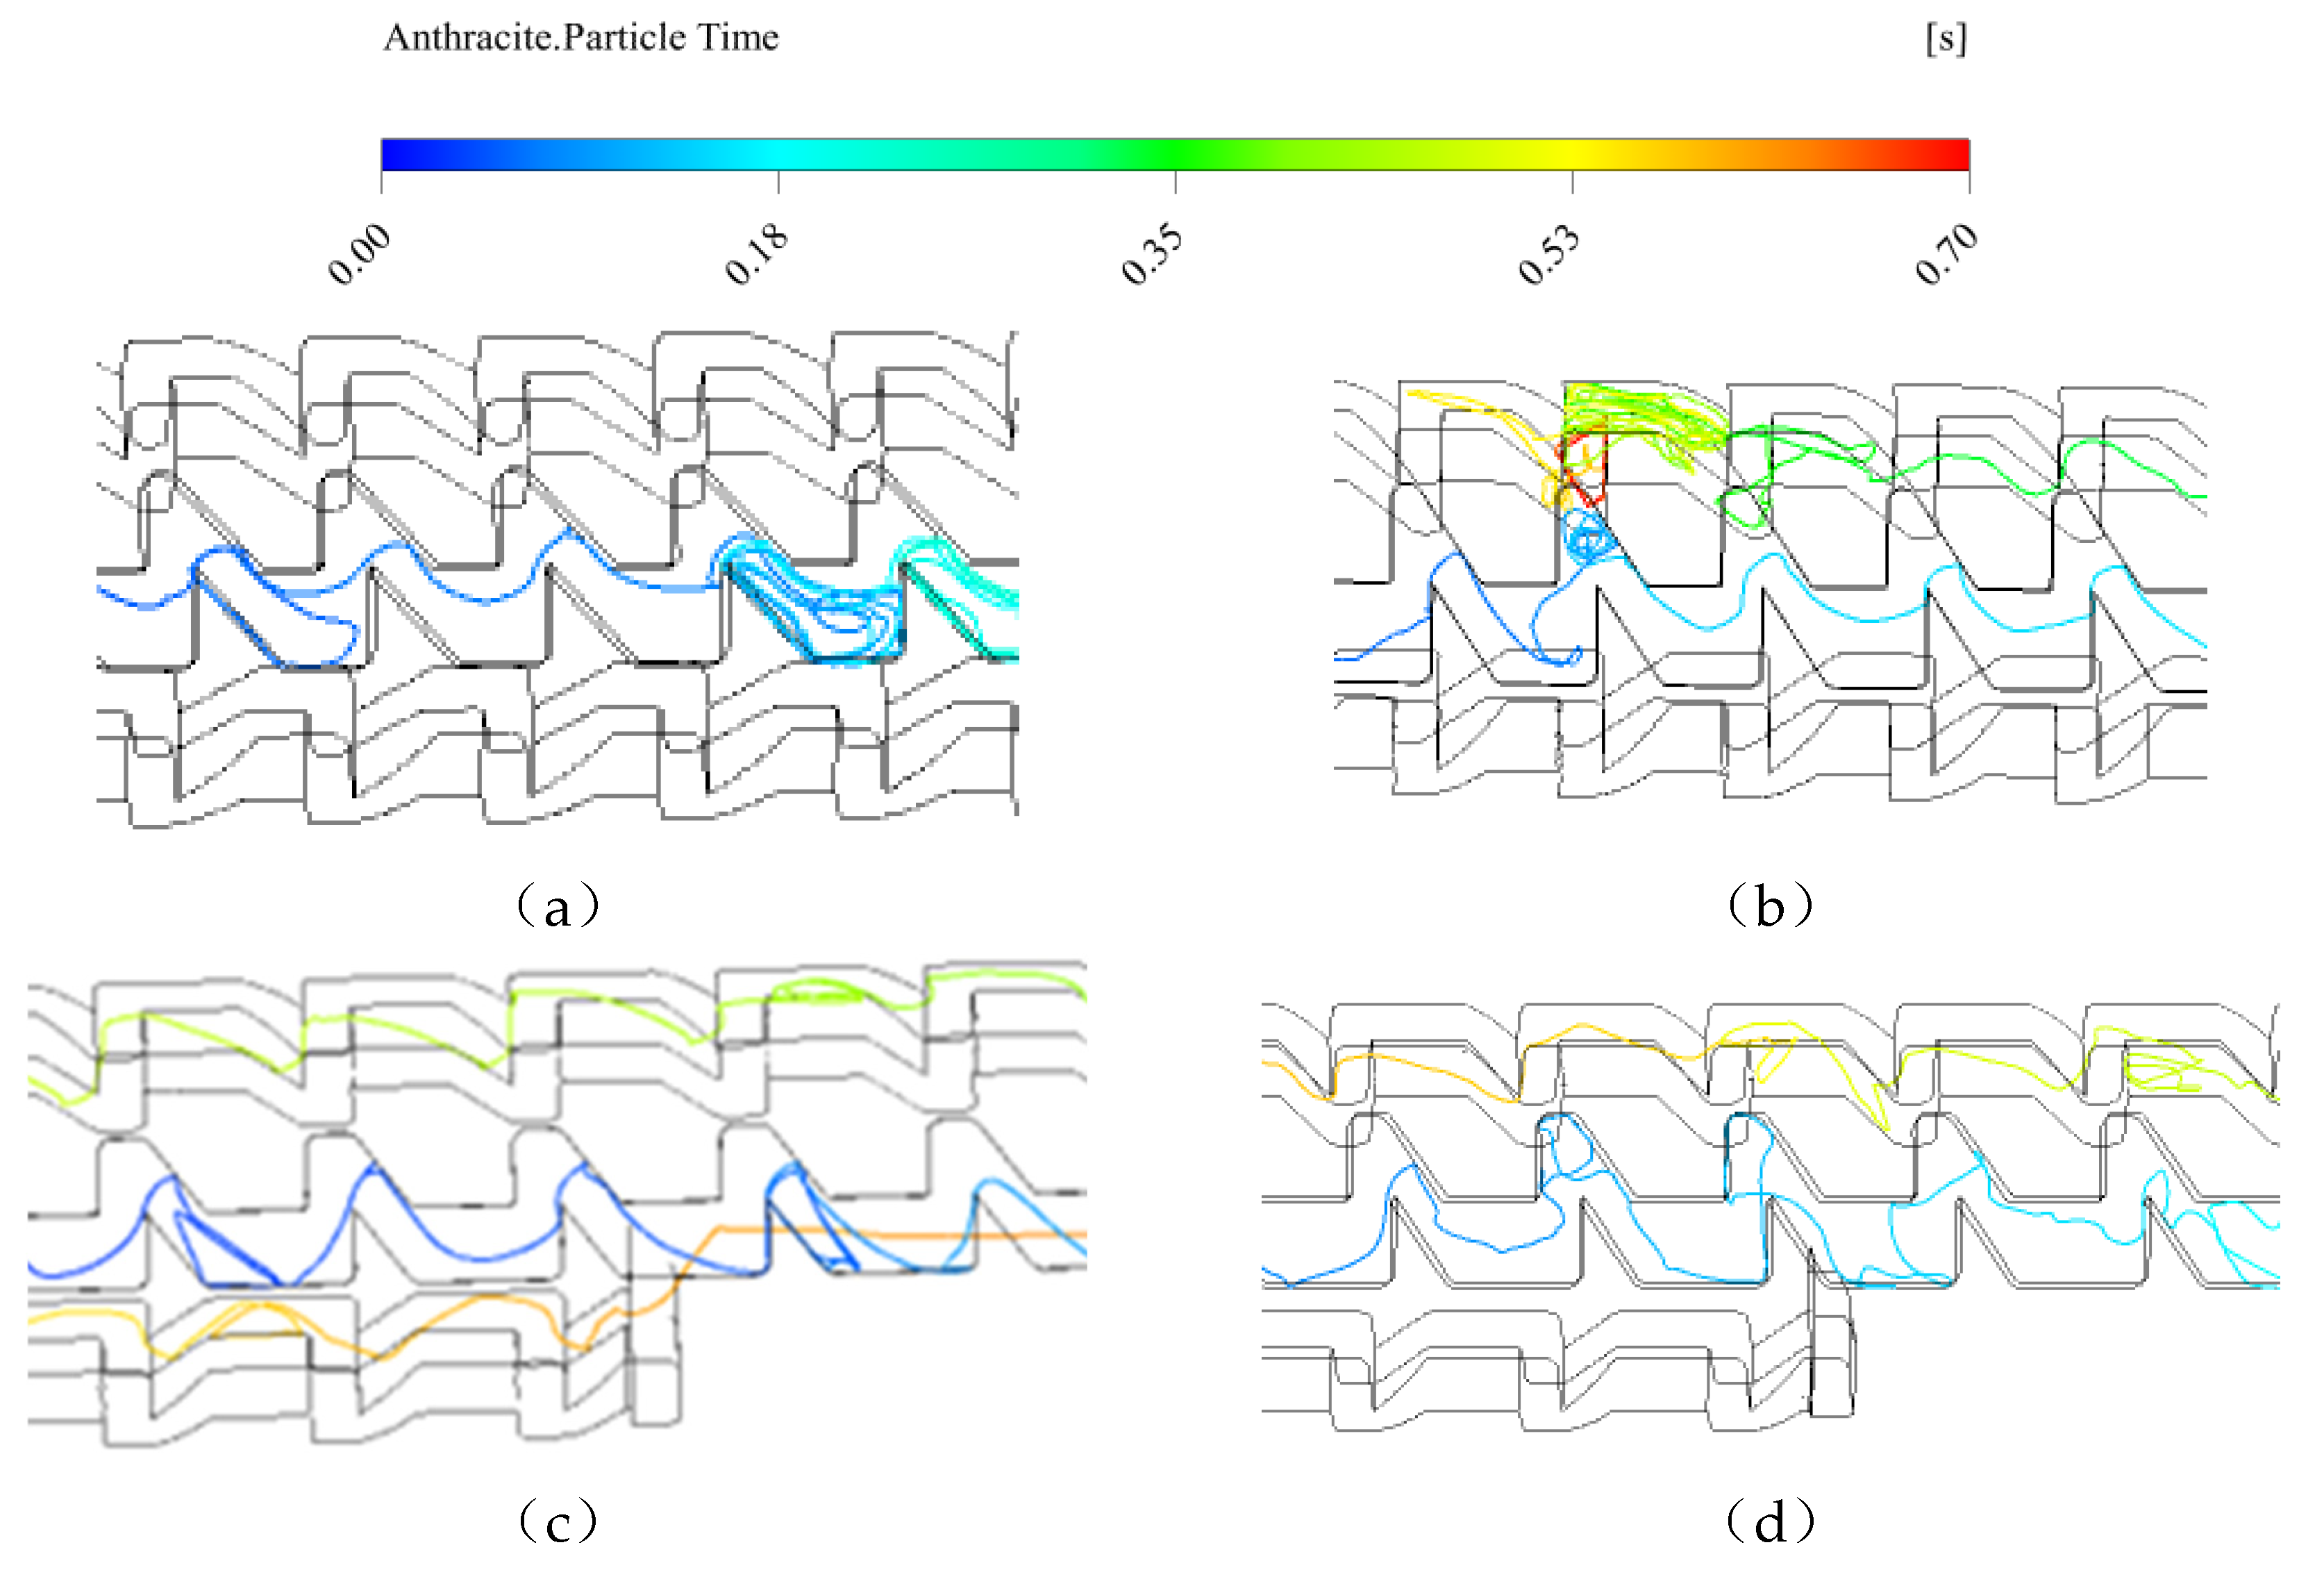
The particle motion trajectory of a single particle in the localized flow channel of four groups of emitters with different variable specifications is shown in Figure 8. The retention time of the particles in the flow channel increases with increasing particle motion distance in the flow channel. The particles appeared to turnover more when entering the 4# and 8# emitters, the particle motion turnover in the 4# emitter was near the bottom water retaining wall surface, and the particle motion turnover in the 8# emitter appeared at the tip of the tooth. The maximum retention times t corresponding to the particle motion trajectories in runners 4#, 8#, 3#, and 6# were 0.44, 0.52, 0.18, and 0.41 s, respectively, in the following order: 3# < 6# < 4# < 8#.

3.4. Analysis of the Relationship between the Anti–Clogging Performance and Hydraulic Performance of Water Emitters

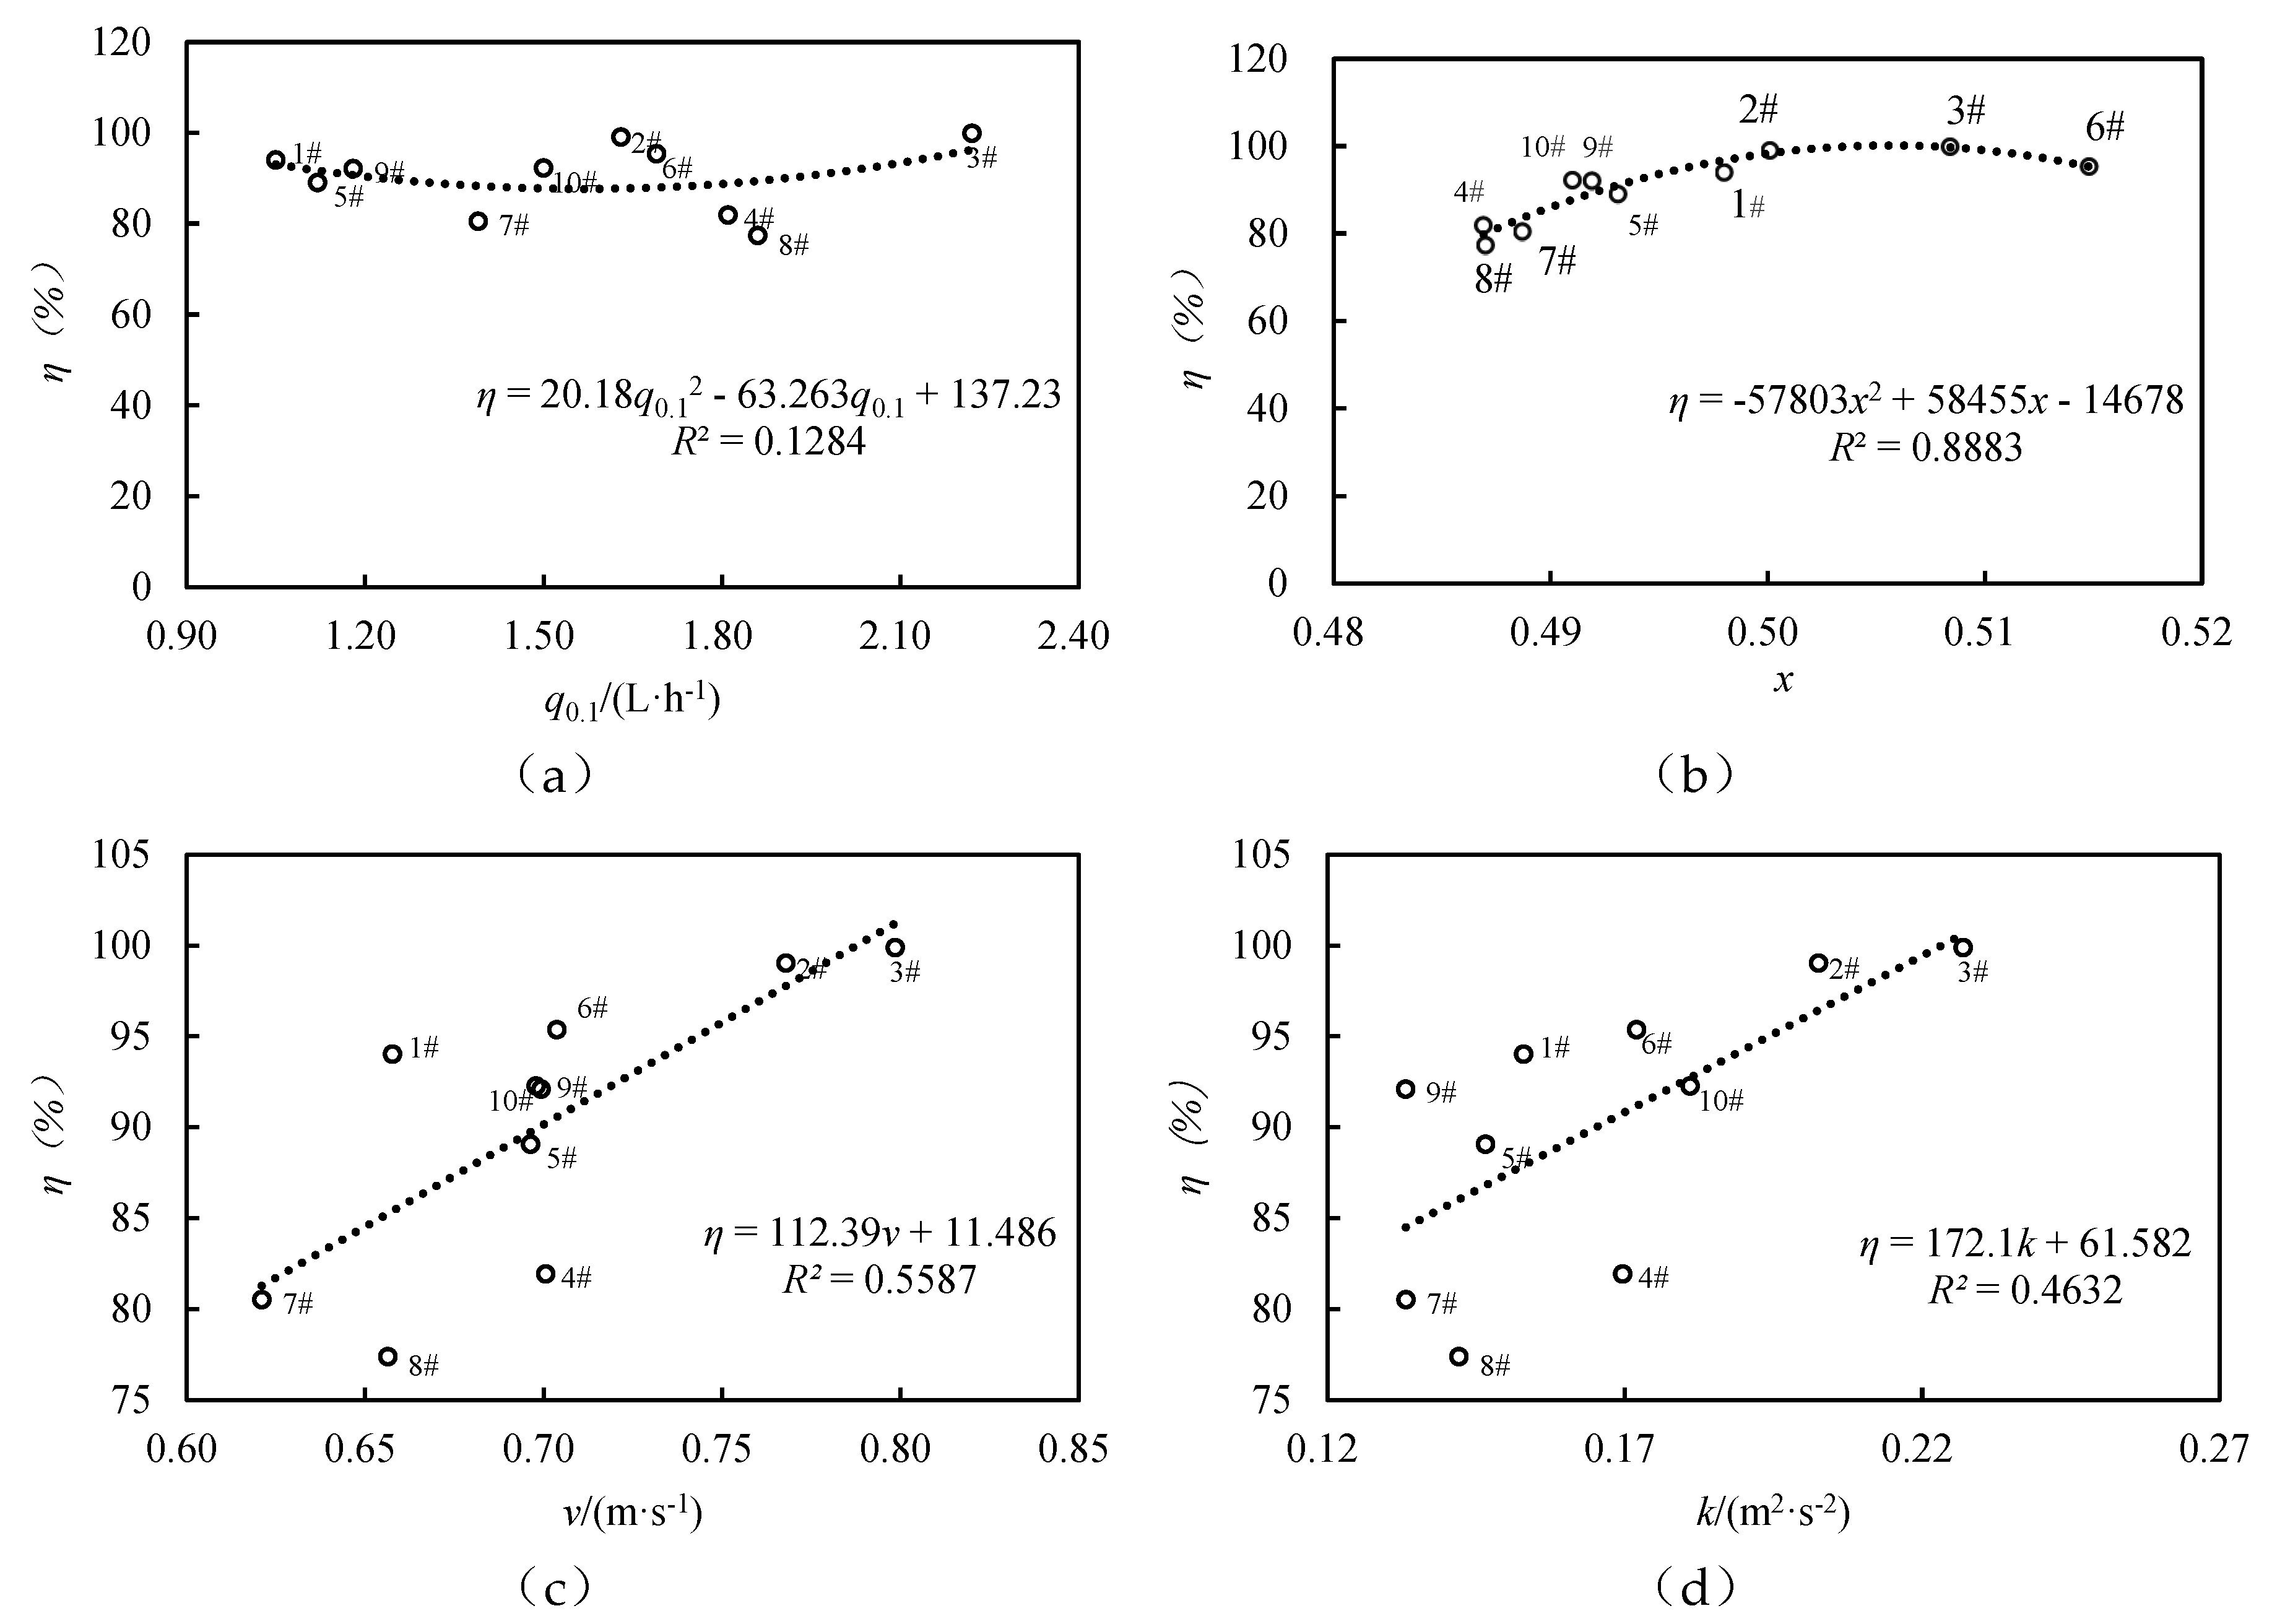
The order of the effect of each factor on η was E > B > D > A (Table 5). In the water–sand two–phase flow simulation, the η values of different sizes of variable flow emitters ranged from 77.38% to 99.88%, among which the 3# emitter was the largest and the 8# emitter was the smallest, and the η rankings of the 4#, 8#, 3#, and 6# flow channels were the same as those for the average turbulent kinetic energy of the flow channels, and the time of the particles retained in the flow channels became shorter with increasing particle passage rate. The η of the variable flow emitter is quadratically related to q0.1 (R2 = 0.1284) (Figure 9a) and η is quadratically related to x, with a coefficient of determination R2 of 0.8883 (Figure 9b). In operating stage I, the anti–clogging performance of the variable flow emitter increased and then decreased with hydraulic performance, and η reached the maximum value when x = 0.5055. The η of the variable flow emitter had a linear relationship with both v and k, and the coefficients of determination R2 were 0.5587 and 0.4632, respectively (Figure 9cd).

3.5. Optimization of the Structural Parameters of Variable Flow Emitter Flow Paths

3.5.1. Modeling of Hydraulic Performance and Anticlogging Performance Indicators of Emitters in Relation to Structural Parameters

The data were analyzed via linear regression analysis through SPSS 26.0 to model the regression of q0.1, x, and η of the 10 specification variables of emitters with flow channel structural parameters E, B, A, and D (Table 7). The regression model determination coefficients R2 of q0.1 and η with each structural parameter were 0.995 and 0.875, respectively, with high fitting accuracy, whereas the regression model determination coefficient R2 of x with each structural parameter was 0.79, with low fitting accuracy. The effects of the constant term and the regression coefficients of E, B and D on the multiple linear regression equations of q0.1 and η reached the significance level (P < 0.05), whereas the effect of A on the linear regression equations of q0.1 and η did not reach the significance level (P > 0.1). The effects of the constant term as well as the linear regression equations of E and B on x reached the significance level (P < 0.05), whereas the effects of both A and D on the linear regression equation of x did not reach the level of significance (P > 0.1). The constant term did not reach the level of significance for the linearity of the flow channel (P > 0.1), and the remaining structural parameters had a significant effect on the linear regression equation of this indicator (P < 0.05) (Table 6). To simplify the nonlinear regression model expression, Factor A was excluded from the regression model for the flow index.
Table 6. Significance analysis of regression coefficients of regression models for the rated flow rate, flow index and particle passage rate of emitter runners.
norm regression coefficient Unstandardized coefficient Standardized coefficient t value P value VIF
B Standard error Beta
q0.1 Constant term -1.175 0.205 -5.720 0.002
E/mm -0.394 0.064 -0.186 -6.118 0.002 1.031
B/mm 0.689 0.064 0.326 10.689 0.000 1.031
A/° 0.001 0.003 0.013 0.413 0.697 1.031
D /mm 2.115 0.068 0.933 31.088 0.000 1.000
R2 0.995
F 276.232
P **
x Constant term 0.493 0.035 13.908 0.000
E/mm -0.031 0.011 -0.578 -2.778 0.039 1.031
B/mm 0.035 0.011 0.655 3.148 0.025 1.031
A/° -0.001 0.001 -0.343 -1.648 0.160 1.031
D/mm -0.001 0.012 -0.015 -0.071 0.946 1.000
R2 0.79
F 4.696
P *
η Constant term 0.745 0.148 5.049 0.004
E/mm -0.354 0.046 -0.794 -7.657 0.001 1.031
B/mm 0.261 0.046 0.586 5.647 0.002 1.031
A/° 0.002 0.002 0.109 1.052 0.341 1.031
D/mm -0.133 0.049 -0.279 -2.73 0.041 1.000
R2 0.948
F 22.716
P **
Note: * and ** represent p<0.1 and p<0.05, respectively.
Table 7. Mathematical regression model of variable flow emitters q0.1, x, and η with flow channel structural parameters.
q0.1 = - 1.175 - 0.394 E + 0.689 B + 0.001 A + 2.115 D R2 = 0.995
x = 0.411 - 0.005 E2 + 0.051 B2 - 0.115 D2 - 0.087 EB + 0.332 ED - 0.007 BD - 0.075 EBD R2 = 0.883
η = 0.745 - 0.354 E + 0.261 B + 0.002 A - 0.133 D R2 = 0.948

3.5.2. Preferred Combination of Structural Parameters for Emitter Runners

Based on Equation (4)–(6), the combination of q0.1, hydraulic performance and anticlogging performance of the variable flow emitter runner structure parameters required for drip irrigation systems can be obtained quickly by using the minimize function in the SciPy library and Python software according to the water conditions, engineering inputs, crop water consumption and soil conditions of the actual project. Taking q0.1 = 1.5, 2.0 L/h as an example, the constraints are as follows: 0.6 mm ≤ E ≤ 1.0 mm, △E = 0.1 mm; 1.8 mm ≤ B ≤ 2.2 mm, △B = 0.1 mm; 34° ≤ A ≤ 42°, △A = 1°; 0.6 mm ≤ D ≤ 1.0 mm, and △D = 0.1 mm. The optimization objectives are Min x, Max η and Min M. For Min M, M = 0.5 x–0.5 η when the weights of both hydraulic performance and clogging resistance are 0.5 (Equation 7). x minimum, η maximum, and the combinations of flow channel structural parameters under the three optimization objectives of considering x and η at the same time are shown in Table 8. The structural parameter combinations of Min x usually pertained to the reduction of cost or loss, and the x obtained for the rated flow rates of 1.5 and 2.0 L/h were lower, at 0.500 and 0.484, respectively. The structural parameter combinations of Max η were usually concerned with the improvement of efficiency, and the rated flow rates of 1.5 and 2.0 L/h obtained by η were higher, at 98.80% and 96.62%, respectively. The structural parameter combination of Min M was the result of the balance of the comprehensive consideration of x and η, and the rated flow rates of 1.5 and 2.0 L/h obtained by x were 0.501 and 0.484, respectively, and those obtained by η were 92.86% and 95.34%, respectively.
M = 0.166 ED - 0.0435 EB - 0.0035 BD - 0.0375 EBD - 0.0025 E2 + 0.0255 B2 - 0.0575 D2 + 0.177 E - 0.1305 B - 0.001 A + 0.0665 D - 0.167

4. Discussion

Authors should discuss the results and how they can be interpreted from the perspective of previous studies and of the working hypotheses. The findings and their implications should be discussed in the broadest context possible. Future research directions may also be highlighted.

4.1. Law of Response of the Hydraulic Performance of a Variable Flow Emitter to Structural Parameters

Based on the Realizable k–ε turbulence model in Fluent software, the nRMSE between the measured and simulated values of q for the variable flow emitter at operating stage I (Figure 1a) is less than 15%, with a high simulation accuracy, and the relative error between the measured and simulated values of q and x is 4.66–14.98%, which is similar to the range of accuracy of existing studies [62,63,64]. In the studies by Xing et al. [64] and Xu and Zhang [65], the measured value of q was lower than the simulated value because of the insufficient smoothness of the sidewalls of the emitter sample, which was made of Plexiglas material used CNC machine tool machining technology, and the low machining accuracy of the emitter flow channel, which resulted in additional energy dissipation when the water flow moved in the flow channel. In this study, the effects of mass force and channel wall roughness were considered in the simulation of the emitter. At the same time, the variable flow emitter core was processed from stainless steel, which has a smooth surface and is more scratch resistant than Plexiglas. The elastomer of the variable flow emitter was selected from Teflon rigid tubes, which led to slight deformation of the elastomer during the water flow movement inside the channel such that the measured value of q was higher than the simulated value.
In this study, a numerical simulation study was carried out for the tooth height (E), tooth spacing (B), tooth angle (A) and runner depth (D) of the runners. The order of structural parameters affecting q0.1, x was obtained by polar analysis as follows: D > B > E > A, B > E > D > A, and A was found to have the smallest effect on q0.1, x. In the existing studies on emitter runners, no consistent conclusion was obtained on the order of influence of each parameter on performance indices owing to the type of emitter. In the existing studies on emitter runners, no consistent conclusions on the order of influence of runner structural parameters on q0.1, x were obtained, and the primary and secondary order of the influence of each parameter on the performance indices varied owing to differences in emitter types and the range of structural parameter selection, etc. [29,30,32,66]. Therefore, for different types of emitters, it is necessary to explore the effects of flow channel structural parameters on their hydraulic performance.

4.2. Changes in the Internal Flow Field and Anticlogging Performance of the Water Emitter

The area of the region in the flow channel with turbulent kinetic energy less than 0.1 m2/s2 as well as t tended to decrease with increasing v and k. η was positively correlated with v and k. Similarly, Yang et al. [43] and Xu et al. [65] reported that adjusting the tooth shape to reduce the area of the low–flow velocity zone, increasing the k of the main flow zone, and increasing the ability of particles to gain access to the outside can increase the rate of particle transport, reduce t, and decrease sedimentation and deposition; these studies also reported that the emitter flow paths are susceptible to clogging in the low–flow velocity zone [67]. Fully considering the distribution characteristics of vortices in the flow channel, abating the low–flow zone can improve its anticlogging performance [68,69], whereas increasing the v of the emitter can improve its anticlogging performance [70].
The study by Gao et al. [17] focused only on the optimization of the hydraulic performance of variable flow emitters at the stage of regular flow water supply, without considering the improvement in anti–clogging performance. In their study, η was selected as the evaluation index for the anti–clogging performance of the emitter, and the range of η was from 77.38% to 99.88%, which was basically within the range of η values (50% to 99%) of the existing studies [38,71]. Some scholars have shown that the different emitter structural parameters, operating pressures, and sand particle sizes have an influence [72,73]. In our study, the order of influence of the emitter runner structure parameters on η was E > B > D > A. In addition, for different runner structure forms, different key parameters were selected. The order of the parameters affecting η was also different, e.g., turning angle of tooth > channel width/channel depth > width of tooth top / channel tooth height > channel tooth height/channel width [38], and vortex circle radius > arc circle center to vortex circle center connecting line > vortex circle spacing > internal arc radius [74].
In this study, η tends to increase and then decrease with increasing x ((Figure 9b) and reaches its maximum value when x = 0.5055. Studies have shown that x increases with decreasing water flow turbulence degree in the flow channel [75,76]. The greater the degree of turbulence in a certain range of water flow is, the greater the wall surface shear force in the flow channel and the stronger the turbulence kinetic energy, which is conducive to promoting the transportation of sand particles in the flow channel, reducing the retention of sand particles inside the flow channel, and improving the anticlogging performance of the emitter [43,55,56]. In general, there is a contradiction between the hydraulic performance and the clogging resistance of variable flow emitters.
To this end, multiple linear regression equations of q0.1, x, η and flow channel structural parameters are constructed, and the optimal combinations of Min x, Max η and Min (0.5 x–0.5 η) flow channel structure parameters for each of the three scenarios are obtained: 1) the case of cleaner water sources, food crops corresponding to the disposable drip irrigation belt, and the need to reduce the unit area of drip irrigation system investment in long–distance laying drip irrigation belt scale project; 2) scenarios where the water source contains much sediment or suspended matter, where there is much agricultural waste or impurities in the irrigated area, and where there is a need for stable operation over a long period of time with reduced maintenance; and 3) medium–sized agricultural irrigation projects with water sources that are neither too high nor too low in sediment content, integrated irrigation systems that require simultaneous attention to hydraulic uniformity and system stability, mixed cropping areas, and scenarios with diverse irrigation needs. For this reason, in our study, the hydraulic performance and anti–clogging performance weights are set to 0.5 to determine the flow channel structure combination of different rated flow rates of the emitter. Drip irrigation belt design and manufacturing can be based on the actual agricultural environment and irrigation needs, as well as the weights of the flow rate, flow index and particle passage rate of each emitter design, and these weights can be changed to meet the different requirements of each combination of emitter structure parameters.

5. Conclusions

This paper takes a variable flow emitter as the research object and uses experimental tests and analysis, CFD numerical simulations and optimization of the flow channel structure to explore the intrinsic connection between the comprehensive performance and structural parameters of the variable flow emitter and to provide a scientific basis for research on variable flow emitter products and the promotion of engineering applications. The main conclusions are as follows.
  • The realizable k–ε turbulence model and the DPM discrete–phase model can be used to carry out studies of numerical simulations within the emitter flow channel.
  • The nRMSE between the measured and simulated values of the water outlet flow from the emitter is 11.23%, and the Fluent simulation accuracy is high.
  • The results of the polar–variance analysis reveal that the influence of the flow channel structural parameters on the flow index is in the order of B > E > D > A, the influence on the flow rate is in the order of D > B > E > A, and the influence on the particle passage rate is in the order of E > B > D > A.
  • The proportion of the low turbulent kinetic energy flow area is negatively correlated with the flow velocity, the retention time of the particles in the flow channel is positively correlated with the proportion of the low turbulent kinetic energy flow area, and the passage rate of the particles is positively correlated with the mean flow velocity and the mean turbulent kinetic energy.
  • Based on the multivariate linear regression model of hydraulic performance and anticlogging performance evaluation indices and structural parameters, the combinations of variable flow emitter runner structural parameters required for drip irrigation systems under different working conditions were obtained via the minimization function.

Author Contributions

Conceptualization, Y.M.; methodology, P.N. and Y.M.; software, P.N.; val–idation, Y.M. and B.Y.; formal analysis, P.N., Y.M. and Z.Y.; investigation, P.N. and Y.M.; writing—original draft preparation, P.N.; writing—review and editing, Y.M. and B.Y.; funding acqui–sition, Y.M. and B.Y. All authors have read and agreed to the published version of the manuscript.

Funding

This research was funded by the Ministry of Science and Technology of China (2023YFD1900804), the Research and Development Support Program of China Institute of Water Resources and Hydropower Research (ID0145B042021), the Inner Mongolia Autonomous Region Key Research and Transformation of Achievements Program (2022YFHH0030), and the Graduate Student Research Innovation Program of Tarim University (TDGRI202252).

Data Availability Statement

The data presented in this study are available upon request from the corresponding author.

Acknowledgments

We thank the College of Water Conservancy and Architectural Engineering of Tarim University, State Key Laboratory of Simulation and Regulation of Water Cycle in River Basin and China Institute of Water Resources and Hydropower Research for their support and cooperation in this project.

Conflicts of Interest

Declare The authors declare no conflicts of interest.

References

  1. Hua, H.; Kang, S. The economic and environmental effect of subsurface drip irrigation. Acta Univ. Agric. Boreali–occidentalis. 2000, 28, 79–83. [Google Scholar]
  2. Lamm, F.R.; Trooien, T.P. Subsurface drip irrigation for corn production: a review of 10 years of research in Kansas. Irrig Sci. 2003, 22, 195–200. [Google Scholar] [CrossRef]
  3. Lamm, F.R.; O'Brien, D.M.; Rogers, DH. Economic comparison of subsurface drip and center pivot sprinkler irrigation using spreadsheet software. Applied Engineering in Agriculture. 2015, 31, 929–936. [Google Scholar] [CrossRef]
  4. Li, J.; Yang, F.; Li, Y. Water and nitrogen distribution under subsurface drip fertigation as affected by layered–textural soils. Trans. Chin. Soc.Agric. Eng. 2009, 25, 25–31. [Google Scholar]
  5. Mo, Y.; Li, G.; Wang, D.; Lamm, F.R.; Wang, J.; Zhang, Y.; Cai, M.; Gong, S. Planting and preemergence irrigation procedures to enhance germination of subsurface drip irrigated corn. Agr. Water Manag. 2020, 242, 106412. [Google Scholar] [CrossRef]
  6. Cao, X.; Feng, Y.; Li, H.; Zheng, H.; Wang, J.; Tong, C. Effects of subsurface drip irrigation on water consumption and yields of alfalfa under different water and fertilizer conditions. Journal of Sensors. 2021, 1, 6617437. [Google Scholar] [CrossRef]
  7. Guo, S.; Mo, Y.; Wu, Z.; Wang, J.; Zhang, Y; Gong, D.; Xu, M.; Guo, B.; Shen, X. The Effects of Furrow Depth in Alternate Row Planting on Germination and Yield of Spring Maize under Subsurface Drip Irrigation in North China Plain. J. Irrig. Drain. 2021, 40, 27–34. [CrossRef]
  8. Mo, Y.; Zhang, Y.; Wang, D.; Wang, J.; Li, G.; Gong, S.; Gao, X. Germination and growth of corn submitted to sowing and cultivation management by subsurface drip irrigation in the North China Plain. Irrig Sci. 2024, 42, 801–813. [Google Scholar] [CrossRef]
  9. Muhammad, T.; Zhou, B.; Puig–Bargu, J.; Ding, C.; Li, S.; Manan, I.; Zhou, Y.; Liu, Z.; Li, Y. Assessment of emitter clogging with multiple fouling and root intrusion in sub–surface drip irrigation during 5–year sugarcane growth. Agr. Water Manag. 2022, 274, 107981. [Google Scholar] [CrossRef]
  10. Camp, C.R.; Lamm, F.R. Irrigation systems, subsurface drip. Encyclopedia Water Science, 2003; 560–564. [Google Scholar]
  11. Kandelous, MM.; Šimůnek, J. Numerical simulations of water movement in a subsurface drip irrigation system under field and laboratory conditions using HYDRUS–2D. Agr. Water Manag. 2010, 97, 1070–1076. [Google Scholar] [CrossRef]
  12. Schiavon, M.; Serena, M.; Leinauer, B.; Sallenave, R.; Baird, JH. Seeding date and irrigation system effects on establishment of warm–season turfgrasses. Agronomy Journal. 2015, 107, 880–886. [Google Scholar] [CrossRef]
  13. Mo, Y.; Li, G.; Wang, D. A sowing method for subsurface drip irrigation that increases the emergence rate, yield, and water use efficiency in spring corn. Agr. Water Manag. 2017, 179, 288–295. [Google Scholar] [CrossRef]
  14. Mo, Y.; Li, G.; Cai, M.; Wang, D.; Xu, X.; Bian, X. Selection of suitable technical parameters for alternate row/bed planting with high maize emergence under subsurface drip irrigation based on HYDRUS–2D model. Trans. Chin. Soc. Agric. Eng. 2017, 33, 105–112. [Google Scholar] [CrossRef]
  15. O’Brien, D.M.; Rogers, D.H.; Lamm, F.R.; Clark, G.A. An economic comparison of subsurface drip and center pivot sprinkler irrigation systems. Applied Engineering in Agriculture. 1998, 14, 391–398. [Google Scholar] [CrossRef]
  16. Mo, Y.; Wang, J.; Zhang, Y.; Li, Q.; Gong, S.; Xu, D.; Gao, X. Drip irrigation apparatus and system. US202117525055, 2022–05–12.
  17. Gao, N.; Mo, Y.; Wang, J.; Yang, L.; Gong, S. Effects of Flow Path Geometrical Parameters on the Hydraulic Performance of Variable Flow Emitters at the Conventional Water Supply Stage. Agriculture. 2022, 12, 1531. [Google Scholar] [CrossRef]
  18. Li, G.; Wang, J.; Alam, M.; Zhao, Y. Influence of geometrical parameters of labyrinth flow path of drip emitters on hydraulic and anti–clogging performance. Trans. ASABE. 2006, 49, 637–643. [Google Scholar] [CrossRef]
  19. Li, Y.; Yang, P.; Xu, T.; Ren, S.; Lin, X.; Wei, R.; Xu, H. CFD and digital particle tracking to assess flow characteristics in the labyrinth flow path of a drip irrigation emitter. Irrig Sci. 2008, 26, 427–438. [Google Scholar] [CrossRef]
  20. Camp, C.R. Subsurface drip irrigation: A review. Trans. ASABE. 1998, 41, 1353–1367. [Google Scholar] [CrossRef]
  21. Yıldırım, G.A.; g ˇ ıralio g ˇ lu, N. Linear solution for hydraulic analysis of tapered microirrigation laterals. J. Irrig. Drain Eng. 2004, 130, 78–87. [Google Scholar] [CrossRef]
  22. Li, Y.; Yang, P.; Xu, T.; Liu, H.; Liu, H.; Xu, F. Hydraulic property and flow characteristics of three labyrinth flow paths of drip irrigation emitters under micro–pressure. Trans. ASABE. 2009, 52, 1129–1138. [Google Scholar] [CrossRef]
  23. Pan, Y. Experimental Study on the Effect of Tooth Flow Structureon the Hydraulic Performance of Emitter Drip. Master Degree, Northwest A&F University, Yanglin, 2017.
  24. Chang, Y.; Niu, W.; Wang, W. Numerical simulation and flow analysis of labyrinth path of drip irrigation emitters. Journal of Northwest A&F University (Nat. Sci. Ed.). 2009, 37, 203–208. [Google Scholar] [CrossRef]
  25. Xie, Q.; Niu, W.; Li, L. Effect of tooth angle and pitch of labyrinth channel on performance of emitter. Journal of Drainage and Irrigation Machinery Engineering. 2013, 31, 449–455. [Google Scholar] [CrossRef]
  26. Chen, X.; Wu, P.; Fan, X.; Niu, W. Numerical simulation of structural parameters using CFD and anti–clogging design analyse on drip emitter. J Irrig Drain. 2008, 27, 35–8. [Google Scholar] [CrossRef]
  27. Zhang, C.; Niu, Y.; Liu, X. Numerical simulation of influence of tooth angle on hyaraulic characteristics of labyrinth emitter. J. Drain. Irrig. 2022, 40, 751–756. [Google Scholar]
  28. Wang, J.; Gong, S.; Li, G.; Zhao, Y. The influence of geometrical parameters of dental flow passage of labyrinth emitter on the hydraulic performance under low working pressure. J. Hydraul. Eng. 2014, 45, 72–78. [Google Scholar] [CrossRef]
  29. Zhang, L.; Li, S. Numerical experimental investigation of douche hydraulic performance on drop irrigation of tooth–type labyrinth channel. Int J Hydroelectr Energy. 2017, 35, 103–106. [Google Scholar]
  30. Yang, B.; Zhang, G.; Wang, J.; Gong, S.; Wang, H.; Mo, Y. Numerical simulation of hydraulic performance of tooth–form channel of labyrinth emitter. J. Irrig. Drain. 2019, 38, 71–76. [Google Scholar] [CrossRef]
  31. Liu, C.; Tang, D.; Zheng, J.; Zhou, H. Optimization of hydraulic performance for drip irrigation trapezoidal labyrinth channel of emitter using response surface methodology. Trans. Chin. Soc.Agric. Eng. 2011, 27, 46–51. [Google Scholar]
  32. Liu, C.; Tang, D.; Wang, L.; Zhao, Z. Multi output optimization of the hydraulic performance for drip irrigation trapezoidal labyrinth channel of emitter. Arid Land Geography. 2016, 39, 600–606. [Google Scholar] [CrossRef]
  33. Li, J.; Chen, L.; Li, Y. Field evaluation of emitter clogging in subsurface drip irrigation system. J. Hydraul. Eng. 2008, 39, 1272–1278. [Google Scholar] [CrossRef]
  34. Wang, H.; Wang, N.; Quan, H.; Zhang, F.; Fan, J.; Feng, H.; Cheng, M.; Liao, Z.; Wang, X.; Xiang, Y. Yield and water productivity of crops, vegetables and fruits under subsurface drip irrigation: A global meta–analysis. Agr. Water Manag. 2022, 269, 107645. [Google Scholar] [CrossRef]
  35. Gilbert, R.G.; Nakayama, F.S.; Bucks, D.A.; French, O.F.; Adamson, K.C.; Johnson, R.M. Trickle irrigation: Predominant bacteria in treated Colorado River water and biologically clogged emitters. Irrig Sci. 1982, 3, 123–132. [Google Scholar] [CrossRef]
  36. Nakayama, F.S.; Bucks, D.A. Water quality in drip/trickle irrigation: A review. Irrig Sci. 1991, 12, 187–192. [Google Scholar] [CrossRef]
  37. Yan, D.; YD, Bai, Z.; Rowan, M.; Gu, L.; Ren, S.; Yang, P. Biofilm structure and its influence on clogging in drip irrigation emitters distributing reclaimed wastewater. Journal of Environmental Sciences. 2009, 21, 834–841. [CrossRef]
  38. Zhang, J.; Zhao, W.; Tang, Y.; Wei, Z.; Lu, B. Numerical investigation of the clogging mechanism in labyrinth channel of the emitter. International Journal for Numerical Methods in Engineering. 2007, 70, 1598–1612. [Google Scholar] [CrossRef]
  39. Wei, Z.; Tang, Y.; Wen, J.; Lu, B. Two–phase flow analysis and experimental investigation of micro–PIV and anti–clogging for micro–channels of emitter. Trans. Chin. Soc.Agric. Eng. 2008, 24, 1–9. [Google Scholar]
  40. Niu, W.; Yu, L.; Wu, P.; Fan, X.; Zhang, L. Influence of Angle of Labyrinth Channels on Ant–i clogging Performance of Emitter. Trans. Chin. So.c Agric. Mach. 2009, 40, 51–55. [Google Scholar]
  41. Yu, L.; Wu, P.; Niu, W. Influence of the offset of labyrinth channels of drip emitters on hydraulic and anti–clogging performance. Trans. Chin. Soc. Agric. Mach. 2011, 42, 64–68. [Google Scholar]
  42. Yu, L.; Tan, H.; Zou, X.; Chang, L.; Chen, L.; Fan, W. Numerical simulation of water and sediment flow in labyrinth channel based on coupled CFD–DEM. Trans. Chin. Soc. Agric. Mach. 2016, 47, 65–71. [Google Scholar] [CrossRef]
  43. Yang, B.; Wang, J.; Zhang, Y.; Wang, H.; Ma, X.; Mo, Y. Anti–clogging performance optimization for dentiform labyrinth emitters. Irrig Sci. 2020, 38, 275–285. [Google Scholar] [CrossRef]
  44. Guo, S.; Zhang, C.; Guo, B.; Zhu, H.; Geng, W.; Chi, J. Influence of tooth width of single internal tooth emitter on its anti–clogging performance. Water Sav. Irrig. 2022, 66–71. [Google Scholar]
  45. Wang, X. Study on Anti–clogging Performance and Structural Parameters Optimization of Bidirectional Flow Channel Emitter in Drip Irrigation. Ph.D. degree, Xi'an University of Technology, Xi'an, 2019.
  46. Wei, Z.; Chen, X. Optimal design of main pipe in a mountain gravity pipe network based on genetic algorithm. Water Sav. Irrig. 2018, 54–58. [Google Scholar]
  47. Ren, C.; Wang, J.; Bai, D.; Zhao, X.; Pei, Q. Application of improved ant colony algorithm in parameter identification problem of solute transport. Chinese Journal of Hydrodynamics. 2017, 32, 344–350. [Google Scholar] [CrossRef]
  48. Chen, L.; Zheng, J.; Gao, J.; Miao, H. Generation of typhoon disaster emergency alternative based on fuzzy risk assessment. Journal of Safety and Environment. 2022, 22, 1467–1476. [Google Scholar] [CrossRef]
  49. Wang, J.; Yang, X.; Jang, Y. Benefit Distribution Model of Military Supply Chain under theBackground of Additive Manufacturing Technology. Journal of Military Transportation. 2022, 1, 58–63. [Google Scholar]
  50. Xu, X.; Yao, X. Research on Equipment Maintenance Strategy for Small and Medium Coal Mine Enterprises. Coal Mine Machinery. 2022, 43, 173–178. [Google Scholar] [CrossRef]
  51. Yang, P.; Lei, X. Developments and study situations of drip irrigation emitters. Water Sav. Irrig. 2000, 17–18. [Google Scholar]
  52. Wang, X.; Yang, P.; Huang, L. Impact of fertilization and top–addressing on yield and quality of solar greenhouse cucumber under trae irrigation. J. Irrig. Drain. 2019, 38, 36–41. [Google Scholar] [CrossRef]
  53. Gilbert, R.G.; Nakayama, F.S.; Bucks, D.A.; French, O.F.; Adamson, K.C. Trickle irrigation: emitter clogging and other flow problems. Agr. Water Manag. 1981, 3, 159–178. [Google Scholar] [CrossRef]
  54. Kreij, C.; Burg, M.; Runia, T. Drip irrigation emitter clogging in Dutch greenhouses as affected by methane and organic acids. Agr. Water Manag. 2003, 60, 73–85. [Google Scholar] [CrossRef]
  55. Wang, G.; Yang, F.; Wu, K.; Ma, Y.; Peng, C.; Liu, T.; Wang, L. Estimation of the dissipation rate of turbulent kinetic energy: A review. Chemical Engineering Science. 2021, 229, 116133. [Google Scholar] [CrossRef]
  56. Chu, L.; Chen, W.; Li, X.; Liu, P. Researches on energy consumption mechanism and energy–saving principles of hydrocydones Ⅳ.The distribution and dissipation of turbulent kinetic energy. Chemical Engineering & Machinery. 1998, 25, 254–258. [Google Scholar]
  57. Zhang, J. Evaluation of Hydraulic and Anti–clogging Performances and Structural Optimization of Labyrinth–Channel Emitters. Ph.D. degree, Xi'an Jiaotong University, Xi'an, 2009.
  58. Zhang, J.; Zhao, W.; Tang, Y.; Lu, B. Anti–clogging performance evaluation and parameterized design of emitters with labyrinth channels. Computers and Electronics in Agriculture. 2010, 74, 59–65. [Google Scholar] [CrossRef]
  59. Bannayan, M.; Hoogenboom, G. Using pattern recognition for estimating cultivar coefficients of a crop simulation model. Field.Crop. Res. 2009, 111, 290–302. [Google Scholar] [CrossRef]
  60. Dettori, M.; Cesaraccio, C.; Motroni, A.; Spano, D.; Duce, P. Using CERES–Wheat to simulate durum wheat production and phenology in Southern Sardinia, Italy. Field. Crop. Res. 2011, 120, 179–188. [Google Scholar] [CrossRef]
  61. Zhuang, C.; He, C. Fundamentals of Applied Mathematical Statistics, 4th ed.; South China University of Technology Press: Guang zhou, China, 2013; p. 436. [Google Scholar]
  62. Tian, J.; Bai, D.; Ren, C.; Wang, X. Analysis on hydraulic performance of bidirectional flow channel of drip irrigation emitter. Trans. Chin. Soc.Agric. Eng. 2013, 29, 89–94. [Google Scholar] [CrossRef]
  63. Li, J.; Bai, D.; Wang, X.; Guo, L. Geometric parameters design and experimental study on new type drip emitter.J. Drain. Irrig. Mach. Eng. 2020, 38, 95–101. [Google Scholar]
  64. Xing, S.; Wang, Z.; Zhang, J.; Liu, N.; Zhou, B. Simulation and verification of hydraulic performance and energy dissipation mechanism of perforated drip irrigation emitters. Water, 2021, 13, 171. [Google Scholar] [CrossRef]
  65. Xu, T.; Zhang, L. Influence and analysis of structure design and optimization on the performance of a pit drip irrigation emitter. J. Irrig. Drain. 2020, 69, 633–645. [Google Scholar] [CrossRef]
  66. Hu, Y.; Peng, J.; Yin, F.; Liu, X.; Li, N. Optimization of trapezoidal labyrinth emitter channel based on MATLAB and COMSOL co–simulation. Trans. Chin. Soc.Agric. Eng. 2020, 36, 158–164. [Google Scholar] [CrossRef]
  67. Capra, A.; Scicolone, B. Water quality and distribution uniformity in drip/trickle irrigation systems. Journal of Agricultural Engineering Research. 1998, 70, 355–365. [Google Scholar] [CrossRef]
  68. Wang, X.; Li, J.; Shan, B.; Wang, G. Structural design and optimization of triangle circulation drip irrigation emitters. Trans. Chin. Soc. Agric. Mach. 2010, 41, 43–46. [Google Scholar]
  69. Sun, H.; Li, Y.; Ji, F.; Liu, H.; Liu, Y. Effects of flow path boundary optimizations on particle transport in drip irrigation emitters. J. Irrig. Drain. 2016, 65, 417–425. [Google Scholar] [CrossRef]
  70. Wang, H.; Wang, J.; Wang, C.; Wang, S.; Qiu, X.; Sun, Y.; Li, G. Characterization of labyrinth emitter–clogging substances in biogas slurry drip irrigation systems. Science of the Total Environment. 2022, 820, 153315. [Google Scholar] [CrossRef] [PubMed]
  71. Yuan, W; Wei, Z; Chu, H; Ma, S. Optimal design and experiment for divided–flow emitter in drip irrigation. Trans. Chin. Soc.Agric. Eng. 2014, 30, 117–24. [CrossRef]
  72. Wang, W.; Wang, F.; Niu, W.; Hu, X. Numerical analysis of influence of emitter channel structure on suspended granule distribution. Trans. CSAE. 2009, 25, 1–6. [Google Scholar]
  73. Yu, L.; Yu, X.; Guo, H.; Wang, T.; Cui, N.; Li, N. Mechanism and anti–clogging of labyrinth–channel emitters under fluctuated water pressure. Trans. Chin. Soc. Agric. Mach. 2022, 53, 342–349. [Google Scholar] [CrossRef]
  74. Chu H, Wei Z, Ma S, Yuan W. Multi–objective optimization of Karman vortex street emitter based on grey relational analysis. J. Irrig. Drain. 2015, 34, 99–103. [CrossRef]
  75. Özekici, B. , Sneed, R.E. Analysis of pressure losses in tortuous–path emitters. Paper–American Society of Agricultural Engineers (USA), 1991; 19pp. [Google Scholar]
  76. Li Y, Yang P, Ren S. General review on several fundamental points of design theory about flow path in drip irrigation emitters. Trans. Chin. Soc. Agric. Mach. 2006, 37, 145–148.
Figure 1. Schematic diagram of the working principle of a variable flow emitter: (a) The regular flow water supply stage; (b) The high–flow water supply stage.
Preprints 114786 g001
Figure 2. Schematic diagram of the variable flow emitter runner structure.
Preprints 114786 g002
Figure 3. Schematic diagram of the structural parameters of the toothed runner of the variable flow emitter.
Preprints 114786 g003
Figure 4. Schematic diagram of the test platform of the emitter.
Preprints 114786 g004
Figure 5. Effects of different factor levels on q0.1 (a) and x (b).
Preprints 114786 g005
Figure 6. Velocity vector distributions at the 1/2 position of runner a depth for 4# (a), 8# (b), 3# (c) and 6# emitters (d).
Preprints 114786 g006
Figure 7. Turbulent kinetic energy distributions at the 1/2 deep position of runner a for 4# (a), 8# (b), 3# (c) and 6# emitter (d).
Preprints 114786 g007
Figure 8. Figure 8. Plots of individual particle trajectories versus retention times for the 4# (a), 8# (b), 3# (c) and 6# emitters (d) flow paths.
Preprints 114786 g008
Figure 9. Variation in η of the emitter with simulation results of q0.1 (a), x (b), v (c) and k (d).
Preprints 114786 g009
Table 1. Experimental design.
Emitter serial number Experimental factors
E/mm B/mm A/° D/mm
1 0.8 1.8 34 0.6
2 0.8 2.0 42 0.8
3 0.8 2.2 38 1.0
4 1.0 1.8 42 1.0
5 1.0 2.0 38 0.6
6 1.0 2.2 34 0.8
7 1.2 1.8 38 0.8
8 1.2 2.0 34 1.0
9 1.2 2.2 42 0.6
10 0.8 1.8 42 0.8
Table 2. Measured (qm) and simulated (q) water flow rates out of 10# emitter.
Water flow rate from emitter H/MPa x
0.04 0.06 0.08 0.10 0.12 0.15
qm/(L·h–1) 1.02 1.24 1.47 1.64 1.84 2.07 0.515
q/(L·h–1) 0.96 1.17 1.34 1.50 1.64 1.76 0.491
Relative Error/% 5.88 5.65 8.84 8.54 10.87 14.98 4.66
nRMSE/% 11.23 /
Table 3. Simulation results of the emitter flow (q) and flow index (x).
Emitter serial number q/(L·h-1) x
H=0.04 MPa H=0.06 MPa H=0.08 MPa H=0.10 MPa H=0.12 MPa H=0.15 MPa
1 0.67 0.82 0.94 1.05 1.15 1.29 0.498
2 1.03 1.27 1.46 1.63 1.79 2.00 0.500
3 1.39 1.71 1.98 2.22 2.43 2.72 0.508
4 1.16 1.41 1.63 1.81 1.98 2.21 0.487
5 0.71 0.87 1.00 1.12 1.22 1.36 0.493
6 1.05 1.30 1.50 1.69 1.85 2.08 0.515
7 0.89 1.08 1.25 1.39 1.52 1.69 0.489
8 1.19 1.45 1.67 1.86 2.04 2.27 0.487
9 0.75 0.92 1.06 1.18 1.29 1.45 0.492
Table 4. Polar analysis of the flow rate (q0.1) versus x for the emitter at 0.1 MPa.
Test indicators Structural parameters
E/mm B/mm A/° D/mm
q0.1 q0.1 1 1.63 1.42 1.53 1.12
q0.1 2 1.54 1.54 1.57 1.57
q0.1 3 1.48 1.70 1.54 1.96
Rq 0.16 0.28 0.04 0.85
x x1 0.5022 0.4912 0.4999 0.4943
x2 0.4983 0.4934 0.4967 0.5012
x3 0.4892 0.5050 0.4930 0.4941
Rx 0.0130 0.0138 0.0070 0.0071
Note: Rq and Rx denote the polar deviations of different structural parameters under different determination indices.
Table 5. Polar analysis of the particle passage rate (η) in the emitters.
Test indicators Structural parameters
E/mm B/mm A/° D/mm
ηi(%) η1(%) 96.14 85.48 90.43 91.73
η2(%) 90.29 88.49 88.31 93.14
η3(%) 83.33 95.78 91.02 84.89
Rη(%) 12.81 10.30 2.71 8.25
Note: ηi denotes the mean value of the particle passage rate at different levels of structural parameters; Rη denotes the extreme deviation of different structural parameters under the measurement index.
Table 8. Preferred combinations of runner structure parameters.
Optimization solutions Emitter Specifications Runner structure parameters x η/%
q0.1/(L·h–1) E/ mm B/ mm A/° D/mm
Min x 1.5 0.8 1.8 42 0.8 0.500 90.92
2.0 0.6 1.8 42 1.0 0.484 95.34
Max η 1.5 0.6 2.0 42 0.7 0.529 98.80
2.0 0.7 2.2 36 0.9 0.533 96.62
Min M 1.5 0.7 1.8 34 0.8 0.501 92.86
2.0 0.6 1.8 42 1.0 0.484 95.34
Disclaimer/Publisher’s Note: The statements, opinions and data contained in all publications are solely those of the individual author(s) and contributor(s) and not of MDPI and/or the editor(s). MDPI and/or the editor(s) disclaim responsibility for any injury to people or property resulting from any ideas, methods, instructions or products referred to in the content.
Copyright: This open access article is published under a Creative Commons CC BY 4.0 license, which permit the free download, distribution, and reuse, provided that the author and preprint are cited in any reuse.
Prerpints.org logo

Preprints.org is a free preprint server supported by MDPI in Basel, Switzerland.

Subscribe

© 2024 MDPI (Basel, Switzerland) unless otherwise stated