Submitted:
09 August 2024
Posted:
09 August 2024
You are already at the latest version
Abstract
Keywords:
1. Introduction
2. Fracture Closure Detection Techniques
2.1. Nolte (1979)[9] Technique

 for α=1 (low
leak-off) Eq. (2)
 for α=0.5 (high
leak-off). Eq. (3)
for α=0.5 (high
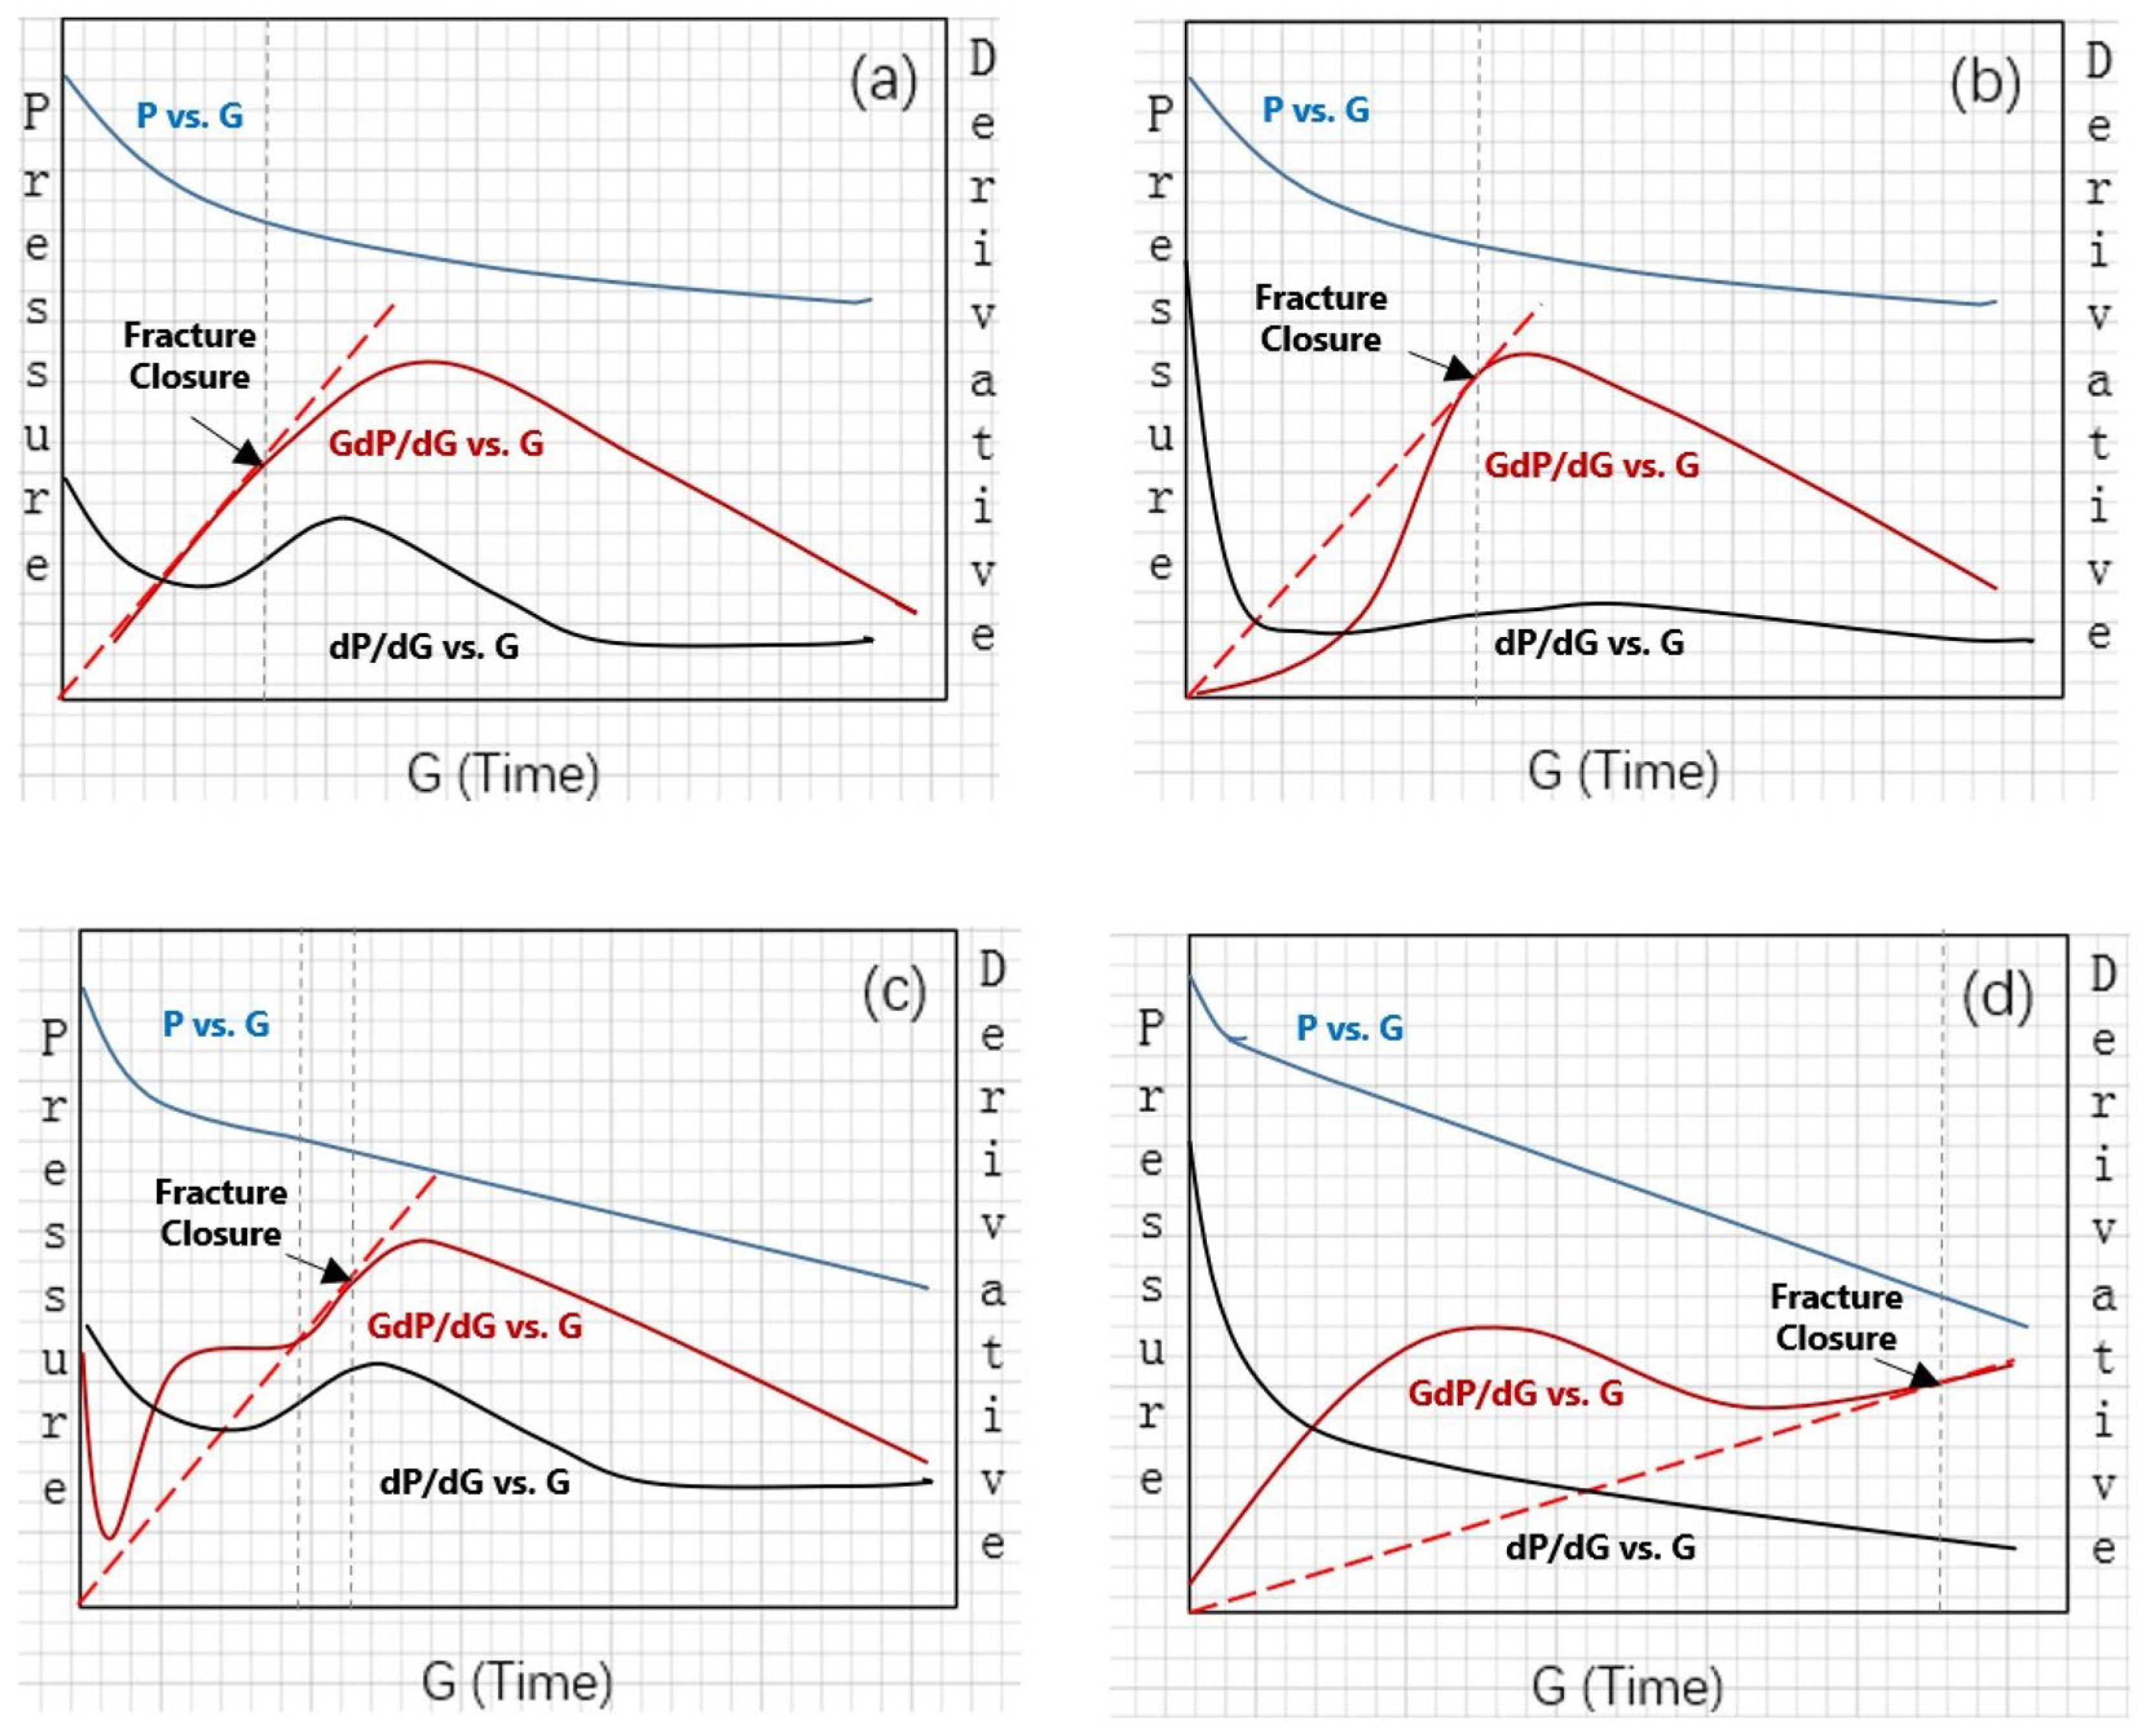
leak-off). Eq. (3)2.2. Tangent Method (Baree et. al. (2007)[18])


2.3. Compliance Method (McClure et al. (2014[20], 2016[21]))
2.4. Variable Compliance Method
2.5. Continuous Wavelet Transform Technique
2.6. Other Techniques
3. Calibration Using Physical Measurements
3.1. Strain Gauges Measurements
3.2. Fiber Optics Measurements.
4. Field Scale Studies
5. Methodology
6. Results and Discussion
7. Conclusions
- Disturbances in flow periods, particularly during post-closure pseudo-linear and pseudo-radial periods, significantly affect the interpretation of fracture closure pressure using the tangent method.
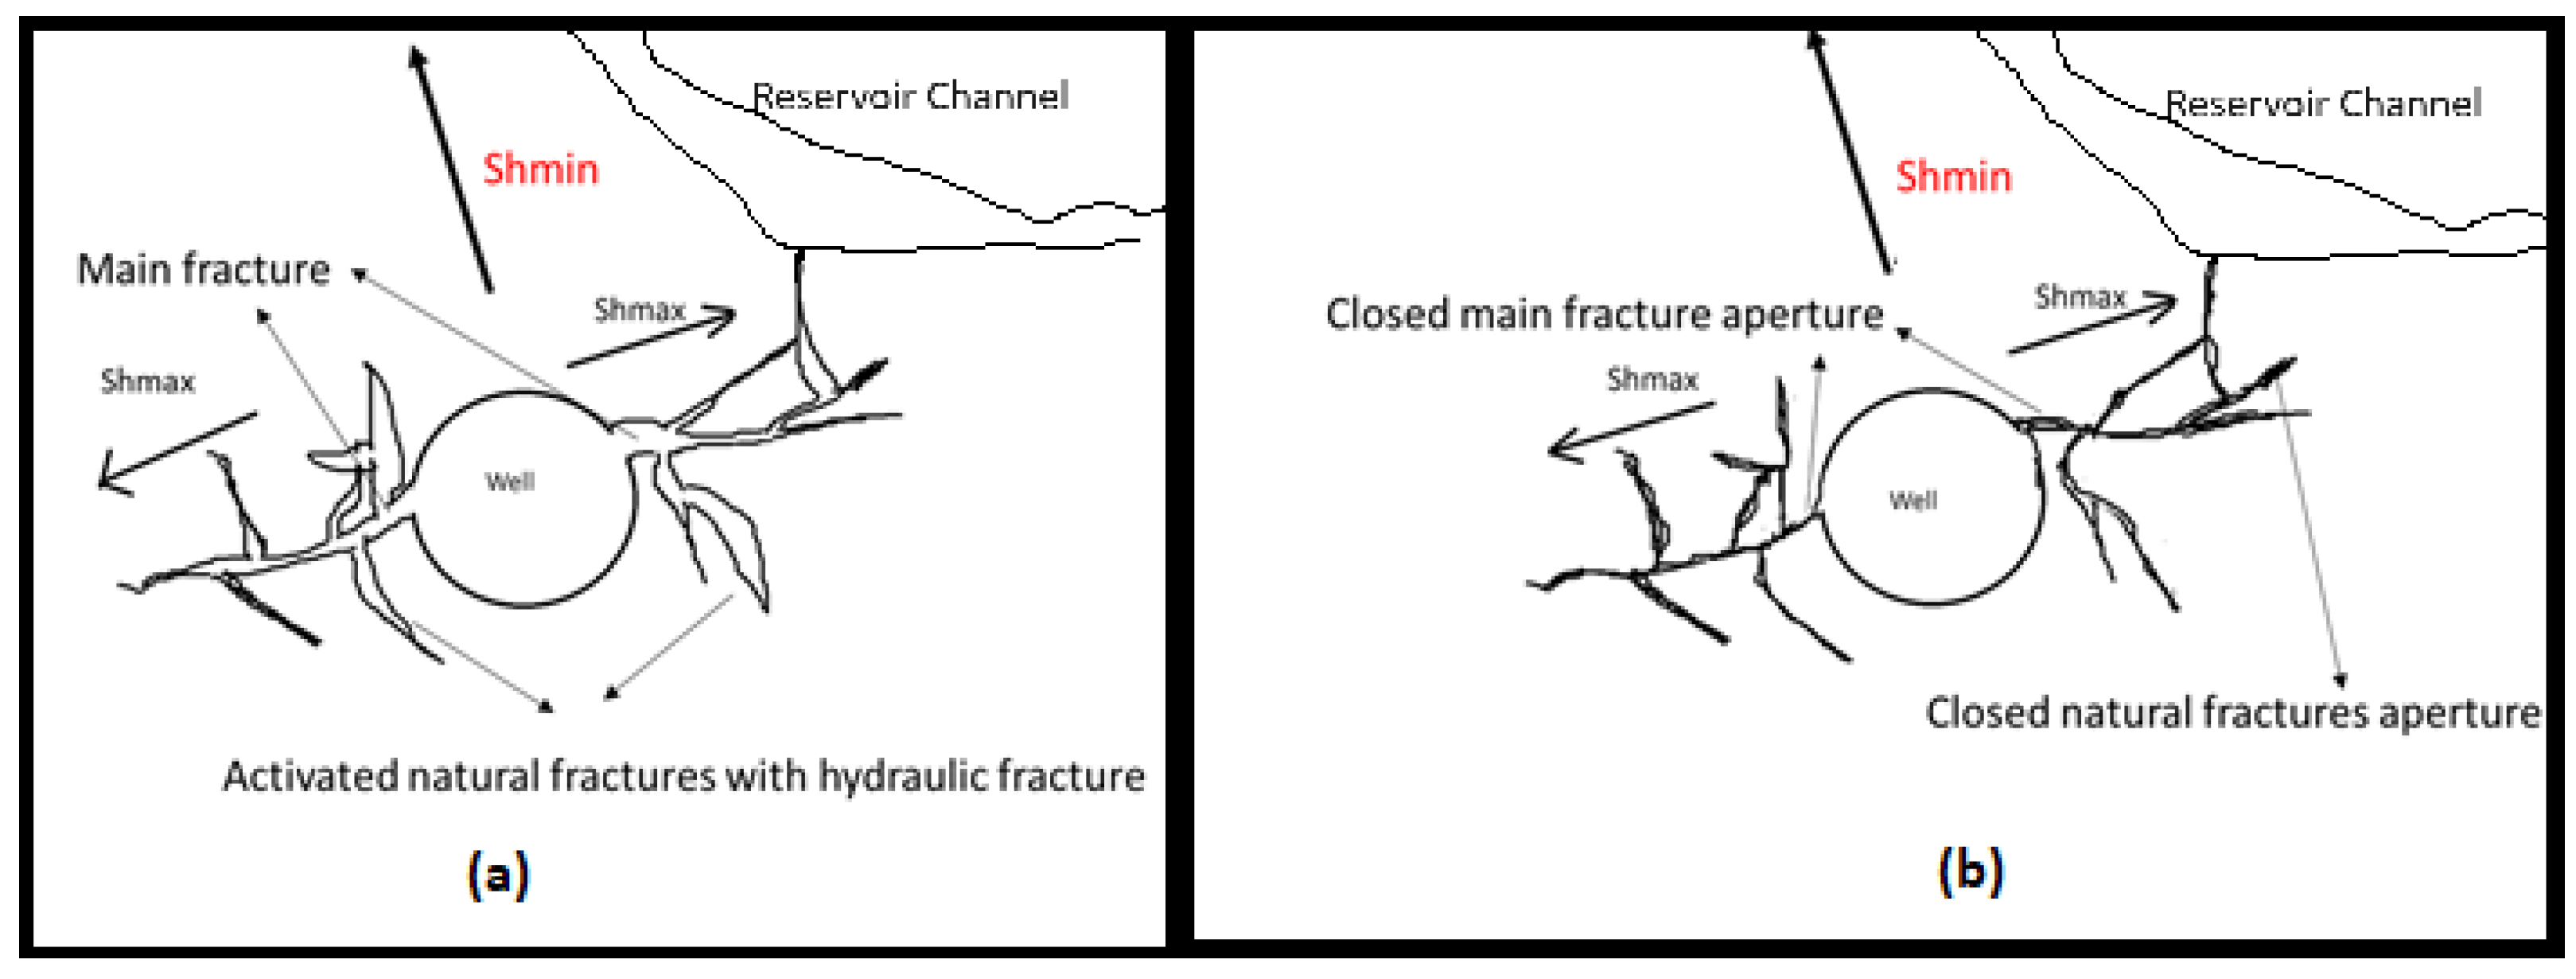
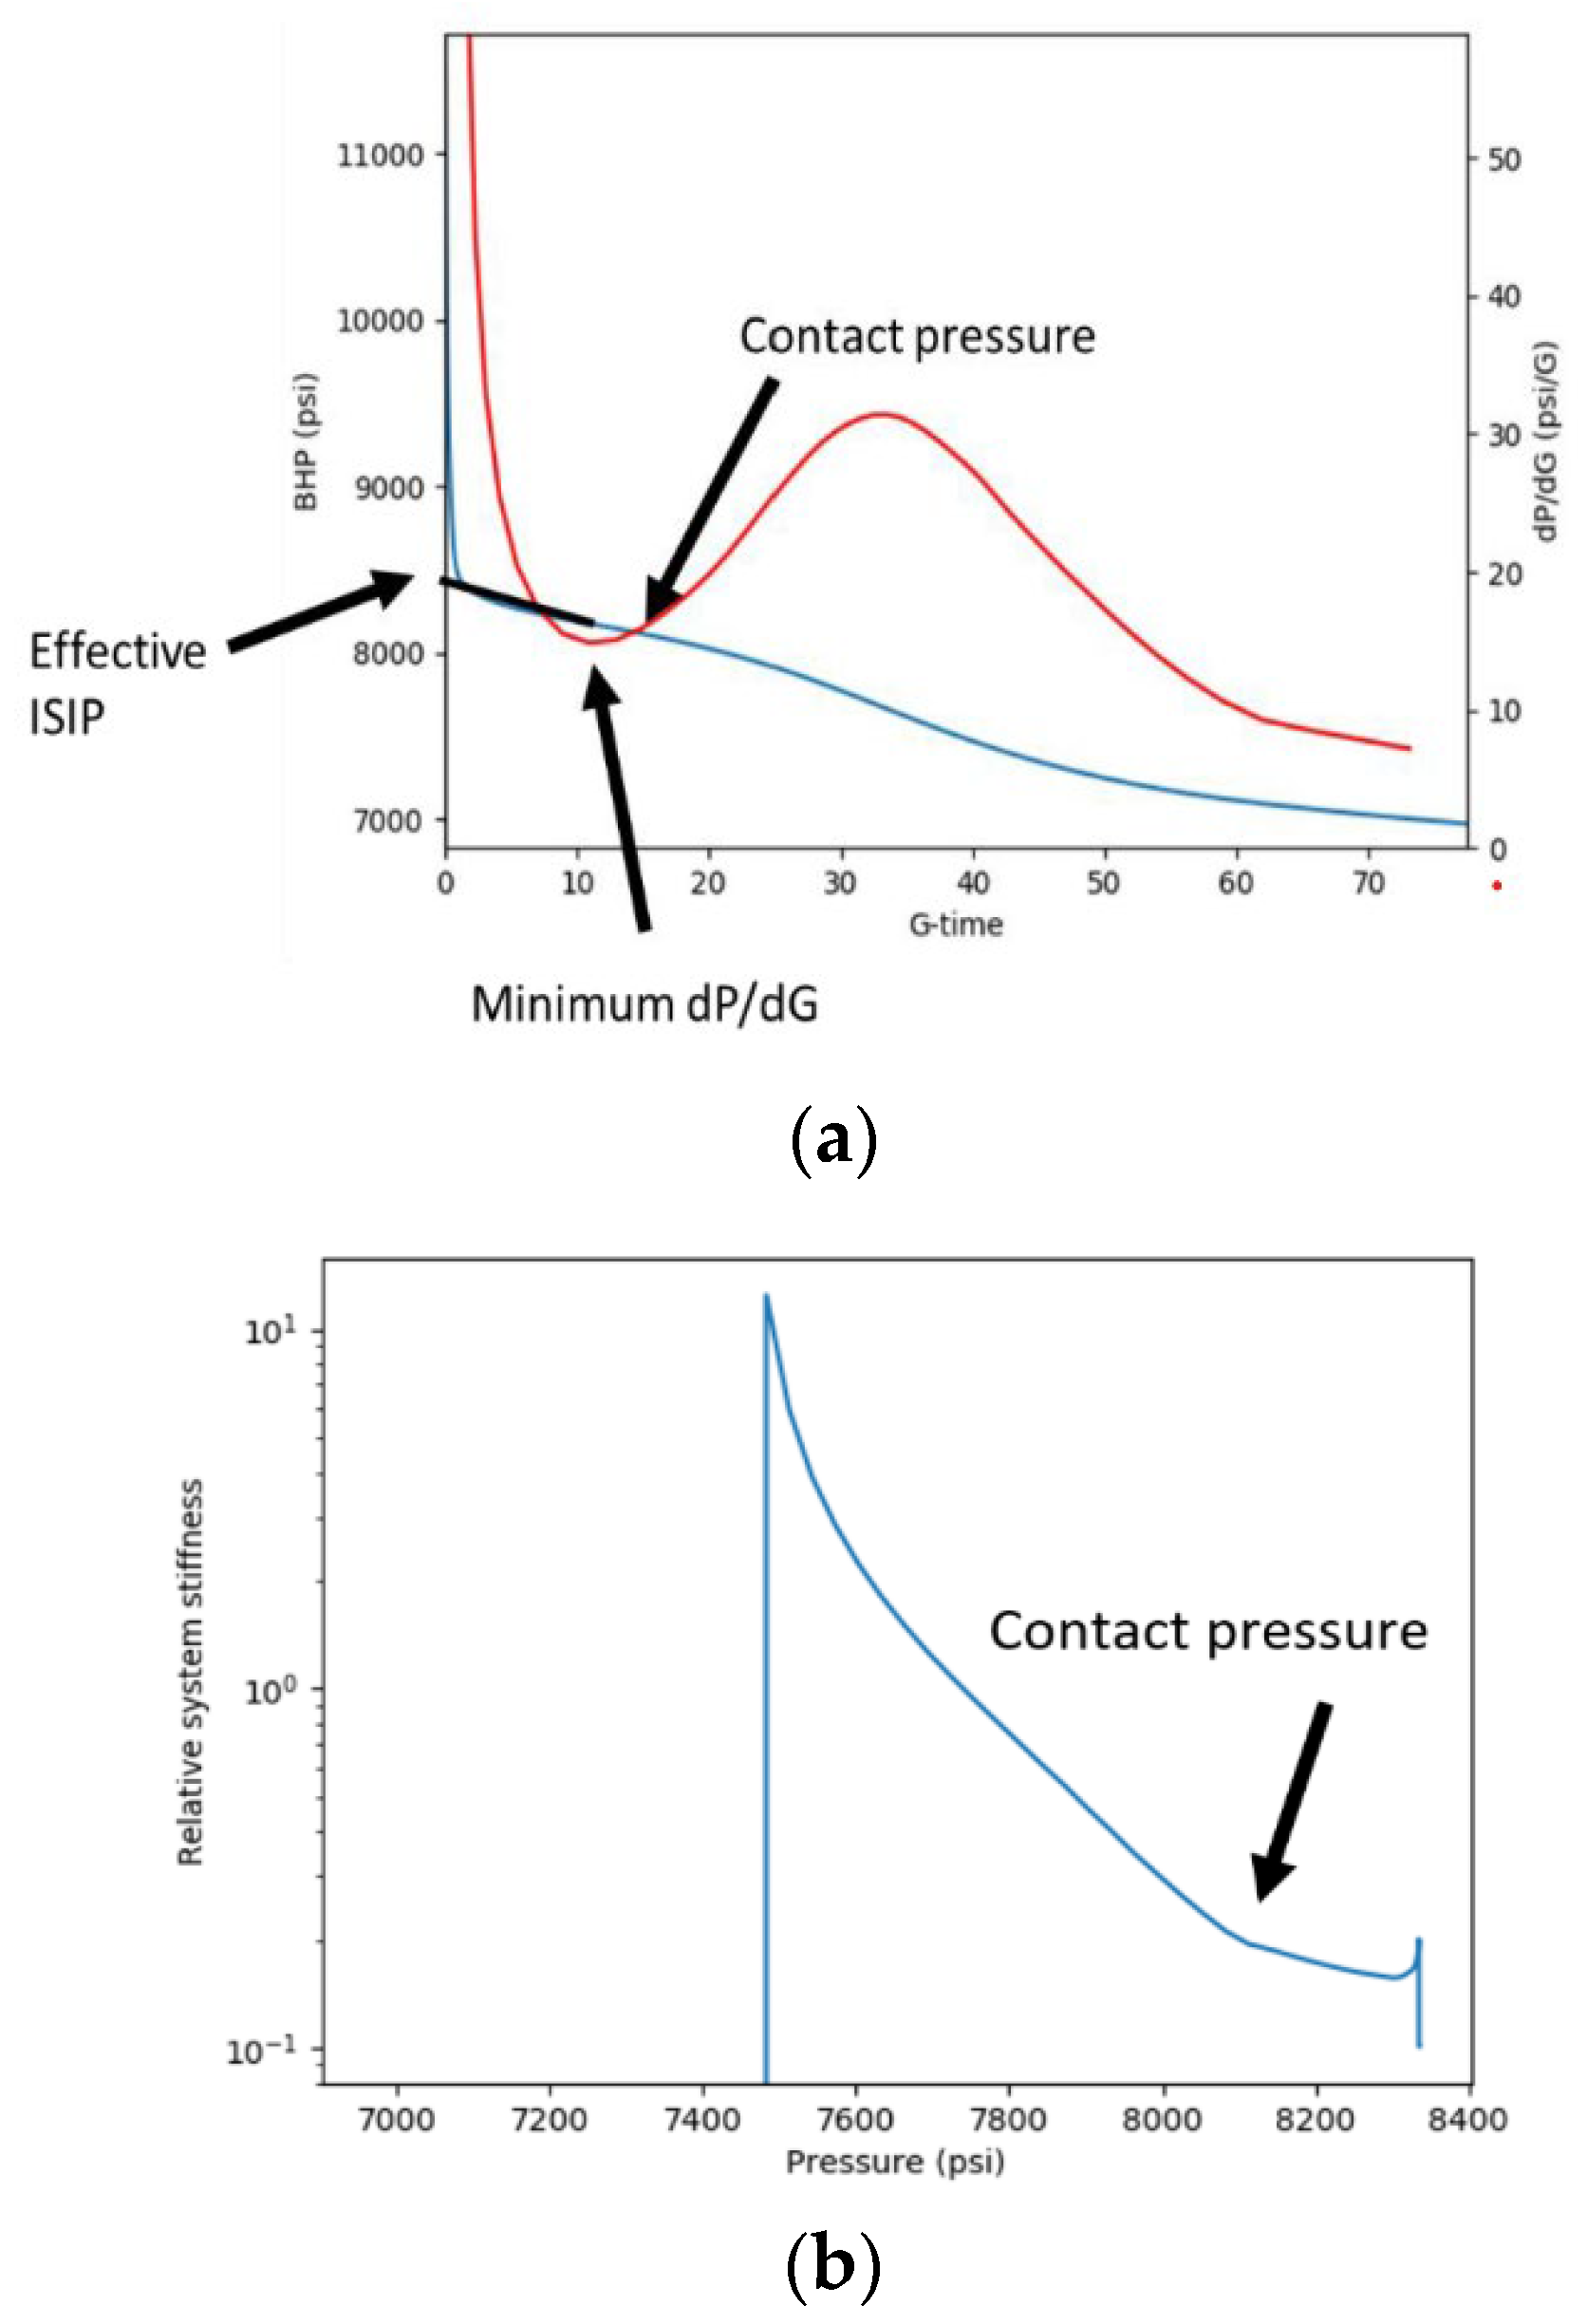
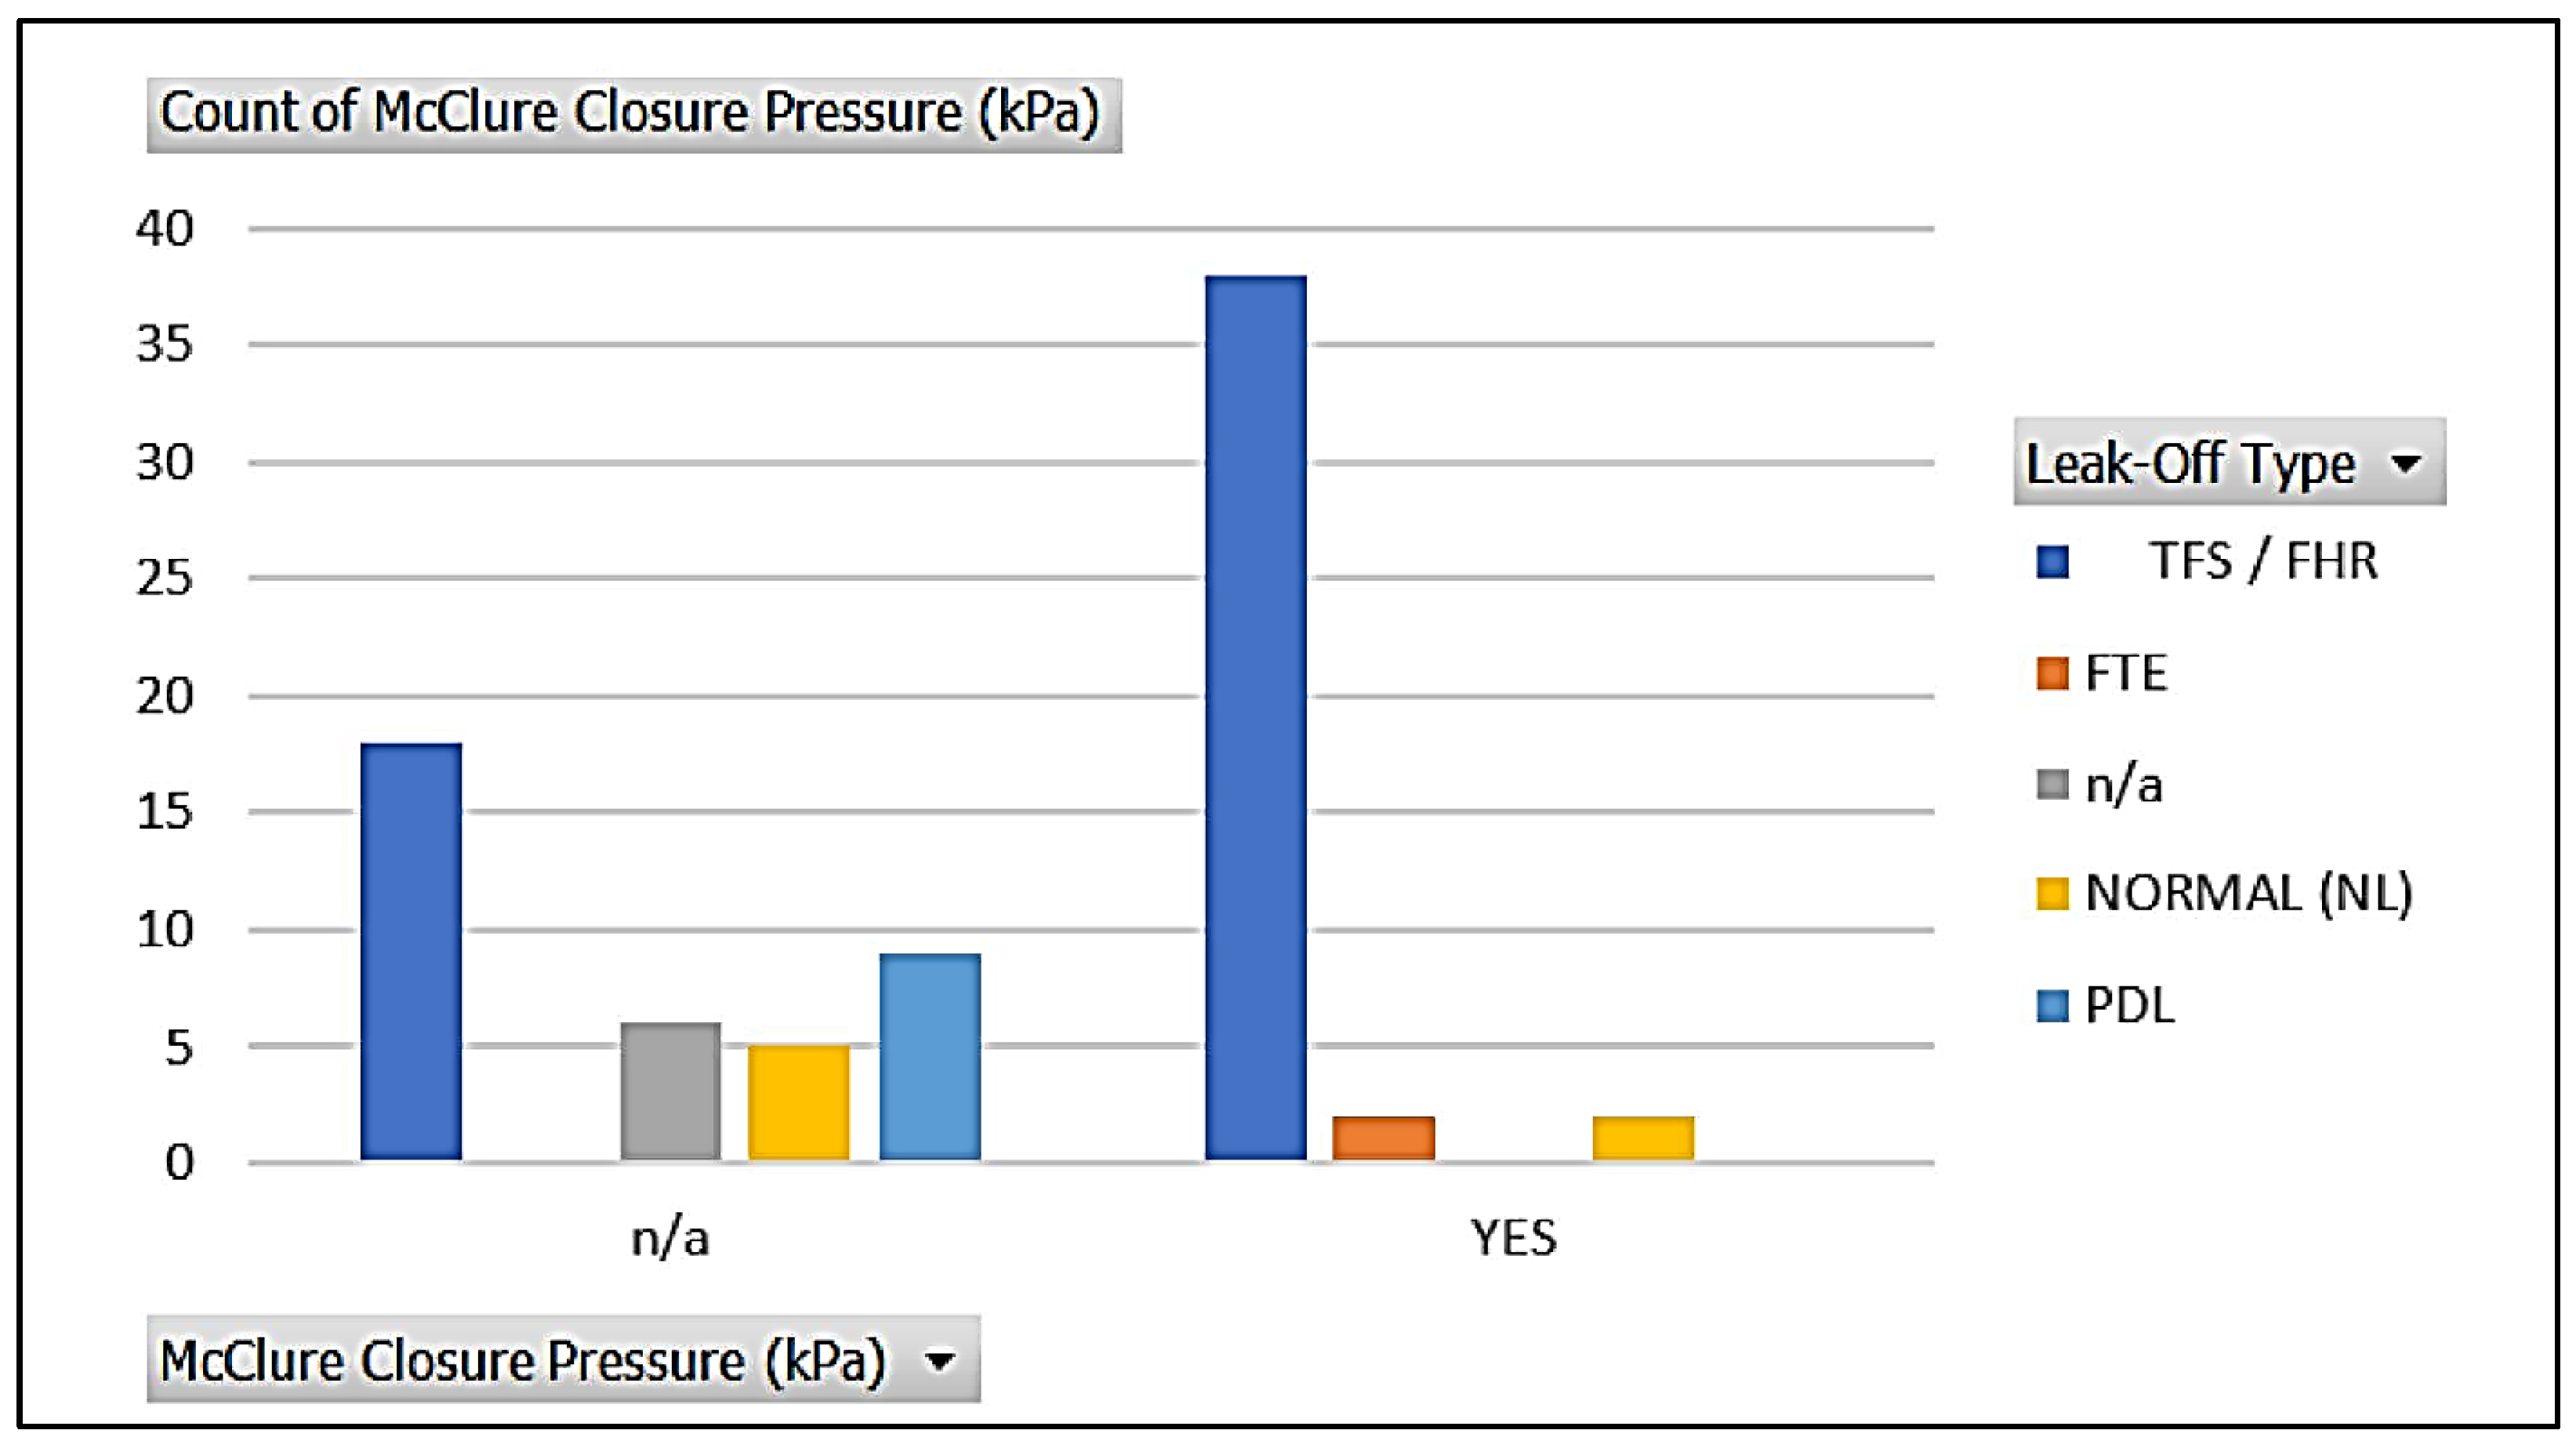
- In naturally fractured reservoirs, there is no significant increase in system stiffness post-closure due to residual apertures remaining after disturbance. Higher fracture permeability results in lower system stiffness, and as a result, DFITs in these reservoirs, initially in equilibrium with natural fractures, do not exhibit an observable increase in system stiffness, rendering the compliance method ineffective for detecting fracture closure in this scenario.
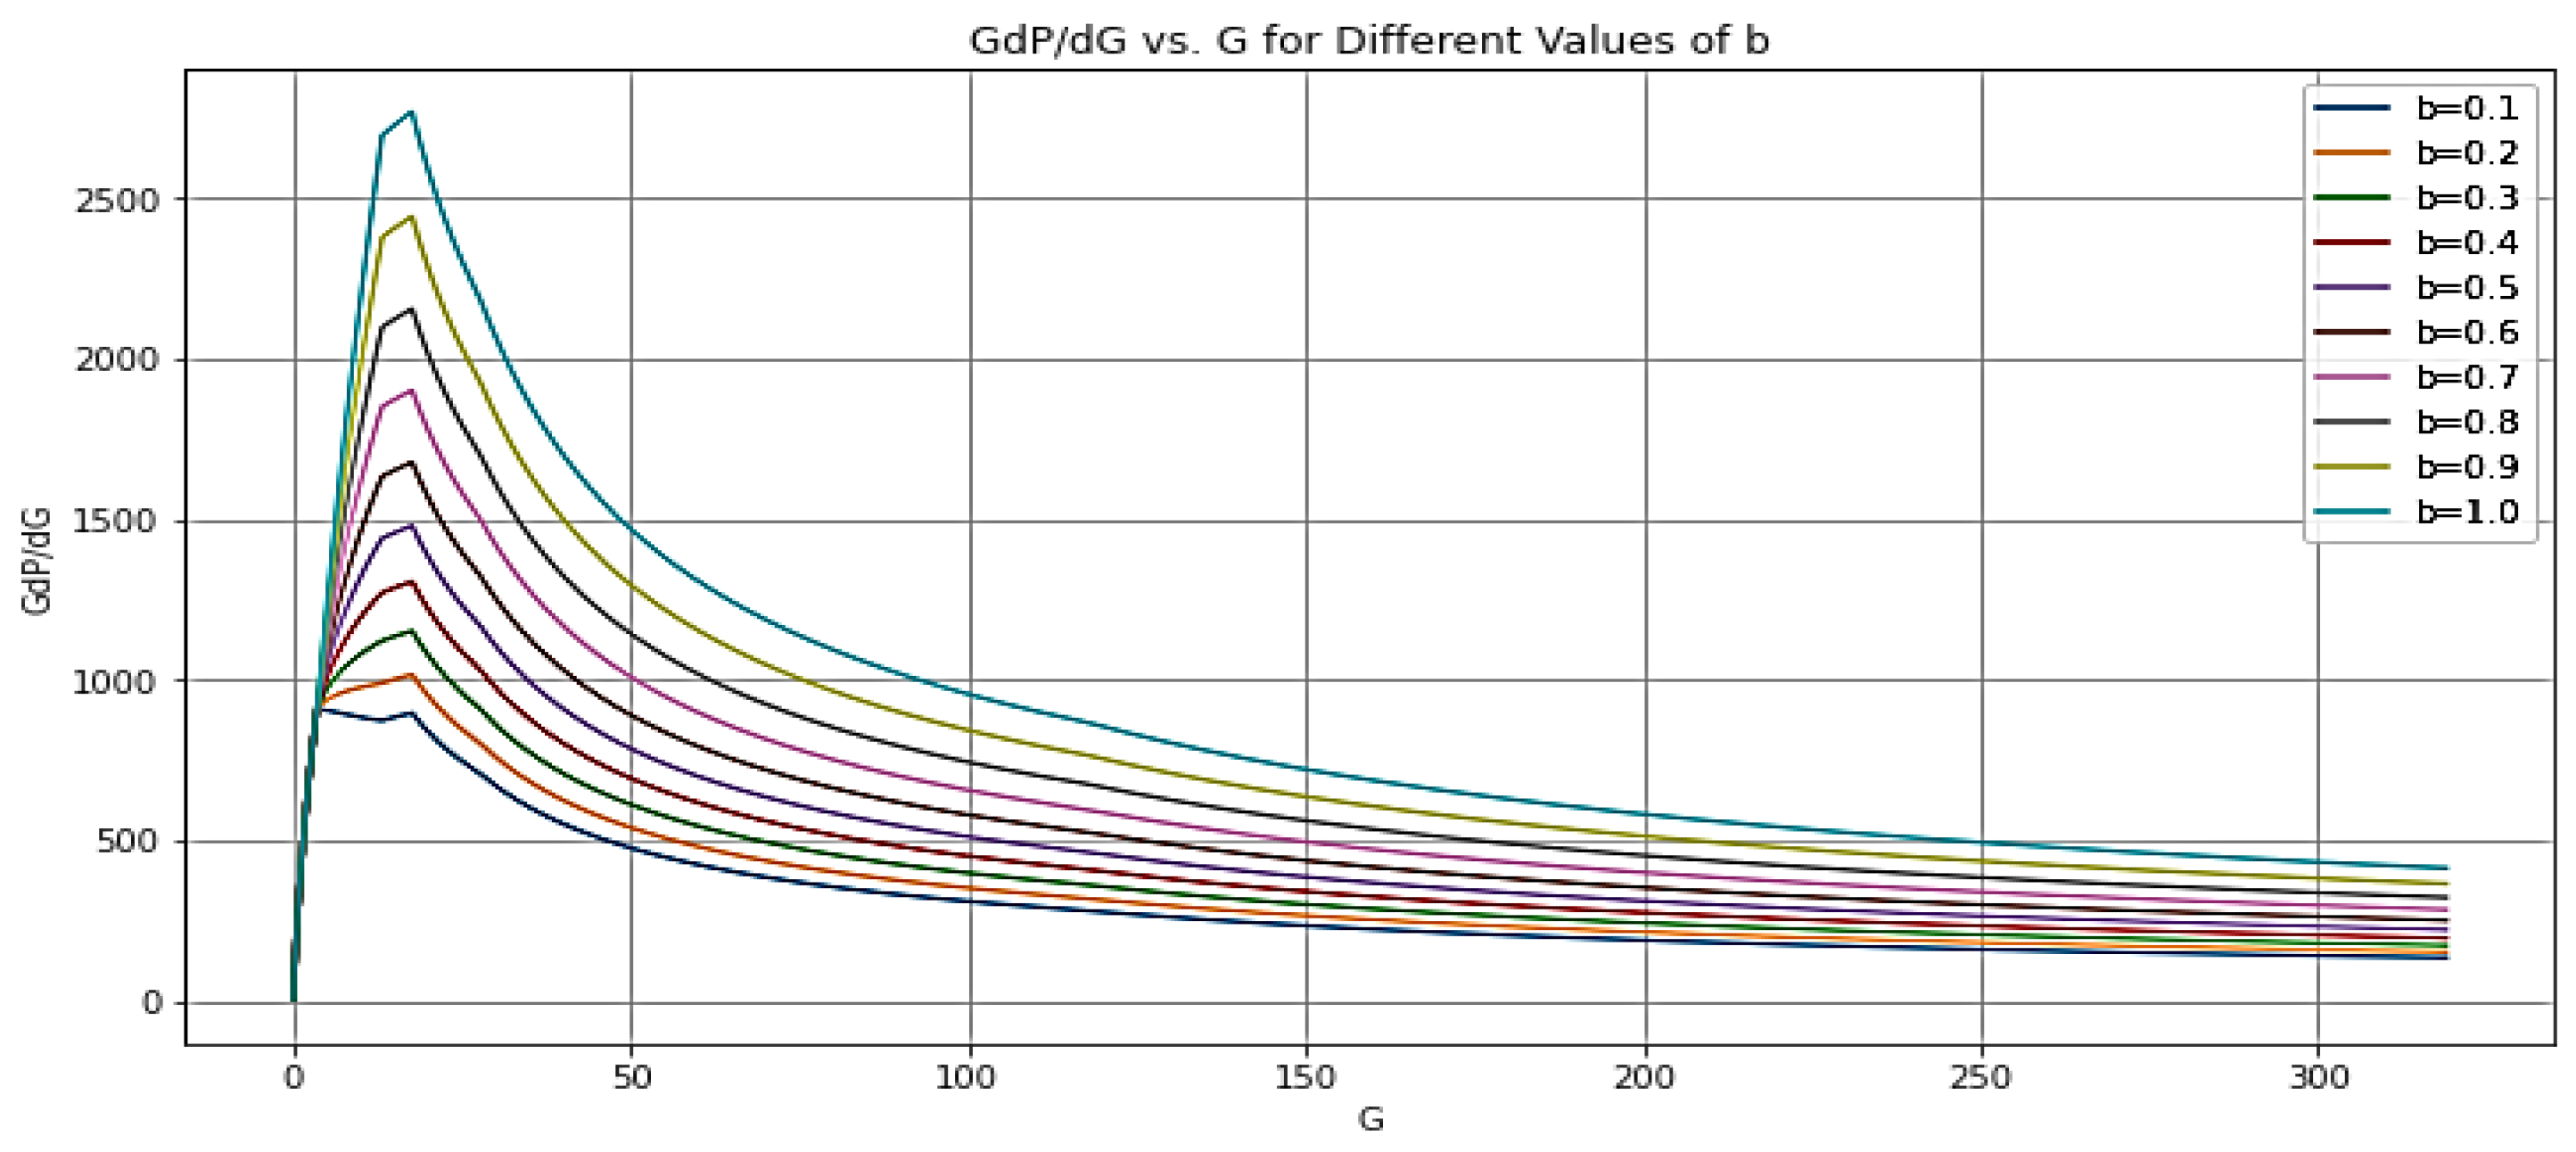
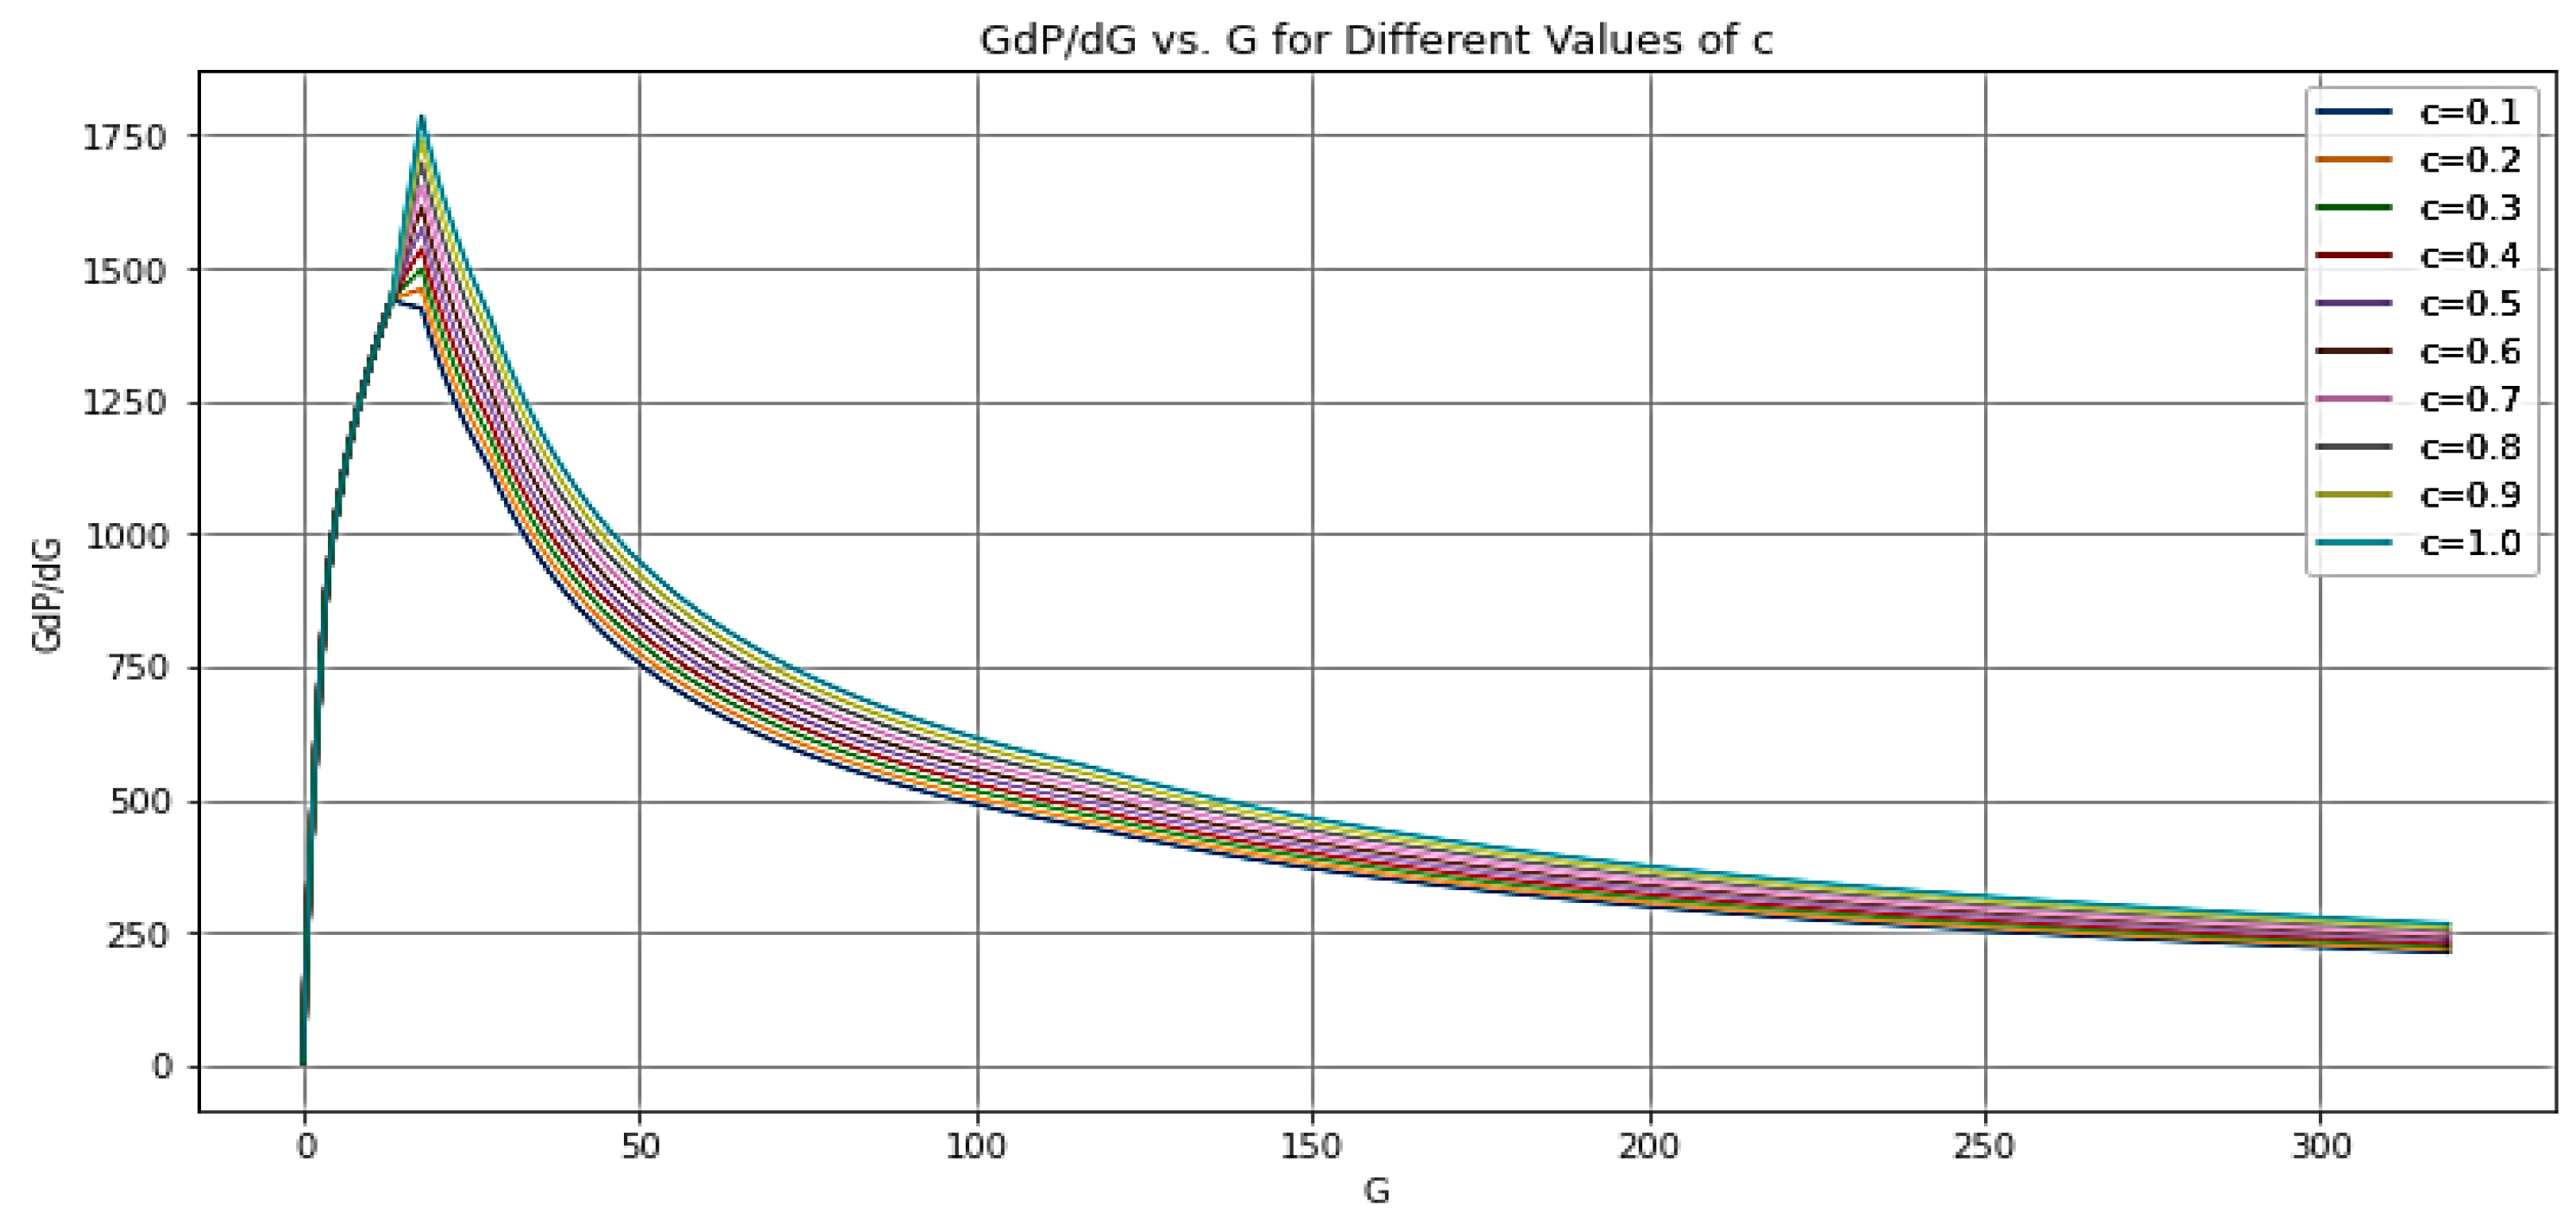
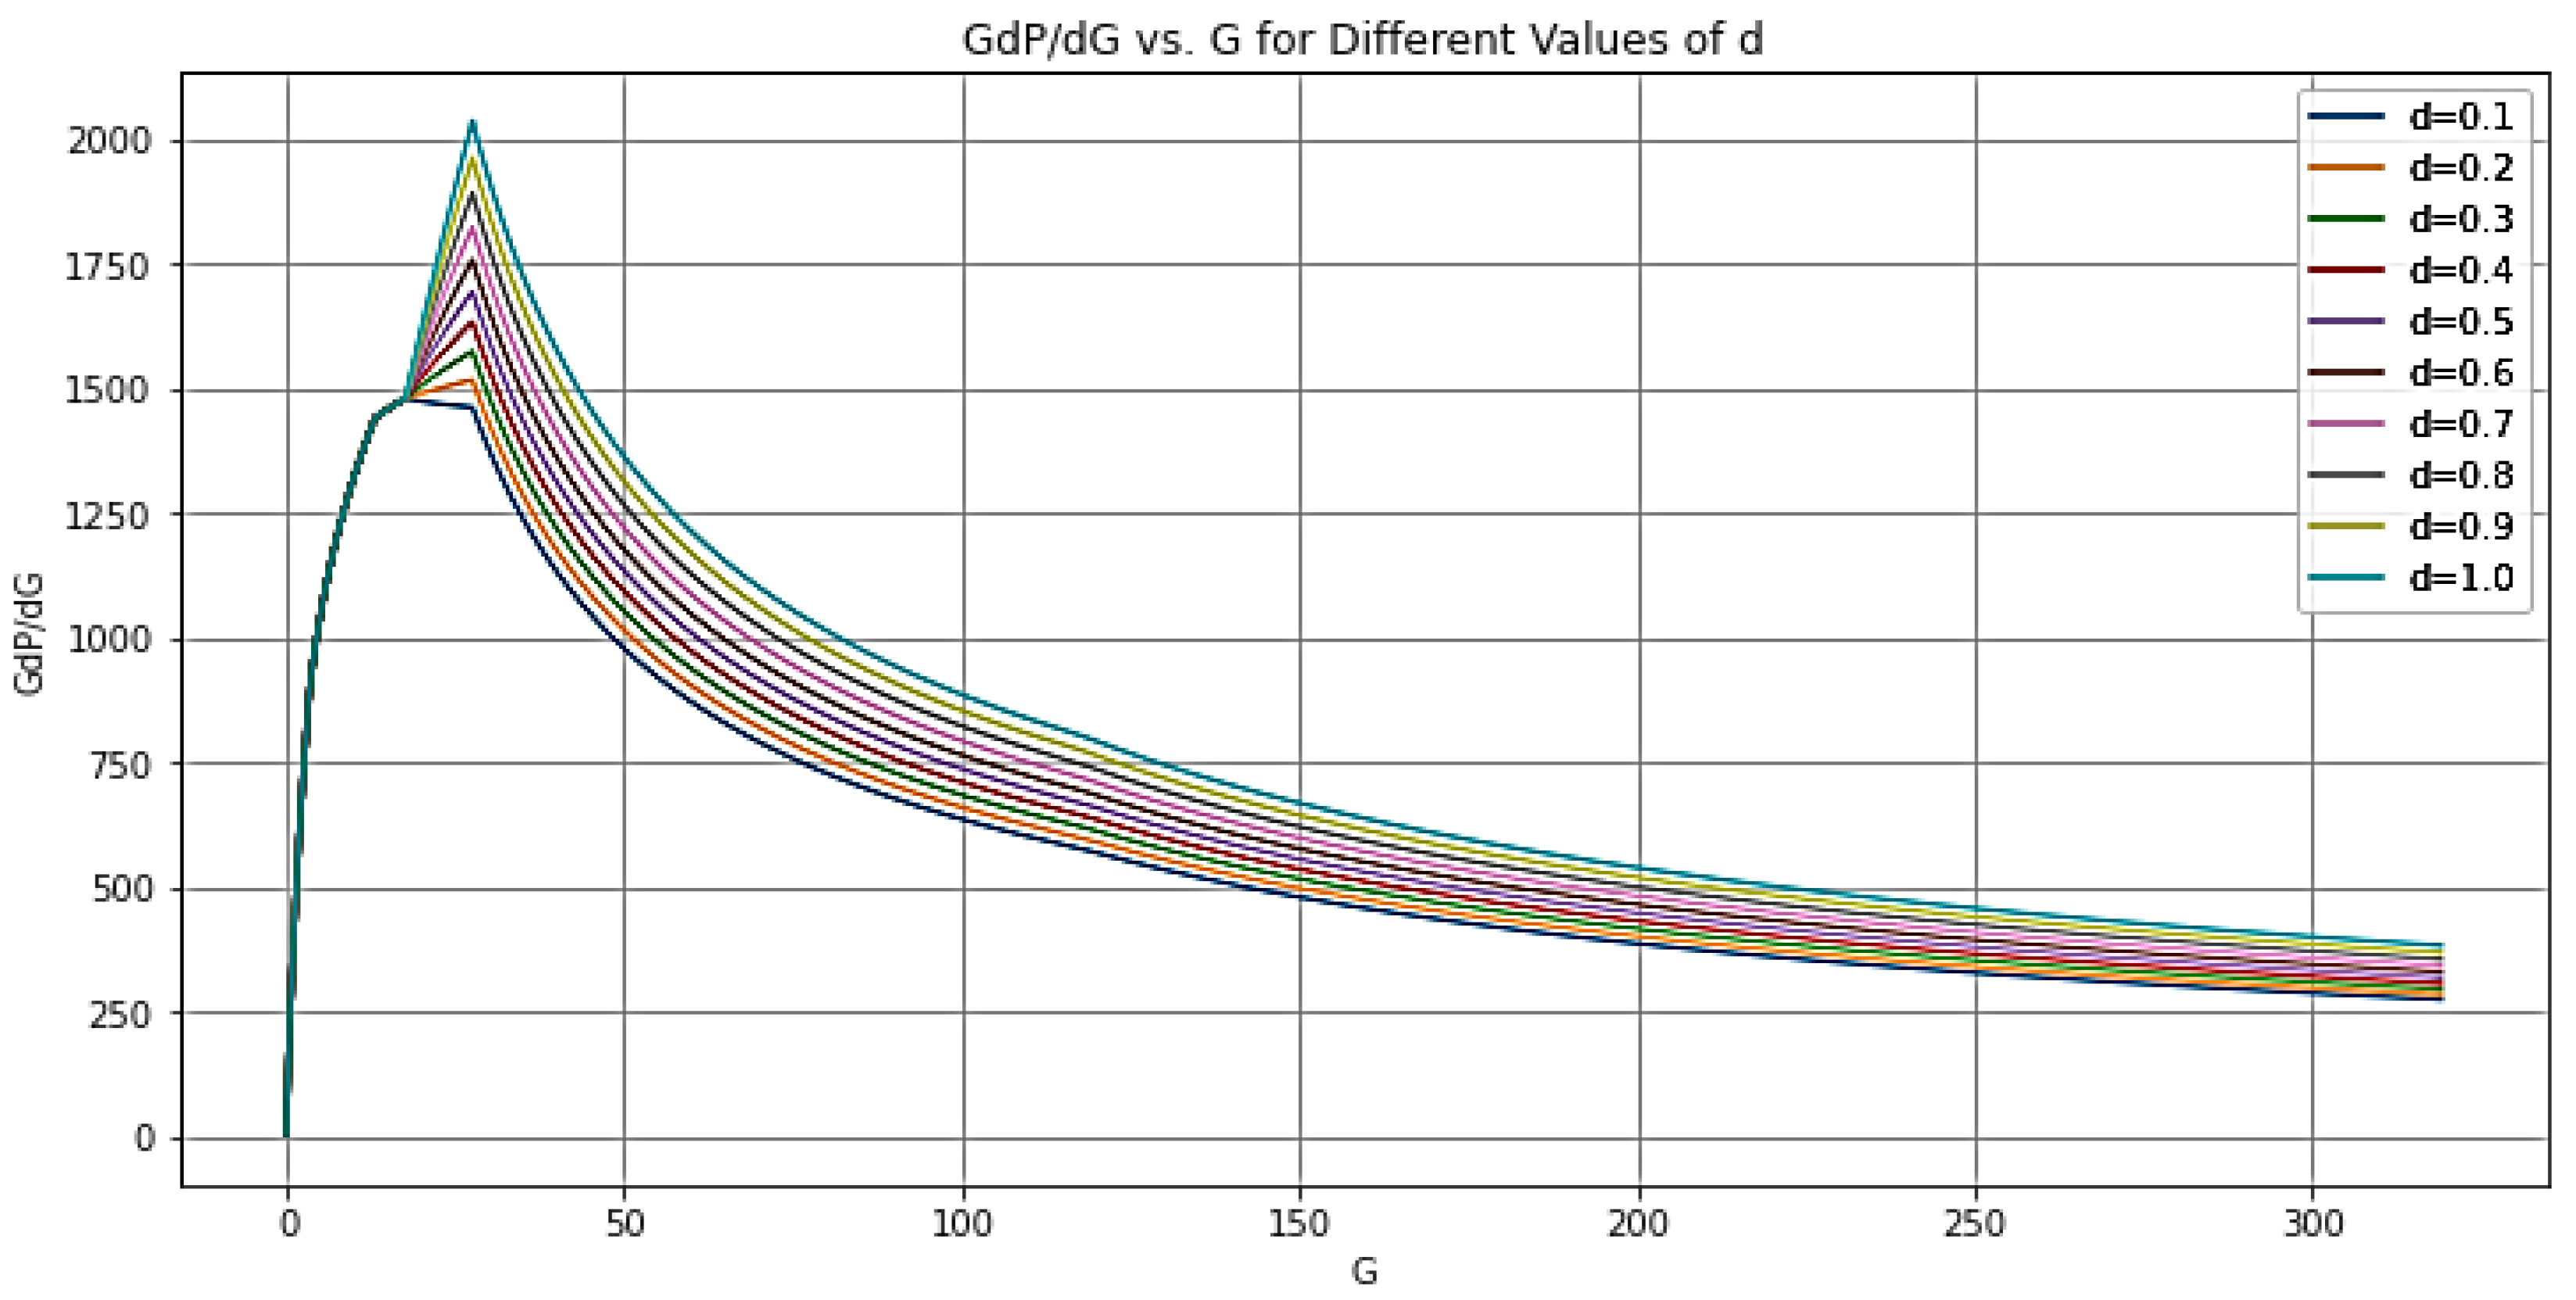
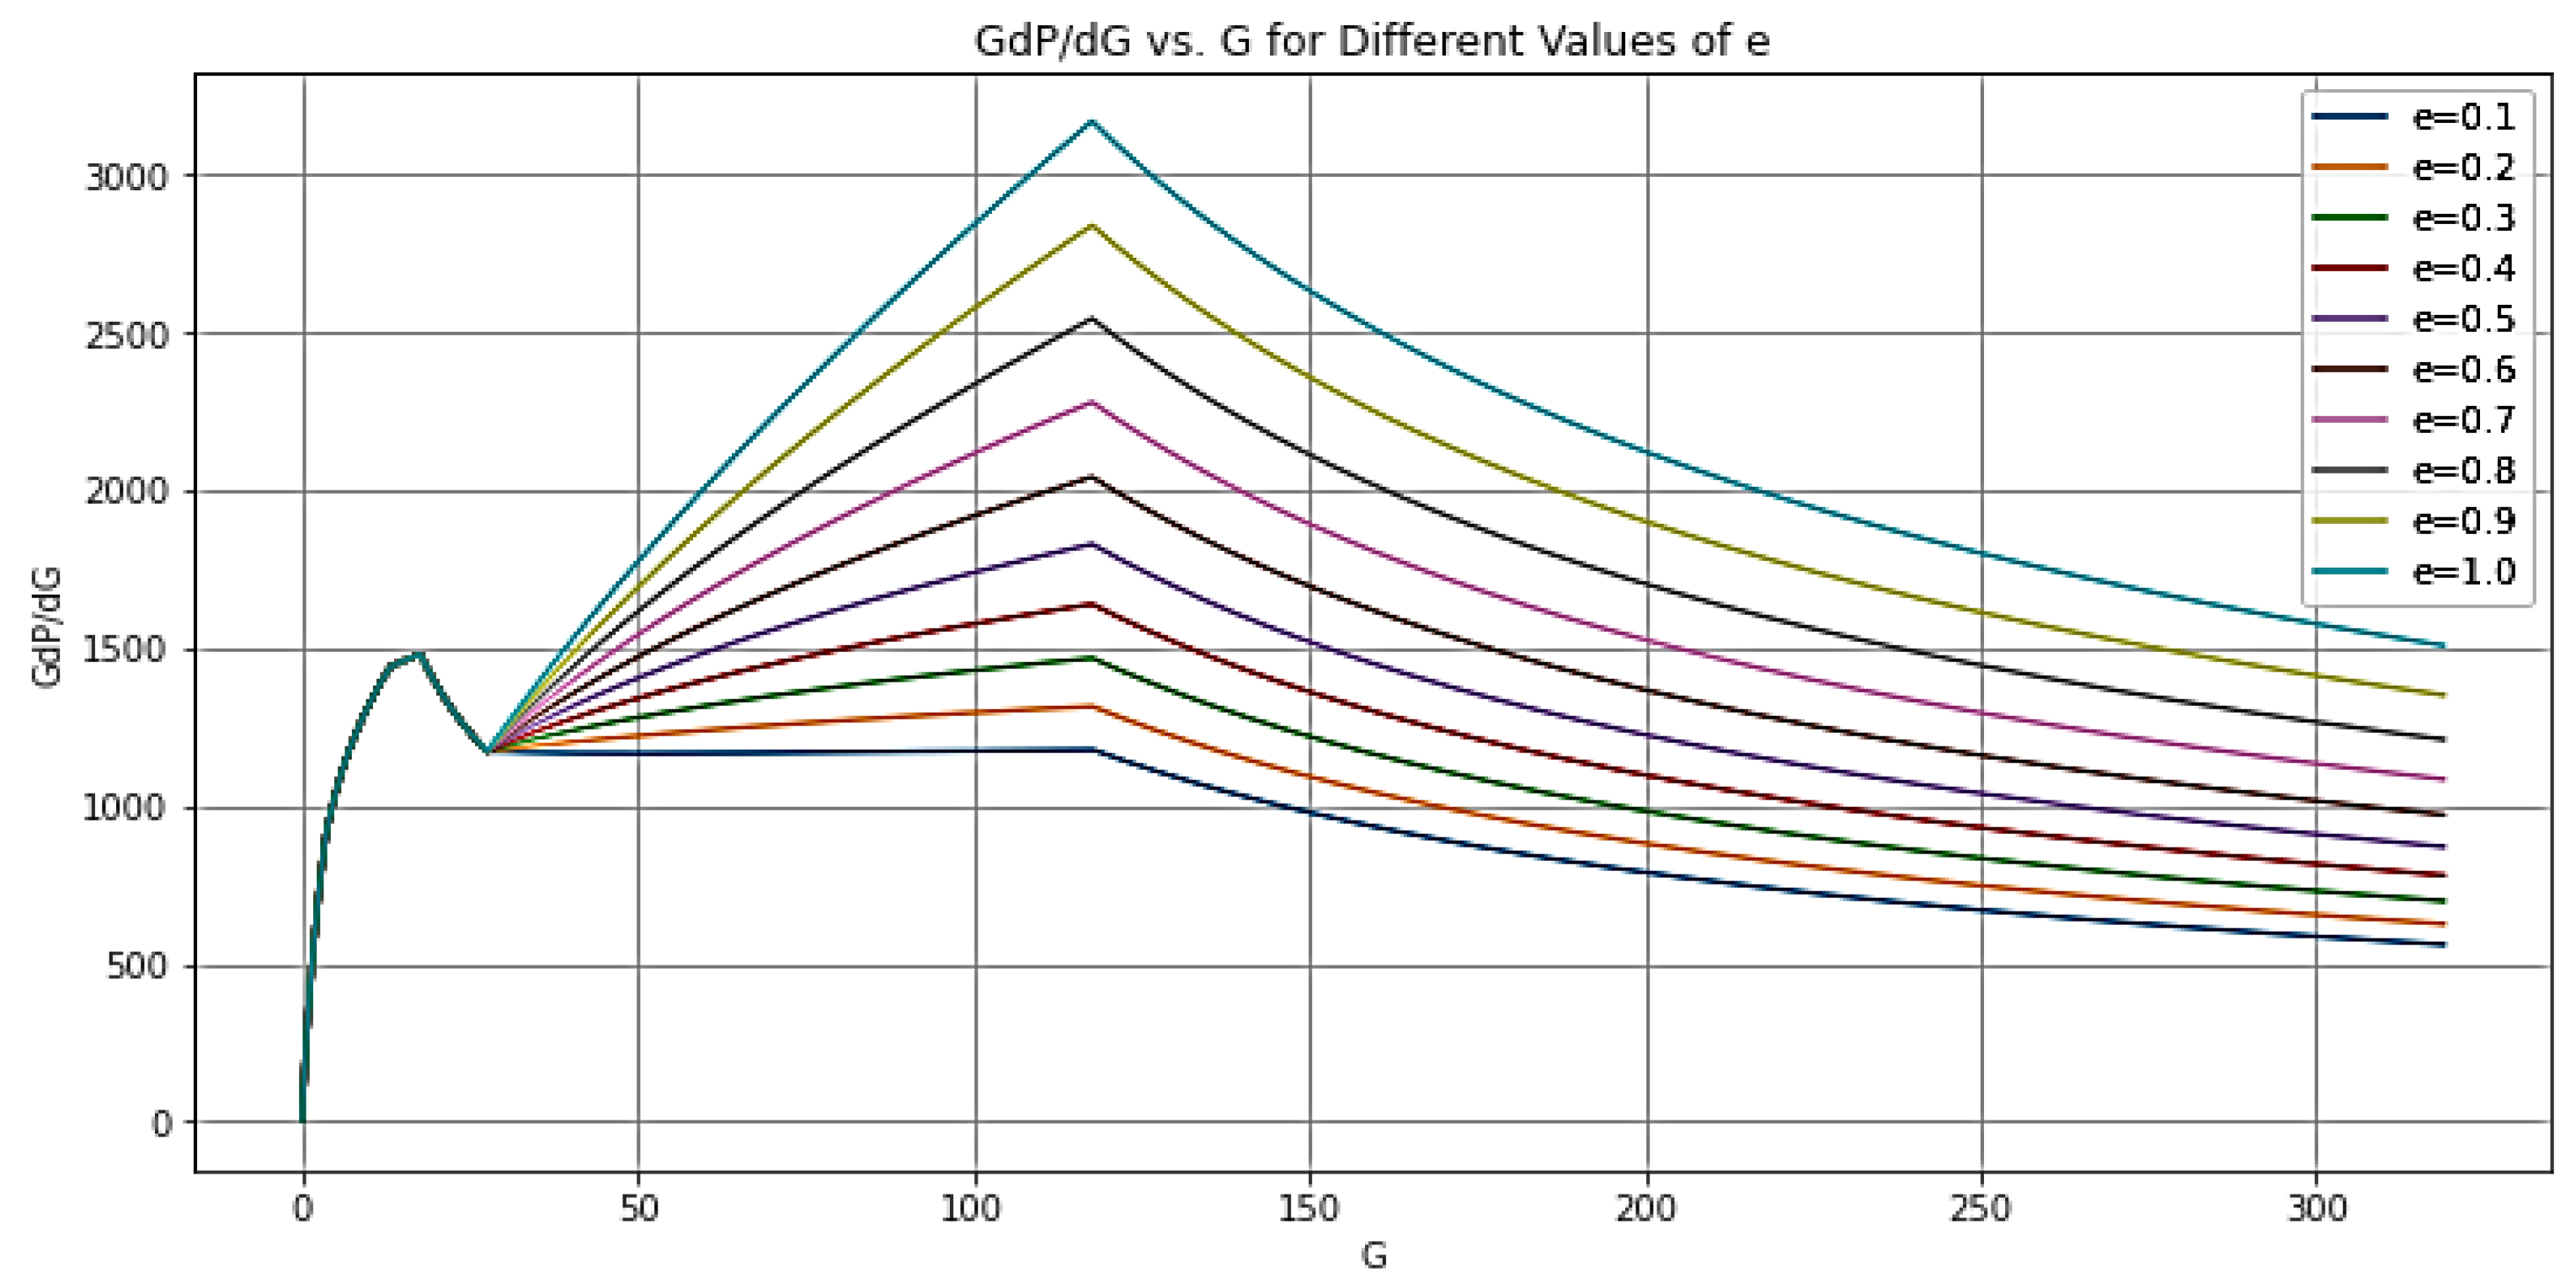
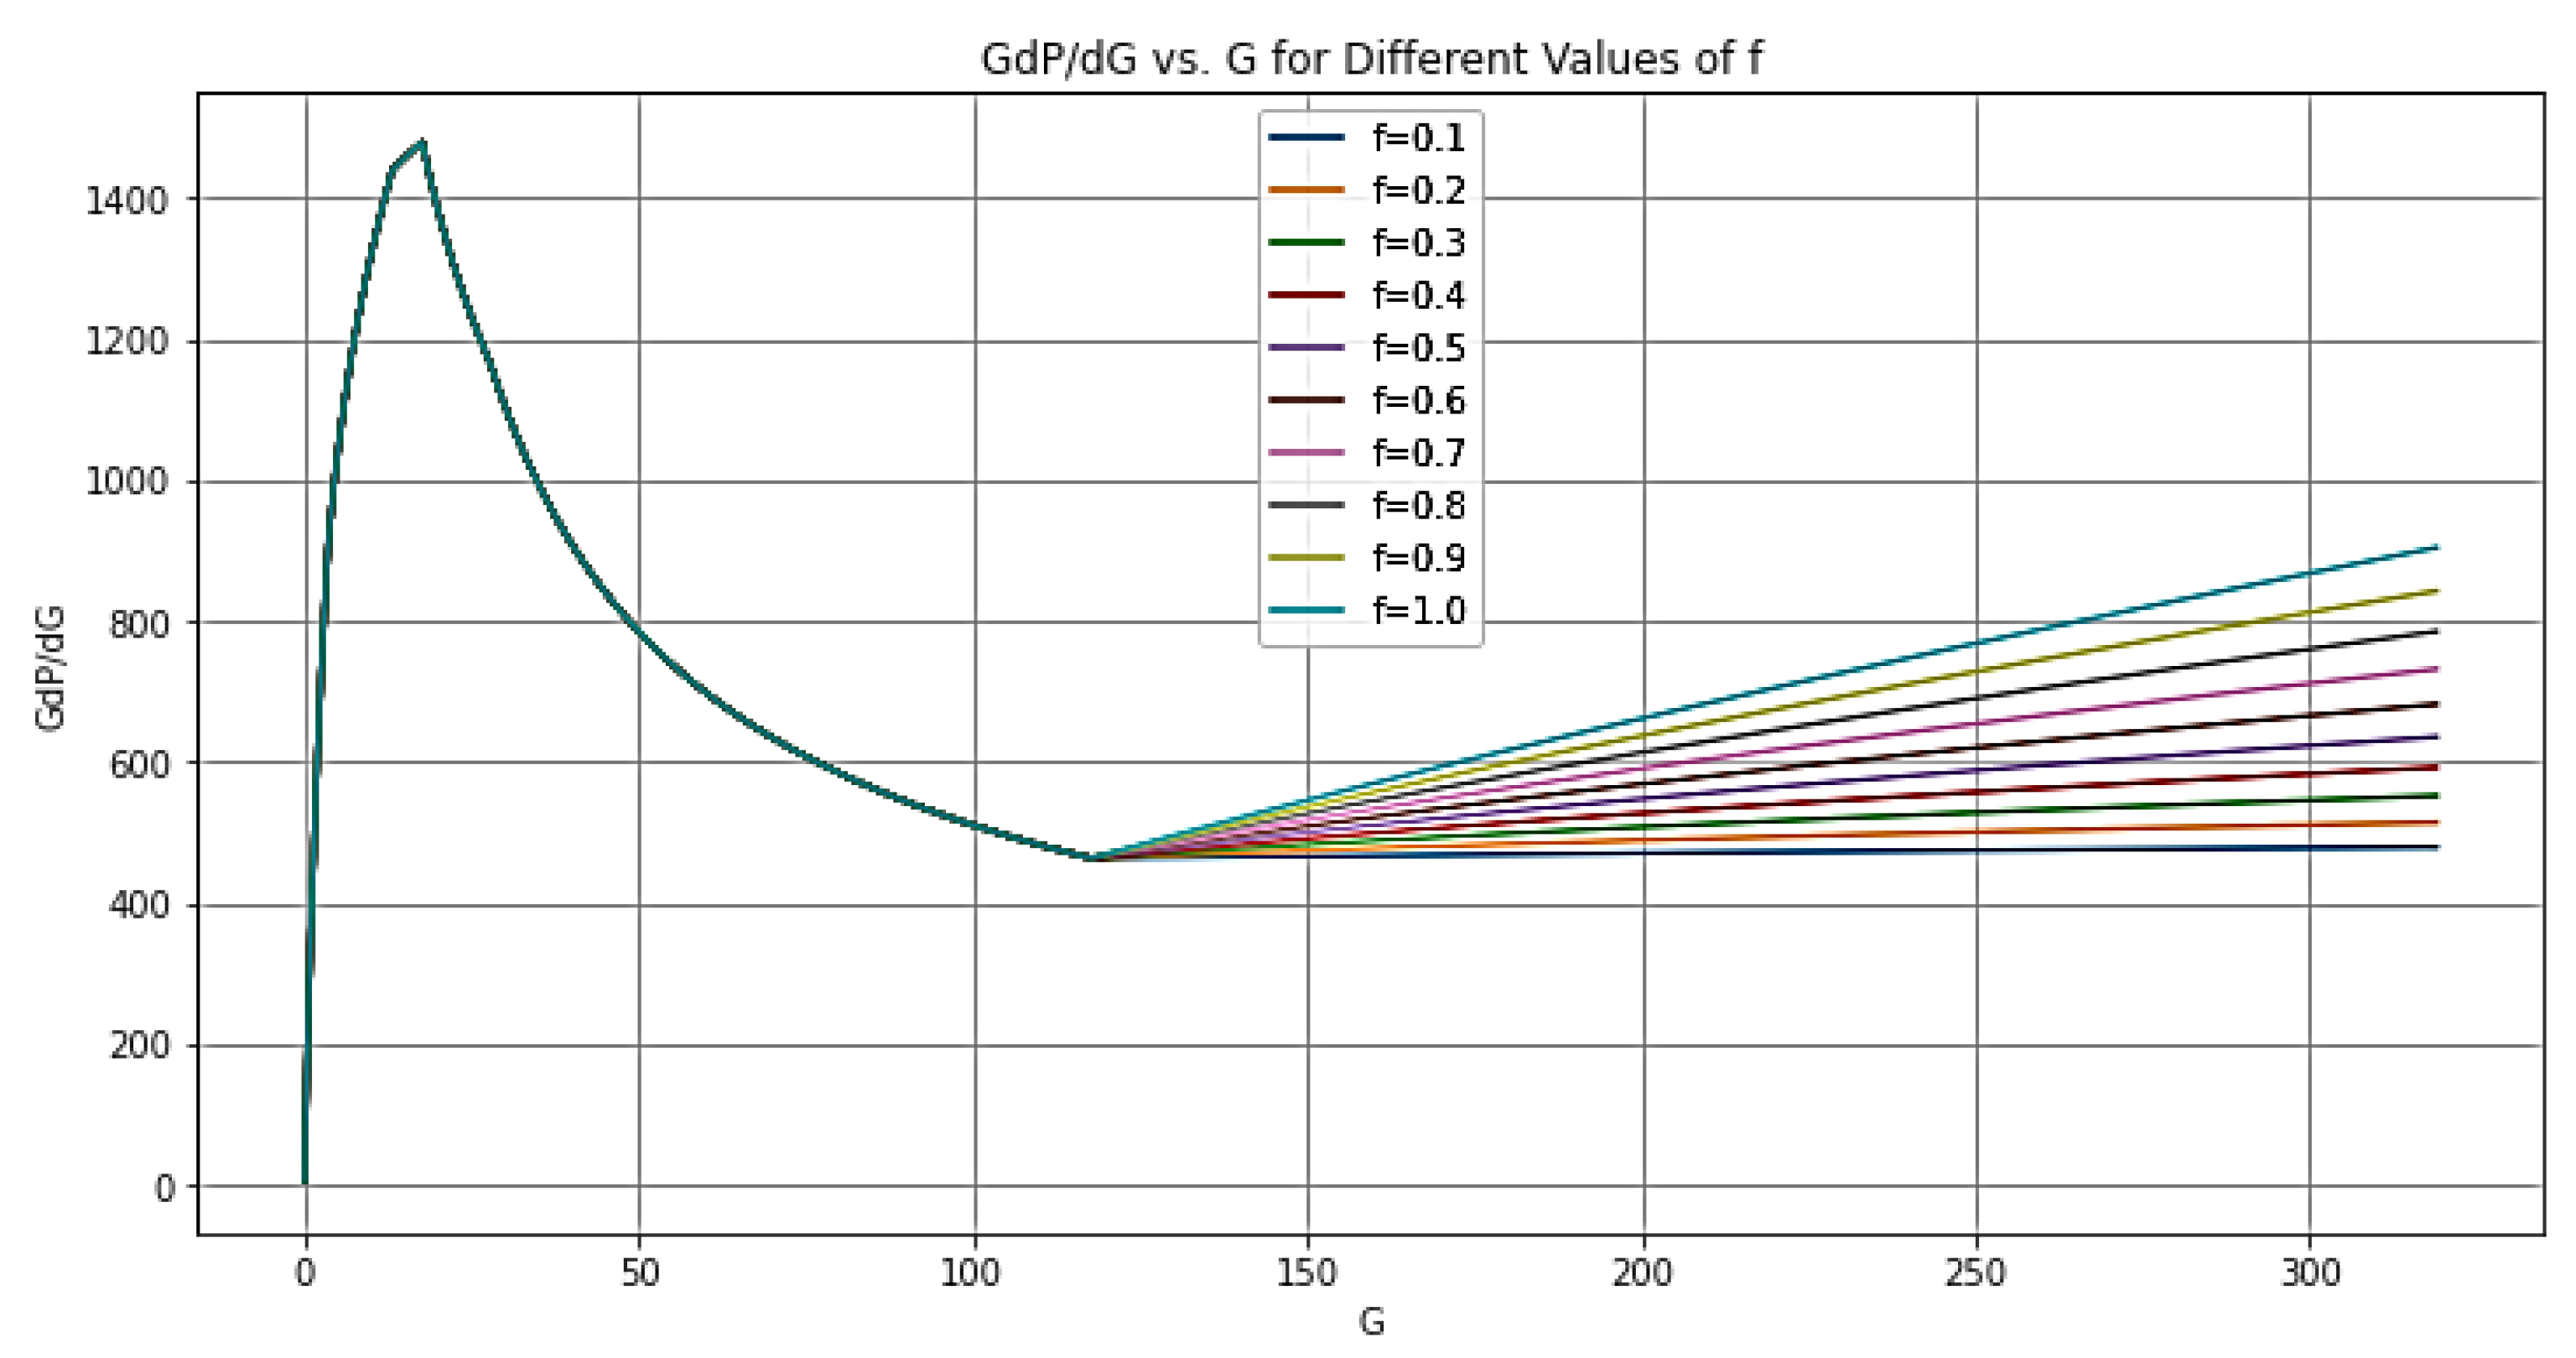
- The tangent method is crucial for identifying different leak-off regimes, which are essential for fracture closure detection. Recognizing the source of leak-off permeability, understanding rock properties, and assessing natural fracture intensity is vital for selecting the most appropriate model for detecting fracture closure. Tangent method models may be used to analyze naturally fractured reservoirs and estimate the volume of natural fractures or transverse storage laminas. The tangent method is influenced by disturbances in the flow regime after fracture closure, which may cause a monotonic increase in the GdP/dG vs. G time plot during field application.
- The compliance method can enhance reservoir evaluation by assessing system stiffness. Combining both the tangent and compliance methods, along with the continuous wavelet transform (CWT) fracture closure detection technique, offers a more reliable approach to identifying fracture closure.
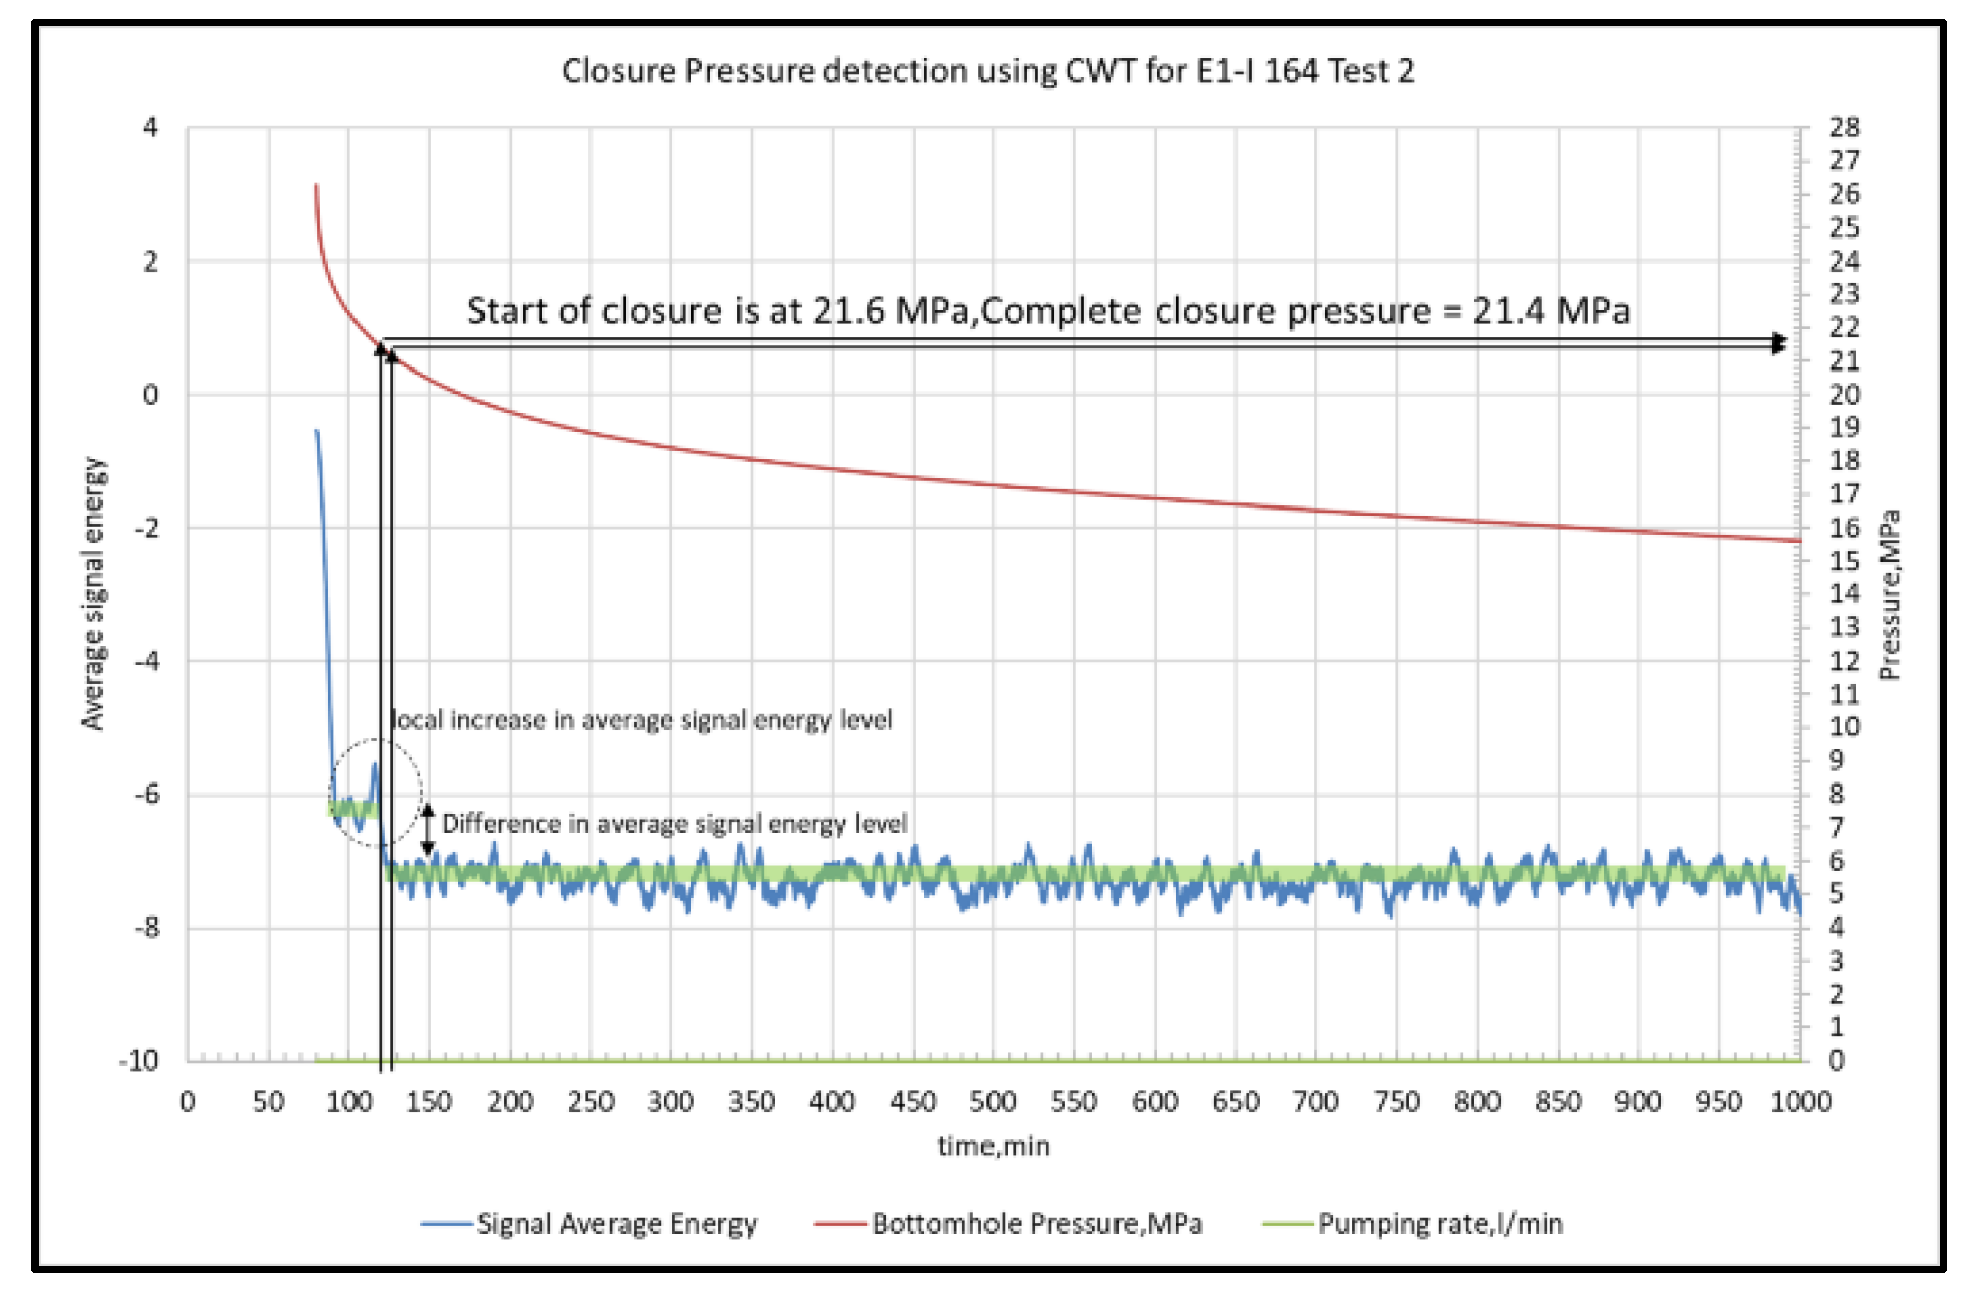
- The CWT fracture closure detection technique provides a powerful analysis technique to detect fracture closure without any pre-assumptions or simplification, as it is based on data analysis. The CWT technique can detect all features embedded in DFIT shut-in pressure.
Author Contributions
Conflicts of Interest
Informed Consent Statement
Funding
References
- Teufel, L.W.; Clark, J.A. Hydraulic fracture propagation in layered rock: experimental studies of fracture containment. Soc. Pet. Eng. J. 1984, 24, 19–32. [Google Scholar] [CrossRef]
- Hubbert, M.K.; Willis, D.G. Mechanics of hydraulic fracturing. Trans. AIME 1957, 210, 153–168. [Google Scholar] [CrossRef]
- Godbey, J.K.; Hodges, H.D. Pressure measurements during formation fracturing operations. Trans. AIME 1958. [Google Scholar] [CrossRef]
- Kehle, R.O. The determination of tectonic stresses through analysis of hydraulic well fracturing. J. Geophys. Res. 1964, 69, 259–273. [Google Scholar] [CrossRef]
- Haimson, B.; Fairhurst, C. Initiation and extension of hydraulic fractures in rocks. Soc. Pet. Eng. J. 1967, 7, 310–318. [Google Scholar] [CrossRef]
- Zoback, M.D.; Hickman, S. In situ study of the physical mechanisms controlling induced seismicity at Monticello Reservoir, South Carolina. J. Geophys. Res.: Solid Earth 1982, 87, 6959–6974. [Google Scholar] [CrossRef]
- McLennan, J.D.; Roegiers, J.C. How instantaneous are instantaneous shut-in pressures? In Proceedings of the SPE Annual Technical Conference and Exhibition, New Orleans, LA, USA, 26–29 September 1982; Society of Petroleum Engineers: , 1982; pp. SPE–11064. [Google Scholar]
- Mayerhofer, M.J.; Economides, M.J. Permeability estimation from fracture calibration treatments. In Proceedings of the SPE Western Regional Meeting, Anchorage, AK, USA, 26–28 May 1993; Society of Petroleum Engineers: pp. SPE–26039, 1993. [Google Scholar]
- Nolte, K.G. Determination of fracture parameters from fracturing pressure decline. In Proceedings of the SPE Annual Technical Conference and Exhibition, Las Vegas, NV, USA, 23–26 September 1979; Society of Petroleum Engineers: pp. SPE–8341, 1979. [Google Scholar]
- Mayerhofer, M.J.; Economides, M.J. Permeability Estimation From Fracture Calibration Treatments. In Proceedings of the SPE Western Regional Meeting, Anchorage, Alaska, May 1993. [Google Scholar] [CrossRef]
- Mayerhofer, M.J.; Ehlig-Economides, C.A.; Economides, M.J. Pressure transient analysis of fracture calibration tests. J. Pet. Technol. 1995, 47, 229–234. [Google Scholar] [CrossRef]
- Craig, D.P.; Brown, T.D. Estimating pore pressure and permeability in massively stacked lenticular reservoirs using diagnostic fracture-injection tests. In Proceedings of the SPE Annual Technical Conference and Exhibition, Houston, TX, USA, 3–6 October 1999; Society of Petroleum Engineers: pp. SPE–56600, 1999. [Google Scholar]
- Smith, M.B. Hydraulic Fracturing; CRC Press: Boca Raton, FL, USA, 2015. [Google Scholar]
- Theis, C.V. The relation between the lowering of the piezometric surface and the rate and duration of discharge of a well using ground-water storage. Trans. Am. Geophys. Union 1935, 16, 519–524. [Google Scholar] [CrossRef]
- Horne, R.; Temeng, K.O. Relative productivities and pressure transient modeling of horizontal wells with multiple fractures. In Proceedings of the SPE Middle East Oil and Gas Show and Conference, Manama, Bahrain, 11–14 March 1995; Society of Petroleum Engineers: pp. SPE–29891, 1995. [Google Scholar]
- Castillo, J.L. Modified fracture pressure decline analysis including pressure-dependent leakoff. In Proceedings of the SPE Rocky Mountain Petroleum Technology Conference/Low-Permeability Reservoirs Symposium, Denver, CO, USA, 27–29 May 1987; Society of Petroleum Engineers: pp. SPE–16417, 1987. [Google Scholar]
- Barree, R.D.; Mukherjee, H. Determination of pressure-dependent leakoff and its effect on fracture geometry. In Proceedings of the SPE Annual Technical Conference and Exhibition, Denver, CO, USA, 6–9 October 1996; Society of Petroleum Engineers, 1996. [Google Scholar] [CrossRef]
- Barree, R.D.; Barree, V.L.; Craig, D.P. Holistic fracture diagnostics. In Proceedings of the Rocky Mountain Oil & Gas Technology Symposium, Denver, CO, USA, 17–19 April 2007; Society of Petroleum Engineers, 2007. [Google Scholar] [CrossRef]
- Barree, R.D.; Barree, V.L.; Craig, D.P. Holistic fracture diagnostics: consistent interpretation of prefrac injection tests using multiple analysis methods. SPE Prod. Oper. 2009, 24, 396–406. [Google Scholar] [CrossRef]
- McClure, M.W.; Blyton, C.A.; Jung, H.; Sharma, M.M. The effect of changing fracture compliance on pressure transient behavior during diagnostic fracture injection tests. In Proceedings of the SPE Annual Technical Conference and Exhibition, Amsterdam, The Netherlands, 27–29 October 2014; Society of Petroleum Engineers, 2014. [Google Scholar] [CrossRef]
- McClure, M.W.; Jung, H.; Cramer, D.D.; Sharma, M.M. The fracture-compliance method for picking closure pressure from diagnostic fracture-injection tests. SPE J. 2016, 21, 1321–1339. [Google Scholar] [CrossRef]
- Jung, H.; Sharma, M.M.; Cramer, D.D. Re-examining interpretations of non-ideal behavior during diagnostic fracture injection test. J. Pet. Sci. Eng. 2016, 145, 114–136. [Google Scholar] [CrossRef]
- Wang, H.; Sharma, M.M. New variable compliance method for estimating in-situ stress and leak-off from DFIT data. In Proceedings of the SPE Annual Technical Conference and Exhibition, San Antonio, TX, USA, 9–11 October 2017; Society of Petroleum Engineers, 2017. [Google Scholar] [CrossRef]
- Gu, H.; Leung, K.H. 3D numerical simulation of hydraulic fracture closure with application to mini-fracture analysis. J. Pet. Technol. 1993, 45, 206–255. [Google Scholar] [CrossRef]
- Soliman, M.Y.; Craig, D.; Bartko, K.; Rahim, Z.; Adams, D. After-closure analysis to determine formation permeability, reservoir pressure, and residual fracture properties. In Proceedings of the SPE Middle East Oil and Gas Show and Conference, Manama, Bahrain, 12–15 March 2005; Society of Petroleum Engineers: pp. SPE–93419, 2005. [Google Scholar]
- Craig, D.P.; Blasingame, T.A. Application of a new fracture-injection/falloff model accounting for propagating, dilated, and closing hydraulic fractures. In Proceedings of the SPE Unconventional Resources Conference/Gas Technology Symposium, Denver, CO, USA, 7–9 February 2006; Society of Petroleum Engineers: pp. SPE–100578, 2006. [Google Scholar]
- Nolte, K.G.; Maniere, J.L.; Owens, K.A. After-closure analysis of fracture calibration tests. In Proceedings of the SPE Annual Technical Conference and Exhibition, San Antonio, TX, USA, 5–8 October 1997; Society of Petroleum Engineers: pp. SPE–38676, 1997. [Google Scholar]
- Gulrajani, S.N.; Nolte, K.G.; Economides, M.J. Fracture evaluation using pressure diagnostics. Reservoir Stimulation 2000, 9. [Google Scholar]
- McClure, M.W.; Jung, H.; Cramer, D.D.; Sharma, M.M. The fracture-compliance method for picking closure pressure from diagnostic fracture-injection tests. SPE J. 2016, 21, 1321–1339. [Google Scholar] [CrossRef]
- Bruno, J.; Sun, H.; Yu, W.; Sepehrnoori, K. New diagnostic fracture injection test model with complex natural fractures using embedded discrete fracture model. In Proceedings of the ARMA US Rock Mechanics/Geomechanics Symposium, Houston, TX, USA, 20–23 June 2021; American Rock Mechanics Association, 2021; pp. ARMA–2021.
- Howard, G.C.; Fast, C.R. Optimum fluid characteristics for fracture extension. Drilling and Production Practice 1957. [Google Scholar]
- Barree, R.D.; Miskimins, J.L. Physical explanation of non-linear derivatives in diagnostic fracture injection test analysis. In Proceedings of the SPE Hydraulic Fracturing Technology Conference, The Woodlands, TX, USA, 9–11 February 2016; Society of Petroleum Engineers, 2016. [CrossRef]
- Liao, C.; Wang, R.; Zhang, J.; Huang, Q.; Li, X.; Zheng, X.; Lin, Z. Well testing analysis methodology and application for complex fault-block reservoirs in the exploration stage. In Proceedings of the SPE Gas & Oil Technology Showcase and Conference, Dubai, UAE, 13–15 March 2023; Society of Petroleum Engineers, 2023; pp. D021S028R006.
- Han, G.; Bartko, K.; Mutlu, U. Geomechanical, geological, and engineering controls of hydraulic fracturing. In Proceedings of the Unconventional Resources Technology Conference (URTeC), Denver, CO, USA, 22–24 July 2019; Aramco Services Company, Saudi Aramco, Rockfield Global Technologies. [CrossRef]
- McClure, M. The spurious deflection on log-log superposition-time derivative plots of diagnostic fracture-injection tests. SPE Reserv. Eval. Eng. 2017, 20, 1045–1055. [Google Scholar] [CrossRef]
- Sneddon, I.N. The distribution of stress in the neighborhood of a crack in an elastic solid. Proc. R. Soc. Lond. A Math. Phys. Sci. 1946, 187, 229–260. [Google Scholar]
- Barton, N.; Bandis, S.C.; Bakhtar, K. Strength, deformation and conductivity coupling of rock joints. Int. J. Rock Mech. Min. Sci. Geomech. Abstr. 1985, 22, 121–140. [Google Scholar] [CrossRef]
- Willis-Richards, J.; Watanabe, K.; Takahashi, H. Progress toward a stochastic rock mechanics model of engineered geothermal systems. J. Geophys. Res.: Solid Earth 1996, 101, 17481–17496. [Google Scholar] [CrossRef]
- McClure, M. Discussion of the paper SPE-187038-MS: Fracture closure stress: Reexamining field and laboratory experiments of fracture closure using modern interpretation methodologies. arXiv preprint arXiv:1904.07126, 2019.
- McClure, M.; Albrecht, M.; Cipolla, C.; Molina, C. Design and implementation of field tests in unconventional reservoirs: Practical perspectives. In Proceedings of the SPE Annual Technical Conference and Exhibition, Houston, TX, USA, 3–5 October 2022; Society of Petroleum Engineers, 2022; pp. D011S016R005.
- Soliman, M.Y.; Ansah, J.; Stephenson, S.; Mandal, B. Application of wavelet transform to analysis of pressure transient data. In Proceedings of the SPE Annual Technical Conference and Exhibition, New Orleans, LA, USA, 30 September—3 October 2001; Society of Petroleum Engineers, 2003.
- Soliman, M.Y.; Stephenson, S. Methods for combining well test analysis with wavelet analysis. U.S. Patent 6,347,283.
- Soliman, M.Y.; Ansah, J. Methods and systems for using wavelet analysis in subterranean applications. U.S. Patent 6,978,211.
- Unal, E.; Siddiqui, F.; Soliman, M.Y.; Dindoruk, B. Wavelet analysis of DFIT data to identify fracture closure parameters. In Proceedings of the SPE Hydraulic Fracturing Technology Conference and Exhibition, The Woodlands, TX, USA, 5–7 February 2019; Society of Petroleum Engineers, 2019. [CrossRef]
- Eltaleb, I.; Rezaei, A.; Siddiqui, F.; Awad, M.M.; Mansi, M.; Dindoruk, B.; Soliman, M.Y. Analysis of fracture injection tests using signal processing approach. In Proceedings of the SPE/AAPG/SEG Unconventional Resources Technology Conference, Virtual, 20–22 July 2020; Society of Petroleum Engineers, 2020. [CrossRef]
- Eltaleb, I.; Rezaei, A.; Soliman, M.Y.; Dindoruk, B. A signal processing approach for analysis of fracture injection test in geothermal reservoirs: A case study on the Utah FORGE formation. In Proceedings of the SPE Hydraulic Fracturing Technology Conference and Exhibition, Virtual, 18–19 May 2021; Society of Petroleum Engineers, 2021. [CrossRef]
- Gabry, M.A.; Eltaleb, I.; Soliman, M.Y.; Farouq-Ali, S.M. A new technique for estimating stress from fracture injection tests using continuous wavelet transform. Energies 2023, 16, 764. [Google Scholar] [CrossRef]
- Gabry, M.A.; Eltaleb, I.; Soliman, M.Y.; Farouq-Ali, S.M. Validation of estimating stress from fracture injection tests using continuous wavelet transform with experimental data. Energies 2023, 16, 2807. [Google Scholar] [CrossRef]
- Craig, D.P. New type curve analysis removes limitations of conventional after-closure analysis of DFIT data. In Proceedings of the SPE Unconventional Resources Conference/Gas Technology Symposium, The Woodlands, TX, USA, 1–3 April 2014; Society of Petroleum Engineers, 2014; pp. D031S007R006.
- Jung, H.; Sharma, M.M.; Cramer, D.D. Enhanced diagnostic fracture injection test analysis using advanced wavelet transform techniques. In Proceedings of the SPE Annual Technical Conference and Exhibition, San Antonio, TX, USA, 9–11 October 2017; Society of Petroleum Engineers, 2017; pp. SPE–187746-MS.
- van den Hoek, P. A simple unified pressure-transient-analysis method for fractured waterflood injectors and mini fractures in hydraulic-fracture stimulation. SPE Prod. Oper. 2018, 33, 32–48. [Google Scholar]
- Siddiqui, F.; Soliman, M.Y.; House, W.; Ibragimov, A. A new analysis technique for interpreting injection/shut-in tests. Hydraul. Fract. Q. 2016.
- Zanganeh, B.; Clarkson, C.R.; Jones, J.R. Reinterpretation of flow patterns during DFITs based on dynamic fracture geometry, leakoff and afterflow. In Proceedings of the SPE Hydraulic Fracturing Technology Conference and Exhibition, The Woodlands, TX, USA, 23–25 January 2018; Society of Petroleum Engineers, 2018; pp. D031S007R003.
- Dutler, N.; Valley, B.; Gischig, V.; Jalali, M.; Brixel, B.; Krietsch, H.; Roques, C.; Amann, F. Hydromechanical insight of fracture opening and closure during in-situ hydraulic fracturing in crystalline rock. Int. J. Rock Mech. Min. Sci. 2020, 135, 104450. [Google Scholar] [CrossRef]
- Gulrajani, S.N.; Nolte, K.G.; Romero, J. Evaluation of the M-Site B-sand fracture experiments: Evolution of a pressure analysis methodology. SPE Prod. Facil. 2001, 16, 30–41. [Google Scholar] [CrossRef]
- Guglielmi, Y.; McClure, M.; ... & the EGS Collab Team. Estimating stress from fracture injection tests: Comparing pressure transient interpretations with in-situ strain measurements. In Proceedings of the 47th Workshop on Geothermal Reservoir Engineering, Stanford University, Stanford, CA, USA, 7–9 February 2022; pp. SGP–TR 223.
- Kneafsey, T.J.; Blankenship, D.; Knox, H.A.; Johnson, T.C.; Ajo-Franklin, J.B.; Schwering, P.C.; ... & Doe, T. EGS Collab project: Status and progress. In Proceedings of the 44th Workshop on Geothermal Reservoir Engineering, Stanford University, Stanford, CA, USA, 11–13 February 2019.
- Kneafsey, T.J.; Blankenship, D.; Dobson, P.F.; Morris, J.P.; White, M.D.; Fu, P.; ... & Valladao, C. The EGS Collab project: Learnings from Experiment 1. In Proceedings of the 45th Workshop on Geothermal Reservoir Engineering, Stanford University, Stanford, CA, USA, 10–12 February 2020.
- Guglielmi, Y.; Cook, P.; Soom, F.; Schoenball, M.; Dobson, P.; Kneafsey, T. In situ continuous monitoring of borehole displacements induced by stimulated hydrofracture growth. Geophys. Res. Lett. 2021, 48, e2020GL090782. [Google Scholar] [CrossRef]
- Guglielmi, Y.; Nussbaum, C.; Jeanne, P.; Rutqvist, J.; Cappa, F.; Birkholzer, J. Complexity of fault rupture and fluid leakage in shale: insights from a controlled fault activation experiment. J. Geophys. Res.: Solid Earth 2020, 125, e2019JB017781. [Google Scholar] [CrossRef]
- Kakurina, M.; Guglielmi, Y.; Nussbaum, C.; Valley, B. In situ direct displacement information on fault reactivation during fluid injection. Rock Mech. Rock Eng. 2020, 53, 4313–4328. [Google Scholar] [CrossRef]
- Kerr, E.; Barree, R.; Estrada, E. What can you learn from a DFIT on fiber optics? In Proceedings of the SPE Fracturing Technology Conference and Exhibition, The Woodlands, TX, USA, 6–8 February 2024; Society of Petroleum Engineers, 2024; pp. D011S001R003.
- Zanganeh, B.; Clarkson, C.R.; Jones, J.R. Reinterpretation of fracture closure dynamics during diagnostic fracture injection tests. In Proceedings of the SPE Western Regional Meeting, Garden Grove, CA, USA, 22–26 April 2018; Society of Petroleum Engineers, 2018; pp. D031S007R009.
- Buijs, H. DFIT: An interdisciplinary validation of fracture closure pressure interpretation across multiple basins. In Proceedings of the SPE Annual Technical Conference and Exhibition, Dubai, UAE, 21–23 September 2021; Society of Petroleum Engineers, 2021; pp. D021S036R006.
- Virues, C.; Robertson, A.; Sendecki, B. Best practices in DFIT interpretation-comparative analysis of 80 DFITs in the Canadian Montney Shale Play. In Proceedings of the SPE Annual Technical Conference and Exhibition, Calgary, AB, Canada, 25–27 September 2023; Society of Petroleum Engineers, 2023; pp. D031S036R004.
- Virues, C.; Robertson, A.; AbouKhalil, E. Best practices in DFIT interpretation-comparative analysis of 83 DFITs in the Canadian Duvernay Shale Play. In Proceedings of the SPE Annual Technical Conference and Exhibition, Houston, TX, USA, 3–5 October 2022; Society of Petroleum Engineers, 2022; pp. D021S026R004.
- Kamali, A.; Ghassemi, A. On the role of poroelasticity in the propagation mode of natural fractures in reservoir rocks. Rock Mech. Rock Eng. 2020, 53, 2419–2438. [Google Scholar] [CrossRef]
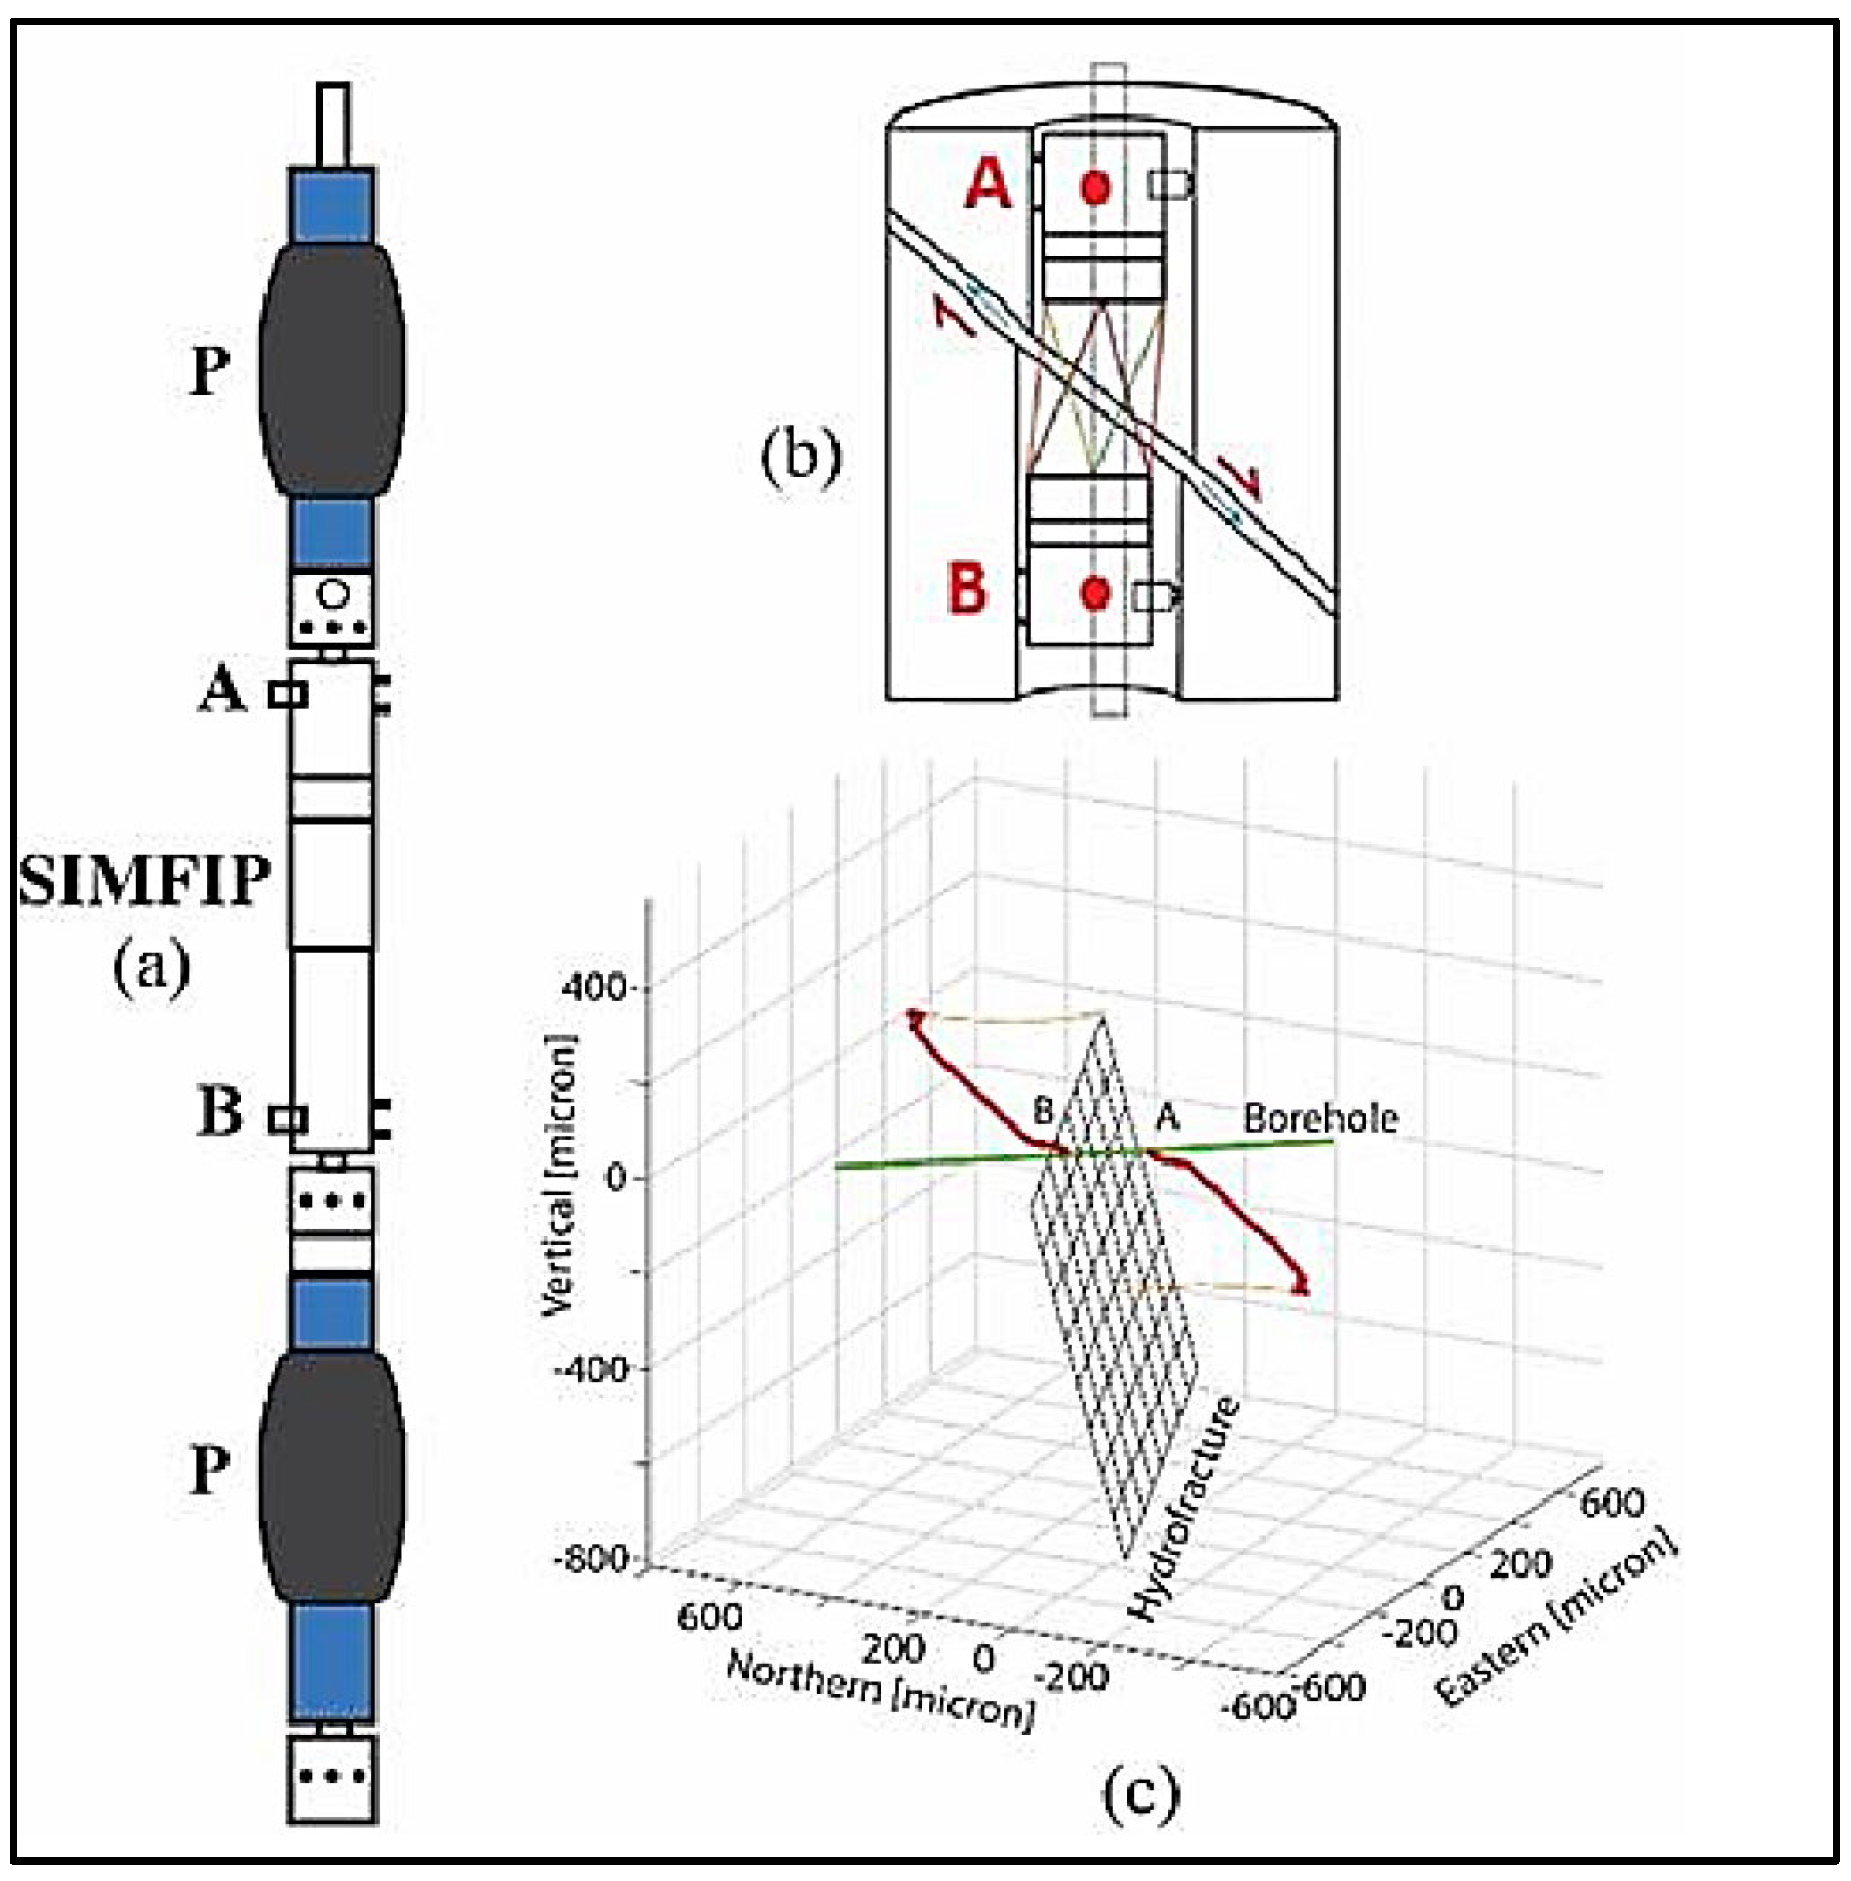
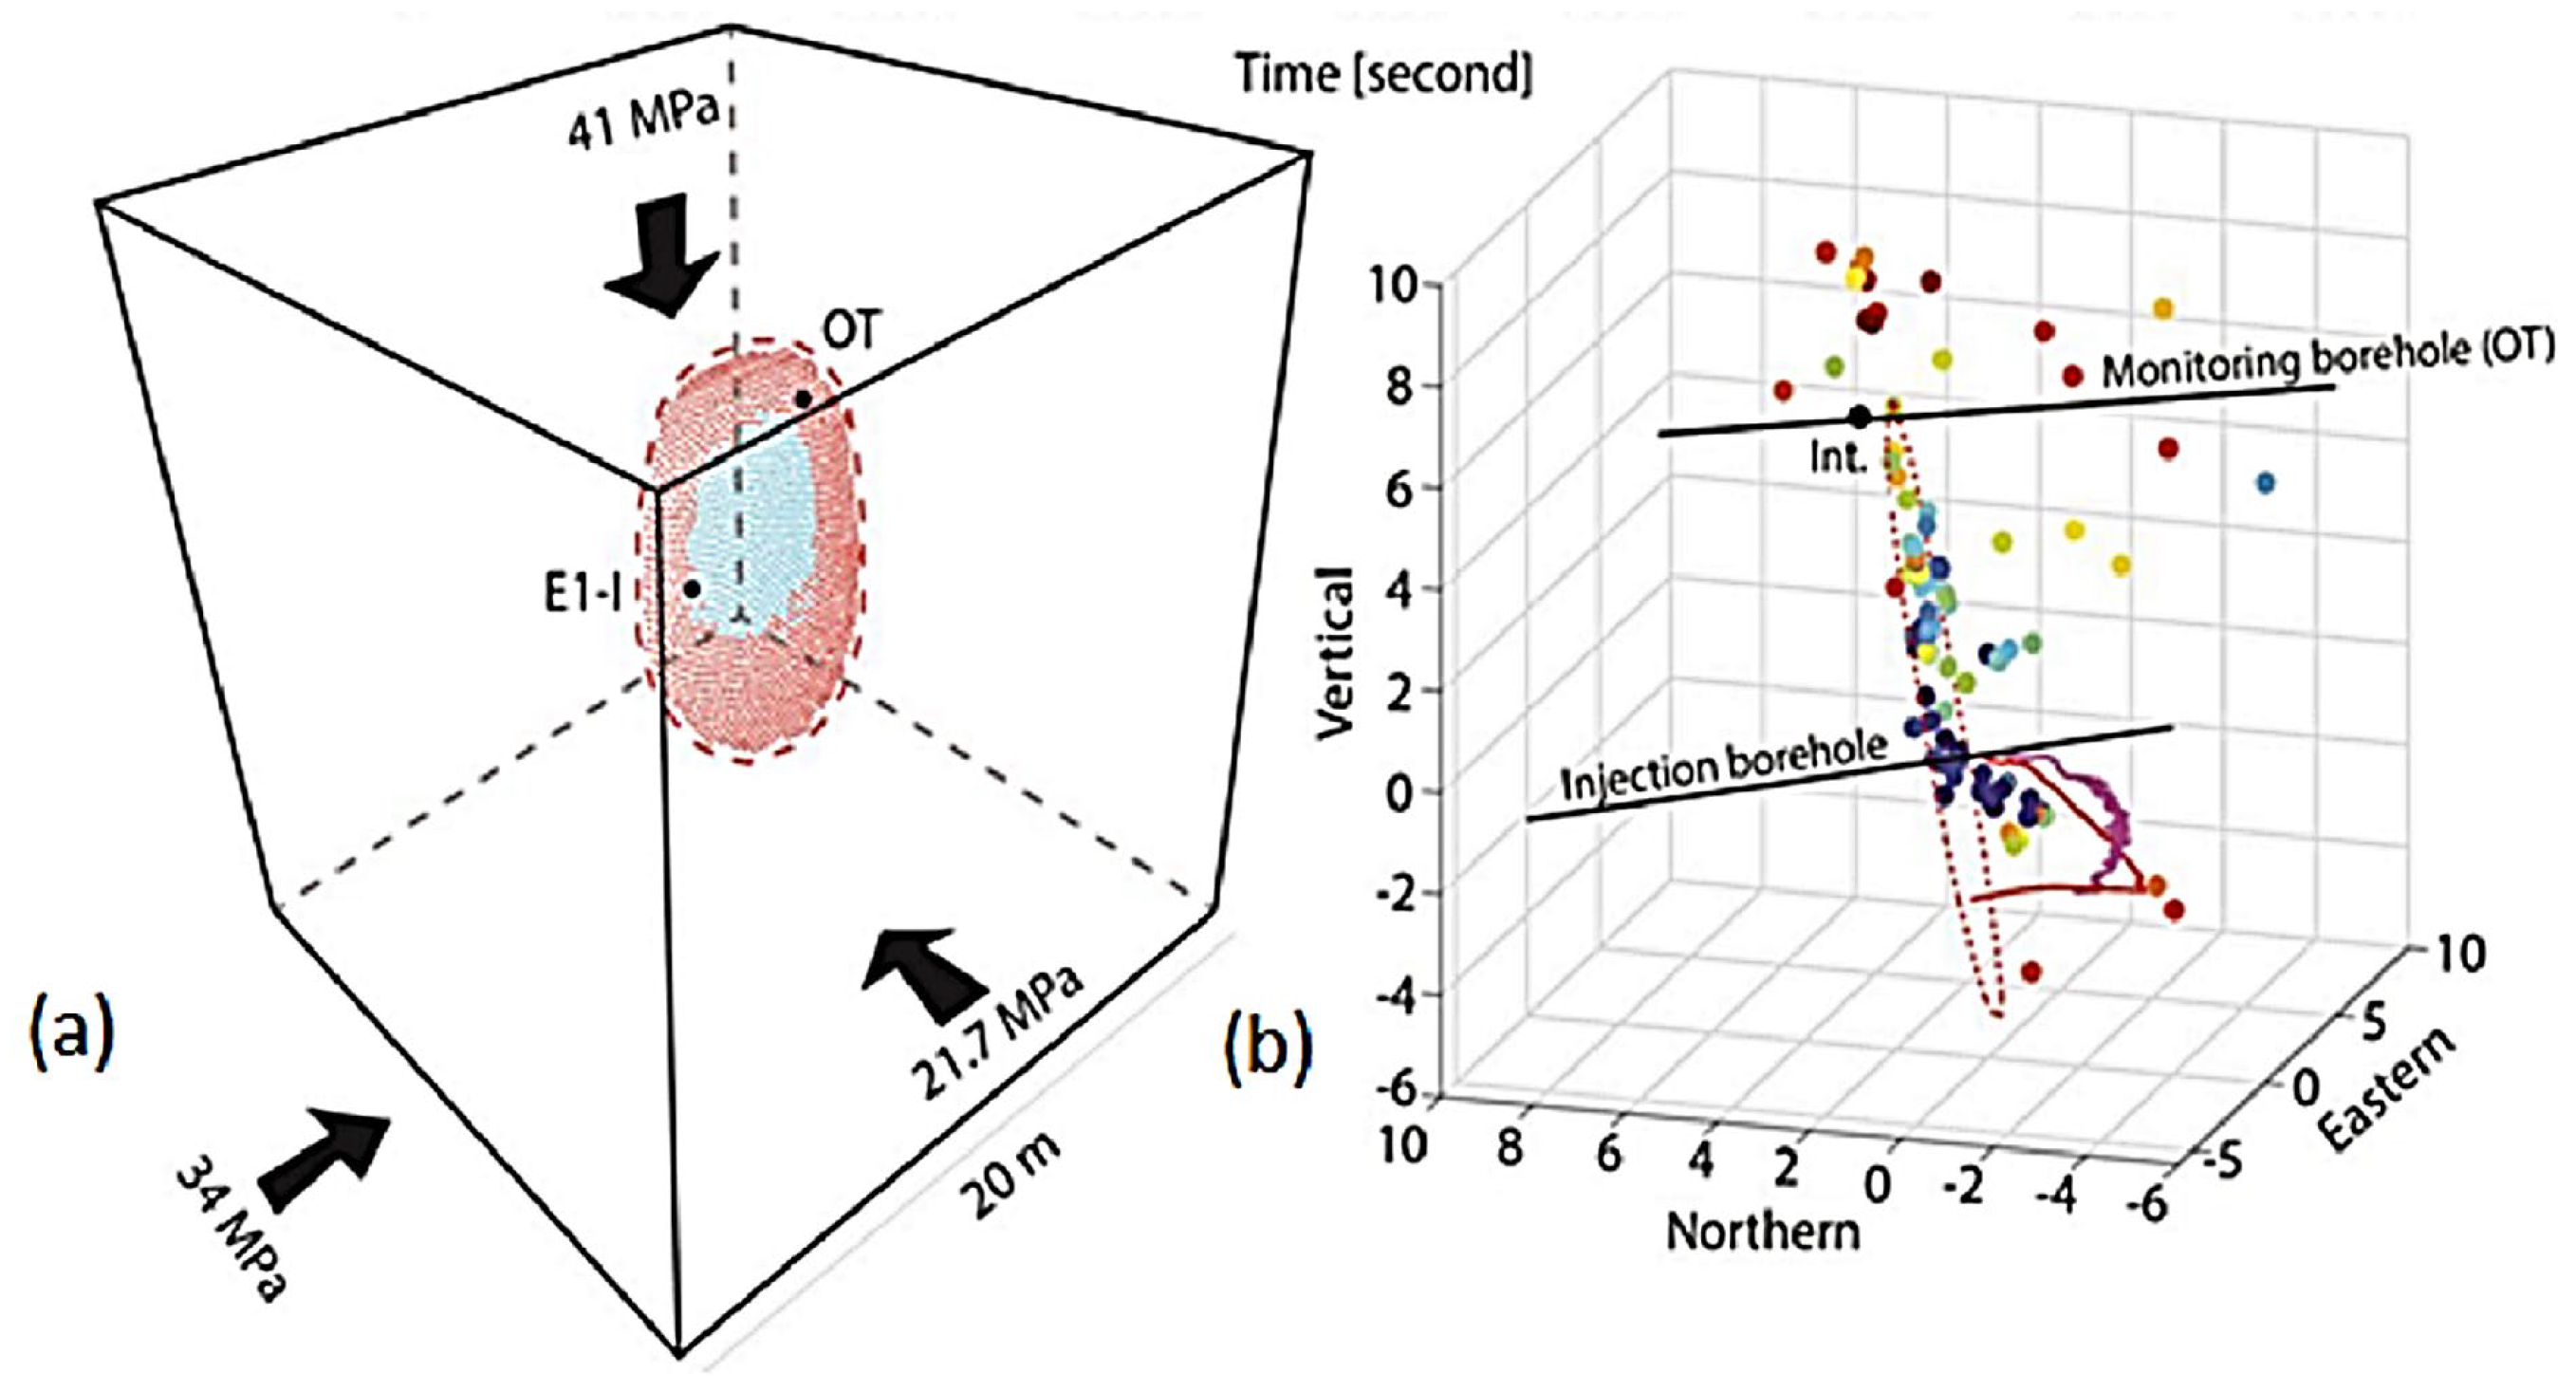

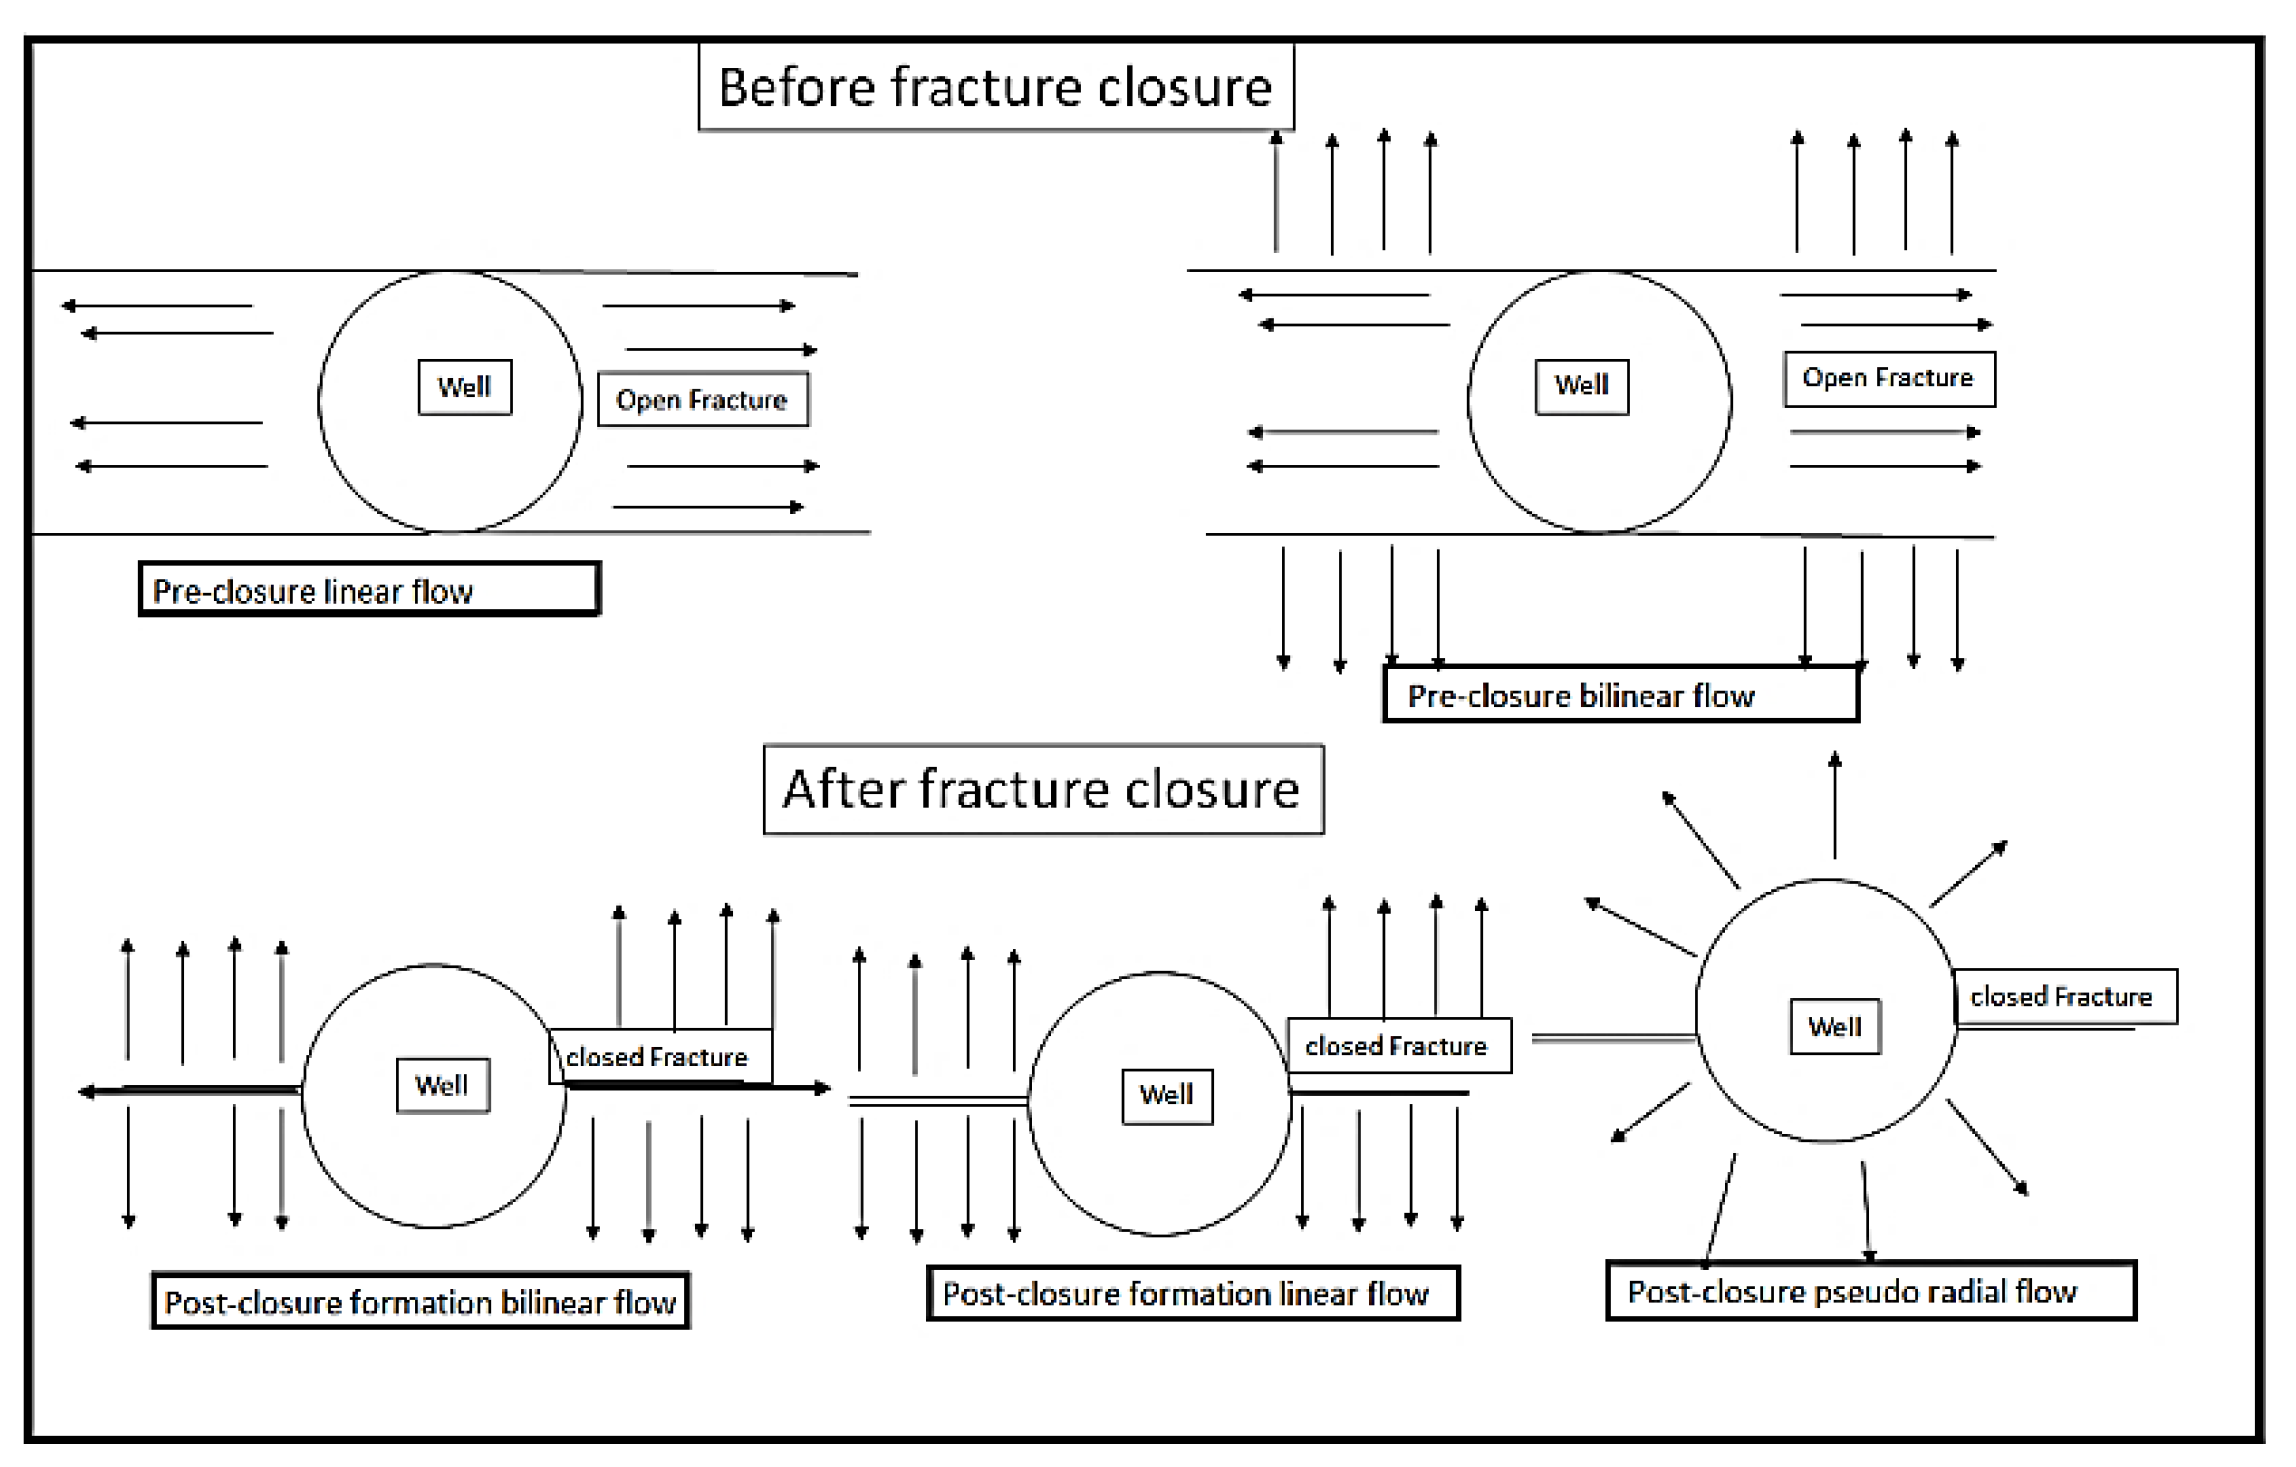

| Log-log | Before Closure | After Closure | |||
| Bilinear | Linear | Bilinear | Pseudolinear | Pseudo-radial | |
| ∆pwf vs. t ∆pawf vs. ta |
¼ | 1/2 | -- | -- | -- |
| ∂∆pwf /∂t vs. t ∂∆pawf /∂ta vs. ta |
-3/4 | -1/2 | -7/4 | -3/2 | -2 |
| t∂∆pwf /∂t vs. t ta∂∆pawf /∂ta vs. ta |
1/4 | 1/2 | -3/4 | -1/2 | -1 |
| t2∂∆pwf /∂t vs. t ta2∂∆pawf /∂ta vs. ta |
5/4 | 3/2 | 1/4 | 1/2 | 0 |
| E1-I 164 Test 2 | E1-I 164 Test 3 | TV4100 Test 4 | TV4100 Test 7 | |
| Fracture closure pressure using SIMFIP | 3100 psi | 3100 psi | 2712 psi-2785 psi | 2700 psi |
| Number of reported natural fractures | 0 | Not reported | 5 | 10 |
| fracture closure pressure using CWT fracture closure detection Technique |
Start of closure 3132 psi Complete closure 3103 psi |
Start of closure 3000 psi Complete closure 2950 psi |
Start of closure 2740 psi Complete closure 2700 psi |
Start of closure 2760 psi Complete closure 2700 psi |
| Fracture closure pressure using Compliance Method | Rapid closure 3000 psi-3500 psi | 2725 psi | 2475 psi | 2800 psi |
| Fracture closure pressure using Tangent Method | Less than 2200 psi | Less than 2200 | Less than 2200 psi | 2700 psi |
| Fracture closure pressure using Nolte Technique | 3400 psi | No closure signature | 2910 psi | 3177 psi |
| Fracture closure pressure using log-log method | No closure signature | No closure signature | No closure signature | No closure signature |
| Fracture closure pressure using the square root of time method | No closure signature | No closure signature | No closure signature | 2700 psi |
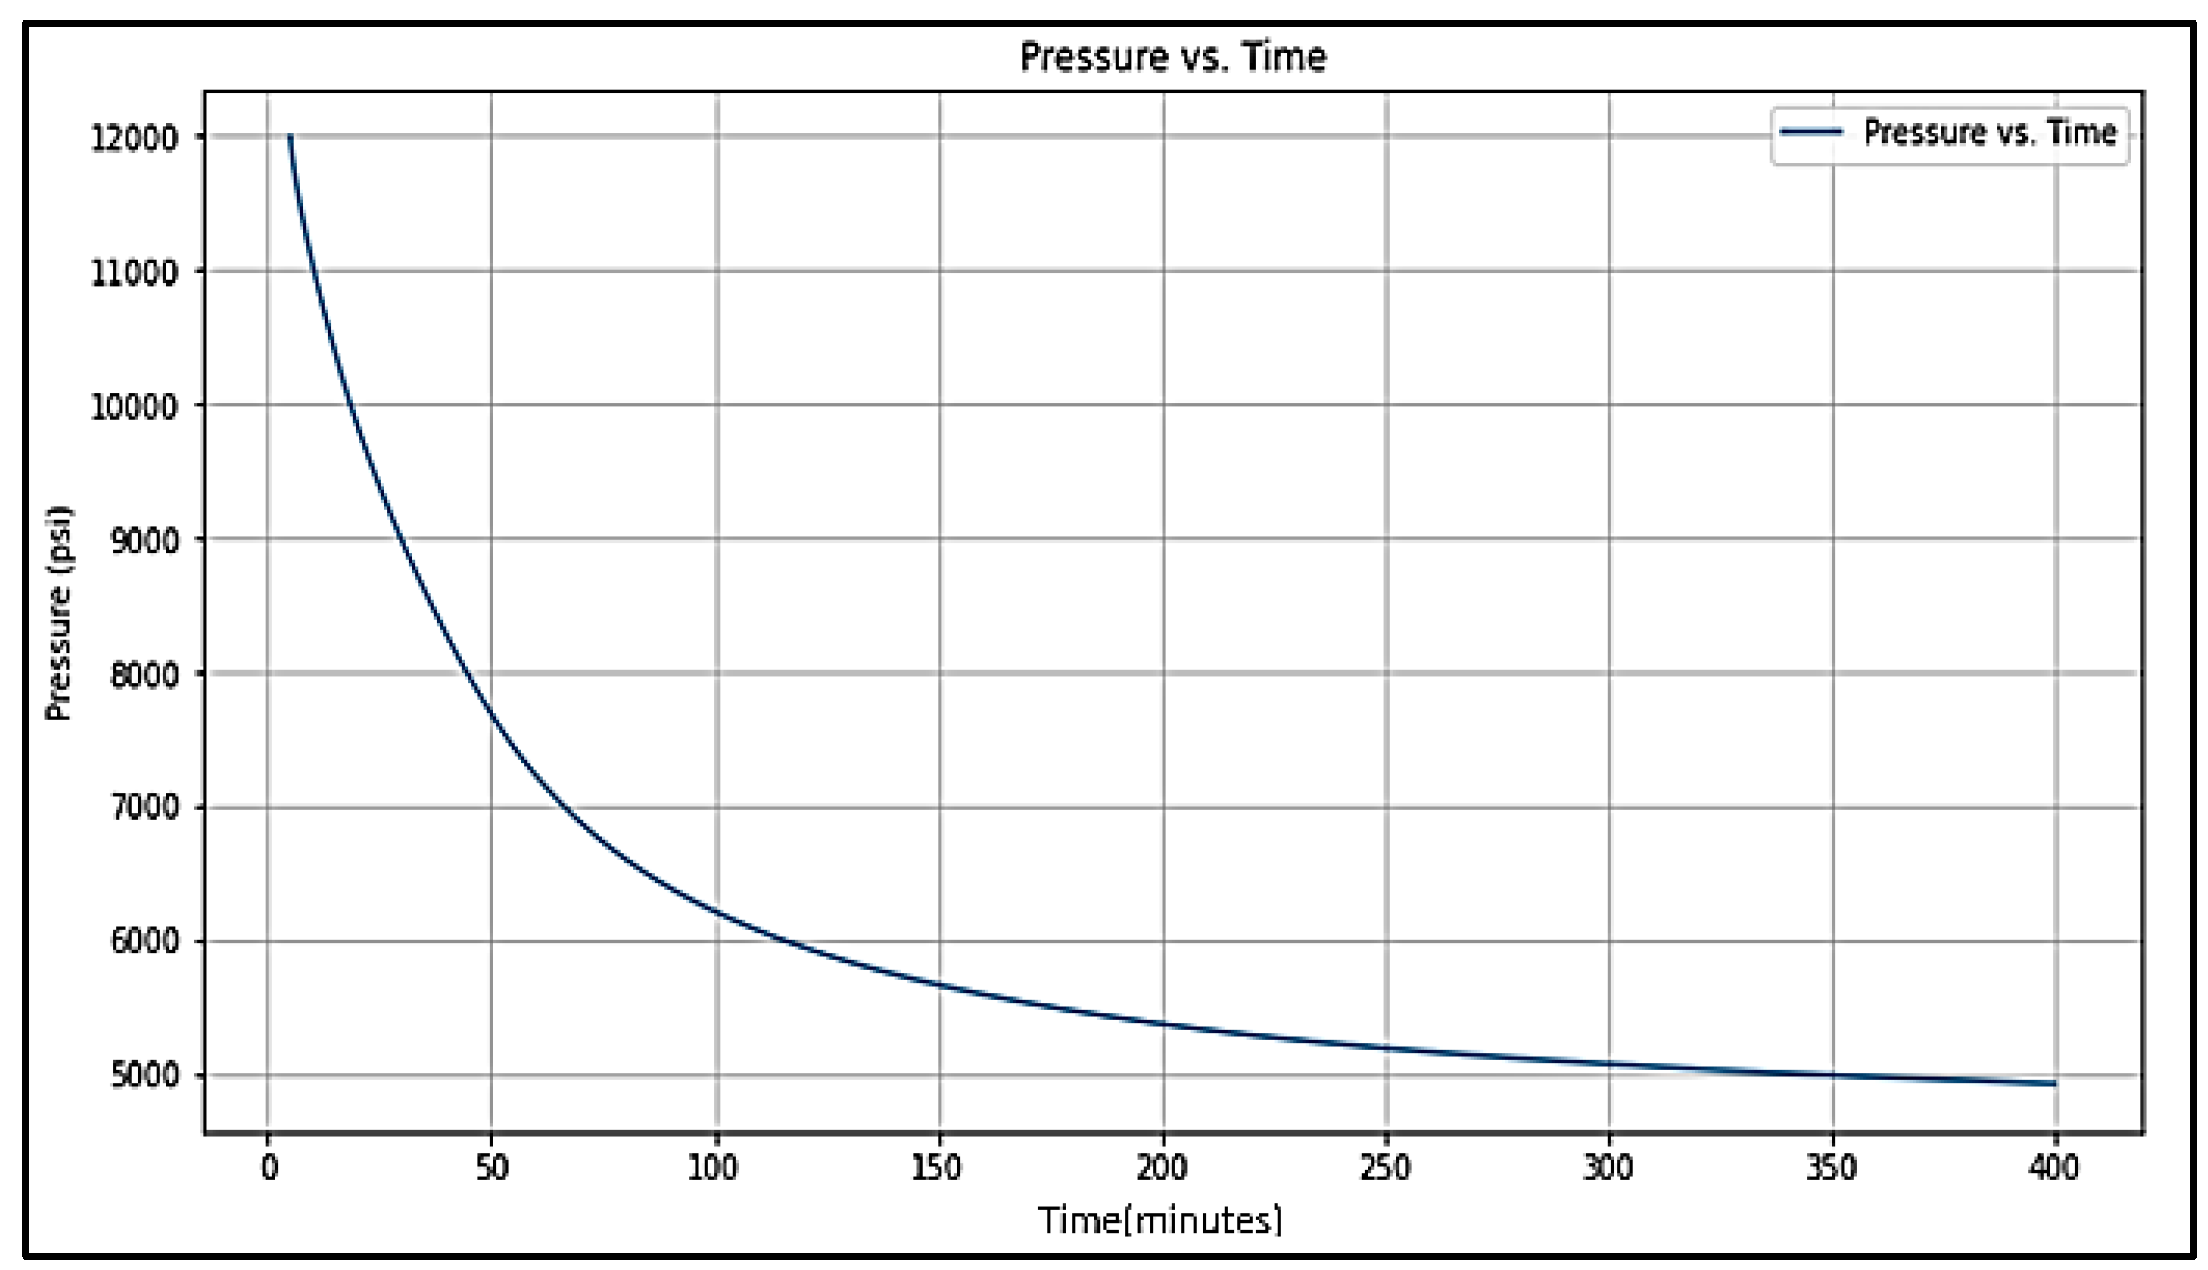
| The Pumping period starts from 0 to 5 minutes (tp = 5 min) | ||||
| Start time of priod (min) |
End time of period (min) |
Slope of log-log t dp /dt versus Δt diagnostic plot | Shut in period name | |
| 5 | 15 | a = 0.75 | Storage | |
| 15 | 40 | b = 0.5 | Pre-closure linear flow. | |
| 40 | 50 | c = 0.25 | Pre-closure bilinear flow. | |
| 50 | 70 | d = -0.5 | Post-closure formation linear flow. | |
| 70 | 200 | e = -0.75 | Post-closure formation bilinear flow. | |
| 200 | 400 | f = -1 | Post-closure radial flow. | |
Disclaimer/Publisher’s Note: The statements, opinions and data contained in all publications are solely those of the individual author(s) and contributor(s) and not of MDPI and/or the editor(s). MDPI and/or the editor(s) disclaim responsibility for any injury to people or property resulting from any ideas, methods, instructions or products referred to in the content. |
© 2024 by the authors. Licensee MDPI, Basel, Switzerland. This article is an open access article distributed under the terms and conditions of the Creative Commons Attribution (CC BY) license (http://creativecommons.org/licenses/by/4.0/).


