
Submitted:
09 August 2024
Posted:
12 August 2024
You are already at the latest version
Abstract
Measuring cell confluence in high-throughput screening of pharmaceutics, cell culture monitoring, cancer research, and industrial applications requires quantitative and standardizable measures to minimize subjective observations and increase throughput1-12 . Over the past half-century, non-invasive specialized programs have been created to quantitatively assess cell confluence, and some software tools exist to meet these needs1,4,5,6,7,8,9 . However, many of these tools are expensive, computationally-demanding, or inaccessible to non-experts1,6. With the assistance of generative artificial intelligence, we have developed the Confluence Analysis Program (CAP), a modern tool designed to be precise, interactive, and user-friendly. CAP is written entirely in Python and runs in any command-line interface (CLI), including Terminal (OS) and Command Prompt (Windows). In addition to fetching all necessary external libraries automatically and prompting drag-and-drop image retrieval, CAP features live visual comparison of cell mass identification to the original image assay. Our results demonstrate robust performance of CAP on fluorescent micrographs of varying confluences ranging from low to high. CAP is provided as a free resource, accessible in the Supplementary Materials.
Keywords:
confluency
; bioinformatics
; cell segmentation
; high-throughput screening
Introduction
Cell confluence assays are critical to a wide range of scientific applications, including pharmaceutics, cell culture monitoring, cancer research, and bioreactor maintance [2,3,4,8,10,11]. These assays measure the percentage of the surface area covered by adherent cells, providing valuable insights into cell growth, proliferation, and behavior [1,2,3,4,5,6,7,8,9,10,11,12].
Few modern applications to measure cell confluence are open-source, interactive, accessible to non-experts, and have limited computational demands. Addressing this gap, we have developed the Confluence Analysis Program (CAP). Written entirely in Python, CAP operates seamlessly in any command-line interface (CLI), including Terminal on macOS and Command Prompt on Windows. CAP allows users to easily retrieve images through a drag-and-drop interface. Additionally, it features live visual comparisons of cell mass identification to the original image assay, enhancing the user’s ability to verify and adjust measurements in real-time. All necessary external libraries are automatically installed if not found on your computer at runtime. The only manual installation steps are downloading Python3 at Python.org (make sure to download the appropriate version for your system), and perhaps the Pip package if not already installed (see Methods section for additional installation and run details).
In this study, we aimed to develop and test CAP. Our work demonstrates that CAP is an effective tool with exceptional ease of use and widespread research applications for cell confluence measurements, which are commonplace in academic and industrial science laboratories.
Methodological Development
CAP performs cell segmentation analysis to estimate cell confluency percentage as the surface area occupied by detected cell bodies, in alignment with standard image processing techniques for this application [1,9]. Of note, several features were implemented in CAP with the intention of optimizing runtime.
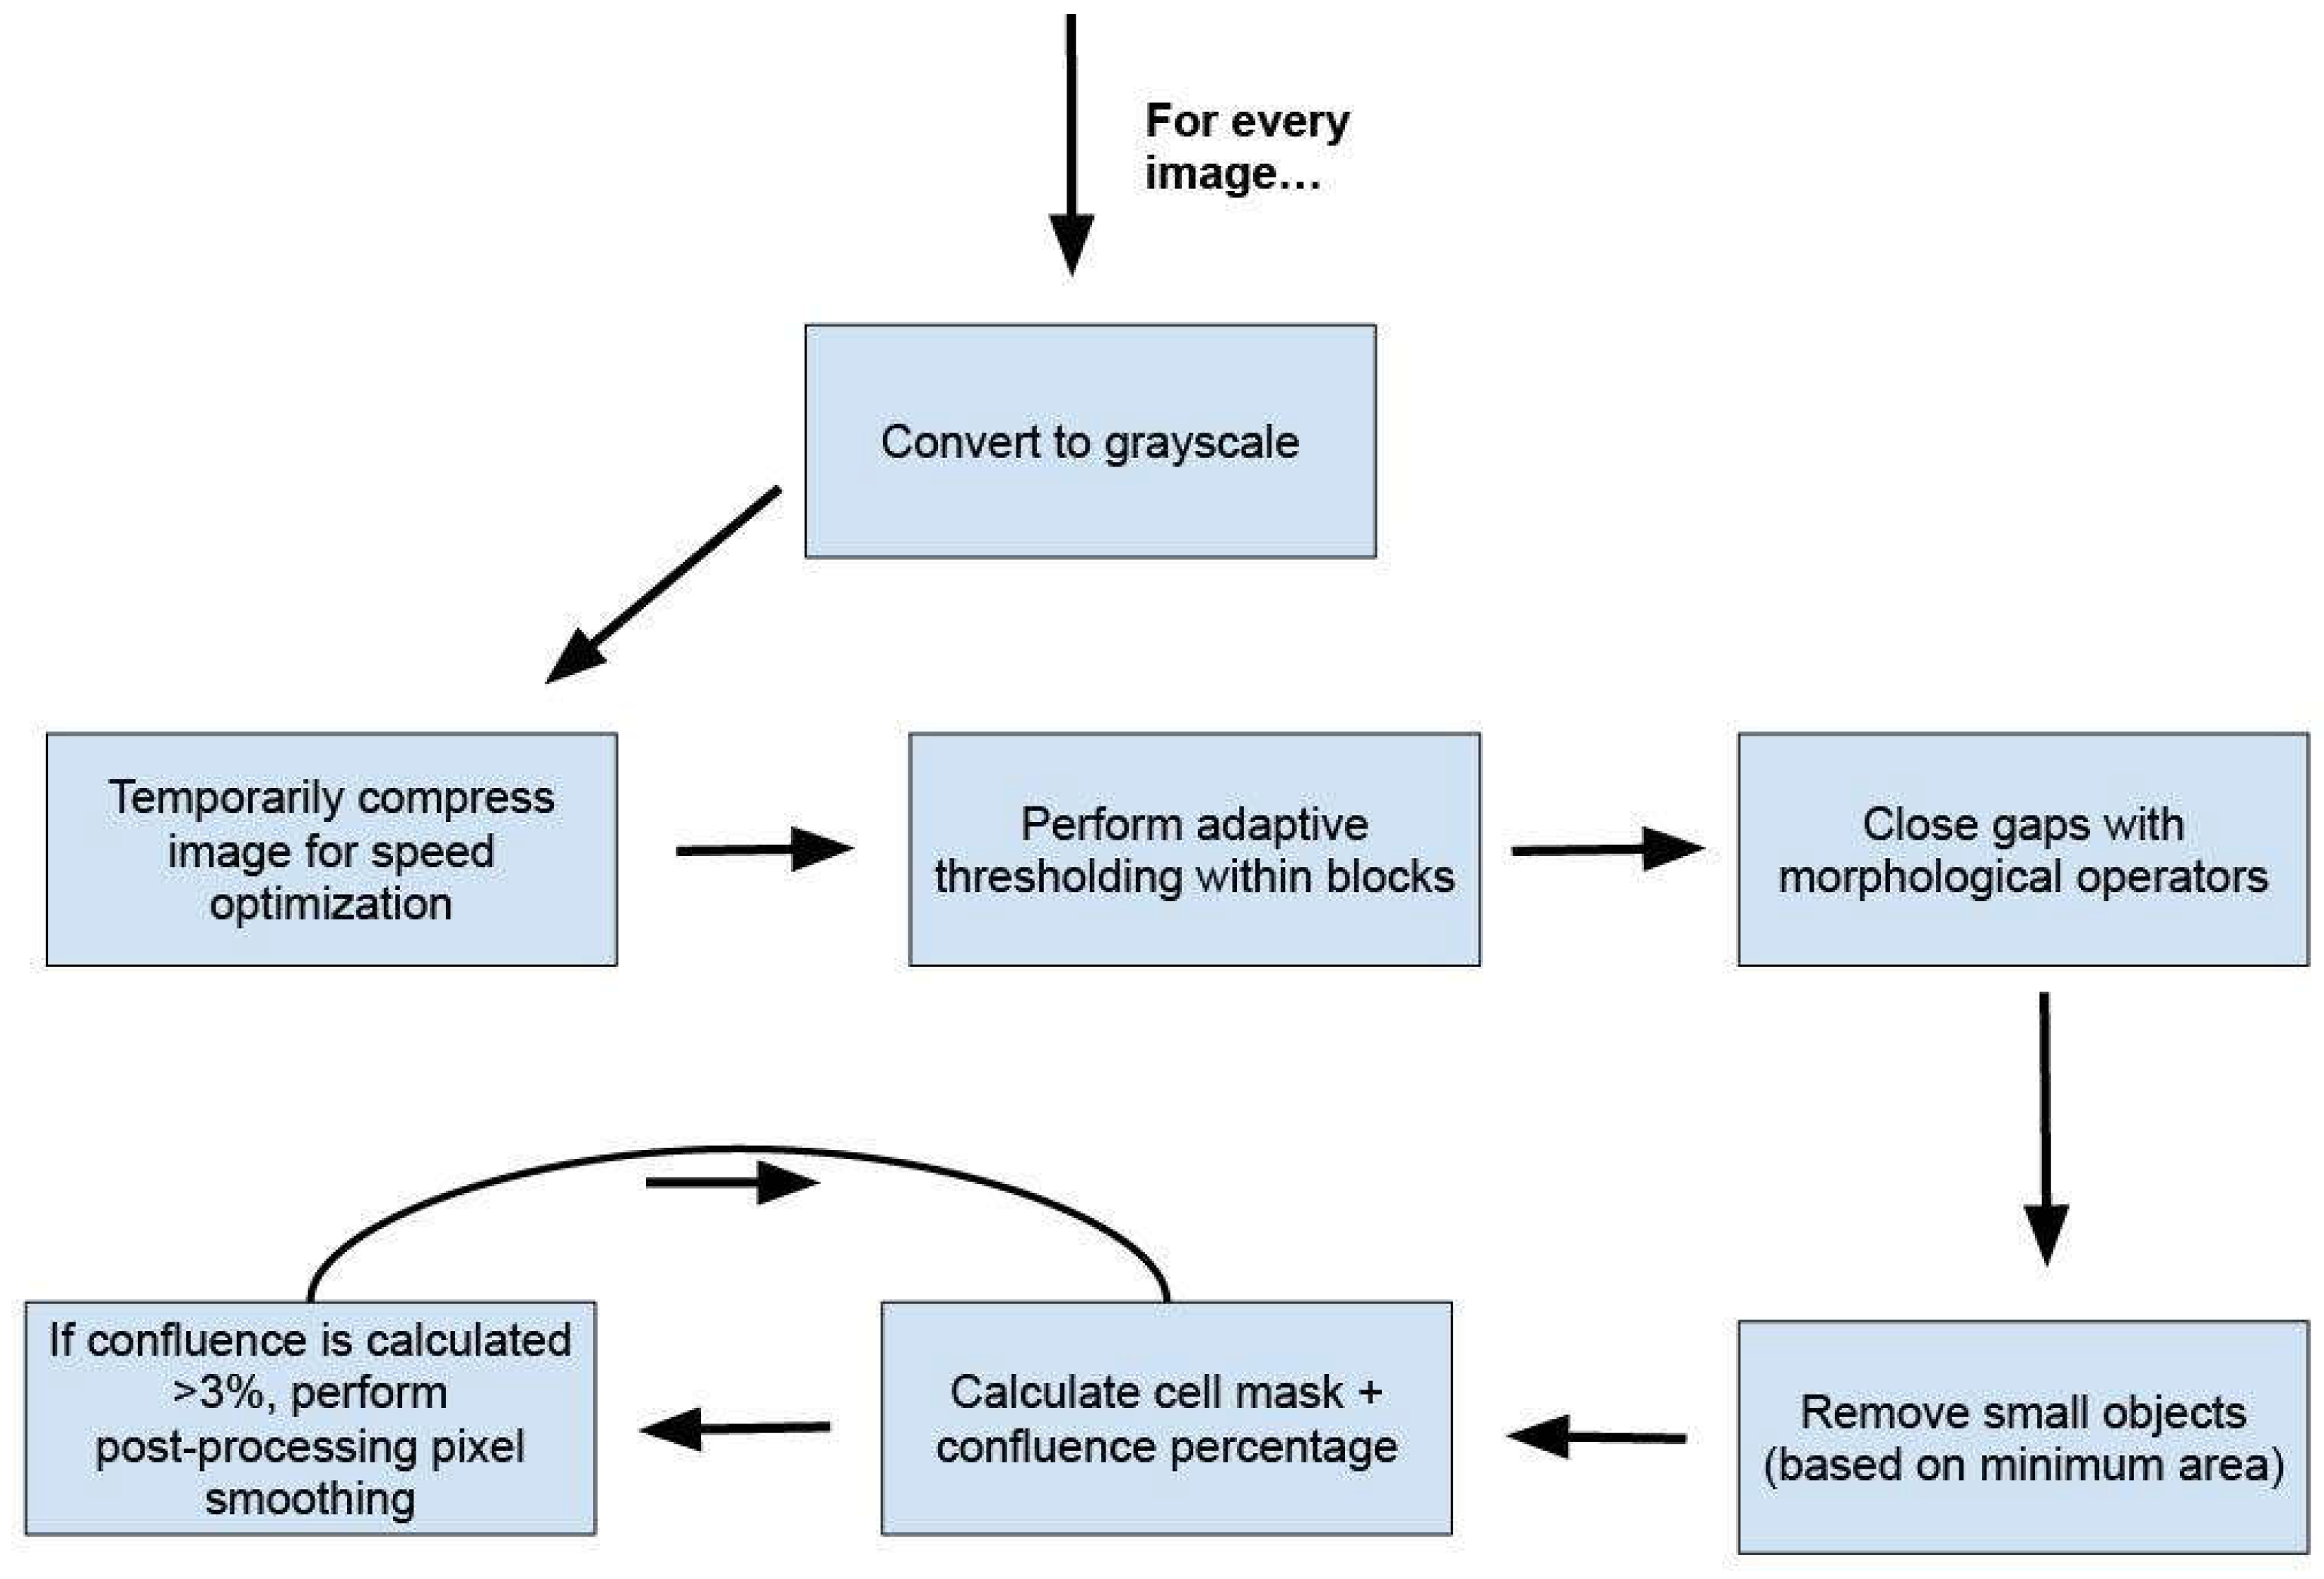
CAP first reads images within an input folder and converts them to grayscale for further processing. To enhance processing speed and efficiency, the images are first compressed using a specialized function before any segmentation analysis. The first crucial step involves adaptive thresholding, a technique used to convert grayscale images into binary images. In this process, each pixel is compared to the mean or weighted mean of its neighborhood, and a threshold is applied to determine whether the pixel belongs to the foreground (cell) or background. The Block Size parameter controls the size of the neighborhood area used for this comparison. Smaller block sizes make the thresholding more sensitive to local variations in intensity, which is useful for images with uneven lighting or varying cell densities. Conversely, larger block sizes provide a more global threshold, suitable for images with more uniform intensity distribution. The program uses adaptive Gaussian thresholding, which considers the weighted sum of neighborhood values minus a constant to determine the threshold for each pixel.
After thresholding, the binary image often contains noise and small gaps within cell regions. To address this, morphological operations are applied to improve the accuracy of cell detection. The primary morphological operation used is closing, which involves dilation followed by erosion. Dilation adds pixels to the boundaries of cell regions, helping to close small gaps and connect disjointed cell parts. Erosion, on the other hand, removes pixels from the boundaries, refining the overall shape and removing small noise particles. The size of the kernel used in these operations is controlled by the Mask Fill parameter, where a larger kernel results in more connected and filled-in cell areas, representing higher confluence. Additionally, the Mask Iterations parameter specifies the number of times these morphological operations are applied. More iterations result in a smoother and cleaner binary mask, but excessive iterations can cause over-merging of close objects. Therefore, adjusting this parameter allows users to balance between connecting cell regions and maintaining individual cell boundaries.
To further improve efficiency, CAP uses numba, a just-in-time compiler, to accelerate the removal of small objects based on area. This optimization significantly speeds up the processing time for large images or datasets. Following morphological processing, CAP performs connected components analysis to identify individual cell regions. During this step, each connected component (potential cell) is labeled, and its area is calculated. To filter out noise and small artifacts, a threshold based on the Minimum Area parameter is applied. Any objects below this area threshold are removed from the binary mask, ensuring that only significant cell regions are considered in the final confluence measurement. If cell confluence is calculated to be above 3%, CAP includes an additional post-processing step where pixels are filled or removed based on local density, further enhancing the accuracy of cell detection. Figure 1 shows a flowchart describing CAP’s processing steps.
For handling multiple images, CAP leverages parallel computing through the ProcessPoolExecutor. This approach allows concurrent processing of images, drastically reducing the overall time required for analysis in high-throughput scenarios. The total area covered by cells is then calculated by summing the pixels in the binary mask, and this value is expressed as a percentage of the total image area, providing the cell confluence measurement. This comprehensive and efficient pipeline ensures users are easily and rapidly able to select optimized parameters in CAP and execute batch confluence measurements for a wide range of cell types and applications.
Figure 1.
Flowchart of CAP processing steps.
Results
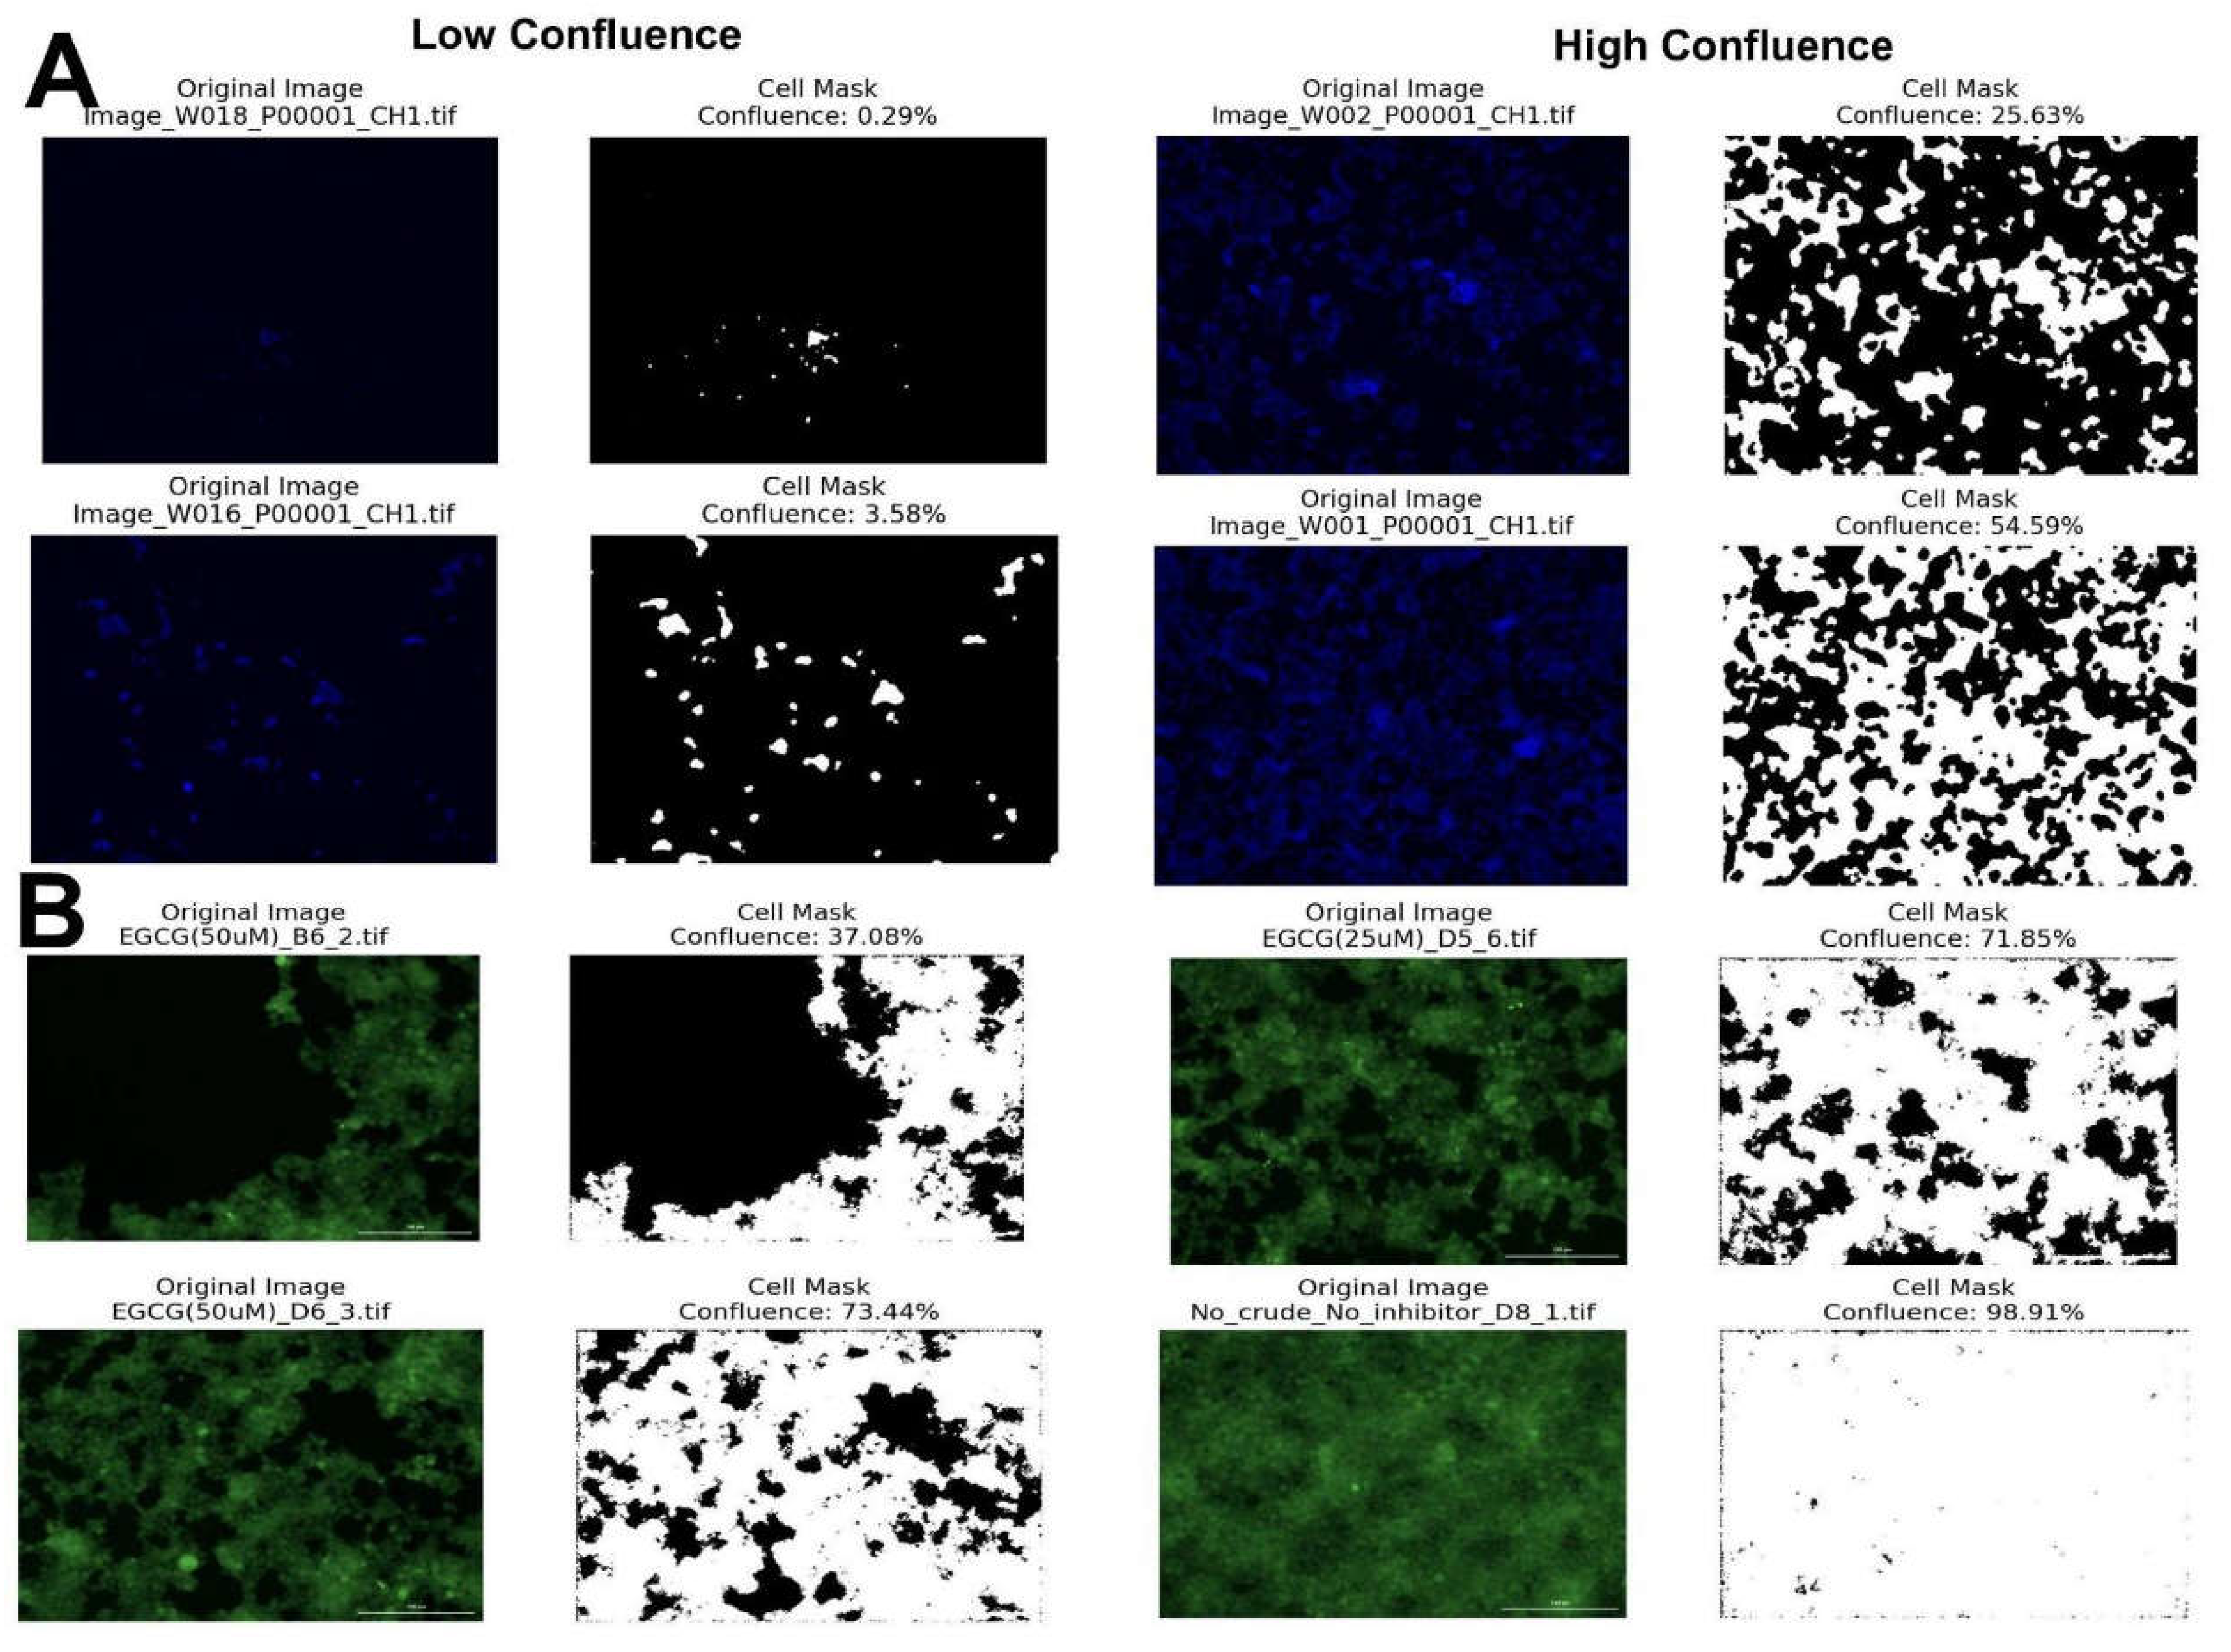
In order to validate the functionality of CAP, we empirically evaluated its measurements of various confluences of cultured HEK293 cells and fluorescent biosensor cells. Eight different two-fold dilutions ranging from 1:500 to 1:4 of HEK93 were prepared using Dulbecco’s Modified Eagle Medium (DMEM) supplemented with 10% Fetal Bovine Serum (FBS), 1x GlutaMAX, and 1x Penicillin-Streptomycin. Two-fold dilutions were pipetted to each row of a 96-well plate. After 3 days, nuclei were stained with Hoechst 33342 and analyzed using a fluorescence microscope. As an additional test, fluorescent biosensor cells expressing yellow fluorescent protein (YFP) were also analyzed. Figure 2 shows the sample wells along with the cell mask and estimated confluence generated by CAP.
As evidenced in results shown in Figure 2, CAP will estimate cell confluency for a variety of staining methods and cell confluences. Using a laptop, CAP analyzed 147 cell images in 4 minutes and 57 seconds, corresponding to an average image processing rate of 2 seconds per image, significantly improved from the rate of 13 seconds per image in other modern algorithms [4].
Discussion
CAP provides a practical and efficient solution for measuring cell confluence, an essential metric in various biological research domains [2,3,4,8,10,11]. CAP’s user-friendly interactive design, limited computation demands, and robust functionality make it a valuable tool for researchers in these domains.
In pharmaceutics, precise confluence measurements are crucial for evaluating the efficacy of drug candidates on cultured cells. In high-throughput drug screening, where thousands of compounds are tested for cytotoxicity or proliferation effects, accurate confluence data ensures reliable assessment of cell health and response to treatments [12]. CAP’s computationally optimized processing allows researchers to quickly assess cell confluence for large quantities of images, enhancing the efficiency of the screening process. Additionally, live image updates responding to parameter changes boost user confidence.
In bioreactor research and manufacturing, effective confluence measures are crucial to maintaining optimal production levels [8]. Accurate confluence measurements ensure that cell cultures are at the right stage for harvesting or further processing.
In cancer research, confluence measurements are used to study tumor cell growth behavior and the effects of potential therapeutics. Lobo et al. (2024) investigated Argonaute (AGO) protein, an RNA silencing protein crucial in regulating cell growth, within a variety of cell lines, demonstrating the effect of cell confluence on AGO2 expression [2]. CAP’s ability to provide precise confluence data finds through real-time parameter adjustments enhances researchers’ ability to evaluate the efficacy and validity of such studies.
Cell culture monitoring, in general, benefits from accurate confluence measurements to maintain optimal growth conditions and ensure experimental consistency. Freshney (2010) emphasizes the importance of routine confluence monitoring to prevent overgrowth and ensure reproducibility across experiments [11]. CAP’s live visual comparison feature and adjustable parameters facilitate accurate monitoring, helping researchers maintain healthy cell cultures and avoid common issues such as overconfluence or insufficient growth.
Conclusions
While CAP is not revolutionary, it fills a crucial gap by providing a free, modern, computationally-ideal, and user-friendly tool for cell confluence measurement. Its application spans multiple research domains, improving the accuracy and efficiency of experiments in pharmaceutics, cancer research, regenerative medicine, and general cell culture monitoring. By simplifying the confluence measurement process, CAP supports the advancement of research and contributes to the reliability of experimental outcomes.
Instructions
-
Download Python:Go to python.org and download the appropriate version of Python3.
-
Install/Check Installation of Pip:Run one of the following commands in your Command-Line Interface (CLI):
- OS: python -m ensurepip --upgrade
- Windows: py -m ensurepip --upgrade
-
Downloading Script:Download the ConfluenceAnalysisProgram.txt file linked in supplementary material, change the file extension to .py, and place it in the desired file directory.
-
Running the Script:Launch your preferred CLI such as Terminal for OS, or Command Prompt for Windows. Within your CLI, navigate to the file directory containing ConfluenceAnalysisProgram.py. Then, run the script.
-
File Provision:The program will check that all necessary external libraries are installed (and install them if not). Then, it will prompt you to enter a FOLDER with images of type .jpg, .jpeg, .png, .bmp, .tiff, .tif, or .gif.
-
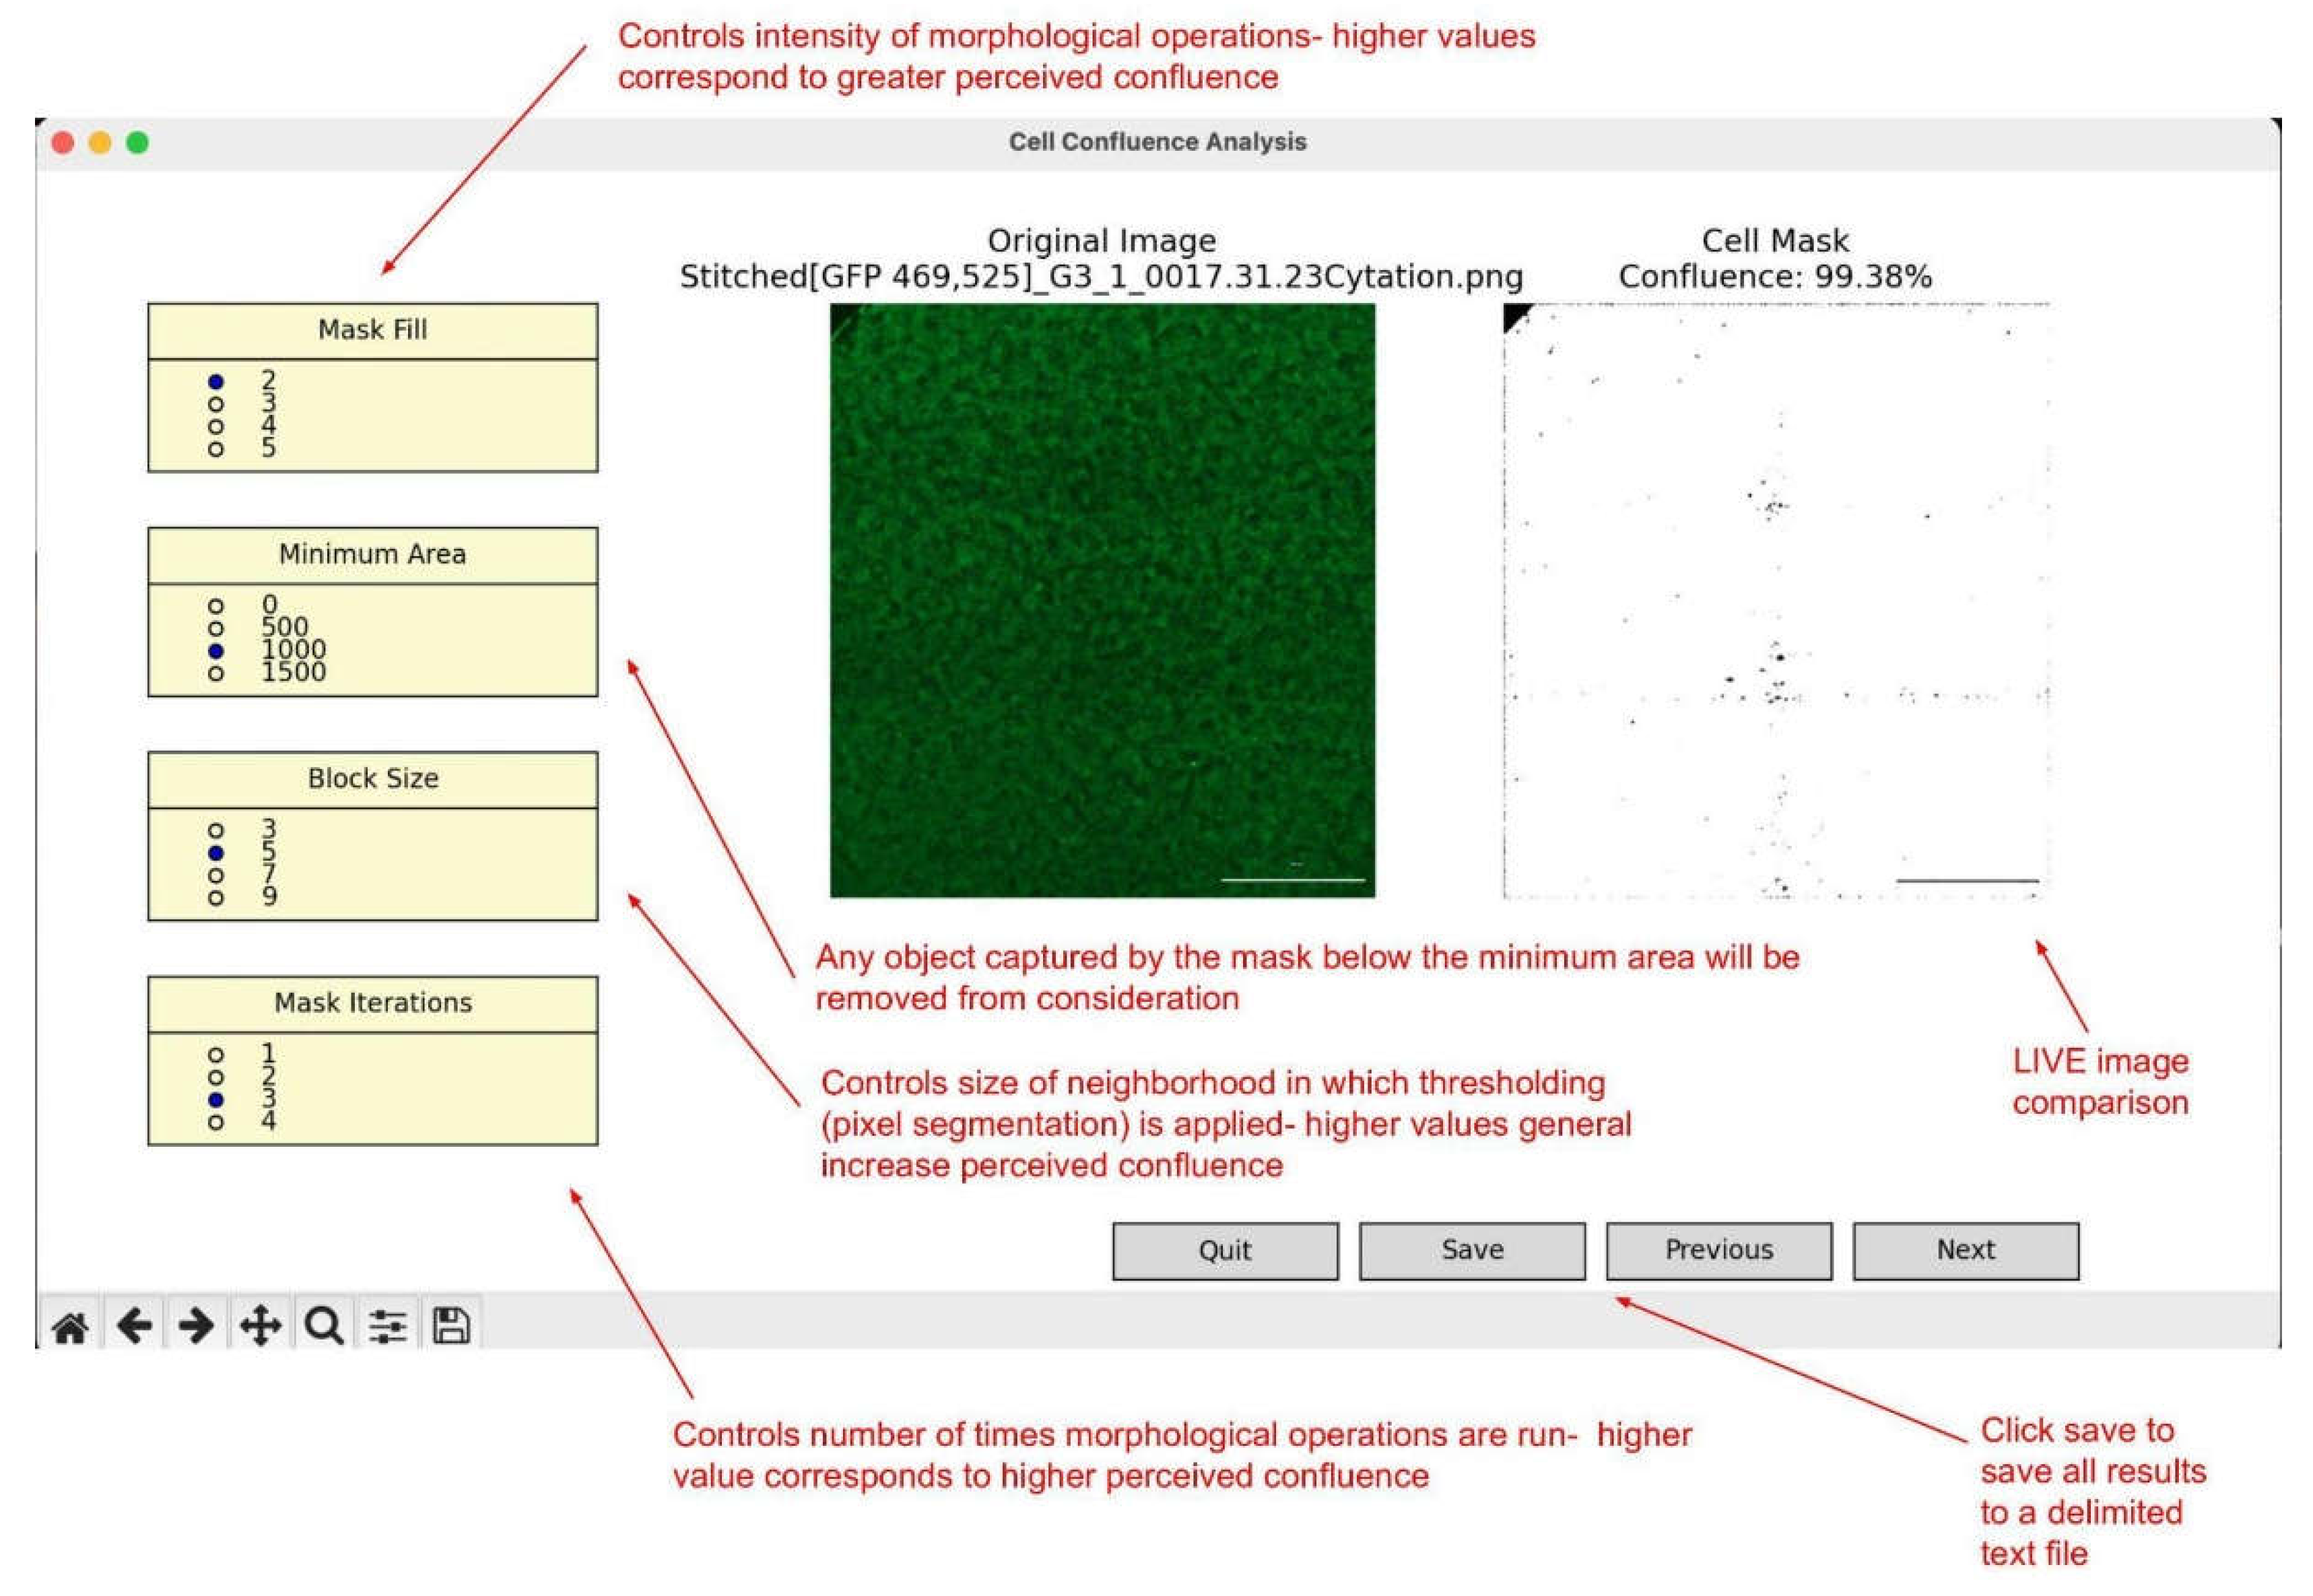
Pop-up Preview Window:After supplying the path to the relevant folder, a pop-up window will emerge displaying an image within the folder on the left, and the cell mask on the right. To the left are four adjustable parameters that should help you align the cell mask with perceived cell presence in the original image. They are each described below:
Mask Fill: This parameter controls the size of the kernel used in morphological operations (such as closing) applied to the binary image after thresholding. It affects how much the detected cell areas are filled in. A higher value for Mask Fill means a larger kernel, which results in more connected and filled-in areas, representing higher confluence. This value is initialized to three on runtime.
Minimum Area: Sets the threshold for the smallest area that a detected object (in this case, a cell) must have to be considered in the mask. Any objects below this area will be removed. This helps to filter out noise and small artifacts that are not cells. This value is initialized to 1,000 on runtime.
Block Size: Controls the size of the neighborhood area used for adaptive thresholding. It determines how local the thresholding will be. Smaller block sizes make the thresholding more sensitive to local variations in intensity, while larger block sizes make it more global. This value is initialized to seven on runtime.
Mask Iterations: Specifies the number of iterations for morphological operations applied to the thresholded image. Morphological operations such as dilation and erosion are used to close gaps and remove noise. More iterations result in a more smoothed and cleaned-up mask, but can also cause more merging of close objects. This value is initialized to three on runtime.
Figure 1.
Example preview window with fluorescent biosensor cell image describing CAP functionalities.
Figure 1.
Example preview window with fluorescent biosensor cell image describing CAP functionalities.
Saving Results
After finding suitable parameters, click the ‘save’ button in the bottom right corner to process every image in the folder and save the calculated confluences to a tab-delimited text file within the input folder called ‘ConfluenceResults.txt’. For larger input folders (100+ images), this saving process may take a few minutes. Within your CLI window, there is a progress bar that will measure time elapsed, time expected until completion, number of images processed, and the average processing time for each image. Don’t be alarmed if the progress bar initially shows very high expected completion times. We have found that it tends to update non-linearly.
Supplementary Materials
The following supporting information can be downloaded at the website of this paper posted on Preprints.org.
Acknowledgments
We would like to thank the USC Bridge Undergraduate Science (BUGS) Program for funding this work as part of a summer research project. Additionally, we would like to acknowledge the role of generative AI, ChatGPT particularly, in code development and troubleshooting.
References
- Busschots, S.; O’Toole, S.; O’Leary, J.J.; Stordal, B. Non-invasive and non-destructive measurements of confluence in cultured adherent cell lines. MethodsX 2015, 2, 8–13. [Google Scholar] [CrossRef]
- Lobo, V.; Shcherbinina, E.; Westholm, J.O.; et al. Integrative transcriptomic and proteomic profiling of the effects of cell confluency on gene expression. Sci Data 2024, 11, 617. [Google Scholar] [CrossRef] [PubMed]
- Hur, S.S.; del Álamo, J.C.; Park, J.S.; Chien, S. Roles of cell confluency and fluid shear in 3-dimensional intracellular forces in endothelial cells. Proceedings of the National Academy of Sciences 2012, 109, 11110–11115. [Google Scholar] [CrossRef] [PubMed]
- Shamhan, M.; Idris, A.S.; Toha, S.F.; Daud, M.F.; Idris, I.M.; Malik, H. An automated approach for fibroblast cell confluency characterisation and sample handling using AIoT for bio-research and bio-manufacturing. Cogent Engineering 2023, 10. [Google Scholar] [CrossRef]
- CellProfiler. Retrieved from https://cellprofiler.org/.
- Malik, H.; Idris, A.S.; Toha, S.F.; Mohd Idris, I.; Daud, M.F.; Azmi, N.L. A review of open-source image analysis tools for mammalian cell culture: algorithms, features and implementations. PeerJ Computer Science 2023, 9, e1364. [Google Scholar] [CrossRef]
- Logos Biosystems. Monitoring confluency of adherent cells in multi-well plates using the CELENA® X High Content Imaging System. 2020. Retrieved from https://logosbio.com/.
- Farrell, C.J.; Cicalese, S.M.; Davis, H.B.; Dogdas, B.; Shah, T.; Culp, T.; Hoang, V.M. Cell confluency analysis on microcarriers by micro-flow imaging. Cytotechnology 2016, 68, 2469–2478. [Google Scholar] [CrossRef] [PubMed]
- Forero, M.G.; Hidalgo, A. Image Processing Methods for Automatic Cell Counting In Vivo or In Situ Using 3D Confocal Microscopy. InTech 2011. [Google Scholar] [CrossRef]
- Chiu, C.-H.; Leu, J.-D.; Lin, T.-T.; Su, P.-H.; Li, W.-C.; Lee, Y.-J.; Cheng, D.-C. Systematic quantification of cell confluence in human normal oral fibroblasts. Applied Sciences 2020, 10, 9146. [Google Scholar] [CrossRef]
- Freshney, R.I. Culture of Animal Cells: A Manual of Basic Technique and Specialized Applications. Wiley-Blackwell, 2010. [Google Scholar]
- Xue, Z.; Zeng, J.; Li, Y.; Meng, B.; Gong, X.; Zhao, Y.; Dai, X. Proteomics reveals that cell density could affect the efficacy of drug treatment. Biochemistry and Biophysics Reports 2023, 33, 101403. [Google Scholar] [CrossRef] [PubMed]
Figure 2.
(A) Plated HEK293 cells stained with Hoechst 33342. The analysis parameters were a mask fill of 3, minimum area of 0, block size of 5, and mask iterations of 3. (B) Plated fluorescent biosensor cells analyzed with a mask Fill of 2, minimum area of 1000, block size of 7, and mask iterations of 3.
Disclaimer/Publisher’s Note: The statements, opinions and data contained in all publications are solely those of the individual author(s) and contributor(s) and not of MDPI and/or the editor(s). MDPI and/or the editor(s) disclaim responsibility for any injury to people or property resulting from any ideas, methods, instructions or products referred to in the content. |
© 2024 by the authors. Licensee MDPI, Basel, Switzerland. This article is an open access article distributed under the terms and conditions of the Creative Commons Attribution (CC BY) license (http://creativecommons.org/licenses/by/4.0/).
Copyright: This open access article is published under a Creative Commons CC BY 4.0 license, which permit the free download, distribution, and reuse, provided that the author and preprint are cited in any reuse.


