1. Introduction
Currently, information systems for organizations have high importance due to the impact generated in the execution of all the processes and procedures developed within the organizations [
1] , in the same way, the compliance of these processes in a manner optimal and efficient within the framework of continuous improvement. Process mining uses the data recorded in information systems and processes them through algorithms that allow obtaining the structure of the processes while extracting valuable information to understand, check, discover, and improve organizational processes [
2].
The processes of organizations are supported by the information stored in information systems, which record data regarding activities, events, times, and variables associated with the execution of all processes. All this information can be used with process mining techniques to discover how processes are executed and make decisions to improve or automate them. [
3]
Currently, information systems such as ERP (Enterprise Resource Planning), defined according to SAP [
4] , play a crucial role in organizations by guaranteeing real-time measurement of the activities executed in the processes of organizations [
5] . These systems not only facilitate the integrated management of business resources but also promote optimal and efficient compliance with processes in the operation [
6] .
Process mining emerges as a fundamental tool in this context by taking advantage of the information recorded in information systems and applying process mining techniques, valuable information is obtained to understand, check, discover, and improve all organizational processes [
7] Given the above, process mining has an impact on ERPs by providing a holistic view of organizational workflows allowing identifying optimization opportunities and making informed decisions to boost efficiency and competitiveness in organizations.
The acquisition of a business intelligence (BI) tool and its implementation are quite advantageous for organizations such as pharmaceutical companies. Expanding its use can have a positive global impact. However, the pharmaceutical context has some particularities that a BI solution should be prepared to respond to. For example, the BI system could lead to the optimization of resources in various departments such as the collection and billing department; will improve the condition of financial analysis through efficient diagnoses and the identification and application of the best practice protocols for treatment, among others [
8] .
The proposed research methodology is Design Science Research (DSR), which is a research approach that links mixed research to the design of artifacts in the field of engineering. This methodology results in an artifact that is the actual billing and collection process in the case study in addition to being the framework to apply process mining aimed at determining realistic processes in organizations.
Likewise, in the context of the pharmaceutical sector in Colombia, there is a growing demand for efficiency and transparency in processes related to collection management and billing. The pharmaceutical industry faces unique challenges, such as the need to comply with strict regulations, manage inventories efficiently, and ensure product traceability [
9]. Furthermore, competition in the market is increasingly intense, prompting organizations to look for ways to improve their operational performance and stay at the forefront in a dynamic and competitive environment [
10].
By considering the context of the pharmaceutical sector through a case study, the application of process mining in the design and optimization of collection and billing processes becomes highly relevant by taking advantage of the information generated by ERP information systems [
11], the pharmaceutical sector can identify opportunities to improve efficiency, reduce costs, and improve customer satisfaction [
12]. The hypothesis of this research indicates that the construction of the real billing and collection process in the pharmaceutical sector can be developed from the creation of an artifact in the DSR methodology that is validated in a case study in Colombia.
This article is structured by section,
Section 2 addresses the state of the art, application in various sectors of process mining in organizations and related works, we continue with
Section 3 in which the methodology to apply process mining in the selected case study is described.
Section 4 analyzes the results obtained. In
Section 5 the discussion is carried out and in
Section 6 the conclusions and future work are presented.
2. State of the Art
Process mining emerged in the early 1990s as a response to the need to obtain a more precise and complete view of the real functioning of processes in organizations, also as a discipline derived from the intersection between data mining and business process management Business Process Management (BPM) [
13]. Early work in this field focused on the development of techniques to extract useful knowledge from event logs generated by organizations' information systems.
A useful tool for modeling processes is the so-called Petri Nets, which have a connection with process mining as a powerful and versatile tool for modeling concurrent systems [
2] and is an active area of research, they emerged in 1962 as part of the doctoral thesis of Carl Adam Petri, a German scientist who was looking for a way to model the behavior of concurrent systems, such as industrial production systems [
14].
On the other hand, BPM has its roots in the industrial efficiency movement of the early 20th century. Pioneers such as Frederick Taylor and Henry Ford introduced the idea of standardizing work processes to improve efficiency [
15].
Today, BPM is a mature and widely applicable discipline. Businesses of all sizes use BPM to improve efficiency, quality, and customer satisfaction [
16]
Given the above, BPM and Petri Nets are valuable tools for modeling and designing processes, but they do not always reflect what happens, since it is a process representation and does not consider real-time operations or changes. sudden or not represented in the processes. This is because process models may be incomplete or inaccurate, processes may change over time without the models being updated, and events that occur in a process may not be recorded in computer systems.
Process mining addresses these limitations by extracting data from the event logs of computer systems. This data can include information about when each activity starts and ends, who performs it, what errors occur, etc.
From this data, process mining can discover real process models, analyze process performance, identify bottlenecks and areas for improvement, and verify compliance with standards [
17].
Process mining is an essential tool for bridging the gap between process models and reality. It allows companies to gain a deeper understanding of how their processes work and make informed decisions to improve them [
18].
2.1. Applications in Various Sectors
Process mining has found applications in a wide range of sectors, including retail, finance, healthcare, manufacturing, and government. To have more visibility and improve their processes, more and more companies are relying on what is called process mining [
19], a technology based on artificial intelligence [
20], and big data [
21] that analyzes data from the processes that are executed in real-time to understand, optimize and automate them.
Process mining will continue to evolve as new technologies emerge a greater amount of data is generated and there is greater computing capacity for data processing. Professionals in the pharmaceutical sector must stay updated on the latest advances in this field to take full advantage of its potential [
22].
2.2. Process Mining in Organizations
The analysis of the processes through the application of data mining occurred in 1998, the first works on the workflow were evident [
23], and research was also carried out in the field of process mining in software engineering [
24]. After this, they published articles with specific applications of process mining as they constituted important advances [
25,
26,
27,
28]. To model and discover processes, analyze organizational perspectives, and predict times [
29,
30,
31,
32,
33]. Thus, it is developed in a cycle composed of phases and discoveries of the processes by obtaining a process map, it is also related to Workflow Management (WFM) which focuses on the automation of business processes, analyzes, identifies, discovers, designs, configures, executes, monitors and evaluates the processes [
34].
Within process mining are algorithms, the first algorithms focused on process discovery, that is, on the automatic identification of the steps and flow of a process from event logs without a predefined model. Algorithms such as Van der Aalst's α algorithm and the Heuristic algorithm of Weijters and Van der Aalst laid the foundations for process modeling by the process mining technique [
35].
Process mining takes the information available in ERP information technology systems using it to visualize and reconstruct process flows while identifying deviations and patterns to address critical points [
2].
It is important to keep in mind that there are different approaches to process discovery techniques, according to [
2] some of these approaches are: the general algorithmic approach such as the α algorithm, the genetic algorithm, the fuzzy mining and discovery techniques, exhibit 1 below lists these approaches with their advantages and disadvantages.
Table 1 shows some process mining algorithms and techniques that have been applied in different fields over time. In addition, it is worth highlighting that researchers have focused on developing and testing algorithms to overcome limitations and problems found in process mining techniques and emphasize the need to have more practical studies to test the benefits of process mining in real cases [
7].
In this research, the first approach was used given that the other process mining approaches involve the design of algorithms and heuristics in first-order logic to understand the relationship and the knowledge base deposited in the ERPs of the organizations, in addition to the flexibility that the alpha mining algorithm allows us to adapt the needs of real billing and collection processes in the case study selected in this research.
2.3. Business Intelligence
Business intelligence (BI) consists of transforming stored information into knowledge, allowing accurate data to be provided to a specific user at the right time to support the decision-making process in real-time. BI integrates a set of tools and technologies that facilitate the collection, integration, analysis, and visualization of data.
To implement a BI platform, it is necessary to follow a series of intermediate steps common in the development of this type of software tool, such as the construction of a Data Warehouse (DW). Some of these steps are considered fundamental for the successful implementation of a BI system, including planning tasks and defining expected results, determining the architecture that the BI system will follow, and selecting and installing the tool. of BI, the construction of the dimensional model of the Data Warehouse, the Extract, Transform, and Load (ETL) process, and at the end the development of the BI application [
39].
2.4. Related Works
There are several works and research in the field of process mining and business process optimization that address topics like the proposal in this article. Among them, the studies by [
40,
41,
42,
43] stand out, which have investigated the application of process mining in improving financial processes in different business contexts.
[
40] uses process mining techniques to analyze and optimize collection and billing processes in a telecommunications company. Although its approach allowed us to identify some areas of improvement and optimization, its main limitation was the lack of integration with specific information systems such as SAP and it did not consider the type of data repository available according to the size of the organization, which limited the depth of analysis and implementation of improvements in real-time.
On the other hand, [
42]explored the application of process analysis techniques in the banking sector to improve efficiency in collection and billing processes. Although they managed to identify some patterns and trends focused on fraud risk, their focus was on the identification of deviations and not on the detailed modeling of processes, which limited their ability to provide specific recommendations in the provision of financial services in the sector. banking.
To conclude, [
43] investigated the implementation of business process management systems (BPMS) to improve efficiency in collection and billing processes in a service company. His approach offered greater automation of processes and its main disadvantage was the complexity in configuring and maintaining the systems, as well as the difficulty in adapting to changes in business processes.
This article has great potential to positively impact the Colombian pharmaceutical sector by offering practical, evidence-based solutions to optimize collection and billing processes, key processes in the successful organizational management of the sector. The sector-specific focus, detailed application of process mining, and in-depth analysis of results differentiate it from other research and make it a valuable contribution to the research field of process modeling using process mining.
Process mining is a little-explored tool in the Colombian pharmaceutical sector. Our research contributes to its adoption and demonstrates its value in optimizing key processes such as billing and collection.
According to [
44], process modeling is an essential activity in business process management, which consists of representing the different steps, activities, and decisions that make up a process. The main objective of process modeling is to capture the reality of the business in an understandable and structured way, which facilitates the identification of areas of improvement and the making of informed decisions to optimize the efficiency and effectiveness of organizational processes.
According to [
45], the objective of process modeling is the actual discovery of the process and the different possible variants or paths in the actual execution of the process to verify compliance with the procedures, policies, and business rules.
According to [
46], to model a process, it is necessary to identify the modeling needs to delimit the scope, the processes that you want to model, and where each one begins and ends, it is also necessary to define the purpose of the modeling, you must determine what part of the process you want to represent and guide on what conceptual aspects should be considered for the analysis, likewise, the functional domains involved in the process, the organizational sector, its context, are identified. the reference models that will be considered and the tools that will be used.
[
47] mention that the most common techniques in process modeling are the flow diagram which presents a sequence of processes, as well as the data flow diagram which allows you to see how the data flows through the organization, the transformation of this data and its finalization. IDEF (Integrated Definition for Function Modeling) techniques that represent, and model processes and data structures related to business processes.
Based on the previously related research, the approach proposed in this research work integrates the alpha process mining algorithm and develops an alternative approach that contributes to the knowledge gap related to the actual construction of billing and collection processes in organizations that generate an impact a disjunctive paradigm in the construction of organizational processes, by proposing a methodology that builds a billing and collection process through process mining.
The Alpha algorithm, also known as α-miner or α-algorithm, is a fundamental method in process mining [
48]. It is used to discover process models from event logs, which are detailed records of the activities carried out within a system or process [
49]. The Alpha algorithm works iteratively, by building a process model step by step from event log data it begins with the identification of the initial activities of the process, that is, the activities that have no preceding activities. For each initial activity, the algorithm searches for the next possible activity in each event log trace. If a consistent next activity is found, it is added to the model, the process is repeated until no more next activities are found to add to the model and finally, the Alpha algorithm can handle concurrency by identifying groups of activities that can be executed in any order [
2].
3. Methodology
This article aims to build the collection and billing process in the Colombian pharmaceutical sector with the use of process mining validated in a case study. To do this, two fundamental questions will be addressed: what is the appropriate methodology for constructing the collection and billing process through process mining and business intelligence, a case study of the Colombian pharmaceutical sector? How to validate the methodology for building a collection and billing process in the Colombian pharmaceutical sector? The analysis will allow not only to identify bottlenecks but also to validate existing process models and verify compliance with the actions and tasks established within the framework of the process model developed in the organization.
Within this research work, it is worth mentioning relevant data from the company from which the data sample is taken, belonging to the pharmaceutical sector, the Colombian pharmaceutical company based in Bogotá, dedicated to the research, development, and marketing of generic medications and branded. Its constant orientation towards quality has allowed it to provide medicines that make a difference to patients over the years. It has a presence in 10 Latin American countries by manufacturing and marketing a broad portfolio of medicines that cover the main health needs, it has a complete portfolio with more than 150 commercial products and more than 25 international bioequivalence and pharmaceutical equivalence studies that support the effectiveness and safety of your medications. The company has a considerable size, with more than 600 employees and an annual turnover that exceeds 296,427 million Colombian pesos, the company has a market share with the number 6 position in the amount of income in the entire pharmaceutical sector of Colombia.
The laboratory's accounting and billing processes are complex and handle a large volume of data. The company processes an average of 2,000 invoices per month and has a portfolio of 200 clients.
The methodology of this research focuses on the DSR methodology, which aims at innovative solutions to real-world problems and serves as guidance to design projects, manage projects, identify and mitigate risks in projects, and build theories from projects and publications of results [
50]. Likewise, DSR also constitutes a methodological approach that deals with designing artifacts that serve human purposes, being a form of scientific knowledge production aimed at solving problems faced in the real world and making a scientific contribution [
51].
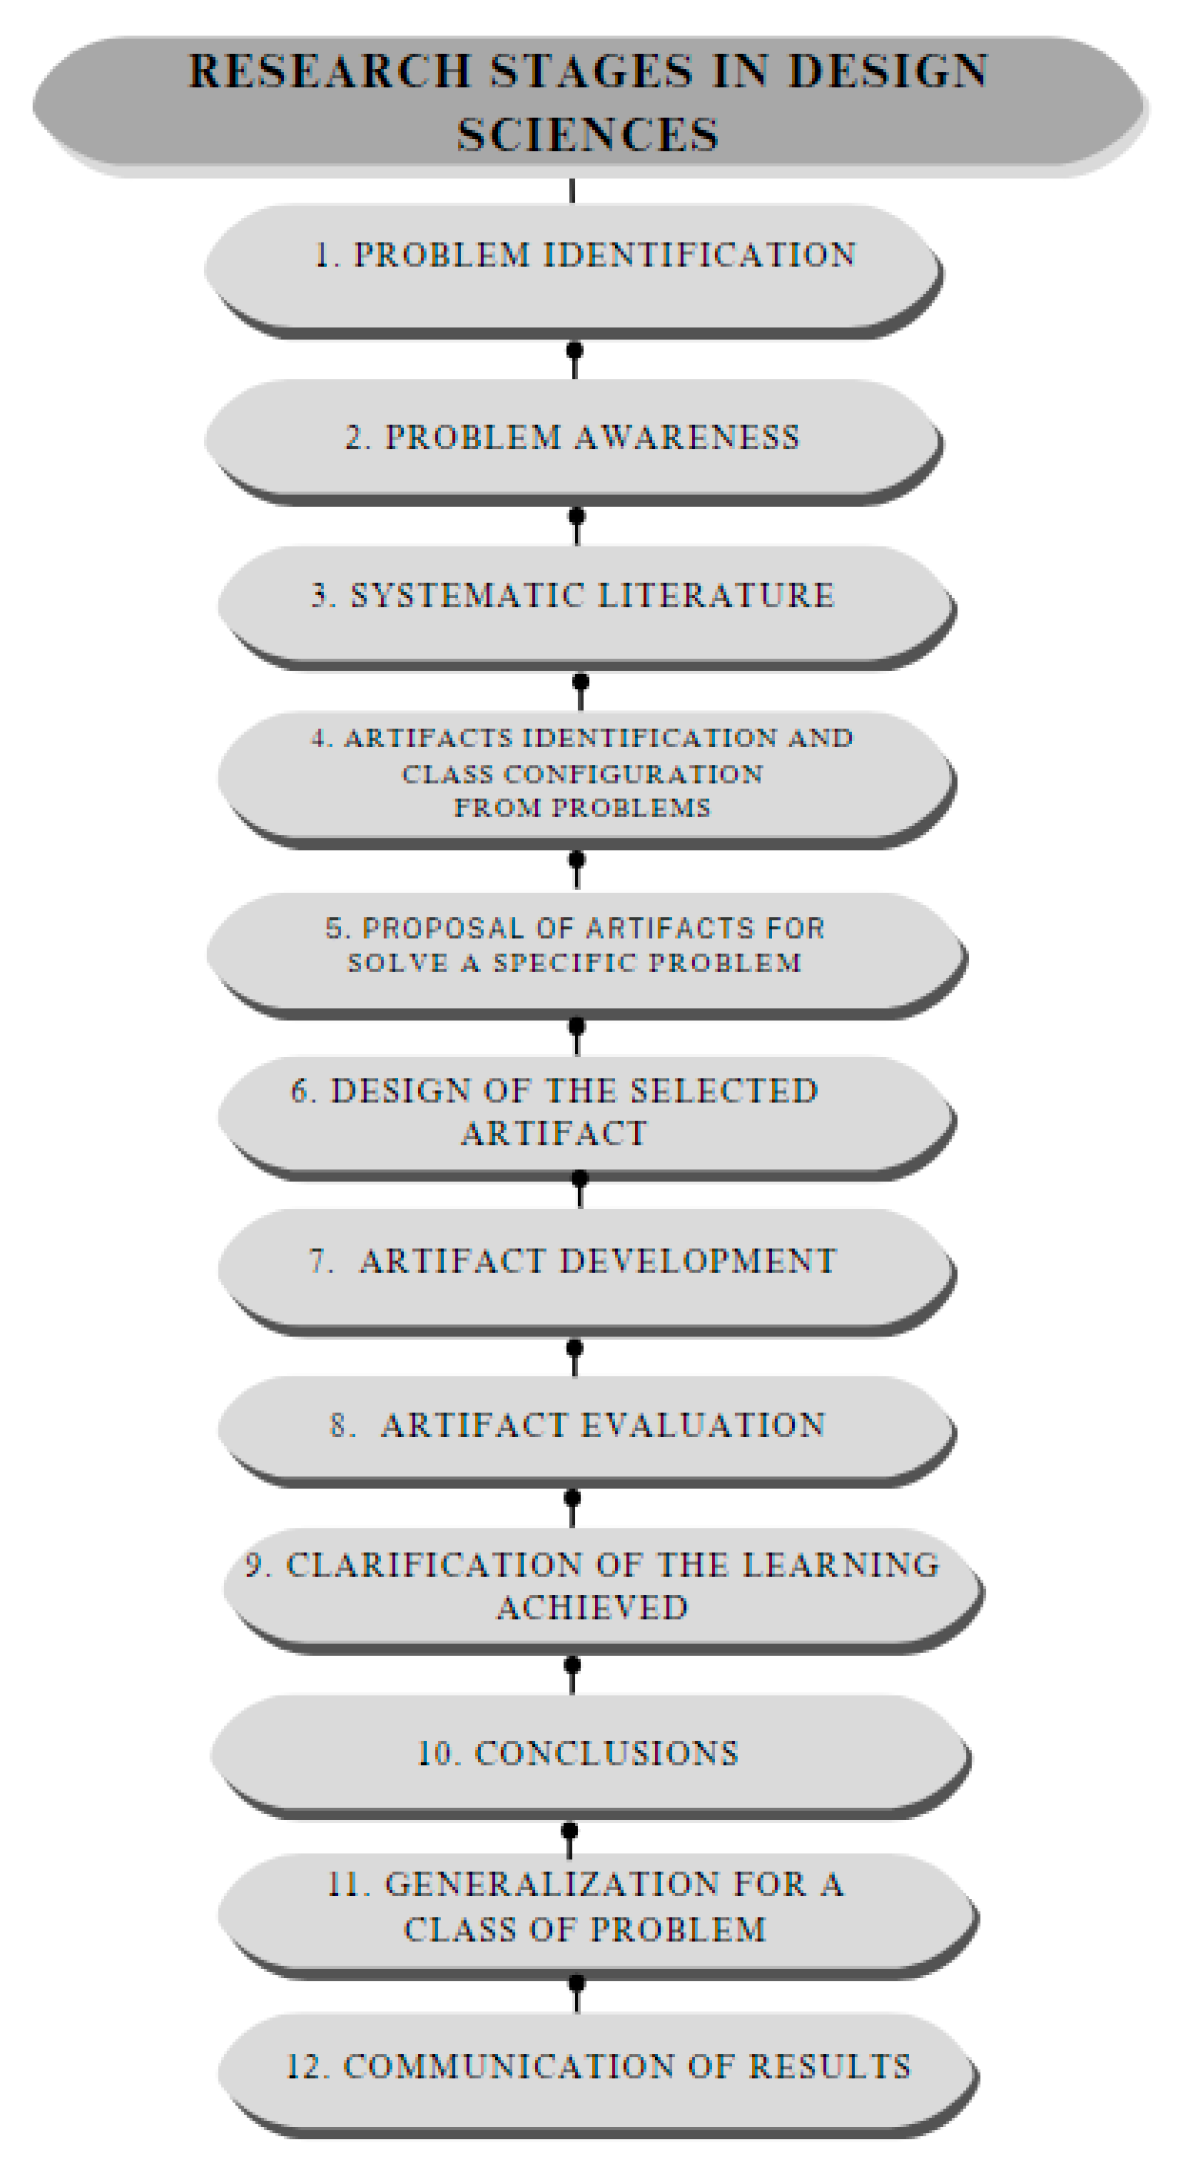
The method for conducting research in design sciences consists of 12 main steps or stages which are illustrated in
Figure 1.
From
Figure 1, the stages of research in design sciences illustrated in
Figure 1 begin with the identification of the problem in stage 1, which must be relevant to be able to structure the formalized research question, in stage 2, awareness of the problem, it is important to understand the problem and investigate to understand the context of the problem and its causes and also consider the functionalities of the artifact, its expected performance and its operational requirements [
51].
In stage 3 of systematic literature, it is essential to consult different technical literature databases such as Scopus, WoS, IEEE, Google Scholar, Science Direct, etc. That helps the researcher justify the importance of the construction and development of the artifact and the resolution of the problem [
51].
For the identification of artifacts and configuration of problem classes in stage 4, it is important to identify artifacts that address similar problems that allow the researcher to use best practices and the configuration of the problem class defines the scope of the contributions of the researcher. Artifact, in stage 5, the proposal of artifacts is related to solving a specific problem, the researcher proposes the artifacts and considers their reality, context, and feasibility to find possible solutions. In stage 6, the design of the selected artifact, the entire context in which the artifact operates, and the satisfactory solutions for the study problem must be considered. It is important to describe all the procedures for the construction of the artifact and its evaluation [
51].
In stage 7 of artifact development, the construction of the artifact is carried out. In stage 8 of the evaluation of the artifact, the behavior of the artifact is observed and measured to provide a satisfactory solution to the problem. In stage 9, with the clarification of the learning achieved, the factors that have contributed to the success of the research are explained along with the elements that have failed. Stage 10 of the conclusions shows the results of the research and the decisions made during its implementation, and the limitations of the research that may give rise to future studies are also indicated [
51].
Stage 11 of generalization for a class of problems, allows the knowledge to be applied in similar situations by other organizations and ends with stage 12 of the communication of the results, which broadly contributes to a great advance in knowledge; this communication can be carried out in magazines, seminars, conferences among others [
51].
3.1. Plan and Justify
In the article, the construction of the collection and billing process of the pharmaceutical sector in Colombia is carried out, through process mining and business intelligence through a case study. It is important to mention that the pharmaceutical industry aims to research and develop medications that improve some health problems and quality of life. The pharmaceutical industry is also a business sector dedicated to the manufacturing, preparation, and marketing of medicinal chemical products [
52].
Likewise, the pharmaceutical market is made up of private and public institutions that have the responsibility of contributing to the development of the delivery of pharmaceutical drugs [
53].
Consequently, the construction of the collection and billing process is developed from the 6 activities related to the processes, which are invoices (RV), cancellations (RF), cash receipts (DZ – DG), value credit notes (NC), and credit notes for an inventory of an organization in the pharmaceutical sector in Colombia.
3.2. Extract Event Log
The construction of the collection and billing process, a case study of the pharmaceutical sector in Colombia, through process mining and business intelligence, is carried out with information from the SAP S4Hanna V. 7.70 information system, information related to the collection and billing from cash receipt documents, inventory credit notes, value credit notes, invoices and cancellations in the period between April 2022 and March 2024.
The file extracted from SAP S4Hanna V. 7.70 contains a variety of essential data that provides a detailed view of the transactions of the collection and billing processes. Among the fields included in this file are:
• Document ID: This field uniquely identifies each accounting document recorded in SAP S4Hanna V. 7.70 which provides a means to track and manage financial transactions.
• Entry time: Indicates the time in which the accounting document was recorded in the system, which allows for analyzing the timing of transactions and detecting possible activity patterns.
• Username: This field records the name of the user who entered the accounting document in SAP S4Hanna V. 7.70, allowing you to provide information on who carried out the transaction and track responsibility in the process.
• Document type: Defines the nature of the accounting document, such as invoices (RV), cancellations (RF), cash receipts (DZ – DG), value credit notes (NC), inventory credit notes (NV), which facilitates the categorization and specific analysis of each type of transaction.
• Document date: Indicates the date on which the accounting document was generated, allowing the temporal organization of transactions and analysis of trends over time.
• Posting Date: This date represents the date on which the document was posted, which may differ from the date of the document and be relevant to accounting and financial management processes.
• Reference key (document consecutive): Provides an additional identifier for the accounting document, which can be used to link it with other related documents or track specific transactions.
• Voided with Indicates whether the accounting document has been reversed or canceled in SAP S4Hanna V. 7.70, which is important for managing errors or incorrect transactions.
• Reference: This field provides additional information associated with the accounting document that may include details about the nature of the transaction, external reference numbers, or any other information relevant to the collection and billing process, in the case of billing and credit notes. corresponds to the consecutive one in the DIAN of these documents.
With the files extracted from SAP S4Hanna V. 7.70 through transaction FB03 - view document, a database is created with the information for the construction of the collection and billing process of the pharmaceutical sector in Colombia, through process mining and intelligence of business.
3.3. Create or Discover the Process Model
In the phase of creating or discovering the process model, data preparation is carried out, data collection, identification of data sources in SAP S4Hanna V. 7.70, the selection of the necessary variables and parameters, the extraction of the data and the transformation and cleaning of data as shown in
Figure 2.
In
Figure 2, the sequence for data preparation is illustrated.
• Data collection: The process is initiated by collecting financial transaction data relevant to collection and billing analysis, specifically in transaction FB03 - view document in SAP S4Hanna V. 7.70, which provides access to accounting document records.
• Identification of data sources in SAP S4Hanna V. 7.70: Specific data sources in SAP that contain the information necessary for the analysis are identified, which includes the Finance (FI), and Sales and Distribution (SD) modules. Transaction FB03 - view document is identified as the main data source for the study. This transaction allows you to view existing accounting documents in SAP S4Hanna V. 7.70, including invoices, cancellations, cash receipts, value credit notes, and inventory notes.
• Selection of variables and parameters: The variables and parameters that are relevant for the analysis are defined. This may include the accounting document number, document date, posting date, recording time, document type, and accounting consecutive, among others.
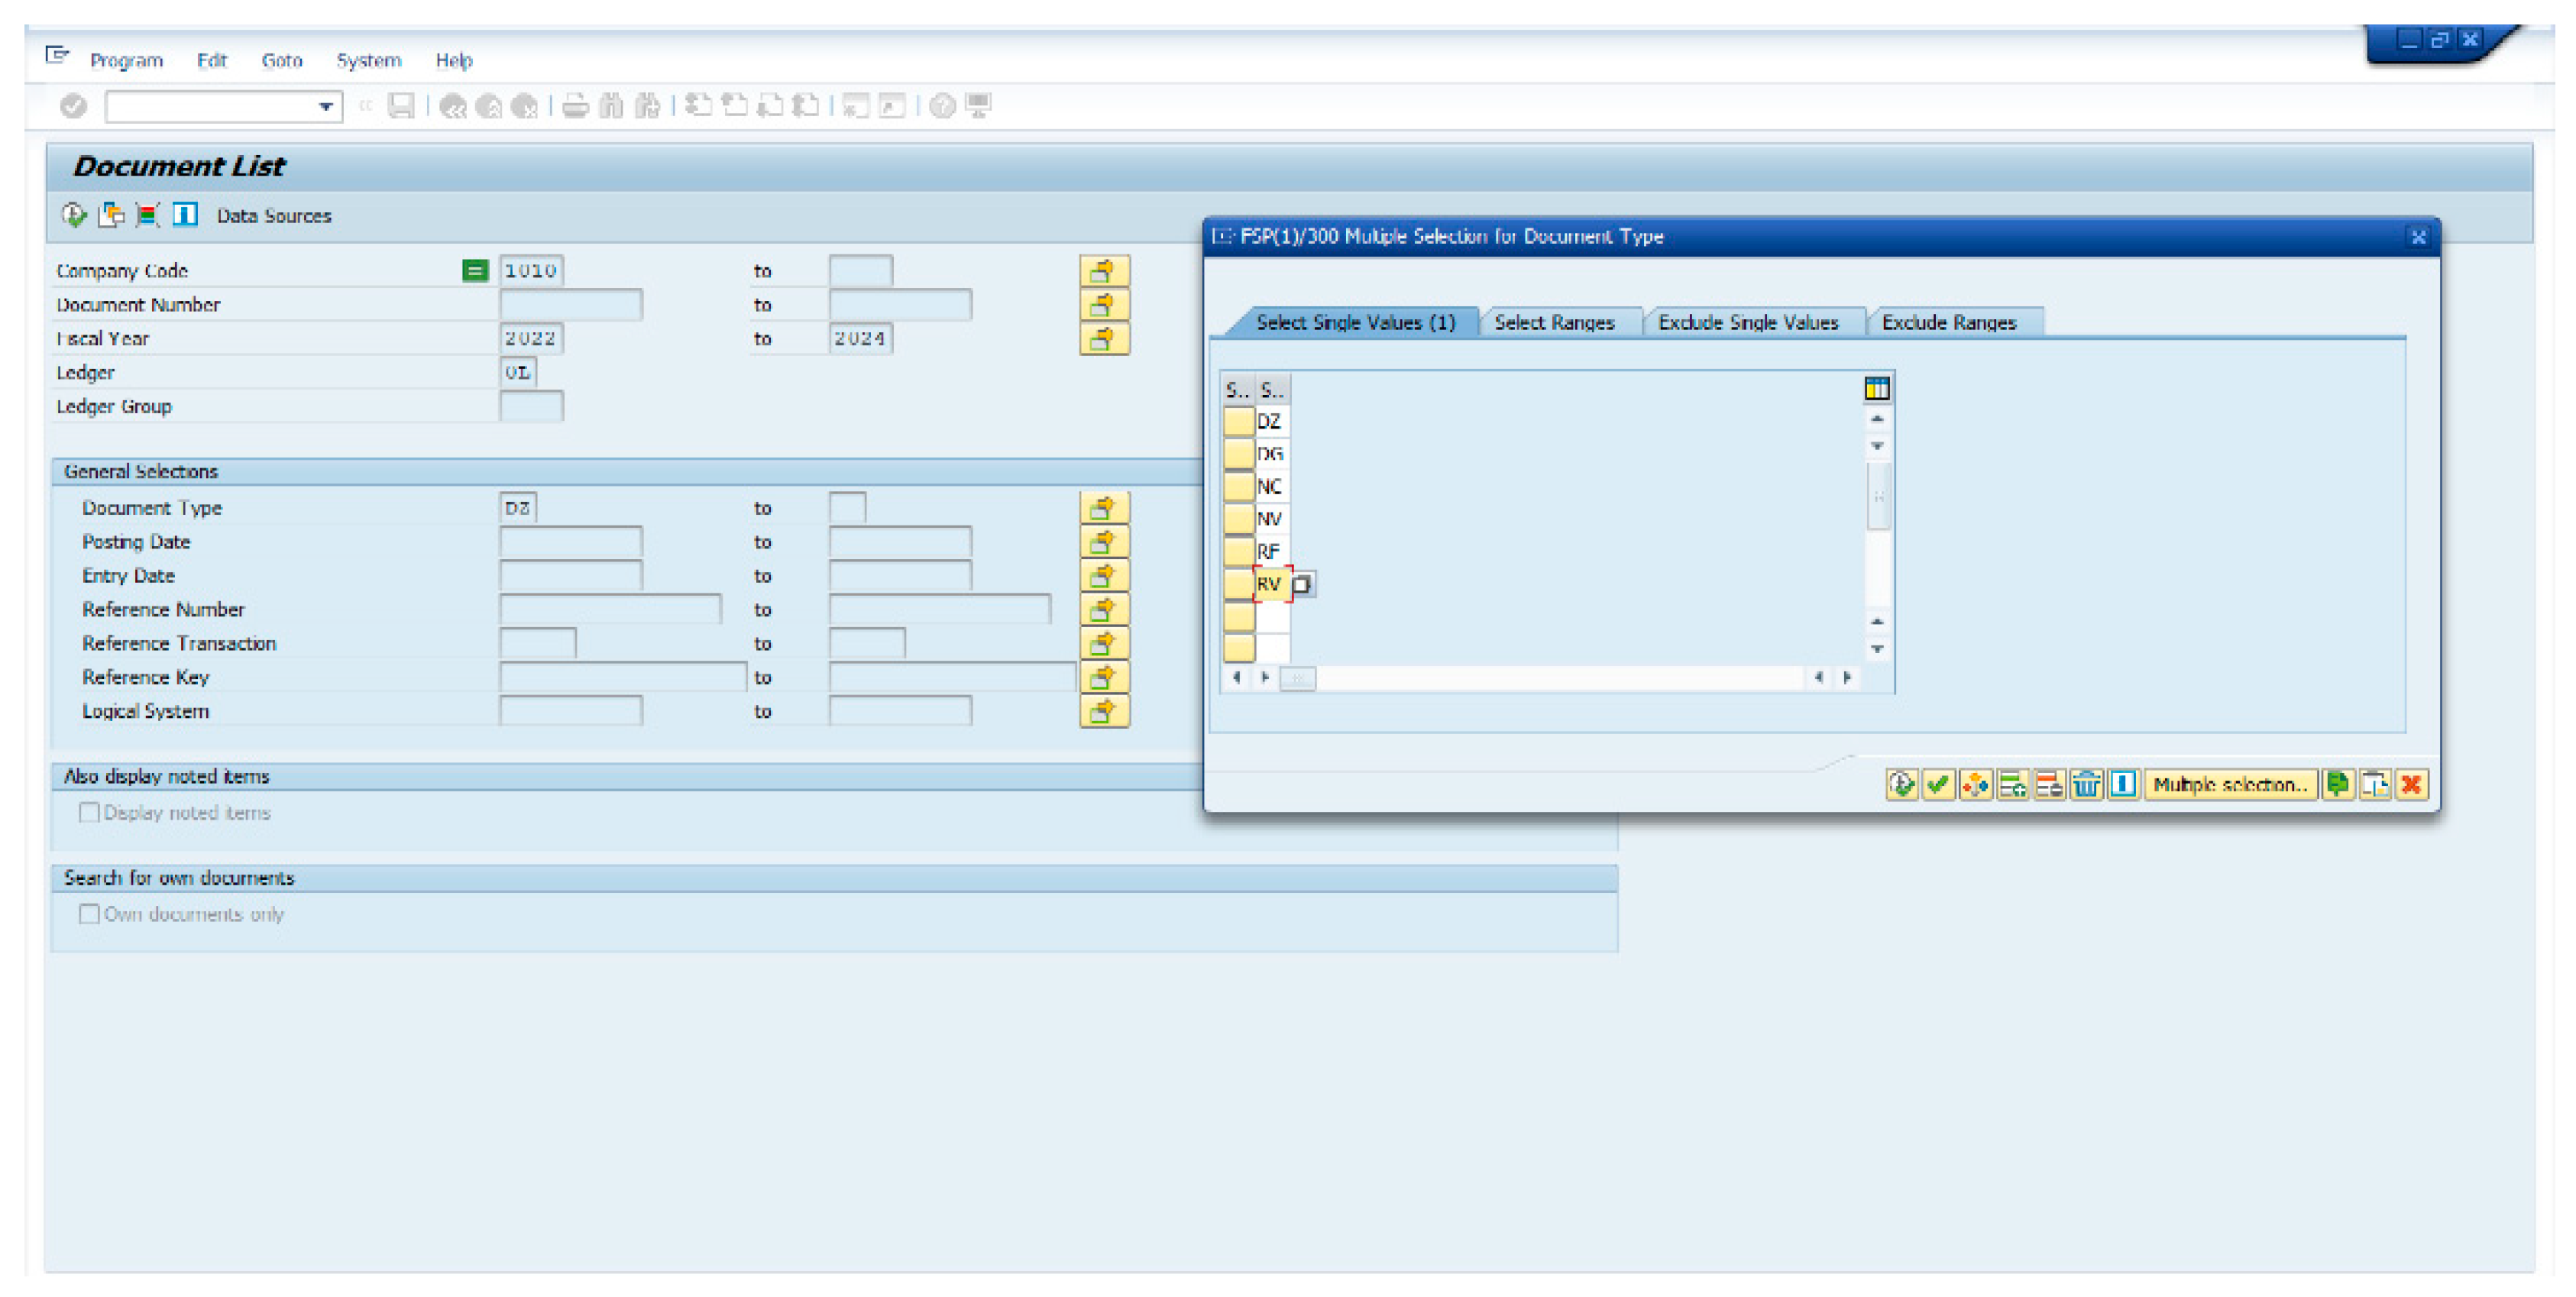
• Data extraction: Transaction FB03 - display document is used to extract data from SAP accounting documents. This involves entering the appropriate parameters, such as the periods consulted (years), ledger (accounting book), and document types to consult and when entering the transaction, it is important to ensure that the transaction has the appropriate layout (data organization) parameterized for the consultation of the information, to correctly extract the information with the necessary variables and parameters as evidenced in
Figure 3.
Figure 3 shows transaction FB03 in the SAP S4Hanna V. 7.70 information system, which is a fundamental tool to view and analyze the accounting documents recorded in the Finance (FI) module. This transaction allows users to access a wide range of financial information, including:
• Details of the accounting documents: Document number, accounting date, company, type of transaction, accounting account, amount, descriptive text, among others.
• Document lists: Filter and sort accounting documents according to various criteria, such as company code, fiscal year, date range, type of transaction, accounting account, amount, etc.
• Totals by accounting account: View the current balance and historical movements of each accounting account in a specific date range.
• Analysis of items: Break down the amounts of accounting documents into their components, such as taxes, discounts, withholdings, etc.
The transaction functionalities are:
• Document Selection: Allows you to enter the specific document number you want to view or use selection criteria to search for documents that meet certain conditions.
• Detail display: Shows detailed information for each accounting document, this includes all fields relevant to the transaction.
• Data export: Allows you to export the search results to an Excel file or other format for later analysis.
• Search functions: Offers various search options to quickly locate the desired documents, this includes free text search, search by date range, search by accounting account, etc.
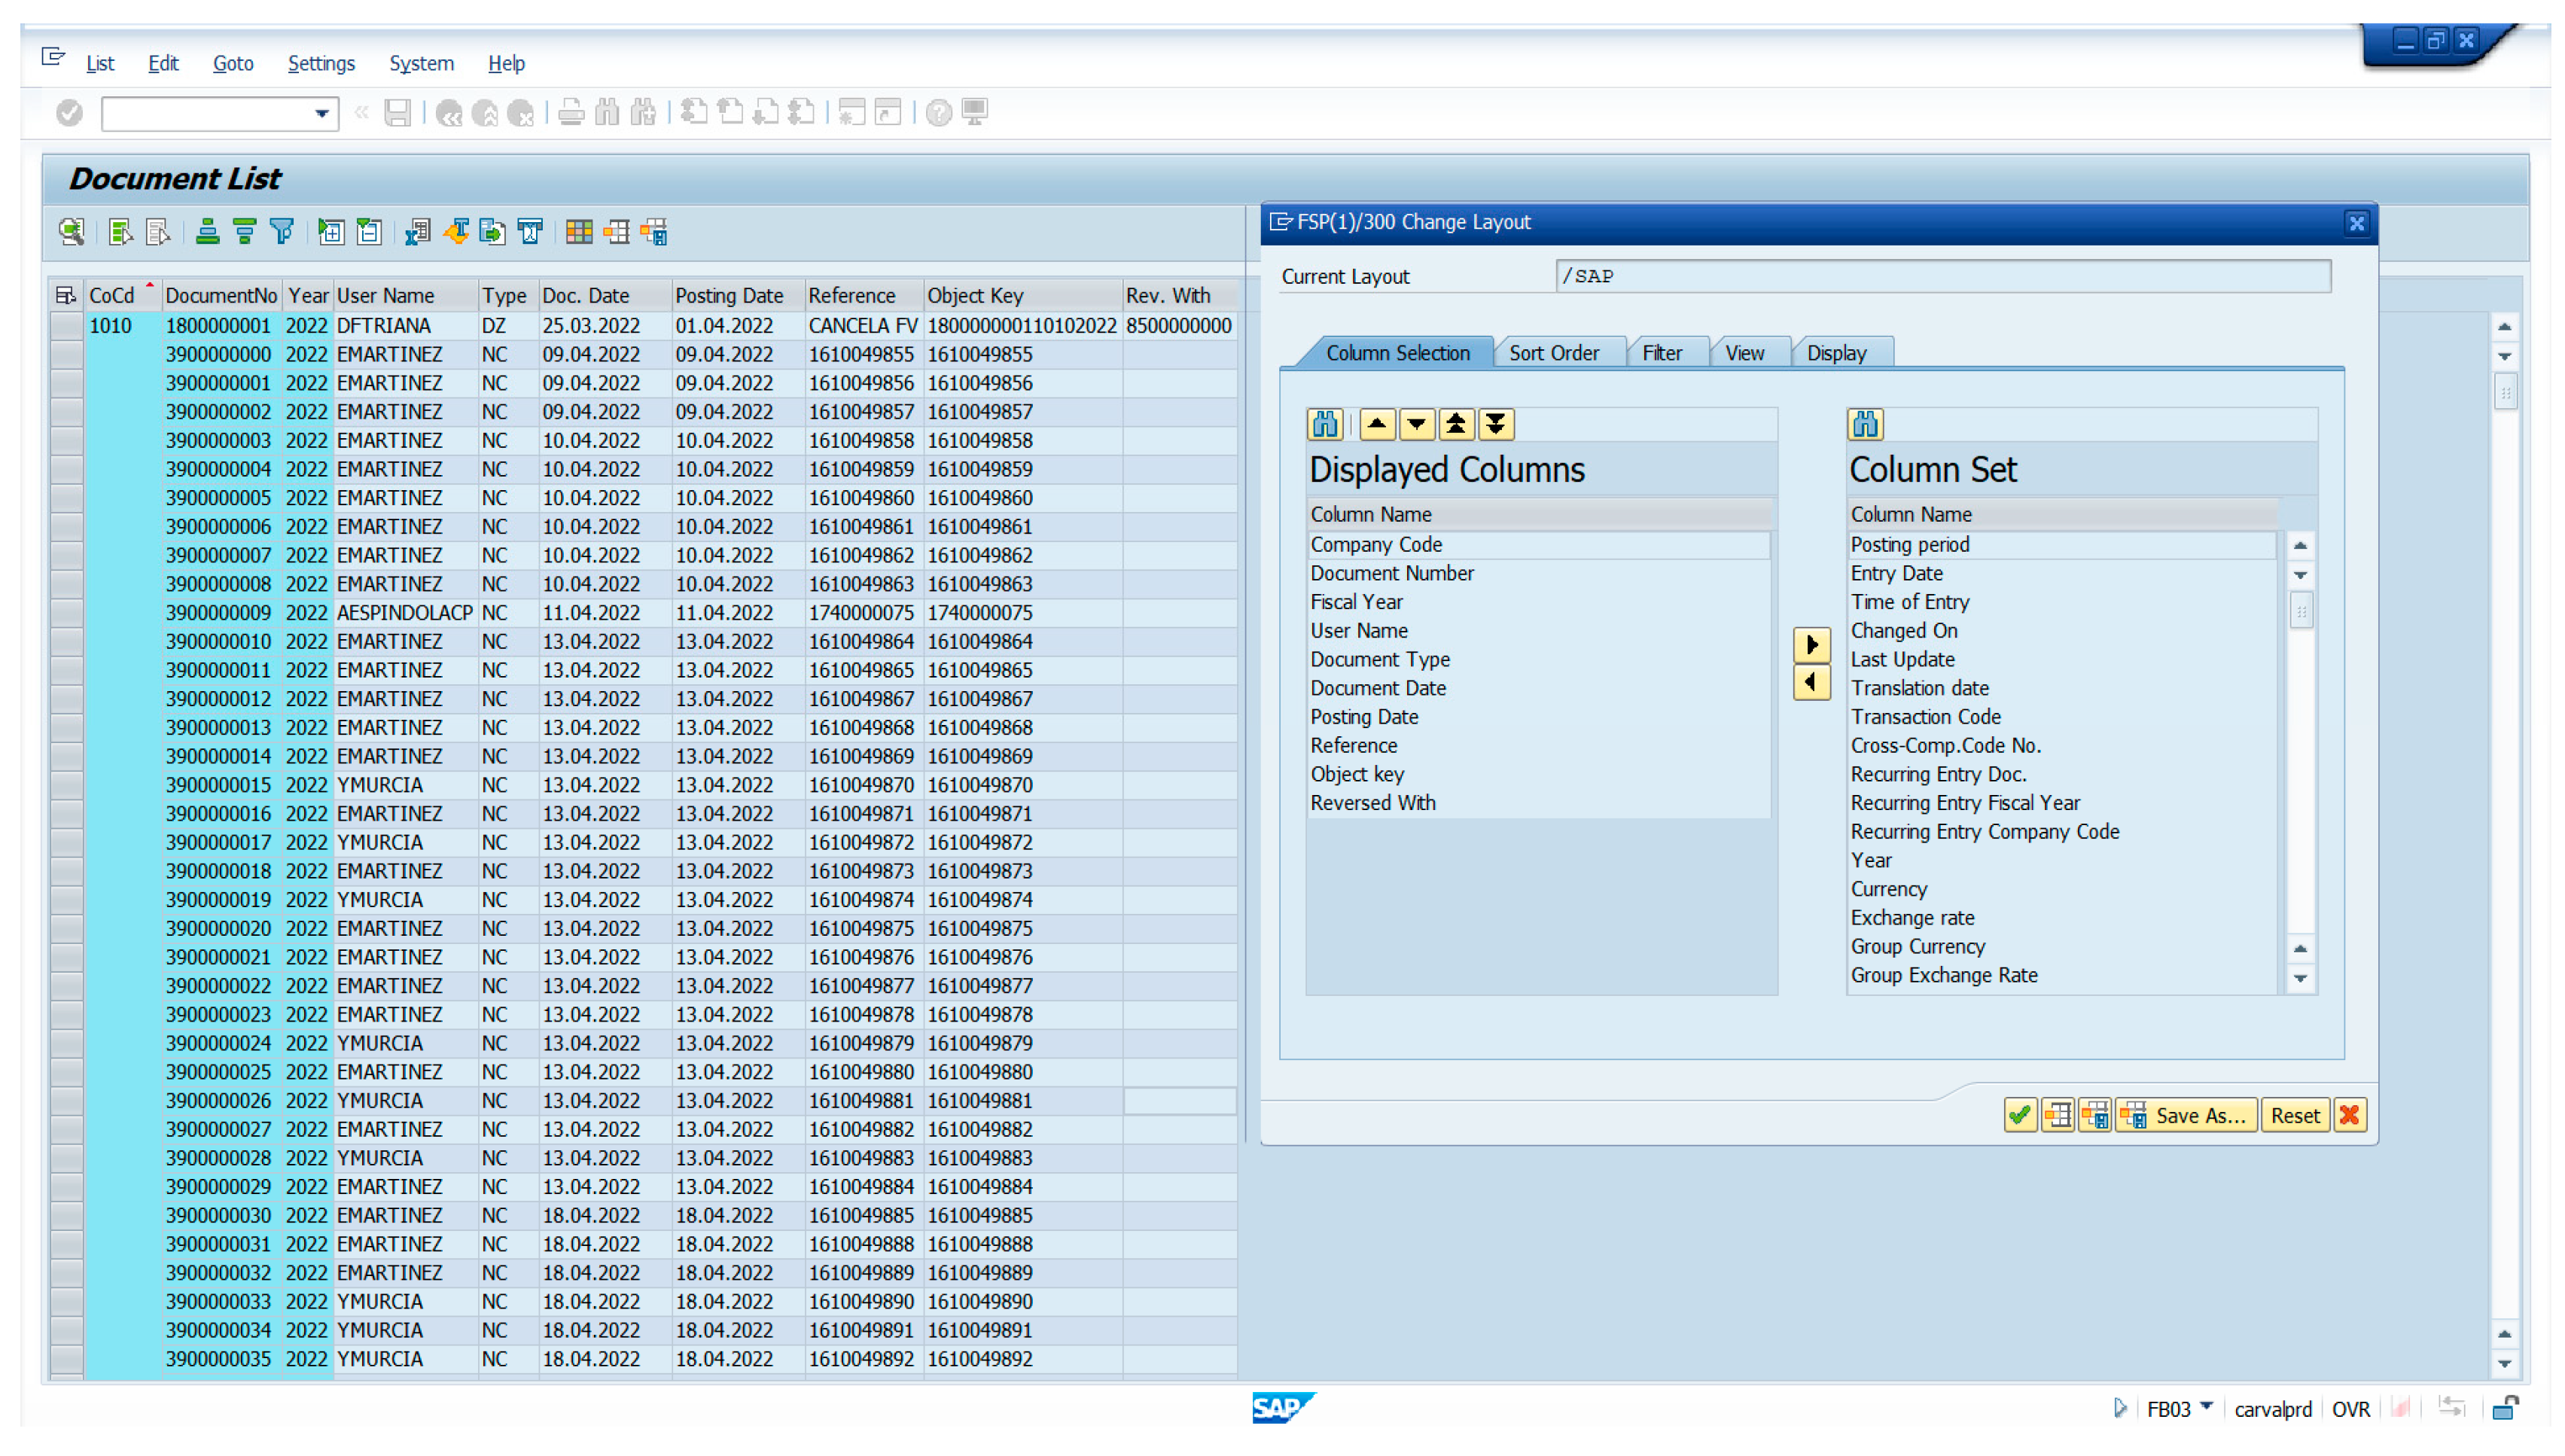
When continuing with the process, after selecting the corresponding variables, a list of documents is displayed as illustrated below in
Figure 4.
The list of documents in
Figure 4 shows the information of the documents stored in the SAP S4Hanna V. 7.70 system, this information is used to design the collection and billing process, within the figure, there are criteria:
• Company code: The company code for which the document was created.
• Document number: The unique identifier of the document.
• Fiscal Year: The fiscal year for which the document was created.
• Document name: A brief description of the document.
• User: The user who created the document.
• Document type: The type of document, such as invoice, credit note, or payment.
• Document Date: The date the document was created.
• Accounting date: The date on which the document was published in the accounting system.
• Reference: A reference number of the document.
• Reference Key: A unique identifier for the reference.
• Canceled with: Accounting document of the corresponding cancellation, if applicable
• Time: The time the document was registered in the module (FI)
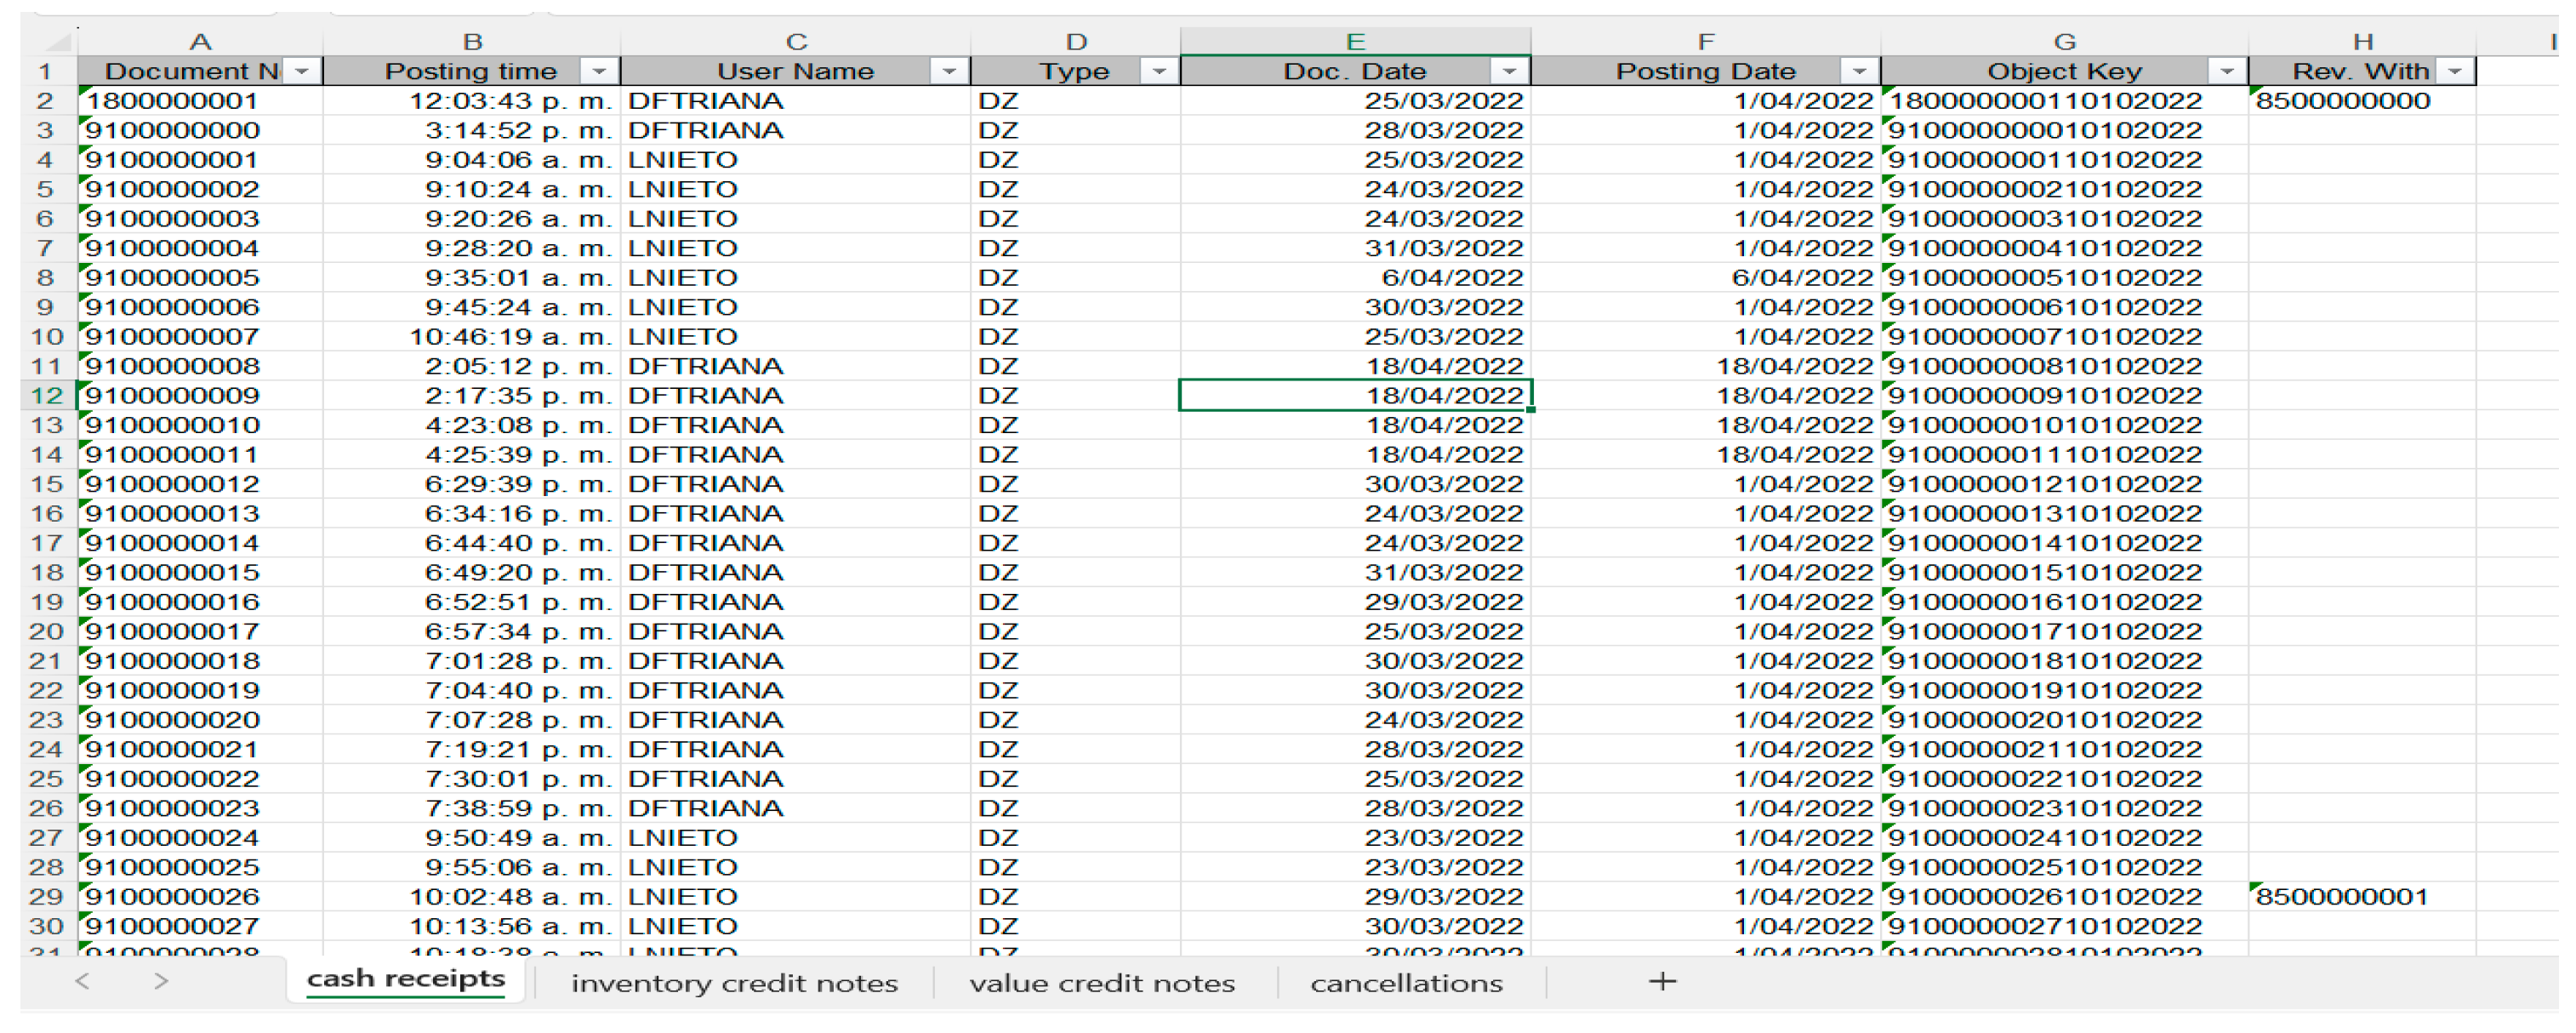
Data Transformation and Cleaning: After extracting the data, the data transformation and cleaning process is carried out. This may include removing duplicate or irrelevant data, standardizing data formats, and correcting errors or inconsistencies, and storing the data as seen below in
Figure 5.
Considering the transformation and cleaning of the data,
Figure 5 shows the data extracted from the SAP S4Hanna V. 7.70 system to Excel. The information extracted from the transaction is separated by sheets, in this case, the data of cash receipts, credit notes that affect finished product inventory, value credit notes, and invoices are displayed along with their cancellations if applicable. The data that was preserved within the data were: Document Number, Entry Time, Username, Document Type, Document Date, Posting Certificate, Reference Key, and Canceled with.
3.4. Create the Integrated Process Model
In the modeling stage, it is important to keep in mind that process mining tools have their specific functionalities, among the most popular tools are CELONIS, ProM, and DISCO, among others.
[
54] mention that the CELONIS tool allows monitoring and has associated audit functions to facilitate the analysis of information, it also has business intelligence functionalities, statistics, management of performance indicators, and the visualization of results through dashboards.
Likewise, [
55] mention that ProM is an open-source tool that brings together the main techniques developed in process mining, it also supports a wide variety of control flow models, Petri Nets, and develops plugins to support the prediction, detection and recommendation of activities and processes to improve the ability to perform process mining analysis.
Similarly, [
56] mentions that DISCO offers a user-friendly interface, presents functionalities to make filters, obtain statistics and information on cases and variants, in addition, visualize the results which allows for an analysis. process mining.
Taking these tools into account, the construction of the collection and billing process, a case study of the pharmaceutical sector in Colombia, was carried out with the DISCO tool with the license in evaluation version for the import phase of the event record, the discovery of the process and performance analysis in general with performance and frequency metrics, likewise, the ProM tool was used to apply process mining techniques and organizational analysis. The application is made with data extracted from the SAP S4Hanna V. 7.70 system illustrated below in
Figure 6.
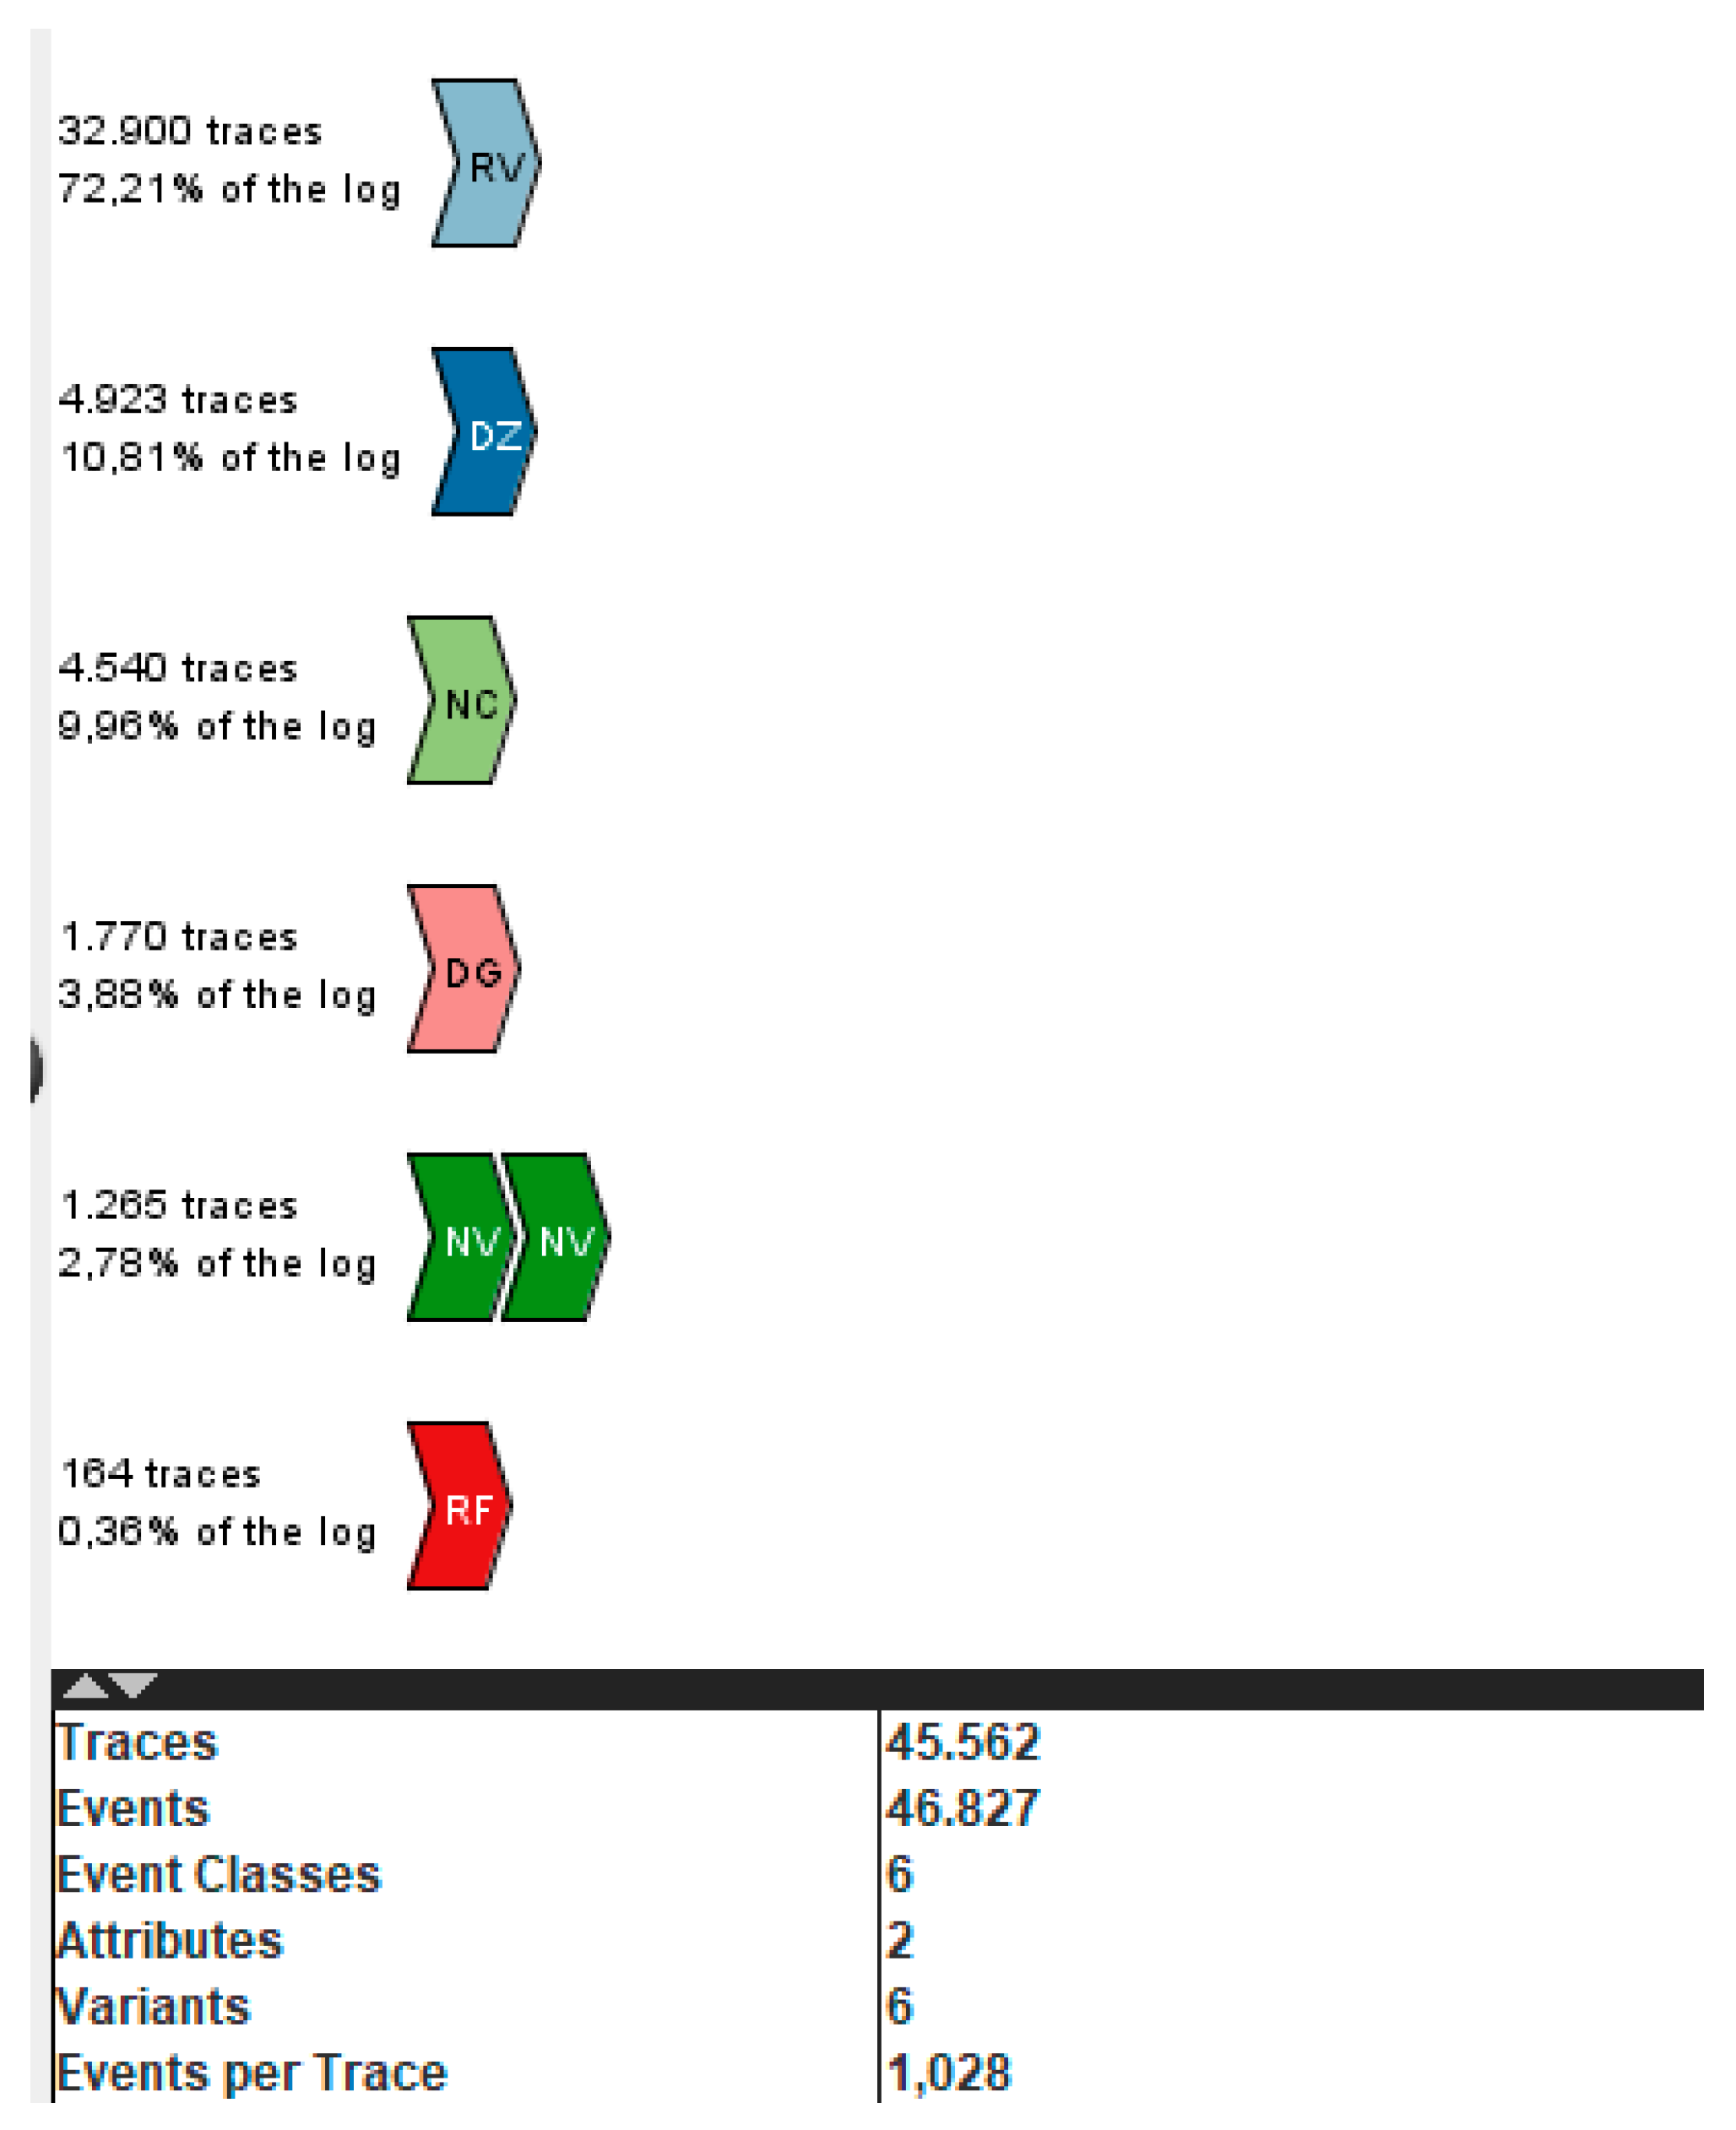
Figure 6 shows the specific data for each type of document. In the case of (RV) invoices, a total of 32,900 documents were registered with a participation percentage of 72.21% of the total data processed, (DZ - DG) cash receipts with a total of 6,693 records and a participation percentage of 14.69%, the cash receipt documents are grouped taking into account that it is the same information but is differentiated by the type of client, for example, which has a different type of document, the (NC) value credit notes which do not move the inventory have a total of 4,540 records and a participation percentage of 9.96%, (NV) credit notes that affect inventory have a total of 1,265 records and participation of 2.78%, (RF) which corresponds to invoice cancellations have a total of 164 records and a participation percentage of 0.36% with a favorable percentage for this process and the margin of error level is below 1%.
In general, the modeled collection and billing process is composed of 7 event classes, 45,562 traces, and 46,827 events.
Likewise, below, in
Figure 7 you can see the graph of the events that occur in the analyzed information.
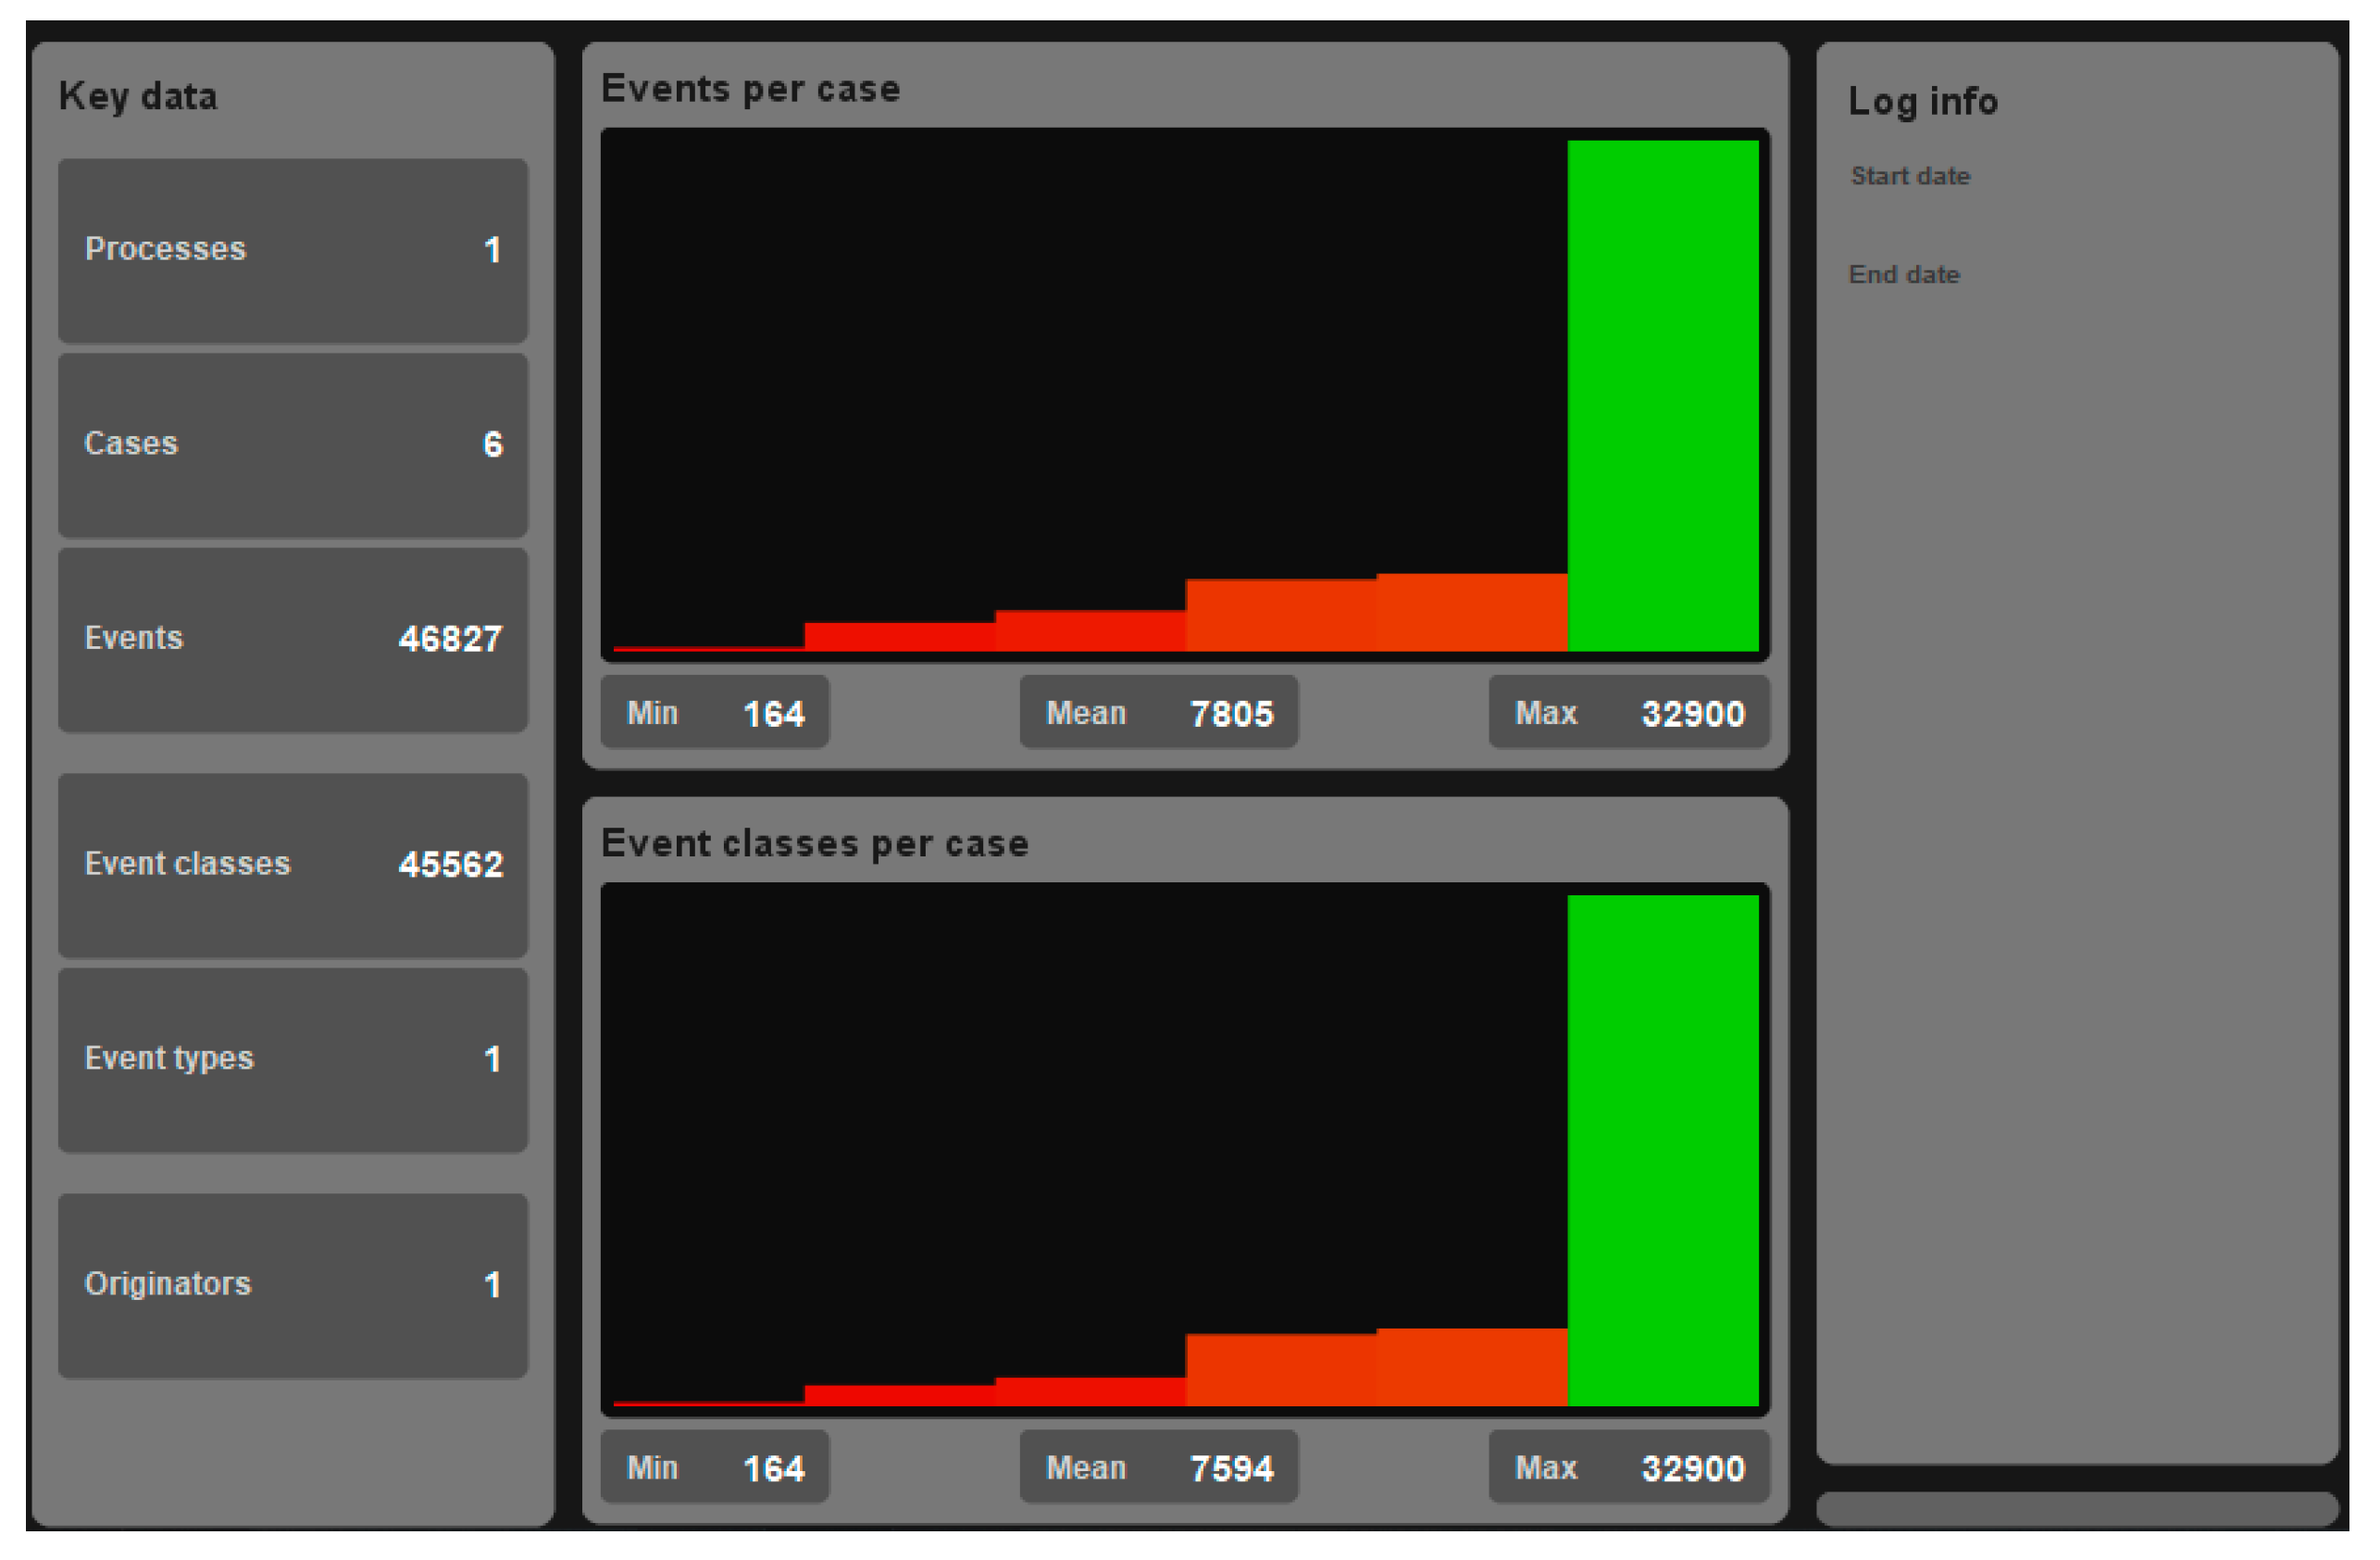
Figure 7 illustrates the XES Event Log viewer, which allows you to view the number of processes involved, and the number of cases and events by showing in red the cases or activities with the fewest events, in orange the average number of events, and in green the greatest number. of events, the graph shows the distribution of the number of events per case. This visualization provides a graphical representation of the variability in the process, highlighting the frequency of different execution paths.
• X-axis: Represents the number of events per case, varying from the minimum to the maximum values observed in the data.
• Y axis: Represents the number of cases, which indicates the frequency with which each number of events occurs per case.
• Bars: The height of each bar represents the number of cases that have the corresponding number of events.
According to the information in the image, the event log contains 6 cases with a total of 46,827 events. The average number of events per case is 7,805, with a minimum of 164 events and a maximum of 32,900 events. This suggests that the analyzed process exhibits a significant degree of variability in its execution, with some cases requiring more steps or activities than others.
Figure 7 begins with the diagnosis in terms of identifying possible bottlenecks, since the distribution of events per case helps to identify them or even inefficiencies in the process. Cases with a higher number of events may indicate areas where the process slows down or where there are unnecessary steps.
3.5. Operational Support
According to [
57], the validation of the artifacts created by the DSR methodology goes through the techniques of consistent validation, criterion validation, measurement criteria, input data validation, internal design validation, linguistic validation, relative improvement validation, representational validation, requirements validation, and theoretical validation. In the same research, validation by measurement criteria is the most common artifact validation technique, given that a form of validation developed in the proposed artifact is the case study of the pharmaceutical sector in Colombia.
Validation by measurement criteria is applied to the case study and allows the validation of compliance with the first artifact on the appropriate methodology for the construction of the collection and billing process in a case study of the Colombian pharmaceutical sector, through process mining and business intelligence by taking into account that the structure of the Event log meets the criteria established by SAP regulations in the ERP system and also guarantees that the input data is consistent with the information generated in the ERP system and proceeds to data cleaning which guarantees that the artifact does not suffer errors coming from a lack of consistent structure in the structure of the Event log and the quality of the data [
57].
4. Results
By taking the data related to the collection and billing processes, these data are imported into the DISCO program and the process map of the collection and billing process in the pharmaceutical sector of Colombia is obtained, through process mining which is observed below. continued in
Figure 8.
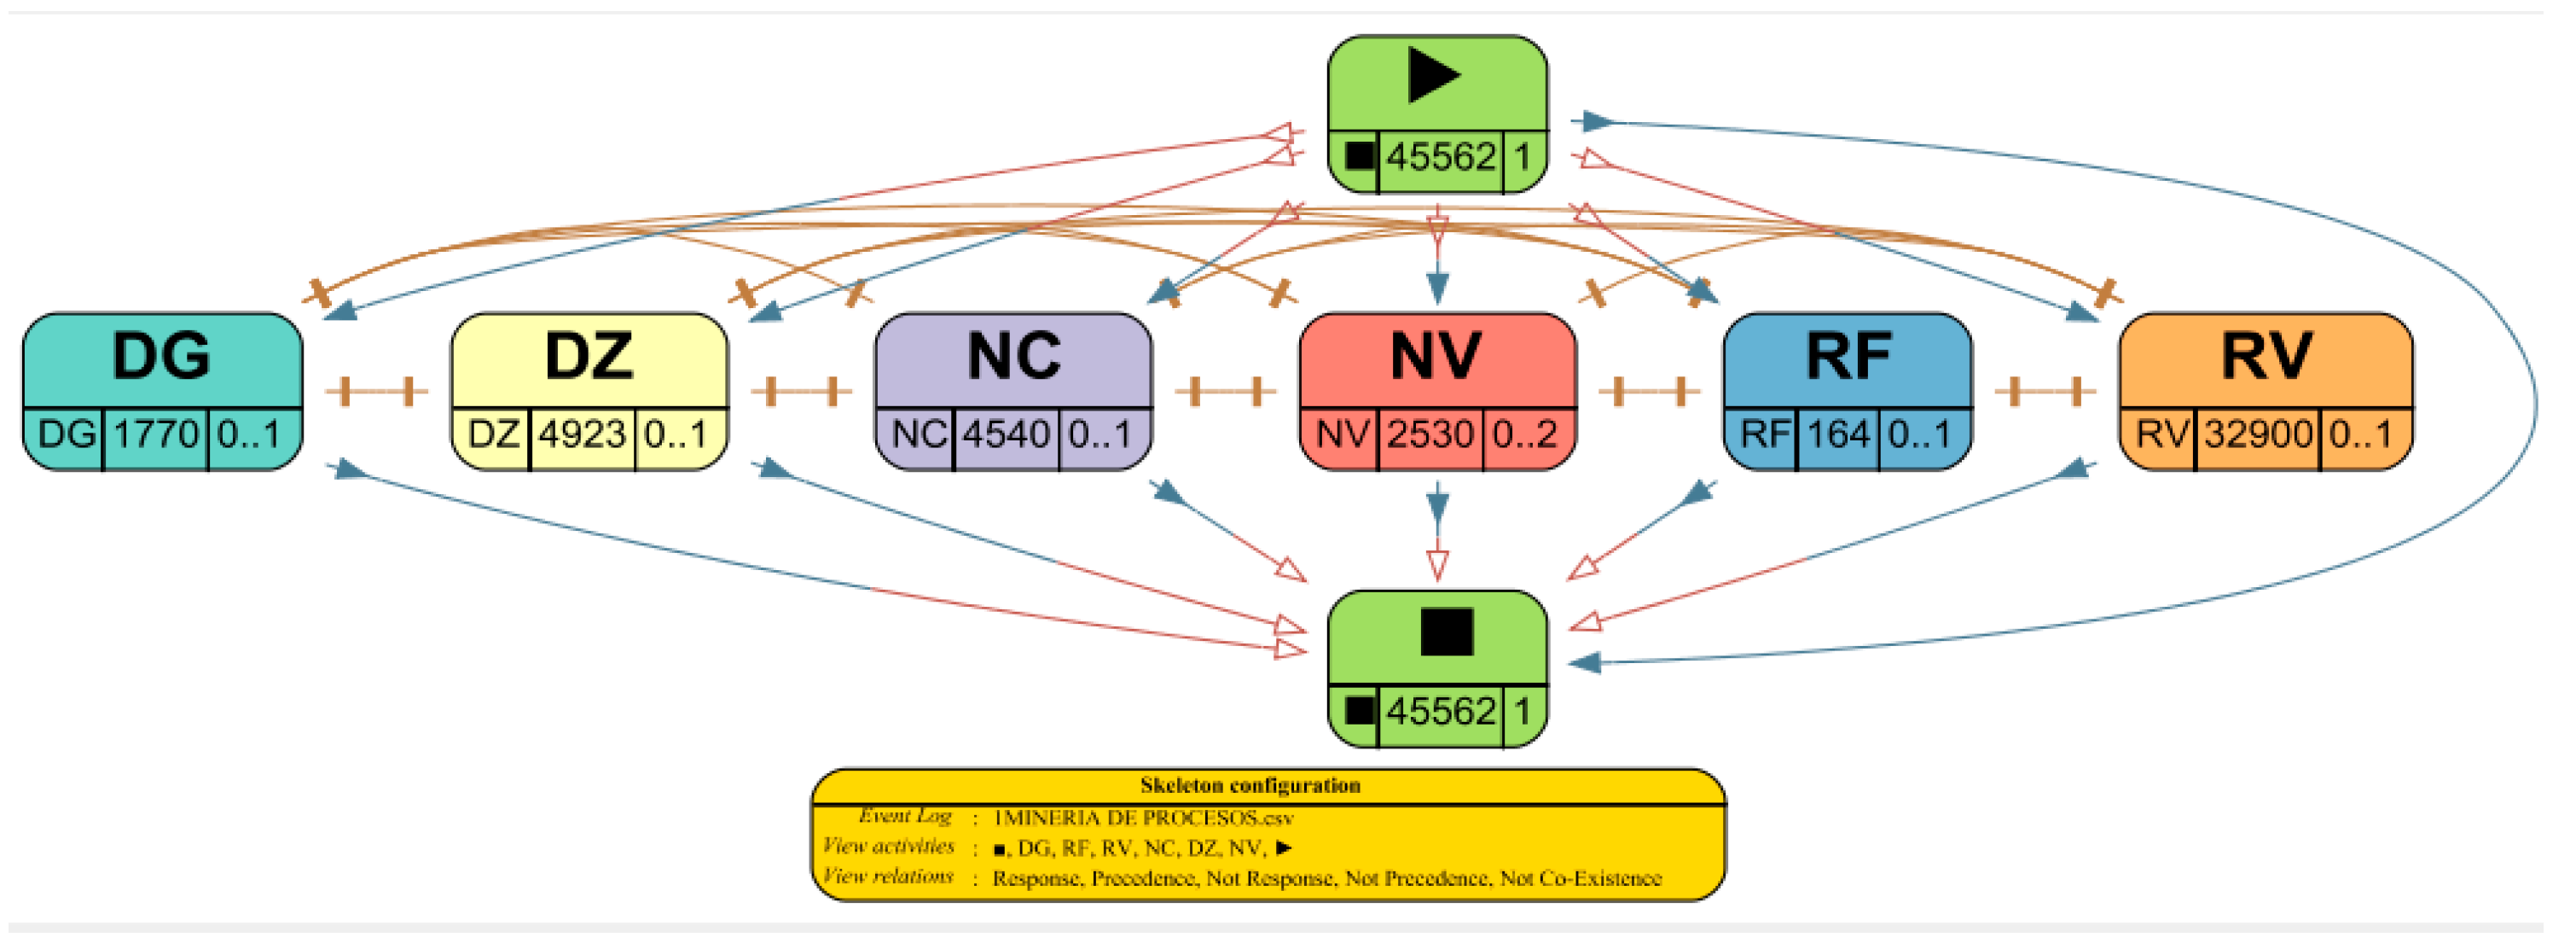
Figure 8 illustrates the map of collection and billing processes in the pharmaceutical sector of Colombia, which allows us to visualize the real flow of the collection and billing processes by taking into account the activities that are invoiced (RV), cancellations (RF), cash receipts (DZ – DG), value credit notes (NC) and inventory credit notes (NV). In addition, the absolute frequency of the activities is shown, the frequency of the RF was 164, the RV 32,900, the NV 2,530, the NC 4,540, the DZ 4,923, and the DG 1,770. When taking into account the absolute frequency, the 3 main processes in the case study, those that occur most frequently according to the process map are invoices (RV), credit value notes (NC), and cash receipts (DZ).
Likewise,
Figure 9 illustrates the fuzzy model which is used to analyze the activities of the collection and billing process under study.
The fuzzy model presented in
Figure 9 allows us to analyze in more detail the workflow and the behavior of the activities related to the collection and billing processes, these activities are cash receipts (DG - DZ), value credit notes (NC), credit notes for inventory (NV), cancellations (RF), and invoices (RV) which according to the edges it is evident that all are related to each other, in addition the activities that move to other events are observed, it is illustrated where loops and repetitions occur that are important to take into account since they can generate bottlenecks, in the case study, in the billing and collection process, the fuzzy model does not allow inefficiencies and bottlenecks to be clearly shown, but it does provide important information regarding the workflow and behavior of activities.
Next,
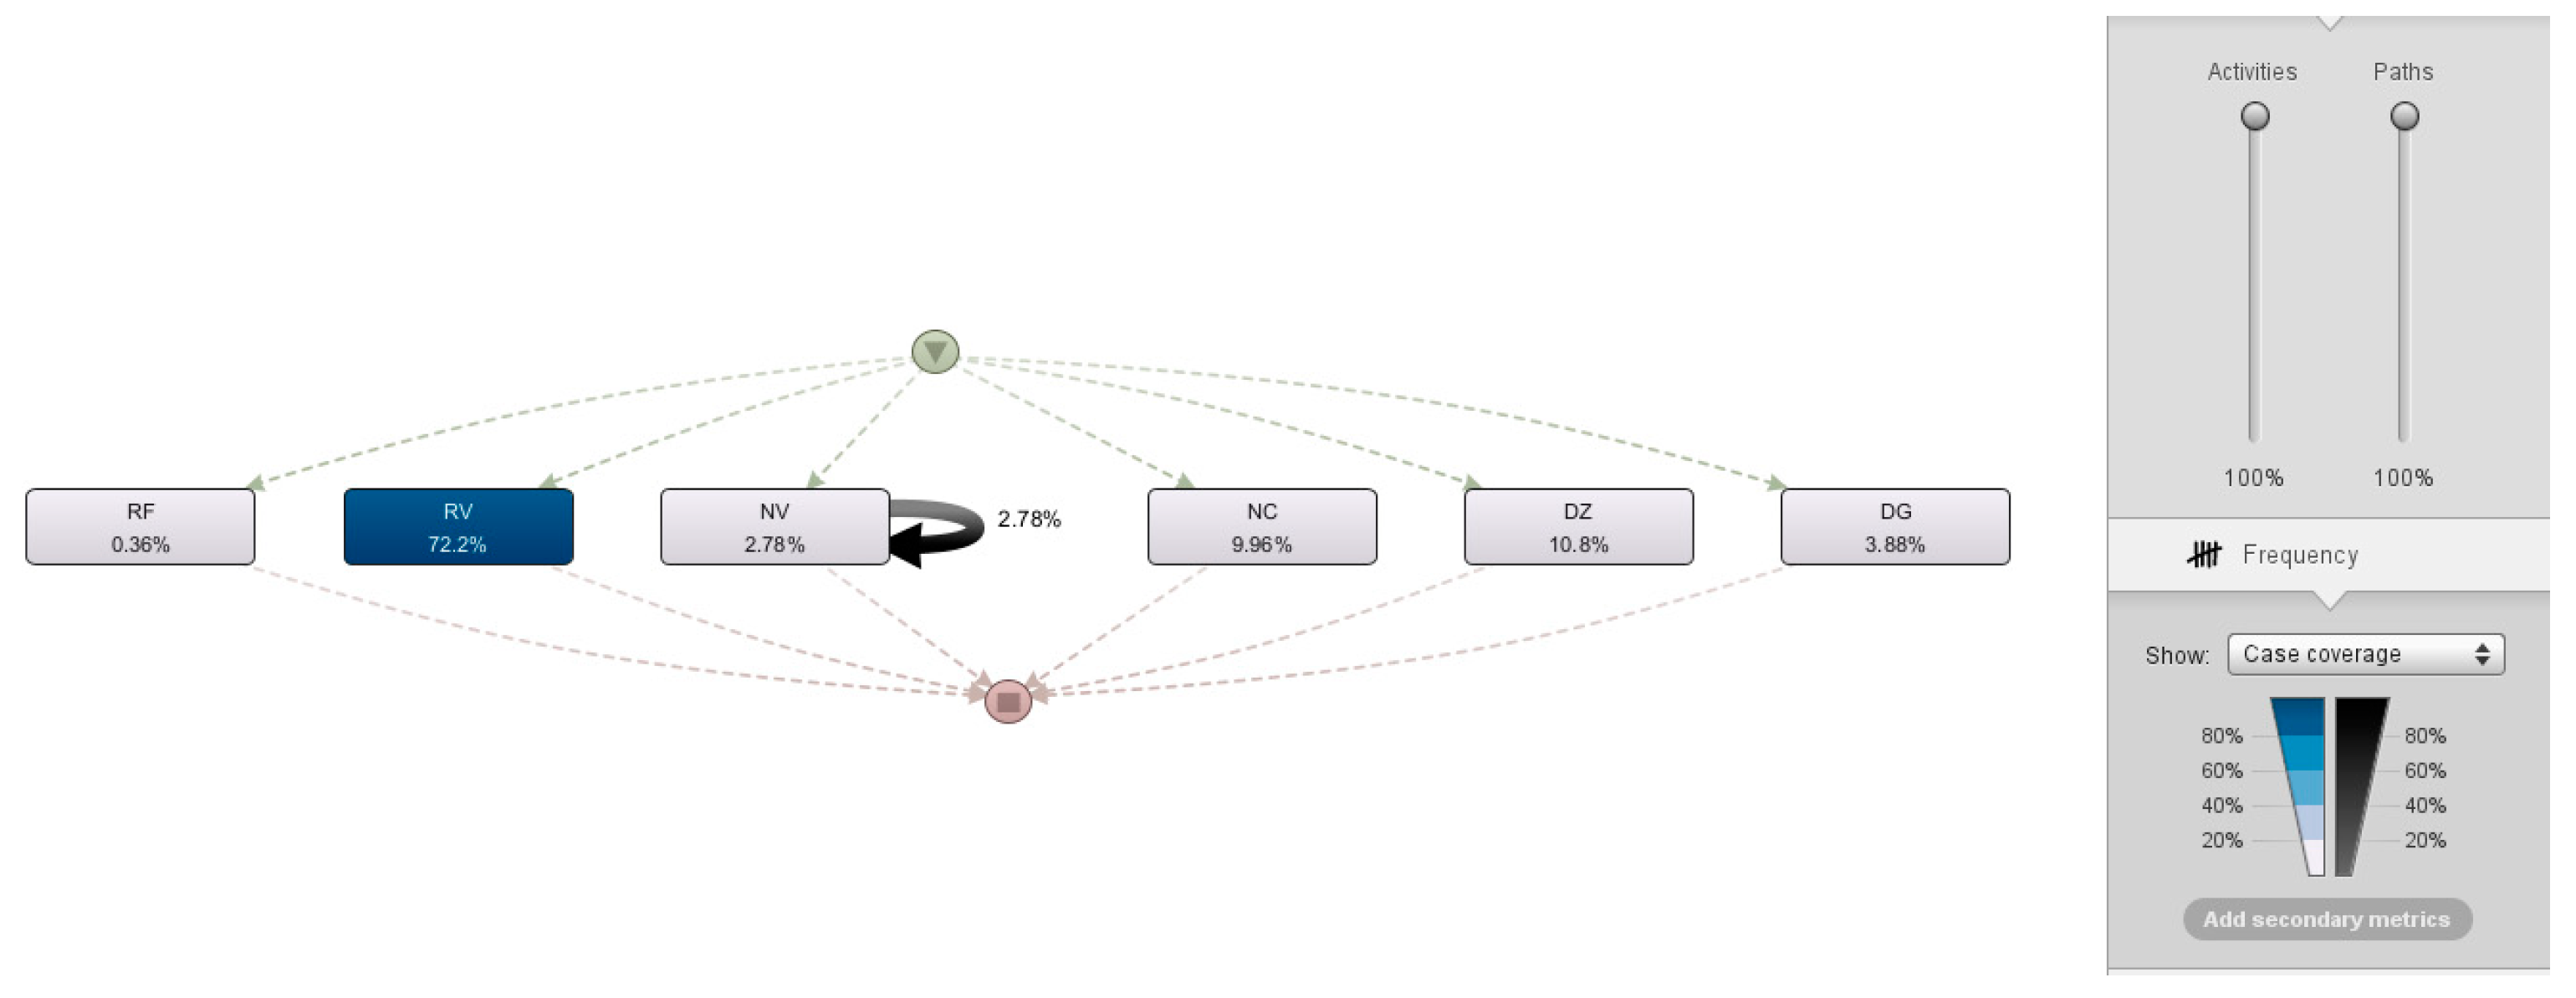
Figure 10 shows the frequency of the cases in the collection and billing processes of the case study.
The frequency of the cases illustrated in
Figure 10 shows the frequency for each activity of the collection and billing process, the frequency of the RF was 0.36% of the RV 72.2%, of the NV 2.78 %, of the NC 9.96%, of the DZ 10.8% and the DG 3.88%. The frequency of cases provides valuable information about the efficiency of the processes, understanding the general distribution of cases, and identifying behavioral patterns in the processes. In the case study, a greater frequency is reflected in the activities RV invoices of 72, 2%, followed by the DZ cash receipts of 10.8% and the NC value credit notes of 9.96%, likewise, the least frequent activities are RF cancellations of 0.36%, the NV credit notes for inventory of 2.78% and the DG cash receipts of 3.88%. When analyzing that the highest frequency of cases is reflected in the RV invoices of 72.2%, this indicates the efficiency and high performance of this activity concerning others since invoices constitute a crucial activity in the billing process, also When observing the high frequency in DZ cash receipts of 10.8% represents efficient management in the collection process, likewise, the lower frequency of RF cancellations of 0.36% and NV credit notes for inventory of 2.78% does not They reflect an inefficiency or a bottleneck in the billing process since having a lower number of cancellations and credit notes for inventory reflects the efficiency in the billing process and does not generate risks in the invoice process, which represents the main activity of process.
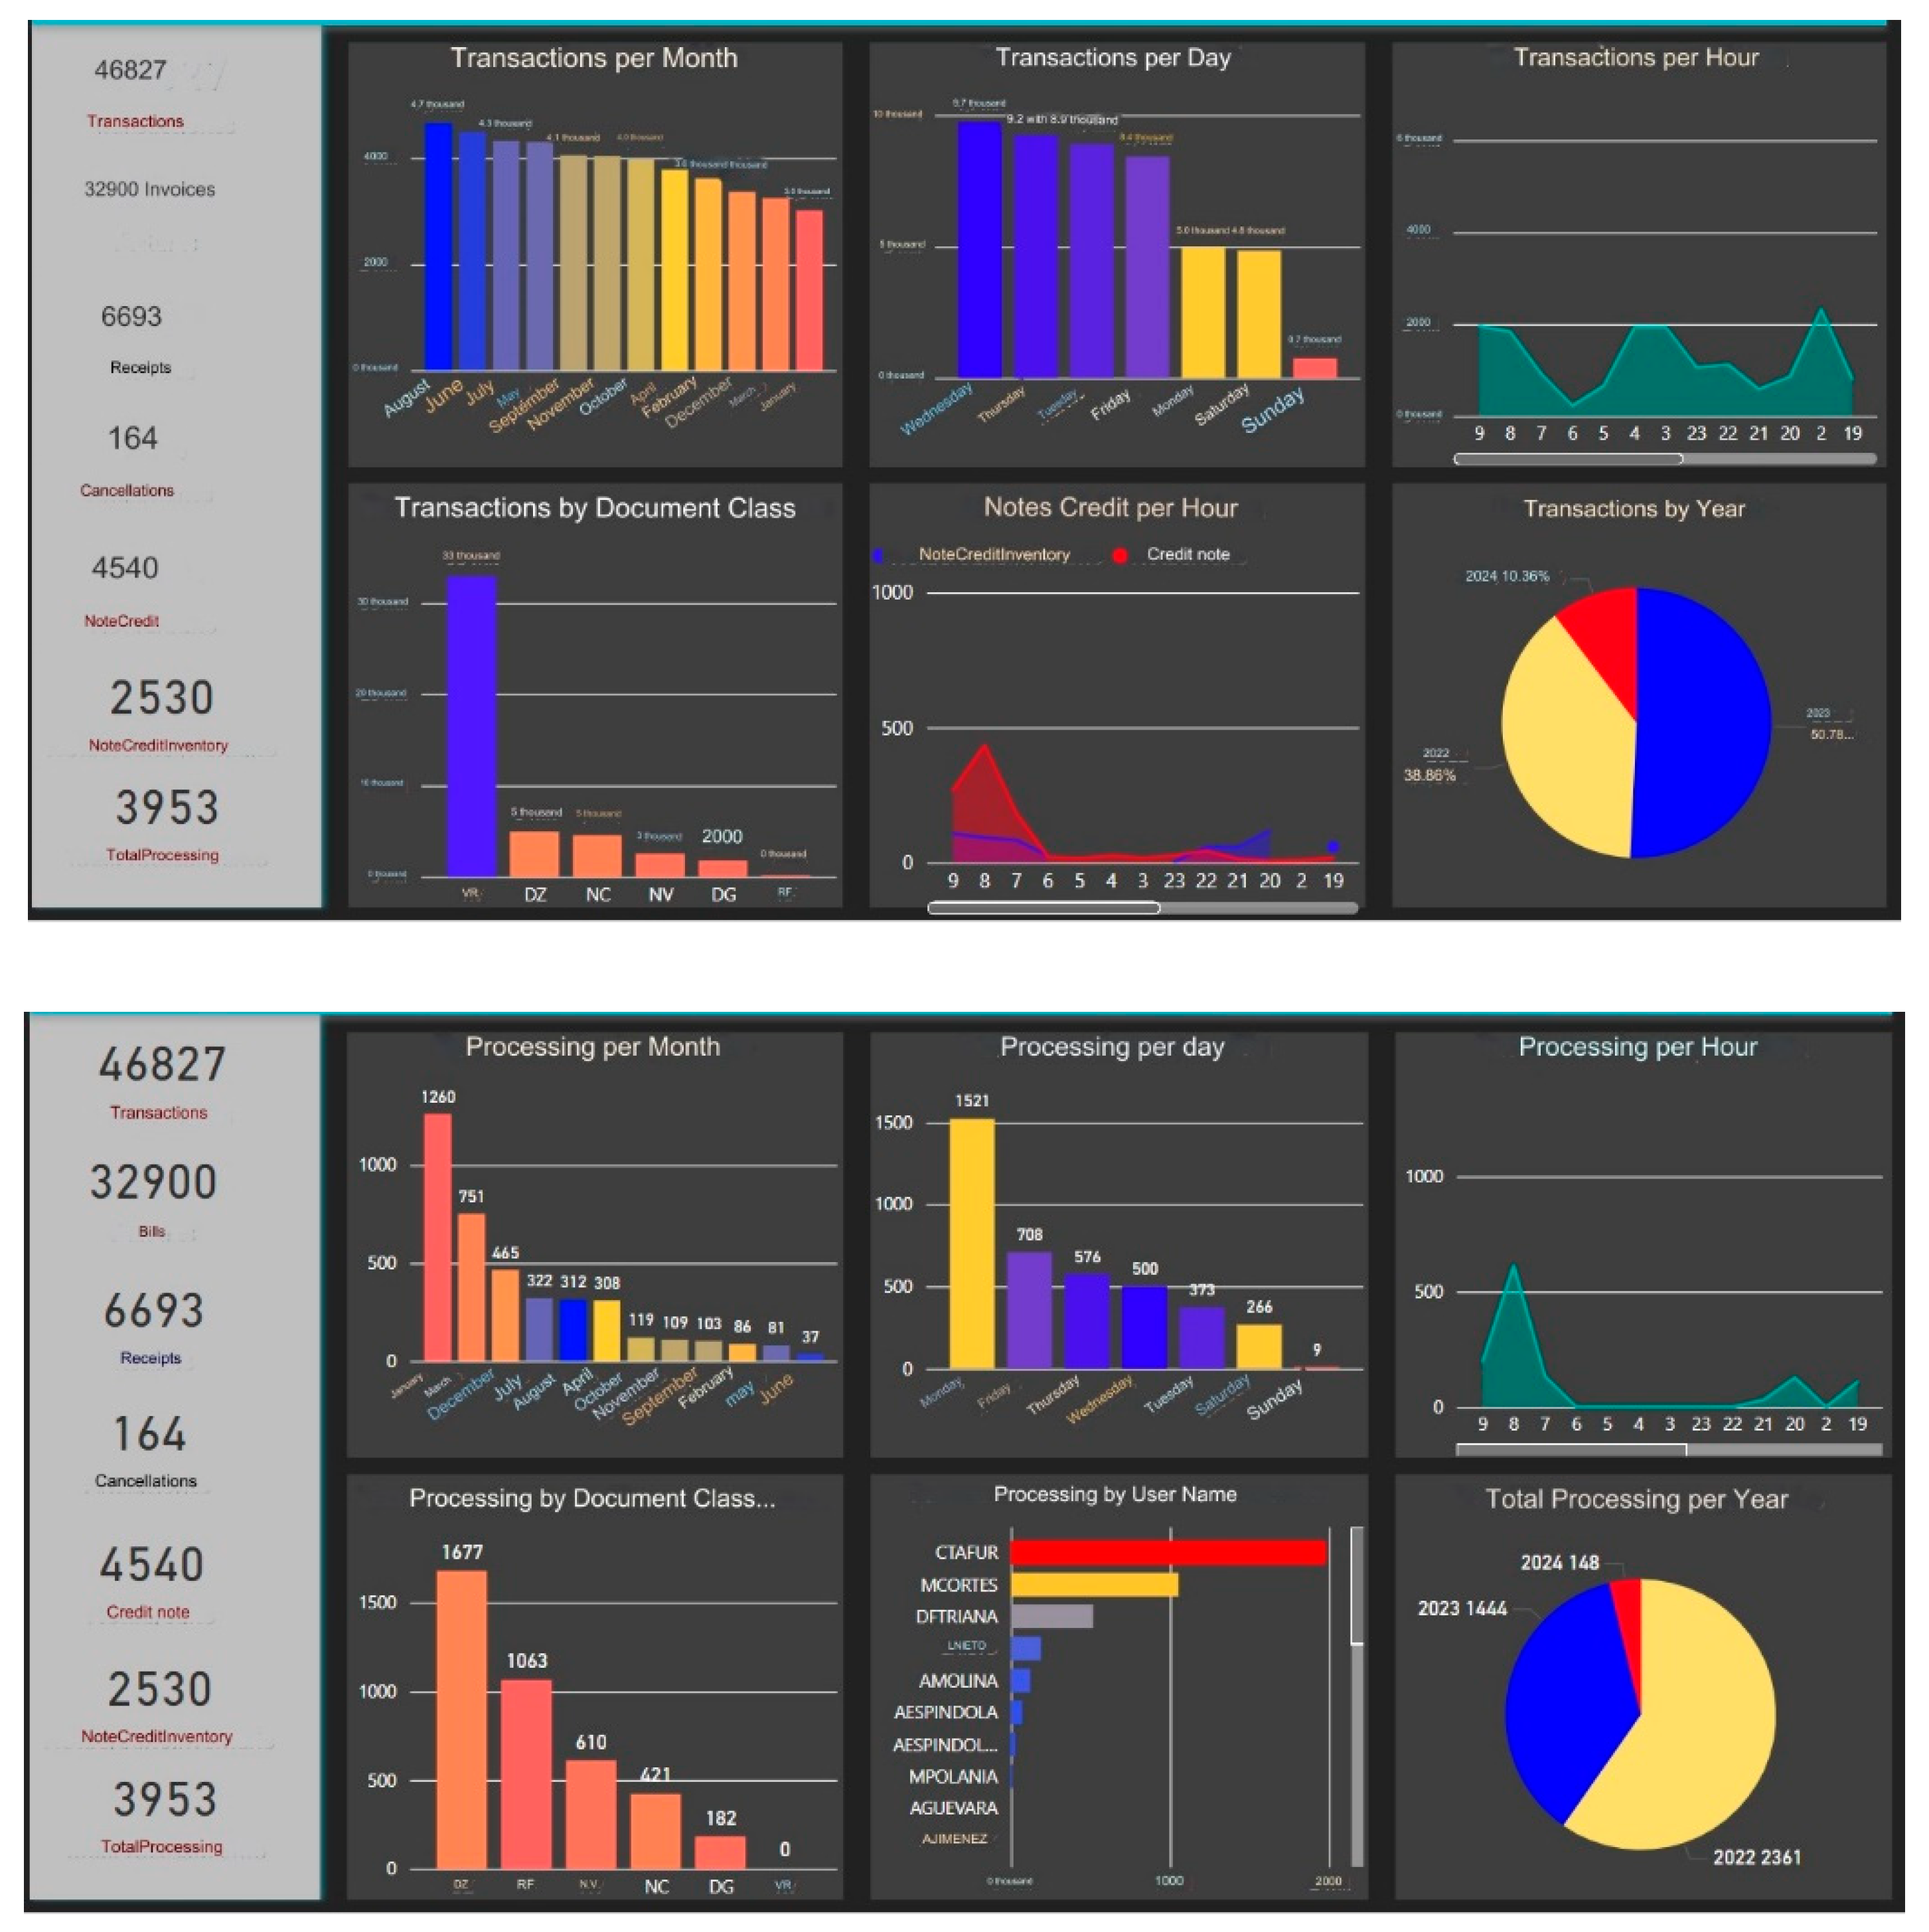
Figure 11 shows the business intelligence results developed in Oracle and deployed in Power BI.
Figure 11 shows the analysis of the results presented in the dashboard, showing several key aspects of transaction processing. In total, 46,827 transactions were recorded, broken down into 32,900 invoices, 6,693 receipts, 164 cancellations, 4,540 credit notes, and 2,530 inventory credit notes, which add up to a total of 3,953 processes.
The processing graph by month indicates that the period with the highest number of transactions is the month of January with 1,260, followed by December with 751, and November with 465. The periods with the least activity were the months of June and May, with 37 and 81 transactions respectively. In terms of days of the week, Friday stands out significantly with 1,521 transactions, while Sunday is the least active day, with only 9 transactions.
The analysis by type of document reveals that, in terms of the duration of the transactions, those of type DZ were the most frequent with 1,677, followed by RF with 1,063 and NV with 610. The least common were those of type RV, which did not record a longer duration in the transaction. The graph of processing times by username shows that the user CTAFUR, followed by MCORTES and DFTRIANA have the least frequency in transaction registration times.
In the processing time per hour graph, a significant peak in transactions is observed at 9 a.m., with sporadic activity at other times of the day. In the end, the graph of total processing by year indicates that 2022 had the highest number of transactions with 2,361, followed by 2023 with 1,444 and 2024 with 148 as of the date of the report. In summary, the results show clear patterns in the temporal and user distribution of transactions, highlighting certain months, days, and hours with greater activity, as well as specific users with a greater workload. This provides a solid foundation for making informed decisions about resource management and financial planning in the billing and collection process of the case study.
Figure 12 shows the dashboards related to billing and the number of receipts.
Figure 12 shows that the results reveal that January and Monday are the periods with the highest activity in terms of transaction processing and billing, while June, July, and weekends show a significant decrease. Peak hours of activity are concentrated in the morning and early afternoon, with a notable reduction during the evening. The distribution by user indicates that some users handle a considerable volume of transactions, suggesting different roles within the organization. In addition, certain types of documents are processed more frequently, with the DZ class being highlighted. Comparison between billing and receipts levels shows a significant disparity, with a greater concentration on billing. These consistent temporal patterns at both levels indicate opportunities for optimization in the transaction process and a better understanding of organizational activity patterns.
5. Discussion
The construction of the collection and billing process, a case study of the Colombian pharmaceutical sector, through process mining and business intelligence, presents unique challenges due to regulatory complexity and the need for precision in the management of large volumes of data. Process mining emerges as a crucial tool in this context, allowing the analysis and improvement of workflows by discovering patterns and bottlenecks in administrative activities. With the application of process mining techniques, inefficiencies in billing and collection management can be identified, with optimization in the revenue cycle and improvements in the transparency and traceability of the process. This approach not only facilitates compliance with strict regulations but also improves customer satisfaction and company profitability by ensuring more agile and precise processes.
In the specific case of the Colombian pharmaceutical sector, where the integration of technology and regulatory compliance is essential, process mining is positioned as an innovative strategy for collection and billing management in pharmaceutical sector industries.
In this section, the discussion of the construction of the collection and billing process in the pharmaceutical sector of Colombia is addressed, using the statistics and graphs obtained in the DISCO program. The different results shown by the DISCO and ProM images are analyzed.
Below,
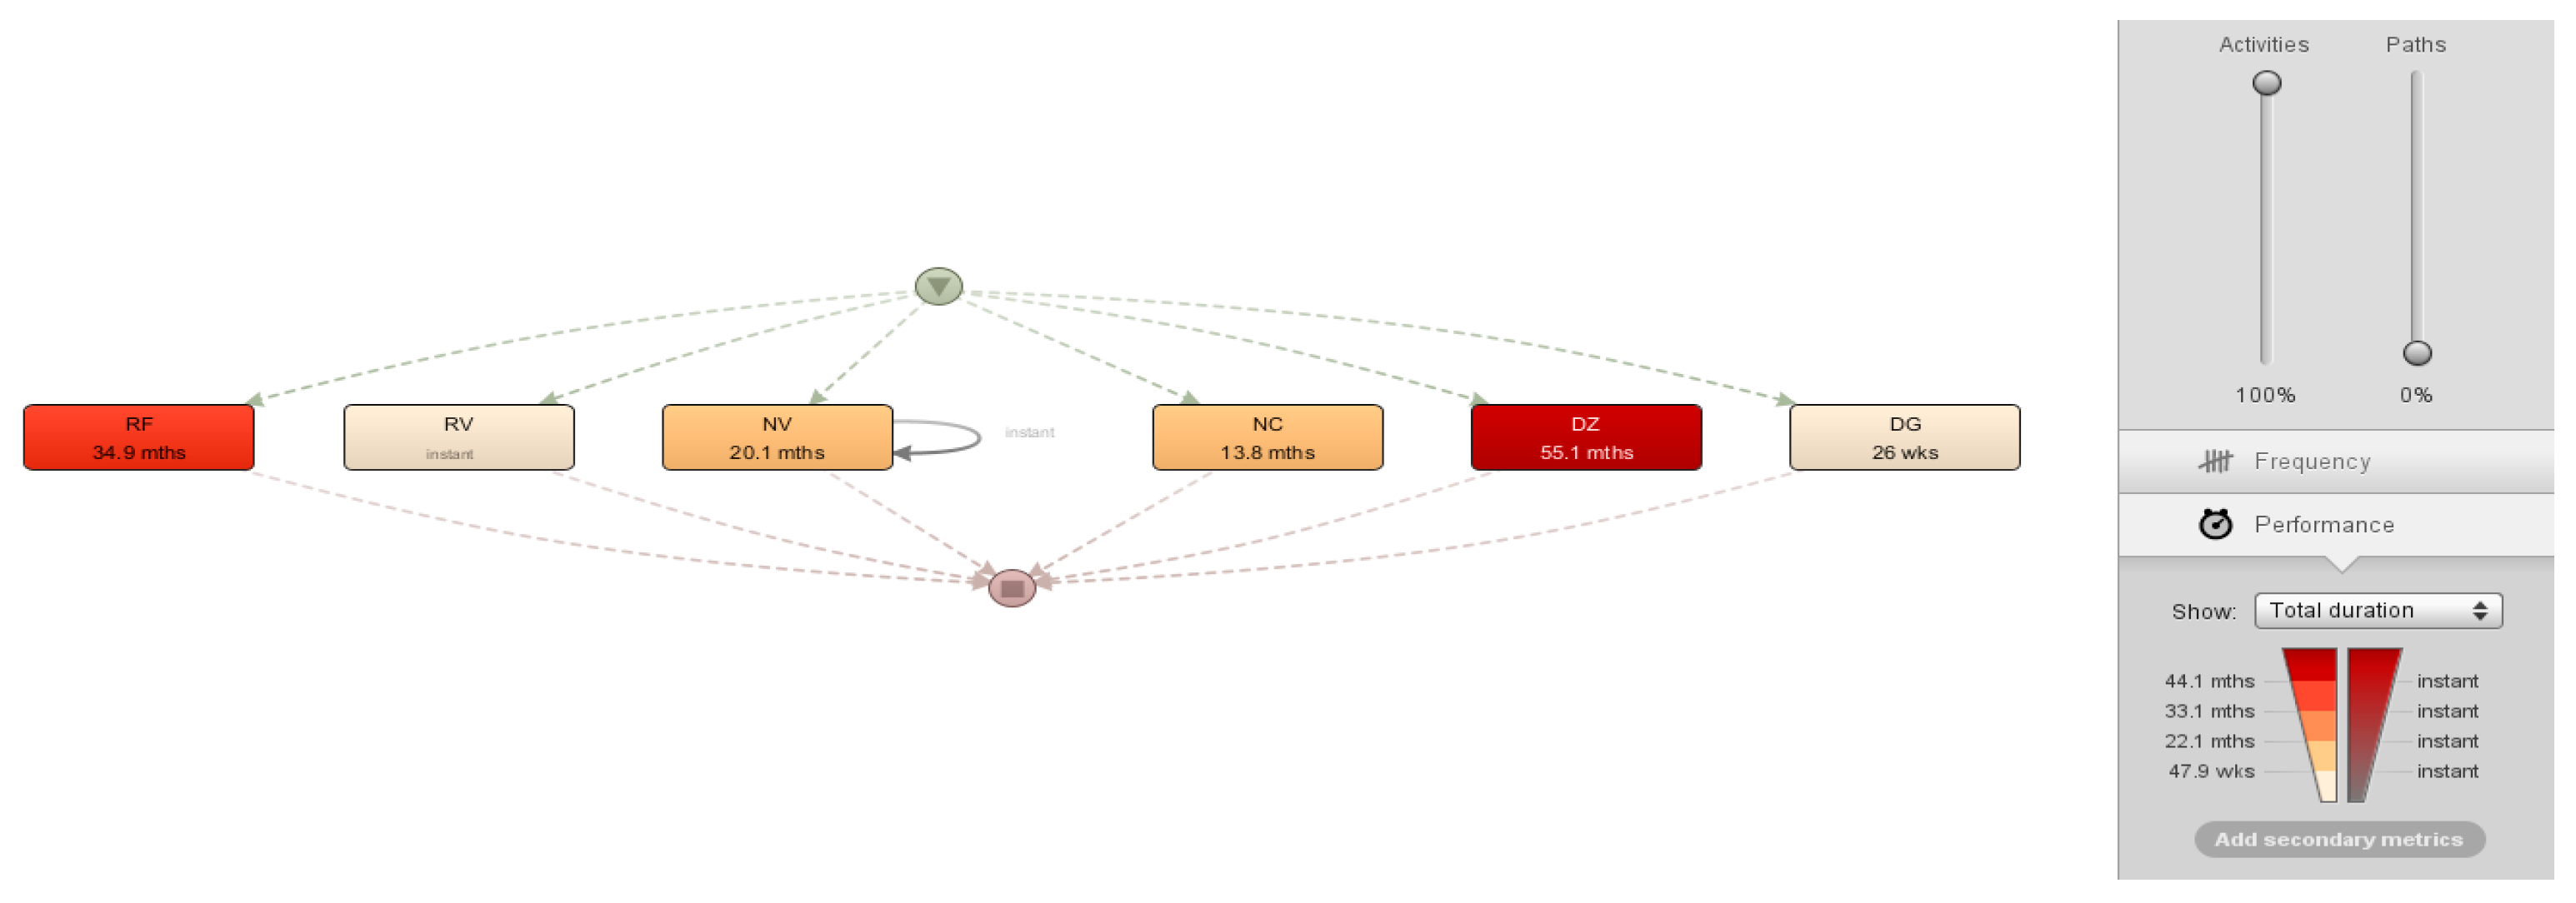
Figure 13 shows the total duration of the activities related to the collection and billing process.
The total duration of the activities illustrated in
Figure 13 indicates the duration of each activity, for the RF the duration is 34.9 minutes, for the RV the duration is instantaneous, for the NV the duration is 20.1 minutes, for the NC 13.8 minutes, the DZ 55.1 minutes and DG 26. The total duration of the activities allows identifying the duration of the activities and reflects a higher duration in the DZ of 55.1 minutes, in the RF of 34.9 minutes, and NV of 20.1 minutes, which reflects an inefficiency in these 3 activities that directly affects the collection and billing process, which generates a bottleneck in the organization. Likewise, activities with a shorter total duration such as RV which is instantaneous and DG 26 times reflect the efficiency and behavior in these activities.
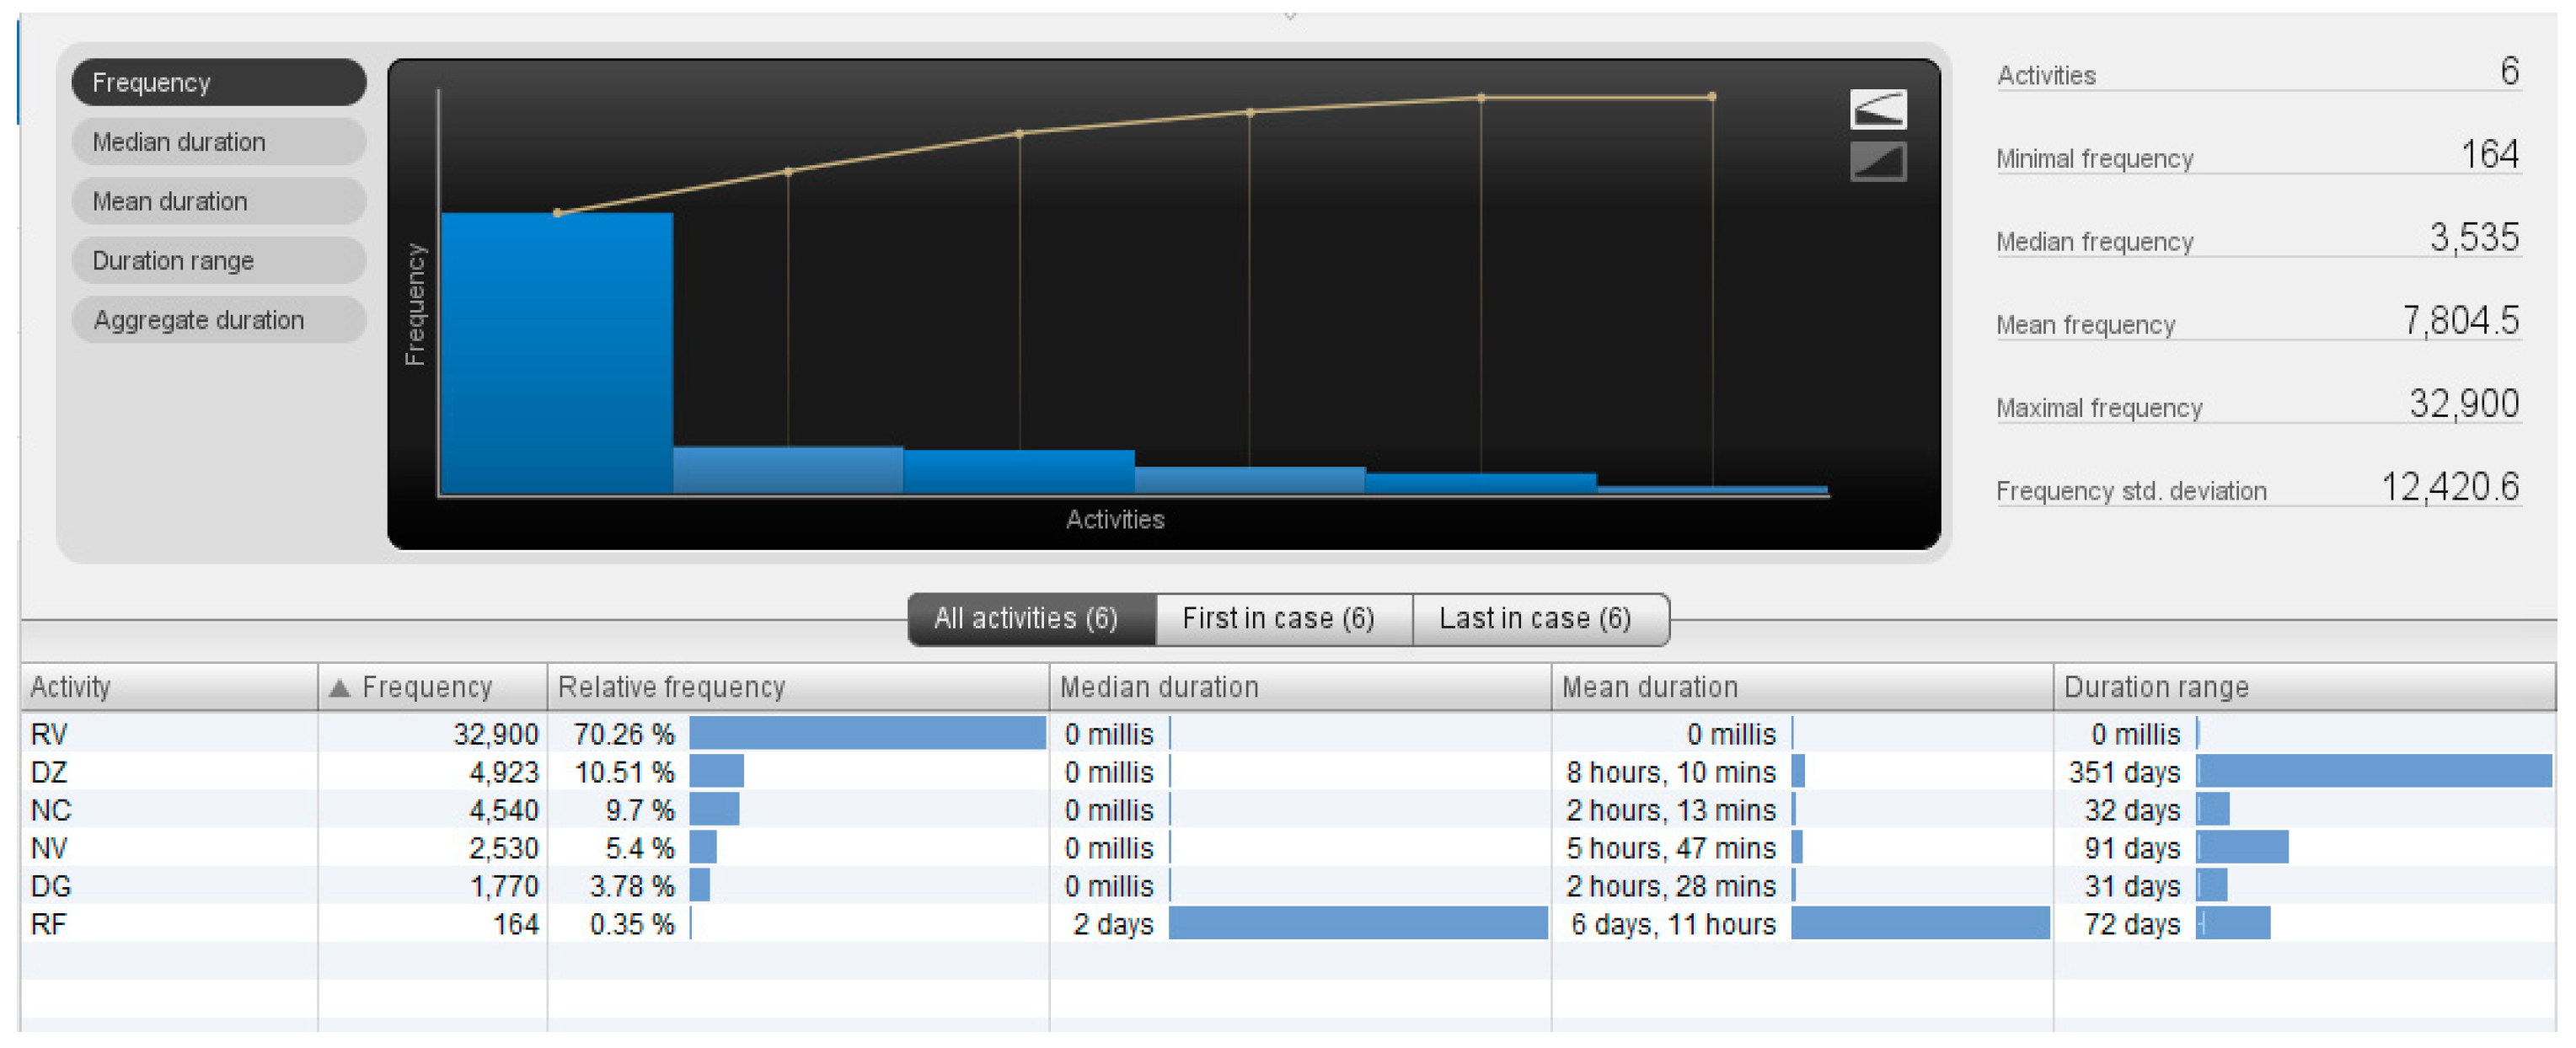
Figure 14 shows the frequency of the activities of the billing and collection processes.
Figure 14 allows us to observe the frequency of the activities of the billing and collection processes, which reflects a higher frequency in the RVs of 70.26%, which are the invoices and the central axis of the analyzed processes, and likewise the frequency of the DZ and DG, which are the cash receipts with a 12.28% share of records respectively. The apparent discrepancy between the high percentage of invoice records and the lower proportion of cash receipts may be due to payment consolidation as customers pay multiple invoices at once, with individual records being grouped into a single payment. The difference in percentages does not indicate an error. It reflects the nature of the payment process, where customers consolidate payments and cash receipts record the overall transaction, not each invoice.
The relative frequency column shows the percentage of times that each activity has been carried out about the total number of activities. RV activity is the one with the highest relative frequency, with 70.26%.
In the median duration of each activity, the column shows the RV activity, which has the shortest average duration, with 0 milliseconds, while the RF activity has the longest average duration, with 6 days and 11 hours, RF corresponds to the cancellation of invoices, which is about avoiding errors in accounting facts due to the implications that this entails in the operation.
Frequency Standard Deviation: This column shows the standard deviation of the frequency of each activity. RV activity has the highest frequency standard deviation, at 12,420.6, while RF activity has the lowest frequency, at 164.
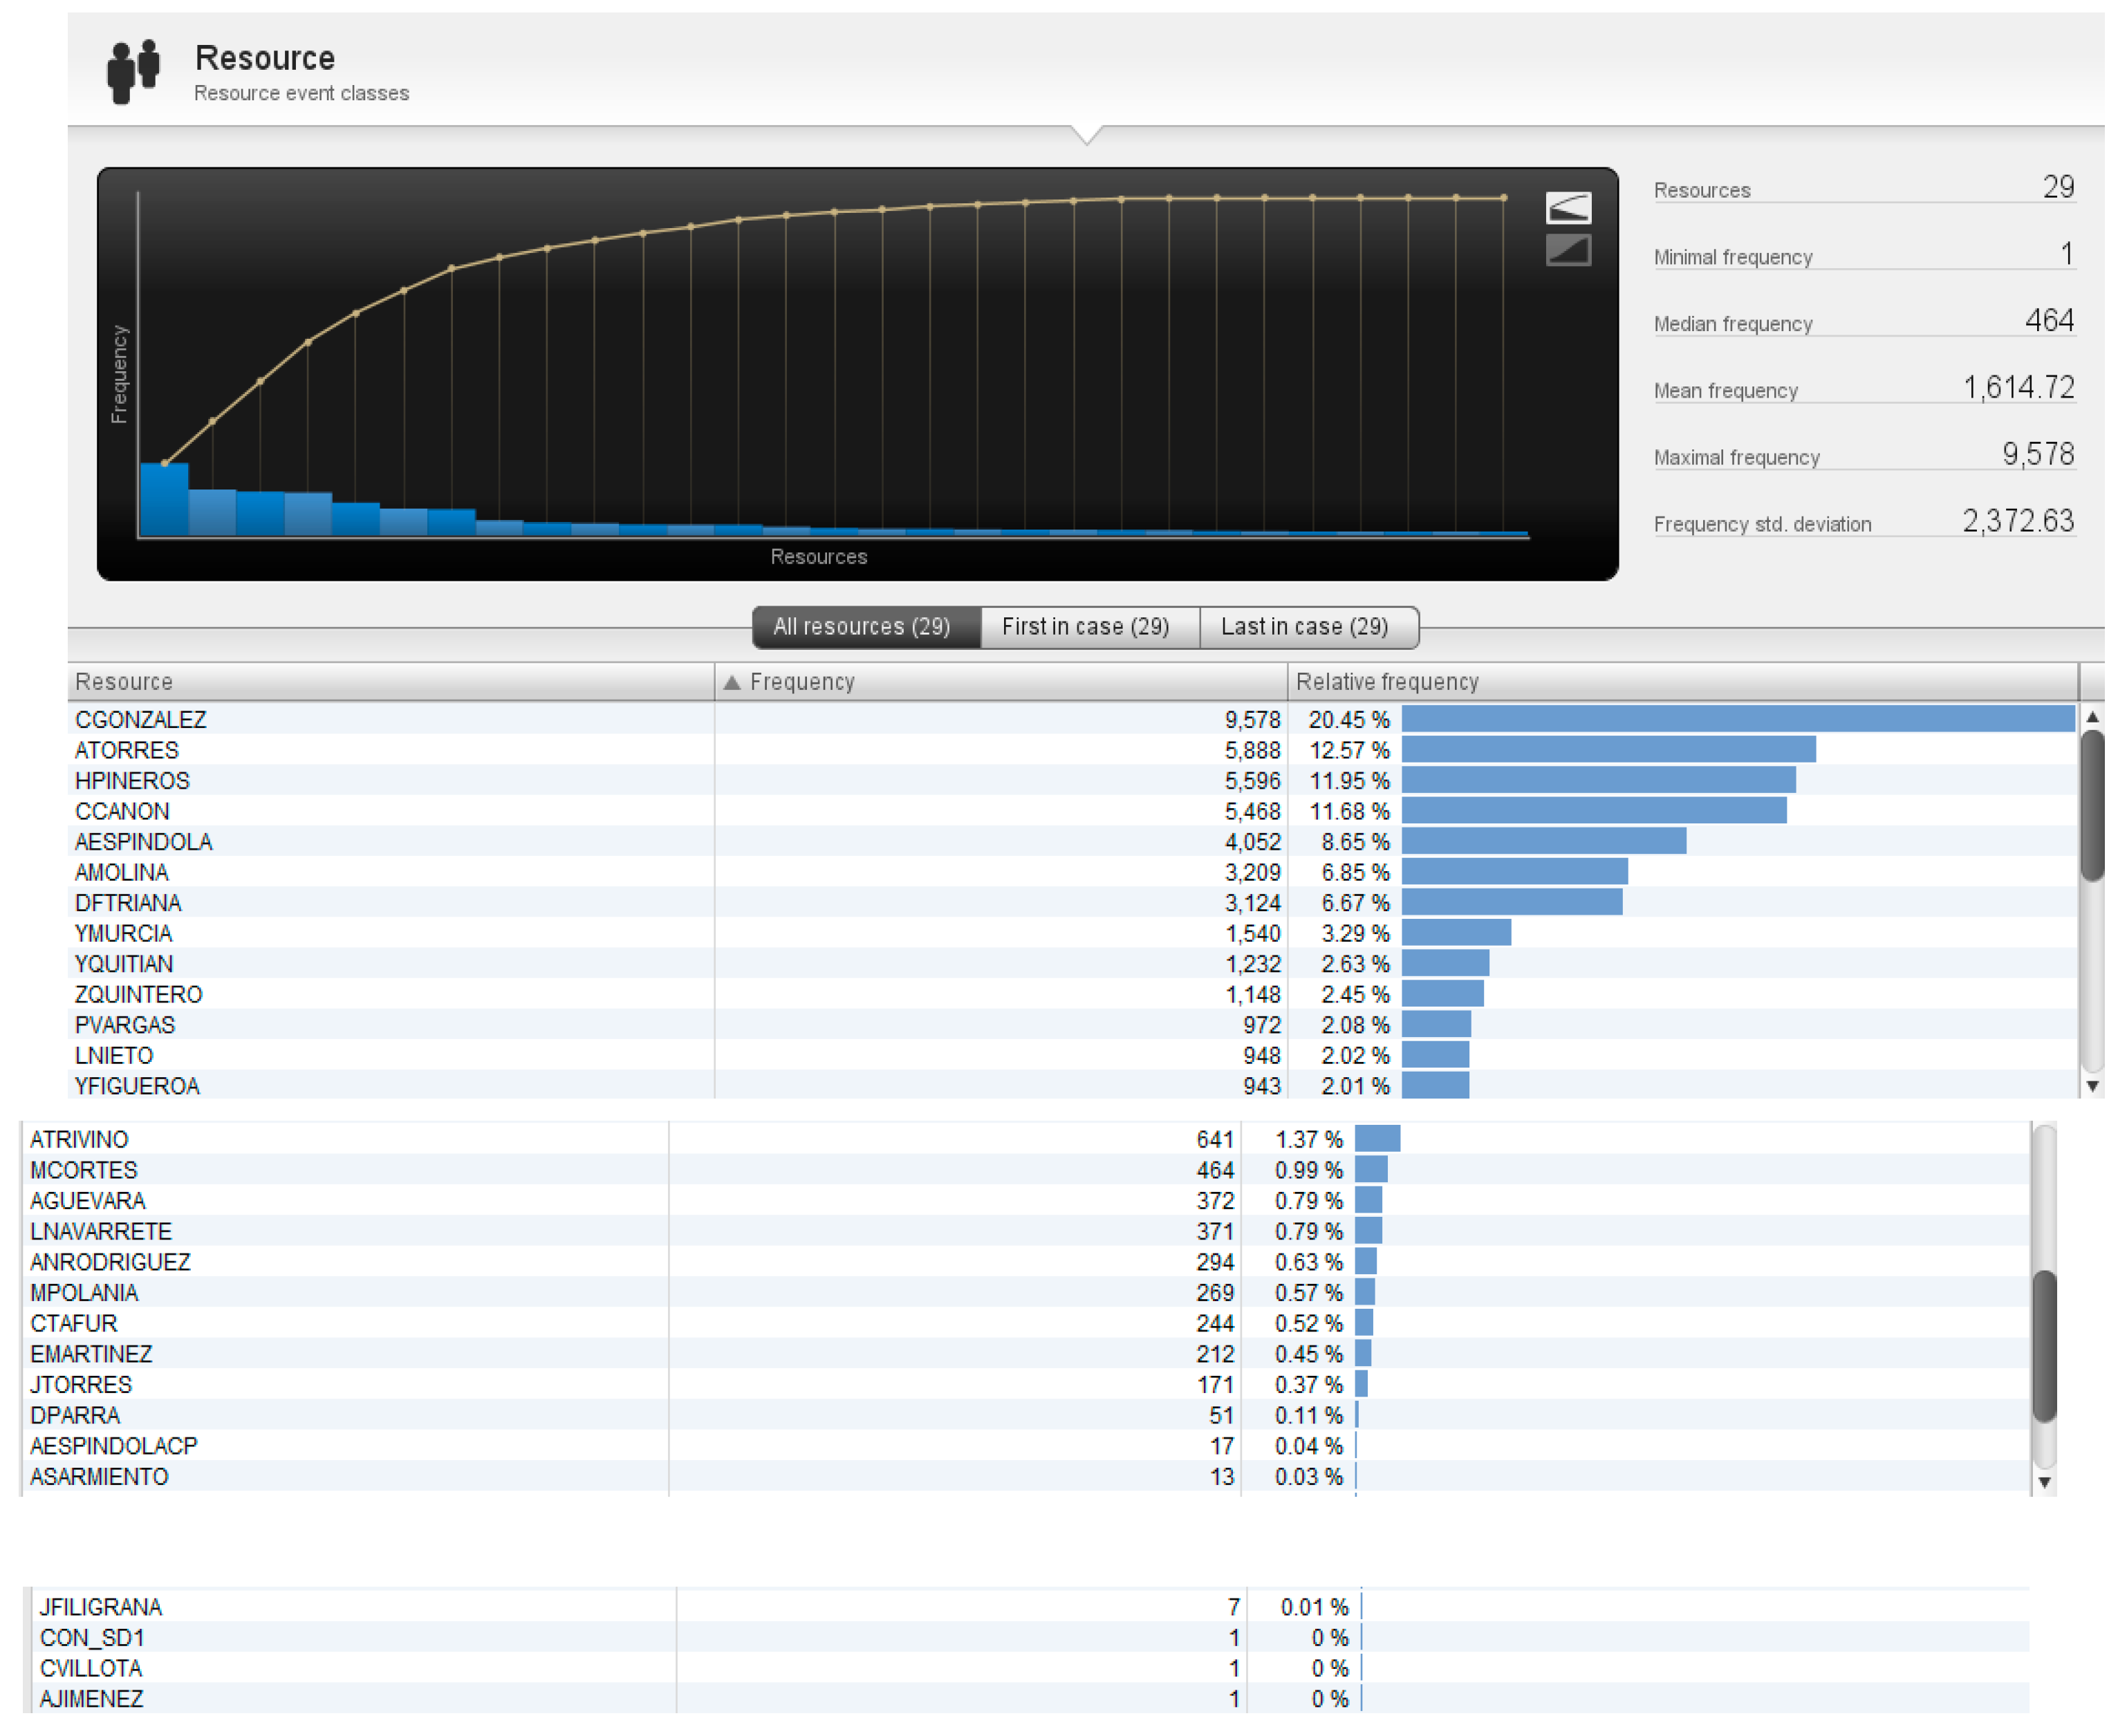
It is also important to analyze the statistics by users which are illustrated below in
Figure 15.
The statistics by users are illustrated in
Figure 15, which shows a dashboard that contains statistics on the use of resources by users. The image shows that the user CGONZALEZ has appeared in the greatest number of events, with a frequency of 9,578 times. This represents 20.45% of the total frequency of all resources. The following most frequent users are ATORRES, HPINEROS, CCANON and AESPINDOLA, likewise, the resources CGONZALEZ, ATORRES, HPINEROS, CCANON, and AESPINDOLA are the ones that have been used the most by users.
Likewise, users with lower percentages correspond to users who were linked to the organization for a short time. It is important to mention that a bottleneck is observed in the statistics by users, in the CGONZALEZ user of 20.45% concerning the frequency of the other users of the organization, this information is key to identifying the users who intervene in the process and be able to track the responsibility of users in the process.
The resource event class table shows that the minimum frequency of a resource appearing in an event is 1 time. The median frequency is 464 times, the average frequency is 1,614.72 times, and the maximum frequency is 9,578 times. The frequency standard deviation is 2,372.63.
6. Conclusions and Future Works
The results obtained in this research work through the different process mining tools allow us to identify the inefficiencies in the billing and collection processes that can be generated in the activities related to the billing and collection processes.
The construction of the collection and billing process, a case study of the pharmaceutical sector in Colombia, through process mining and business intelligence based on its application and results, allows a real description of the billing and collection processes and the activities involved. in these processes and identify their inefficiencies.
An artifact related to the method for constructing the real collection and billing process in the pharmaceutical sector industries in Colombia is obtained, which allowed it to be valid in a case study. The contribution of this research focuses on developing a new approach to build models of billing and collection processes supported by process mining, which leads to filling the gap in modeling these accounting processes in organizations from an alternative methodology and technique to the flow charts pre-established by biases and regulations.
Validation in design science is a process that ensures the quality, effectiveness, and relevance of the artifacts, these artifacts for the case study are what is the appropriate methodology and how to validate the methodology for the construction of the collection and billing process in a case study of the pharmaceutical sector in Colombia, through process mining and business intelligence, this validation is carried out with validation by measurement criteria, taking into account the structure of the Event log and compliance with SAP regulations in the systems ERP and the consistency of the input data with the information generated by the ERP which guarantees the consistency of the Event log and the quality of the data. Likewise, it is important to evaluate the results of knowledge, the effectiveness, the usefulness of the artifacts produced in the research, the validity of the quality of scientific research, and the reliability of the research results, which constitutes an integral aspect of design science research.
Process mining constitutes an important tool for organizations since it allows for discovering the real execution model of the processes, determining compliance in the processes by established guidelines, discovering existing bottlenecks, monitoring the productivity of the personnel who execute the different processes, predicting execution times in the processes and determine the relationship between different variables related to the processes.
From the point of view of business intelligence, it complements the results of process mining as a prelude to considering the design of the process, the modeling of processing and billing data reveals significant temporal patterns in the transactional activity of the organization. January and Mondays stand out as the busiest periods, while June, July, and weekends see a notable decline in transaction volume. Peak hours are concentrated in the morning and early afternoon, with a reduction during the evening. Furthermore, the disparity in the distribution of work between users and document types suggests potential areas for load redistribution and process optimization. The comparison between billing and receipts levels highlights a greater concentration on billing, indicating a possible differential focus on operational priorities. These findings provide a solid basis for the implementation of optimization and improvement strategies in process management within the organization, which thus improves efficiency and effectiveness in daily operations.
The limitation of this research is related to the application of a single case study for collection and billing processes in organizations in the pharmaceutical sector in Colombia, for which future work must carry out more case studies in the pharmaceutical sector and compare with cross-sectional studies with countries in the same region to evaluate the modeling of the billing process and real collection with references to particularities of culture and regulations, which allows complementing the process modeling approach by process mining.
It should be noted that the application of process mining requires information available in organizations, for which the existence of ERP information systems that function as data repositories that can be extracted by the methodology proposed in this article is needed, which implies that for the size of the Colombian context, the processes that can be modeled by process mining are in medium and large-sized organizations.
It is also important to highlight that in many cases the time in which the data is recorded in the information systems does not correspond to the actual execution time of the processes, which decreases the reliability of the data and information available.
For future lines of research, the design of all the processes developed in an organization can be carried out and other process mining tools or algorithms can be used. Carry out studies on the integration of process mining in organizations as a management and optimization tool for processes and activities, as well as allowing for the redesign of processes and implementation of required changes. This research is part of the accounting theory research line of the Universidad de Manizales.

