Submitted:
09 August 2024
Posted:
12 August 2024
You are already at the latest version
Abstract
Keywords:
1. Introduction
2. Results
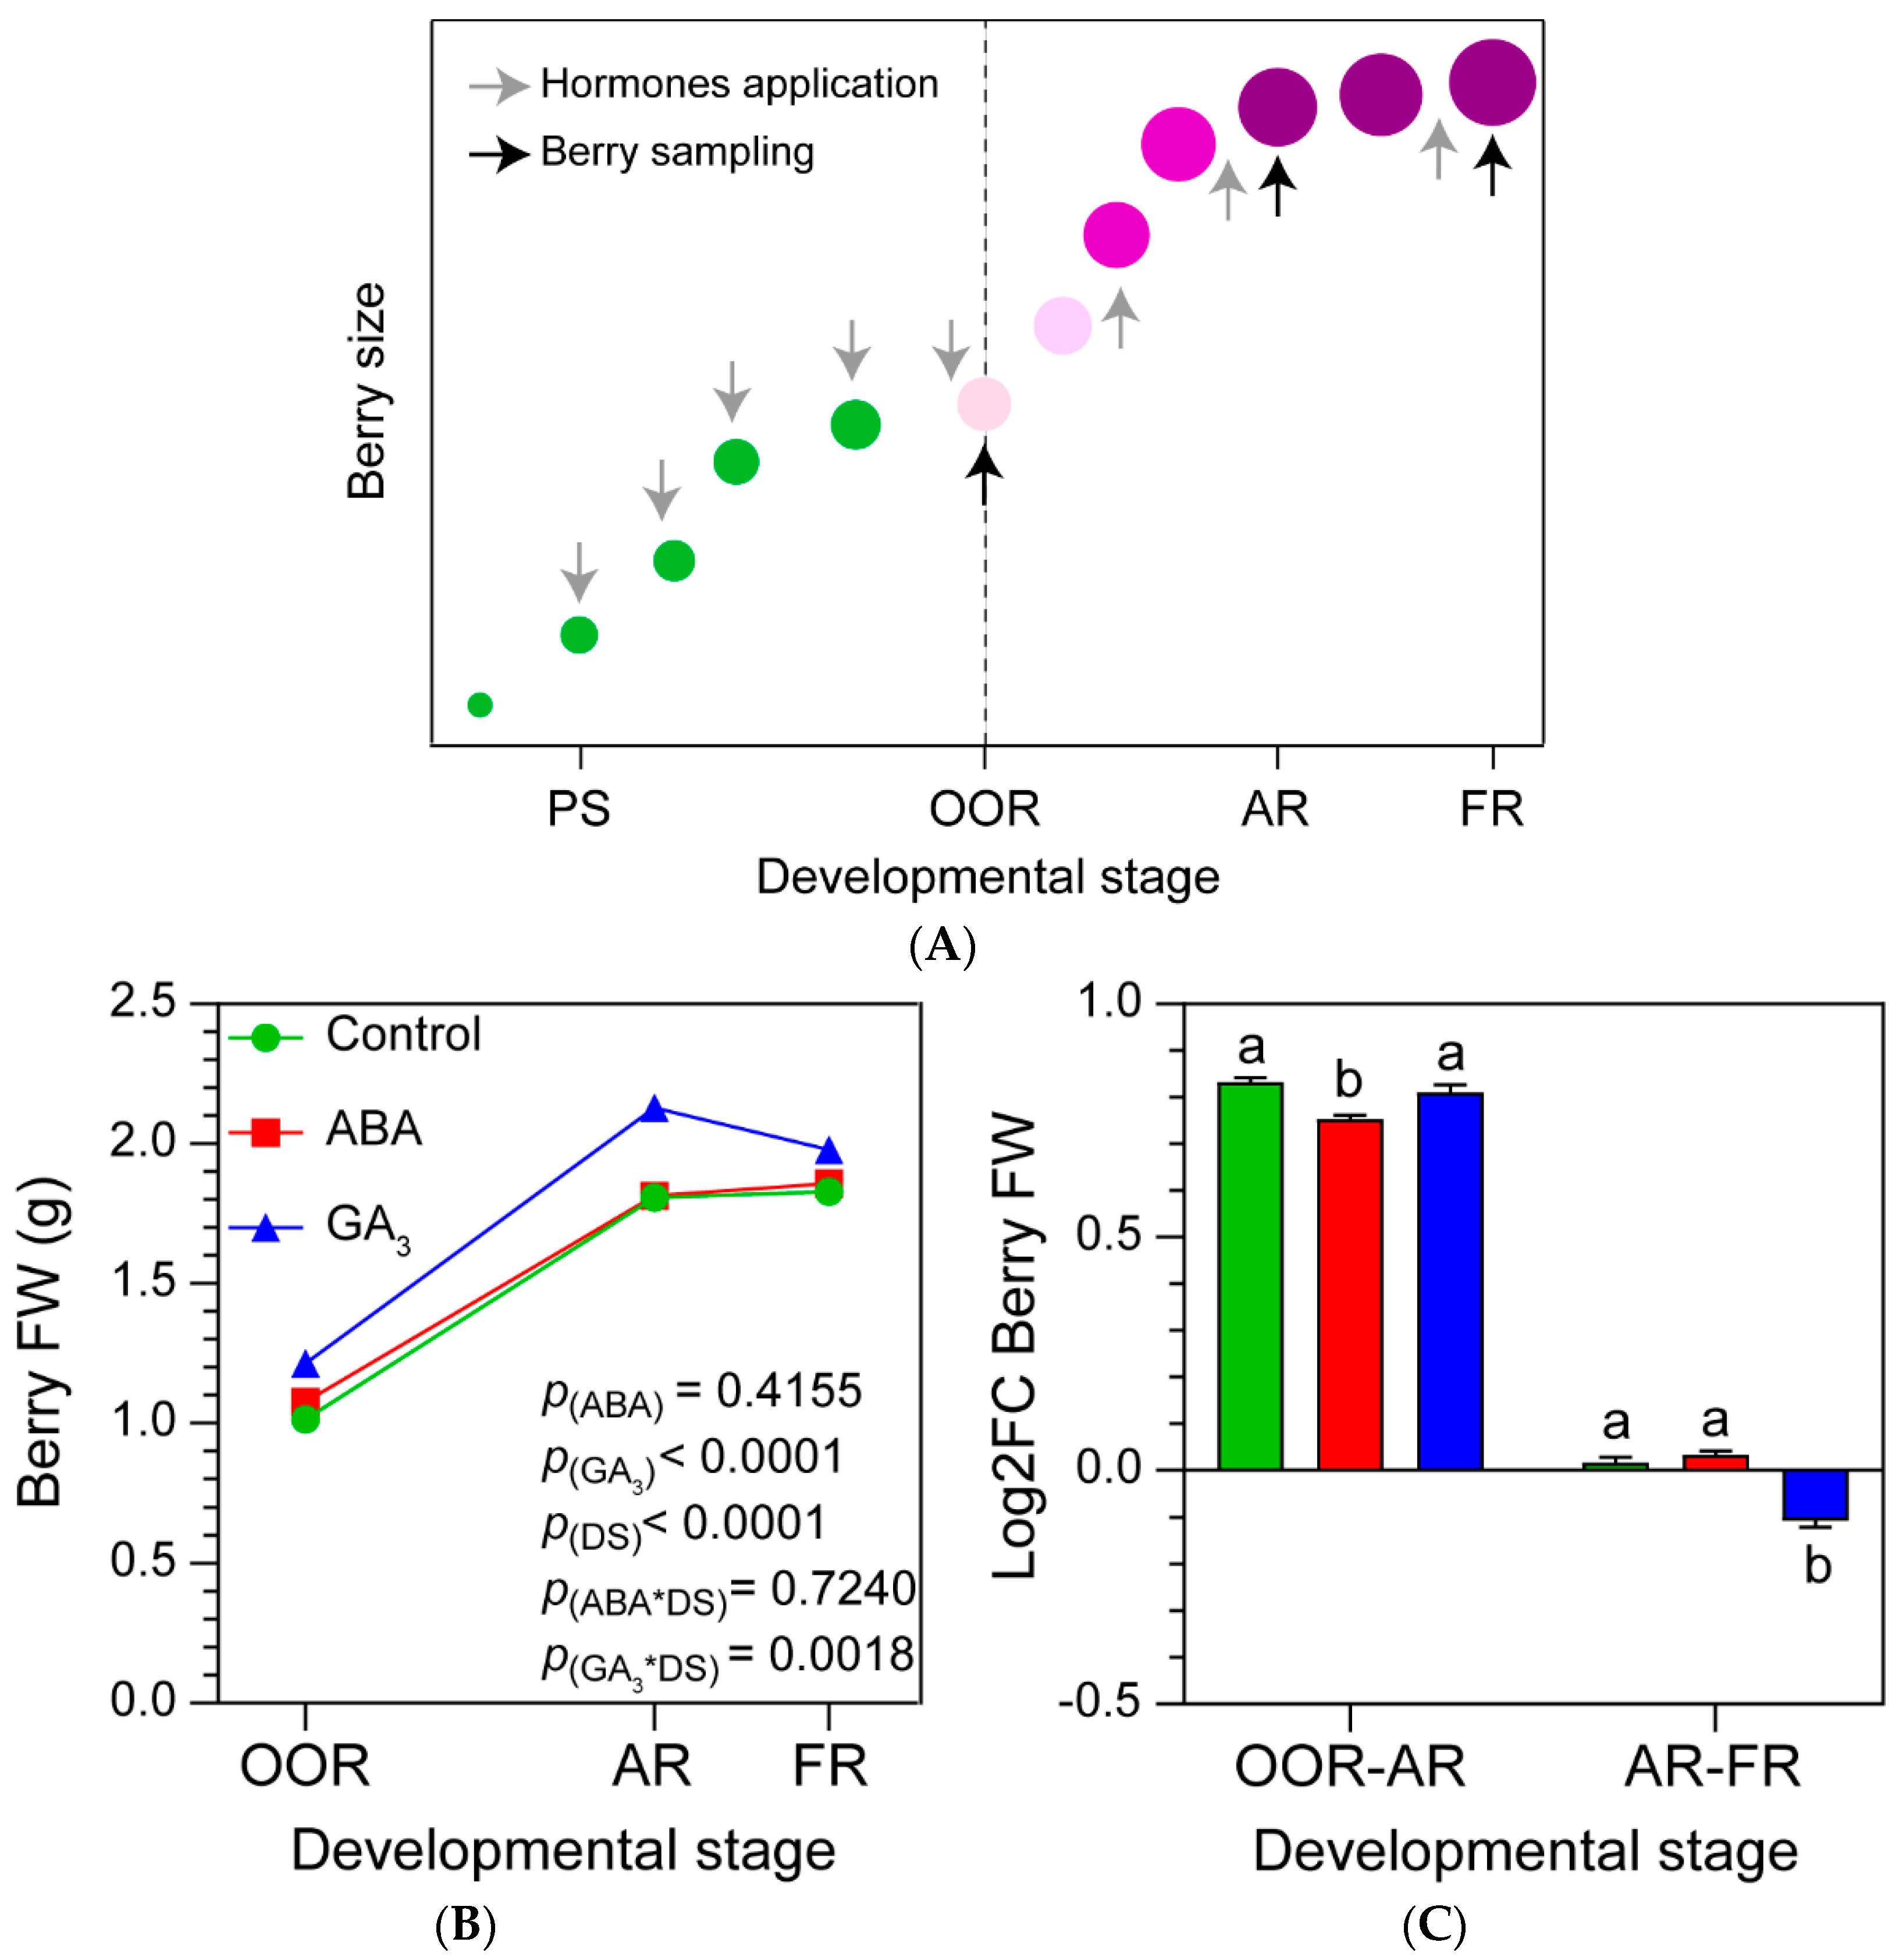
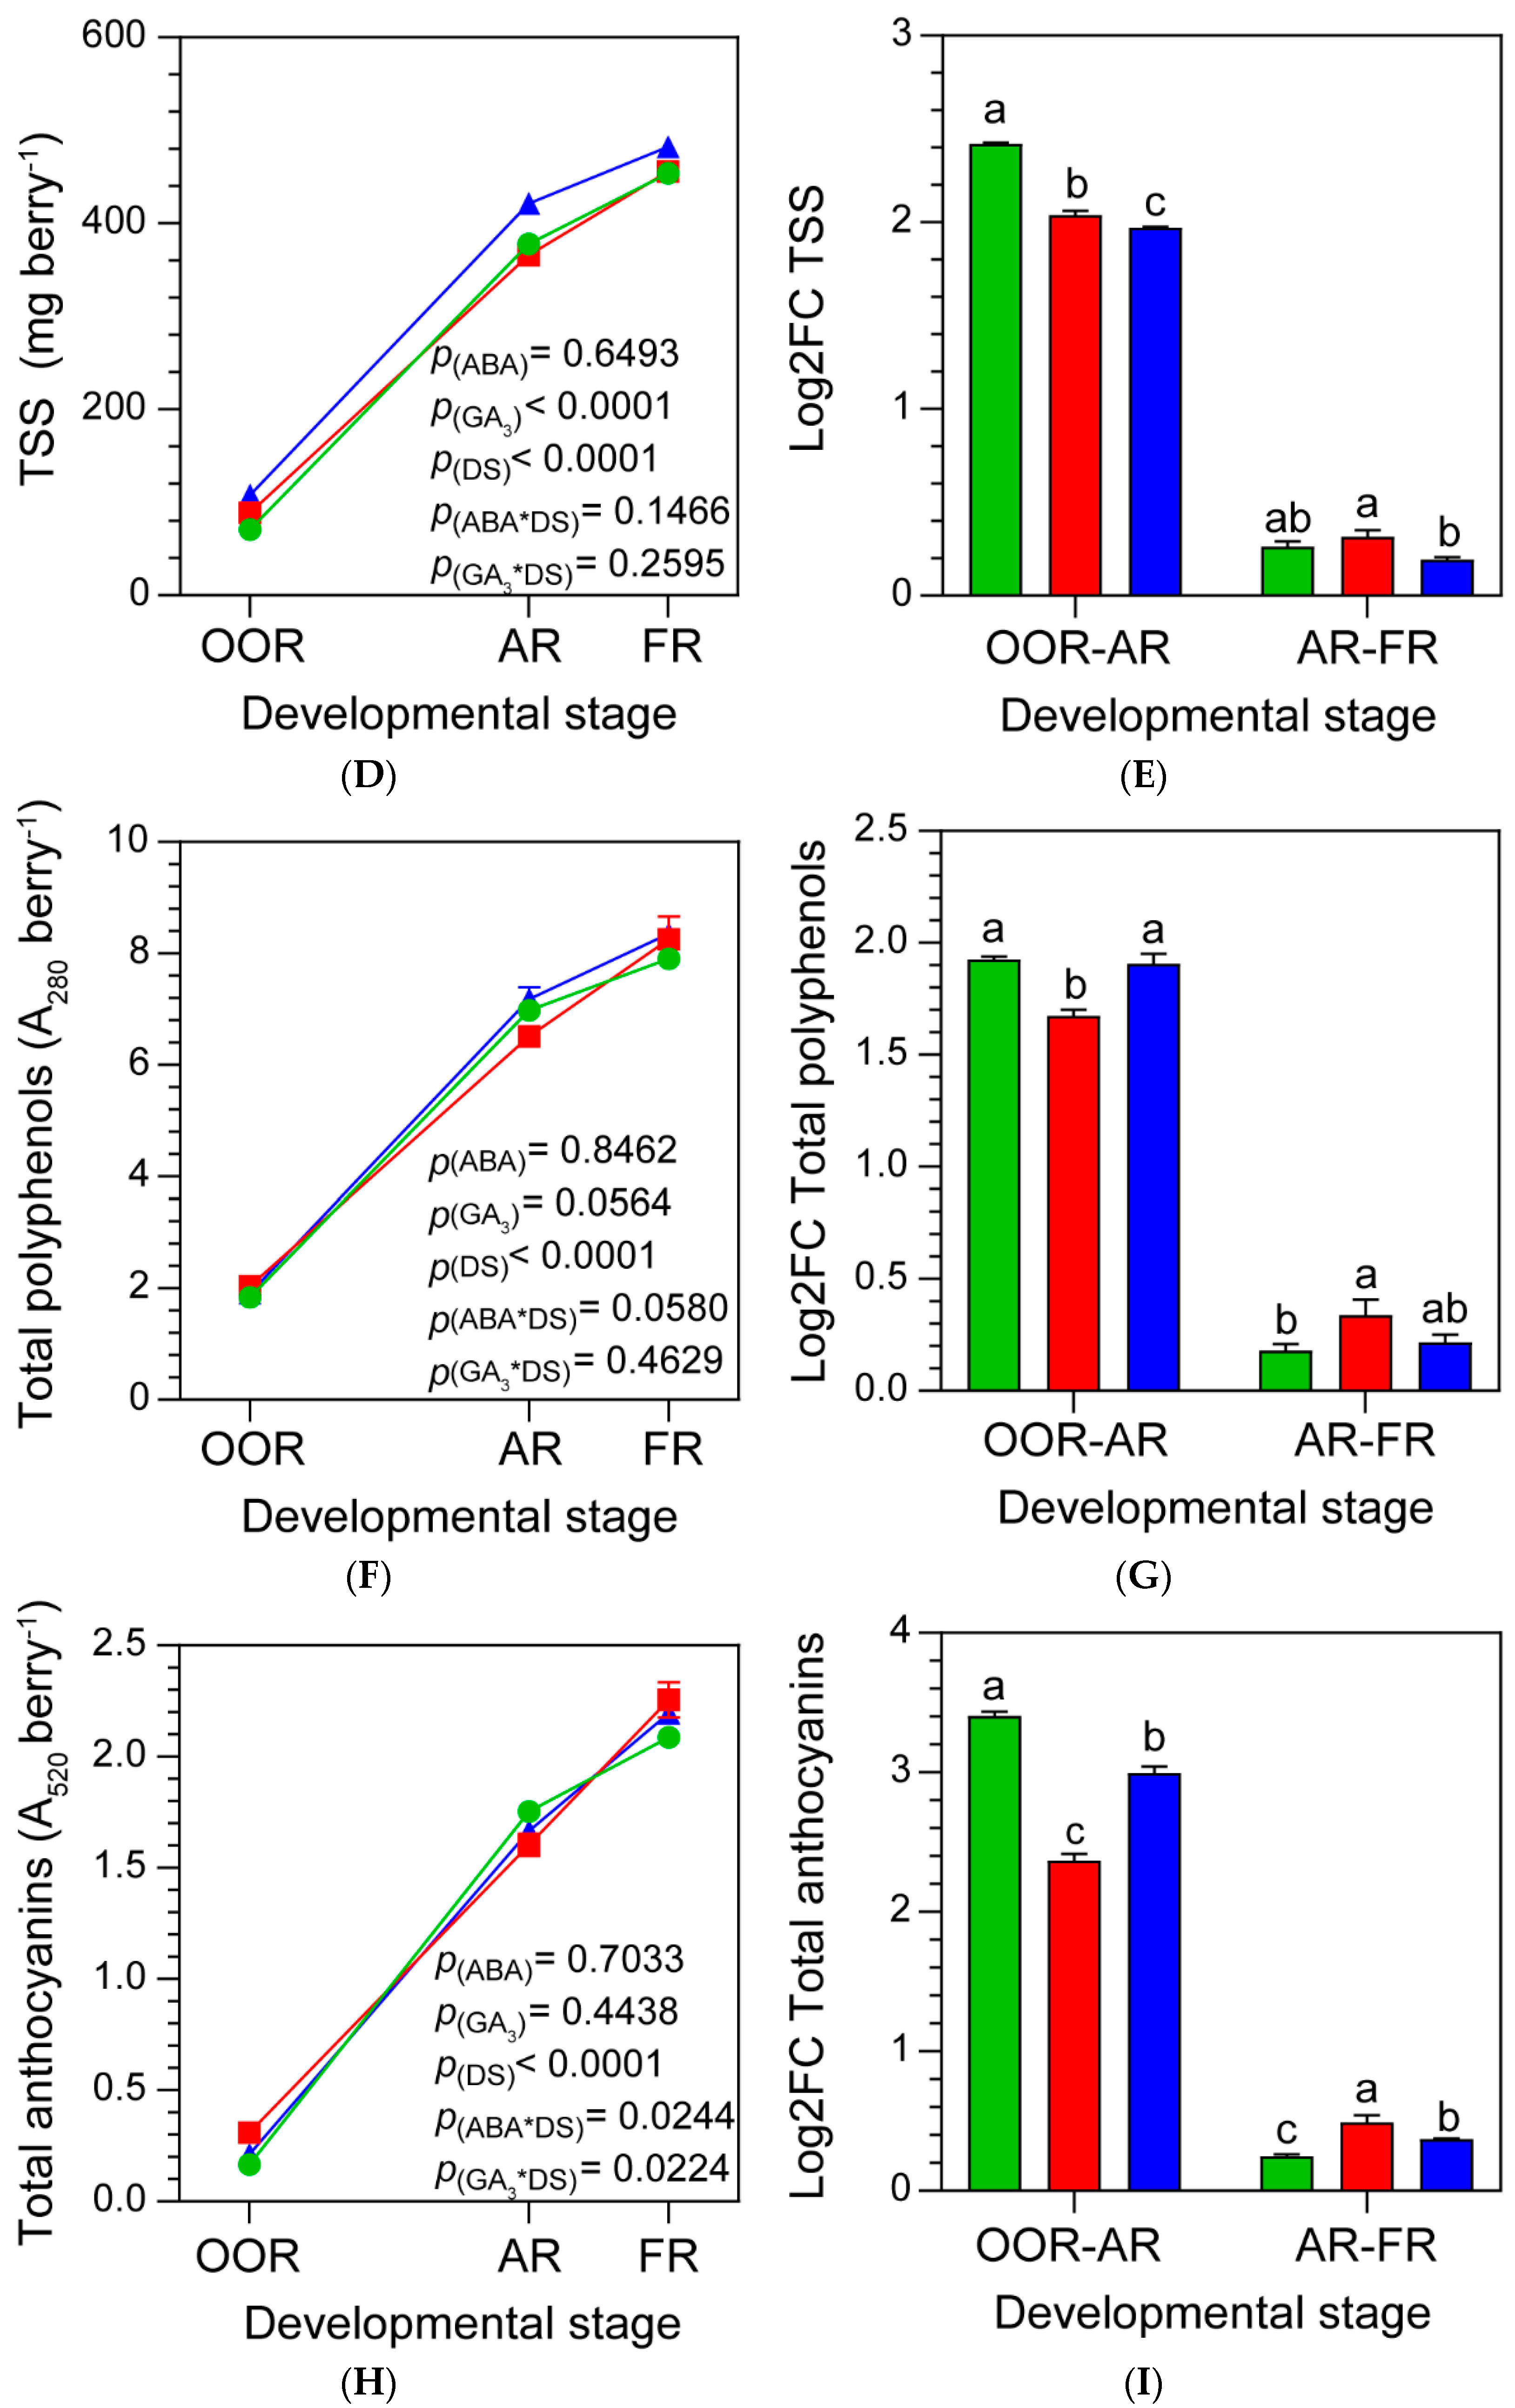
2.1. GA3 Promotes BFW and TSS Accumulation during Berry Ripening, Whilst ABA Has No Effect
2.2. ABA and GA3 Modify the Phenolic Compounds Dynamics during Berry Ripening
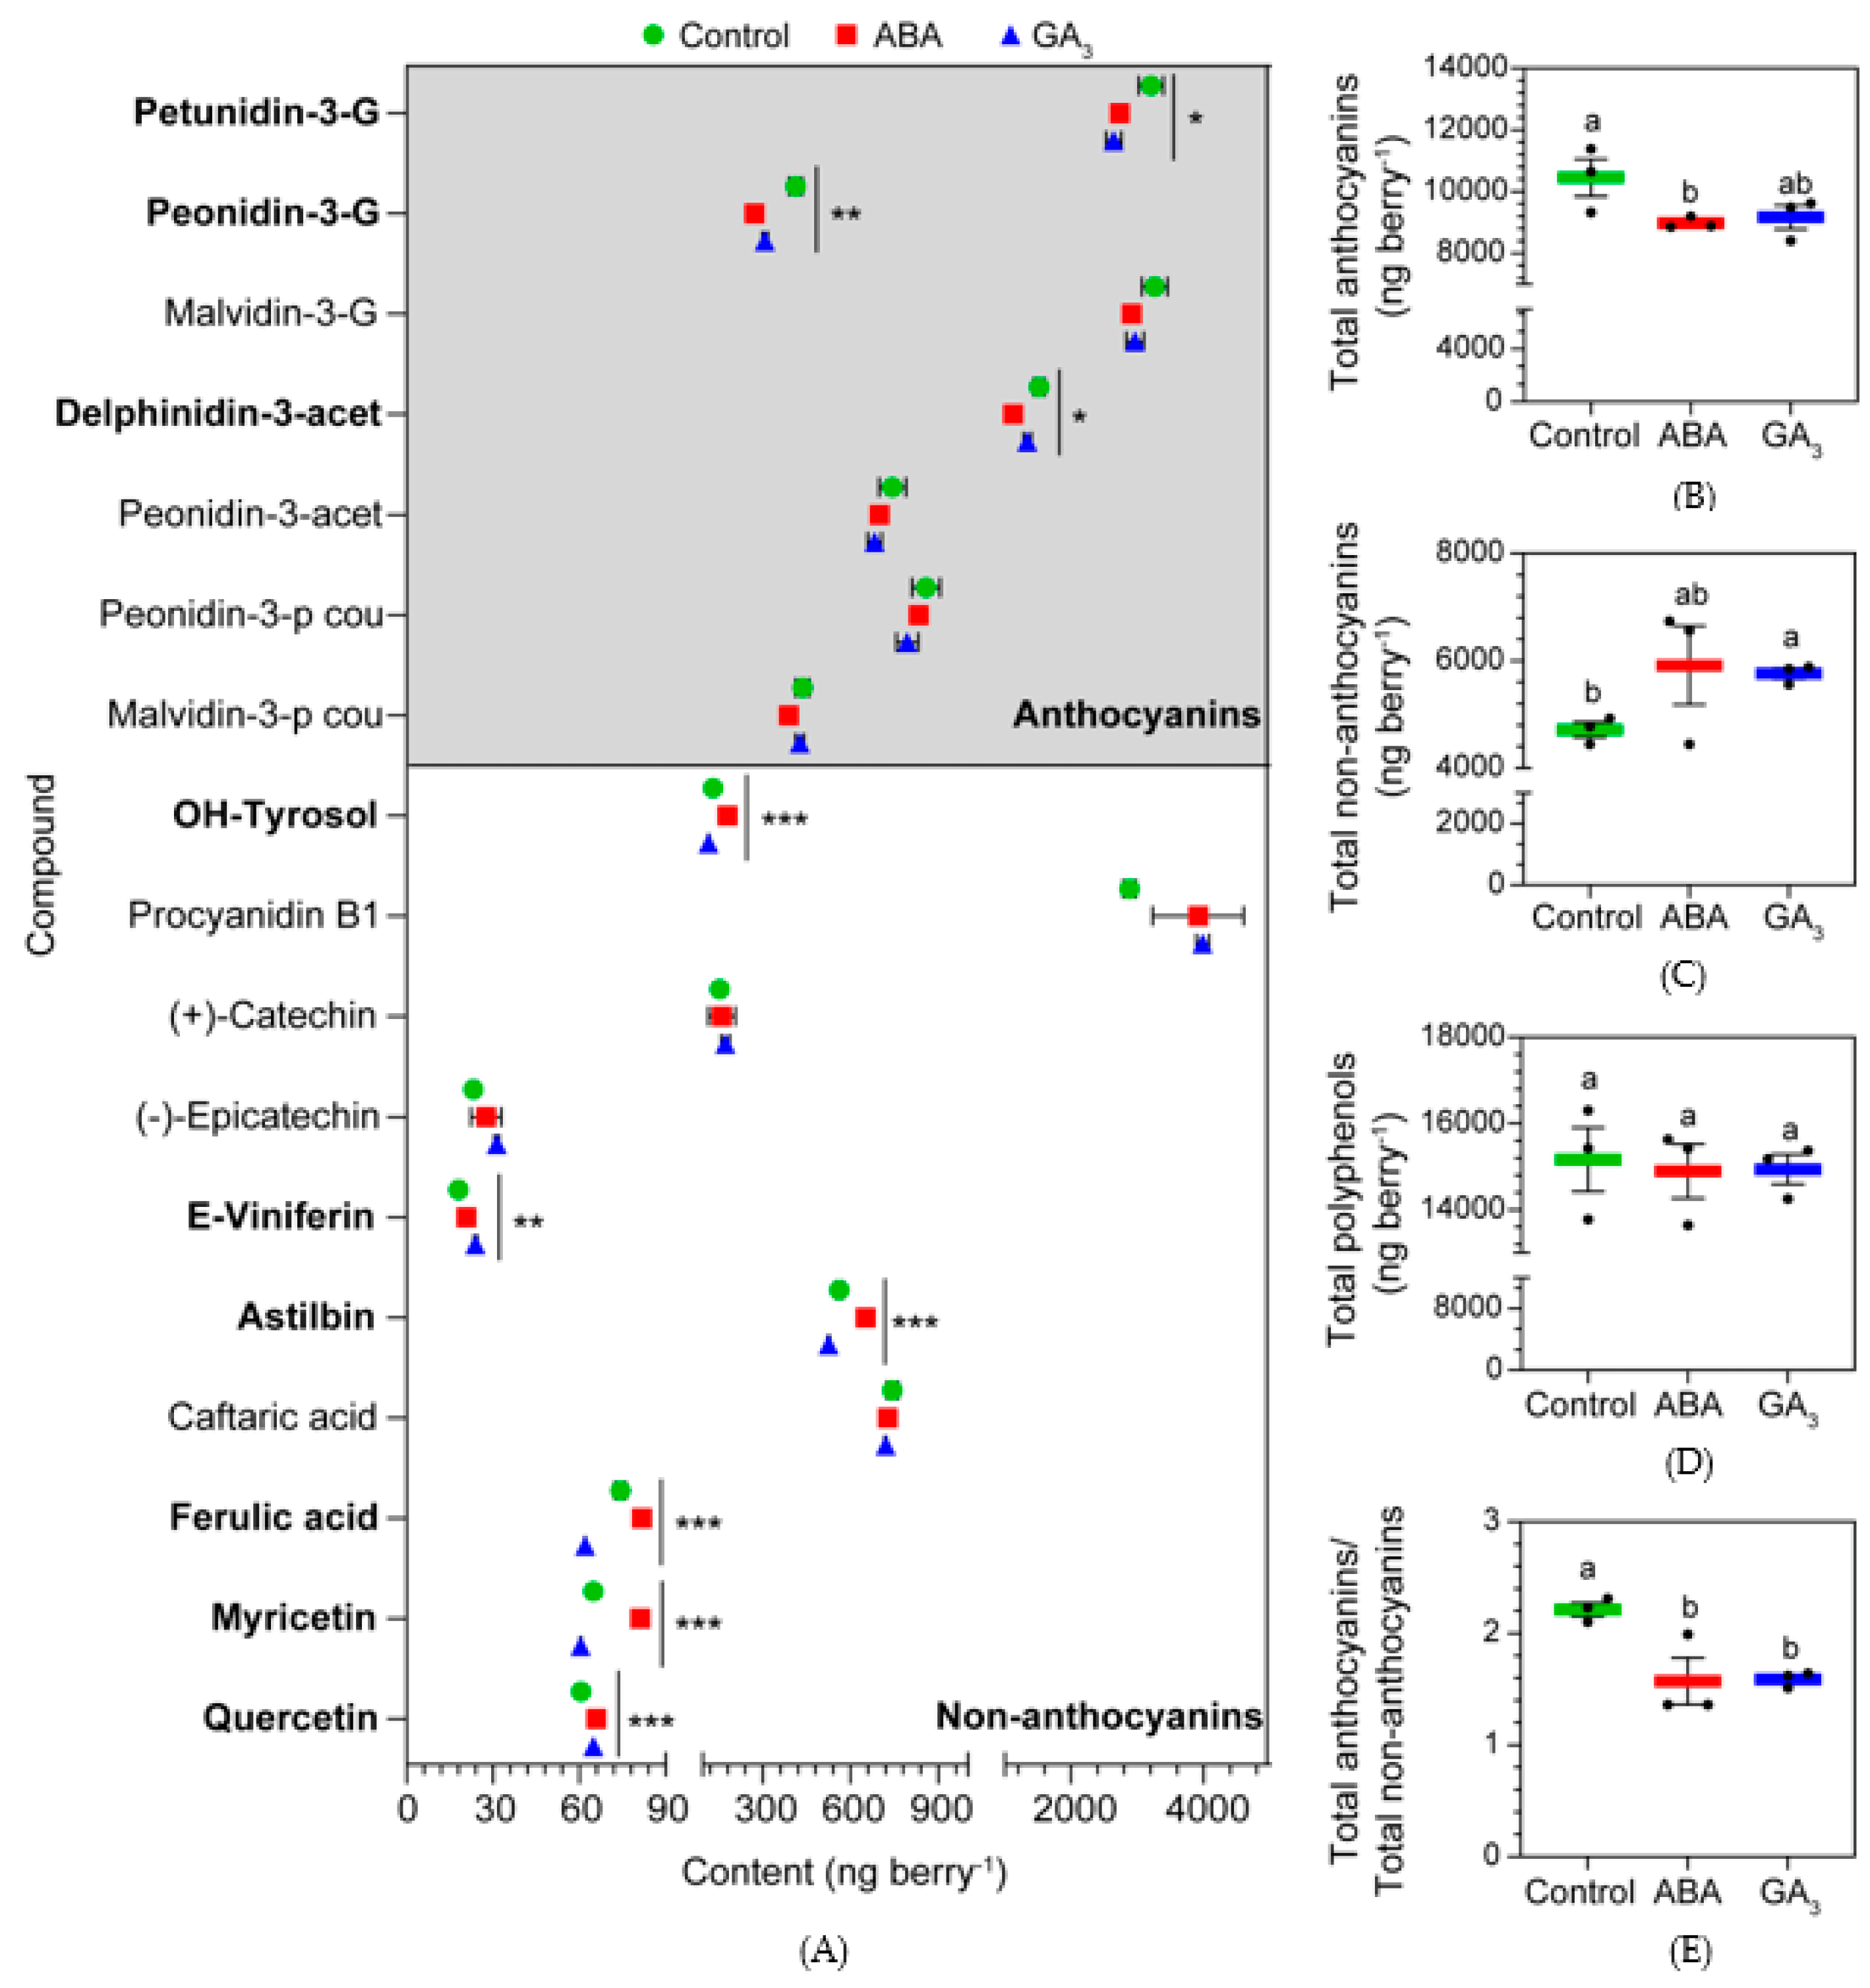
2.3. ABA and GA3 Promote a Shift in Polyphenols Metabolism at AR
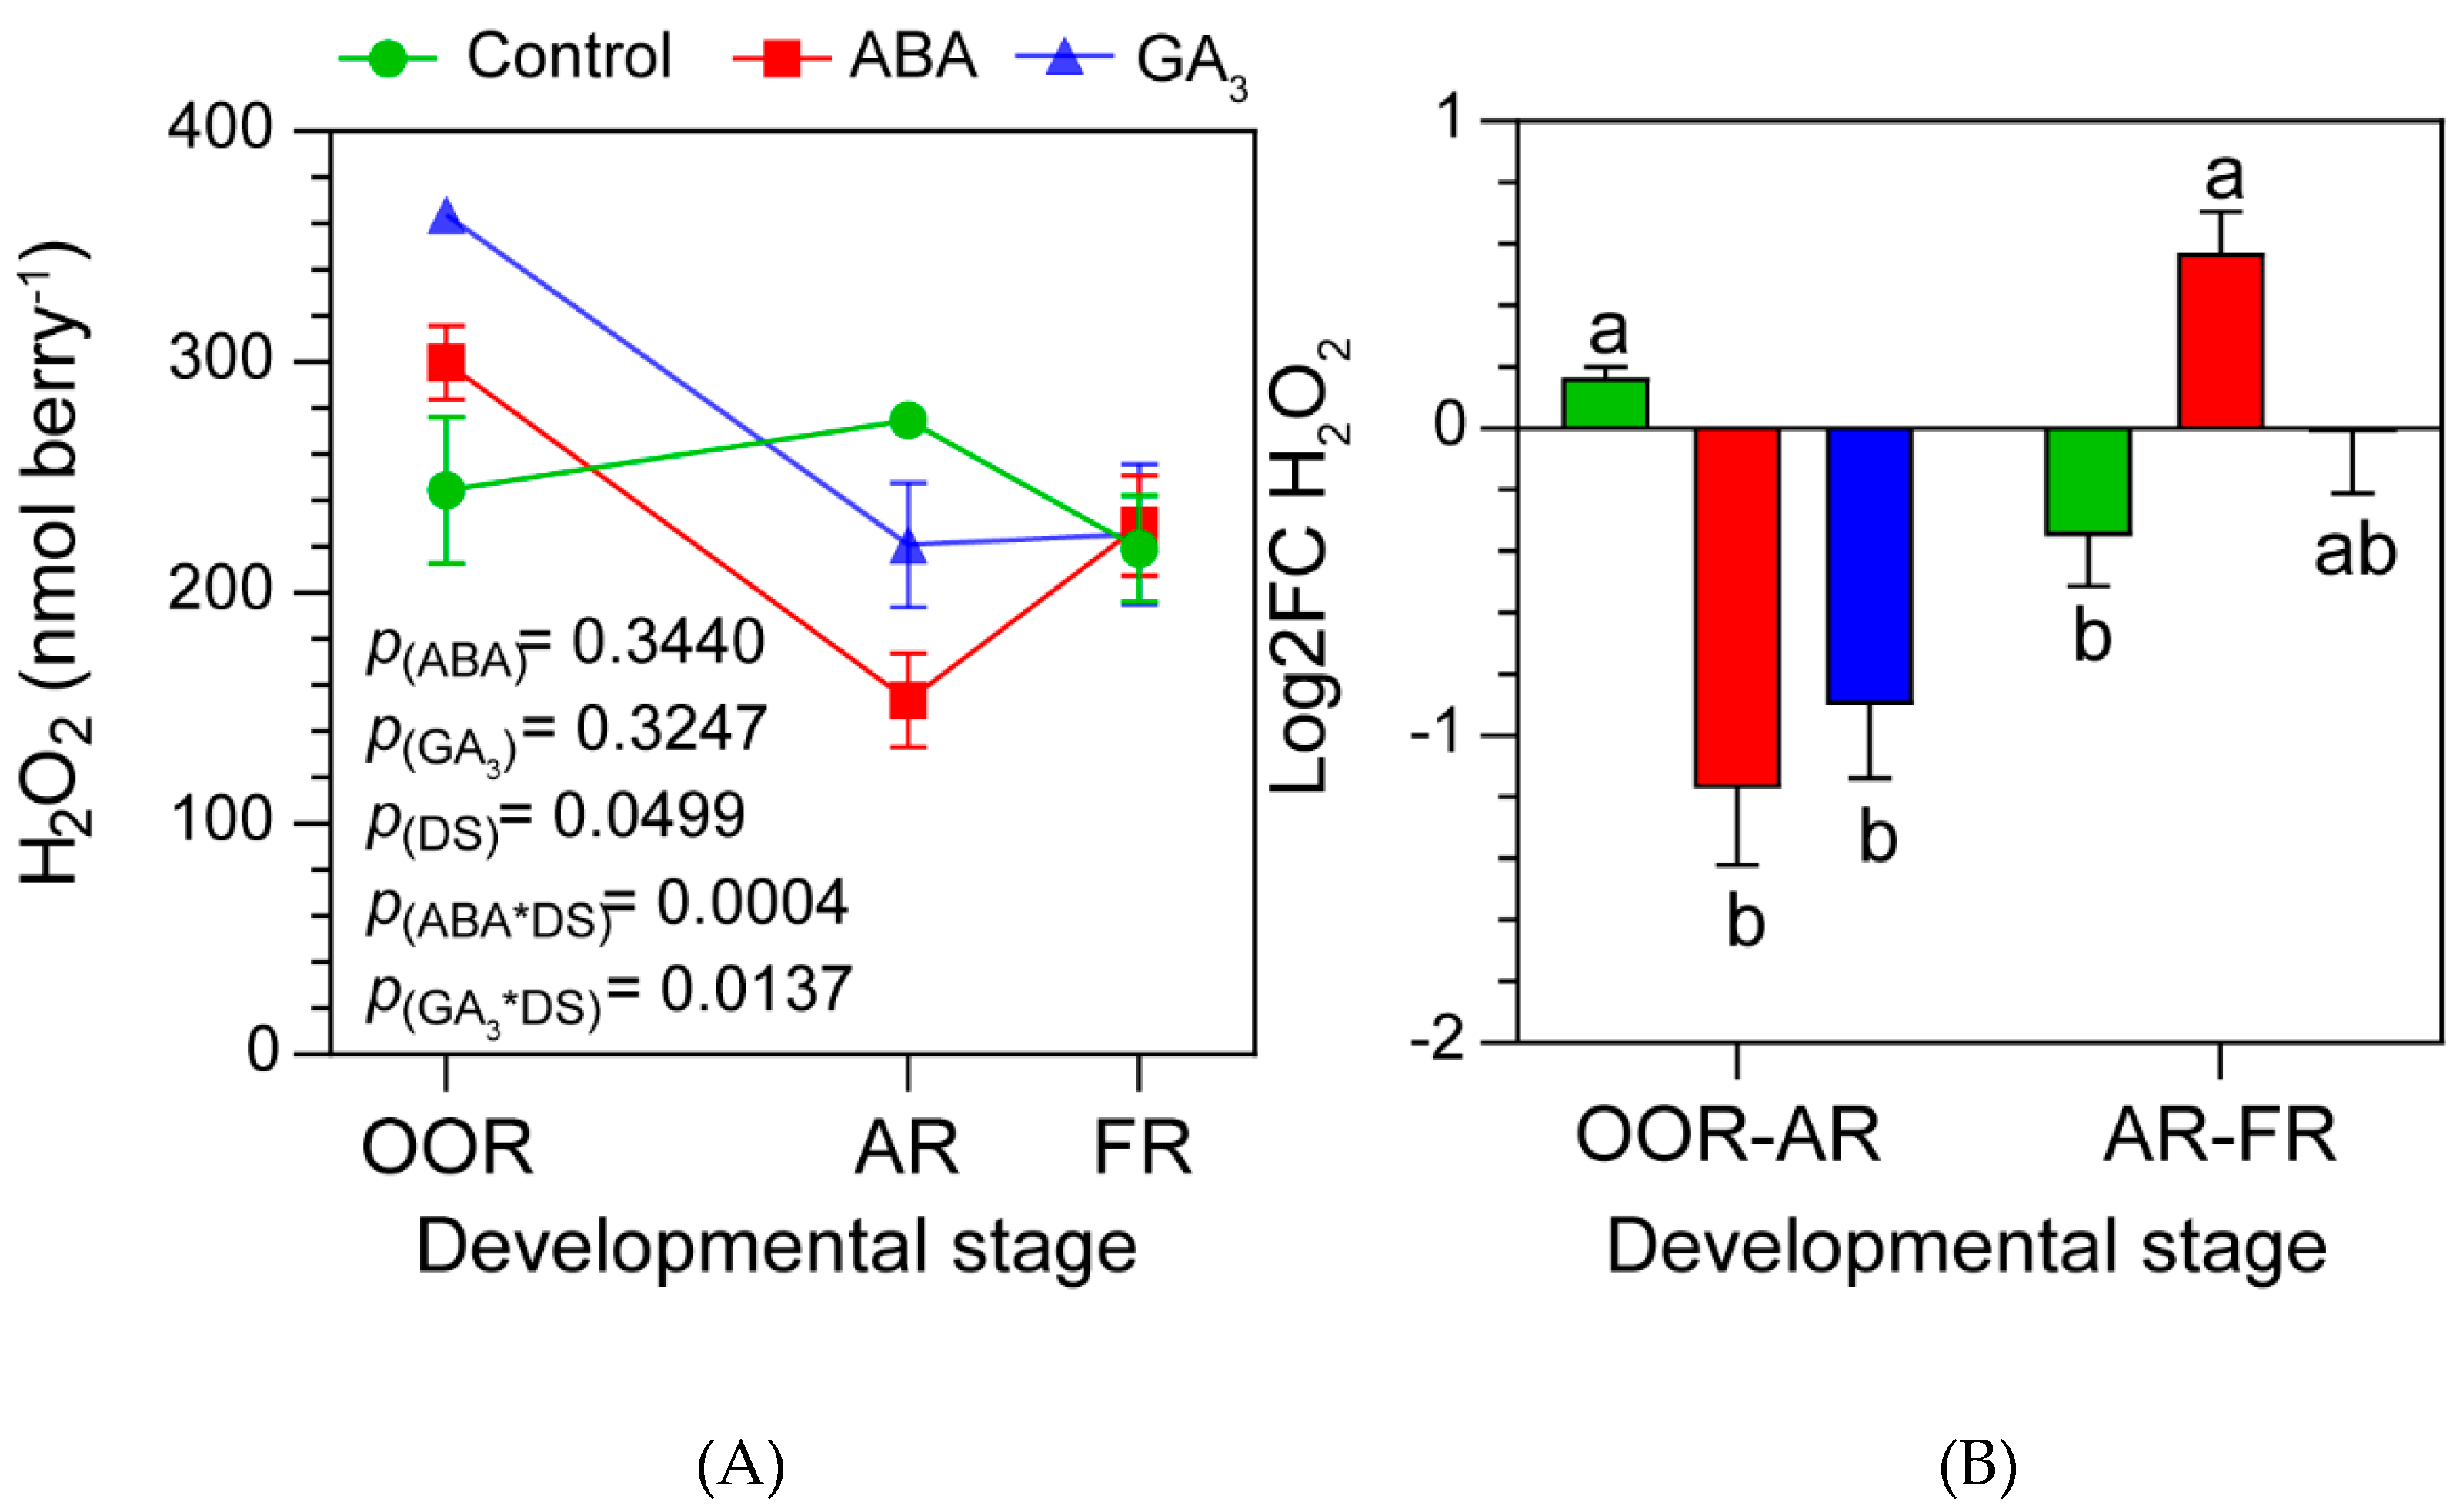
2.4. ABA and GA3 Modify Berry H2O2 Content Dynamics during Berry Ripening
2.5. ABA and GA3 Positively Modulate the Enzymatic Antioxidant Defense System
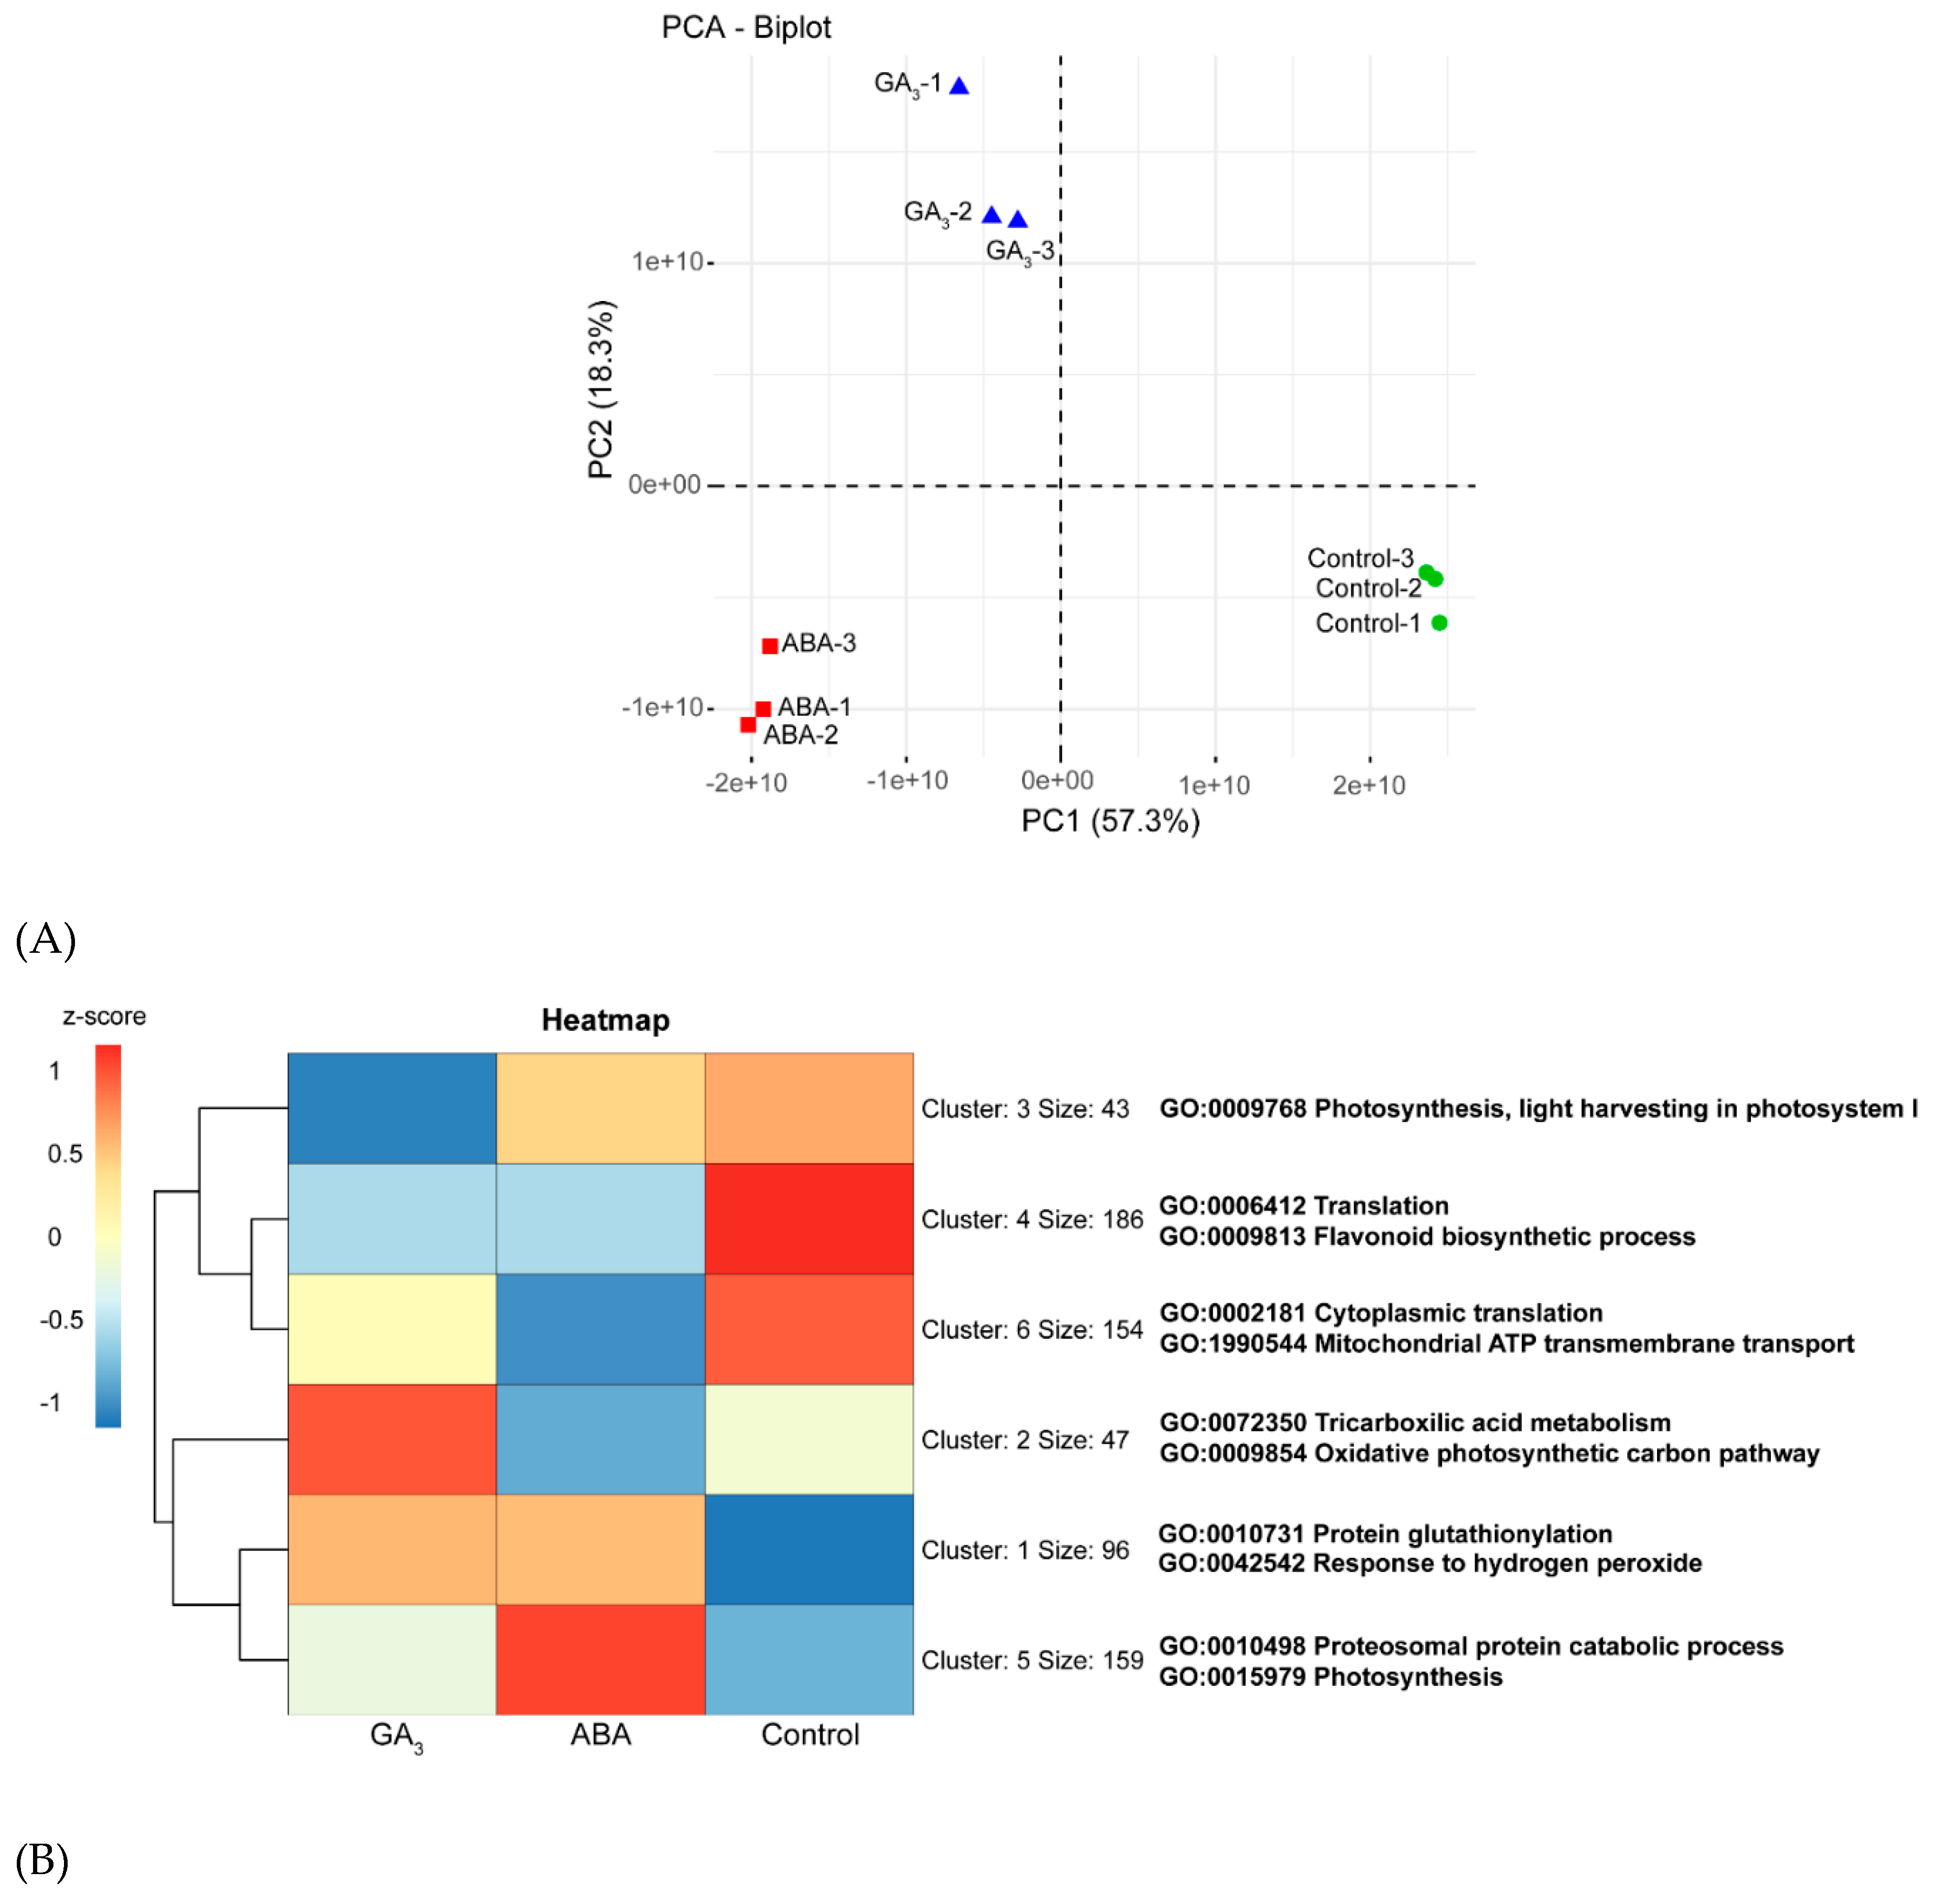
2.5.1. ABA and GA3 Differentially Modulate the Berry Skin Proteome
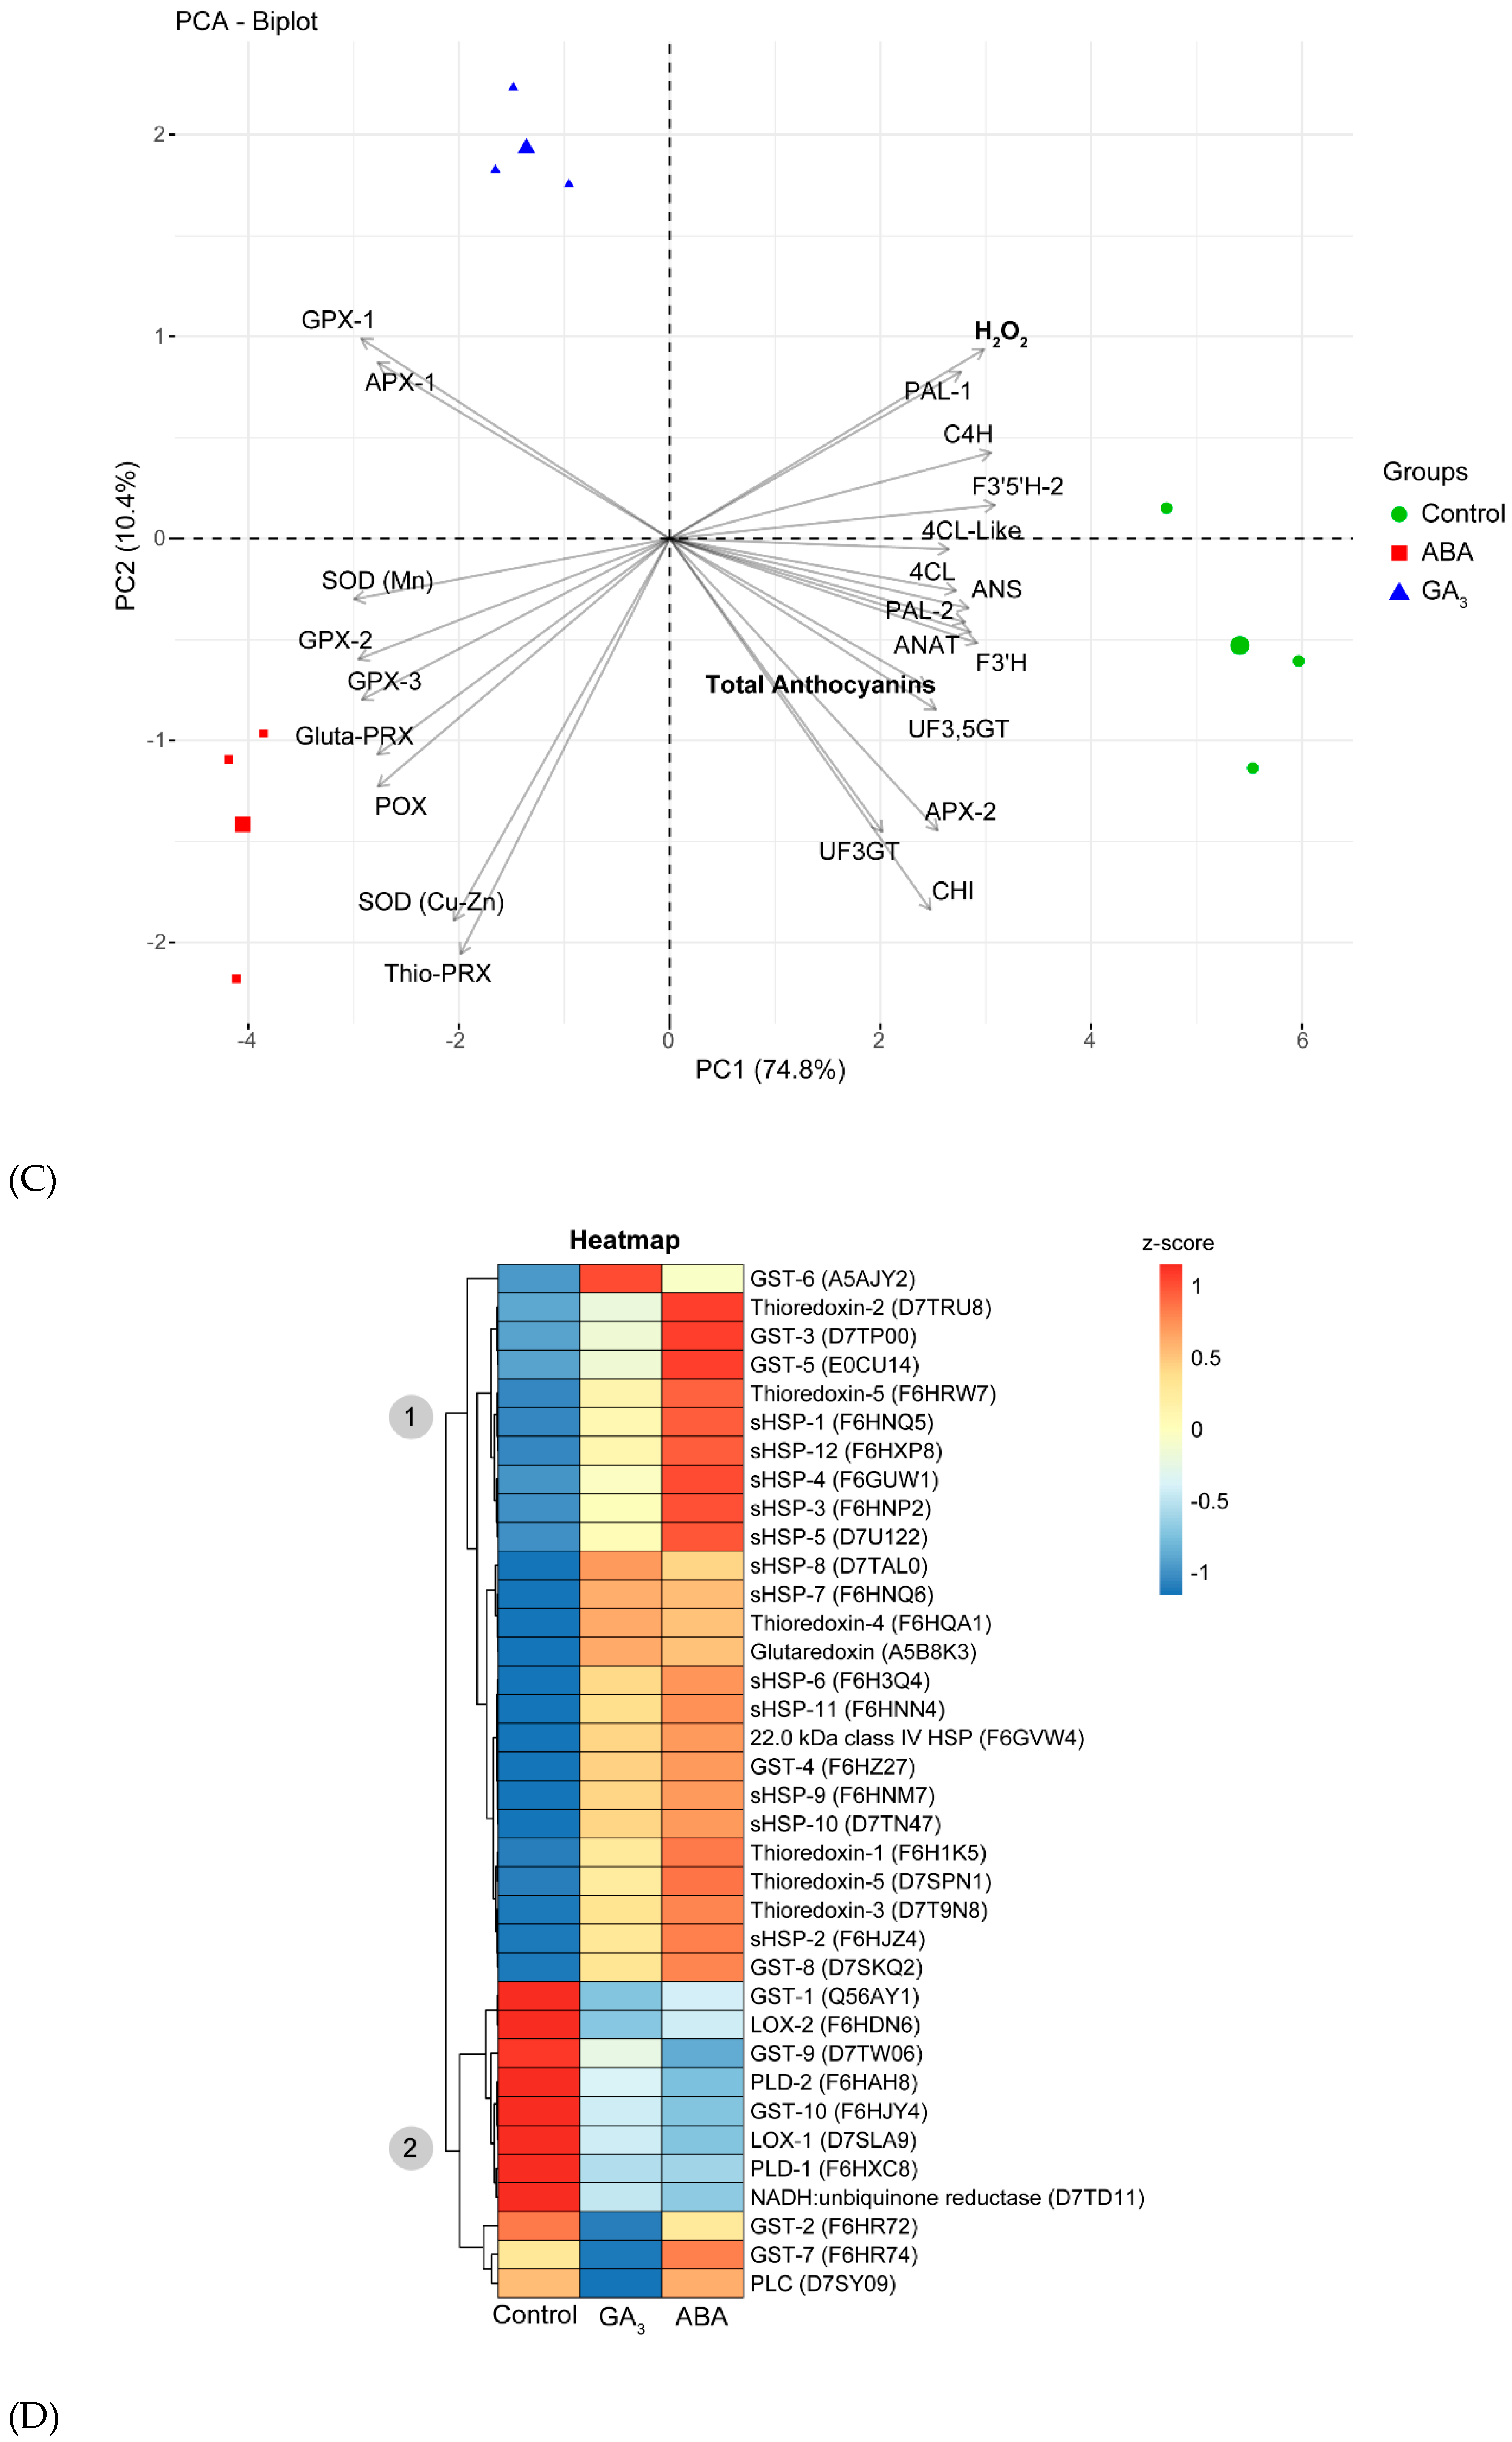
2.5.2. ABA and GA3 Up-Regulate the Proteins with Antioxidant Function
2.5.3. ABA and GA3 Up-Regulate the Oxidative Stress Response Proteins
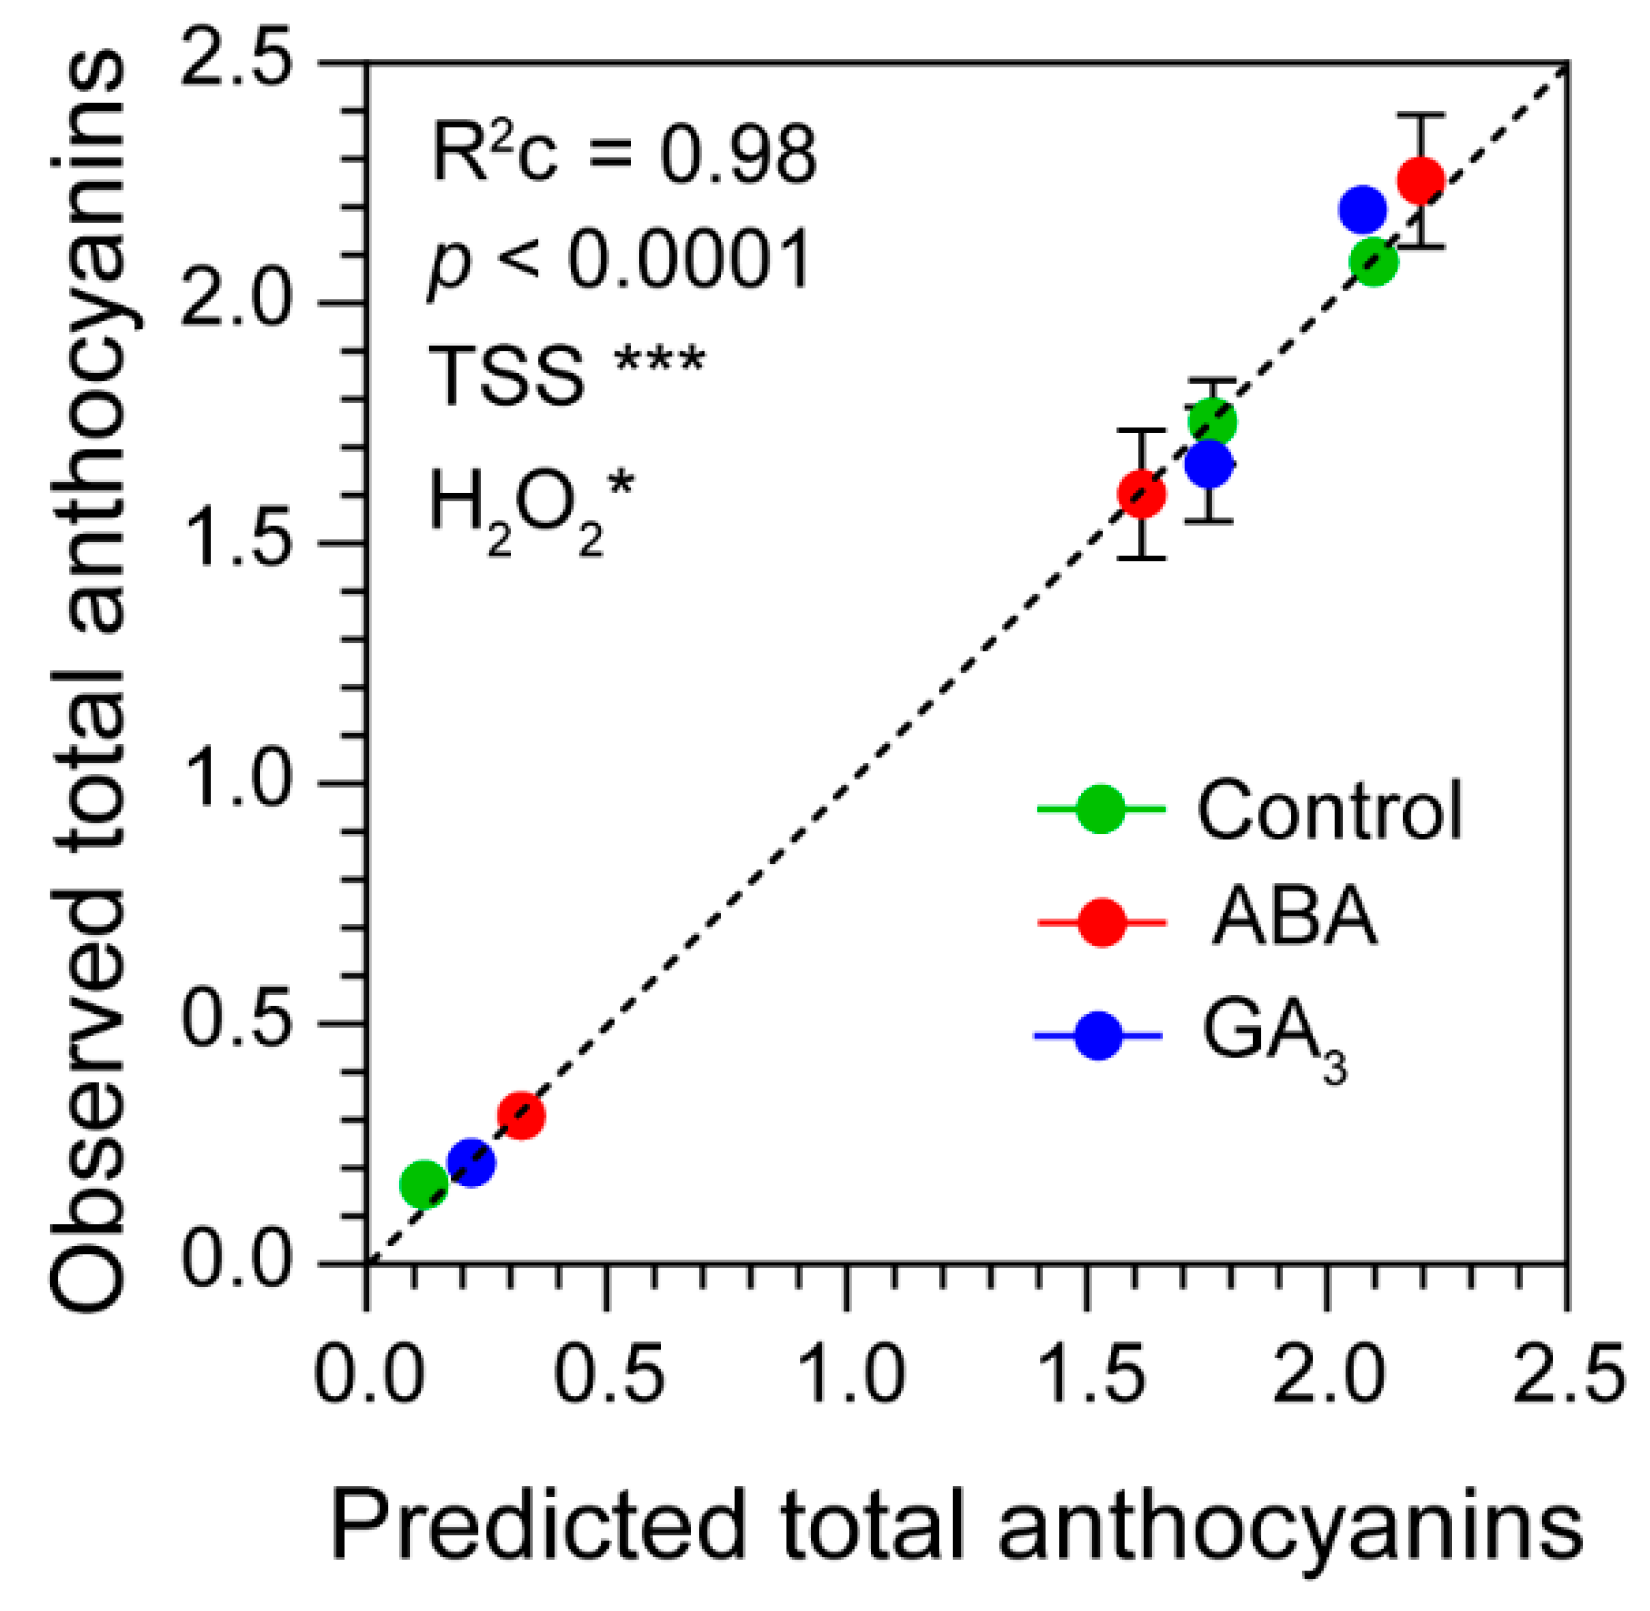
2.6. Berry Total Anthocyanins Accumulation Depends on Berry Sugar and H2O2 Content
3. Discussion
4. Materials and Methods
4.1. Plant Material and Experimental Conditions
4.2. Berry Sampling, Fresh Weight and Total Soluble Solids
4.3. Berry Phenolic Extraction, Berry Total Polyphenols and Anthocyanins
4.4. Berry Phenolic Compounds Profile
4.5. Berry Hydrogen Peroxide Content and Lipid Peroxidation
4.6. Proteomic Analysis Using High-Resolution Mass Spectrometry
4.6.1. Berry Skin Protein Extraction and Quantification
4.6.2. Nano-LC-Orbitrap Tandem Mass Spectrometry (nano-LC-MS/MS) Protein Analysis
4.7. Proteomics Data Analysis
4.8. Statistical and Bioinformatic Analysis
5. Conclusions
Supplementary Materials
Author Contributions
Funding
Acknowledgments
Conflicts of Interest
References
- Delrot S, Conde C. Biochemical Changes throughout Grape Berry Development and Fruit and Wine Quality. Food. 2007 Jan 1;1(1):1–22.
- Fanzone, M.; Zamora, F.; Jofré, V.; Assof, M.; Gómez-Cordovés, C.; Peña-Neira. Phenolic characterisation of red wines from different grape varieties cultivated in Mendoza province (Argentina). J. Sci. Food Agric. 2011, 92, 704–718. [Google Scholar] [CrossRef] [PubMed]
- Downey, M.O.; Dokoozlian, N.K.; Krstic, M.P. Cultural Practice and Environmental Impacts on the Flavonoid Composition of Grapes and Wine: A Review of Recent Research. Am. J. Enol. Vitic. 2006, 57, 257–268. [Google Scholar] [CrossRef]
- McAtee, P.; Karim, S.; Schaffer, R.; David, K. A dynamic interplay between phytohormones is required for fruit development, maturation, and ripening. Front. Plant Sci. 2013, 4, 79. [Google Scholar] [CrossRef]
- Wheeler, S.; Loveys, B.; Ford, C.; Davies, C. The relationship between the expression of abscisic acid biosynthesis genes, accumulation of abscisic acid and the promotion ofVitis viniferaL. berry ripening by abscisic acid. Aust. J. Grape Wine Res. 2009, 15, 195–204. [Google Scholar] [CrossRef]
- Gambetta, G.A.; Matthews, M.A.; Shaghasi, T.H.; McElrone, A.J.; Castellarin, S.D. Sugar and abscisic acid signaling orthologs are activated at the onset of ripening in grape. Planta 2010, 232, 219–234. [Google Scholar] [CrossRef] [PubMed]
- Bennett, J.; Meiyalaghan, S.; Nguyen, H.M.; Boldingh, H.; Cooney, J.; Elborough, C.; Araujo, L.D.; Barrell, P.; Lin-Wang, K.; Plunkett, B.J.; et al. Exogenous abscisic acid and sugar induce a cascade of ripening events associated with anthocyanin accumulation in cultured Pinot Noir grape berries. Front. Plant Sci. 2023, 14, 1324675. [Google Scholar] [CrossRef] [PubMed]
- Murcia G, Pontin M, Reinoso H, Baraldi R, Bertazza G, Gómez-Talquenca S, et al. ABA and GA3 increase carbon allocation in different organs of grapevine plants by inducing accumulation of non-structural carbohydrates in leaves, enhancement of phloem area and expression of sugar transporters. Physiol Plant. 2016 Mar 1;156(3):323–37.
- Ferrara G, Mazzeo A, Matarrese AMS, Pacucci C, Pacifico A, Gambacorta G, et al. Application of Abscisic Acid (S-ABA) to ‘Crimson Seedless’ Grape Berries in a Mediterranean Climate: Effects on Color, Chemical Characteristics, Metabolic Profile, and S-ABA Concentration. J Plant Growth Regul. 2013 Sep 1;32(3):491–505.
- Pilati, S.; Bagagli, G.; Sonego, P.; Moretto, M.; Brazzale, D.; Castorina, G.; Simoni, L.; Tonelli, C.; Guella, G.; Engelen, K.; et al. Abscisic Acid Is a Major Regulator of Grape Berry Ripening Onset: New Insights into ABA Signaling Network. Front. Plant Sci. 2017, 8, 1–16. [Google Scholar] [CrossRef]
- Li, J.; Liu, B.; Li, X.; Li, D.; Han, J.; Zhang, Y.; Ma, C.; Xu, W.; Wang, L.; Jiu, S.; et al. Exogenous Abscisic Acid Mediates Berry Quality Improvement by Altered Endogenous Plant Hormones Level in “Ruiduhongyu” Grapevine. Front. Plant Sci. 2021, 12. [Google Scholar] [CrossRef]
- Murcia G, Pontin M, Piccoli P. Role of ABA and Gibberellin A3 on gene expression pattern of sugar transporters and invertases in Vitis vinifera cv. Malbec during berry ripening. Plant Growth Regul. 2018 Mar;84(2):275–83.
- Pahi, B.; Rout, C.K.; Saxena, D. Effects of gibberellic acid (GA3) on quality and yield in grapes. Int. J. Chem. Stud. 2020, 8, 2362–2367. [Google Scholar] [CrossRef]
- Moreno, D.; Berli, F.J.; Piccoli, P.N.; Bottini, R. Gibberellins and Abscisic Acid Promote Carbon Allocation in Roots and Berries of Grapevines. J. Plant Growth Regul. 2010, 30, 220–228. [Google Scholar] [CrossRef]
- Peppi, M.C.; Fidelibus, M.W.; Dokoozlian, N. Abscisic Acid Application Timing and Concentration Affect Firmness, Pigmentation, and Color of `Flame Seedless' Grapes. HortScience 2006, 41, 1440–1445. [Google Scholar] [CrossRef]
- Roberto SR, de Assis AM, Yamamoto LY, Miotto LCV, Sato AJ, Koyama R, et al. Application timing and concentration of abscisic acid improve color of ‘Benitaka’ table grape. Sci Hortic. 2012 Jul 13;142:44–8.
- Koyama R, Roberto SR, de Souza RT, Borges WFS, Anderson M, Waterhouse AL, et al. Exogenous Abscisic Acid Promotes Anthocyanin Biosynthesis and Increased Expression of Flavonoid Synthesis Genes in Vitis vinifera × Vitis labrusca Table Grapes in a Subtropical Region. Front Plant Sci. 2018 Mar 26;9:323.
- Jimenez, A.; Creissen, G.; Kular, B.; Firmin, J.; Robinson, S.; Verhoeyen, M.; Mullineaux, P. Changes in oxidative processes and components of the antioxidant system during tomato fruit ripening. Planta 2002, 214, 751–758. [Google Scholar] [CrossRef]
- Qin, G.; Meng, X.; Wang, Q.; Tian, S. Oxidative Damage of Mitochondrial Proteins Contributes to Fruit Senescence: A Redox Proteomics Analysis. J. Proteome Res. 2009, 8, 2449–2462. [Google Scholar] [CrossRef]
- Blokhina, O.; Virolainen, E.; Fagerstedt, K.V. Antioxidants, Oxidative Damage and Oxygen Deprivation Stress: a Review. Ann. Bot. 2003, 91, 179–194. [Google Scholar] [CrossRef]
- Mhamdi A, Van Breusegem F. Reactive oxygen species in plant development. Dev Camb Engl. 2018 Aug 9;145(15):dev164376.
- Kärkönen, A.; Kuchitsu, K. Reactive oxygen species in cell wall metabolism and development in plants. Phytochemistry 2015, 112, 22–32. [Google Scholar] [CrossRef] [PubMed]
- Apel K, Hirt H. Reactive oxygen species: metabolism, oxidative stress, and signal transduction. Annu Rev Plant Biol. 2004;55:373–99.
- Gechev, T.S.; Van Breusegem, F.; Stone, J.M.; Denev, I.; Laloi, C. Reactive oxygen species as signals that modulate plant stress responses and programmed cell death. BioEssays 2006, 28, 1091–1101. [Google Scholar] [CrossRef] [PubMed]
- Huang, H.; Ullah, F.; Zhou, D.-X.; Yi, M.; Zhao, Y. Mechanisms of ROS Regulation of Plant Development and Stress Responses. Front. Plant Sci. 2019, 10, 800. [Google Scholar] [CrossRef]
- Pilati, S.; Perazzolli, M.; Malossini, A.; Cestaro, A.; Demattè, L.; Fontana, P.; Ri, A.D.; Viola, R.; Velasco, R.; Moser, C. Genome-wide transcriptional analysis of grapevine berry ripening reveals a set of genes similarly modulated during three seasons and the occurrence of an oxidative burst at vèraison. BMC Genom. 2007, 8, 428–428. [Google Scholar] [CrossRef]
- Pilati, S.; Brazzale, D.; Guella, G.; Milli, A.; Ruberti, C.; Biasioli, F.; Zottini, M.; Moser, C. The onset of grapevine berry ripening is characterized by ROS accumulation and lipoxygenase-mediated membrane peroxidation in the skin. BMC Plant Biol. 2014, 14, 87–87. [Google Scholar] [CrossRef]
- Kumar, V.; Irfan, M.; Ghosh, S.; Chakraborty, N.; Chakraborty, S.; Datta, A. Fruit ripening mutants reveal cell metabolism and redox state during ripening. Protoplasma 2015, 253, 581–594. [Google Scholar] [CrossRef]
- Brennan, T.; Frenkel, C. Involvement of Hydrogen Peroxide in the Regulation of Senescence in Pear. Plant Physiol. 1977, 59, 411–416. [Google Scholar] [CrossRef] [PubMed]
- Huan, C.; Jiang, L.; An, X.; Yu, M.; Xu, Y.; Ma, R.; Yu, Z. Potential role of reactive oxygen species and antioxidant genes in the regulation of peach fruit development and ripening. Plant Physiol. Biochem. 2016, 104, 294–303. [Google Scholar] [CrossRef]
- Guo D, l. , Wang Z g., Li Q, Gu S c., Zhang G h., Yu Y h. Hydrogen peroxide treatment promotes early ripening of Kyoho grape. Aust J Grape Wine Res. 2019;25(3):357–62.
- Guo, D.-L.; Wang, Z.-G.; Pei, M.-S.; Guo, L.-L.; Yu, Y.-H. Transcriptome analysis reveals mechanism of early ripening in Kyoho grape with hydrogen peroxide treatment. BMC Genom. 2020, 21, 1–18. [Google Scholar] [CrossRef] [PubMed]
- Xu, L.; Yue, Q.; Xiang, G.; Bian, F.; Yao, Y. Melatonin promotes ripening of grape berry via increasing the levels of ABA, H2O2, and particularly ethylene. Hortic. Res. 2018, 5, 1–11. [Google Scholar] [CrossRef] [PubMed]
- Sun, H.; Cao, X.; Wang, X.; Zhang, W.; Li, W.; Wang, X.; Liu, S.; Lyu, D. RBOH-dependent hydrogen peroxide signaling mediates melatonin-induced anthocyanin biosynthesis in red pear fruit. Plant Sci. 2021, 313, 111093. [Google Scholar] [CrossRef] [PubMed]
- Wen B, Zhang F, Wu X, Li H. Characterization of the Tomato (Solanum lycopersicum) Pectin Methylesterases: Evolution, Activity of Isoforms and Expression During Fruit Ripening. Front Plant Sci. 2020 Mar 3;11:1–17.
- Wang, D.; Yeats, T.H.; Uluisik, S.; Rose, J.K.; Seymour, G.B. Fruit Softening: Revisiting the Role of Pectin. Trends Plant Sci. 2018, 23, 302–310. [Google Scholar] [CrossRef]
- Berli, F.J.; Alonso, R.; Beltrano, J.; Bottini, R. High-Altitude Solar UV-B and Abscisic Acid Sprays Increase Grape Berry Antioxidant Capacity. Am. J. Enol. Vitic. 2014, 66, 65–72. [Google Scholar] [CrossRef]
- Berli, F.J.; Fanzone, M.; Piccoli, P.; Bottini, R. Solar UV-B and ABA Are Involved in Phenol Metabolism of Vitis vinifera L. Increasing Biosynthesis of Berry Skin Polyphenols. J. Agric. Food Chem. 2011, 59, 4874–4884. [Google Scholar] [CrossRef] [PubMed]
- Koyama, K.; Sadamatsu, K.; Goto-Yamamoto, N. Abscisic acid stimulated ripening and gene expression in berry skins of the Cabernet Sauvignon grape. Funct. Integr. Genom. 2009, 10, 367–381. [Google Scholar] [CrossRef]
- Giribaldi, M.; Gény, L.; Delrot, S.; Schubert, A. Proteomic analysis of the effects of ABA treatments on ripening Vitis vinifera berries. J. Exp. Bot. 2010, 61, 2447–2458. [Google Scholar] [CrossRef]
- Yang, L.; Zhang, J.; He, J.; Qin, Y.; Hua, D.; Duan, Y.; Chen, Z.; Gong, Z. ABA-Mediated ROS in Mitochondria Regulate Root Meristem Activity by Controlling PLETHORA Expression in Arabidopsis. PLOS Genet. 2014, 10, e1004791. [Google Scholar] [CrossRef] [PubMed]
- Jiang, M.; Zhang, J. Effect of Abscisic Acid on Active Oxygen Species, Antioxidative Defence System and Oxidative Damage in Leaves of Maize Seedlings. Plant Cell Physiol. 2001, 42, 1265–1273. [Google Scholar] [CrossRef] [PubMed]
- Ye, N.; Zhu, G.; Liu, Y.; Li, Y.; Zhang, J. ABA Controls H2O2 Accumulation Through the Induction of OsCATB in Rice Leaves Under Water Stress. Plant Cell Physiol. 2011, 52, 689–698. [Google Scholar] [CrossRef] [PubMed]
- Shah, S.H.; Islam, S.; Mohammad, F.; Siddiqui, M.H. Gibberellic Acid: A Versatile Regulator of Plant Growth, Development and Stress Responses. J. Plant Growth Regul. 2023, 42, 7352–7373. [Google Scholar] [CrossRef]
- Hung, K.T.; Cheng, D.G.; Hsu, Y.T.; Kao, C.H. Abscisic acid-induced hydrogen peroxide is required for anthocyanin accumulation in leaves of rice seedlings. J. Plant Physiol. 2008, 165, 1280–1287. [Google Scholar] [CrossRef] [PubMed]
- Loreti E, Povero G, Novi G, Solfanelli C, Alpi A, Perata P. Gibberellins, jasmonate and abscisic acid modulate the sucrose-induced expression of anthocyanin biosynthetic genes in Arabidopsis. New Phytol. 2008;179(4):1004–16.
- An, J.; Xu, R.; Wang, X.; Zhang, X.; You, C.; Han, Y. MdbHLH162 connects the gibberellin and jasmonic acid signals to regulate anthocyanin biosynthesis in apple. J. Integr. Plant Biol. 2024, 66, 265–284. [Google Scholar] [CrossRef] [PubMed]
- Berli, F.J.; Moreno, D.; Piccoli, P.; Hespanhol-Viana, L.; Silva, M.F.; Bressan-Smith, R.; Cavagnaro, J.B.; Bottini, R. Abscisic acid is involved in the response of grape (Vitis viniferaL.) cv. Malbec leaf tissues to ultraviolet-B radiation by enhancing ultraviolet-absorbing compounds, antioxidant enzymes and membrane sterols. Plant, Cell Environ. 2009, 33, 1–10. [Google Scholar] [CrossRef] [PubMed]
- Pontin, M.; Murcia, G.; Bottini, R.; Fontana, A.; Bolcato, L.; Piccoli, P. Nitric oxide and abscisic acid regulate osmoprotective and antioxidative mechanisms related to water stress tolerance of grapevines. Aust. J. Grape Wine Res. 2021, 27, 392–405. [Google Scholar] [CrossRef]
- Jiang Z, Zhu H, Zhu H, Tao Y, Liu C, Liu J, et al. Exogenous ABA Enhances the Antioxidant Defense System of Maize by Regulating the AsA-GSH Cycle under Drought Stress. Sustainability. 2022 Jan;14(5):3071.
- Fu, J.; Li, L.; Wang, S.; Yu, N.; Shan, H.; Shi, Z.; Li, F.; Zhong, X. Effect of gibberellic acid on photosynthesis and oxidative stress response in maize under weak light conditions. Front. Plant Sci. 2023, 14, 1128780. [Google Scholar] [CrossRef]
- Yang, L.; Luo, S.; Jiao, J.; Yan, W.; Zeng, B.; He, H.; He, G. Integrated Transcriptomic and Metabolomic Analysis Reveals the Mechanism of Gibberellic Acid Regulates the Growth and Flavonoid Synthesis in Phellodendron chinense Schneid Seedlings. Int. J. Mol. Sci. 2023, 24, 16045. [Google Scholar] [CrossRef]
- ul Haq S, Khan A, Ali M, Khattak AM, Gai WX, Zhang HX, et al. Heat Shock Proteins: Dynamic Biomolecules to Counter Plant Biotic and Abiotic Stresses. Int J Mol Sci. 2019 Oct 25;20(21):5321.
- Santos CVD, Rey P. Plant thioredoxins are key actors in the oxidative stress response. Trends Plant Sci. 2006 Jul 1;11(7):329–34.
- Sevilla, F.; Martí, M.C.; De Brasi-Velasco, S.; Jiménez, A. Redox regulation, thioredoxins, and glutaredoxins in retrograde signalling and gene transcription. J. Exp. Bot. 2023, 74, 5955–5969. [Google Scholar] [CrossRef] [PubMed]
- Gullner, G.; Komives, T.; Király, L.; Schröder, P. Glutathione S-transferase enzymes in plant-pathogen interactions. Front. Plant Sci. 2018, 9, 1836. [Google Scholar] [CrossRef] [PubMed]
- Sun, L.; Fan, X.; Zhang, Y.; Jiang, J.; Sun, H.; Liu, C. Transcriptome analysis of genes involved in anthocyanins biosynthesis and transport in berries of black and white spine grapes (Vitis davidii). Hereditas 2016, 153, 1–22. [Google Scholar] [CrossRef] [PubMed]
- Kussmaul, L.; Hirst, J. The mechanism of superoxide production by NADH:ubiquinone oxidoreductase (complex I) from bovine heart mitochondria. Proc. Natl. Acad. Sci. 2006, 103, 7607–7612. [Google Scholar] [CrossRef] [PubMed]
- Singh, P.; Arif, Y.; Miszczuk, E.; Bajguz, A.; Hayat, S. Specific Roles of Lipoxygenases in Development and Responses to Stress in Plants. Plants 2022, 11, 979. [Google Scholar] [CrossRef] [PubMed]
- Xi FF, Guo LL, Yu YH, Wang Y, Li Q, Zhao HL, et al. Comparison of reactive oxygen species metabolism during grape berry development between ‘Kyoho’ and its early ripening bud mutant ‘Fengzao.’ Plant Physiol Biochem. 2017 Sep 1;118:634–42.
- Dominguez, P.G.; Frankel, N.; Mazuch, J.; Balbo, I.; Iusem, N.; Fernie, A.R.; Carrari, F. ASR1 Mediates Glucose-Hormone Cross Talk by Affecting Sugar Trafficking in Tobacco Plants. Plant Physiol. 2013, 161, 1486–1500. [Google Scholar] [CrossRef]
- Çakir, B.; Agasse, A.; Gaillard, C.; Saumonneau, A.; Delrot, S.; Atanassova, R. A Grape ASR Protein Involved in Sugar and Abscisic Acid Signaling. Plant Cell 2003, 15, 2165–2180. [Google Scholar] [CrossRef] [PubMed]
- Nopo-Olazabal, C.; Hubstenberger, J.; Nopo-Olazabal, L.; Medina-Bolivar, F. Antioxidant Activity of Selected Stilbenoids and Their Bioproduction in Hairy Root Cultures of Muscadine Grape (Vitis rotundifolia Michx.). J. Agric. Food Chem. 2013, 61, 11744–11758. [Google Scholar] [CrossRef]
- Singh, P.; Arif, Y.; Bajguz, A.; Hayat, S. The role of quercetin in plants. Plant Physiol. Biochem. 2021, 166, 10–19. [Google Scholar] [CrossRef]
- Coombe, B.G. Growth Stages of the Grapevine: Adoption of a system for identifying grapevine growth stages. Aust. J. Grape Wine Res. 1995, 1, 104–110. [Google Scholar] [CrossRef]
- Berli, F.; D’angelo, J.; Cavagnaro, B.; Bottini, R.; Wuilloud, R.; Silva, M.F. Phenolic Composition in Grape (Vitis vinifera L. cv. Malbec) Ripened with Different Solar UV-B Radiation Levels by Capillary Zone Electrophoresis. J. Agric. Food Chem. 2008, 56, 2892–2898. [Google Scholar] [CrossRef] [PubMed]
- Urvieta, R.; Buscema, F.; Bottini, R.; Coste, B.; Fontana, A. Phenolic and sensory profiles discriminate geographical indications for Malbec wines from different regions of Mendoza, Argentina. Food Chem. 2018, 265, 120–127. [Google Scholar] [CrossRef] [PubMed]
- Antoniolli, A.; Fontana, A.R.; Piccoli, P.; Bottini, R. Characterization of polyphenols and evaluation of antioxidant capacity in grape pomace of the cv. Malbec. Food Chem. 2015, 178, 172–178. [Google Scholar] [CrossRef]
- Ferreyra, S.; Torres-Palazzolo, C.; Bottini, R.; Camargo, A.; Fontana, A. Assessment of in-vitro bioaccessibility and antioxidant capacity of phenolic compounds extracts recovered from grapevine bunch stem and cane by-products. Food Chem. 2021, 348, 129063. [Google Scholar] [CrossRef] [PubMed]
- Junglee, S.; Urban, L.; Sallanon, H.; Lopez-Lauri, F. Optimized Assay for Hydrogen Peroxide Determination in Plant Tissue Using Potassium Iodide. Am. J. Anal. Chem. 2014, 05, 730–736. [Google Scholar] [CrossRef]
- Beligni, M.V.; Lamattina, L. Nitric oxide interferes with plant photo-oxidative stress by detoxifying reactive oxygen species. Plant, Cell Environ. 2002, 25, 737–748. [Google Scholar] [CrossRef]
- Negri, A.S.; Prinsi, B.; Rossoni, M.; Failla, O.; Scienza, A.; Cocucci, M.; Espen, L. Proteome changes in the skin of the grape cultivar Barbera among different stages of ripening. BMC Genom. 2008, 9, 378–378. [Google Scholar] [CrossRef] [PubMed]
- Neuhoff, V.; Arold, N.; Taube, D.; Ehrhardt, W. Improved staining of proteins in polyacrylamide gels including isoelectric focusing gels with clear background at nanogram sensitivity using Coomassie Brilliant Blue G-250 and R-250. Electrophoresis 1988, 9, 255–262. [Google Scholar] [CrossRef] [PubMed]
- Doncheva, N.T.; Morris, J.H.; Gorodkin, J.; Jensen, L.J. Cytoscape StringApp: Network Analysis and Visualization of Proteomics Data. J. Proteome Res. 2018, 18, 623–632. [Google Scholar] [CrossRef]
- Shannon, P.; Markiel, A.; Ozier, O.; Baliga, N.S.; Wang, J.T.; Ramage, D.; Amin, N.; Schwikowski, B.; Ideker, T. Cytoscape: A software environment for integrated models of Biomolecular Interaction Networks. Genome Res. 2003, 13, 2498–2504. [Google Scholar] [CrossRef]
Disclaimer/Publisher’s Note: The statements, opinions and data contained in all publications are solely those of the individual author(s) and contributor(s) and not of MDPI and/or the editor(s). MDPI and/or the editor(s) disclaim responsibility for any injury to people or property resulting from any ideas, methods, instructions or products referred to in the content. |
© 2024 by the authors. Licensee MDPI, Basel, Switzerland. This article is an open access article distributed under the terms and conditions of the Creative Commons Attribution (CC BY) license (https://creativecommons.org/licenses/by/4.0/).


