1. Introduction
The carbon fiber-reinforced polymer (CFRP) has become a widely used material in modern manufacturing due to its application in vital parts to structural safety in durable consumer goods [
1]. High stiffness, low weight, and increased fatigue strength are the main reasons that make CFRP so attractive to the industry. However, CFRP is susceptible to damage during machining, such as fiber cracks, matrix defects (gap, porosity), and delamination [
2]. Delamination is one of the most common failure forms of composites and occurs because of continuous stress and pressure, which causes layer deformation [
3]. It is responsible for drastically reducing the mechanical resistance of this material [
4] and has been reported in reviews of drilling [
5] and milling [
6] operations of this composite.
To monitor the integrity of CFRP structures, several monitoring methods have been proposed during the manufacturing stages. Destructive methods, which are less commonly preferred because of their nature of damaging the part, are sometimes necessary for comprehensive analysis. Bending tests were performed for research purposes with the aim of using CFRP for structural reinforcement [
7]. Tensile strength tests were conducted to perform a failure analysis of CFRP anchors [
8]. The effect of elevated temperatures on the microhardness of CFRP was investigated using the Vickers hardness test method, which is widely used for quality control [
9]. On the other hand, non-destructive testing (NDT) plays a key role in monitoring machining processes. Direct monitoring techniques can be employed to verify structural integrity, such as visual inspection [
10], electrical resistance [
11], and infrared thermography with a laser beam [
12]. However, indirect monitoring techniques are preferred today because they are helpful in the online measurement of the machining process responses [
13]. These methods are commonly used for structural health monitoring (SHM) in several knowledge areas, such as bridges in civil engineering [
14], aircrafts in aerospace engineering [
15], and metallic structures in mechanical engineering [
16]. The SHM aims at strategies to identify damage in structures by performing periodic measurements to determine the degradation conditions of components [
15].
In CFRP manufacturing, studies to monitor the process are extremely valuable, since this material is increasingly inserted in structures that do not allow critical failures, such as passenger airplanes and military helicopters [
17]. Several approaches have proposed indirect methods based on SHM and sensor technology for failure detection in CFRP materials, which can be classified as active and passive. In passive detection, it is usual to use acoustic emission (AE) techniques since failures in composite materials produce frequencies that can be detected by AE sensors [
18]. Many studies have been conducted to detect composite delamination based on AE signal processing, such as using counts metric [
19], cumulative energy [
20], frequency analysis based on fast Fourier transform (FFT) [
21], and convolutional neural networks (CNN) [
22]. On the other hand, active methods use piezoelectric transducers that inject controlled signals into the structure, such as the electromechanical impedance method [
17], lamb waves [
23], and guided waves [
24].
The objective of this study is to introduce a novel NDT approach for SHM of CFRP using an acoustic wave generation method that involves launching a metallic sphere onto the surface of a CFRP plate. The proposed method is more cost-effective and requires less complex equipment compared to traditional methods based on AE and electromechanical impedance. Our method can also be used to characterize and evaluate the frequency response of piezoelectric transducers. The method currently used is the pencil lead break (PLB) method, a well-established and widely recognized technique in the literature for generating reproductive acoustic waves [
25]. This paper proposes a method for launching a metallic sphere towards a structure and monitoring the response using a piezoelectric transducer. The launching sphere provides a simple and inexpensive method for generating an impulsive signal as input on the structure. It also delivers higher energy to the structure compared to PLB. Therefore, our method enables achieving greater structural dimensions and avoids variations in the PLB method caused by human hand inaccuracy.
2. State of the Art
2.1. CFRP Composites
CFRP composite materials have been widely used in engineering to manufacture critical components because of their high specific stiffness, high specific strength, superior corrosion resistance, and excellent thermal stability [
26]. In the aircraft industry, an increasing number of components are made from CFRP aiming to reduce the weight of the structure, improve the fuel efficiency, reduce emissions, and enhance load-bearing capacity [
2]. In automotive engineering, CFRP is a suitable material, despite its high cost. It can reduce weight, integrate parts, improve crashworthiness, increase durability and toughness, and provide aesthetic appeal [
27].
Researchers have investigated the effects of CFRP machining parameters on several failures (delamination, matrix defects, fiber cracks, impurities, interface cracks, etc.) by traditional methods (drilling, milling, turning, etc.) and non-traditional methods (water jet machining, abrasive water jet machining, laser machining, electrical discharge machining, ultrasonic machining, electrochemical machining, etc.) [
2].
Table 1 compares some features between CFRC and aluminum, another widely used material in the industry. Aluminum is presented here because it was used as a comparative material in the experiment, as described in
Section 3.
Based on their respective densities, CFRC is found to be significantly lighter than aluminum. Aluminum is a ductile material that can be molded and extruded in several ways. Both CFRC and aluminum are highly resistant to corrosion. Aluminum can provide good mechanical resistance when combined with other materials, forming alloys [
28]. However, aluminum still has less resistance and stiffness compared to CFRC. The cost of manufacturing aluminum is usually lower than that of CFRC because it employs well-known methods, such as casting, machining, and forging, while CFRC requires more complex processes, such as lamination and autoclave curing [
29].
2.2. The PLB Method
The PLB is a well-established method of using pencil-lead breaks as AE sources. It consists of breaking a lead at a specified angle to the material surface under study. The lead break releases energy in the form of an elastic wave that propagates through the entire structure, making it a simple and reliable way to create a broadband signal to study the wave propagation and the acoustic sensor response in the host structure. However, conducting PLB tests with a high degree of repeatability can be challenging in practice [
30].
Several recent studies have used the PLB method to generate acoustic waves. In a study by Yao et al., they decomposed AE excited by PLB on a thin isotropic plate through modal decomposition using a multi-element piezoelectric sensor array. According to the study, the direction of the PLB orientation has an impact on AE modal decomposition [
31]. In a study by Ghadarah and Ayre, the PLB method showed that an AE transducer fully embedded in glass fibre composite presents lower sensitivity than an AE transducer surface embedded [
32]. Mahajan and Banerjee conducted a study in which they located an AE source, which was simulated using PLB as a source, based on a deep learning algorithm [
33].
Almeida et al. investigated the piezoelectric transducers employed in the PLB method and assessed the sensitivity of piezoelectric transducers for damage detection [
25]. Piezoelectric diaphragms are commonly used in audio signaling devices because of their low cost and simple structure. The diaphragm consists of a piezoelectric ceramic disc attached to a brass plate, and it is easily applied to surfaces [
34]. Piezoelectric diaphragms have been used in several monitoring applications, such as the grinding process [
35], water flow rate in a chamber [
36], and partial discharge detection [
37].
2.3. Damage Indices
Previous studies on SHM have used statistical parameters to characterize damage, such as root mean square deviation (RMSD) and the correlation coefficient deviation (CCDM) [
35]. Transducers are connected to a data acquisition (DAQ) system. This system collects mechanical sound waves that propagate through the structure and transfer them to a computer for digital processing. Regions of interest can be selected in the time domain, and frequency bands can be filtered using frequency spectrum analysis. To search for variations in the frequency content that are correlated to the structural conditions, the RMSD and CCDM damage indices can be calculated using equation 1 and equation 2, respectively [
34].
In equation 1 and equation 2, and are the spectral frequency signatures for the healthy (H) structure, at a frequency k, and the damaged (D) structure, respectively, and they are computed in the range of frequency selected between ωI and ωF. In equation 2, and are the mean values of the signatures.
3. Material and Methods
The method proposed in this study is based on the propagation of acoustic emission waves, which are generated by the impact of the sphere on the structure. The waves change based on material properties and existing damages. To validate the effectiveness of the proposed method, two different kinds of experimental tests based on sphere launching were performed on a CFRP structure. The first test consists of performing consecutive launches at a specific point on the plate surface, at different heights between each test. The second test consists of performing launches on the plate surface at the same point, simulating structural damage by attaching metallic nuts to the plate surface under study. Similar tests were conducted on the same-sized aluminum plate for comparative purposes to evaluate the proposed method for different materials, expanding its contributions. The PLB method was also employed in both materials to assess the structure conditions for comparative analysis
3.1. Experimental Setup
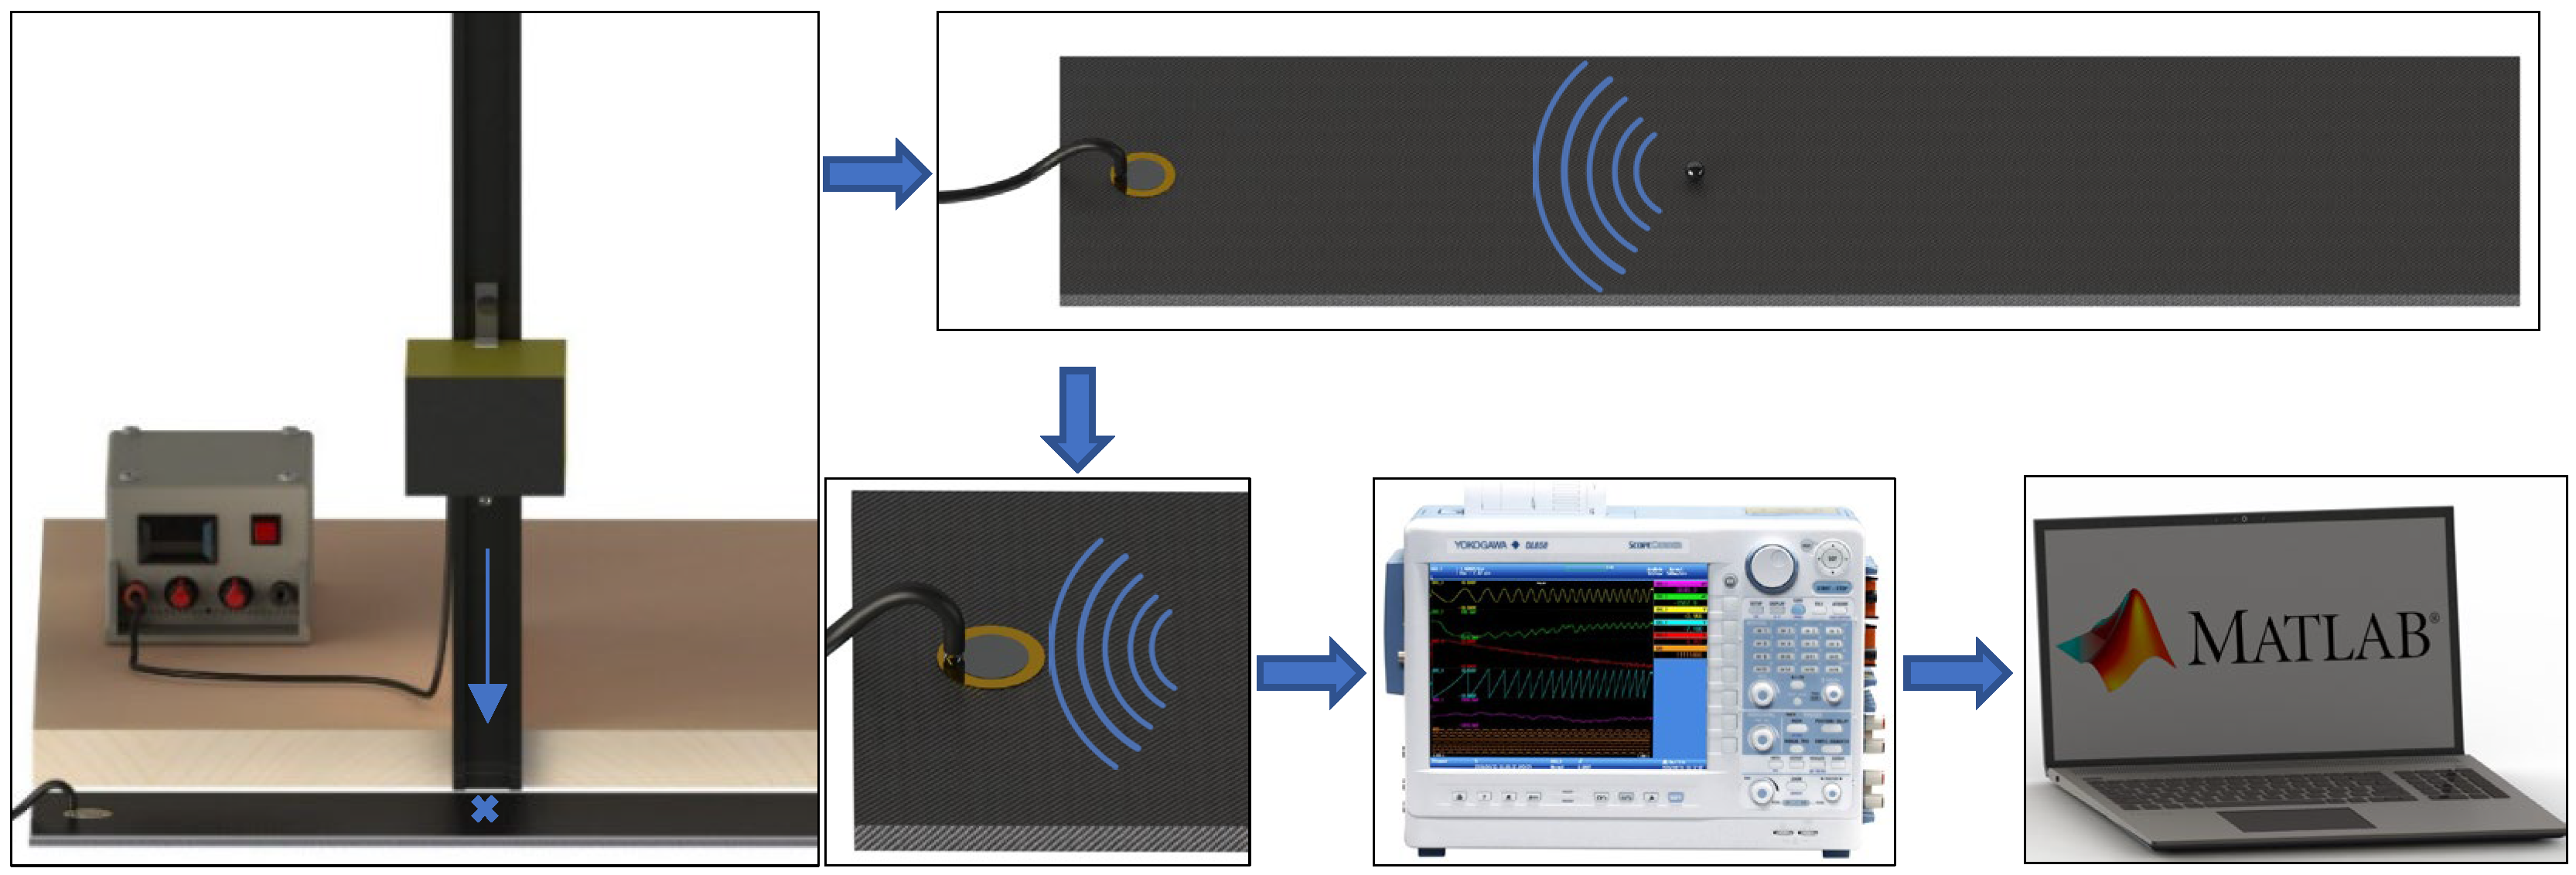
A workbench schematic diagram of the launching sphere method is presented in
Figure 1. One notes that the sphere collision with the plate generates acoustic waves on the material. The signals are collected by the piezoelectric transducer, which is connected to an oscilloscope, and digitally processed on the MATLAB
® software.
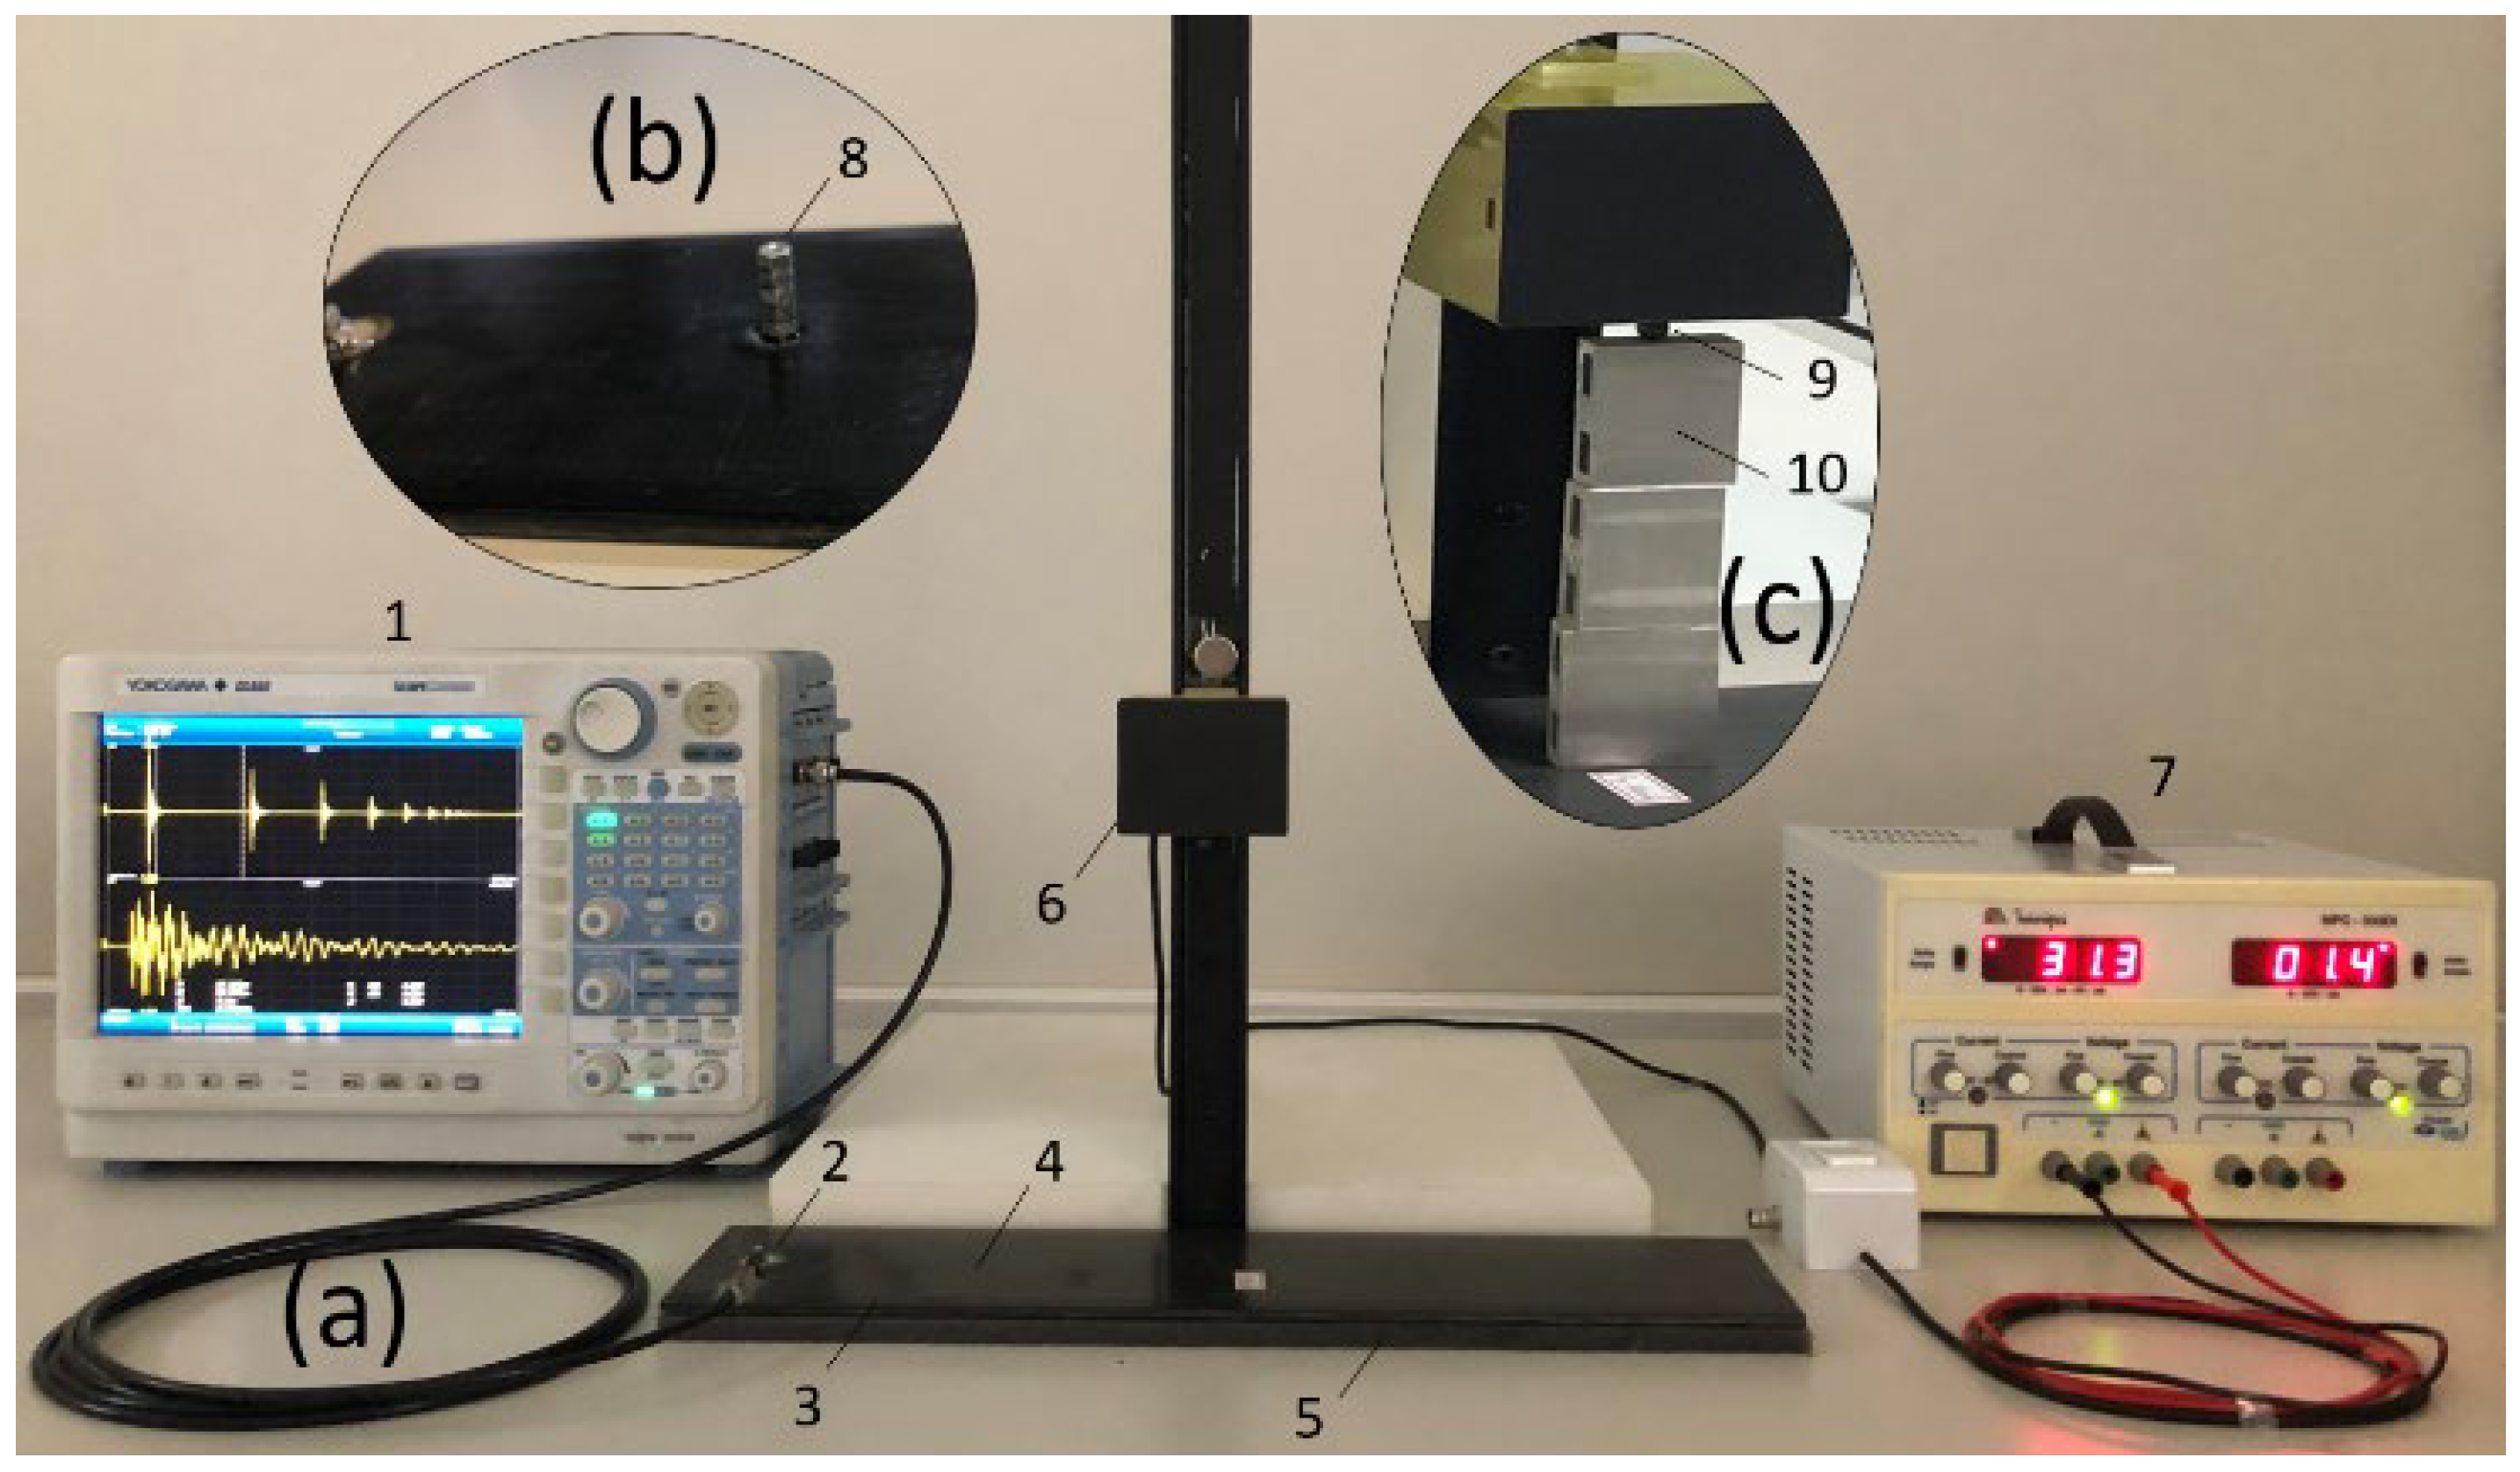
The experimental workbench is shown in
Figure 2. To conduct the experiments, a 19.9 mm diameter piezoelectric diaphragm was attached at 25 mm from the edge of a CFRP plate with 448 × 106.3 × 5 mm dimensions and 391.46 ± 1.03 g mass. The CFRP plate was the same one used in [
38], the EXP-C, which has 24 layers of 0/90° bidirectional plain-weave fiber fabric (HexcelTM) as illustrated in (2) in
Figure 2. The point where the metallic nuts were attached for damage simulation was 105 mm from the piezoelectric diaphragm, as in (4) in
Figure 2. The hexagonal metallic nuts have dimensions of 6.2 mm diameter and a mass of 0.54 ± 0.02 g, as in (8) in
Figure 2. Underneath the CFRP plate, a foam sheet of the same dimensions was arranged to avoid any unwanted external vibration, as shown in (5) in
Figure 2. A thin layer of ethyl cyanoacrylate-based glue was used to fix the piezoelectric transducer. The steel sphere used in the launches, which comes from a bearing, has a 6.3 mm diameter and 1.046 ± 0.01 g mass and is illustrated in (9) in
Figure 2. The selection of this sphere was empirical, and the choice was based on its availability, reduced size and weight, and the reduced potential to cause damage on the surfaces of both materials when launched at a distance of up to 500 mm. To suspend the sphere over the plate and perform the launches, it was required to use a device consisting of a wooden base, a metal rail, and an electromagnet attached to the rail, as illustrated in (6) in
Figure 2. The launch base of the sphere, equipped with an electromagnet, is coupled to the rail of 540 mm in height to allow the adjustment of the launch height. Once the height is adjusted, a permanent magnet fixes the launch base at the desired height. To control the launch height, five equal aluminum blocks 38 mm high each were used as templates, as shown in (10) in
Figure 2. An adjustable voltage source is used to power the electromagnet, as in (7) in
Figure 2. The acquired signals were collected and stored by an oscilloscope model DL850 from Yokogawa
®, as in (1) in
Figure 2, at a sampling frequency of 10 MHz.
After the acquisition, all data were transferred to a computer, where the signals were digitally processed using MATLAB® software. The digital signal processing procedure initially consisted of segmenting each signal to extract only the signal related to the first touch of the sphere on the surface of the structure, eliminating the parts of the signal regarding the sphere rebounds. The frequency spectrum is computed, analyzed, and compared to search for variations in the frequency content correlated to the structural conditions. Subsequently, RMSD and CCDM damage indices are computed.
To assure the effectiveness of the proposed method and allow comparisons, the tests were repeated under the same conditions for an aluminum structure with the same dimensions as the CFRP plate, but with 643.4 ± 0.2 g mass, as illustrated in (3) in
Figure 2. The piezoelectric diaphragm was also fixed at 25 mm from the edge of the aluminum plate.
3.2. PLB Tests
The PLB tests were conducted by breaking a 0.5 mm thick lead at a 45° angle to the CFRP plate surface at two positions, one at 70 mm and the other at 210 mm from the diaphragm. Five repetitions were performed in each defined position, and then the correlation coefficient was calculated for each position, as seen in [
39], to evaluate the repeatability and feasibility of the repetitions.
Similarly, to the CFRP structure, PLB tests were conducted on an aluminum plate surface. For this purpose, three repetitions were performed at 210 mm from the piezoelectric diaphragm. The distance was chosen based on the results from the CFRP tests and the correlation coefficients were calculated to evaluate the repeatability between the tests.
3.3. Plastic Deformation Evaluation in Sphere Launch Tests
Preceding the sphere launch tests, tests were conducted to evaluate CFRP and aluminum plastic deformation caused by the metal sphere impact on the structure's surface. For this purpose, a series of launches were performed at different heights. Through a digital microscope from Inskam, 30 W, and 1000x magnification, it was possible to obtain detailed images of the structures' conditions before and after the launches.
For the CFRP tests, ten consecutive launches were performed at the same point of the plate surface, using a 6.3 mm diameter sphere to evaluate whether there would be an onset of marks or cracks on the surface. The tests were conducted at three launch heights (114 mm, 152 mm, and 190 mm).
For the aluminum tests, two metal spheres were used. One sphere has 3.9 mm in diameter and 1.046 ± 0.006 g mass. The other one was the same 6.3 mm diameter sphere used previously. The aluminum tests consisted of launching each sphere from three different heights (114 mm, 152 mm, and 190 mm). The reason for using two spheres for the aluminum was due to marks visually observed and caused by the impact of the 6.3 mm sphere in the preliminary tests.
3.4. CFRP Launch Tests for Height Variation Study
Each test consisted of launching a 6.3 mm diameter and 1.046 ± 0.006 g metal sphere on a CFRP plate surface at 210 mm from the piezoelectric transducer, based on the results of
Section 3.2. Five aluminum blocks, 38 mm long each, were used as templates to ensure the exact launch height for each test. Thus, initially, there were five launching heights: 38 mm, 76 mm, 114 mm, 152 mm, and 190 mm. A sixth height of 490 mm was subsequently defined based on the maximum size of the metallic rail. Therefore, for each of the six defined heights, five launches were performed on the CFRP surface. Then the correlation coefficient was calculated to verify the similarity between the launches' repetitions. It is worth mentioning that all tests described in this section were conducted at a constant temperature of 25 ± 2 ºC. The signals were segmented to extract only the signal generated from the first touch of the sphere on the CFRP surface, thus removing the signals obtained from the rebounds. The frequency spectra were computed and compared to verify variations as the launch height was changed. An average of the five spectra obtained for each height was calculated to simplify the visualization and analysis.
3.5. Aluminum Launch Tests to Verify the Effect of Sphere Damage
Preliminary tests have shown that the sphere launches on the aluminum have generated visible marks (possible damage), which could compromise the repeatability of the tests for this material. Thus, launch tests were performed on aluminum to verify this fact, which consisted of launching the 6.3-mm diameter metallic sphere seven consecutive times at a 114-mm height. The sphere impact location on the aluminum surface was defined at 210 mm from the piezoelectric diaphragm based on the results in
Section 3.2. The height of 114 mm was chosen based on the highest correlation and lowest standard deviation obtained for the launches in CFRP. The tests were conducted at a constant temperature of 25 ± 2 °C. Then, the correlation coefficient between the first launch (initial mark of the sphere) and the following launches was calculated. Finally, the signal spectra were computed and analyzed.
3.6. SHM Tests
Considering the studies previously conducted, sphere launch tests were performed on both CFRP and aluminum plates, simulating structural damage by adding mass to their surfaces. For this purpose, five metallic nuts were gradually added to the surface of both plates by an ethyl cyanoacrylate-based adhesive. Before the mass addition, five launches were performed to characterize the baseline for both plates. After each mass addition, five more launches were performed on the same point at 210 mm from the piezoelectric transducer fixed at 25 mm from the edge of both plates. The metallic nuts were attached and stacked one by one at 105 mm from the transducer. Similarly, the PLB tests were conducted on the same structures of CFRP and aluminum by breaking the pencil lead at the same point where the sphere was launched. Five repetitions were also performed for the baseline and five metallic nuts of the same specifications were gradually added to the surfaces. The PLB tests in this step of methodology were meant to be compared to the launch tests regarding the detection of damage to the structures.
4. Results and Discussion
This section will present all the results and discussions from the experiments described in the previous section.
4.1. SHM Tests
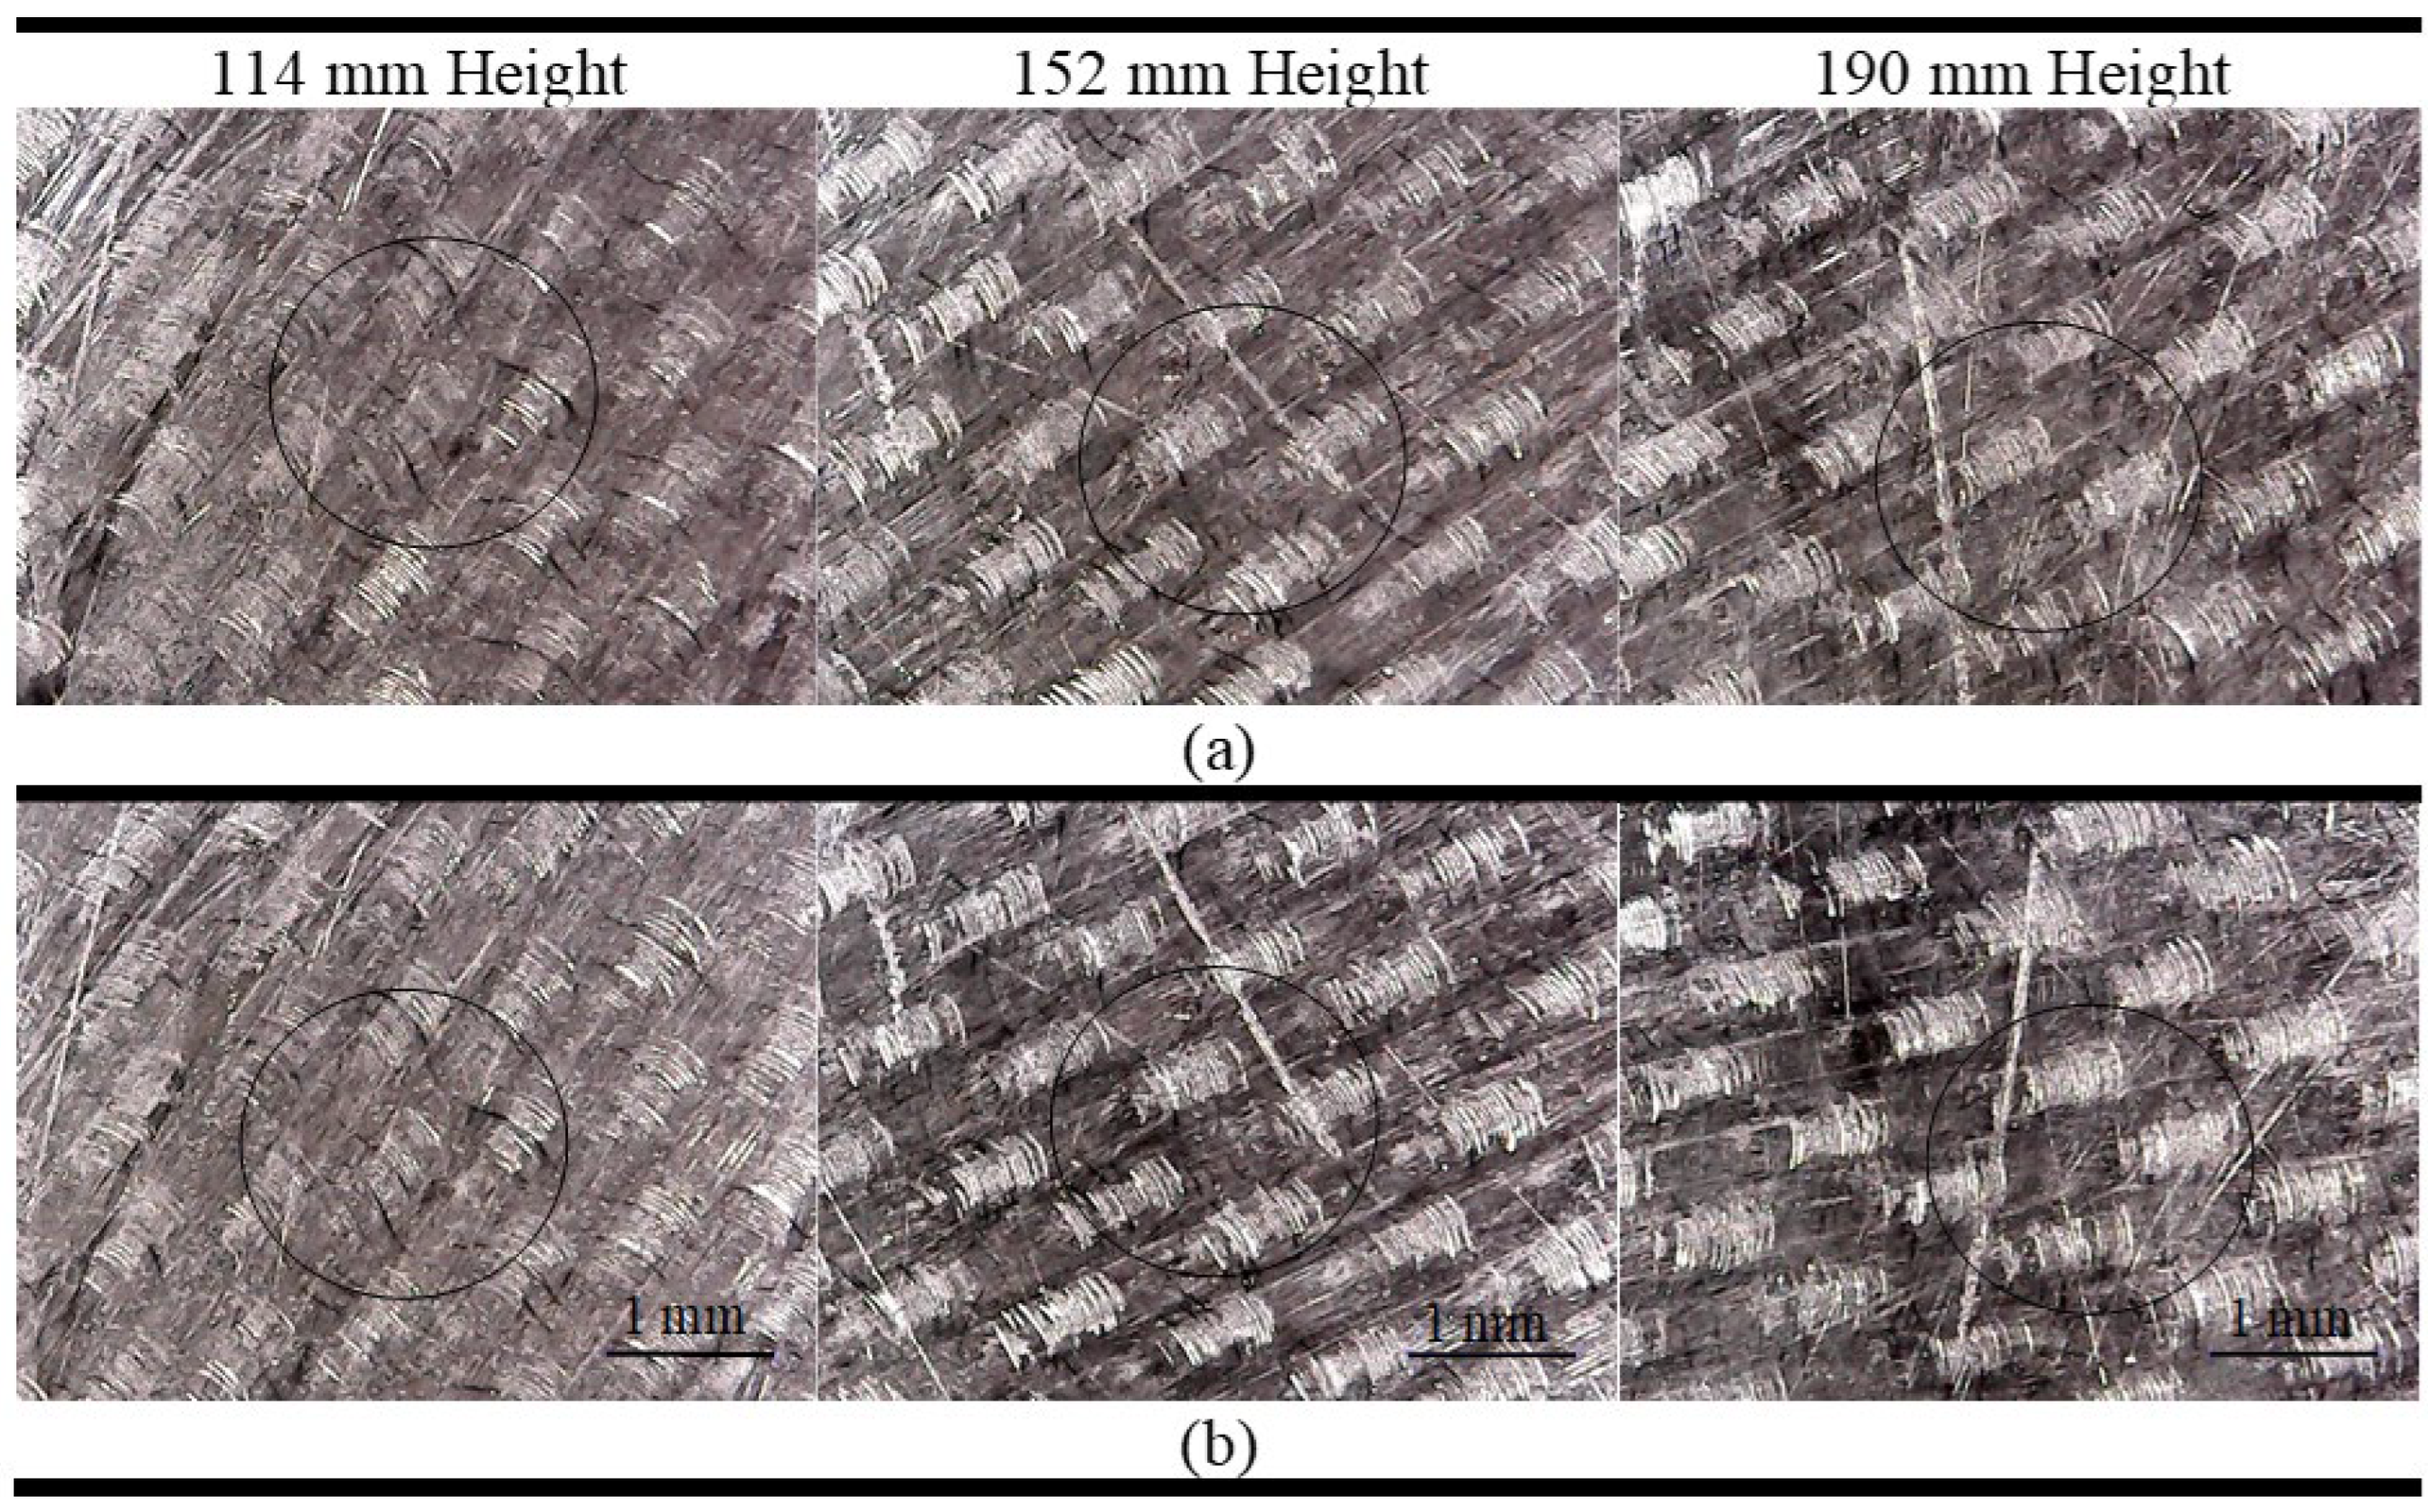
Figure 3 shows the microscopic images obtained for CFRP before (a) and after (b) the sphere impact for three launching heights. It can be observed in the circled areas where the impacts occurred that there is no apparent damage at the tested heights.
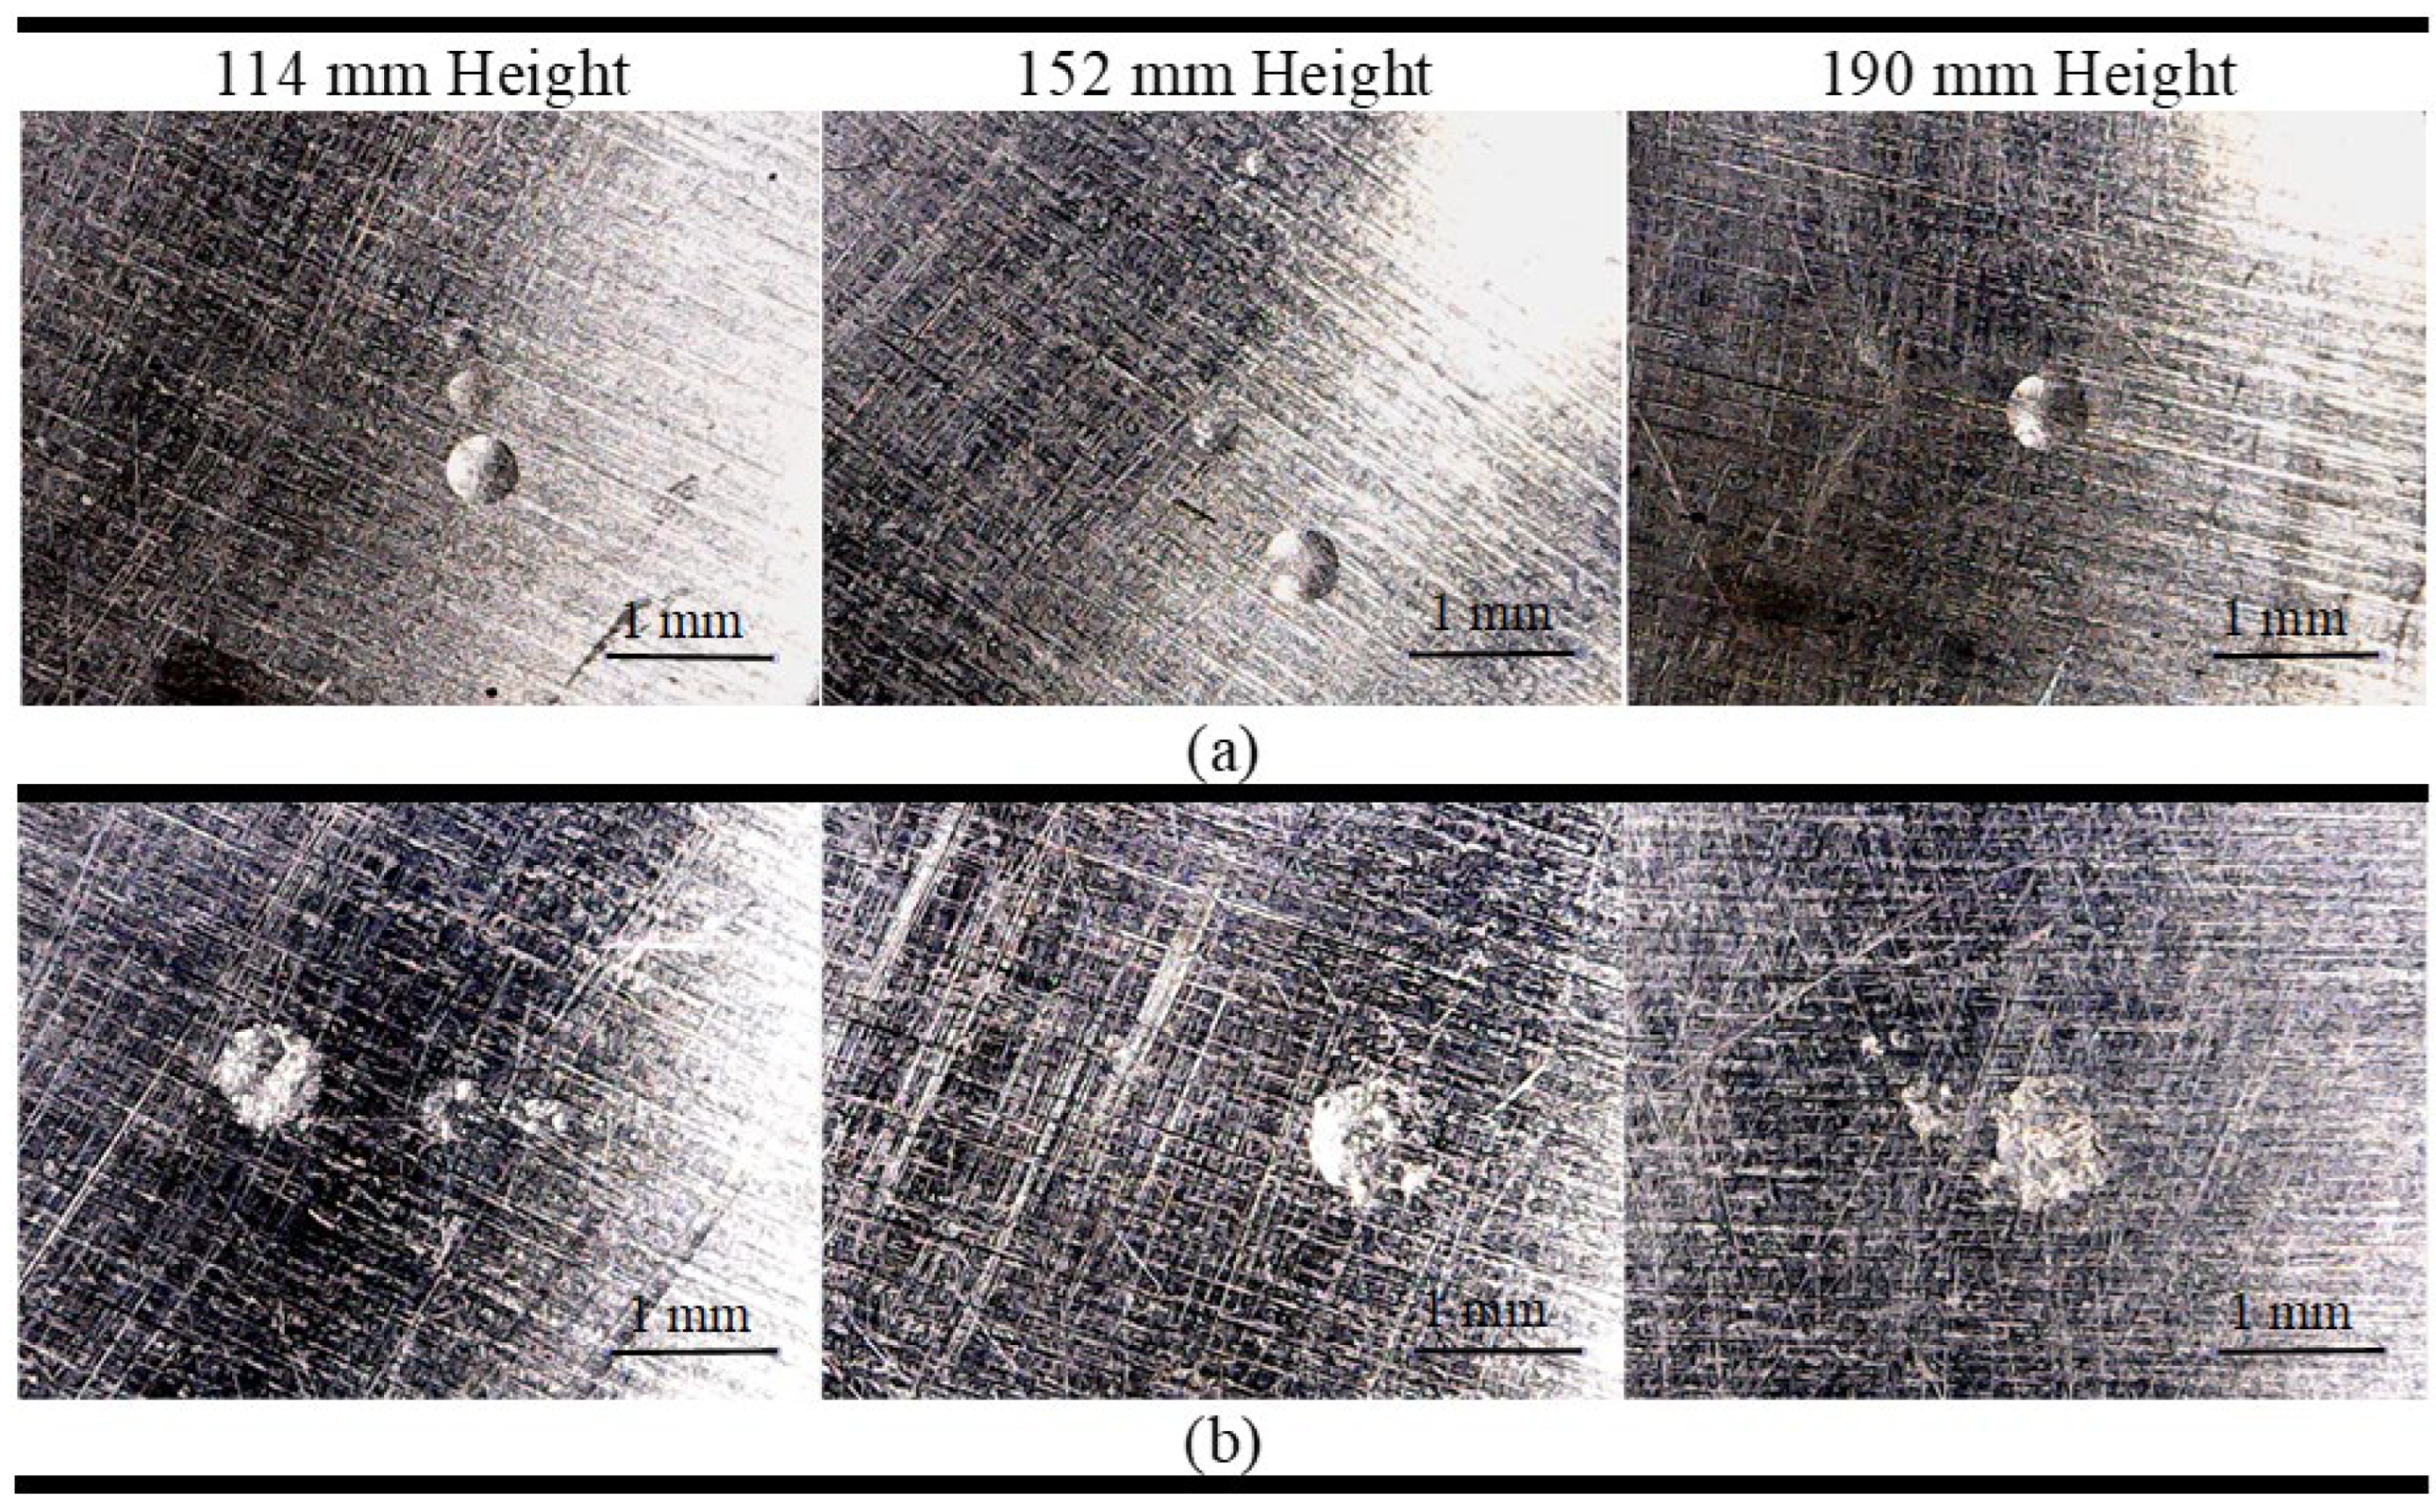
The microscopic images obtained for the aluminum are shown in
Figure 4. In the images, it is evident the marks resulting from the sphere's impact on the aluminum plate surface after the first launch. The 3.9 mm sphere caused circular damage of about 0.5 mm diameter, while the 6.3 mm sphere caused similar damage of about 0.8 mm diameter. However, it is seen that the damage caused by the 3.9 mm sphere is deeper. The smaller marks around the impact area are due to the spheres rebounding off the plate surface.
4.2. Results from PLB Tests on CFRP
Table 2 shows the correlation coefficients between the repetitions obtained for the time domain signals from the PLB tests on the CFRP. It is observed that the coefficient for both positions is close to 93% with low standard deviations between the repetitions, which demonstrates good repeatability between the tests. Position 2 was chosen in this work due to the greater easiness of using the sphere launching device.
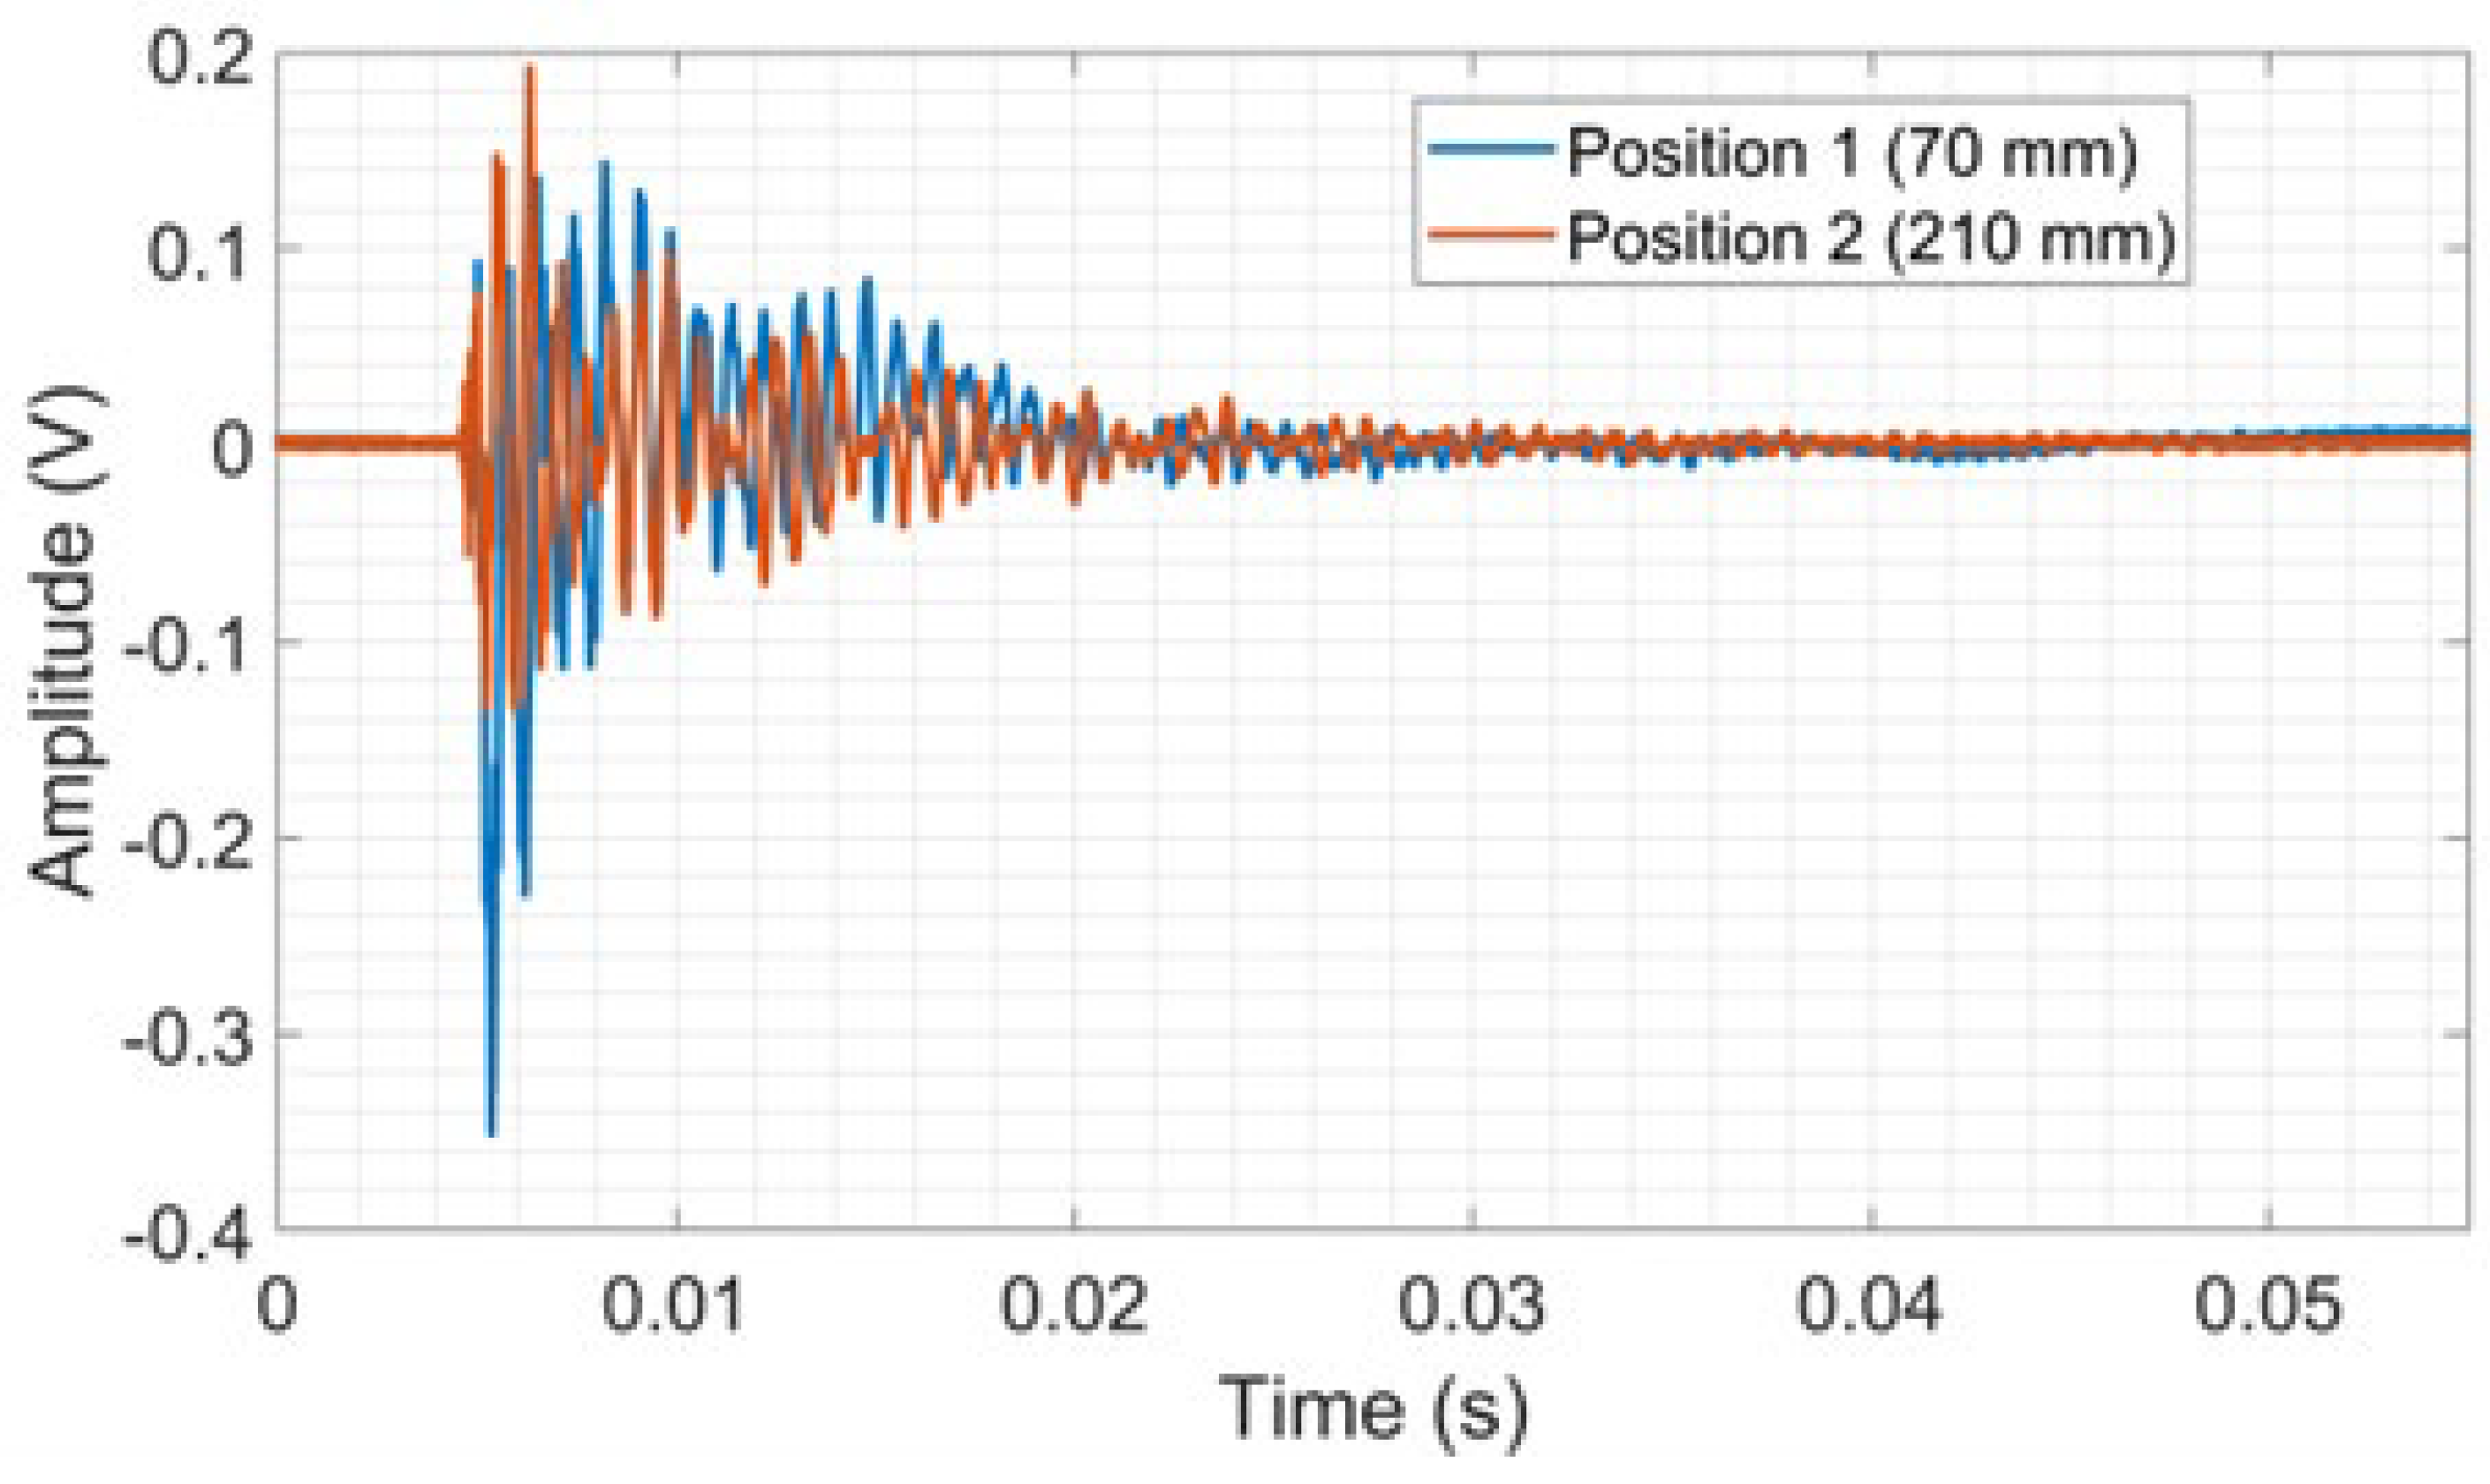
Figure 5 shows the raw signal of repetition 1.
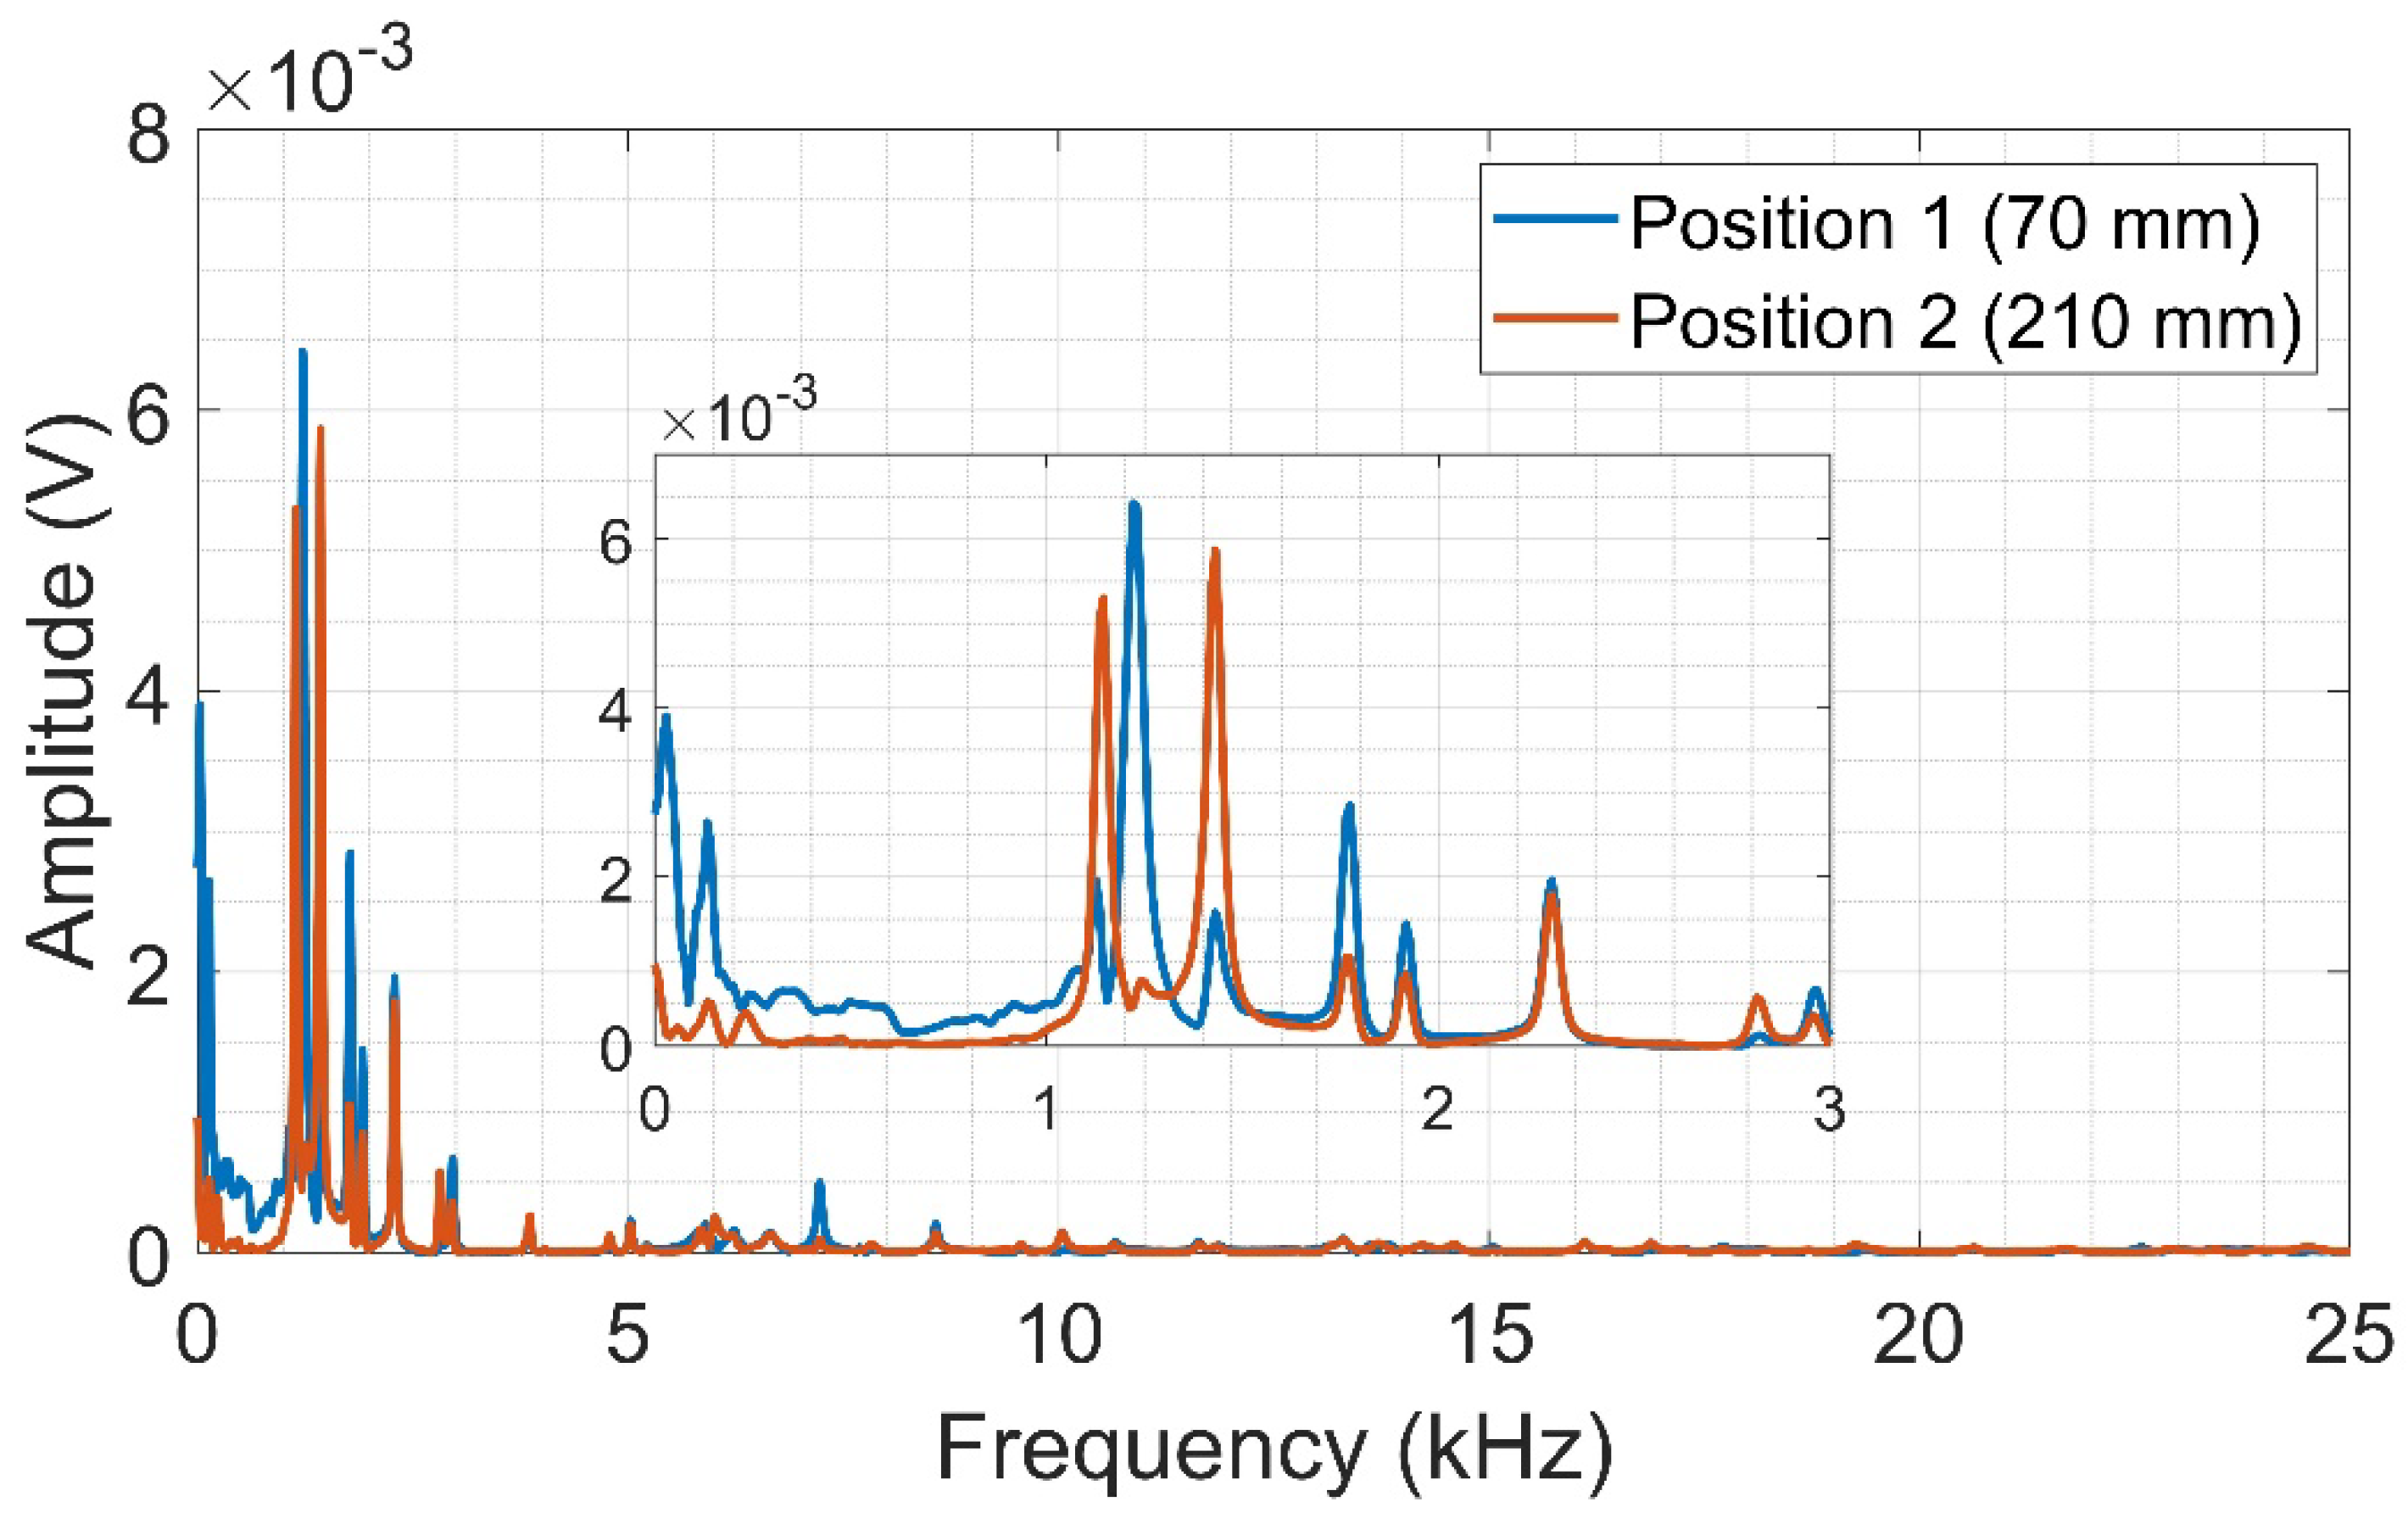
Figure 6 shows the average frequency spectra. The amplitudes vary based on the test location, alternating between the lead break positions along the spectrum. In certain ranges, the amplitudes are higher for position 1 (70 mm), as demonstrated by the amplification of the 0 to 3 kHz band in
Figure 6. Spectral activity is observable up to about 25 kHz, especially in the range of 0 to 10 kHz, where amplitudes are higher. The results showed that the piezoelectric transducer and CFRP assembly are sensitive to the impact generated by the lead breaking on the plate surface. It is worth mentioning that CFRP is a heterogeneous and anisotropic material, with much lower density than metals, providing that the dispersive and dominant flexural out-of-plane Lamb waves easily travel on its surface. Furthermore, acoustic waves propagating in a fiber-reinforced composite are subject to scattering and attenuation, even though the whole system is perfectly elastic. This is due to the multiple dispersion of incident waves through the randomly distributed composite fibers [
40,
41].
4.3. Results from PLB Tests on Aluminum
The correlation coefficients between the PLB tests (repetitions) on aluminum are shown in
Table 3. It is observed that the values are extremely high, demonstrating great repeatability for this material.
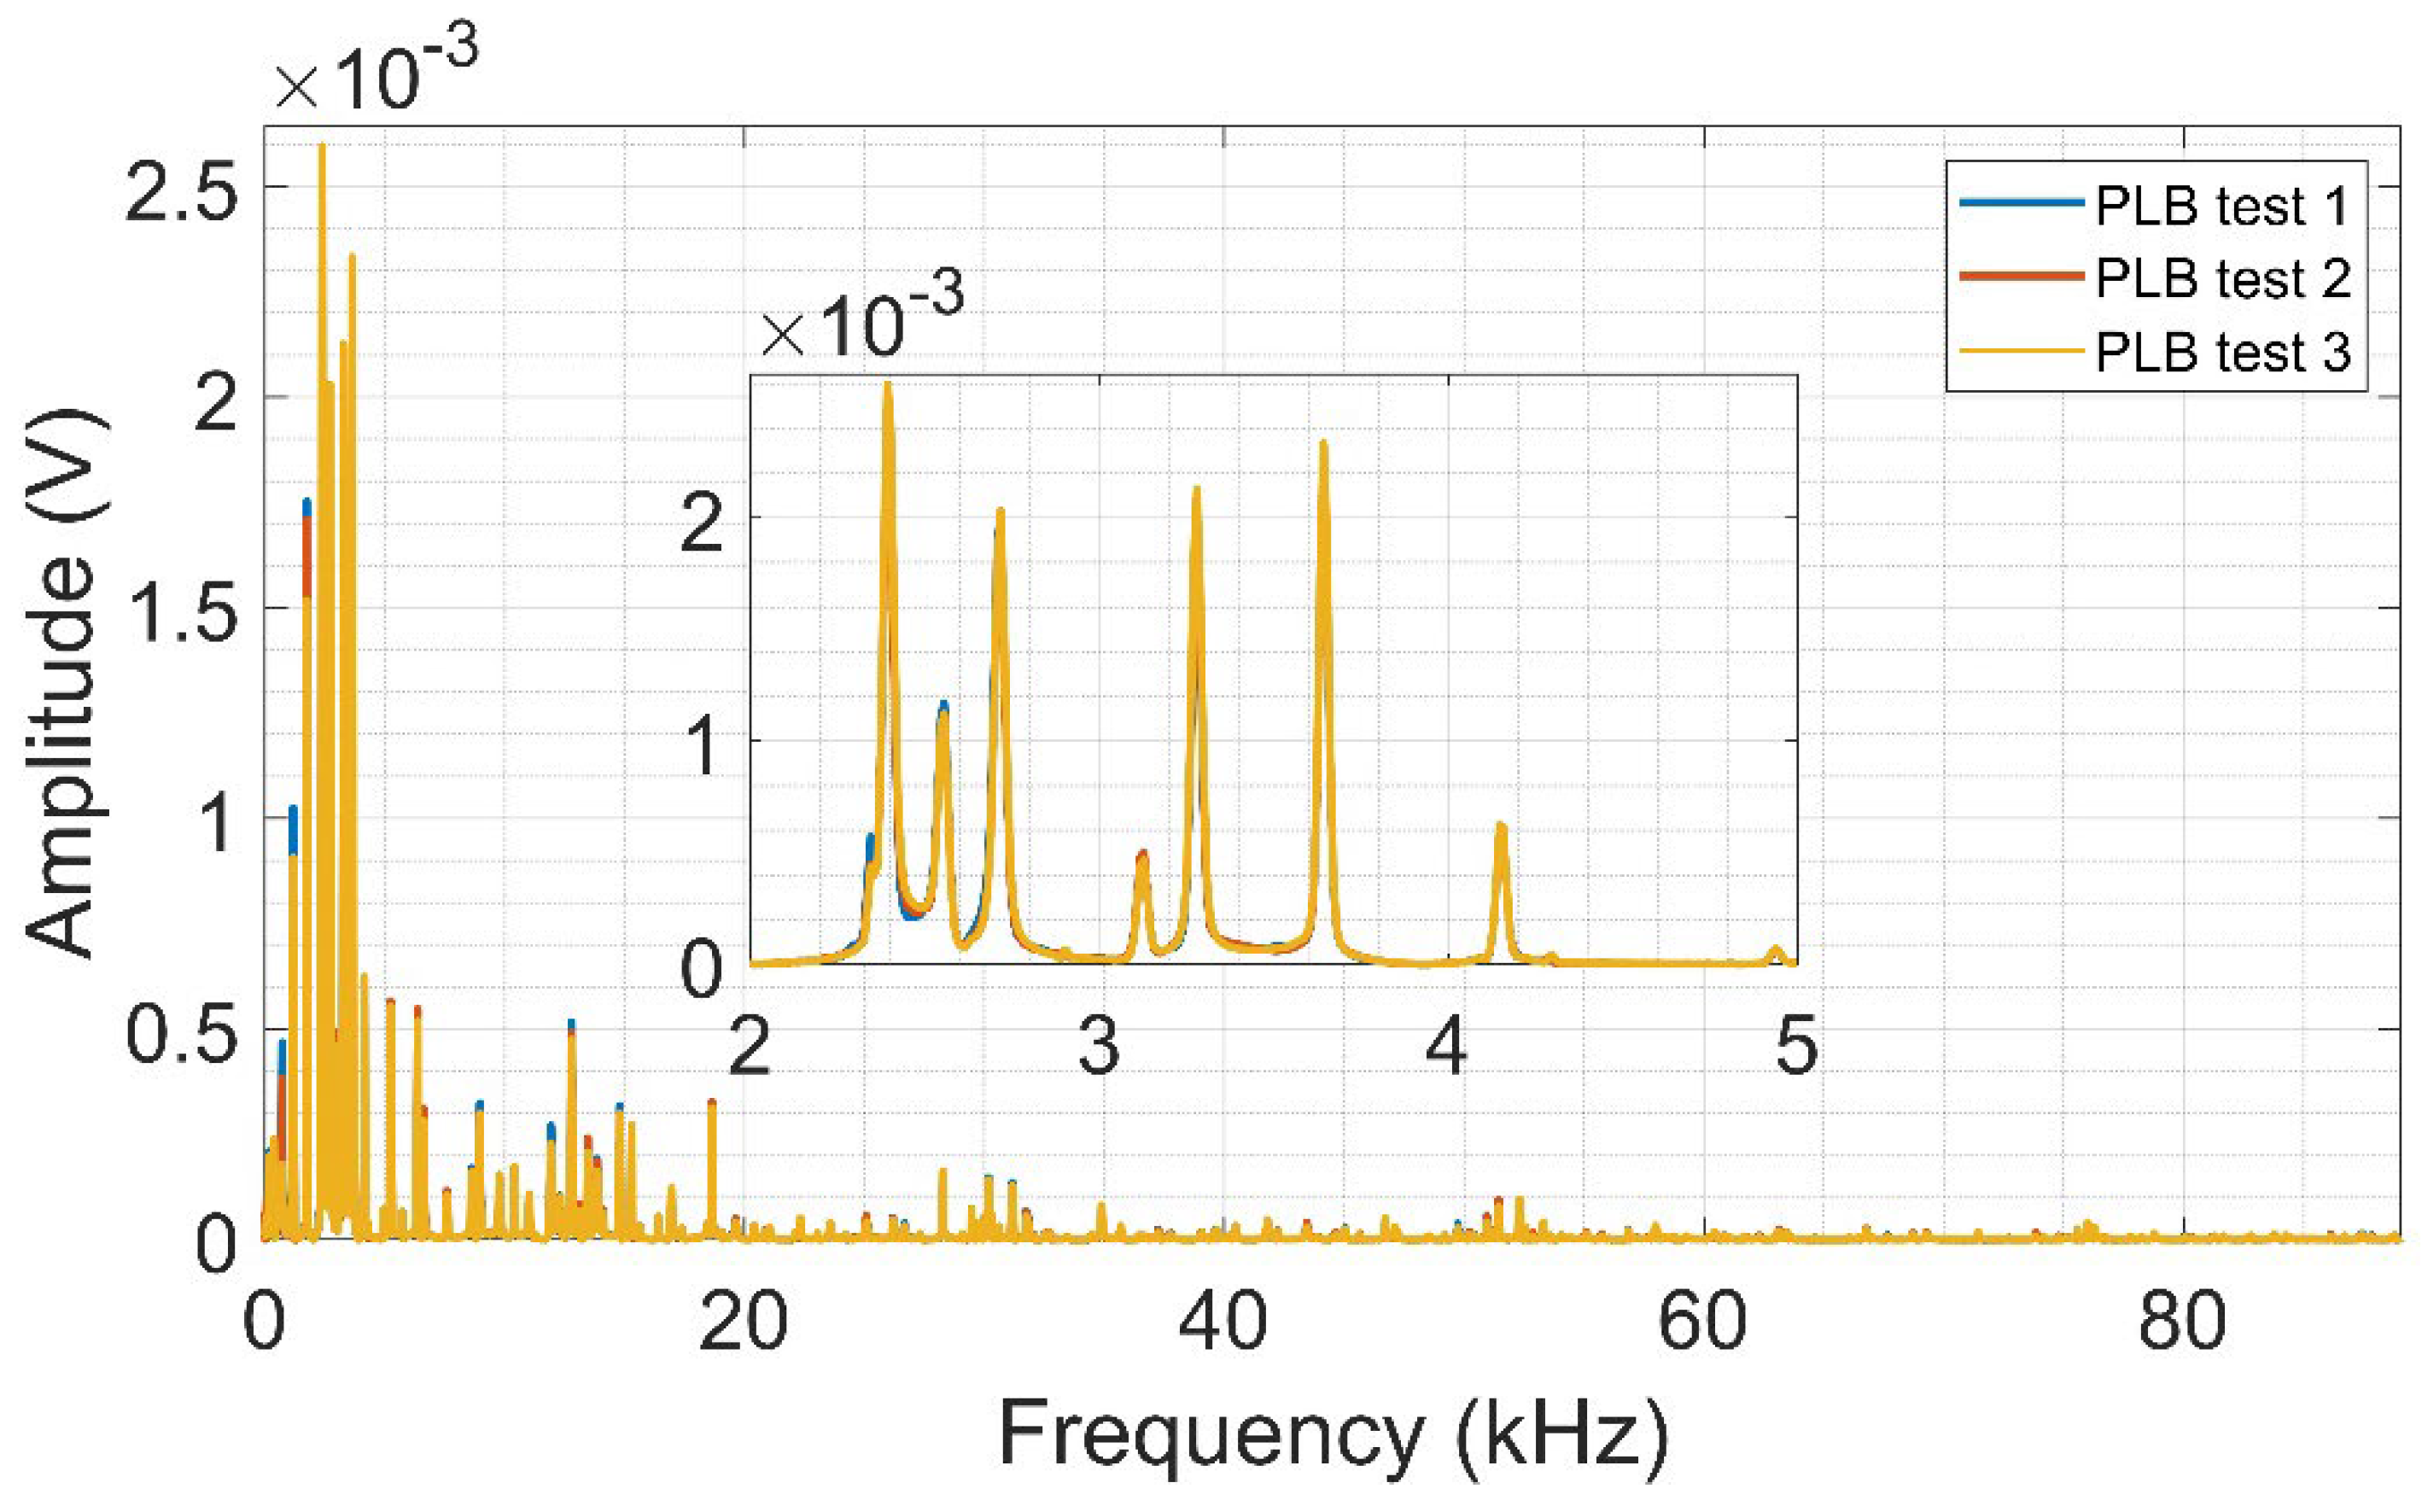
The spectra for each PLB test are shown in
Figure 7. It is possible to notice wider frequency responses for aluminum when compared to CFRP but with lower amplitudes.
The aluminum density is higher than CFRP, and therefore the out-of-plane dislocations of flexural mode are smaller at the surface, as those waves are dispersive with velocities changing with frequency, resulting in lower amplitudes of the acoustic signal [
41]. It is worth mentioning that the tests (lead breaking) on both plates were conducted at the same distance from the transducer, thus allowing a comparison of acoustic wave propagation in these materials.
4.4. Results from CFRP Launch Tests
Table 4 shows the correlation coefficient values between the repetitions for each launch test height for CFRP.
The correlation coefficients were calculated to evaluate the repeatability of the proposed method for acoustic wave generation and to define the best launch height. The mean and standard deviation of all possible combinations were computed for the five launches performed at each height. Notably, the correlation coefficient for all launch heights was greater than 99%, which shows the high repeatability of the method. However, the highest correlation value and the lowest standard deviation were obtained for the 114 mm height. It is worth mentioning that this height allows quick and easy handling of the metallic sphere without taking the risk of accidentally moving the plate or the electromagnet between launches.
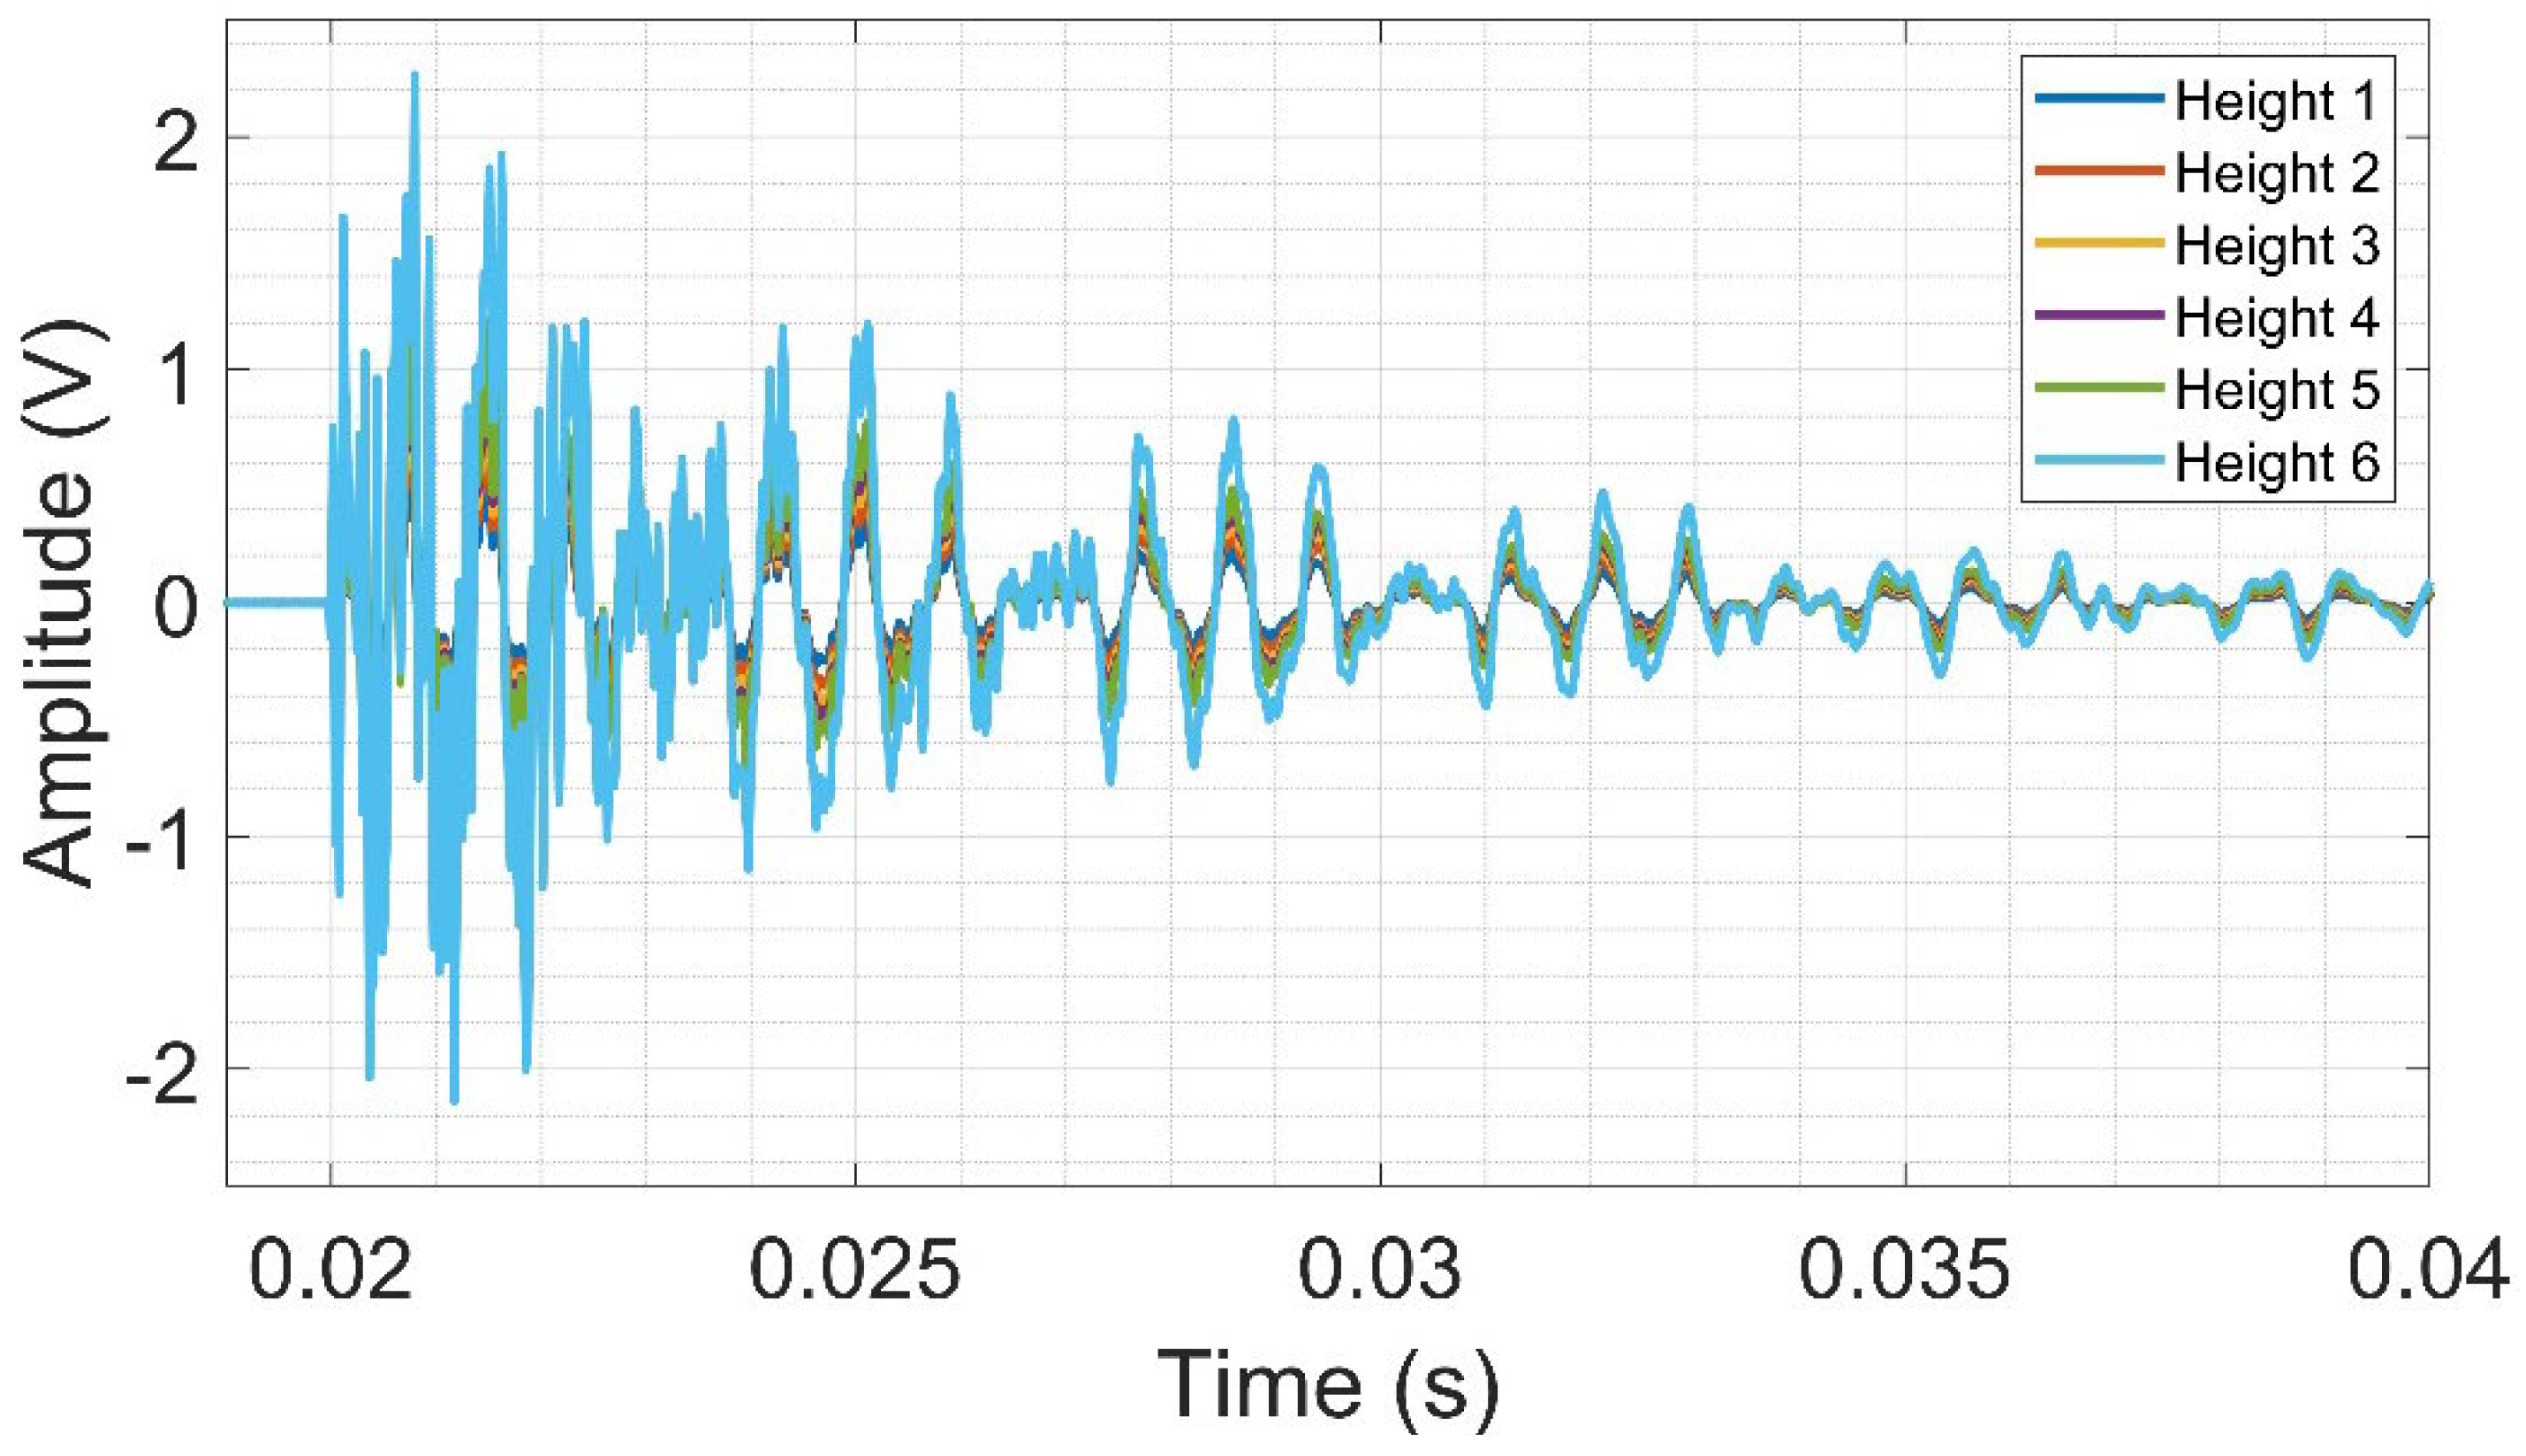
The time domain raw signals were segmented to extract only the first sphere touch on the CFRP surface. The analysis of the raw signal obtained from the sphere launch tests on CFRP reveals that the highest amplitudes presented are obtained from higher launch heights, as seen in
Figure 8.
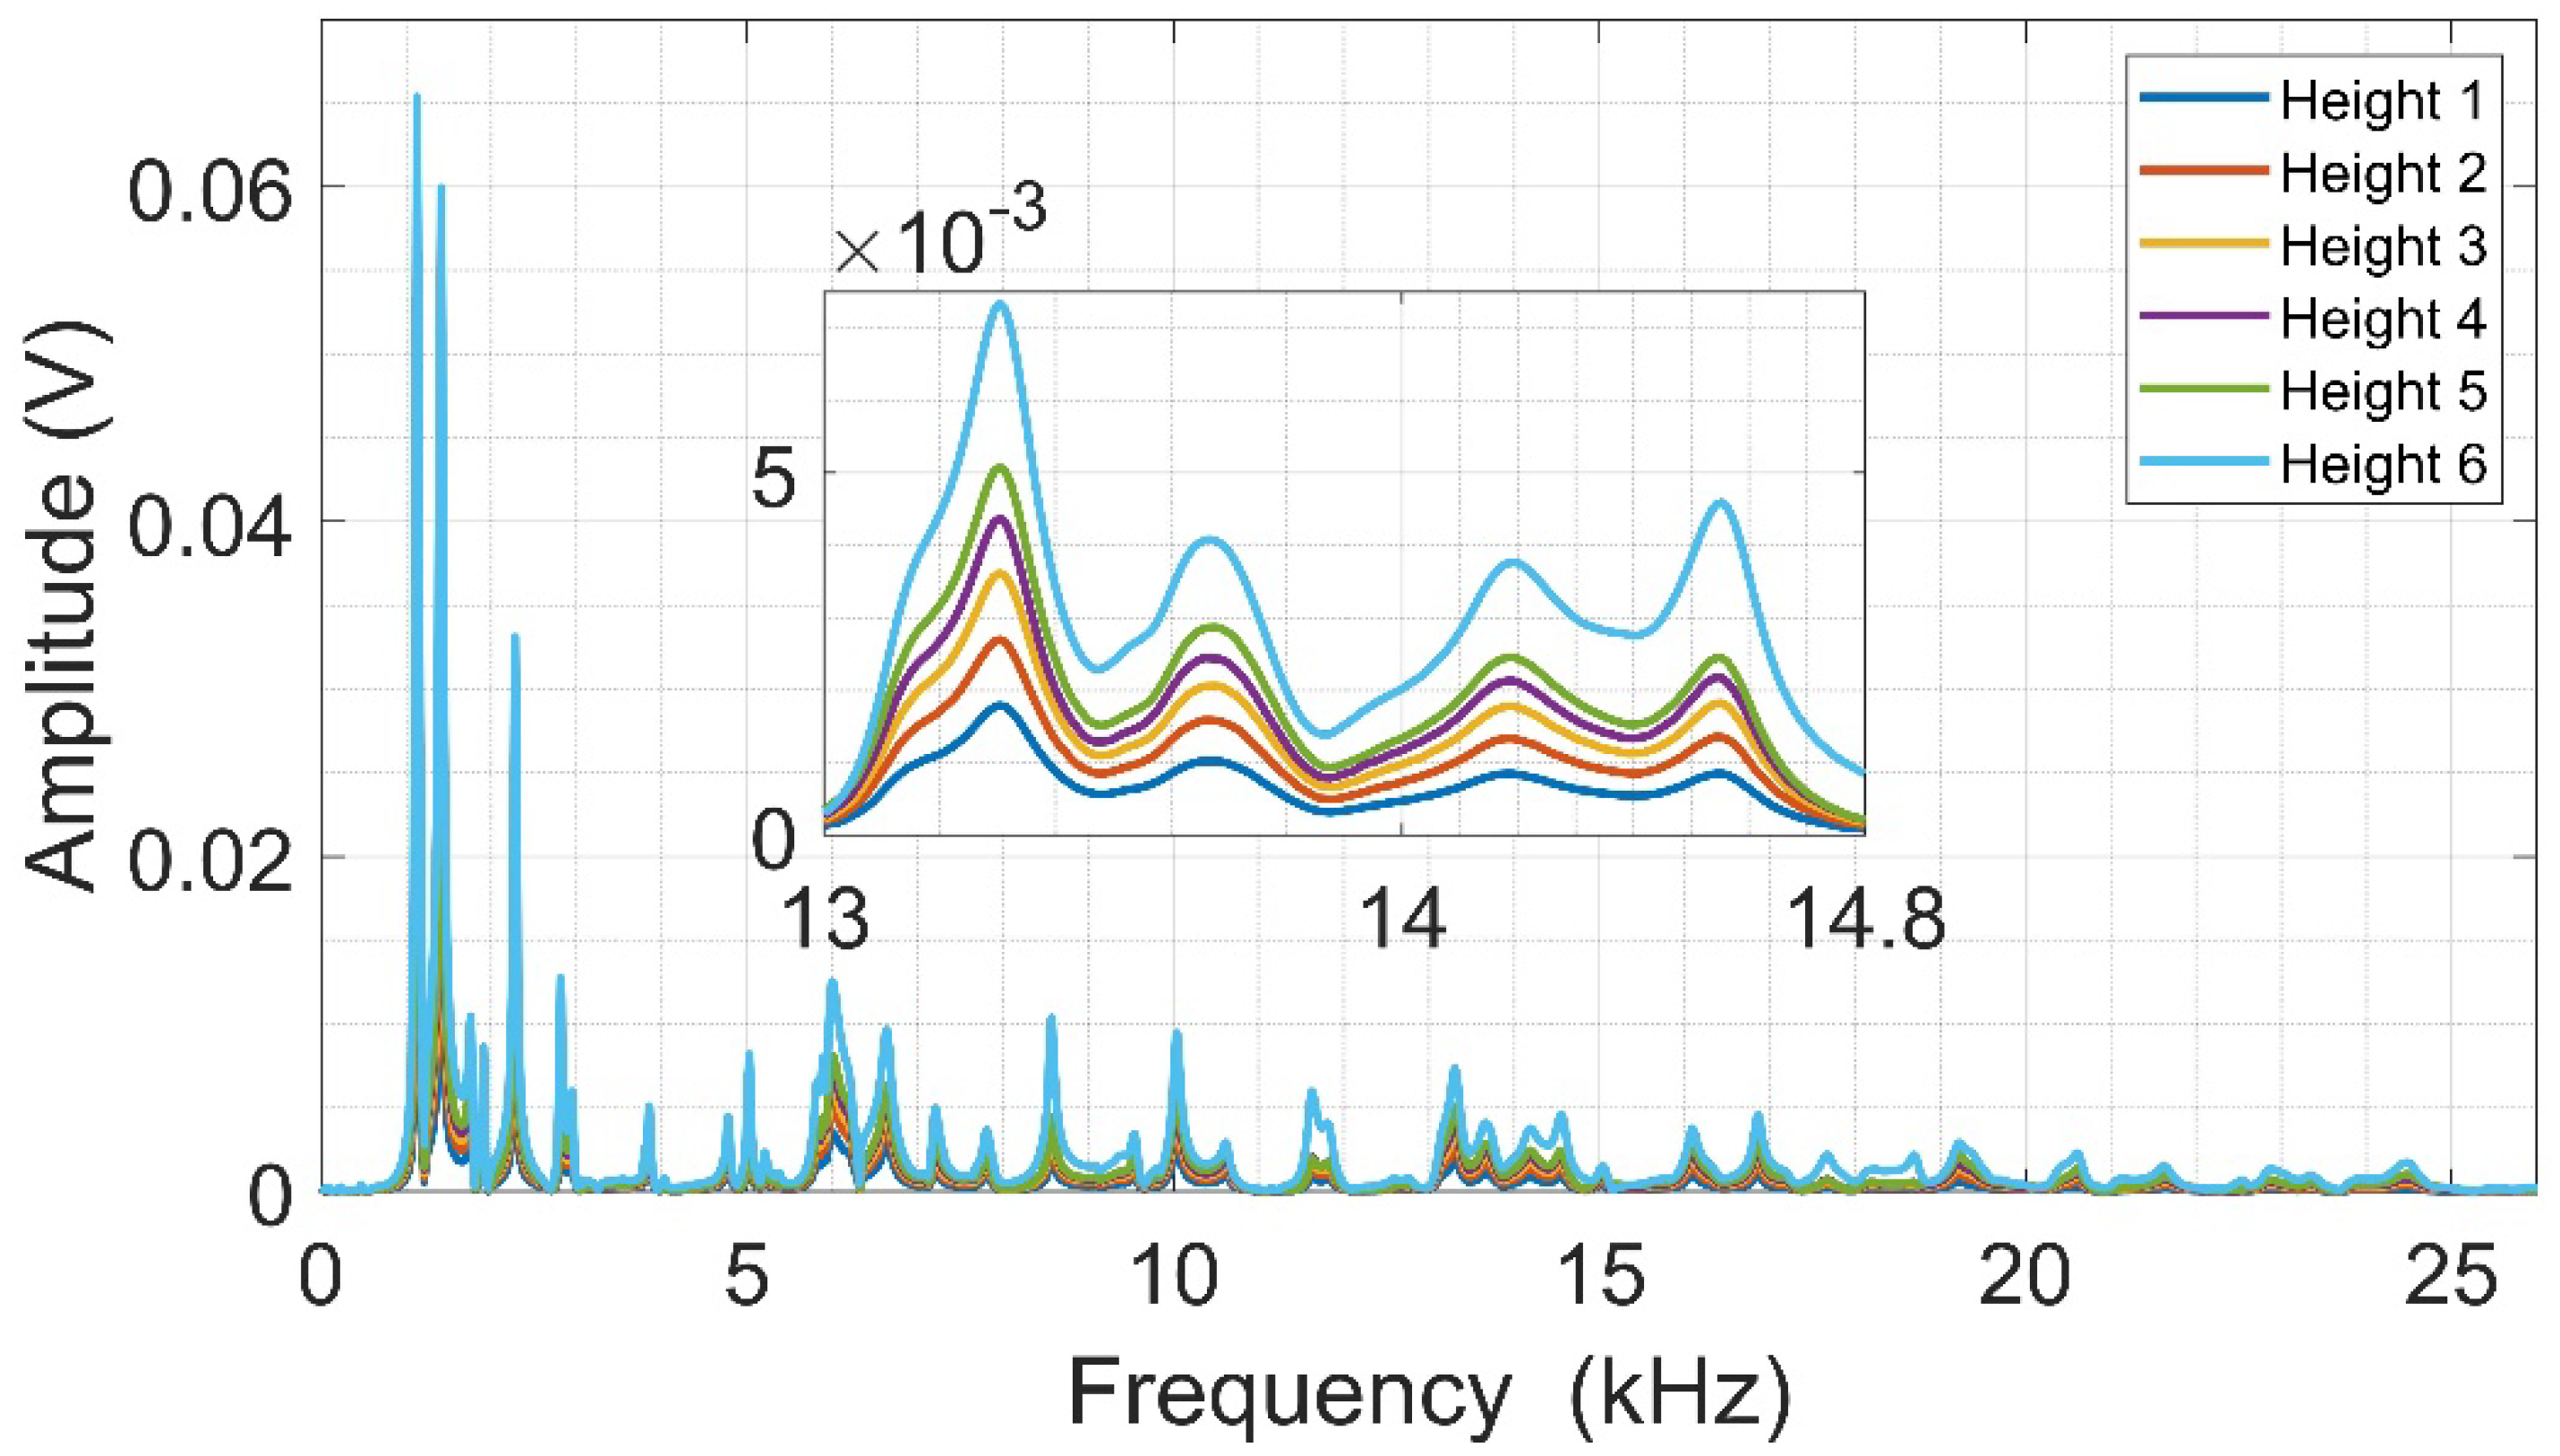
Figure 9 presents the frequency spectra from the raw acoustic signals acquired from the sphere launch tests performed on the CFRP structure. As can be seen, the signal amplitude varies with the launch height, as was observed in the raw signal. The frequency range between 13 kHz and 14.8 kHz, illustrated in
Figure 9, shows in detail the amplitude variation caused by the launch height variation, i.e., the higher the launch height, the higher the amplitudes obtained. This behavior is almost repeated across the entire spectrum, where spectral activity is detected up to about 25 kHz.
4.5. Results from Aluminum Launch Tests
From the raw signals of the seven launches on the aluminum, the correlation coefficient was computed between the first launch (baseline) and the other six launches.
Table 5 shows only three of the computed coefficients, being these values higher than 99%, demonstrating that the deformation caused by the contact between the sphere and the plate surface, as observed in
Section 4.1,
Figure 4, does not affect the acquired signals, even if the tests are performed several times at the same point. This confirms the high similarity between the signals from several launches performed at the same surface position.
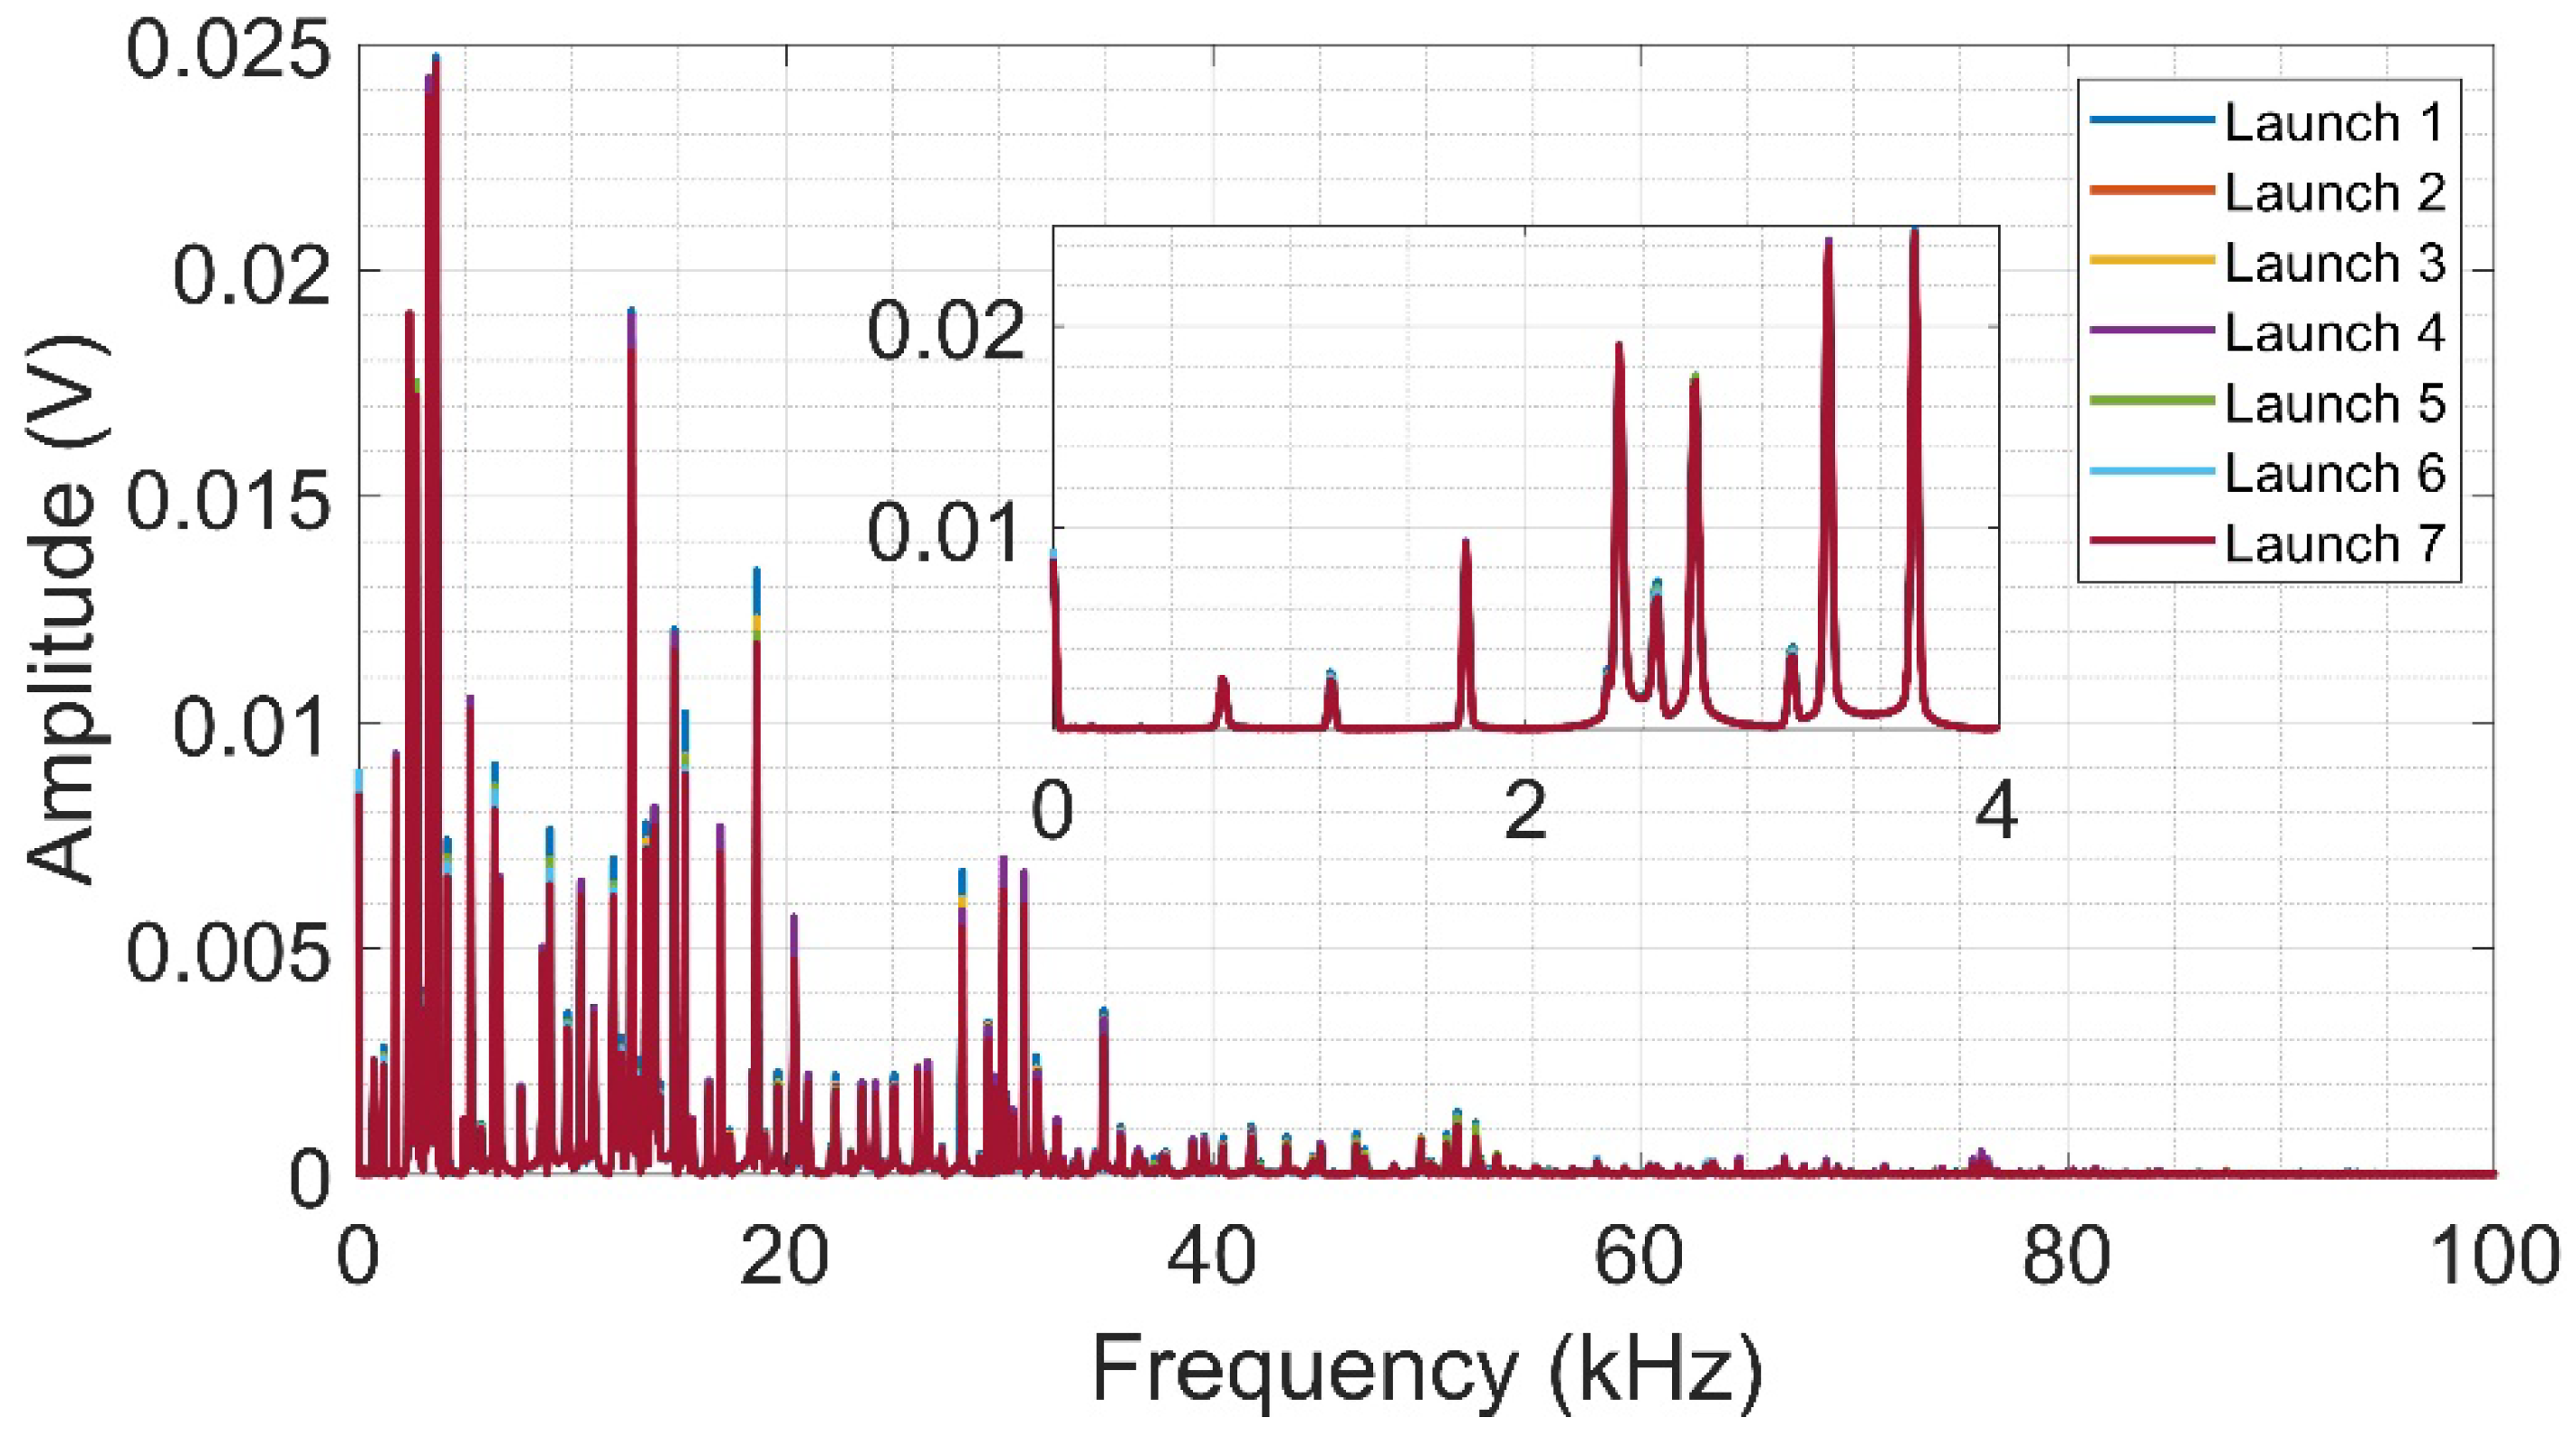
Figure 10 illustrates the frequency spectra obtained from the sphere launch tests on the aluminum surface. Similar to the PLB test, it is observed that the spectra show a wider frequency band and smaller amplitudes when compared to the amplitudes obtained from the CFRP. When analyzing a smaller frequency band (up to 4 kHz), it is possible to observe an almost complete overlap of the signals, indicating the high repeatability between the tests.
4.6. Results from NDT Tests
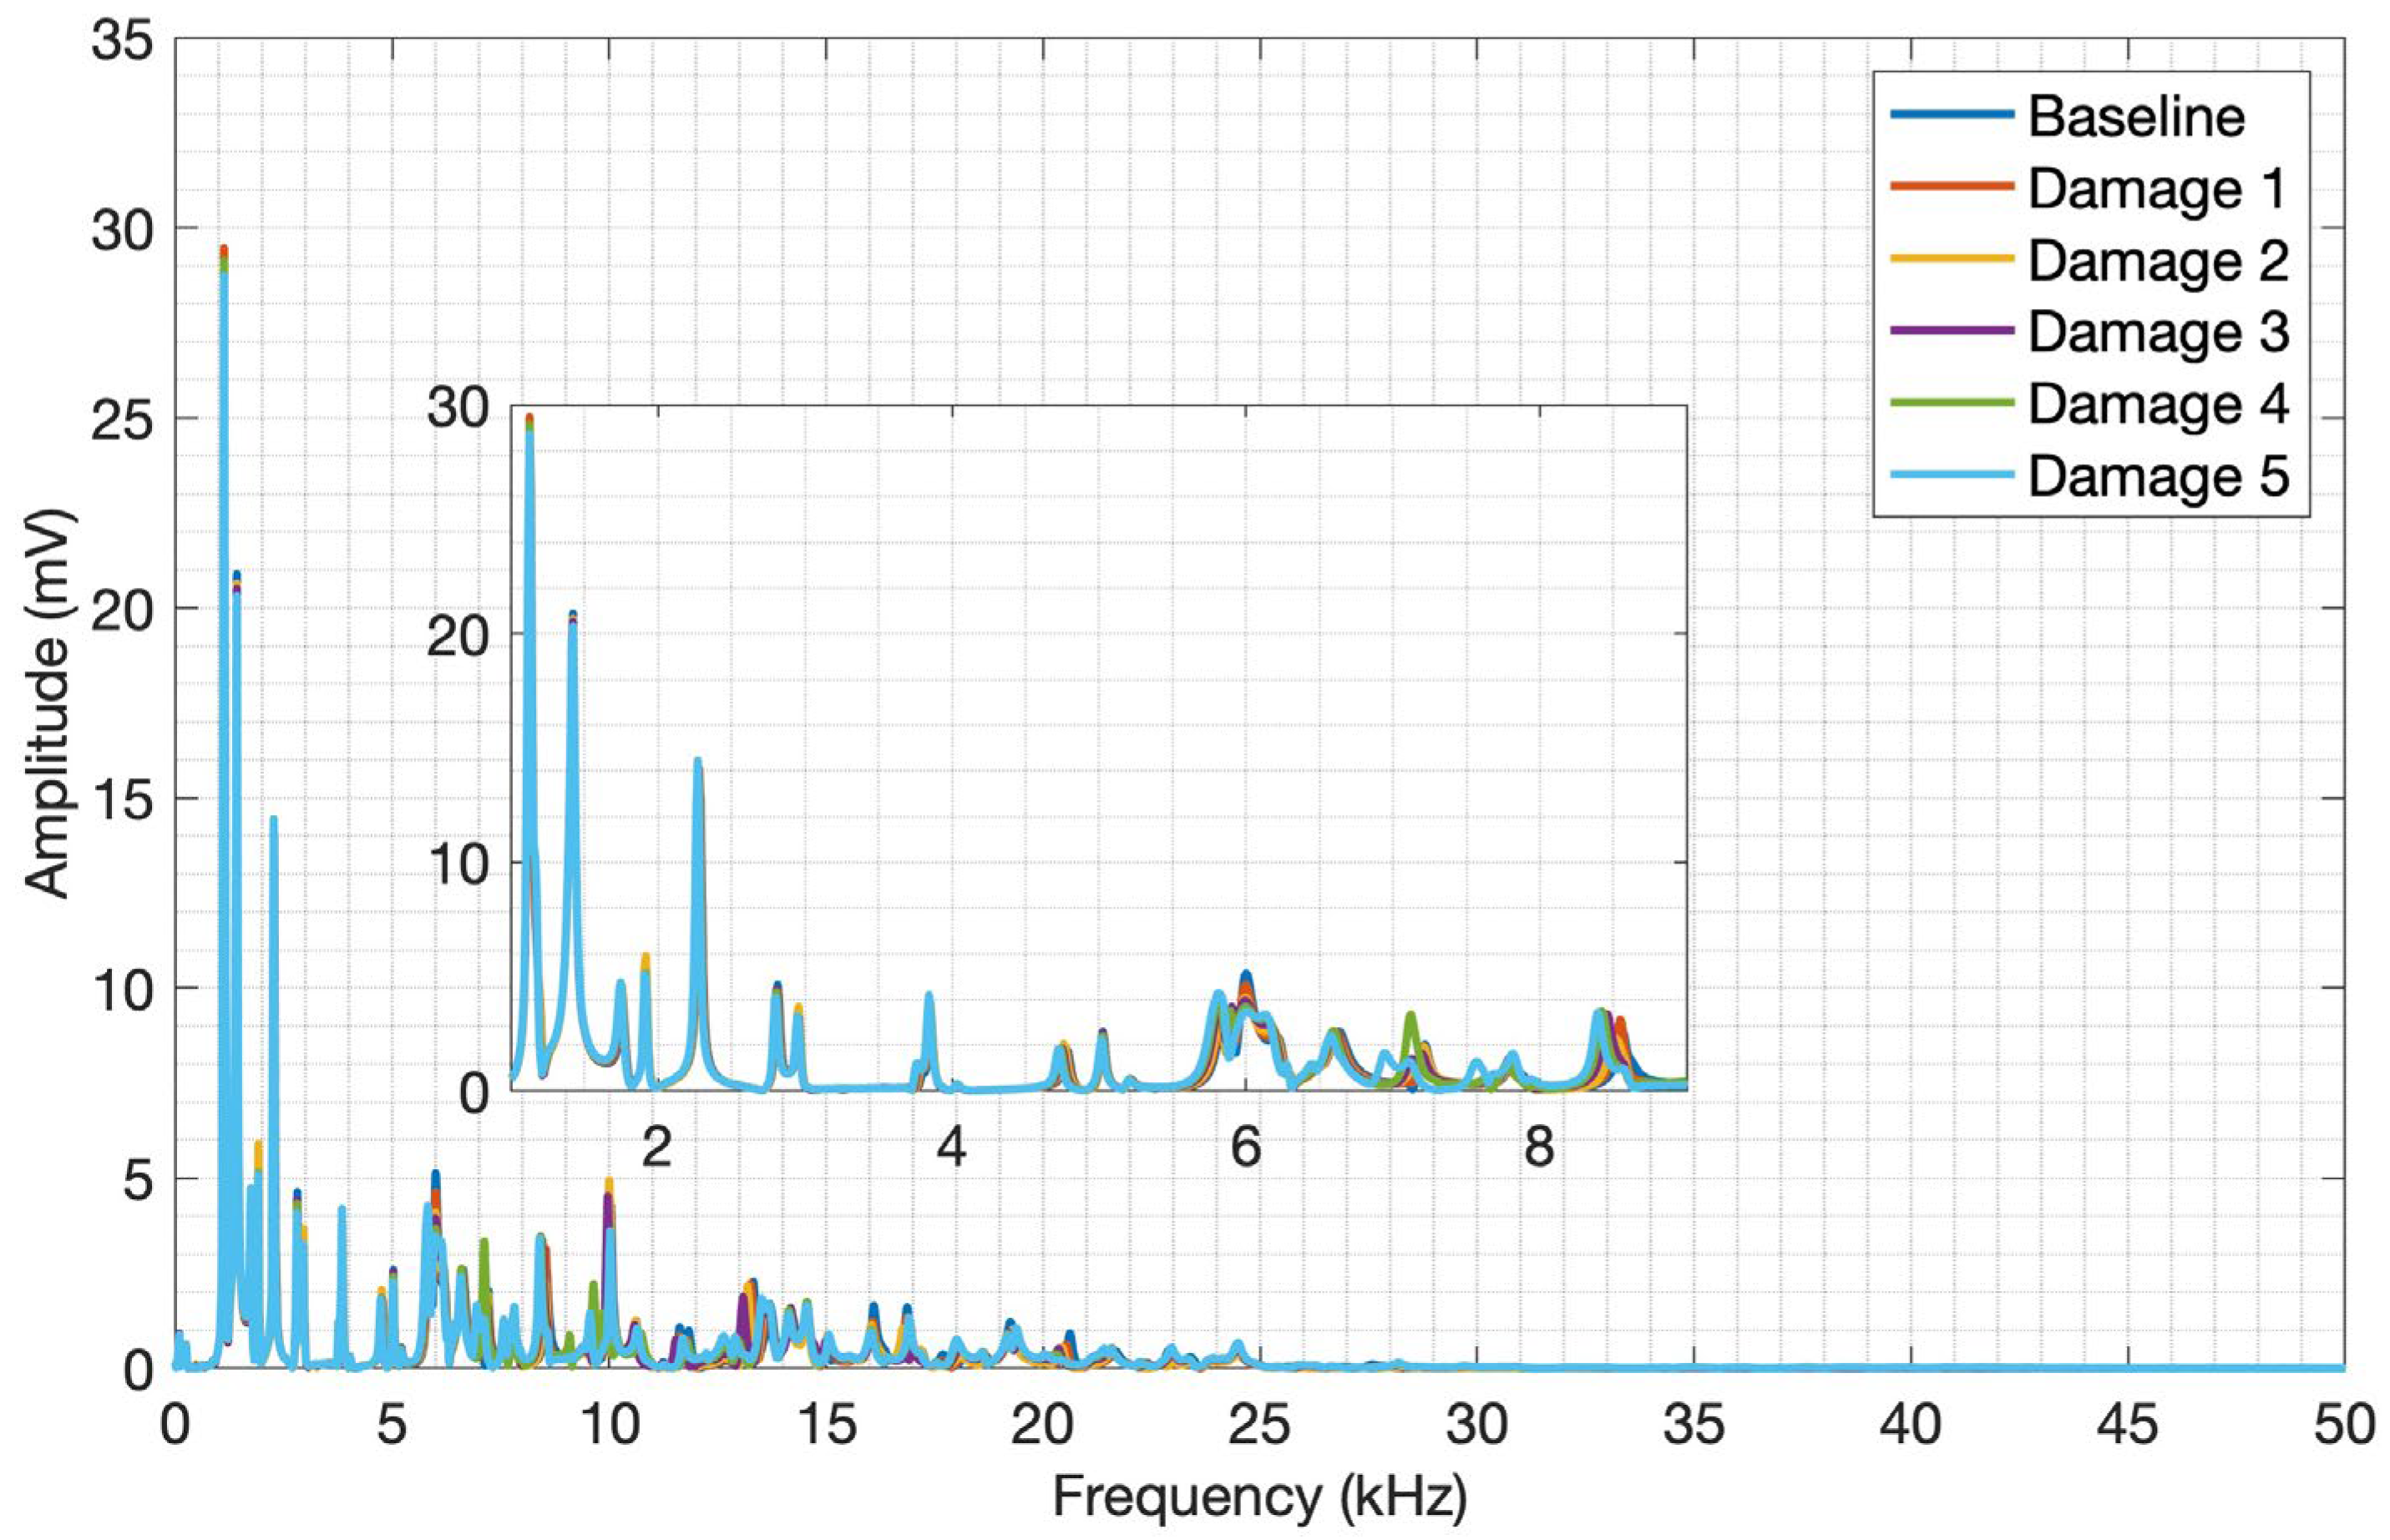
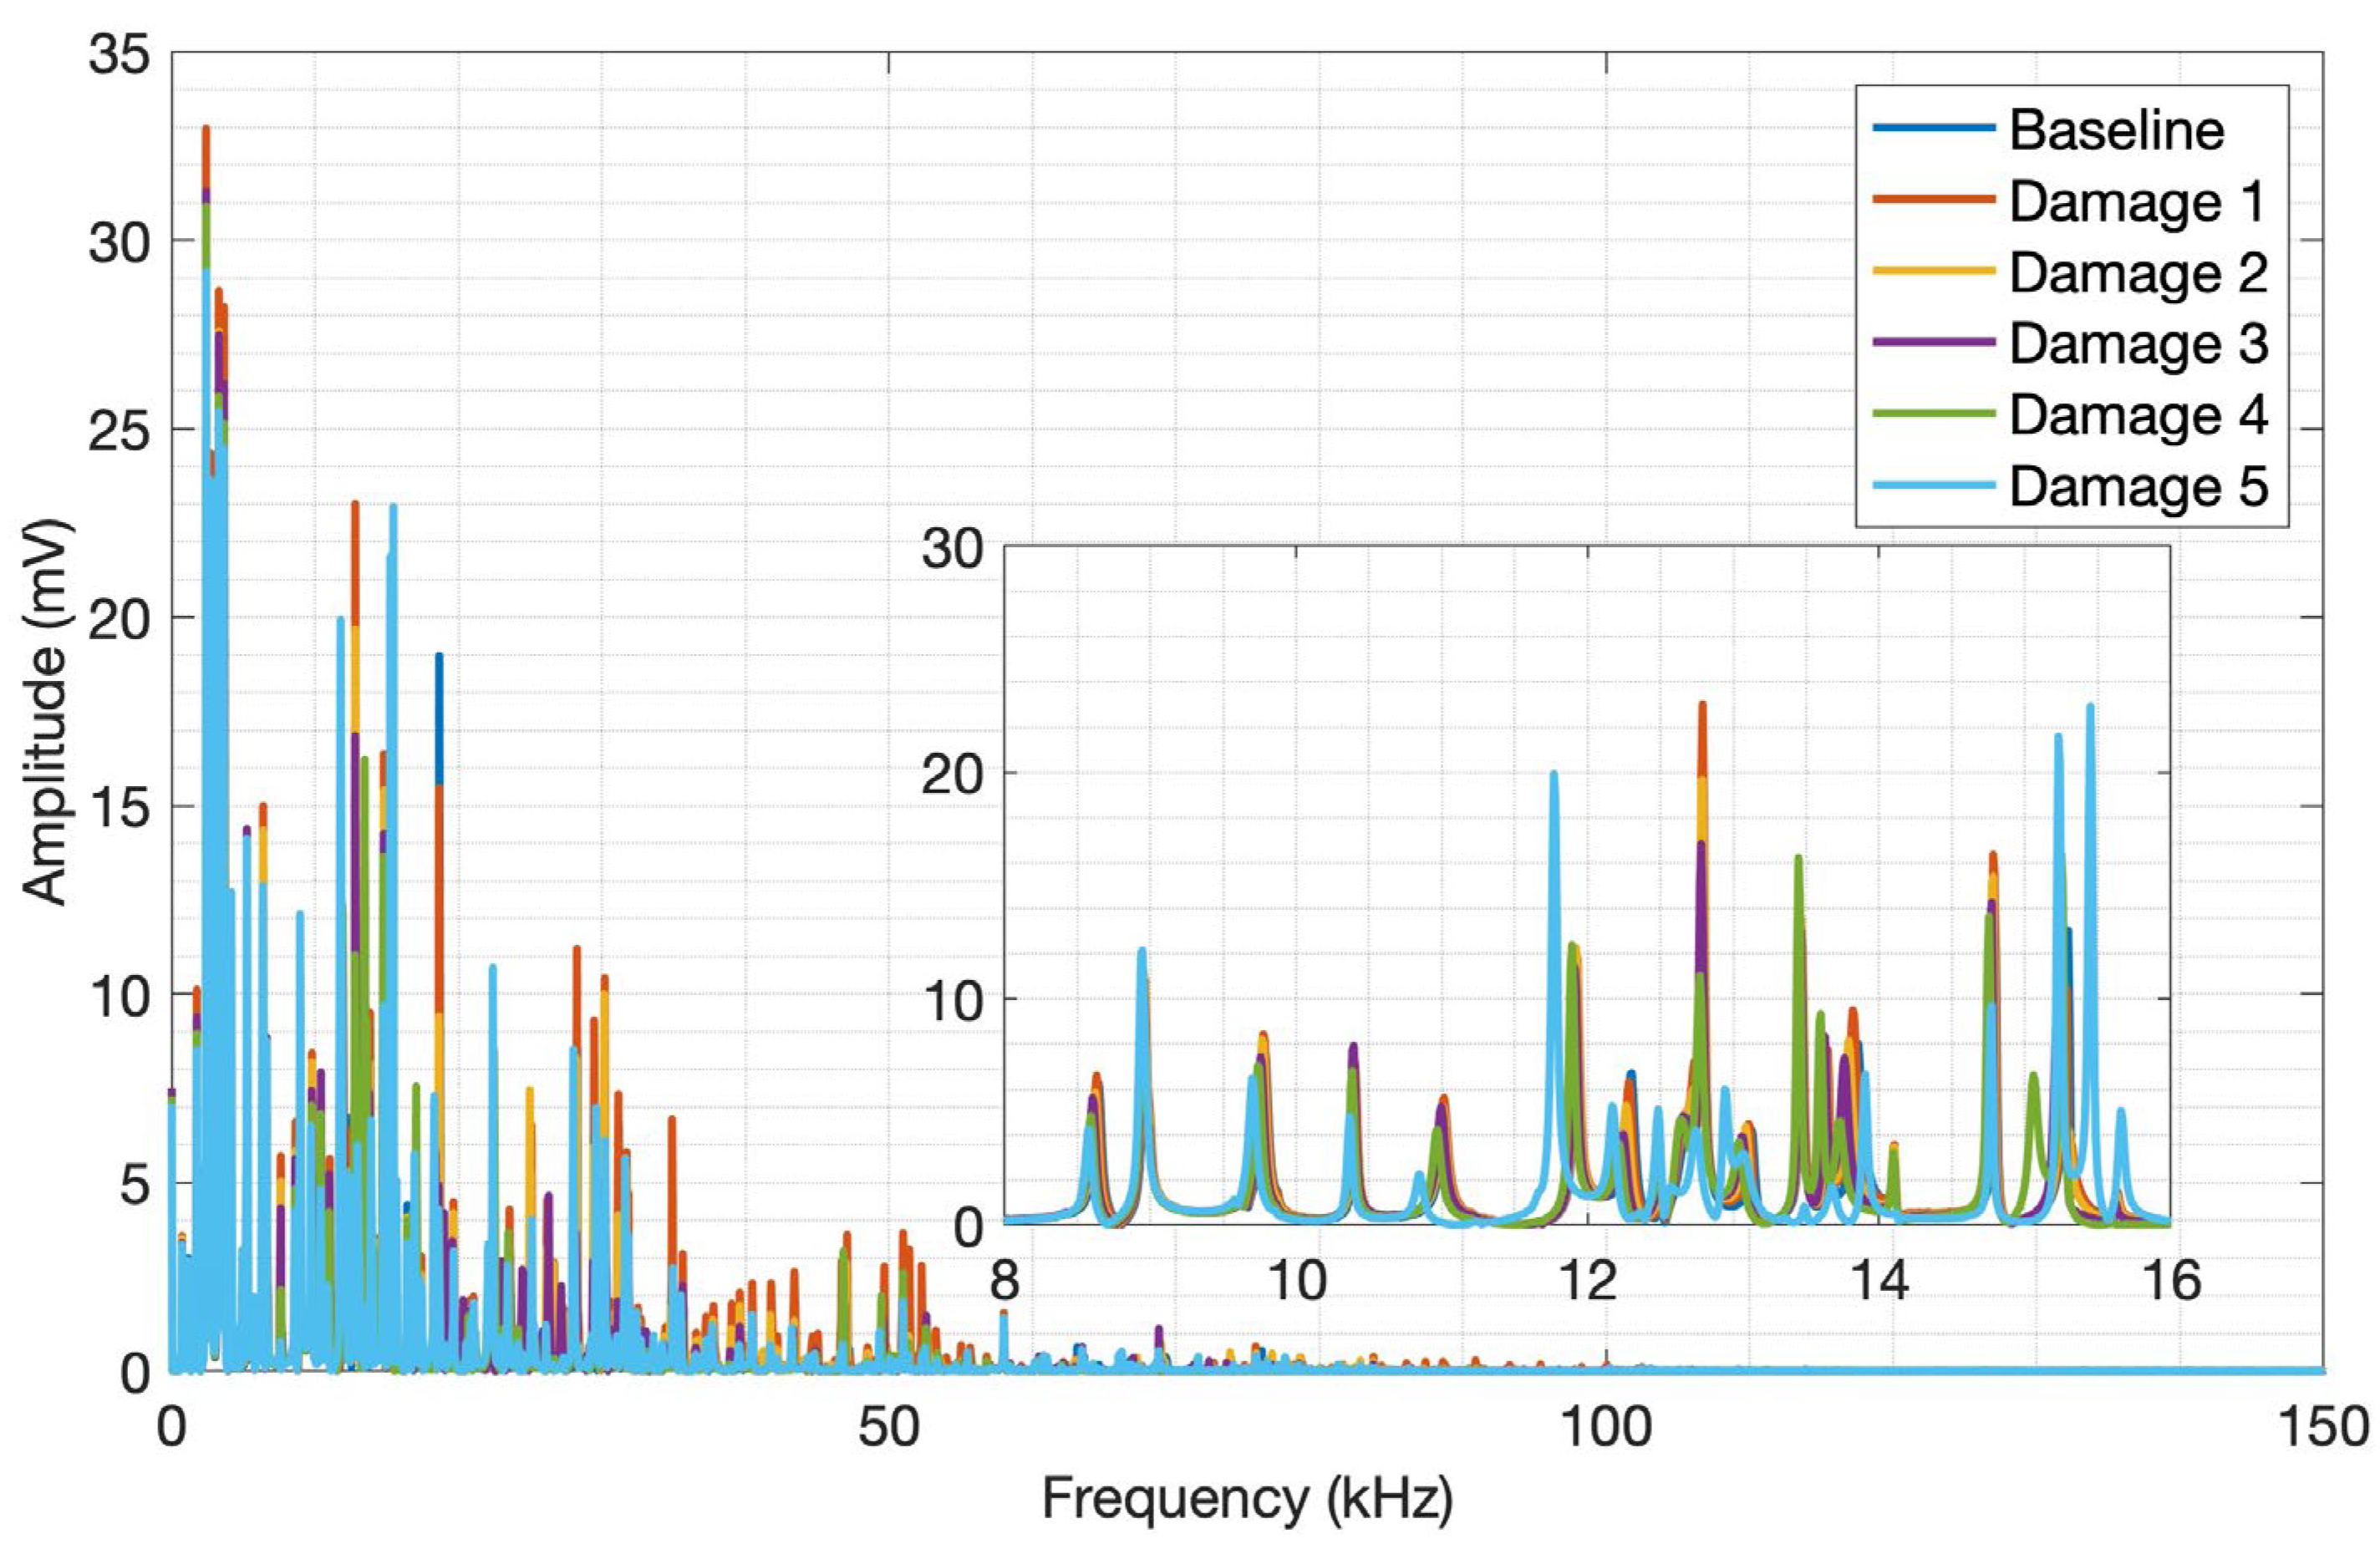
The frequency spectrum was computed, and an average of the five spectra obtained for each plate condition was calculated to simplify the analysis, as seen in
Figure 11.
Through visual analysis of the CFRP spectrum, it is possible to notice amplitude variations in the signals between the structure conditions, as well as their frequency content. As a result of the composite materials' attenuating conditions, it is possible to observe spectral activity up to approximately 30 kHz. But only through a detailed analysis of the entire transient signal, it was possible to select the 1 kHz to 9 kHz frequency band, which shows a more pronounced amplitude and frequency shifts over the whole signal. This frequency band clearly shows a signal variation due to the plate mass variation, evidencing the CFRP and piezoelectric diaphragm assembly sensitivity to mass variation and the impact caused on the structure surface by the proposed acoustic wave generation method. The frequency spectra for aluminum are shown in
Figure 12.
The behavior observed in aluminum is very similar to that seen in CFRP. Still, the aluminum frequency ranges are much wider due to the material's properties, reaching up to approximately 100 kHz. The amplitude variation and signal frequency shift concerning the aluminum plate mass are significant, thus evidencing the applicability of the acoustic wave generation method proposed for aluminum plates and its sensitivity to the mass variation. By analyzing the spectrum along the entire transient signal, it was possible to find the frequency band between 8 kHz and 16 kHz, where the amplitude and frequency content variation are more pronounced.
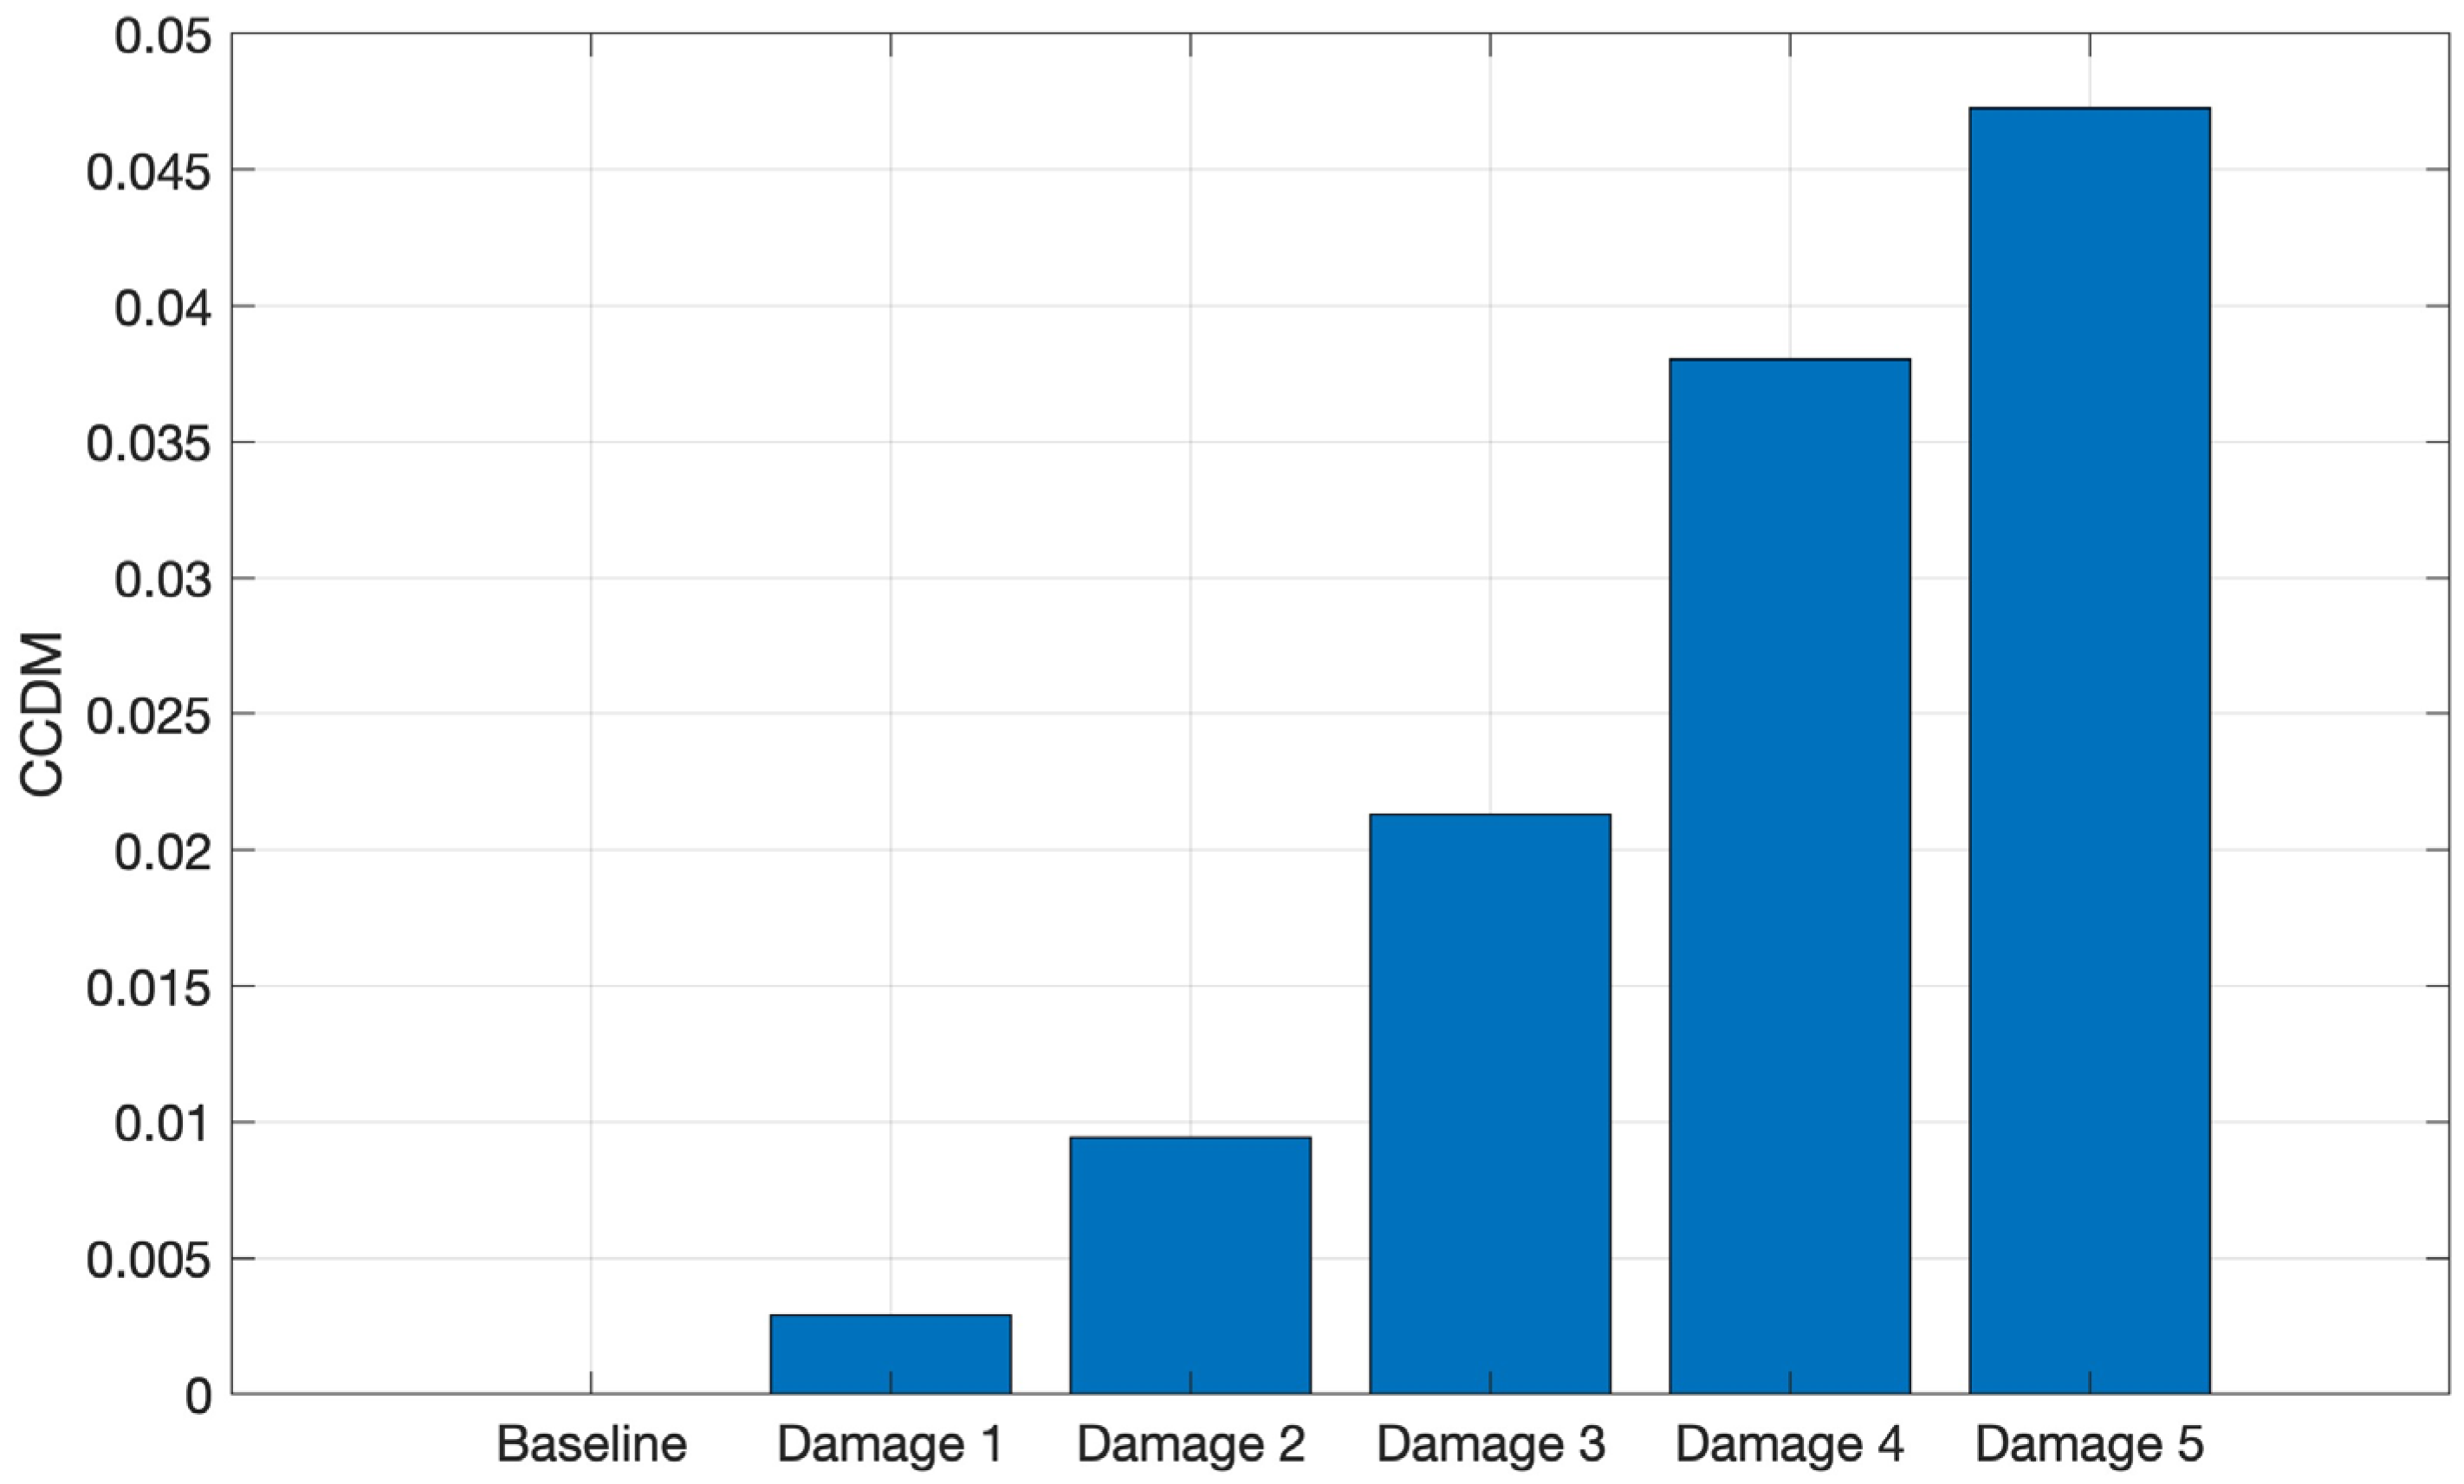
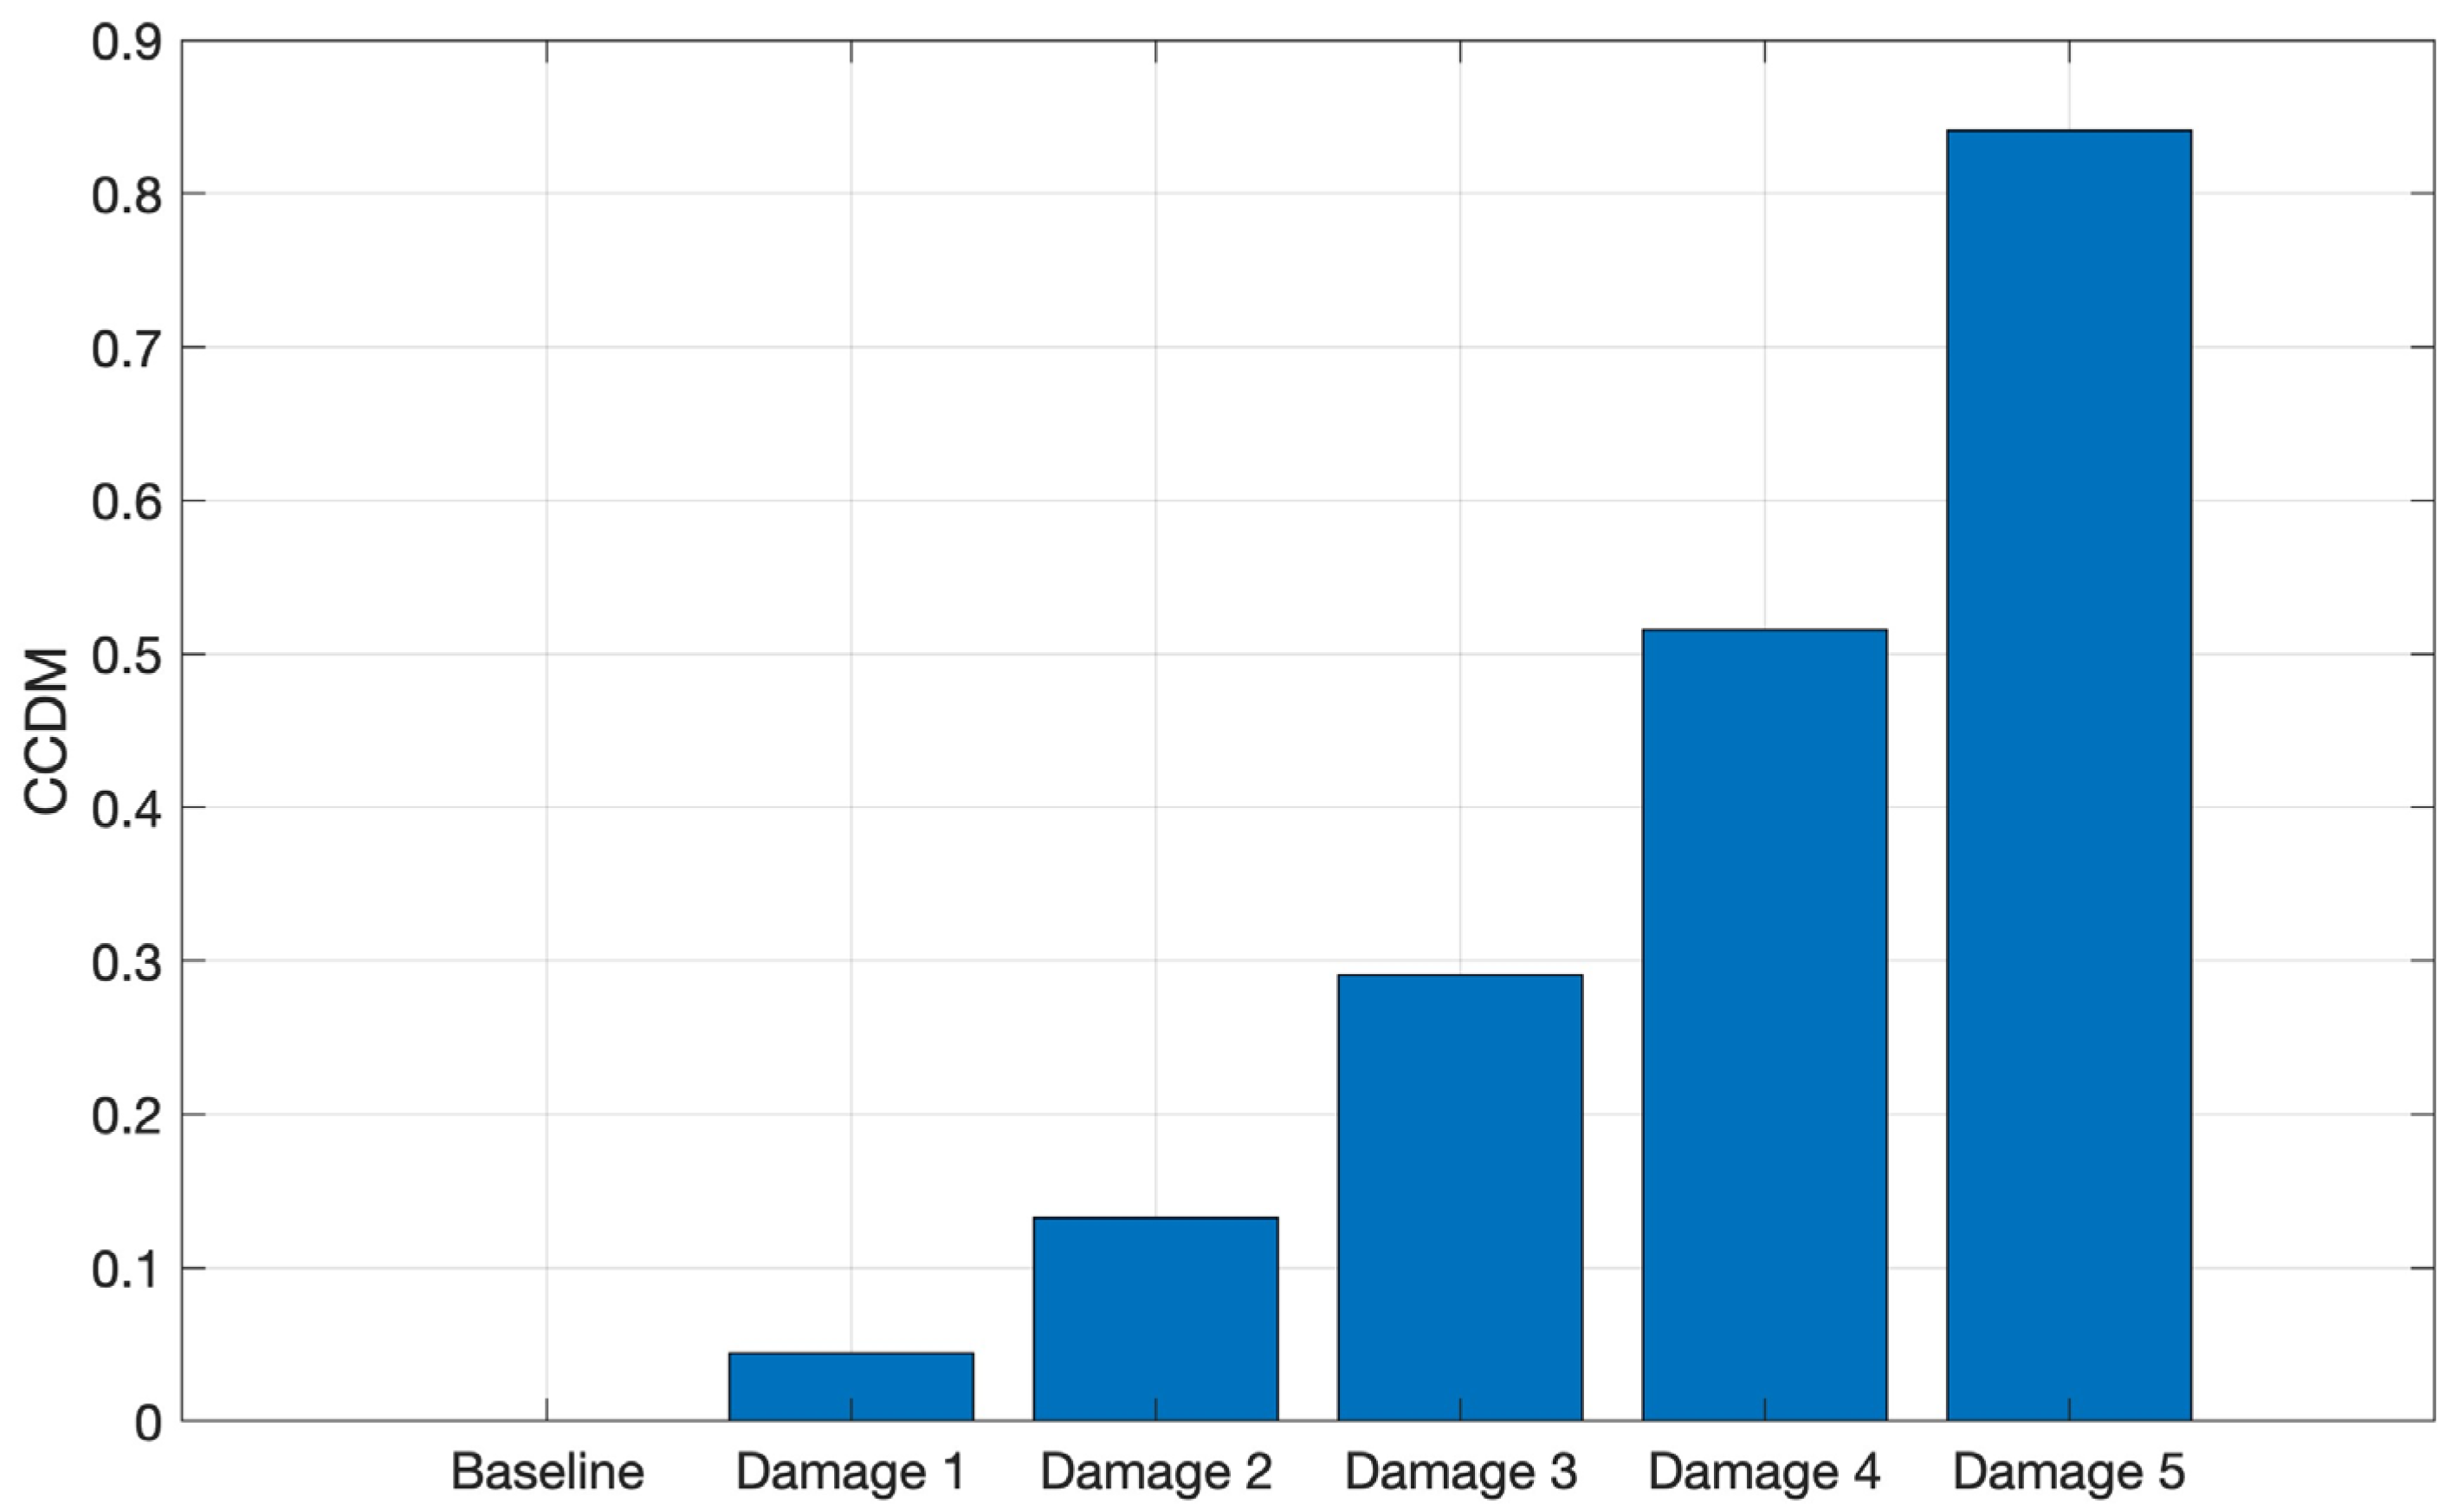
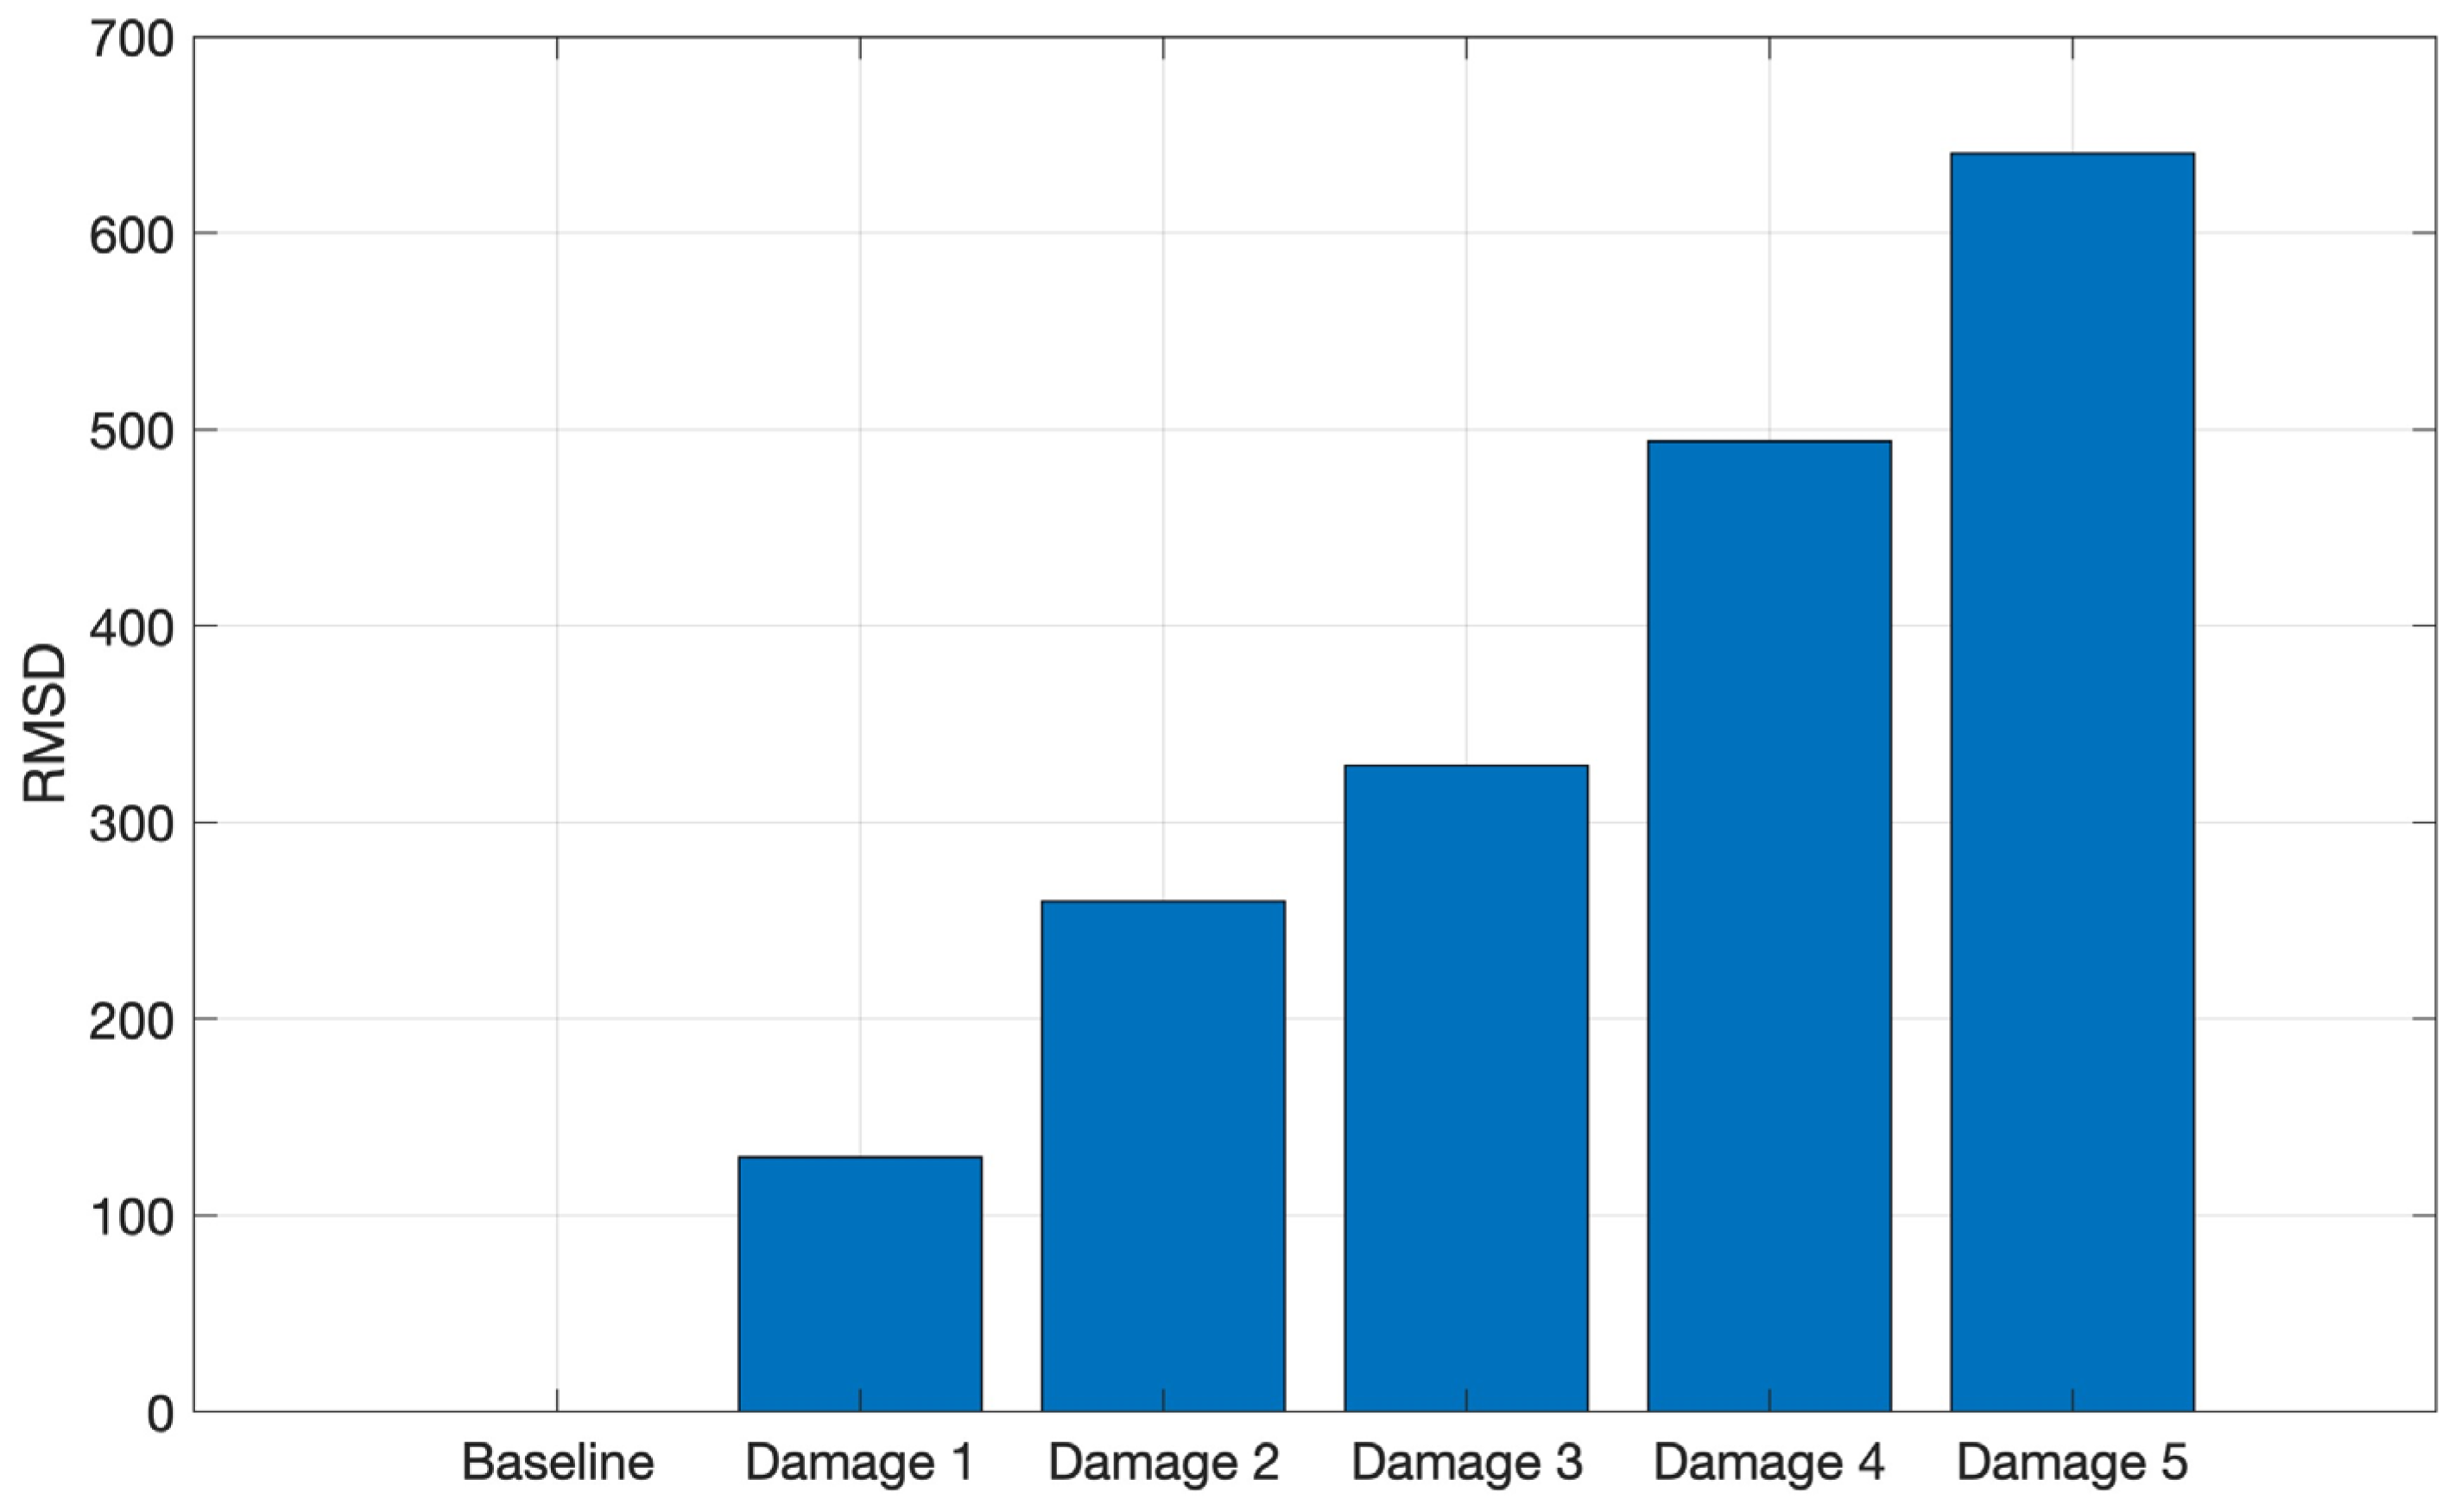
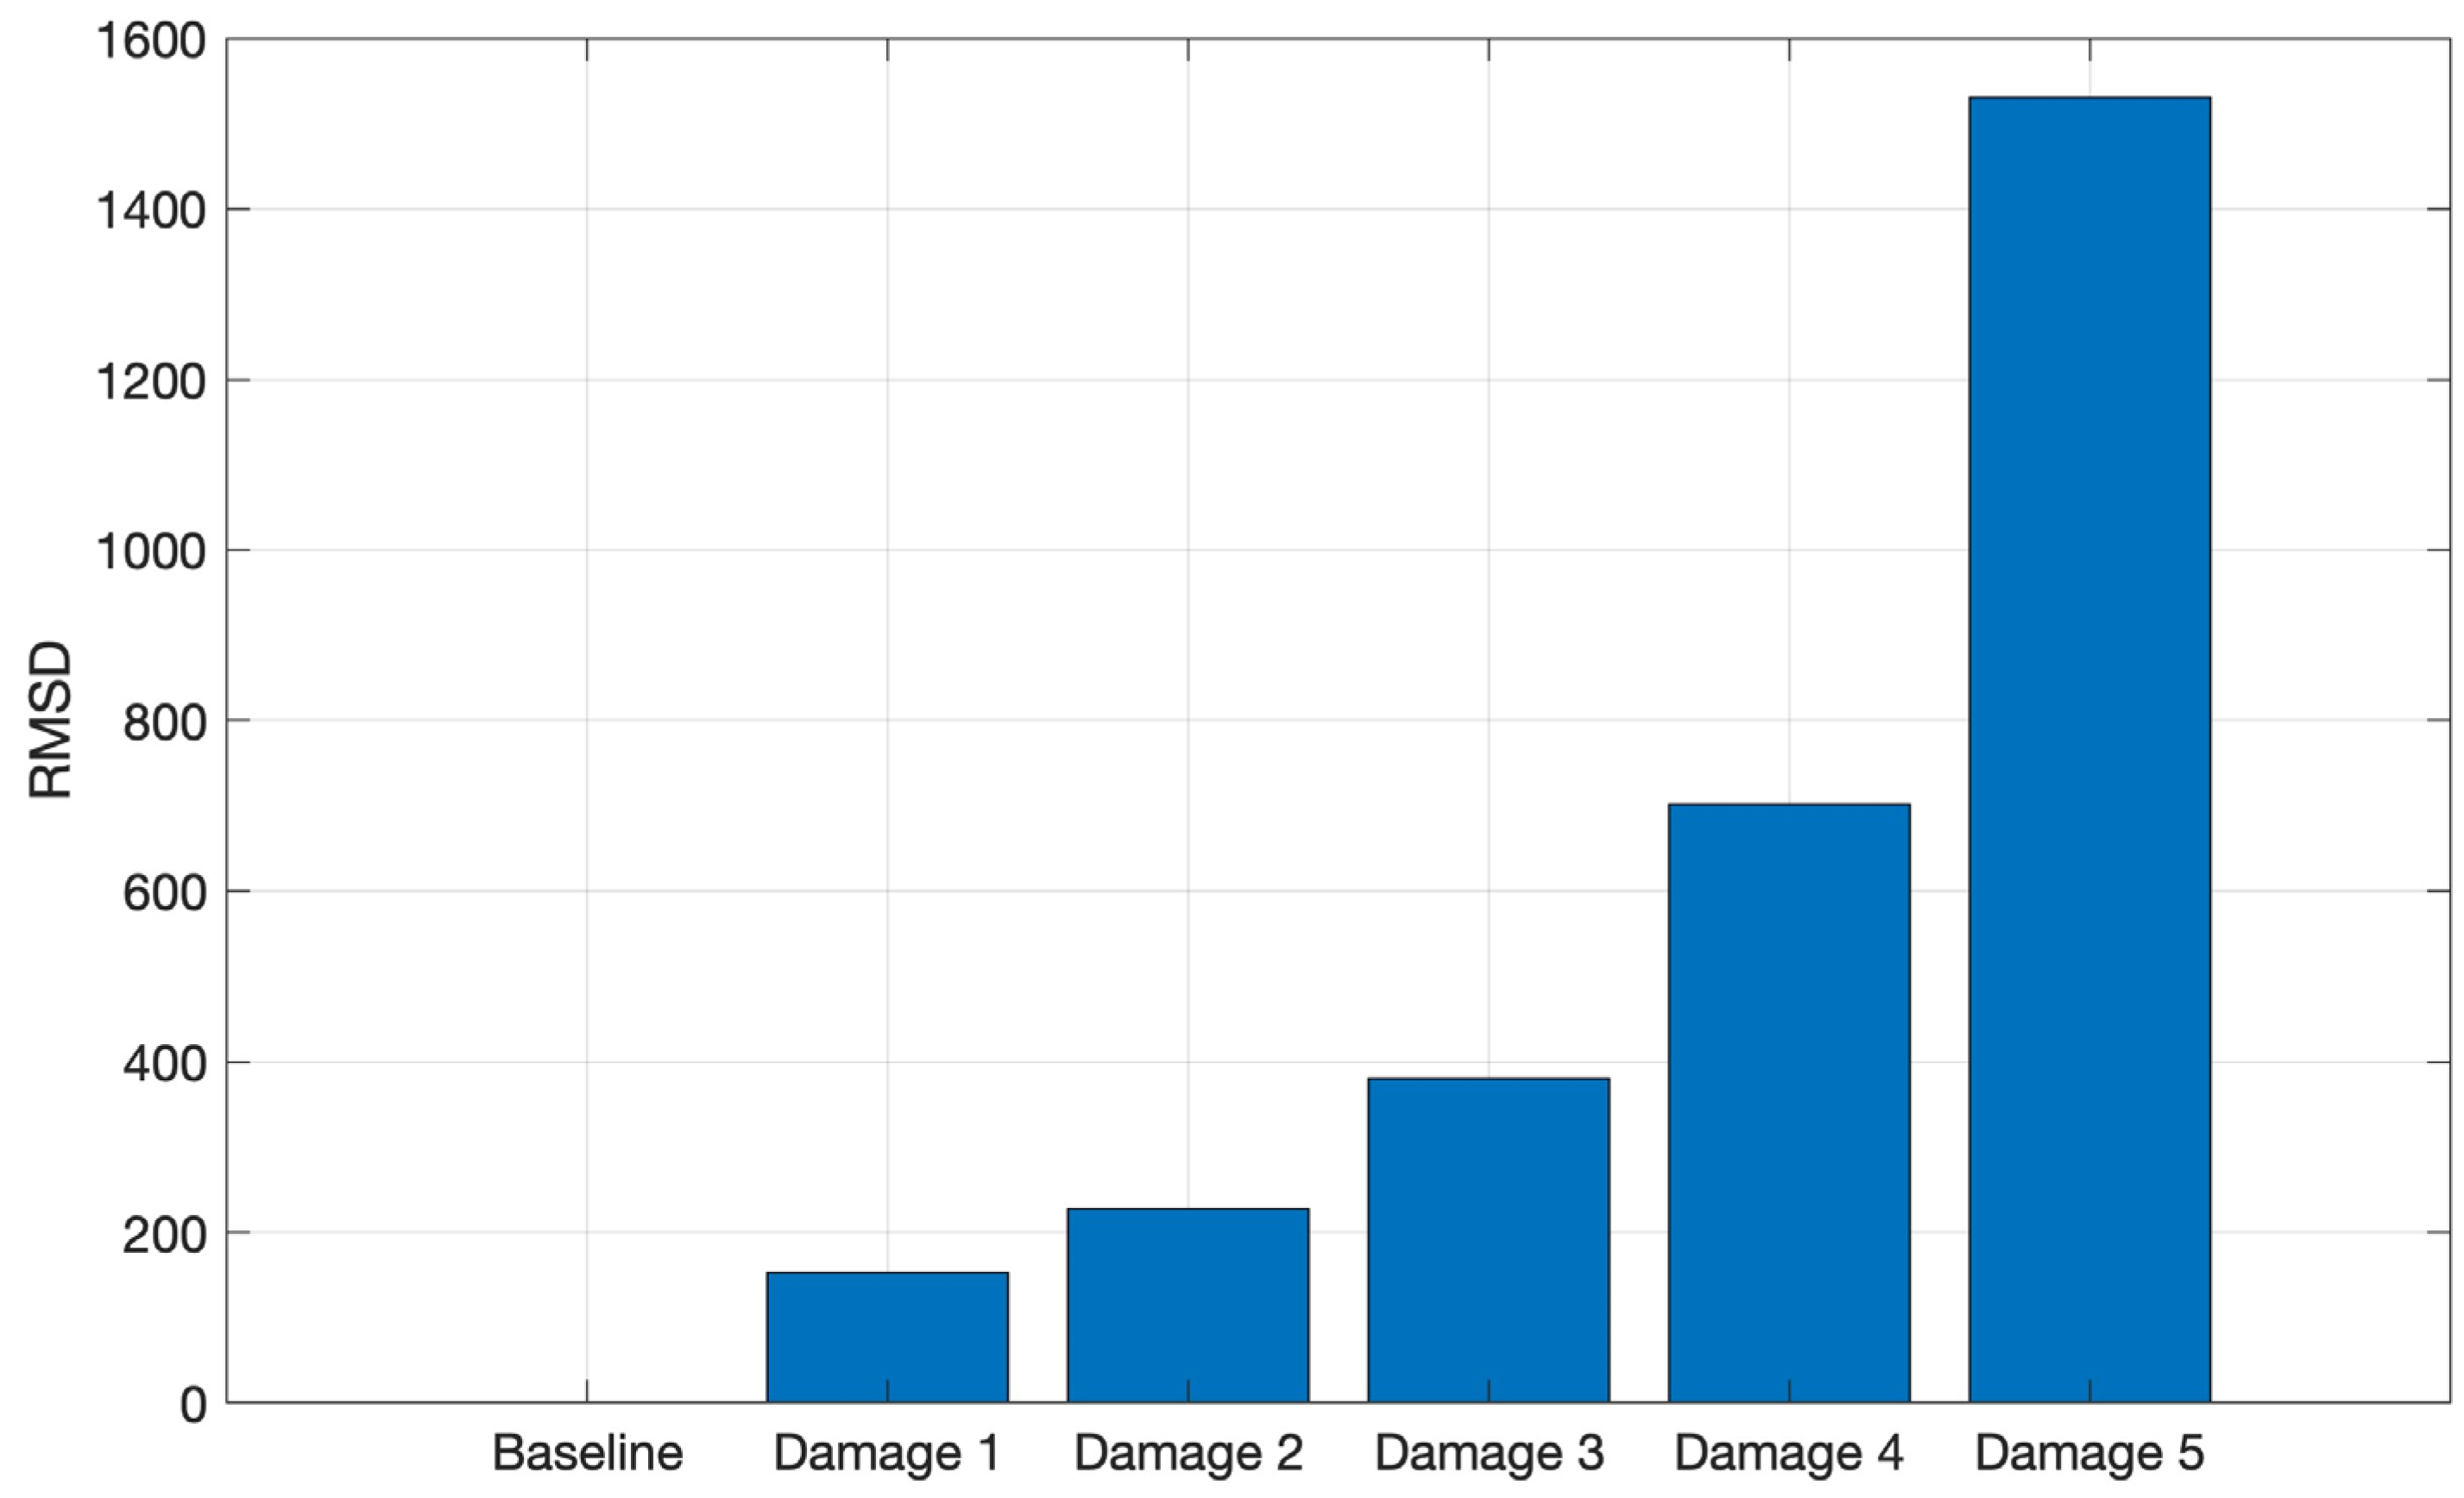
To evaluate and quantify the signal variations due to structure mass variation, the CCDM and RMSD indices were computed. Both metrics were applied for the 8 kHz to 16 kHz frequency band for both materials.
Figure 13 shows the CCDM index for the CFRP structure.
It can be observed in
Figure 13 that the CCDM index increases with the addition of metallic nuts to the plate surface, i.e., the increase in the CFRP plate mass causes a frequency shift between the spectra. Therefore, the CCDM index applied in the selected frequency band is able to identify and quantify the CFRP plate mass variation.
The CCDM was computed for aluminum, and it is shown in
Figure 14, where a similar behavior to that reported for CFRP is observed. The progressive increase in the CCDM index indicates that the increasing structure mass leads to a shift in the frequency component of these signals, demonstrating that the used metric is sensitive to mass variation and, therefore, able to identify the simulated damage on the aluminum structure, as in the CFRP.
Figure 15 shows the RMSD index for the tests performed on the CFRP structure, where it is possible to observe an increasing RMSD index as the structure mass increases, indicating that the amplitude of the signals, acquired from the CFRP tests, increases in the selected frequency band as the structure mass increases.
Similarly, the RMSD index for the aluminum test signals is shown in
Figure 16, i.e., there is a gradual index increase as the masses are added to the structure.
4.7. Results from NDT PLB Tests
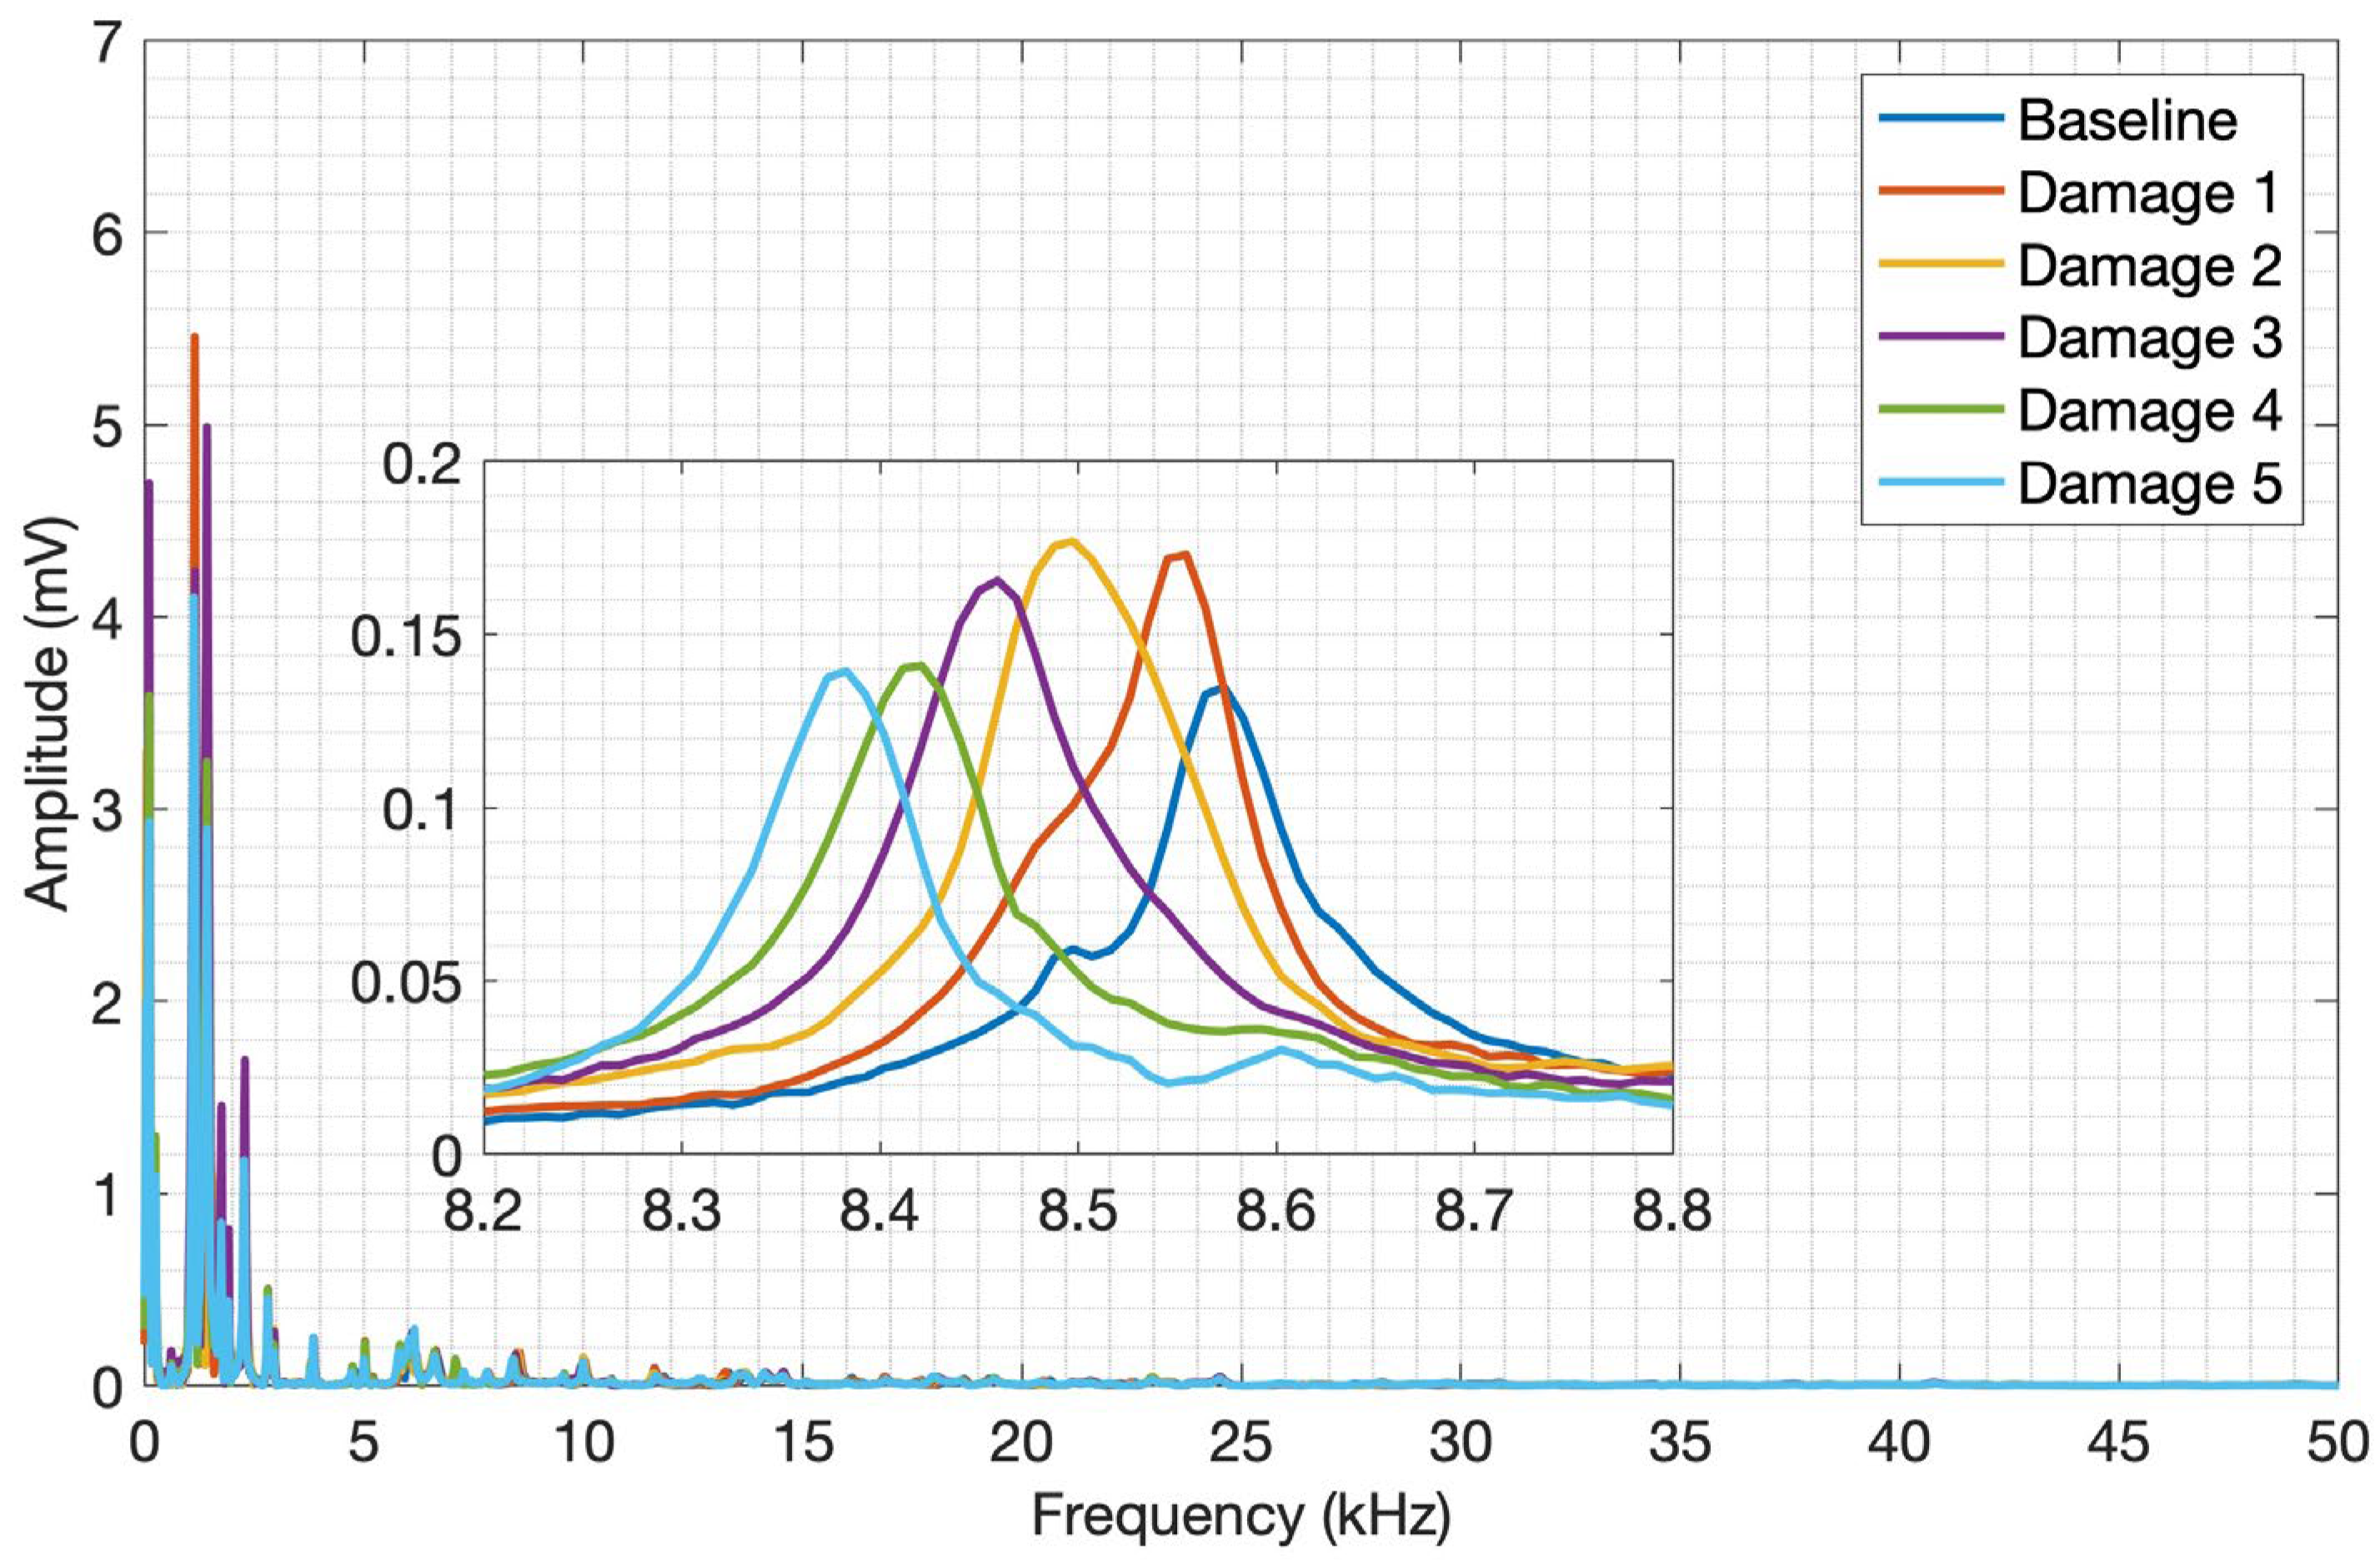
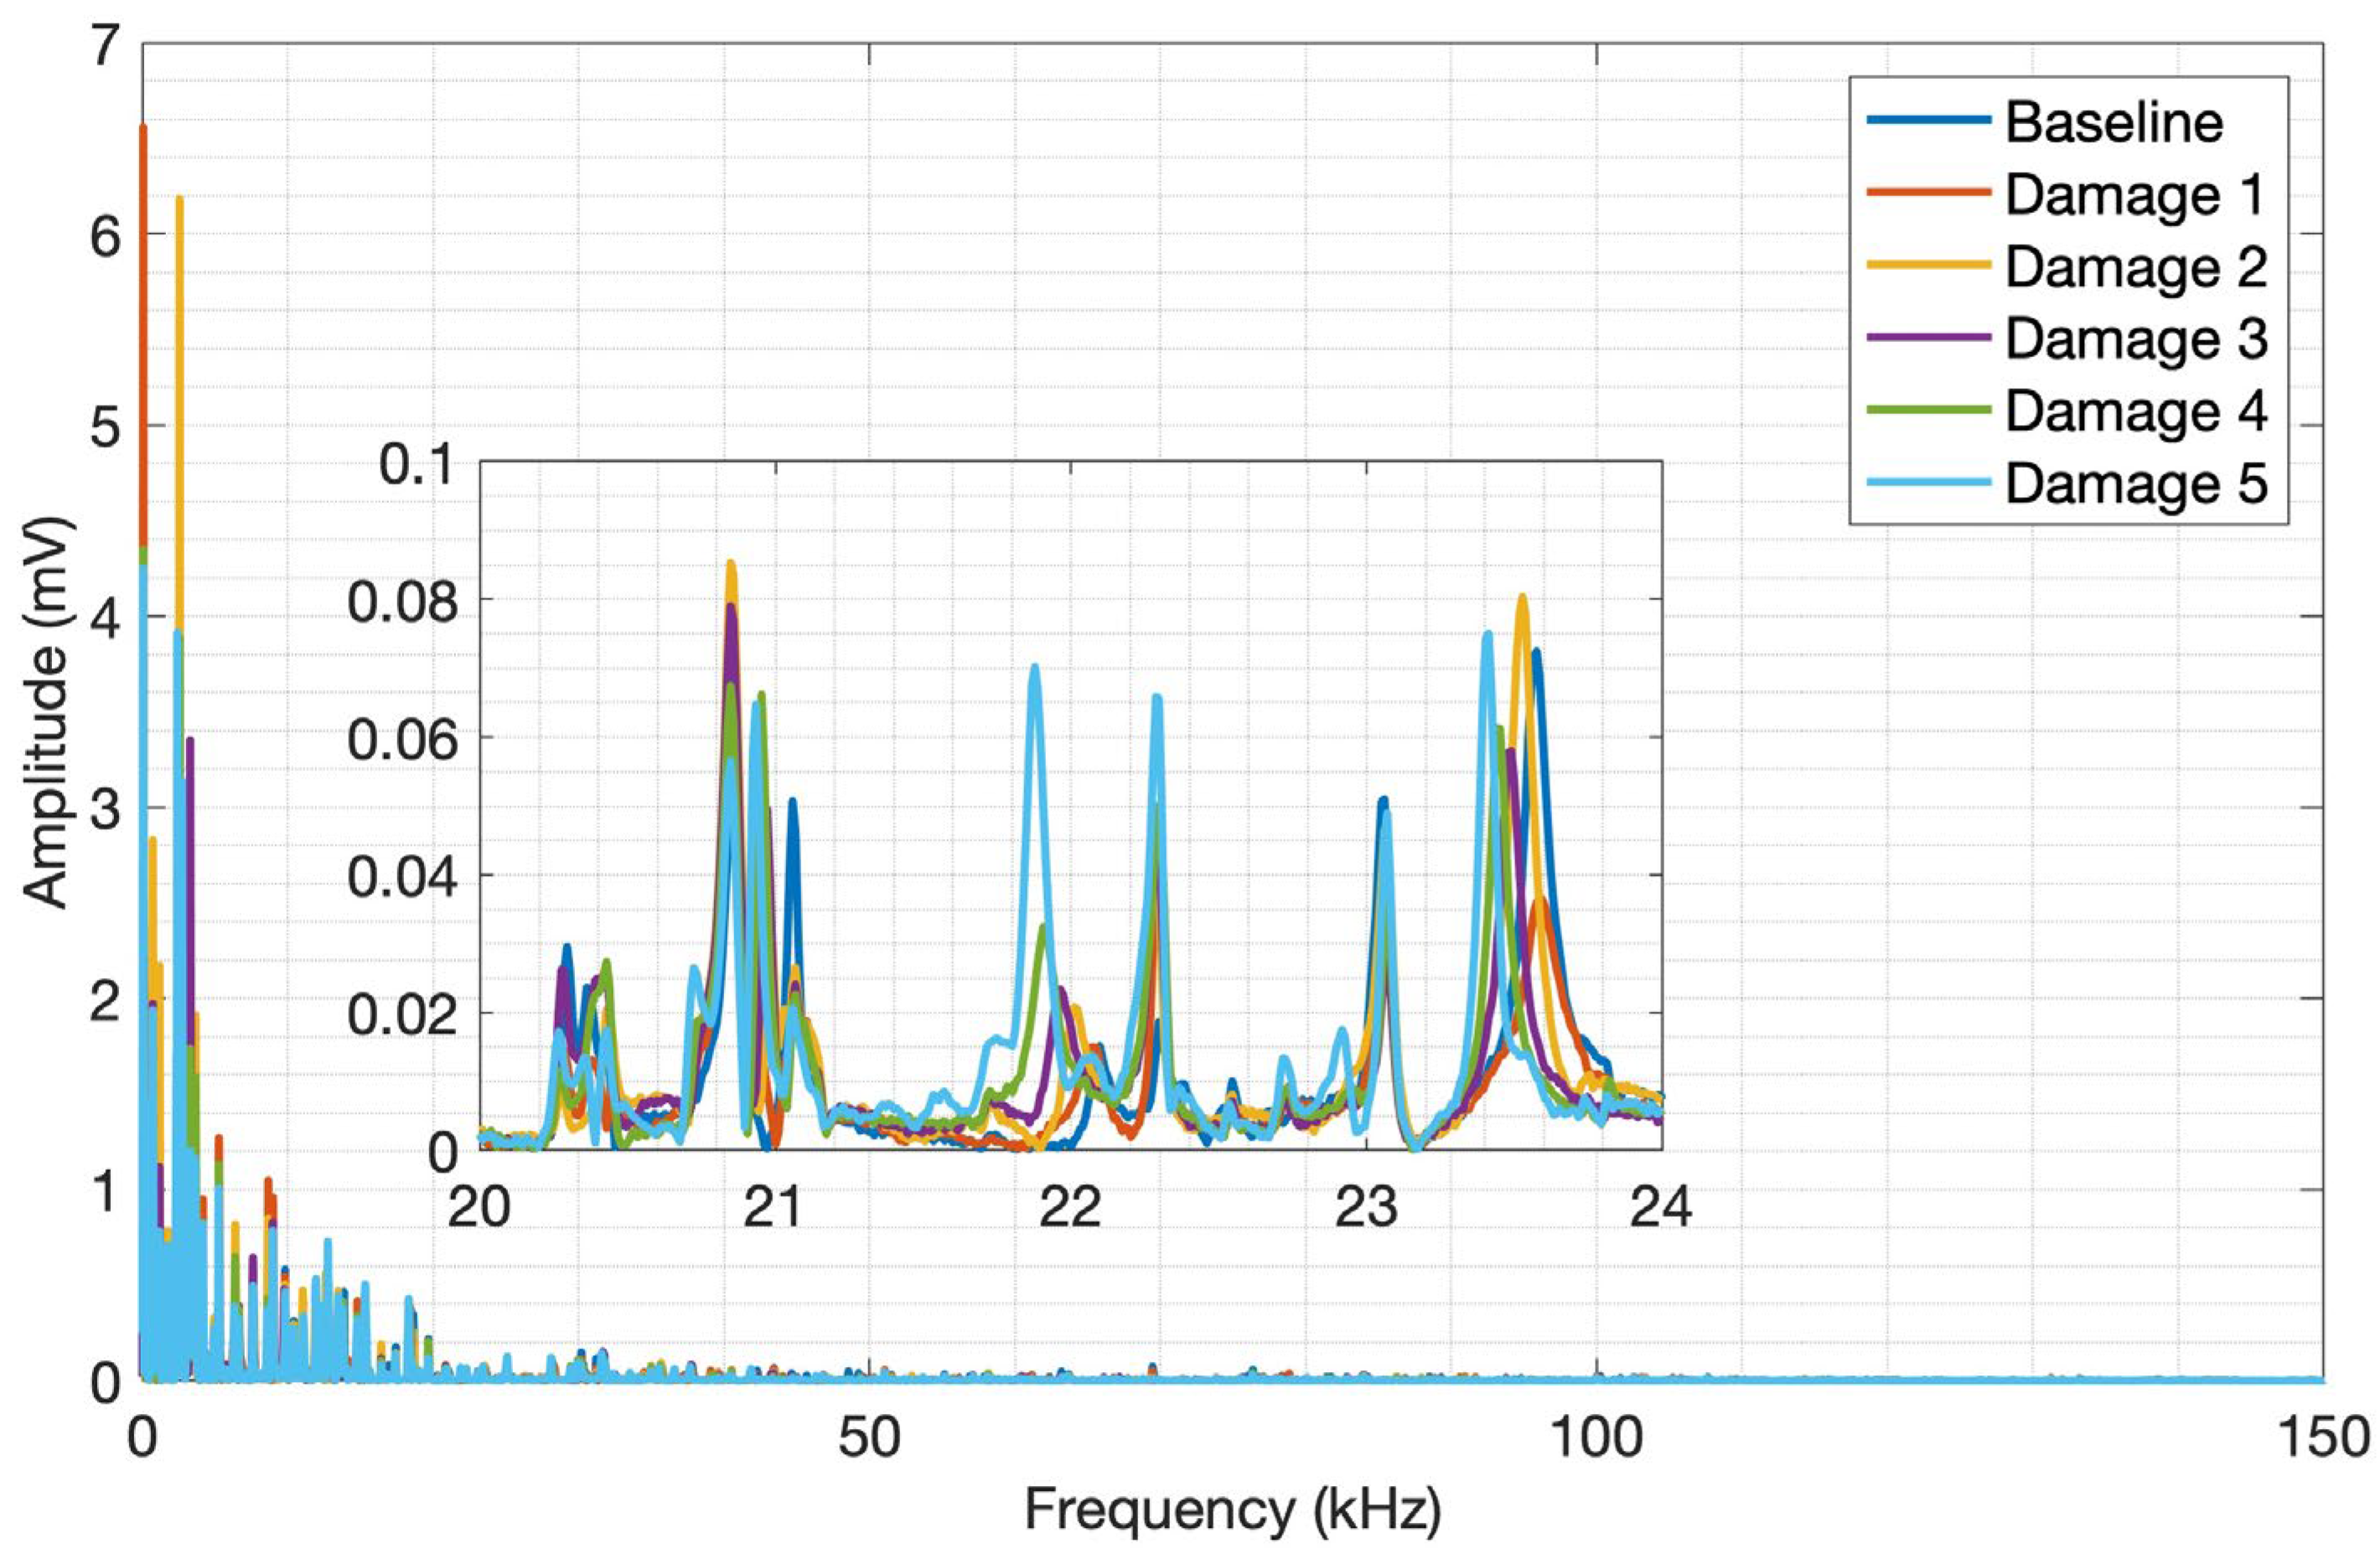
The average spectra of PLB tests for the CFRP and aluminum plates are shown in
Figure 17 and
Figure 18, respectively. It can be observed in these figures a similar frequency content and amplitude behavior to the launch tests, but the amplitudes are significantly smaller due to the very low mechanical energy impressed by the pencil lead break compared to the impact of the sphere on the surface. On the other hand, a closer look along the spectra reveals different frequency bands with more pronounced amplitude variation and shifts for both PLB and launch methods. This difference may be explained by the nature of each method, that is, the PLB method imposes lower mechanical energy when the pencil lead is broken when compared to the impact of the sphere. As a result, the acoustic waves released in the structure will not be able to propagate in the same way as in the sphere impact, which will at certain extent have different levels of transmission, reflection, attenuation, and interferences throughout the structure. A frequency band from 8.2 kHz to 8.8 kHz and another from 20 kHz to 24 kHz were selected for CFRP and aluminum plates, respectively.
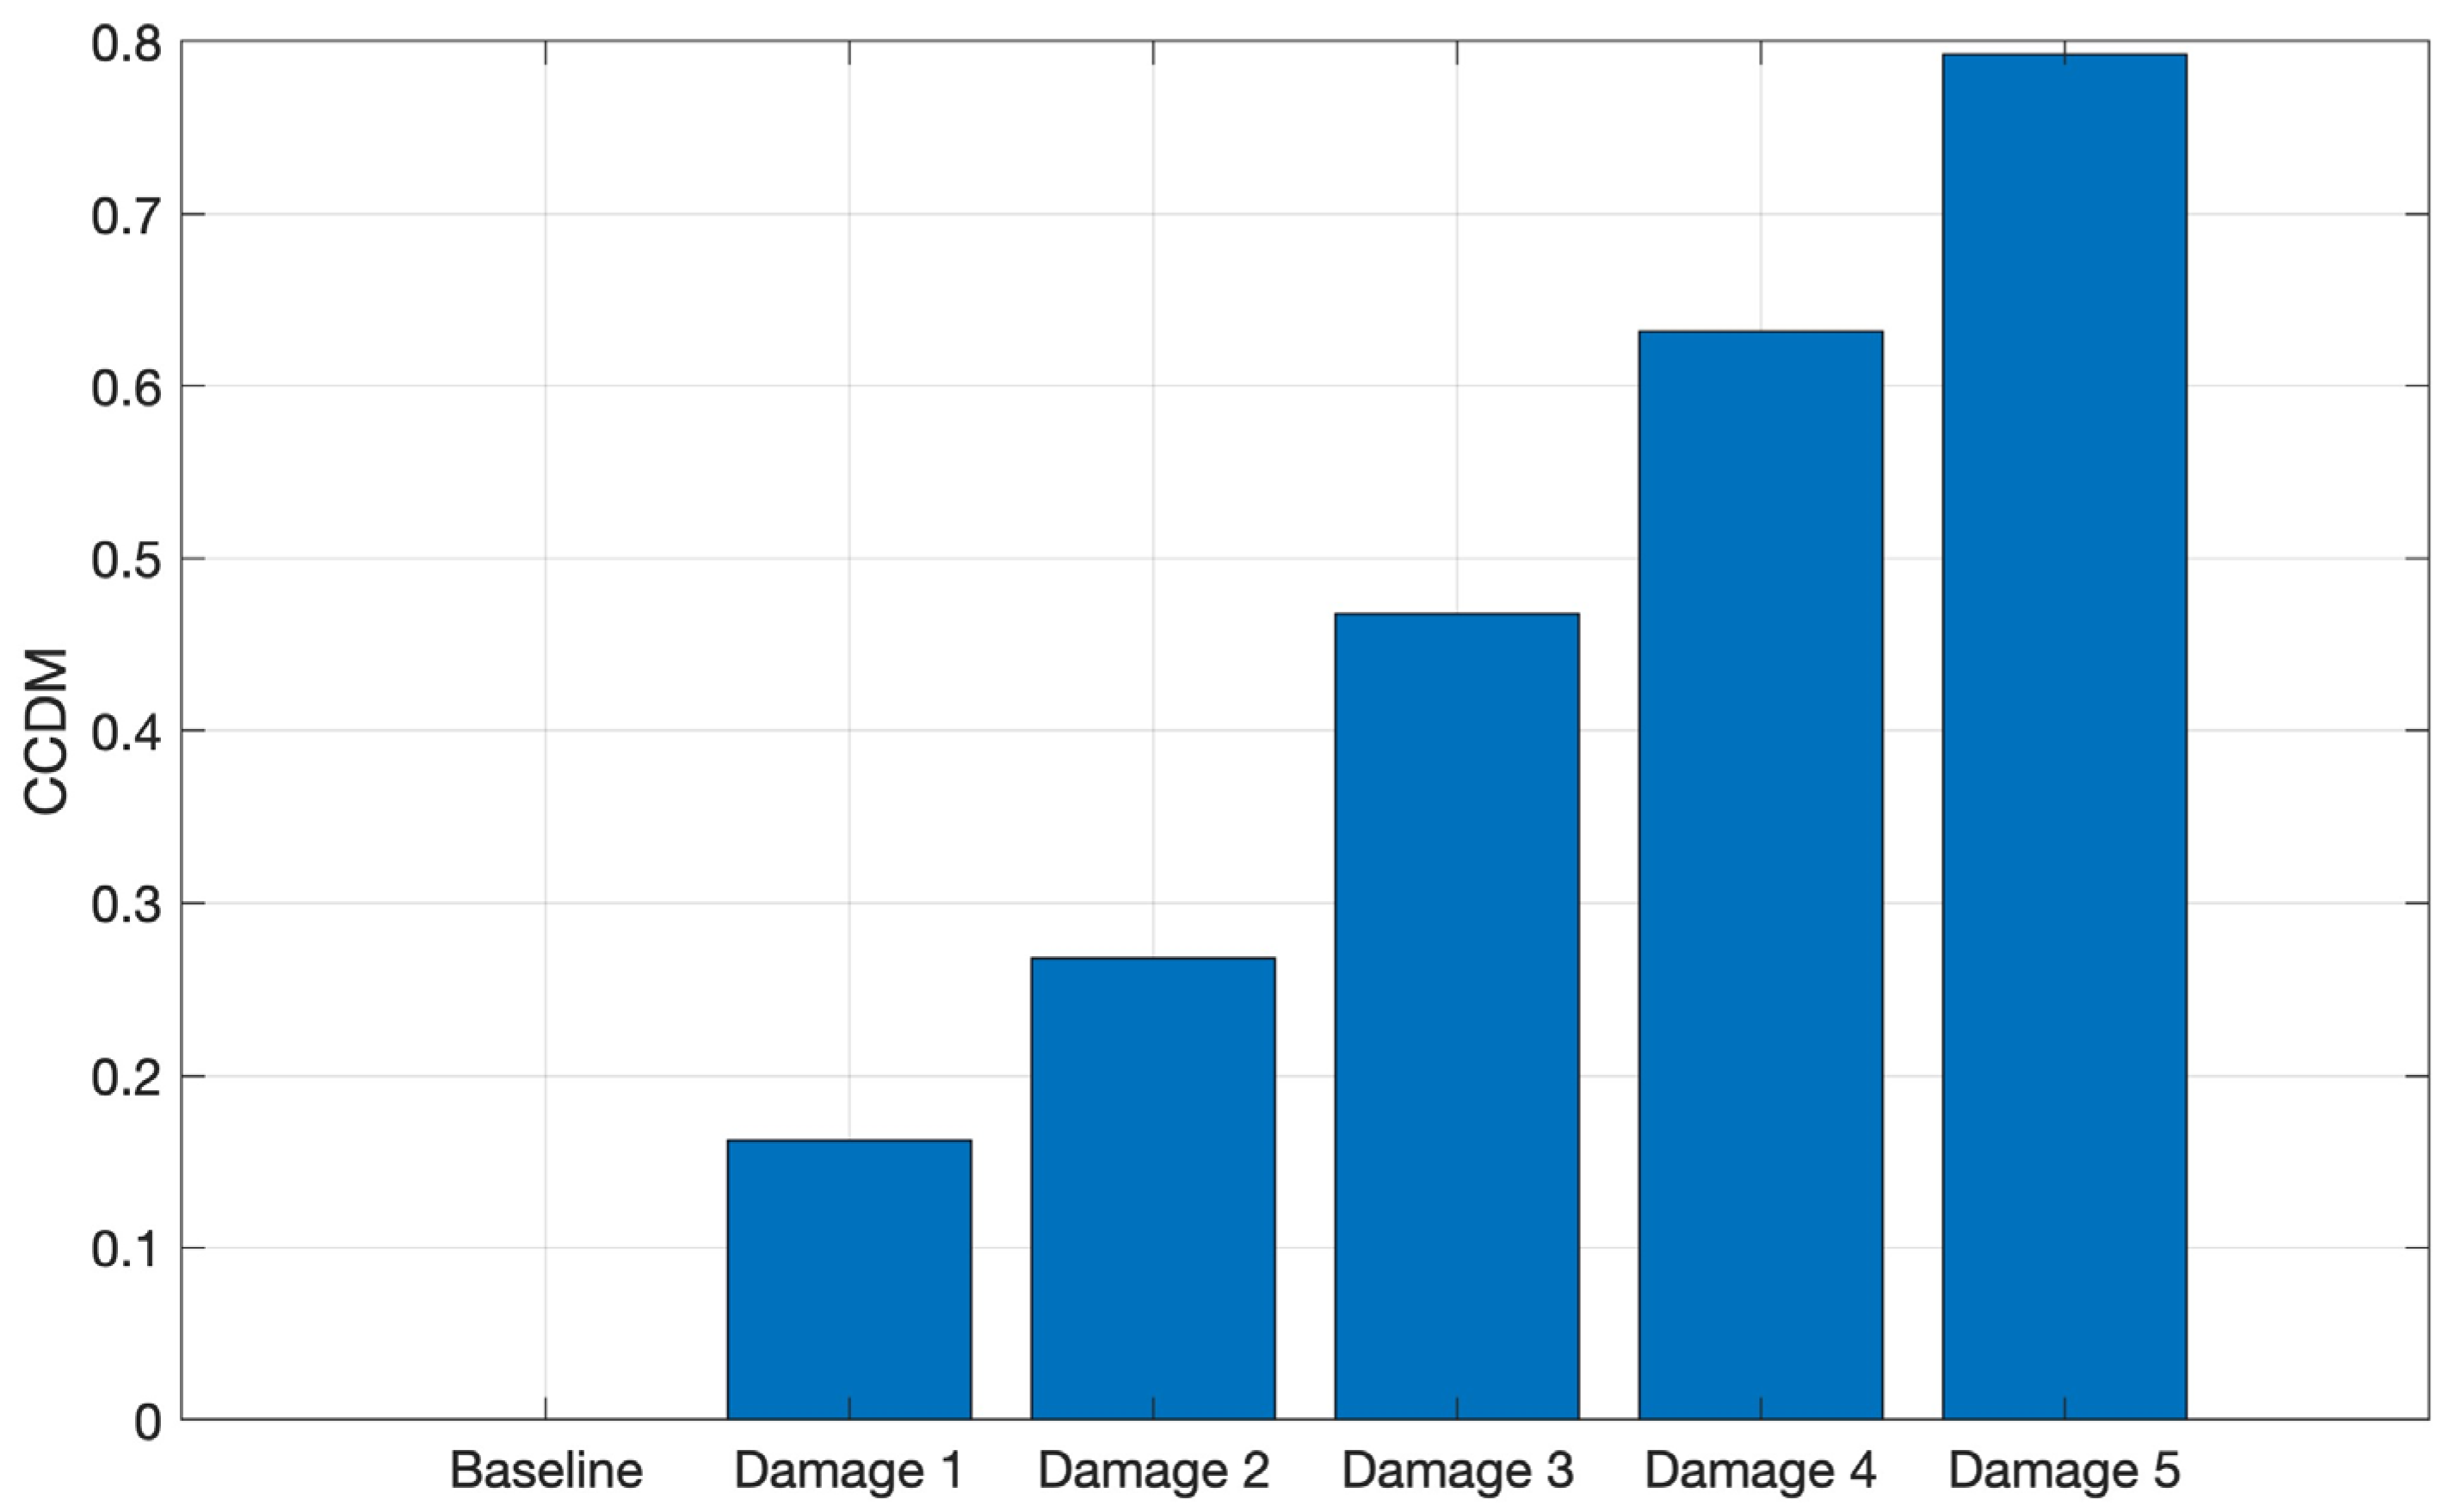
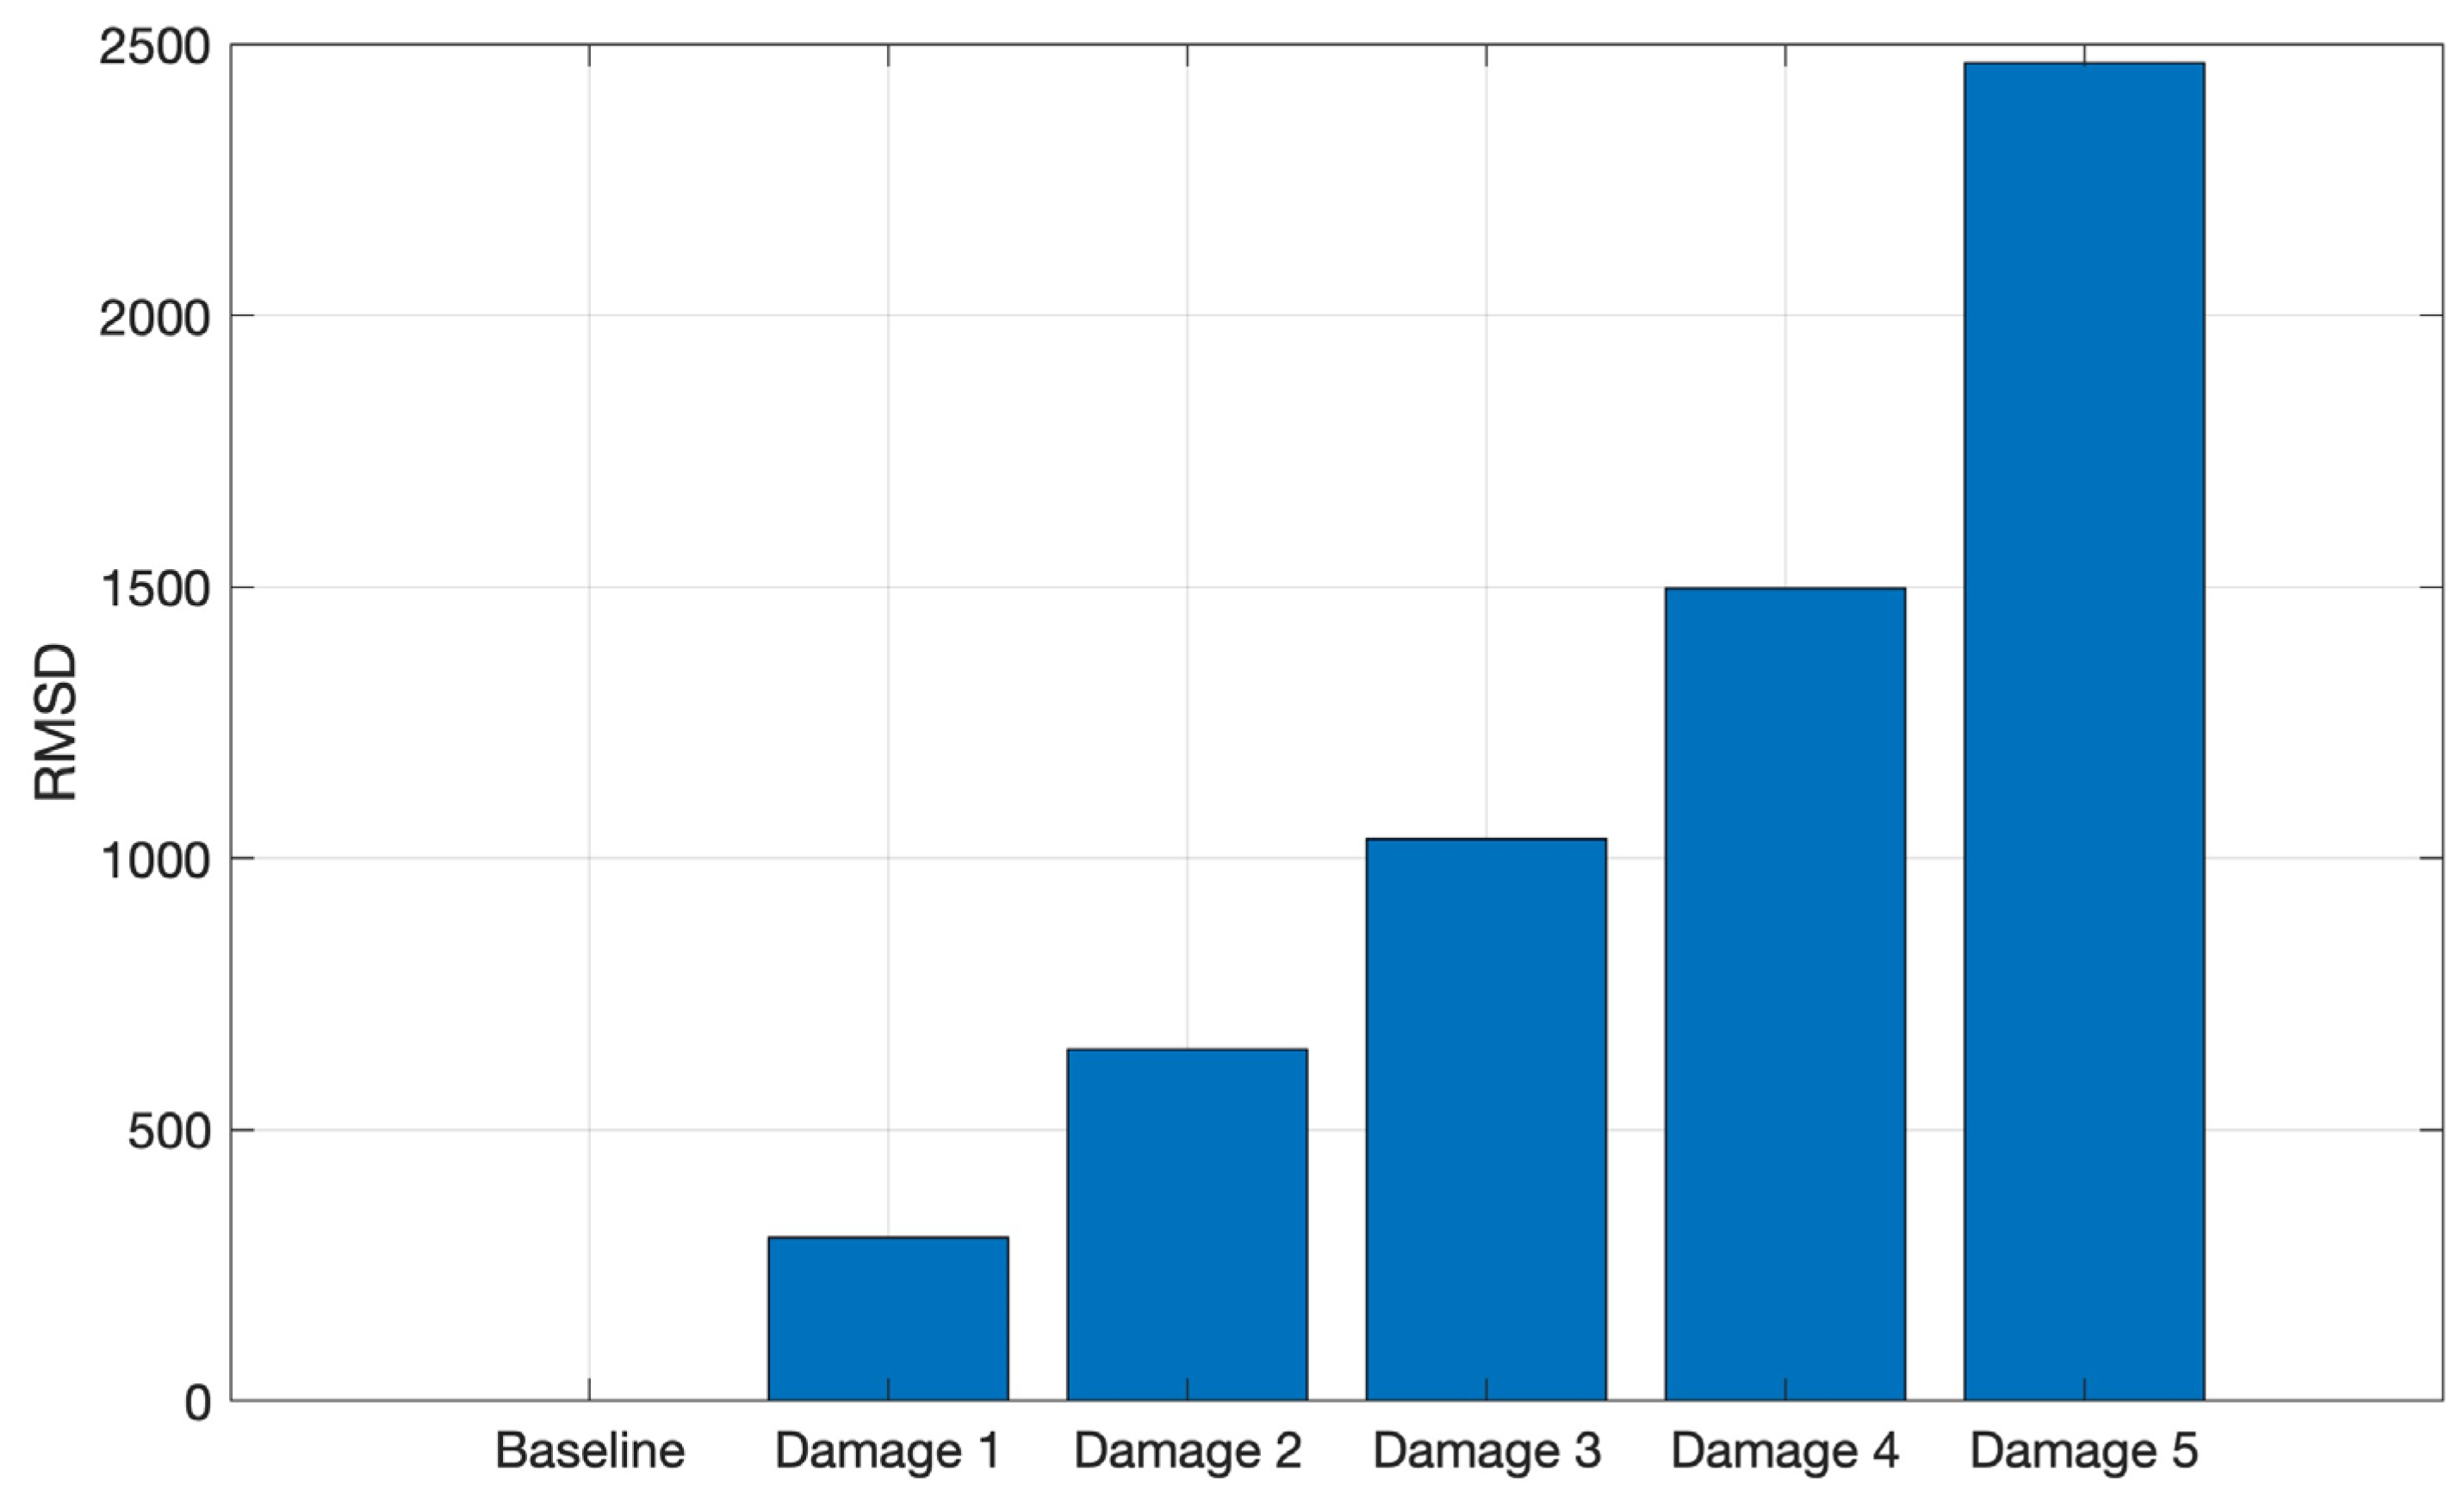
The CCDM and RMSD indices computed in the band of 20 kHz to 24 kHz for the aluminum plate are shown in
Figure 19 and
Figure 20, respectively. As these metrics imply, the sequential increase of these indices is a measure of the progressive increase in signal amplitudes (RMSD) and shifts (CCDM) of each structure-condition spectrum with regard to the baseline.
Therefore, these results show a very good correlation between the indices and the mass variation. The results for the selected frequency band of 8.2 kHz to 8.8 kHz for the CFRP plate show a good correlation to the mass variation as well, but they are not presented herein to avoid repetitiveness. It is worth mentioning that other frequency bands were also found and presented good indices results.
4.8. Coherence between Launch and PLB Tests
To measure how well the signals from the launch tests correspond to the signals from the PLB tests at each frequency, the magnitude-squared coherence (MSC) was computed, as applied in the work of [
42]. The MSC of each repetition was computed for each structure condition and material, and then an average was obtained. The function named coherence available in MATLAB was employed with a hamming window of 218 length and an overlap of 50%.
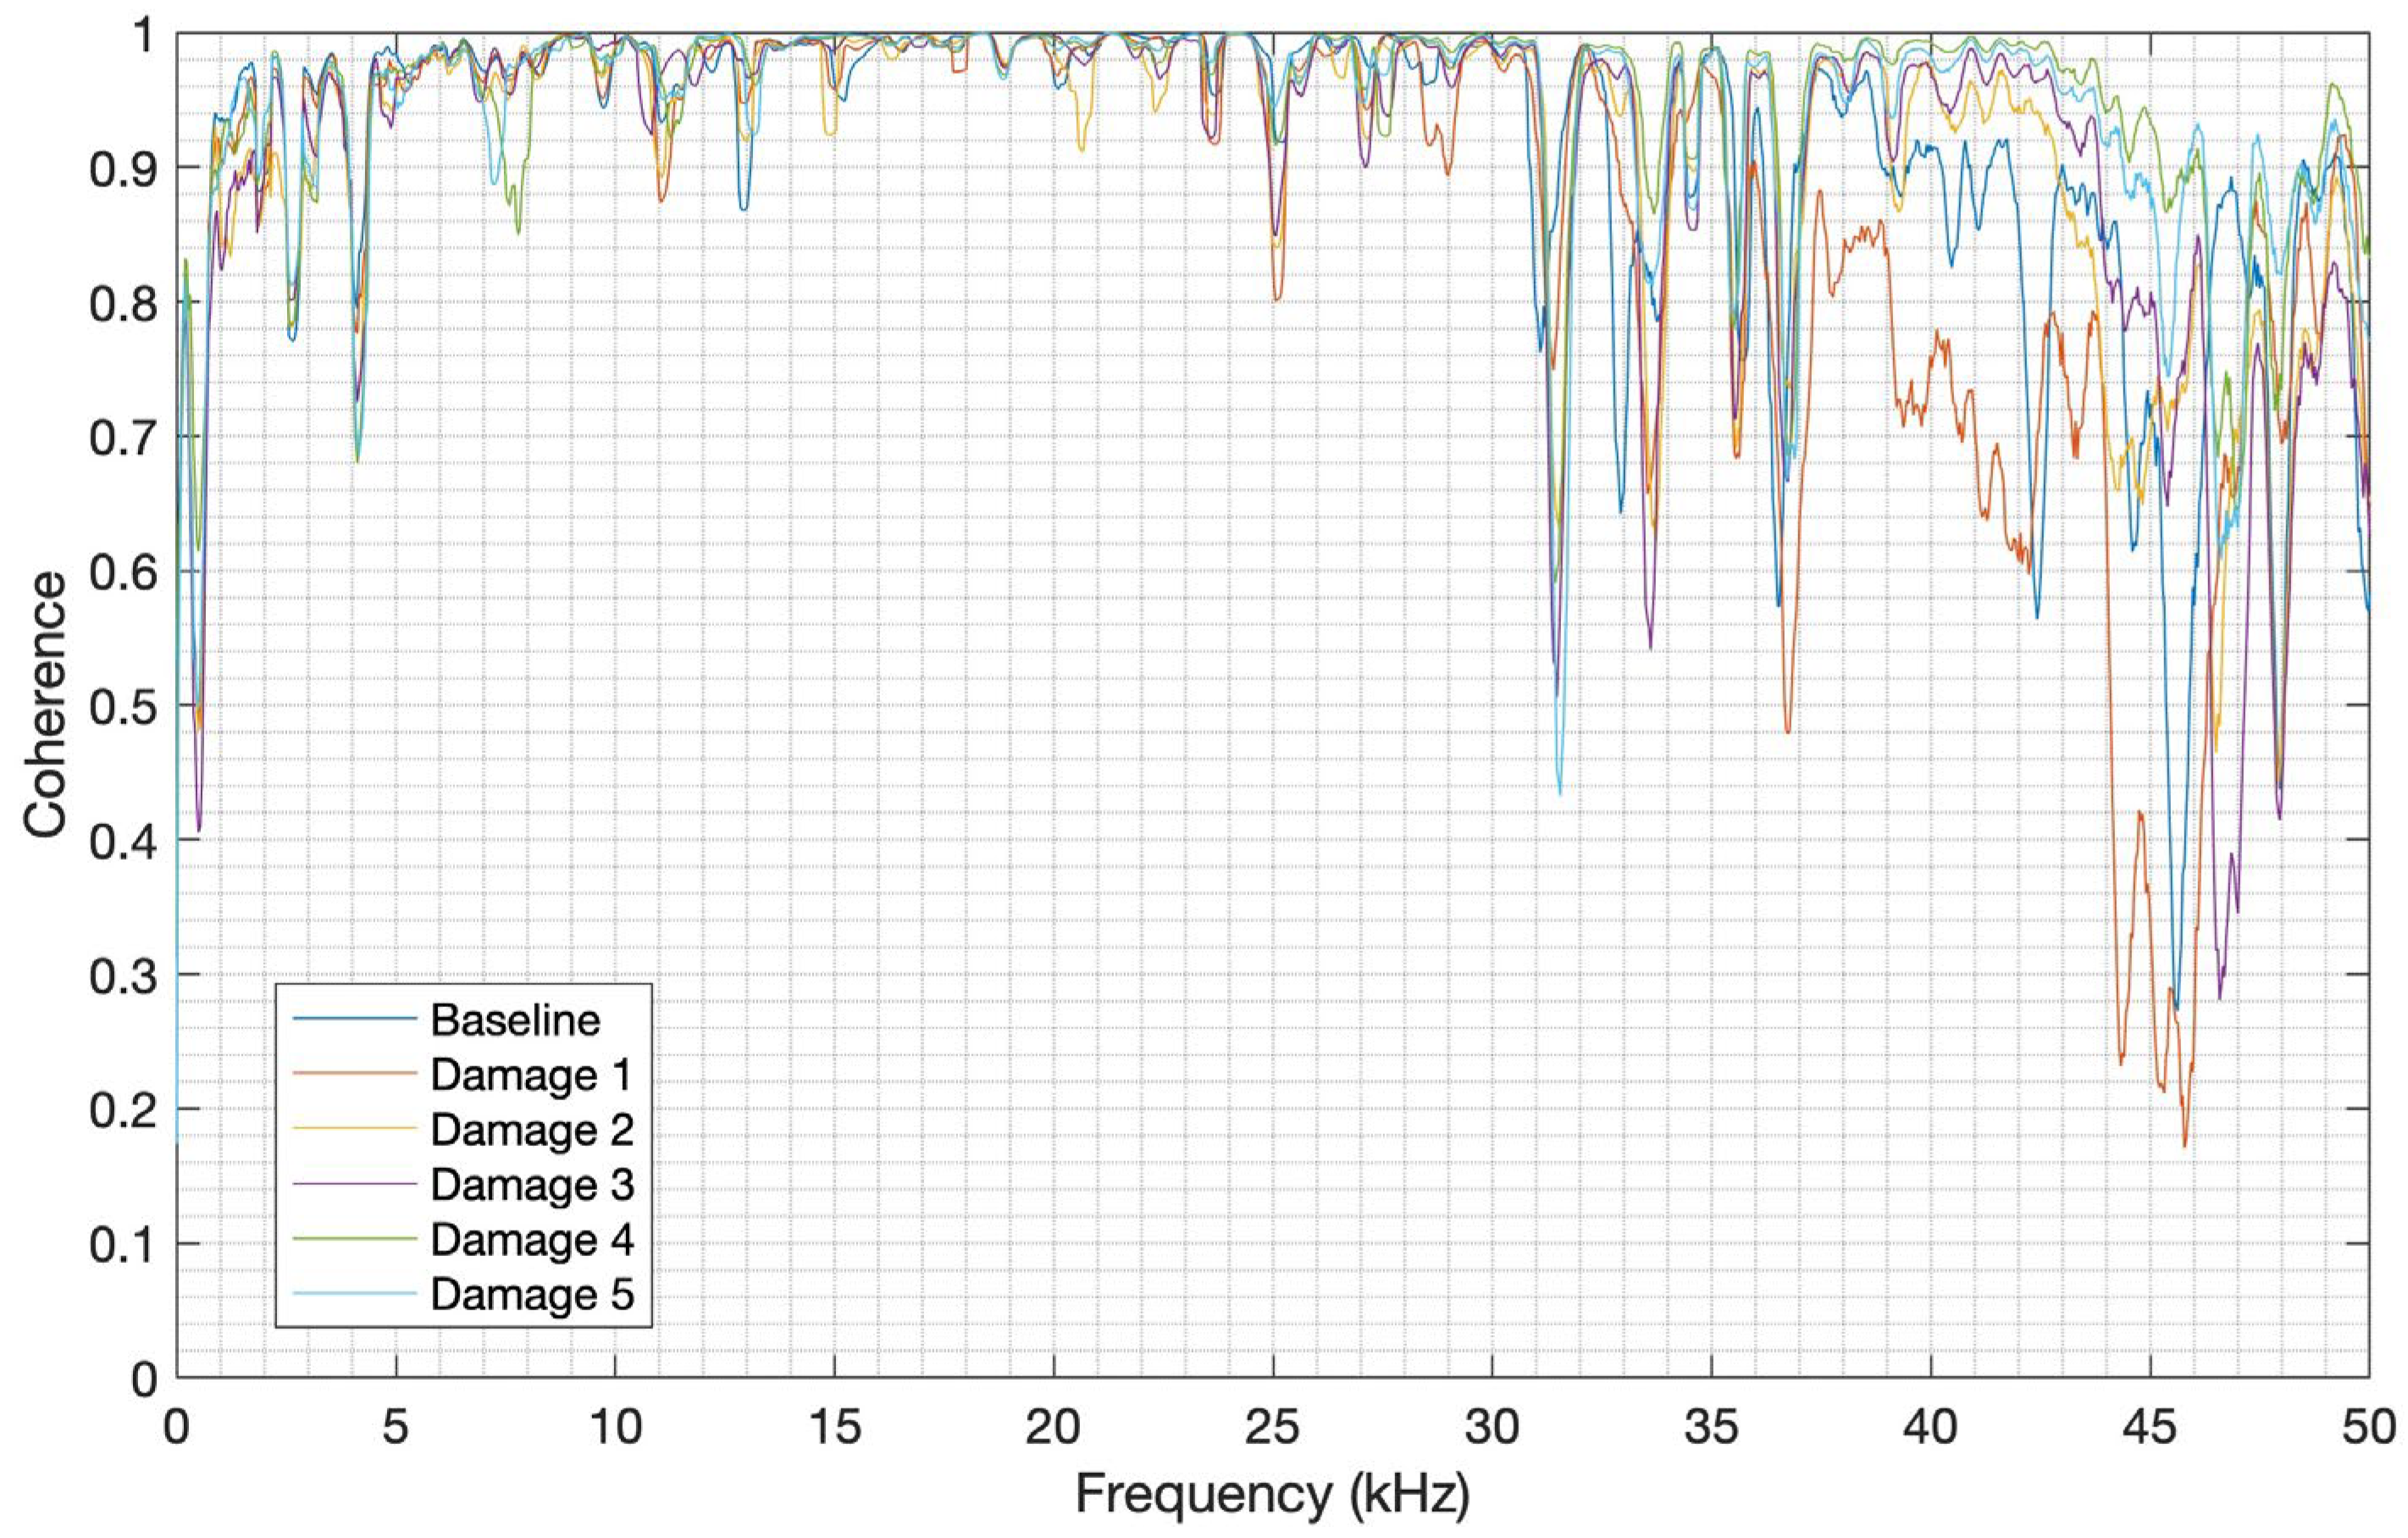
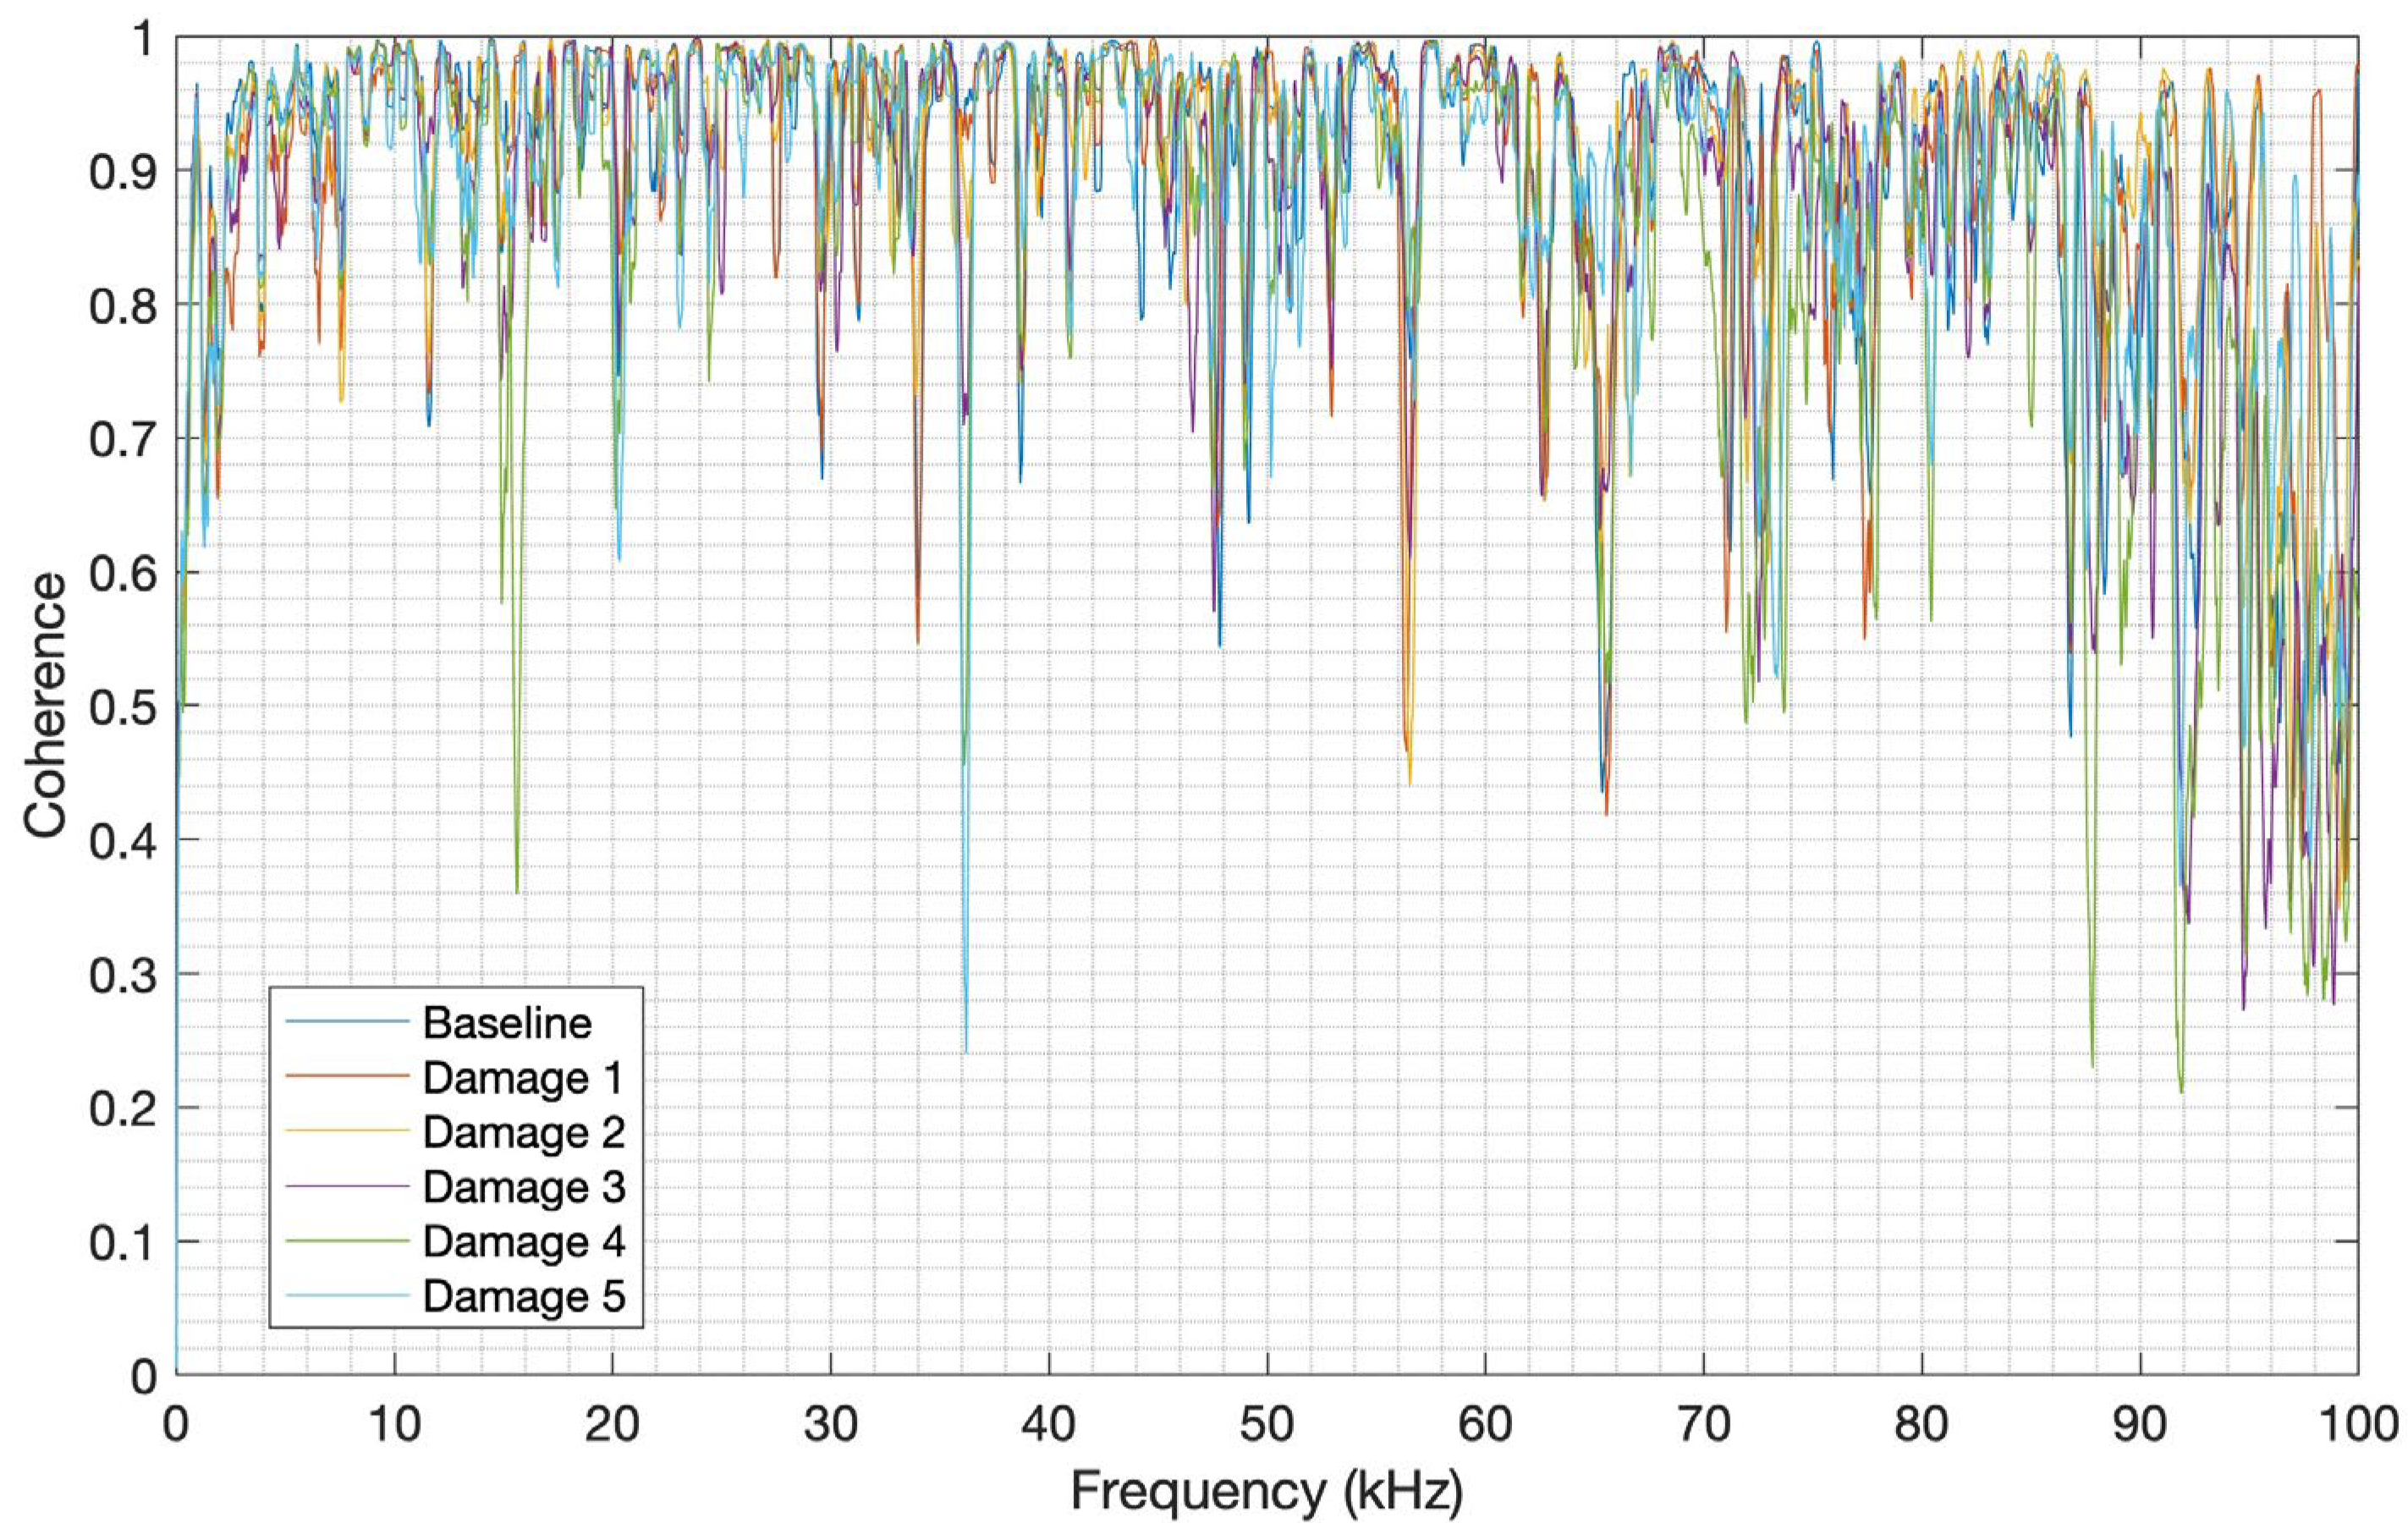
Figure 21 and
Figure 22 show the MSC between the launch and PLB tests for CFRP and aluminum, respectively.
It can be observed in
Figure 20, that the average of the MSC for each CFRP structure condition clearly shows a good correlation (mean value higher than 0.8) between the launch and PLB signals up to 31 kHz. There is however a degradation of signals’ correspondence from this frequency, with the worst MSC of about 0.17 in the frequency band from 44 kHz to 48 kHz. In the case of the aluminum structure, as shown in
Figure 22, the MSC average for each structure condition also presents a good correlation (mean value higher than 0.7) up to nearly 86 kHz, with a degradation of the signals’ correlation from this frequency, reaching the MSC of 0.21 in the frequency band from 86 kHz to 100 kHz. It can therefore be inferred that both launch and PLB methods have a good correlation in most of the useful frequency bands for each material herein studied.
5. Conclusions
The present work proposed a new reproducible acoustic wave generation method for CFRP and aluminum structural monitoring based on launching a metallic sphere and using a piezoelectric diaphragm. The sensor frequency response study conducted by PLB tests showed that the frequency response range for CFRP is about 25 kHz, while for aluminum is up to approximately 90 kHz. On the other hand, the signal amplitudes observed for CFRP were higher than those for aluminum. Then, a study about the elastic deformations caused by the sphere impact on the surfaces was conducted, in which no damage was observed on the CFRP structure, but there was an apparent mark on the aluminum, which could influence the method repeatability for this material. Subsequently, launch tests were conducted on the CFRP structure at different launch heights, whose results showed high correlation coefficients, revealing the high repeatability of the proposed method, with the highest correlation for the 114 mm height. The results for aluminum launch tests, performed on the launch height and impact distance chosen previously, also produced high correlation indexes between repetitions, demonstrating high repeatability for the method on aluminum and also showing that the elastic deformations caused by the sphere impact were insignificant. It is worth mentioning that the maximum signal amplitude caused by the sphere impact was about ten (10) times higher than those obtained for the PLB in both materials, but the same frequency response ranges were observed. Finally, NDT tests for PLB and launch methods were conducted on both materials, in which signal amplitude variations and frequency shifts were observed with the addition of metallic nuts to simulate damage. Based on the spectra, both CCDM and RMSD indexes showed a progressive increase as the masses were added to the structure, demonstrating the effectiveness of both methods in damage detection for these materials. Also, the magnitude-squared coherence between the launch and PLB signals has shown in most of the useful frequency bands good correlation of both methods. It is worth mentioning that the proposed method presented higher repeatability than the PLB method due to the constant control of the launch conditions (height, sphere mass, launch position, and impact point), which does not happen in the PLB method due to the human inaccuracy in handling the pencil when breaking the lead. Furthermore, the proposed method imposes a much higher acoustic energy source on the structure than the PLB, as verified by the signal magnitudes, which enables a wider reach of the structure. Since a piezoelectric transducer was employed, the launching sphere method is a cheap and simple way to generate an impulsive signal on the structure and a good approach for obtaining the transfer function of the structure being inspected. Future studies to improve the technique can be conducted, such as the evaluation of different diameters and materials for the launch sphere, different structural materials, and real damage detection, such as delamination in CFRP, among others.
References
- M. Lints, A. M. Lints, A. Salupere, S. Dos Santos, Numerical simulation of ultrasonic time reversal on defects in carbon fibre reinforced polymer, Wave Motion 94 (2020). [CrossRef]
- M. Altin Karataş, H. M. Altin Karataş, H. Gökkaya, A review on machinability of carbon fiber reinforced polymer (CFRP) and glass fiber reinforced polymer (GFRP) composite materials, Defence Technology 14 (2018) 318–326. [CrossRef]
- M.J. Suriani, H.Z. M.J. Suriani, H.Z. Rapi, R.A. Ilyas, M. Petrů, P. Petrů, S.M. Sapuan, A.B. Gimeno, Delamination and Manufacturing Defects in Natural Fiber-Reinforced Hybrid Composite: A Review, Polymers (Basel) 13 (2021) 1–24. [CrossRef]
- C. Barile, Innovative mechanical characterization of CFRP by using acoustic emission technique, Eng Fract Mech 210 (2019) 414–421. [CrossRef]
- P. Patel, V. P. Patel, V. Chaudhary, Delamination evaluation in drilling of composite materials – A review, Mater Today Proc 56 (2022) 2690–2695. [CrossRef]
- R.B.D. Pereira, L.C. R.B.D. Pereira, L.C. Brandão, A.P. de Paiva, J.R. Ferreira, J.P. Davim, A review of helical milling process, Int J Mach Tools Manuf 120 (2017) 27–48. [CrossRef]
- A.M. Pawlak, T. A.M. Pawlak, T. Górny, Ł. Dopierała, P. Paczos, The Use of CFRP for Structural Reinforcement—Literature Review, Metals (Basel) 12 (2022). [CrossRef]
- W. Sun, Development of a testing methodology for the design and quality control of carbon fiber reinforced polymer (CFRP) anchors, Constr Build Mater 164 (2018) 150–163. [CrossRef]
- S.W. Lee, S. S.W. Lee, S. Han, S. Il Kim, S. Choi, Influence of elevated temperature on the microhardness and microstructure of carbon fiber reinforced polymers, Journal of Reinforced Plastics and Composites 42 (2023) 1220–1228. [CrossRef]
- J. Cui, W. J. Cui, W. Liu, Y. Zhang, L. Han, P. Yin, Y. Li, M. Zhou, P. Wang, A visual inspection method for delamination extraction and quantification of carbon fiber reinforced plastic (CFRP), Measurement (Lond) 196 (2022). [CrossRef]
- Q. Zhao, K. Q. Zhao, K. Zhang, S. Zhu, H. Xu, D. Cao, L. Zhao, R. Zhang, W. Yin, Review on the electrical resistance/conductivity of carbon fiber reinforced polymer, Applied Sciences (Switzerland) 9 (2019). [CrossRef]
- W. Swiderski, Non-destructive testing of CFRP by laser excited thermography, Compos Struct 209 (2019) 710–714. [CrossRef]
- D.Y. Pimenov, M. D.Y. Pimenov, M. Kumar Gupta, L.R.R. da Silva, M. Kiran, N. Khanna, G.M. Krolczyk, Application of measurement systems in tool condition monitoring of Milling: A review of measurement science approach, Measurement (Lond) 199 (2022). [CrossRef]
- Z. He, W. Z. He, W. Li, H. Salehi, H. Zhang, H. Zhou, P. Jiao, Integrated structural health monitoring in bridge engineering, Autom Constr 136 (2022). [CrossRef]
- S. Abbas, F. S. Abbas, F. Li, J. Qiu, A review on SHM techniques and current challenges for characteristic investigation of damage in composite material components of aviation industry, Mater Perform Charact 7 (2018) 224–258. [CrossRef]
- M. Abbas, M. M. Abbas, M. Shafiee, Structural health monitoring (SHM) and determination of surface defects in large metallic structures using ultrasonic guided waves, Sensors (Switzerland) 18 (2018). [CrossRef]
- T. Wandowski, P.H. T. Wandowski, P.H. Malinowski, W.M. Ostachowicz, Delamination detection in CFRP panels using EMI method with temperature compensation, Compos Struct 151 (2016) 99–107. [CrossRef]
- J. Xu, W. J. Xu, W. Wang, Q. Han, X. Liu, Damage pattern recognition and damage evolution analysis of unidirectional CFRP tendons under tensile loading using acoustic emission technology, Compos Struct 238 (2020). [CrossRef]
- M. Fotouhi, M. M. Fotouhi, M. Saeedifar, S. Sadeghi, M. Ahmadi Najafabadi, G. Minak, Investigation of the damage mechanisms for mode I delamination growth in foam core sandwich composites using acoustic emission, Struct Health Monit 14 (2015) 265–280. [CrossRef]
- L. Michalcová, M. L. Michalcová, M. Kadlec, Carbon/epoxy composite delamination analysis by acoustic emission method under various environmental conditions, Eng Fail Anal 69 (2016) 88–96. [CrossRef]
- M. Fotouhi, M.A. M. Fotouhi, M.A. Najafabadi, Acoustic emission-based study to characterize the initiation of delamination in composite materials, Journal of Thermoplastic Composite Materials 29 (2016) 519–537. [CrossRef]
- C. Barile, C. C. Barile, C. Casavola, G. Pappalettera, V. Paramsamy Kannan, Damage monitoring of carbon fibre reinforced polymer composites using acoustic emission technique and deep learning, Compos Struct 292 (2022). [CrossRef]
- B. Feng, A.L. B. Feng, A.L. Ribeiro, H.G. Ramos, A new method to detect delamination in composites using chirp-excited Lamb wave and wavelet analysis, NDT and E International 100 (2018) 64–73. [CrossRef]
- S. Shoja, V. S. Shoja, V. Berbyuk, A. Boström, Delamination detection in composite laminates using low frequency guided waves: Numerical simulations, Compos Struct 203 (2018) 826–834. [CrossRef]
- V.A.D. De Almeida, F.G. V.A.D. De Almeida, F.G. Baptista, P.R. De Aguiar, Piezoelectric transducers assessed by the pencil lead break for impedance-based structural health monitoring, IEEE Sens J 15 (2015) 693–702. [CrossRef]
- J. Xu, Y. J. Xu, Y. Yin, J. Paulo Davim, L. Li, M. Ji, N. Geier, M. Chen, A critical review addressing drilling-induced damage of CFRP composites, Compos Struct 294 (2022). [CrossRef]
- R. Othman, M. R. Othman, M. Hisyam Basri, I. Ismail, M.A. Ab, H. Pahmi, M. Hisyam, M. Basri, H. Sharudin, A. Rahman Hemdi, APPLICATION OF CARBON FIBER REINFORCED PLASTICS IN AUTOMOTIVE INDUSTRY: A REVIEW, 2018. https://www.researchgate.net/publication/337917403.
- S. Amirkhanlou, S. S. Amirkhanlou, S. Ji, A review on high stiffness aluminum-based composites and bimetallics, Critical Reviews in Solid State and Materials Sciences 45 (2020) 1–21. [CrossRef]
- S.J. Joshi, K.S. S.J. Joshi, K.S. Patel, D.B. Shah, K.M. Patel, B.K. Mawandiya, Development and performance analysis of out-of-autoclave curing process for CFRP composites, Advances in Materials and Processing Technologies 8 (2022) 1593–1603. [CrossRef]
- M.G.R. Sause, INVESTIGATION OF PENCIL-LEAD BREAKS AS ACOUSTIC EMISSION SOURCES, J. Acoustic Emission 29 (2011) 184–196.
- X. Yao, B.S. X. Yao, B.S. Vien, N. Rajic, C. Rosalie, L.R.F. Rose, C. Davies, W.K. Chiu, Modal Decomposition of Acoustic Emissions from Pencil-Lead Breaks in an Isotropic Thin Plate, Sensors 23 (2023). [CrossRef]
- N.S. Ghadarah, D. N.S. Ghadarah, D. Ayre, A comparative analysis of acoustic emission sensor embedding in glass fibre composite, Compos Sci Technol 247 (2024). [CrossRef]
- H. Mahajan, S. H. Mahajan, S. Banerjee, Acoustic emission source localisation for structural health monitoring of rail sections based on a deep learning approach, Meas Sci Technol 34 (2023). [CrossRef]
- D.M.S. Ribeiro, P.R. D.M.S. Ribeiro, P.R. Aguiar, L.F.G. Fabiano, D.M. D’Addona, F.G. Baptista, E.C. Bianchi, Spectra Measurements Using Piezoelectric Diaphragms to Detect Burn in Grinding Process, IEEE Trans Instrum Meas 66 (2017) 3052–3063. [CrossRef]
- F.I. Ferreira, P.R. F.I. Ferreira, P.R. De Aguiar, R.B. Da Silva, M.J. Jackson, F.G. Baptista, E.C. Bianchi, Monitoring of Cylindrical Plunge Grinding Process by Electromechanical Impedance, IEEE Sens J 22 (2022) 12314–12322. [CrossRef]
- H.A. Dereshgi, M.Z. H.A. Dereshgi, M.Z. Yildiz, N. Parlak, Performance Comparison of Novel Single and BiDiaphragm PZT Based Valveless Micropumps, Journal o f Applied Fluid Mechanics 13 (2020) 401–412. [CrossRef]
- A.Binotto, B.A. A.Binotto, B.A. de Castro, V.V. dos Santos, J.A.A. Rey, A.L. Andreoli, A Comparison between Piezoelectric Sensors Applied to Multiple Partial Discharge Detection by Advanced Signal Processing Analysis †, Engineering Proceedings 2 (2020). [CrossRef]
- M. Ferreira Batista, I. M. Ferreira Batista, I. Basso, F. de Assis Toti, A. Roger Rodrigues, J. Ricardo Tarpani, Cryogenic drilling of carbon fibre reinforced thermoplastic and thermoset polymers, Compos Struct 251 (2020). [CrossRef]
- B.A. De Castro, D. B.A. De Castro, D. De Melo Brunini, F.G. Baptista, A.L. Andreoli, J.A.C. Ulson, Assessment of Macro Fiber Composite Sensors for Measurement of Acoustic Partial Discharge Signals in Power Transformers, IEEE Sens J 17 (2017) 6090–6099. [CrossRef]
- J.T. Verbis, S.E. J.T. Verbis, S.E. Kattis, S. V Tsinopoulos, D. Polyzos, Wave dispersion and attenuation in fiber composites, Comput Mech 27 (2001) 244–252. [CrossRef]
- A. Gupta, J.C. A. Gupta, J.C. Duke, Identifying the arrival of extensional and flexural wave modes using wavelet decomposition of ultrasonic signals, Ultrasonics 82 (2018) 261–271. [CrossRef]
- B.O. Fernandez, P.R. B.O. Fernandez, P.R. Aguiar, F.A. Alexandre, M.A. Aulestia Viera, E.C. Bianchi, Study of Knock Sensors as Low-Cost Alternatives to Acoustic Emission Sensors, IEEE Sens J 20 (2020) 6038–6045. [CrossRef]
Figure 1.
Workbench schematic diagram.
Figure 1.
Workbench schematic diagram.
Figure 2.
Test bench: oscilloscope (1), piezoelectric diaphragm (2), CFRP or Aluminum plate (3), damage addition point (4), foam sheet (5), launching device (6), voltage source (7), metal nuts (8), metallic sphere (9), aluminum template (10).
Figure 2.
Test bench: oscilloscope (1), piezoelectric diaphragm (2), CFRP or Aluminum plate (3), damage addition point (4), foam sheet (5), launching device (6), voltage source (7), metal nuts (8), metallic sphere (9), aluminum template (10).
Figure 3.
Plastic deformation analysis due to the metallic sphere impact on CFRP: (a) before (b) after.
Figure 3.
Plastic deformation analysis due to the metallic sphere impact on CFRP: (a) before (b) after.
Figure 4.
Plastic deformation study due to the metallic sphere impact on aluminum: (a) 3.9 mm sphere (b) 6.3 mm sphere.
Figure 4.
Plastic deformation study due to the metallic sphere impact on aluminum: (a) 3.9 mm sphere (b) 6.3 mm sphere.
Figure 5.
The raw signal of repetition 1 from PLB tests on CFRP.
Figure 5.
The raw signal of repetition 1 from PLB tests on CFRP.
Figure 6.
Average frequency spectra from PLB tests on CFRP.
Figure 6.
Average frequency spectra from PLB tests on CFRP.
Figure 7.
Average frequency spectra from PLB tests on aluminum.
Figure 7.
Average frequency spectra from PLB tests on aluminum.
Figure 8.
Raw signal from launch tests on CFRP.
Figure 8.
Raw signal from launch tests on CFRP.
Figure 9.
Average frequency spectra from launch tests on CFRP.
Figure 9.
Average frequency spectra from launch tests on CFRP.
Figure 10.
Frequency spectra from launch tests on Aluminum.
Figure 10.
Frequency spectra from launch tests on Aluminum.
Figure 11.
Launch tests adding mass to CFRP.
Figure 11.
Launch tests adding mass to CFRP.
Figure 12.
Launch tests adding mass to aluminum.
Figure 12.
Launch tests adding mass to aluminum.
Figure 13.
CCDM applied for the tests conducted on CFRP in the frequency band from 1 kHz to 9 kHz.
Figure 13.
CCDM applied for the tests conducted on CFRP in the frequency band from 1 kHz to 9 kHz.
Figure 14.
CCDM applied for the tests conducted on aluminum in the frequency band from 8 kHz to 16 kHz.
Figure 14.
CCDM applied for the tests conducted on aluminum in the frequency band from 8 kHz to 16 kHz.
Figure 15.
RMSD applied for the tests conducted on CFRP in the frequency band from 8 to 16 kHz.
Figure 15.
RMSD applied for the tests conducted on CFRP in the frequency band from 8 to 16 kHz.
Figure 16.
RMSD applied for the tests conducted on aluminum in the frequency band from 8 kHz to 16 kHz.
Figure 16.
RMSD applied for the tests conducted on aluminum in the frequency band from 8 kHz to 16 kHz.
Figure 17.
PLB tests adding mass to CFRP.
Figure 17.
PLB tests adding mass to CFRP.
Figure 18.
PLB tests adding mass to aluminum.
Figure 18.
PLB tests adding mass to aluminum.
Figure 19.
CCDM for CFRP in the frequency band from 20 kHz to 24 kHz.
Figure 19.
CCDM for CFRP in the frequency band from 20 kHz to 24 kHz.
Figure 20.
RMSD for CFRP in the frequency band from 20 kHz to 24 kHz.
Figure 20.
RMSD for CFRP in the frequency band from 20 kHz to 24 kHz.
Figure 22.
MSC for aluminum.
Figure 22.
MSC for aluminum.
Table 1.
Comparison between CFRC and aluminum features.
Table 1.
Comparison between CFRC and aluminum features.
| Feature |
CFRC |
Aluminum |
| Density |
Variable (around 1.5 g/cm3) |
Around 2.7 g/cm3
|
| Materials |
Carbon fibers embedded in a plastic (polymer) matrix |
Pure or alloy (copper, magnesium, silicon, or zinc) |
| Cost |
More expansive |
Cheaper |
| Thermal and Electrical Conductivity |
Lower |
Higher |
| Strength and stiffness |
Higher |
Lower |
Table 2.
Correlation coefficients.
Table 2.
Correlation coefficients.
| Positions |
Average |
Standard deviation |
| Position 1 (70 mm) |
0.9269 |
0.0480 |
| Position 2 (210 mm) |
0.9250 |
0.0543 |
Table 3.
Correlation coefficient for aluminum.
Table 3.
Correlation coefficient for aluminum.
| Positions |
Correlation coefficient |
| Test 1 and test 2 |
0.9934 |
| Test 1 and test 3 |
0.9851 |
| Test 2 and test 3 |
0.9918 |
Table 4.
Correlation coefficient for CFRP launch tests.
Table 4.
Correlation coefficient for CFRP launch tests.
| Launch height (mm) |
Average correlation coefficient |
Standard Deviation |
| 38 mm |
0.9972 |
0.00240 |
| 76 mm |
0.9994 |
0.00014 |
| 114 mm |
0.9997 |
0.00003 |
| 152 mm |
0.9995 |
0.00026 |
| 190 mm |
0.9995 |
0.00027 |
| 490 mm |
0.9990 |
0.00073 |
Table 5.
Correlation coefficient for aluminum launch tests.
Table 5.
Correlation coefficient for aluminum launch tests.
| Launches |
Correlation coefficient |
| Launch 1 and Launch 3 |
0.9945 |
| Launch 1 and Launch 5 |
0.9968 |
| Launch 1 and Launch 7 |
0.9914 |
|
Disclaimer/Publisher’s Note: The statements, opinions and data contained in all publications are solely those of the individual author(s) and contributor(s) and not of MDPI and/or the editor(s). MDPI and/or the editor(s) disclaim responsibility for any injury to people or property resulting from any ideas, methods, instructions or products referred to in the content. |
© 2024 by the authors. Licensee MDPI, Basel, Switzerland. This article is an open access article distributed under the terms and conditions of the Creative Commons Attribution (CC BY) license (https://creativecommons.org/licenses/by/4.0/).
