Submitted:
10 August 2024
Posted:
14 August 2024
Read the latest preprint version here
Abstract
A multi-environment evaluation of sorghum genotypes was conducted across six environments in the 2021 main growing season in a randomized complete block design with three replications. The objectives of the study were to estimate the magnitude of genotypes by environment interaction (GEI) and grain yield stability of drought-tolerant sorghum genotypes across different environments. Data were subjected to analysis of variance, Additive Main Effects and Multiplicative Interaction (AMMI), and GGE biplot analysis. Combined analysis of variance revealed significant variations among genotypes, environments, and GEI for yield and yield-related traits, indicating that these factors significantly affected grain yield. The maximum mean grain yield value of genotypes due to the mean effect of the environment was obtained from G1 (5119.93kg ha-1), followed by G14 (4834.57 kg ha-1), and G18 (4801.20 ha-1), while the least mean grain yield was obtained from G3 (3314.50 kg ha-1). The multiplicative variance of the treatment sum of squares due to GEI was partitioned into four principal component axes (PCA). Sum squares of the first and second interaction principal component axis (IPCA) explained 71.07% and 17.50% of the GEI variation, respectively. The IPCA1&2 mean squares were highly significant (P≤0.01), indicating the adequacy of the AMMI model with the first two IPCAs for cross-validation of grain yield variation. The magnitude of the GEI sum squares was 3.9 times that of the genotype sum squares for grain yield, indicating the presence of substantial differences in genotypic responses across environments. The results of cultivar superiority measure (Pi), yield stability index (YSI), AMMI stability value (ASV), regression coefficient (bi), and deviation from regression (S2di) depicted that genotypes G18, G22, G31, and 32 were the most stable genotypes for grain yield and biomass yield, respectively. AMMI2 biplot showed Jinka, Alduba, and Kako were the most discriminating environments as indicated by the long distance from the origin; whereas testing locations Meioso and Gato with short vector length indicated that these locations had less discriminating power on the genotypes' performance. The study has provided precious information on the yield stability status of the sorghum genotypes and the best environments for future improvement programs in Ethiopia.
Keywords:
AMM1 biplot
; ASV
; Yield stability index
; cultivar superiority measure
1. Introduction
Sorghum [Sorghum bicolor (L.) Monech ] is the fifth most important cereal crop in the world, after wheat, rice, maize, and barley[1]. It is a C4 plant that has high photosynthetic efficiency and originated in the Ethiopian region [2]. Multi-environment trials are used to select the best-performing genotype for different locations and environmental conditions. Plant breeders need to identify drought-tolerant genotypes with stable yield performance in various environments. Developing countries require stable cultivars with high yields.
In Ethiopia, several studies have been conducted to investigate the interaction between genotype and environment when it comes to crops like sorghum [3,4,5,6,7], maize [8,9], wheat [10], teff [11], and finger millet [12]. However, there is limited information available on the impact of genotype, environment, and GEI on sorghum yield using drought-tolerant genotypes in Ethiopia. To address this gap, a study was carried out to determine the extent of the effect of genotypes by environment interaction and to assess the performance and stability of drought-tolerant sorghum genotypes that show promise for adaptation to different conditions and cultivation under farmers’ conditions in Ethiopia.
2. Materials and Methods
2.1. Description of the Study Area
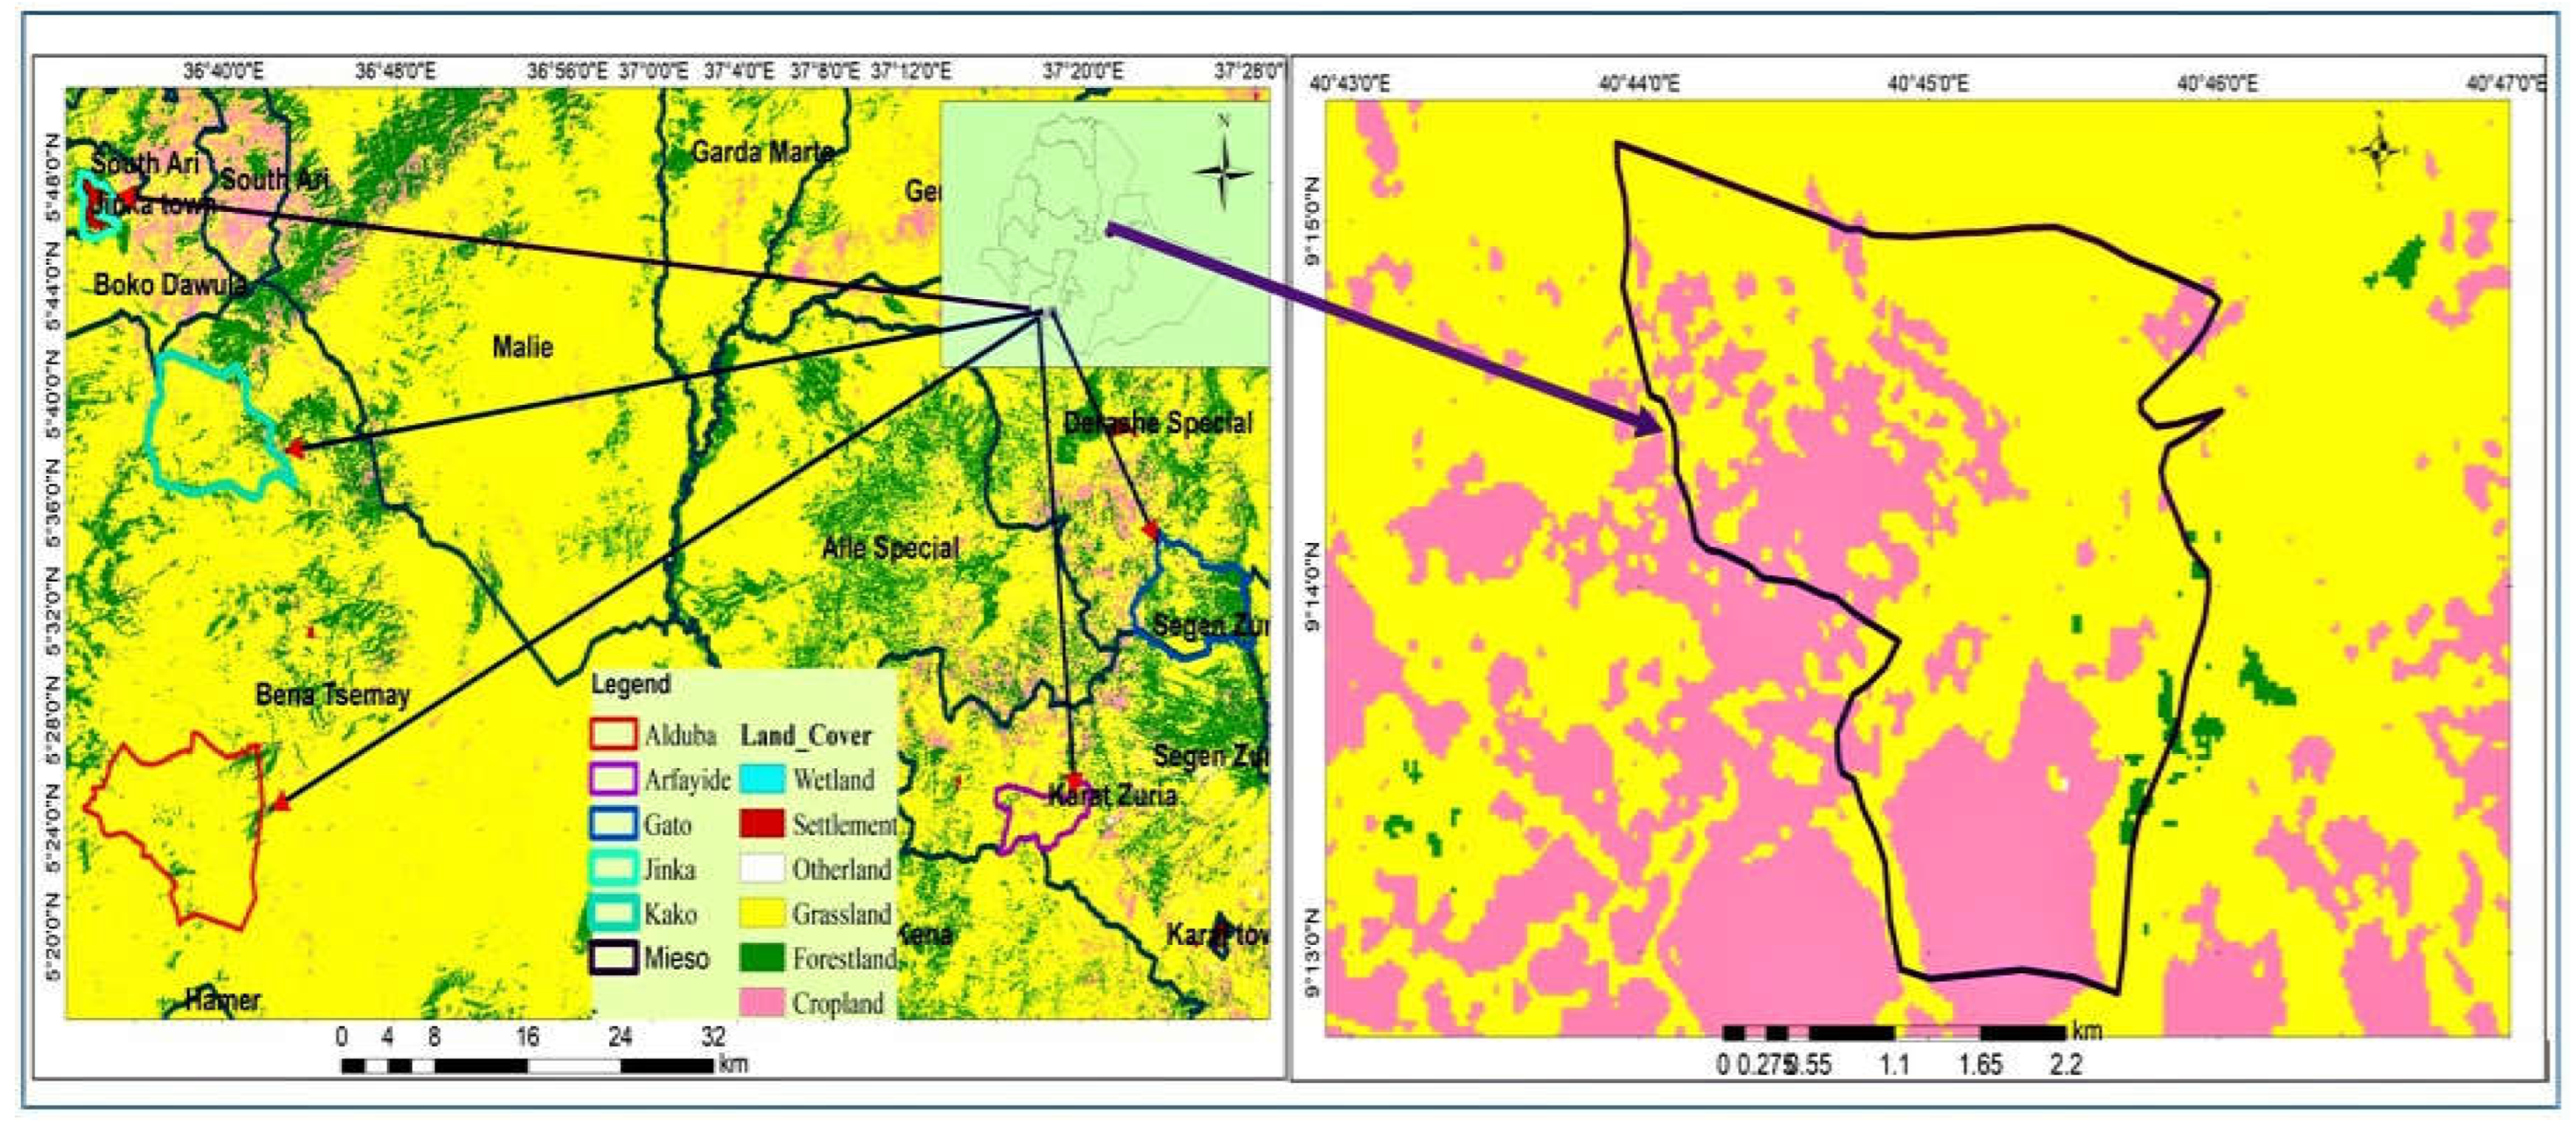
The experiment was conducted at six locations during the 2021 main cropping season. These locations represent the main lowland sorghum-growing areas of the country (Figure 1).
Figure 1.
Study area map. Different colors designate land cover of study locations.
2.2. Trial Materials
Thirty-four genotypes were selected based on their drought performance from the moisture stress trial conducted at Weoito(Table A1 and Table A2), and two standard check varieties were included. A list of genotypes used for genotype-by-environment experiments is provided in (Table 2).

Table 2.
List of genotypes used for genotypes by environment experiments.
| Serial no. | Genotypes | Code | Source |
| 1 | 27907 | G1 | EBI |
| 2 | 69313 | G2 | EBI |
| 3 | 69330 | G3 | EBI |
| 4 | 70084 | G4 | EBI |
| 5 | 70154 | G5 | EBI |
| 6 | 70373 | G6 | EBI |
| 7 | 71018 | G7 | EBI |
| 8 | 74654 | G8 | EBI |
| 9 | 74669 | G9 | EBI |
| 10 | 74679 | G10 | EBI |
| 11 | 74680 | G11 | EBI |
| 12 | 74684 | G12 | EBI |
| 13 | 74686 | G13 | EBI |
| 14 | 74691 | G14 | EBI |
| 15 | 74693 | G15 | EBI |
| 16 | 74704 | G16 | EBI |
| 17 | 74705 | G17 | EBI |
| 18 | 200617 | G18 | EBI |
| 19 | 201453 | G21 | EBI |
| 20 | 204602 | G22 | EBI |
| 21 | 204619 | G23 | EBI |
| 22 | 204629 | G24 | EBI |
| 23 | 204631 | G25 | EBI |
| 24 | 204633 | G26 | EBI |
| 25 | 204634 | G27 | EBI |
| 26 | 206285 | G28 | EBI |
| 27 | 206286 | G29 | EBI |
| 28 | 213008 | G30 | EBI |
| 29 | 213017 | G31 | EBI |
| 30 | 213019 | G32 | EBI |
| 31 | 213026 | G33 | EBI |
| 32 | 214010 | G34 | EBI |
| 33 | 214109 | G35 | EBI |
| 34 | 216906 | G36 | EBI |
| 35 | Dekeba( Standard check ) | G19 | MARC |
| 36 | Melkam( Standard check) | G20 | MARC |
EBI =Ethiopian Biodiversity Institute (EBI), MARC=Melkassa Agricultural Research Center.
2.2.1. Experimental Design and Procedures
The experiment used randomized complete block design with three replications at all locations with plot size of 3.75mX5m. Seeds were drilled into 5-meter-long paired rows spaced 0.75 meters apart. Weeds were removed from the plots 2-3 weeks after sowing. The seed rate was 15 kg/ha, and plots received NPS fertilizer at planting (19 kg/ha N, 38 kg/ha P2O5, and 7 kg/ha S), with an additional 23 kg/ha of nitrogen in the form of urea applied at 45 days after planting. Data was collected from the four middle rows.
2.2.2. Data Collection
Data was collected on sorghum based on descriptors developed by the International Board for Plant Genetic Resources [13]. At maturity, yield components were recorded, including panicle length, panicle weight, panicle yield, and thousand kernel weight. Data was collected on a plot basis and plant basis, including measurements of straw weight, grain yield, total biomass, harvest index, and panicle weight.
2.2.3. Data Analyses
Various statistical software packages were used to analyze the data. SAS software 9.0 was used for combined analyses of variance and mean comparison with the LSD test [14]. Additionally, GEA-R Version 4.1 was used for several analyses, including AMMI analysis and GGE biplot stability analysis [15].
Analysis of Variance for Individual location and Combined Data over the Location
The data from different locations were analyzed using a mixed linear model through the analysis of variance based on Gomez and Gomez [16]. Bartlett’s test was used to check the homogeneity of error variances before combining the analysis [17]. The combined analysis of variance was conducted using SAS software 9.0[14] to determine the differences between genotypes across and among environments and their interaction. In the combined analysis, genotypes were considered as fixed while locations were considered a random variable. The following model was used for ANOVA of data of individual location:
where; Yij = observed value of genotype i in block j, µ = Grand mean of the experiment, Gi= the effect of genotype i, Bj = the effect of block j, eij =the error of genotype i in block j.
Yij =µ + Gi +Bj + eij
Combined analysis of variance over locations was carried out using the following statistical model:
where; Yijk = observed value of genotype i in block k of environment (location) j, μ = Grand mean of the experiment, Gi = the effect of genotype i, GEj = the interaction effect of genotype i with environment j, Bk(j) =the effect of block k in location (environment) j, eijk =the error effect of genotype i in block k of environment j. Mean separation was done using Duncan multiple range test to discriminate the genotypes and identify superior ones based on yield.
Yijk=μ + Gi +Ej +GEij+ Bk(j)+ eijk
Stability Analysis
Analysis of variance only detects genotype by environment interaction effects. To determine the stability of a genotype’s performance across different environments, breeders need additional information. Stability depends on the genetic structure of the cultivar’s population and the genotype of individual plants. So, the significance of genotype by environment interaction was further analyzed using stability parameters. Means of genotypes for grain yield across locations were analyzed using SAS [18]. AMMI model, biplot technique, and AMMI stability value analysis were computed per standard procedures.
AMMI Analysis
The Additive Main effect and Multiplicative Interaction (AMMI) model analysis was performed for grain yield and biomass. The AMMI model equation is given as:
where, yij= is the observed yield of genotype i in environment j
μ = is the grand mean, = the additive effect of the ith genotype (genotype means minus the grand mean), =is the additive effect of the jth environment (environment mean deviation), = is the eigenvalues of the PCA axis n, = are scores for the genotype i and environment j for the PCA axis n, = is the residual for the first n multiplicative components, = is the error
AMMI Stability Value (ASV)
The AMMI stability value as described by Purchase [19] was calculated as follows:
Where;
ASV= AMMI stability value, IPCAA1 = interaction principal component analysis 1, IPCAA2 = interaction principal component analysis 2, SSIPCAA1 = sum of square of the interaction principal component one, SSIPCAA2 = sum of square of the interaction principal component two.
3. Results and Discussion
3.1. Combined Analysis of Variance
In the study, significant differences were found in the environment, genotype, and genotype by environment interactions for all traits studied (Table 1). Our findings are in agreement with an earlier study on bread wheat [20]. The AMMI analysis revealed that a large portion of the variation was attributed to environmental effects (69.29%) followed by genotype by environment interactions (24.49%) and genotype effects (6.22%). This suggests that the performance of sorghum genotypes varied across different locations, highlighting the need for further evaluation of genotypes with wider adaptability and testing them in diverse environments. The diversity in environments indicated by the large sum of squares emphasizes the importance of testing sorghum genotypes at multiple locations to account for variations in climatic and soil conditions. These findings are consistent with earlier studies [21,22,23] on sorghum and support the idea that testing genotypes across various environments is crucial for understanding their performance and adaptation.
3.2. Mean Performance of Genotypes
Grain Yield
The analysis of variance results for each environment showed significant differences (P≤0.01) in grain yield among sorghum genotypes tested at multiple locations (Table 1). This aligns with previous studies on sorghum that also reported significant variations in grain yield among different varieties [24]. The tested genotypes exhibited varying performances for grain yield across the different environments, with the mean grain yield ranging from 1148.1 kg/ha for genotype G34 at Arfayide to 9137 kg/ha for genotype G36 at Jinka, with an overall environmental mean yield of 4250.12 kg/ha (Table 2). The average environmental grain yield varied from 1721.61 kg/ha at Arfayide to 6182.31 kg/ha at Jinka, while the average genotype grain yield across environments ranged from 3314.50 kg/ha for genotype G3 to 5119.93 kg/ha for G1(Table 2). These findings indicate that it is crucial to evaluate sorghum genotypes in various environments to comprehend their adaptability and performance variations. Additionally, the study demonstrated that the GEI sum square magnitudes were around 3.9 times greater than those of the genotypes sum squares for grain yield. This suggests significant differences in genotypic responses across different environments, resulting in observed variations in genotypic responses across environments. These findings align with the research by Amare et al. [24], which also highlighted a threefold difference in the magnitude of the GEI sum of squares compared to wheat genotypes, indicating substantial variations in genotypic responses across environments. The larger sum of squares of GEI relative to genotypes underscores the significant differences in genotypic responses across environments, emphasizing the considerable variance in genotypic responses across different conditions. Consequently, GEI poses challenges to the selection process by complicating the assessment of genotypes’ yield performance and weakening the correlation between genotypic and phenotypic values [25]. The GEI observed in this study follows a cross-over pattern, leading to shifts in genotype rankings for specific environments, making it challenging to interpret grain yield based solely on genotype and environment means. These findings are consistent with the findings of Tekle et al. [26] regarding mung bean.
The highest mean grain yields across the environment were recorded for the genotypes (G1 and G14), with a mean yield of (5119.93 and 4834.57 kg ha-1), respectively. Whereas, the lowest mean grain yield was recorded from the genotype (G3) with an average mean yield of 3314.50 kg ha-1 (Table 2), indicating that the tested genotypes had inconsistent performance across the tested environments. In this study, most of the tested genotypes gave relatively good grain yield performance, and it could be suggested that there is an opportunity to get high-yielding sorghum genotypes for future variety development. The large variation due to the environments in our study also confirmed the high diversity of weather conditions during growing seasons and the locations had different soil types, temperature, and rainfall as well as altitude, directly affecting the performances of the genotypes. Thus, the selection and development of sorghum varieties in the future should follow environment-specific approaches. This result is in agreement with the work of Yitayeh et al. [22] and Abiy[27] on the early maturing sorghum genotype, who reported that the performance of sorghum genotypes was different from location to location, similar to that of Tegegn et al. [28] in finger millet. Ranking based on the genotype-focused scaling assumed that stability and mean yield were equally important [29].
The best candidate genotypes were expected to have a high mean seed yield with stable performance across all test locations. However, such genotypes are very rare to find in practice. Therefore, high-yielding and relatively stable genotypes can be considered as a reference for genotype evaluation [30].
Table 1.
Analysis of variance of morphological traits between genotypes (G), environment (E) and GEI interaction for 36 sorghum genotypes across six locations.
Table 1.
Analysis of variance of morphological traits between genotypes (G), environment (E) and GEI interaction for 36 sorghum genotypes across six locations.
| Trait | DF | MD | GFP | PHT | ||||||
| Source of variation | df | MS | Percent | MS | Percent | MS | Percent | MS | Percent | |
| Environment(E) | 5 | 3026.16** | 28.64 | 17357.93** | 56.66 | 8170.96** | 44.99 | 120104.56** | 28.38 | |
| Genotype (G) | 35 | 150.20** | 9.95 | 150.84** | 3.45 | 77.04** | 3.01 | 13494.25** | 22.32 | |
| GxE interactions Rep(E) Error |
175 12 420 |
71.95** 226.2** 40.77 |
23.84 5.14 |
61.46** 3167.80** |
7.02 24.82 |
72.61** 1337.36** |
13.97 17.64 |
2023.64** 9735.66** |
16.74 5.52 |
|
| 32.42 | 29.39 | 8.06 | 44.27 | 20.45 | 44.27 | 27.05 | ||||
|
Trait |
PL | PY | PW | SW | ||||||
| Source of variation | df | MS | Percent | MS | Percent | MS | Percent | MS | Percent | |
| Environment(E) | 5 | 3631.75** | 34.65 | 418611.32** | 58.85 | 366168.77** | 40.70 | 419507928** | 47.34 | |
| Genotype (G) | 35 | 137.87** | 9.21 | 2025.96* | 3.18 | 7848.58** | 6.11 | 15762275** | 12.45 | |
| GxE interactions Rep(E) Error |
175 12 420 |
85.18** 82.24** 32.21 |
28.44 1.88 25.82 |
3042.56** 9413.07** 1779.34 |
14.97 3.18 21.01 |
5260.07** 19546.56** 2946.62 |
20.46 5.21 27.51 |
2353159** | 9.29 | |
| 70190040** | 19.01 | |||||||||
| 1255266 | 11.90 | |||||||||
|
Trait |
BM | TKW | GY | HI | ||||||
| Source of variation | df | MS | Percent | MS | Percent | MS | Percent | MS | Percent | |
| Environment(E) | 5 | 597883554** | 43.59 | 1799.68** | 43.90 | 298875131** | 48.30 | 419507928** | 39.58 | |
| Genotype (G) | 35 | 16989501** | 8.67 | 74.47** | 12.72 | 3897432** | 4.14 | 15762275** | 7.68 | |
| GxE interactions Rep(E) Error |
175 12 420 |
4667812** 103932563** 2881993 |
11.91 18.18 17.65 |
16.20** 75.54** 12.27 |
13.83 4.42 0.06 |
3031950** 12269443** 1877757 |
16.98 4.77 25.81 |
2353159** | 21.12 | |
| 70190040** | 3.24 | |||||||||
| 1255266 | 28.38 | |||||||||
*, **, =Significant at 5% and 1% level of probability respectively, DF=days to flowering, DM=days to maturity, GFP=grain filling period PHT=plant height (cm), PL=panicle length (cm), PY=panicle yield (g), PW=panicle weight (g), SW=Straw weight (kg), BM= biomass (kg), TKW= thousand- kernel weight (g) and GY=grain yield (kg).
Table 2.
Mean grain yield (kg ha-1) of 36 sorghum genotypes across six different test locations.
| Genotype | Jinka | Kako | Alduba | Arfayide | Gato | Mieso | Mean |
|---|---|---|---|---|---|---|---|
| G1 | 7694abcd | 5852abc | 8440ab | 1816.0abcde | 3669.6a | 3248abcd | 5119.93 |
| G2 | 7749abcd | 3639c | 5096bcdefg | 1957.2abcde | 1455.8bc | 3311abcd | 3868.00 |
| G3 | 5176abcd | 3555c | 4992dcefg | 1331.6bcde | 1269.4c | 3563abcd | 3314.50 |
| G4 | 4957bcd | 6080abc | 4851defg | 1034.9e | 4092.1ab | 4859abc | 4312.33 |
| G5 | 4134d | 5354abc | 4277efg | 1333.3bcde | 3581.1a | 4596abc | 3879.23 |
| G6 | 5406abcd | 5347abc | 2677g | 1837.3abcde | 3490.6a | 2737bcd | 3582.48 |
| G7 | 7798abcd | 6844a | 5511bcdefg | 1503.7bcde | 3864.1ab | 2878bcd | 4733.13 |
| G8 | 5596abcd | 5665abc | 4533defg | 1639.2bcde | 3694.4ab | 5063abc | 4365.10 |
| G9 | 6058abcd | 5230abc | 7816abcd | 1612.5bcde | 3658.1a | 3211abcd | 4597.60 |
| G10 | 3879d | 4167bc | 5872abcdefg | 1960.0abcde | 2447.2abc | 3893abcd | 3703.03 |
| G11 | 8869ab | 5301abc | 6528abcdef | 1573.3bcde | 3173.0a | 3074abcd | 4753.05 |
| G12 | 4353cd | 4876abc | 8336abc | 2010.6abcd | 3675.1a | 4941abc | 4698.62 |
| G13 | 6425abcd | 6093abc | 5126bcdefg | 1277.0cde | 3887.6ab | 2737bcd | 4257.60 |
| G14 | 8333abc | 5267abc | 6654abcdef | 1917.5abcde | 3539.9a | 3296abcd | 4834.57 |
| G15 | 4467cd | 5923abc | 4109efg | 1475.6bcde | 3916.1ab | 5678a | 4261.45 |
| G16 | 7674abcd | 4350bc | 4543defg | 1787.7abcde | 3113.2a | 4485abcd | 4325.48 |
| G17 | 8209abc | 4350bc | 5333bcdefg | 1360.5bcde | 3665.4a | 4015abcd | 4488.82 |
| G18 | 7658abcd | 5722abc | 6383abcdef | 1158.5ed | 3415.7a | 4470abcd | 4801.20 |
| G19 | 4556cd | 4706abc | 5291bcdefg | 2234.1ab | 2585.8abc | 3141abcd | 3752.32 |
| G20 | 4636cd | 4706abc | 4365efg | 1410.4bcde | 3416.4a | 4563abc | 3849.47 |
| G21 | 5484abcd | 4765abc | 4230efg | 2020.7abcd | 3199.3a | 3300abcd | 3833.17 |
| G22 | 6019abcd | 7274a | 6519abcdef | 1583.5bcde | 3488.7a | 3530abcd | 4735.70 |
| G23 | 7649abcd | 5101abc | 4285efg | 2013.8abcd | 3161.9a | 3093abcd | 4217.28 |
| G24 | 4952bcd | 4303bc | 7467abcde | 1867.7abcde | 2579.5abc | 5270ab | 4406.53 |
| G25 | 6015abcd | 4134bc | 5956abcdef | 2136.3abc | 2985.3ab | 1778d | 3834.10 |
| G26 | 5548abcd | 3534c | 5600bcdefg | 1226.7cde | 2610.7abc | 3584abcd | 3683.90 |
| G27 | 5168abcd | 4862abc | 6198abcdef | 1459.3bcde | 4045.2ab | 4078abcd | 4301.75 |
| G28 | 5342abcd | 5559abc | 5353bcdefg | 2151.1abc | 3149.0a | 4007abcd | 4260.18 |
| G29 | 4067d | 4683abc | 5084bcdefg | 1828.5abcde | 3008.4ab | 2567bcd | 3539.65 |
| G30 | 7212abcd | 3957c | 4312efg | 2638.8a | 2722.7ab | 2723bcd | 3927.58 |
| G31 | 7339abcd | 5362abc | 6257abcdef | 1860.7abcde | 3676.4a | 4211abcd | 4784.35 |
| G32 | 6064abcd | 5849abc | 5481bcdefg | 2088.1abcd | 3451.3a | 4080abcd | 4502.23 |
| G33 | 5627abcd | 4548abc | 9022a | 1837.0abcde | 3316.1a | 4381abcd | 4788.52 |
| G34 | 7669abcd | 5647abc | 5931abcdefg | 1148.1de | 3758.4ab | 4252abcd | 4734.25 |
| G35 | 5644abcd | 4934abc | 5719abcdefg | 1983.8abcd | 3626.5a | 2489cd | 4066.05 |
| G36 | 9137a | 3554c | 3531fg | 1902.9abcde | 3353.8a | 4022abcd | 4250.12 |
| Mean | 6182.31 | 5030.36 | 5602.17 | 1721.61 | 3270.66 | 3753.44 |
G= genotype, G1-G36 (Genotypes one up to thirty six), a=highest, b=medium, c=poor, d=poorest, e-g=bad mean grain yield, genotype having same letters are same in mean yield.
3.3. Stability Analyses
Additive Main Effects and Multiplicative Interaction Analysis
The Additive Main Effects and Multiplicative Interaction (AMMI) analysis of variance for grain yield (kg/ha) and biomass (kg/ha) of 36 sorghum genotypes tested across six environments is presented in Table 4. The analysis revealed that genotypes had a significant impact on grain yield, while the environment (p≤0.001) also had a significant effect on grain yield. This finding aligns with a study by Jifar et al. [31] on tef genotypes, where they observed significant effects (P≤0.01) attributed to the environment, genotype, and their interaction (G×E) on seed yield and yield components.
In this research, environmental factors explained the majority of the variance in grain yield (69.29%), with genotype-environment interaction (24.49%) and genotype (6.22%) following. The impact of the environment was the most significant, while that of genotype was the least. The result aligns with earlier studies on sorghum [32,33]. Thus, the primary source of variation in grain yield was attributed to environments, suggesting their diversity and potential subdivision into mega-environments. Significant discrepancies among environments predominantly accounted for the variability in grain yield. Similar outcomes have been noted in other studies on sorghum [22,34], where environments displayed a higher sum of squares compared to genotypes.
The interaction between genotype and environment had a significant impact on grain and biomass. Two principal components were found to be the most precise predictors for both grain and biomass. These components explained 73.86% of grain yield variability and 88.57% of the total GEI sum of squares in biomass. These findings have been observed by several researchers across various locations and years [35,36]. Similar findings have been documented for sorghum genotypes assessed across various locations and years [3,37,32]. Moreover, the mean square of IPCA1 was higher than that of IPCA2, IPCA3, and IPCA4 for grain and biomass, indicating variations in genotype performance due to GEI. This aligns with previous studies on sorghum [3,33,38].
Table 4.
Analysis of variance for the AMMI model for grain and biomass yield.
| Source of variations | Grain yield | biomass | |||||
|---|---|---|---|---|---|---|---|
| df | S.S. | Percent | Accumulated | MS | Percent | Accumulated | |
| Genotype(G) | 35 | 44594242* | 6.22 | 6.22 | 1.99E+08 | 13.61 | 13.61 |
| Environments(E) | 5 | 496649374** | 69.29 | 75.51 | 9.93E+08 | 67.78 | 81.39 |
| Interactions(GxE) | 175 | 175547472** | 24.49 | 100.00 | 2.72E+08 | 18.61 | 100.00 |
| PC1 | 39 | 75845622** | 43.21 | 43.21 | 1.94E+08 | 71.07 | 71.07 |
| PC2 | 37 | 53814007** | 30.65 | 73.86 | 47685656 | 17.50 | 88.57 |
| PC3 | 35 | 24616969** | 14.02 | 87.88 | 25943186 | 9.52 | 98.10 |
| PC4 | 33 | 15600190** | 8.89 | 96.77 | 4233067 | 1.55 | 99.65 |
| Residuals | 31 | 5670685 | 3.23 | 953107 | 0.35 | ||
| Total | 215 | 7.17E+08 | 1.46E+09 | ||||
*, **, significant at 5% & 1% probability level; ns, non-significant.
The Additive main effects and multiplicative interaction one (AMMI 1) biplot
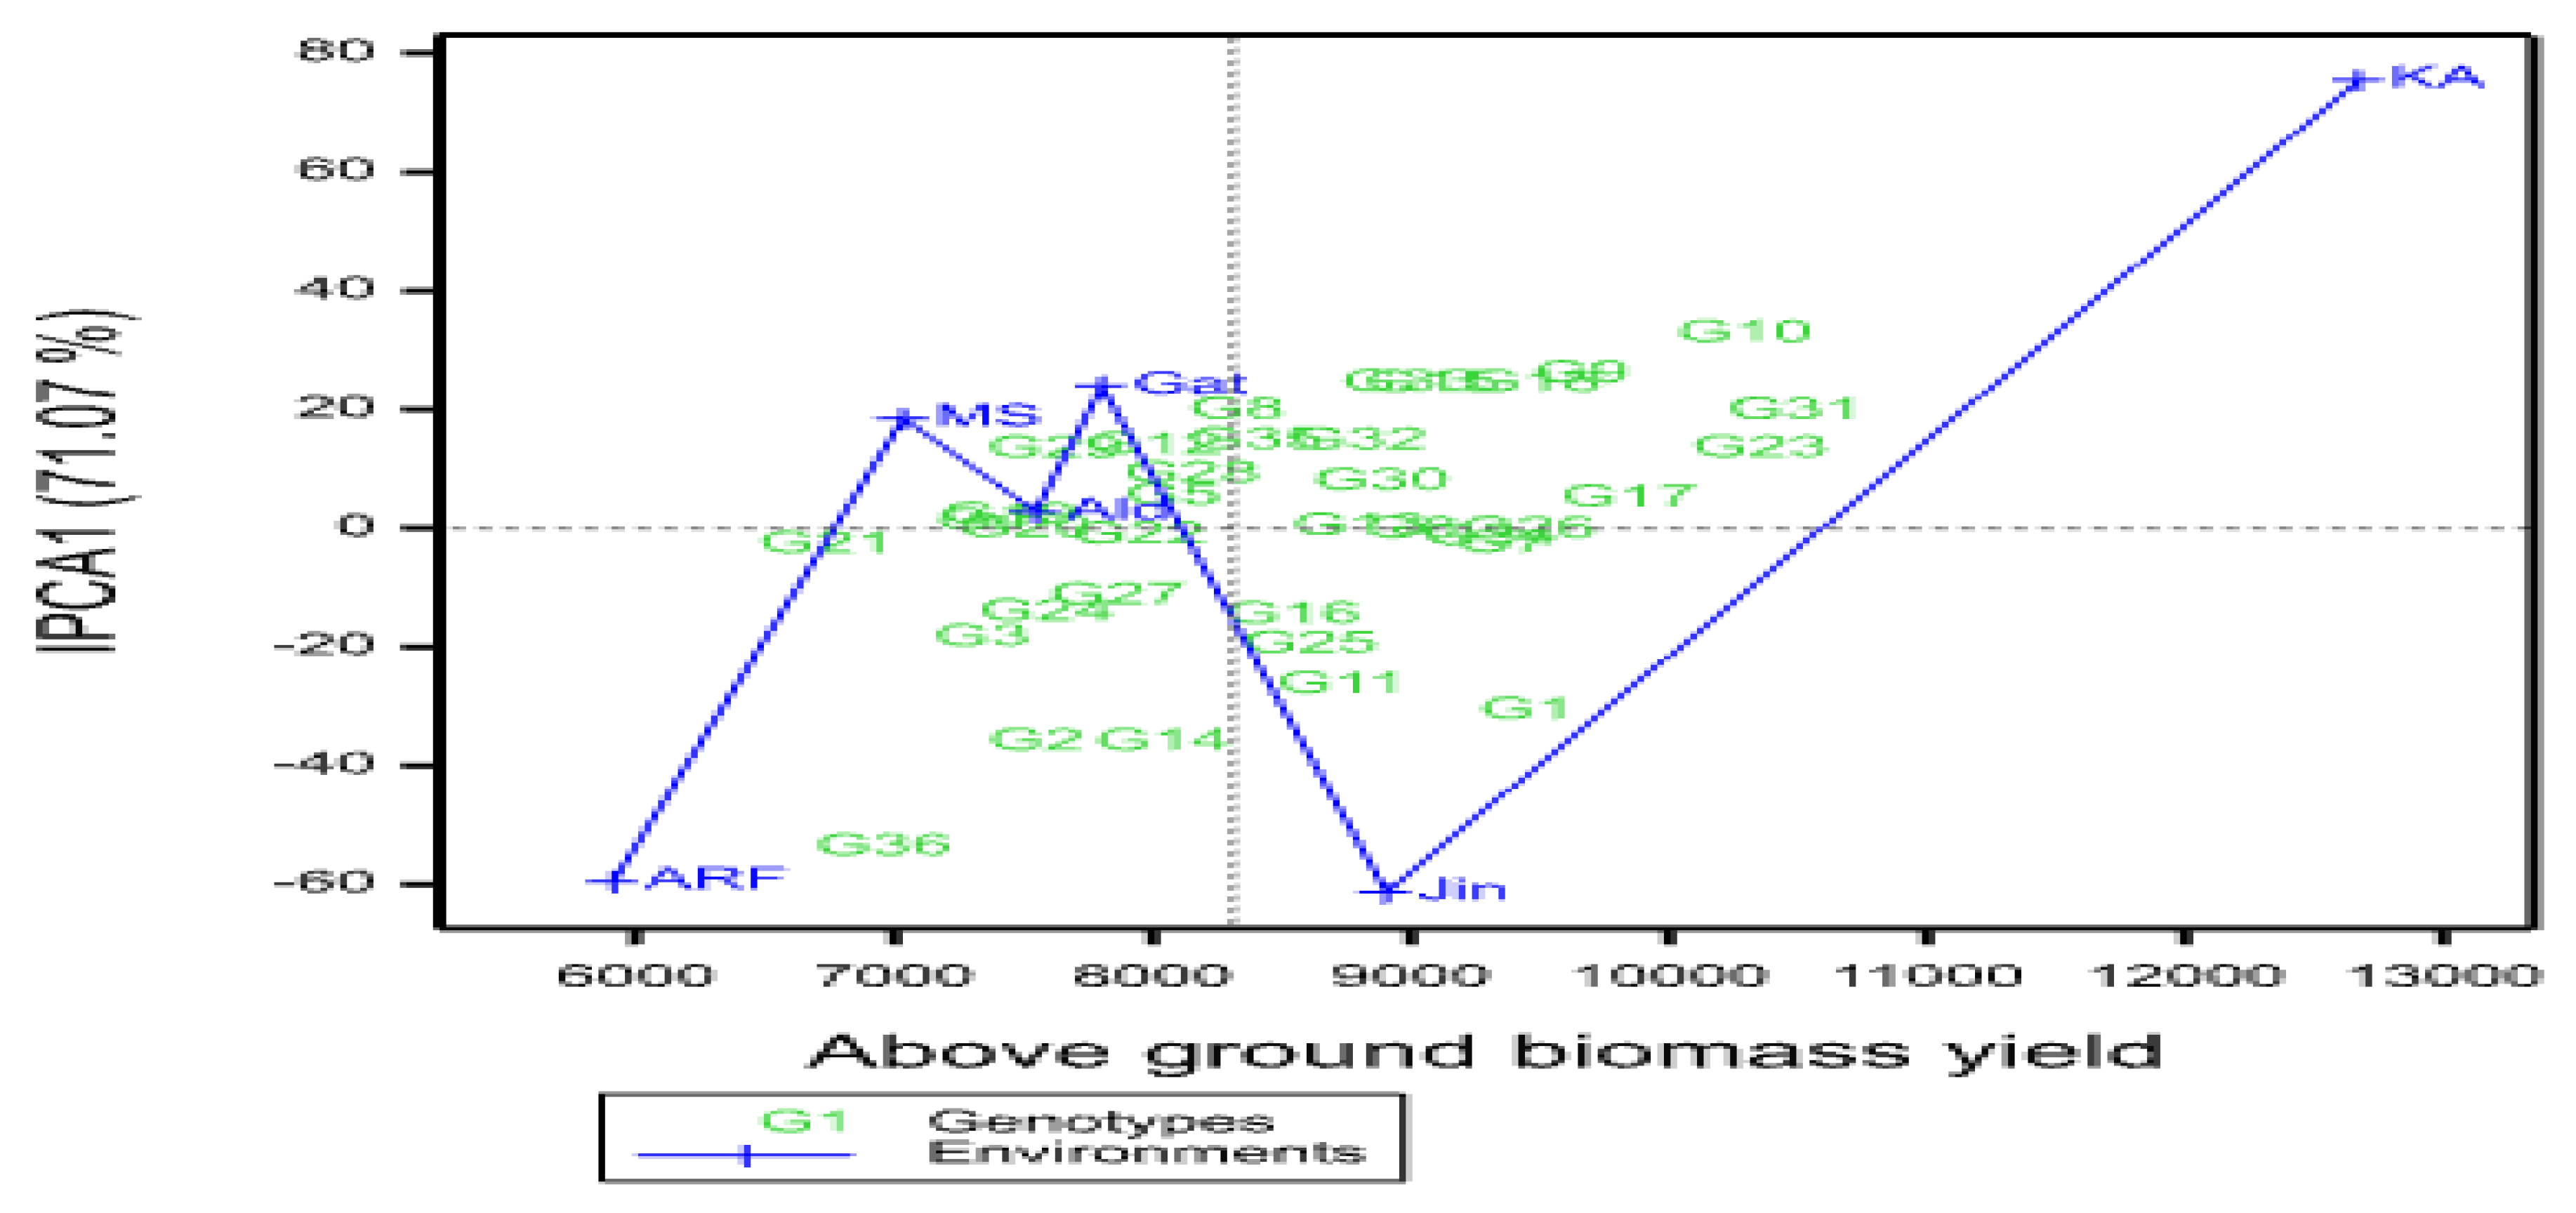
AMMI 1 biplot shows genotype and environment interaction effects on yield [25]. The X-axis represents yield, while the Y-axis shows IPCA1 scores. It helps interpret interaction effects and evaluate adaptability (Figure 1 and Figure 2). The study identified stable genotypes G21, G25, G13, G32, G35, G28, and G8, with G21 and G25 underperforming and G32, G8, G28, and G13 exhibiting high grain yield (Figure 1). For biomass, genotypes G20, G22, G5, G13, G30, G28, G35, G6, and G12 were stable but G22, G20, and G28 didn’t perform well. Genotypes G11, G2, and G1 were generally adaptable to all environments, while G6, G15, and G29 exhibited specific adaptability. Yitayeh et al. [22] utilized this model to assess the yield stability of early maturing sorghum. Genotypes on the right of the perpendicular line midpoint had higher yields than those on the left. G13, G34, G14, G31, G18, G16, G7, G17, G11, and G1 had higher grain yields, while G26, G19, G20, G29, G5, and G3 had lower yields. G1, G11, G25, and G16 had higher biomass, while G19, G29, G12, G28, and G5 had lower yields (Figure 2).
In summary, Alduba, Jinka, and Kako were favorable testing locations while Arifyde, Gato, and Meioso were unfavorable. Genotypes G22 and G33 showed higher grain yields in Kako and Alduba. For biomass, Jinka and Kako were favorable while Arifyde, Gato, and Meioso were unfavorable. Locations far from the origin, such as Arifyde, Kako, and Jinka, played a crucial role in the genotype-environment interaction, affecting the stability of biomass performance. Genotypes G1 and 11 showed higher biomass at Jinka, indicating their adaptability to this location. Crossa et al. [25] also noted that Genotype and location combinations with IPCA1 scores of the same sign resulted in positive specific interaction effects, while combinations with opposite signs led to negative specific interactions.
Figure 1.
AMMI1 biplot of IPCA1 against grain yield for 36 sorghum genotypes tested across six locations (Jin:Jinka, KA:Kako,Ald:Alduba,ARF:Arifyde,Gat:Gato,MS:Meioso).
Figure 1.
AMMI1 biplot of IPCA1 against grain yield for 36 sorghum genotypes tested across six locations (Jin:Jinka, KA:Kako,Ald:Alduba,ARF:Arifyde,Gat:Gato,MS:Meioso).
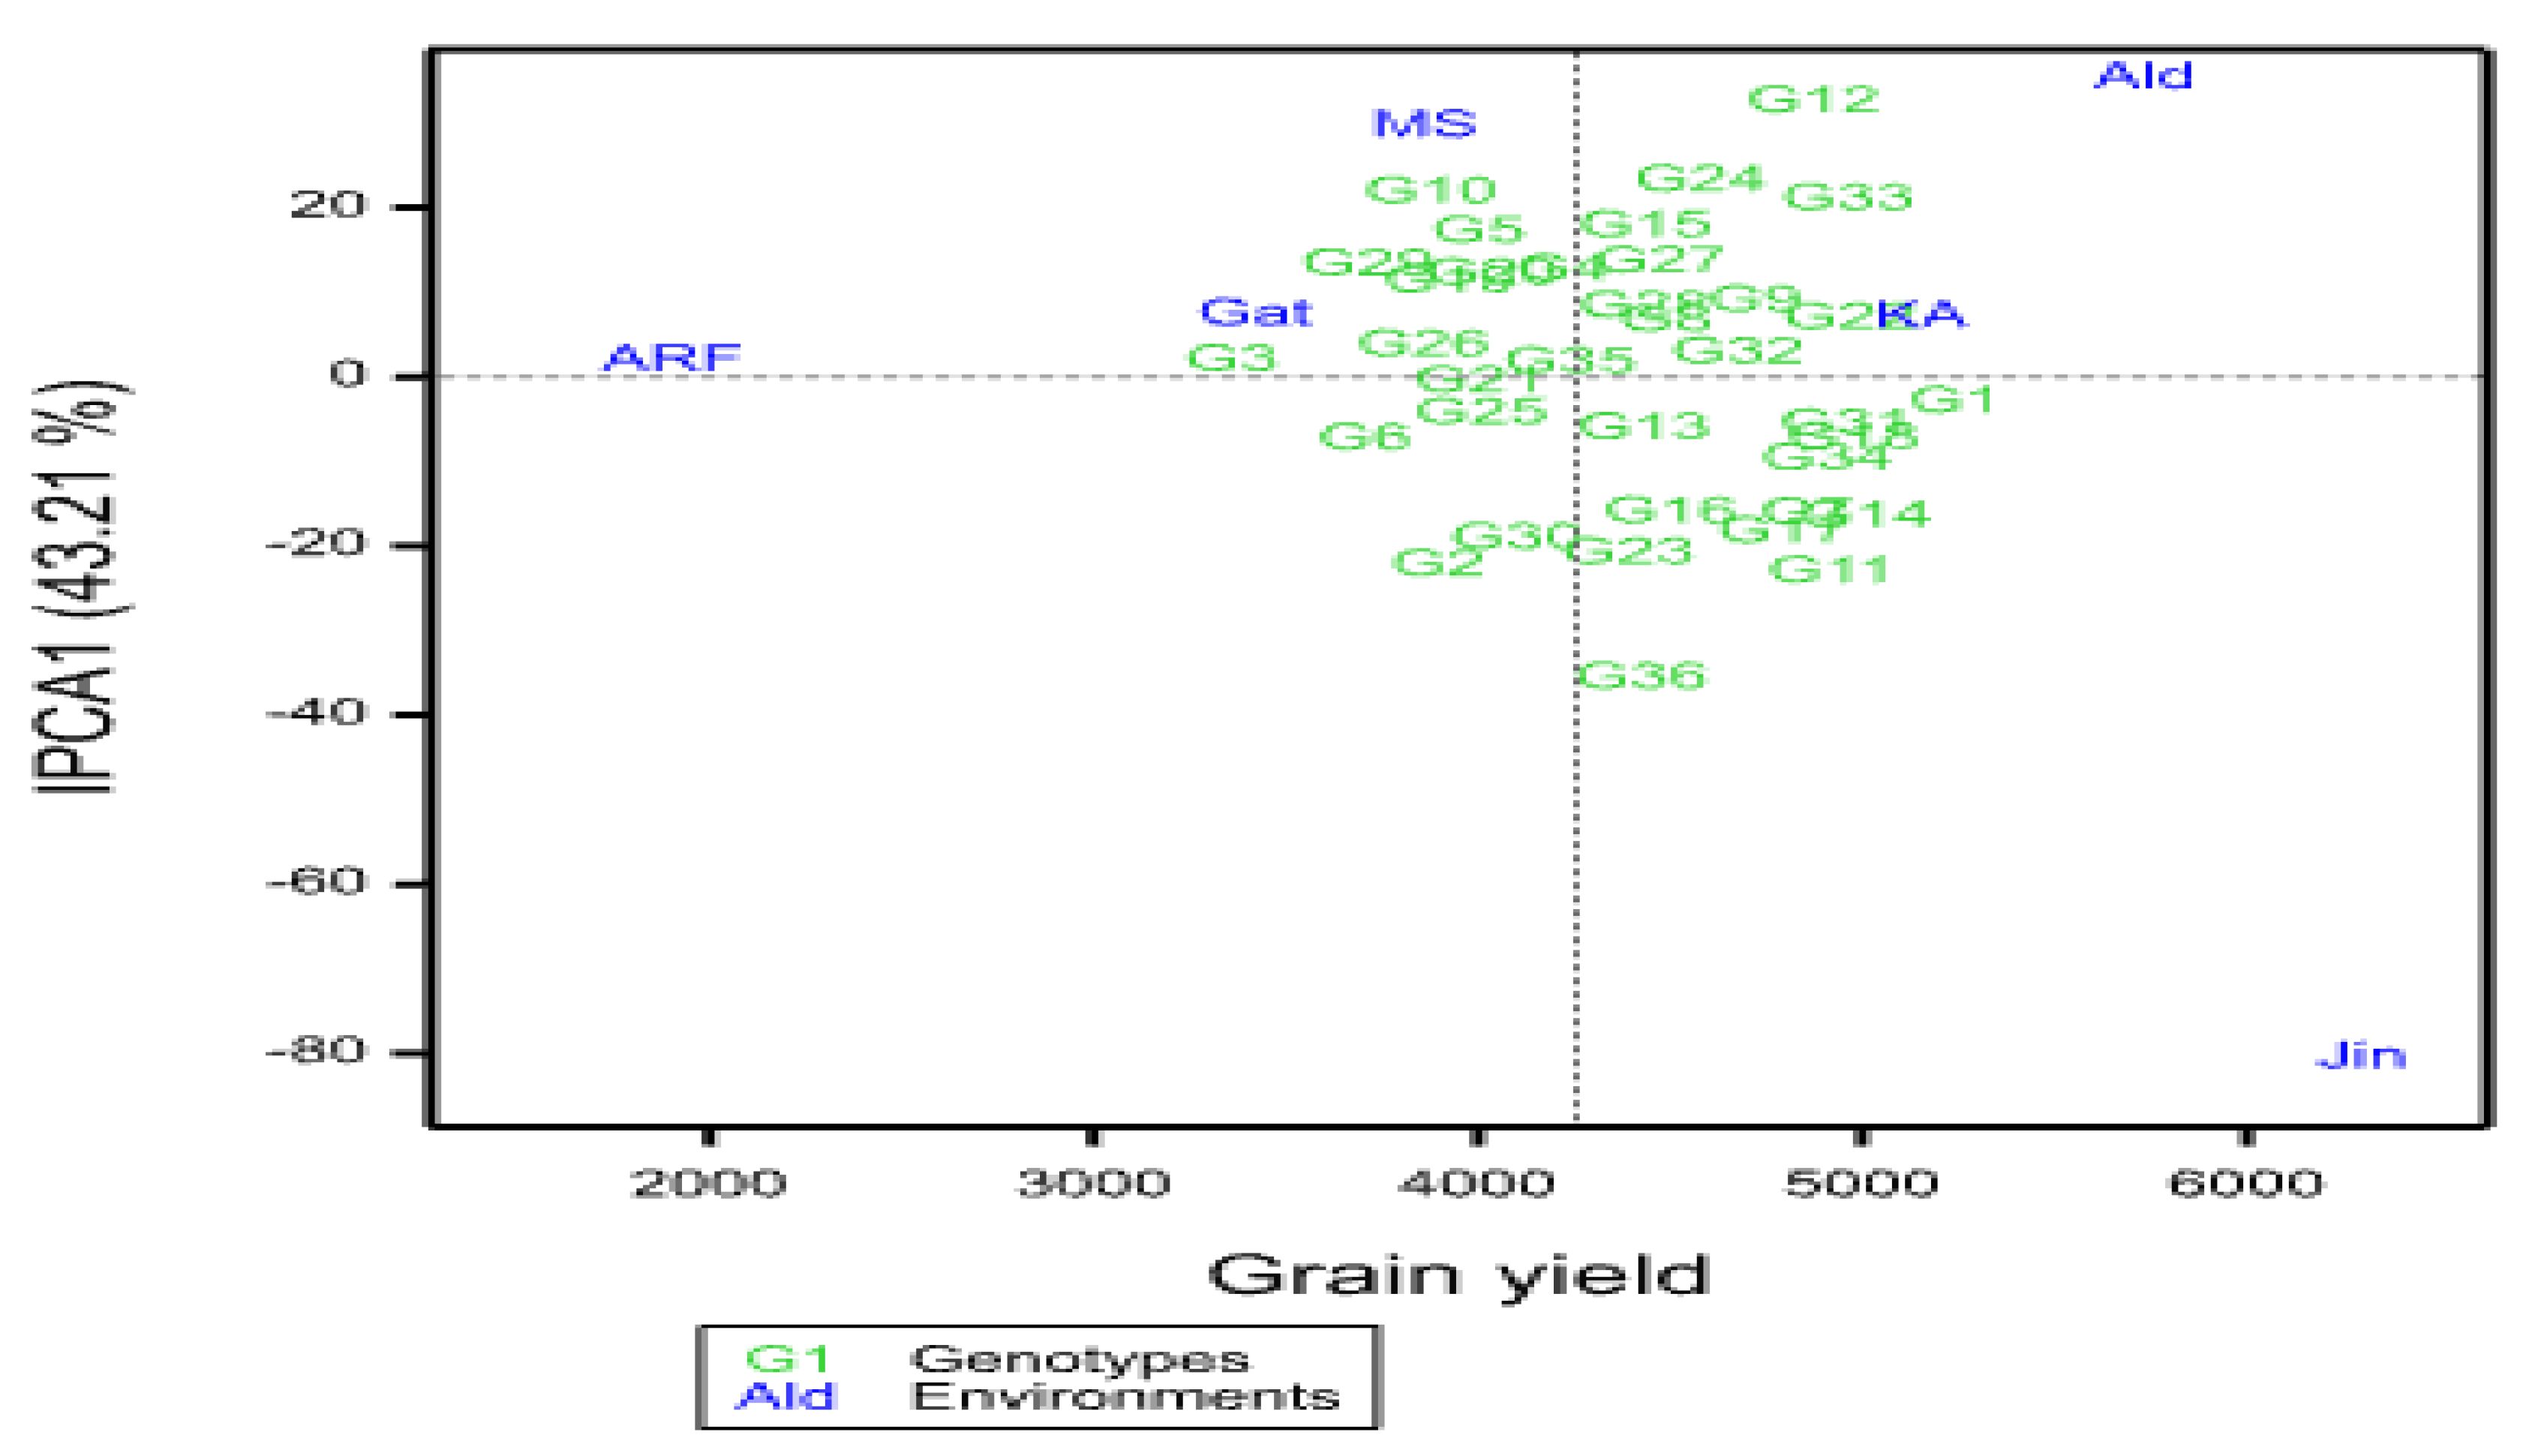
Figure 2.
AMMI1 biplot of IPCA 1 against biomass for 36 sorghum genotypes tested across six locations.
Figure 2.
AMMI1 biplot of IPCA 1 against biomass for 36 sorghum genotypes tested across six locations.
3.4. AMMI Stability Value (ASV)
The Interaction Principal Component One (IPCA1) and Interaction Principal Component Two (IPCA2) scores in the AMMI model serve as stability indicators. The AMMI Stability Value (ASV) provides a balanced measure of stability [19]. Genotypes with lower ASV values are deemed stable, while those with higher ASV values are considered unstable. As per Appendix Table A1, G35 exhibited the highest stability with an ASV of 4.54, followed by G3 (6.60), G32 (7.51), G26 (8.29), G31 (9.17), G22 (9.57), and G18 (11.87) as the most unstable genotypes for grain yield. The stable genotypes (G31, G22, G32, and G18) showed mean grain yield above the grand mean, aligning with findings from Alemu et al. [39] and Yitayeh et al. [22] who utilized this stability parameter to assess sorghum genotypes’ stability. Concerning biomass, genotype G26 (3.90) demonstrated the highest stability, followed by G4 (7.31), G13 (9.40), and G19 (10.90), while G36 (218.71), G2 (146.83), G14 (146.72), and G10 (133.48) were identified as the most unstable genotypes.
4. Conclusions
The combined analysis of variance showed significant variation among the sorghum genotypes, environments, and their interaction (G x E). In the AMMI analysis, genotypes (G) and environments (E) contributed to 24.49% and 69.29% of the treatment sum of squares, respectively, whereas the G x E interaction accounted for 14.8%. The environment played a more significant role in the total sum of squares than genotypes. The two IPCAs validated the grain yield variation explained by genotype-environment interaction, explaining 73.86% of the interaction sum of squares. The AMMI1 and AMMI2 biplots identified the most stable genotypes for grain and biomass. For various stability measures, genotypes G18, G22, G31, and G32 were identified as the most stable genotypes for grain and biomass.
The study identified sorghum genotypes G18 and G31 as stable and high-yielding candidates for variety development programs in Ethiopia. These genotypes exhibit consistent performance across different environments and show promise for further enhancement in sorghum production.
Acknowledgements
This paper was supported by the Ministry of Education and Jinka University. We are grateful for their financial and logistical support.
References
- FAO. Statistical database, Food and Agriculture Organization of the United Nations, Rome, Italy. 2015, http://faostat3.fao.org/home/E.
- Vavilov, N.I. The origin, variation, immunity and breeding of cultivated plants. Chronica Botanica 1951, 13, 1–366. [Google Scholar] [CrossRef]
- Seyoum, A.; Gebreyohannes, A.; Nega, A.; Nida, H.; Tadesse, T.; Tirfessa, A.; Bejiga, T. Performance evaluation of Sorghum [Sorghum bicolor (L.) Moench] genotypes for grain yield and yield related traits in drought prone areas of Ethiopia. Advances in Crop Science and Technology 2019, 7, 423. [Google Scholar]
- Belete, T.; Bediru, N. Yielding and stability appraisal of released varieties of sorghum [Sorghum bicolor (L.) Moench.]. Journal of Agricultural Research Advances 2020, 2, 31–35. [Google Scholar]
- Belay, F.; Mekbib, F.; Tadesse, T. Genotype by environment interaction and grain yield stability of Striga resistant sorghum [Sorghum bicolor (L.) Moench] genotypes in Ethiopia. Ethiopian Journal of Crop Science 2020, 8, 79–99. [Google Scholar]
- Anum, W.; Yasmeen, S.; Ali, L.; Riaz, U.; Ali, A.; Ahmed, R.I.; Akhtar, I.; Manzoor, N.; Ur-Rahman, A.; Maan, N.A.; et al. Environment X Genetic Stability of Different Sorghum Bicolor Varieties/Promising Lines Under Various Environmental Conditions. AGJSR 2021, 39, 69–81. [Google Scholar] [CrossRef]
- Enyew, M.; Feyissa, T.; Geleta, M.; Tesfaye, K.; Hammenhag, C.; Carlsson, A.S. Genotype by environment interaction, correlation, AMMI, GGE biplot and cluster analysis for grain yield and other agronomic traits in sorghum [Sorghum bicolor L. Moench]. PLoS ONE 2021, 16, e0258211. [Google Scholar] [CrossRef] [PubMed]
- Abate, M. Genotype by environment interaction and yield stability analysis of open pollinated maize varieties using AMMI model in Afar Regional State, Ethiopia. Journal of Plant breeding and crop science 2020, 12, 8–15. [Google Scholar]
- Belay, N. Genotype-by-environment interaction of maize testcross hybrids evaluated for grain yield using GGE biplots. International Journal of Food Science and Agriculture 2022, 6, 216–227. [Google Scholar]
- Alemu, G.; Dabi, A.; Geleta, N.; Duga, R.; Solomon, T.; Zegaye, H.; Getamesay, A.; Delesa, A.; Asnake, D.; Asefa, B.; et al. Genotype× environment interaction and selection of high yielding wheat genotypes for different wheat-growing areas of Ethiopia. Am. J. Biosci. 2021, 9, 63–71. [Google Scholar] [CrossRef]
- Jifar, H.; Assefa, K.; Tesfaye, K.; Dagne, K.; Tadele, Z. Genotype-by-environment interaction and stability analysis in grain yield of improved Tef ( Eragrostis tef) varieties evaluated in Ethiopia. Journal of experimental agriculture international 2019, 35, 1–13. [Google Scholar] [CrossRef]
- Haile, S. Genotype x Environment Interaction and Grain Yield Stability of Finger Millet [Eleusine coracana(L) subsp. Coracana] Varieties in Eastern and Western, Ethiopia. MSc Thesis, Haramaya, Haramaya University.2020.
- IBGR and ICRISAT. Descriptors for sorghum [Sorghum bicolor (L.) Moench]. International Board for Plant Genetic Resources. 1993. Rome, Italy, p.432.
- SAS Institute. SAS/STAT User’s Guide. 2004. SAS Institute, Cary, North Carolina. USA.
- Angela, P.; Mateo, V.; Gregorio, A.; Francisco, R.; Marco, L.; José, C.; Juan, B. GEAR (Genotype x Environment Analysis with R for Windows) Version 4.1.2016. CIMMYT Research Data and Software Repository Network. The Crop Journal 2020, 8, 745–756. [Google Scholar]
- Gomez, K.A.; Gomez, A.A. Statistical Procedures for Agricultural Research. 2nd Edition John Wiley and Sons Inc. 1984, New York.
- Bartlett, M.S. Multivariate analysis. Supplement to the journal of the royal statistical society 1947, 9, 176–197. [Google Scholar] [CrossRef]
- Hussein, M.A.; Bjornstad, A.S.; Aastveit, A.H. SASG× ESTAB: A SAS program for computing genotype× environment stability statistics. Agronomy journal 2000, 92, 454–459. [Google Scholar] [CrossRef]
- Purchase, J.L. Parametric analysis to describe genotype x environment interaction and yield stability in winter wheat. Ph.D. Thesis, Department of Agronomy, Faculty of Agriculture of the University of the Free State, Bloemfontein, South Africa. 1997.http://hdl.handle.net/11660/1966. [Google Scholar]
- Amare, A.; Mekbib, F.; Tadesse, W.; Tesfaye, K. Genotype X environment interaction and stability of drought tolerant bread wheat (Triticum aestivum L.) genotypes in Ethiopia. International Journal of Research 2020, 6, 26–35. [Google Scholar]
- Belay, F.; Mekbib, F.; Tadesse, T. Genotype by environment interaction and grain yield stability of Striga resistant sorghum [Sorghum bicolor (L.)Moench] genotypes in Ethiopia. Ethiopian Journal of Crop Science 2020, 8, 79–99. [Google Scholar]
- Yitayeh, Z.S.; Mindaye, T.T.; Bisetegn, K.B. AMMI and GGE Analysis of GxE and Yield Stability of Early Maturing Sorghum [Sorghum bicolor (L.)Moench] Genotypes in Dry Lowland Areas of Ethiopia. Adv. in Crop Sci. T.2019.
- Mulugeta, B.; Tesfaye, K.; Geleta, M.; Johansson, E.; Hailesilassie, T.; Hammenhag, C.; Hailu, F.; Ortiz, R. Multivariate analyses of Ethiopian durum wheat revealed stable and high yielding genotypes. PloS One 2022, 17, e0273008. [Google Scholar] [CrossRef] [PubMed]
- Amare, A.; Mekbib, F.; Tadesse, W.; Tesfaye, K. Screening of drought tolerant bread wheat (Triticum aestivum L.) genotypes using yield based drought tolerance indices. Ethiopian Journal of Agricultural Sciences 2019, 29, 1–16. [Google Scholar]
- Crossa, J.; Gauch, H.G., Jr.; Zobel, R.W. Additive main effects and multiplicative interaction analysis of two international maize cultivar trials. Crop science 1990, 30, 493–500. [Google Scholar] [CrossRef]
- Ganta, T.; Mekbib, F.; Amsalu, B.; Tadele, Z. Genotype by Environment Interaction and Yield Stability of Drought Tolerant Mung Bean [Vigna radiata (L.) Wilczek] Genotypes in Ethiopia. Journal of Agriculture and Environmental Sciences 2022, 7, 43–62. [Google Scholar]
- Legesse, A. and Mekbib, F. Genotype X environment interaction and stability of early maturing sorghum [Sorghum bicolor (L.) Moench] genotypes in Ethiopia, 2015. MSc. Thesis, Alemaya University of Agriculture, Ethiopia.
- Belete, T.; Tulu, L.A.; Senbetay, T. Evaluation of finger millet [Eleusine coracana (L.) Gaertn.] varieties at different locations of southwestern Ethiopia. Journal of Genetic and Environmental Resources Conservation 2020, 8, 9–17. [Google Scholar]
- Yan, W.; Rajcan, I. Biplot analysis of test sites and trait relations of soybean in Ontario. Crop science 2002, 42, 11–20. [Google Scholar] [CrossRef] [PubMed]
- Yan, W.; Tinker, N.A. Biplot analysis of multi-environment trial data: Principles and applications. Canadian journal of plant science 2026, 86, 623–645. [Google Scholar] [CrossRef]
- Jifar, H.; Assefa, K.; Tesfaye, K.; Dagne, K.; Tadele, Z. Genotype-by-environment interaction and stability analysis in grain yield of improved tef (Eragrostis tef) varieties evaluated in Ethiopia. Journal of experimental agriculture international 2019, 35, 1–13. [Google Scholar] [CrossRef]
- Worede, F.; Mamo, M.; Assefa, S.; Gebremariam, T.; Beze, Y. Yield stability and adaptability of lowland sorghum [Sorghum bicolor (L.) Moench] in moisture-deficit areas of Northeast Ethiopia. Cogent Food & Agriculture 2020, 6, 1736865. [Google Scholar]
- Birhanu, C.; Bedada, G.; Dessalegn, K.; Lule, D.; Chemeda, G.; Debela, M.; Gerema, G. Genotype by environment interaction and grain yield stability analysis for Ethiopian sorghum [Sorghum bicolor (L.) Moench] genotypes. Int. J. Plant Breeding and Crop Sci. 2021, 8, 975–986. [Google Scholar]
- Worede, F.; Tarekegn, F.; Teshome, K. Simultaneous selection for grain yield and stability of sorghum [Sorghum bicolor (L.) Moench] genotypes in Northeast Ethiopia. African Journal of Agricultural Research 2021, 17, 1316–1323. [Google Scholar]
- Gauch, H.G., Jr.; Zobel, R.W. Optimal replication in selection experiments. Crop Science 1996, 36, 838–843. [Google Scholar] [CrossRef]
- Yan, W.; Hunt, L.A.; Sheng, Q.; Szlavnics, Z. Cultivar evaluation and mega-environment investigation based on the GGE biplot. Crop science 2000, 40, 597–605. [Google Scholar] [CrossRef]
- Al-Naggar, A.M.M.; Abd El-Salam, R.M.; Hovny, M.R.A.; Yaseen, W.Y. Genotype× Environment Interaction and Stability of Sorghum bicolor Lines for Some Agronomic and Yield Traits in Egypt. Asian Journal of Agricultural and Horticultural Research 2018, 1–14. [Google Scholar] [CrossRef]
- Admas, S.; Tesfaye, K. Genotype-by-environment interaction and yield stability analysis in sorghum [Sorghum bicolor (L.) Moench] genotypes in North Shewa, Ethiopia. Acta Universitatis Sapientiae, Agriculture and Environment 2017, 9, 82–94. [Google Scholar] [CrossRef]
- Alemu, B.; Negash, G.; Raga, W.; Abera, D. Multi-locations evaluation of sorghum [Sorghum bicolor (L.) Moench] genotypes for grain yield and yield related traits at western Oromia, Ethiopia. Journal of Cereals and Oilseeds 2020, 11, 44–51. [Google Scholar]
Disclaimer/Publisher’s Note: The statements, opinions and data contained in all publications are solely those of the individual author(s) and contributor(s) and not of MDPI and/or the editor(s). MDPI and/or the editor(s) disclaim responsibility for any injury to people or property resulting from any ideas, methods, instructions or products referred to in the content. |
© 2024 by the authors. Licensee MDPI, Basel, Switzerland. This article is an open access article distributed under the terms and conditions of the Creative Commons Attribution (CC BY) license (http://creativecommons.org/licenses/by/4.0/).
Copyright: This open access article is published under a Creative Commons CC BY 4.0 license, which permit the free download, distribution, and reuse, provided that the author and preprint are cited in any reuse.


