Preprint
Article

Synthesis of Patchouli Biomass Based (α-Fe2O3, γ-Fe2O3, Fe3O4)/Activated Biochar Composite for Water Environment Remediation

Altmetrics

Downloads

87

Views

48

Comments

0

This version is not peer-reviewed

Submitted:

12 August 2024

Posted:

14 August 2024

You are already at the latest version

Alerts
Abstract
Biochar is a porous material produced by pyrolisis of biomass and can be modified using metal oxide to improve its adsorption performance, especially toward organics substances. The activated biochar was synthesized from patchouli biomass to study effect of calcination temperature on both structural properties and paracetamol drug adsorption of the composite was studied. Some process routes were conducted, including the patchouli biomass pyrolysis using CoCl2 activator, the activated biochar impregnation using 0.1 M FeCl3 solutions, biochar-FeCl3 calcination at various temperatures (400, 600, 800 oC) in the almost closed porcelain crucible, product characterizations using X-ray diffraction and FTIR spectrometry, and paracetamol adsorption test at various concentrations (10, 20, 30, 40, and 50 ppm). The paracetamol concentrations were analyzed using UV-Vis spectrophotometry at 243 nm. The adsorption data was treated using Langmuir, Freundlich, and Dubinin-Radushkevich (DR) models. The product diffractograms indicated α-Fe2O3, γ-Fe2O3, FeFe2O4 beside the carbon turbostratic structure. The metal oxide peak heights increased by increasing of the temperature. FTIR spectra significantly started to change at 600 oC. Adsorption test of paracetamol gave the highest adsorption capacity of 56.37 mg/g at 800 oC (Langmuir model) with correlation coefficient of 0.964. The highest adsorption energy was achieved at 800 oC, i.e 530.33 J/mol (physical adsorption) with a dimensionless factor, the RL value of 0.86 (favorable adsorption), and the n constant of 1.58 (favorable adsorption).
Keywords: 
Subject: Chemistry and Materials Science  -   Surfaces, Coatings and Films

1. Introduction

Biochar is biomass based charcoal [1], categorized as porous black carbon [2] and produced by organic matter [3] or biomass pyrolysis under limited oxygen condition [4]. Patchouli biomass was used in this research as precursor due to one of Indonesian natural commodities. Its field is about 9600 hectare [5]. The other reason is that chemically it contains 39.41% of cellulose, 12.31% of hemicellulose, and 12.52 % of lignin [6]. Hemicellulose undergoes decomposition at 200-260 ◦C, cellulose at 240–350 ◦C, and lignin at 280–500 ◦C [7]. Pyrolysis is a process of thermochemical decomposition [8]. During the pyrolysis process, those three lignocellulosic components undergo various reactions including depolymerization, fragmentation and cross-linking. Products of the pyrolysis are char (solid), bio-oil, (liquid) and gaseous such as carbon dioxide, carbon monoxide, hydrogen and syngas of C1-C2 hydrocarbons [9,10]. Biochar contains about 65 to 90 per cent carbon. Increasing of pyrolysis temperature decreases the biochar yield but improves the carbon content [11].
Characteristics of biochar, including porosity and surface functional groups make it has good potency in many applications, such as for soil amendment by improvement of soil organic mater [12], reduction of the greenhouse gas emissions [13] such as nitrous oxide and methane from the soil [14], minimization of the heavy metals in soils [15] and immobilization of fertilizer’s anions [16]. Biochar enhances nutrient in the soil by increasing nitrogen mineralization or nitrification as consequence of biochars high ion exchange capacity and the improved microbial growth and activity [17]. The microbial activity in the soil was signed by absorption of oxygen gas and emission of carbon dioxide. More microorganism in the soil more microbial respiration [18]. The biochar reduces significantly soil bulk density and increase its porosity which improves water holding capacity of the soil [19]. In wastewater treatment, biochar handled various pollutants such as heavy metal [20,21] and organic [22,23,24]. The Biochar also has applications as animal food additives and electronic devices [7].
Adsorption is a favorable and feasible method for treatment of waste water due to its low cost, high efficiency, and ability to remove pollutant at low concentrations [25]. Modification of the biochar surface by nanomaterials such as AlOOH, ZnO/ZnS, Fe3O4, MgO, MnO2, Ni0.5 Zn0.5 Fe2O4 can improve its physicochemical properties such as functional group, porosity, and active sites on the biochar surface which enhances the heavy metal adsorption [26]. For example, manganese-oxide/biochar (Mn/BC) composite raised the removal efficiency of lead (II) from 6.4 to 98.9 % at pH 5.00. This improvement is attributed to the increase of surface hydroxyls and the decrease of pHZPC (pH of Zero Point Charge) in carbon. The maximum monolayer adsorption of lead(II) on Mn/BC at 25 oC was five times that on BC [27]. Using Freundlich model and Langmuir model, modification of biochar by MgO improved adsorption of methylene blue from 132,65 to 156,35 mg/g and from 130.25 to 148.25 mg/g, respectively [28]. Magnetite impregnated biochar removed Cu(II) and Zn(II) higher than individual biochar or magnetite [29]. Fe3O4/biochar from different biomass removed methylene blue, Cr(VI), Tl(I), and U(IV) with removal eficiency more than 90%. The other adsorbates such as PO43-, As(V), PFOA were eliminated about 100% [30]. NiFe2O4/biochar (NFO/BC) composites can adsorp tetracycline higher than biochar and NFO in percentage ratio of 94:56:49. These different adorptions are more related to chemical (functional groups and charge sites) than physical properties such as surface area and pore volume because both increased by sequence of biochar > NFO/biochar > NFO [31]. Composite of Ni-Fe LDH/biochar from pine wood increased adsorption capacity of arsenic anion from 0.2 mg/g to 4.4 mg/g due to improvement of hydroxyl for complexation on the surface [32].
Principally, composite of carbon-metal oxide is prepared by impregnation of carbon by addition of salt to produce carbon–salt composite and alcination of carbon-salt composite to get carbon–metal oxide composite [33]. Therefore, calcination temperature becomes an important parameter in the formation of impregnate structure which may give effect on the adsorption performance of the composite. The different temperature of calcination of carbon–Cu(NO3)2 in nitrogen gas streaming, i.e 400, 530, and 800 oC, have produced carbon–CuO, carbon–Cu2O, and carbon–Cu, respectively. Similarly, calcination of carbon–Ni(NO3)2 in the nitrogen gas streaming at different temperatures, 550 and 800oC, produced carbon–NiO and carbon–Ni, respectively. Adsorption test indicated that Cu(I) and Ni(II) impregnated carbons improved thiophenate adsorption of 40–53%. Carbon was prepared by pyrolisis of palm seed [24]. Adsorption of phosphorus by Mg/biochar improved by increasing of calcinations temperature from 300 to 600oC [34] and adsorption of As(IV) on iron oxide impregnated rice husk biochar at temperature of 950oC is higher than at 550oC [23].
In this research FeCl3–biochar composite was calcined at various calcination temperatures. Fe2O3 was predicted as product of FeCl3 calcination with presence of oxy gasses emitted by biochar activation. The Fe2O3 has 3+ cation charge which has good affinity to Lewis base organic contaminant. On the other hand, as hematite structure (α – Fe2O3) this material is highly resistant to corrosion and can be used as catalyst, therefore it is greatly important in technological and industrial applications [35].
This research is aimed to study influence of the temperature on the change of structural properties of impregnate and adsorption performance of those composites, especially for adsorption of drug pollutant, such as paracetamol (acetaminophen). It is an analgesic drug type which can cause acute liver damage [36]. Paracetamol is not biodegradable pharmaceutical product, hence it will decompose difficultly. It will lead an health and environmental problem if it accumulates in wastewater and groundwater supply and eventually is consumed as the drinking water [37]. Removal of paracetamol from water environment was studied using adsorption method but using activated carbon [37,38,39]. Result of this research will be very useful to give image of biochar-Fe2O3 composite performance as adsorbent to handle the drug wastewater, especially containing paracetamol or drug structure which has physicochemistry (size, structure, shape, and polarity) similar to paracetamol.
Biochar which was prepared using the chemical activators was termed as biochar, such as using the activator of KOH [40,41], Na2P2O7 [42], MgCl2.6H2O [43], NaOH [44], as activated biochar, for example by using activator of KOH [45], or as activated carbon such as using KOH, NaOH, H3PO4, ZnCl2, FeCl3 [46]. In this paper, the term of activated biochar is used because the patchouli biomas was pyrolyzed using including CoCl 2 activator in pyrolysis process and FeCl3 in modification process by calcination..

2. Materials and Methods

2.1. Materials of Research

This research used the same patchouli biomass (mixture of root and stem) as our previous researchs [47,48,49,50,51,52,53]]. CoCl2.6H2O (Merck, Darmstad, Germany), HCl 37% (Merck, Darmstad, Germany), FeCl3 (Merck, Darmstad, Germany) and the distilled water were used as the chemicals and solvent, respectively.
An oven (Memmert, Büchenbach, Germany) and a conventional furnace (Carbolite, Derbyshire, UK) were used for drying and calcinating process, respectively.
X-ray diffractometer (PANalytical X’Pert PRO, Malvern, Germany), FTIR spectrometer (Shimadzu, Kyoto Japan), surface area analyzer (Quantachrome NovaWin2), and UV-Vis spectrophotometer (Shimadzu, Kyoto Japan.) were applied for characterization of the products and paracetamol analysis, respectively.

2.2. Preparation of Activated Biochar and Composite

Activated biochar preparation was performed in the same procedure as conducted by previous publication [40]. Patchouli biomass was washed using water and dried under sunrise. Then, the biomass size was conditioned at the range 60-100 mesh. The precursor (10 g) was mixed by CoCl2.6H2O salt (52 g), and distillated water (60 mL), then the mixture was evaporated at 100 oC for 4 h under stirring. The CoCl2 impregnated biomass was pyrolized at 450 oC for 2 h in the tube furnace under nitrogen gas stream. The activator was removed from product by washing the product using 1 M HCl solution and distillated water, then dried at 130oC (6 h) using oven and sieved for conditioning the size of 100-120 mesh. The activated biochar product was sieved to take the solid particle size of 100-120 mesh.
The FeCl3/AB and FexOy/AB composites (AB = Activated Biochar) were prepared by using FeCl3 salt as impregnant reactant [54]. The FeCl3 solution (0.1 M, 100 mL) was added to the activated biochar (6 g) and shaked for 24 h at 200 rpm. The mixture was filtered and the composite was dried at 100 oC for 1 h, then calcined at 400, 600, and 800 oC for 1 h in the closed ceramic crucible. The uncalcined and calcined composites were characterized.
For XRD characterizations, the codes of the composite samples as written as sample identification in reports of analysis from LSUM as follows:
  • Activated biochar by pyrolysis using CoCl2 activator: Biiochar Aktivator CoCl2 100-120
  • Composite by calcination of activated biochar-FeCl3 at 400oC: BIFe4
  • Composite by calcination of activated biochar-FeCl3 at 600oC: BIFe6
  • Composite by calcination of activated biochar-FeCl3 at 800oC: BIFe8
For FTIR spectrometry, the codes of the composite samples as written in report of analysis from Analysis Laboratory in Department of Chemistry, Brawijaya University as follows:
  • Activated biochar by pyrolysis using CoCl2 activator: Biochar Co 52_39
  • Activated biochar – FeCl3 before calcination: B.IFe
  • Composite by calcination of activated biochar-FeCl3 at 400oC: B.IFe 400
  • Composite by calcination of activated biochar-FeCl3 at 600oC: B.IFe 600
  • Composite by calcination of activated biochar-FeCl3 at 800oC: B.IFe 800
By consideration of those different codes, both X-ray diffractograms and FTIR spectra in this paper were reported without the codes.

2.3. Characterization of Activated Biochar and Composites

Surface functional groups of biochars were determined by FTIR spectrophotometer (Shimadzu). Pellet kalium bromide (KBr) technique was applied by mixing the dried biochars and the oven-dried KBr (Merck). The measurements of those FTIR spectra were in Instrument Laboratory of Chemistry Department Brawijaya University.
Crystal structure of the biochar and composites were characterized using powder X-ray diffractometer in Lab Sentral Mineral dan Material Maju or Lab Sentral Universitas Negeri Malang (LSUM). All X-ray diffractograms were collected in 2θ range of 10–90° at a scan rate of 2° min by using Cu metal target (Kα = 1.54 Ǻ). Measurement conditions of analysis were 30 mA, 40 kV, and receiving slit size of 0.1 mm.
Porosity was determined using data of nitrogen gas adsorption using Surface Area Analyzer (SAA) in Materials Physics Laboratory, Department of Materials and Metallurgical Engineering, ITS Surabaya. Before adsorption, the composites were outgassed at 300 oC for 3 h. The adsorption process was performed at 77.5 K.

2.4. Adsorption Test

Adsorption test was conducted as the previous research [28] by using the composites which were produced at various calcination temperatures and uncalcined biochar as the control. Each paracetamol solution (10, 20, 30, 40, and 50 ppm) was added to the activated biochar and composites then were shaked for 24 h at 200 rpm. The drug solution concentration was analyzed using UV-Vis spectrophotometer at maximum wavelength of 243 nm. Concentration data was used to make isotherm adsorption curves based on Freundlich, Langmuir, and Dubinin–Raduskevich.

3. Results and Discussions

3.1. Crystal Structure of the Composites

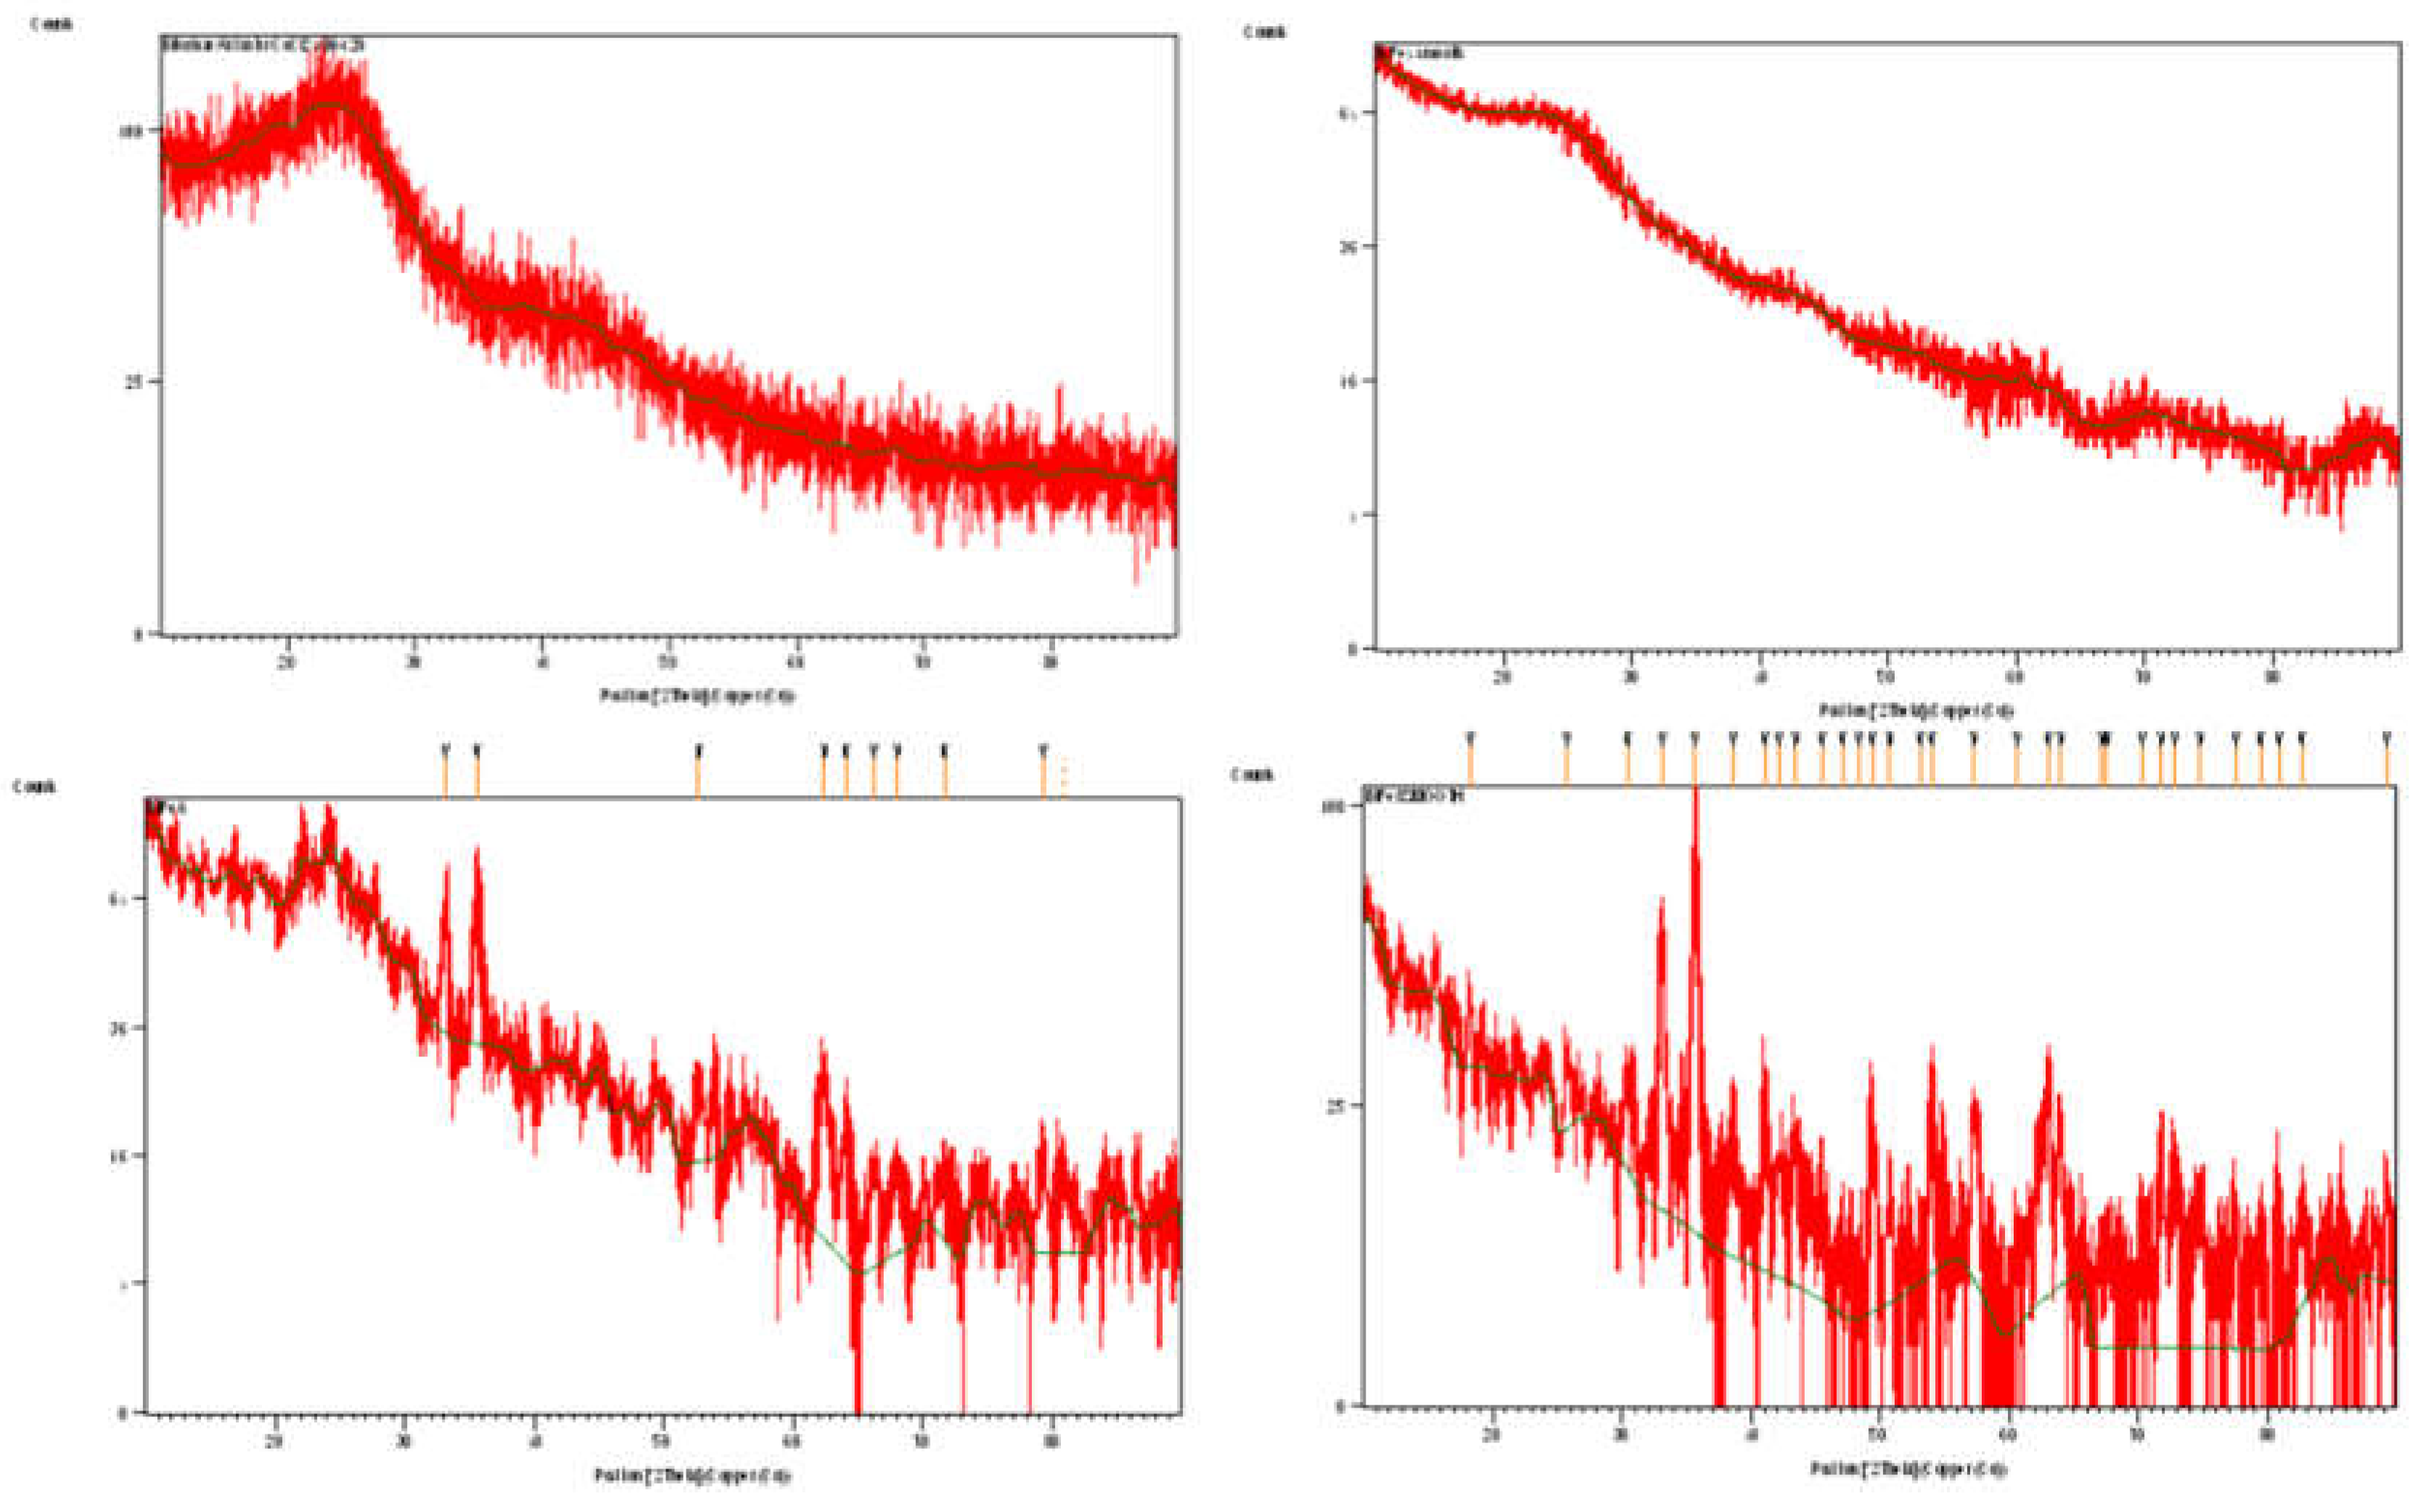
Effects of calcination temperature on crystal structure of the composites were studied using X-ray diffraction method. Result of the characterization is reported in Figure 1. Diffractogram of the activated biochar was taken from product of PUPT 2015 research (product of the patchouli biomass pyrolysis using CoCl2 activator). The others were based on PUPT 2016 (the composite products from the biochar from PUPT 2015 by using FeCl3 as impregnant resources).
All diffractograms in Figure 1 are the redrawing results of all theactivated biochar and the composite diffractograms (Figure 2) from the characterizations of thesynthesized products in LSUM.
Pattern of the activated biochar X-raydiffractogram (Figure 1) shows broad peakaround 23 and 43o which indicates turbostratic graphite structure [55]. Turbostratic is intermediate of graphite. Itis a mixture of amorphous and graphite structure [56].
The composite diffractogram which was produced bycalcination  at 400 oC showed no peak of the impregnantdiffractogram. Pattern of the diffractogram just shows pattern of the activatedbiochar’s diffractogram whereas FeCl3 were added before thecalcination process. It is probably too low iron (III) oxide concentration inthe composite (compared to the activated biochar) which can be detectedsignificantly by the diffractometer as concequency of still little formation ofthe iron oxide at 400oC. However, the diffractogram peak becomelower than the activated biochar which indicates thermal decomposition of theactivated biochar at 400oC.
On the other side, the composite which was calcinedat 600 oC shows some peaks. Interpretation process was conducted forhematite and maghemite because both structures contain Fe(III) as contained inthe impregnant precursor (FeCl3). Comparation of the diffractogramd-spacing to standard hematite (Table 1)indicates presence of hematite (α-Fe2O3), because itcontains relatively same or very closed 3 main peaks of standard hematite’sdiffractograms. All standard crystals which were used for interpretations ofthe product diffractograms are from American Mineralogyst Crystal StructureDatabase (AMCSD). This database is a very good choice, not only due to easy totake freely in google but also provide more than one choice, based on differentresearchs.
Figure 1 and Table 1 show that the composite which was obtained by calcination at 800 oC has higher peaks and more diffractograms than at 600oC. It indicated the improvement of the α–Fe2O3 crystallization process which resulted in better crystallization. Theoritically, higher temperature makes more collisions of reactants which makes more effective chemical reaction. The reaction in calcination process is a solid state reaction which involves ions diffusion and reactions last on the surfaces of the reactants [57]. It means that more collisions in higher temperature may create better ion diffusion.
For other alternative, comparison to standard maghemite (γ-Fe2O3) was conducted in Table 2. Result of the interpretations gave conclusion that the products contain maghemite structure because both products which were obtained at 600 and 800oC have 3 highest diffractogram peaks of the maghemite structure.
Another possibility is matchness of 3 main peaks for standar magnetite (α-Fe3O4) and 3 peaks of the products’ diffractogram (Table 3). It indicates that the composite also contained the magnetite. Magnetite is a spinel which can be written as FeFe2O4. Precursor of this metal oxide in this synthesis was FeCl3 which contains iron charge of 3+, so that Fe(II) probably derived from patchouli biomass. Presence of Fe(II) may be related to content of Fe element in the biochar based on EDX analysis whereas no iron (II) substance was included in synthesis process, as reported in our previous research [51,52]. Magnetite contains both Fe(II) and Fe(III) ions in the crystal lattice, each half of the Fe3+ ions are located in tetrahedral and octahedral sites. Magnetite can be formulated as FeO·Fe2O3 [58].
Comparation to data of AMCSD standard FeCl3 as precursor of metal oxides gave only the highest peak of 3 main FeCl3 standard data (Table 4) which was closed to the data of products. It means that presence of FeCl3 structure in the product is doubted or a weak conclusion.
FeCl3 is a chemical activator which has a chemical role as the dehydrating agent in the activation reaction along calcination process. This salt has melting point of 300oC so that it melted at the calcination temperatures of 600 and 800 oC [59]. In the biochar activation, the molten salt encapsulated the biochar and aromatize it [60]. As dehydrating agent, FeCl3 provided the Lewis acid of Fe(III) to attract Lewis base of O atom in the H2O molecules which was formed by thermal reactions of the oxy functional groups on surface of the biochar. This attraction improves the activation reaction effectivity. For example, the thermal reactions on surface of the biochar which has hydroxyl functional groups (C-OH) by presence of FeCl3 can be predicted as follows:
Preprints 115017 i001
The hydroxyl is only one example of the oxy functional groups on surface of the biochar. The other ones can be founded in discussion of section of 3.2.

3.2. Surface Functional Group of the Composites

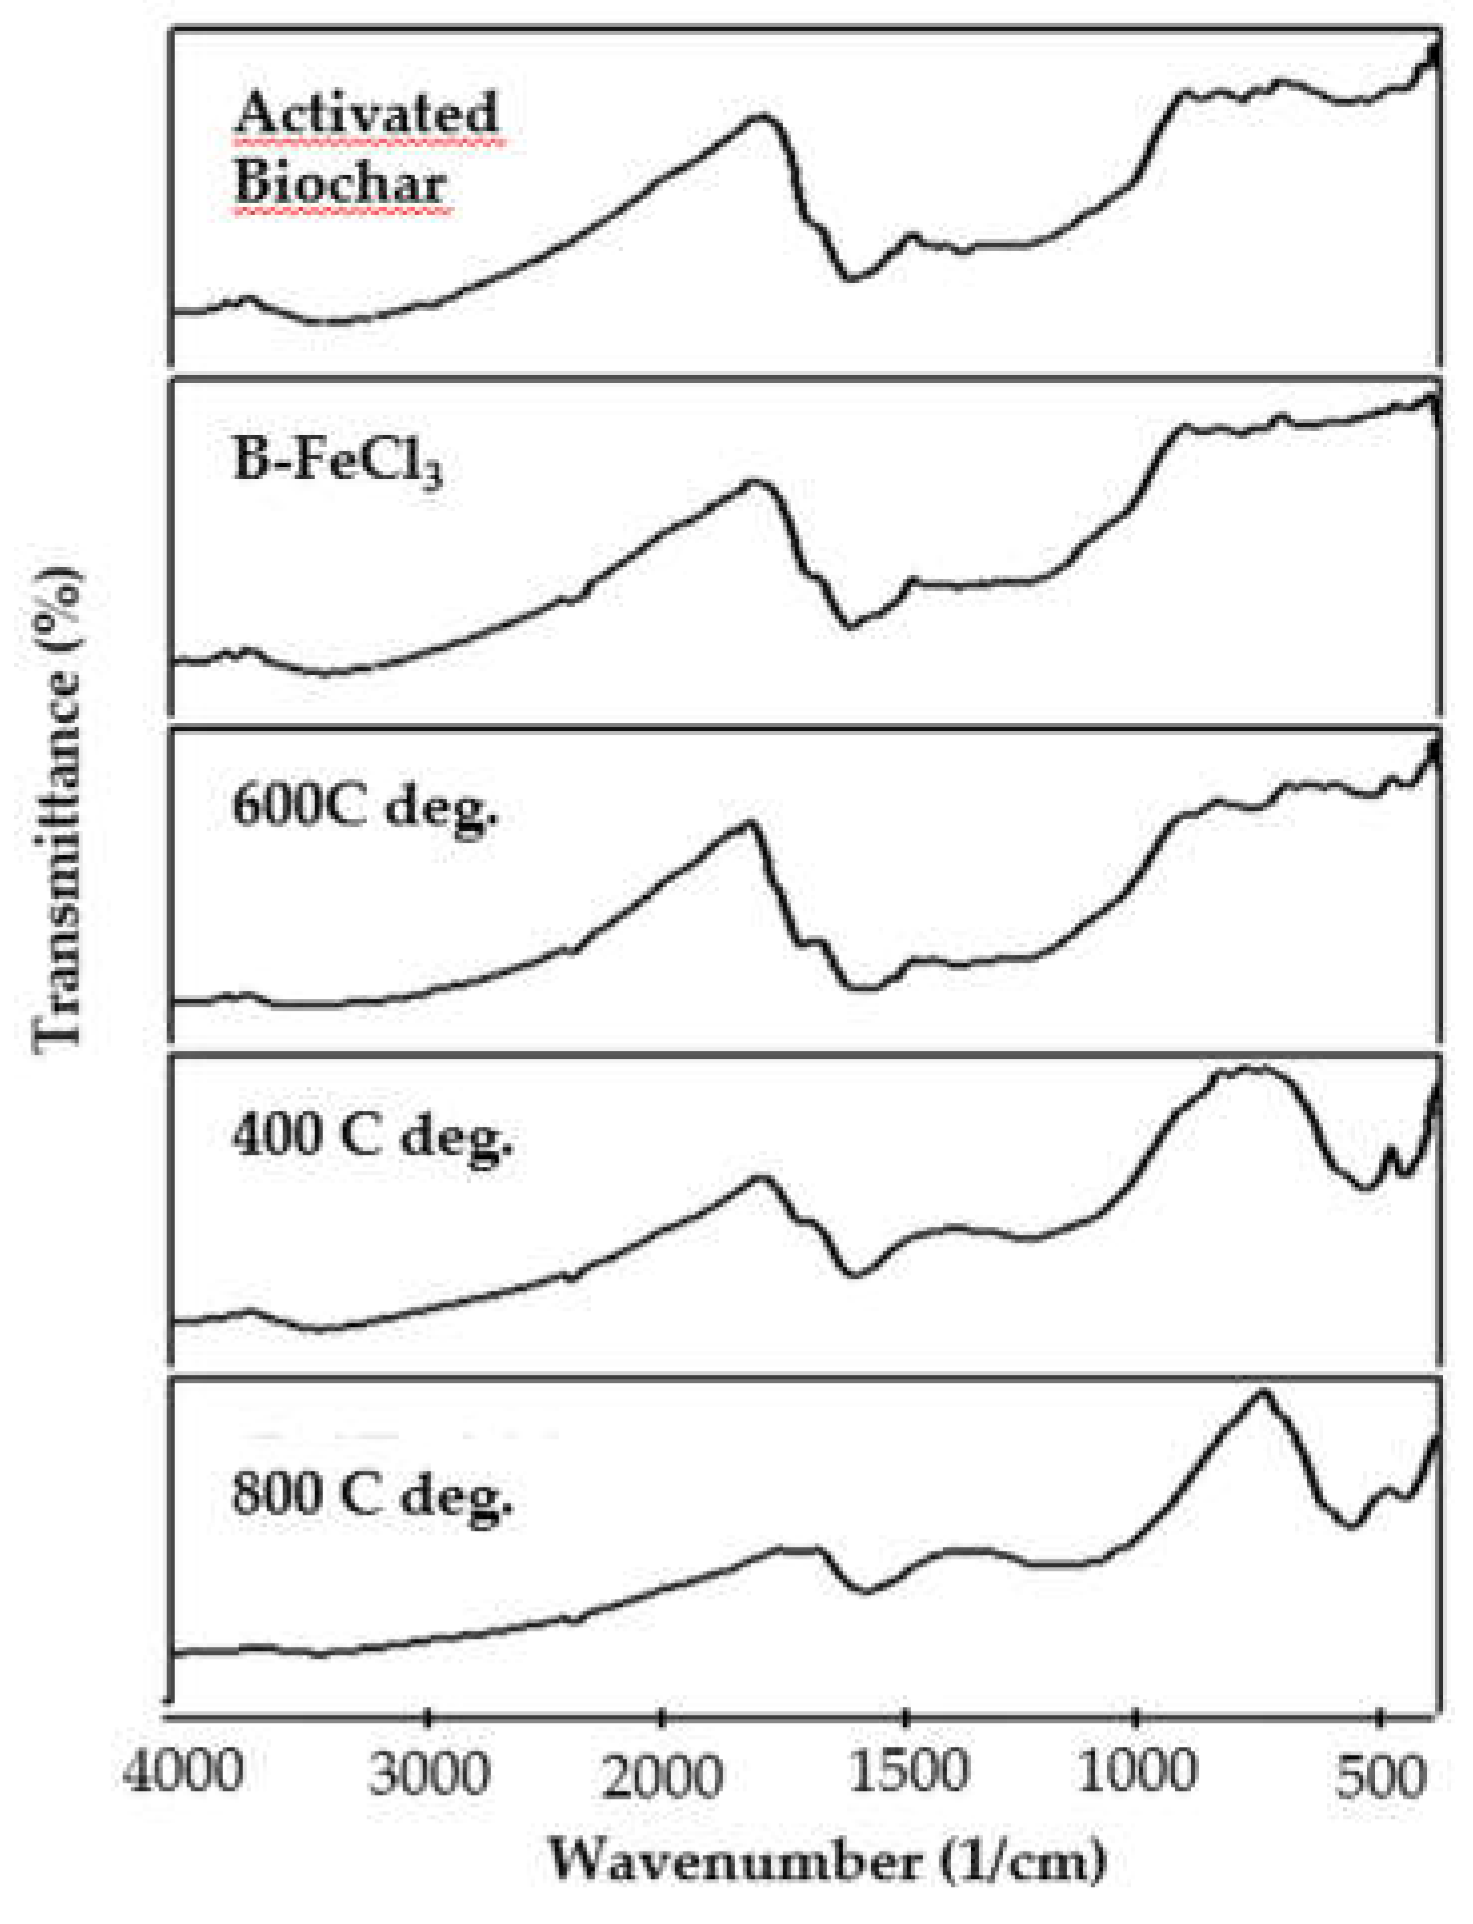
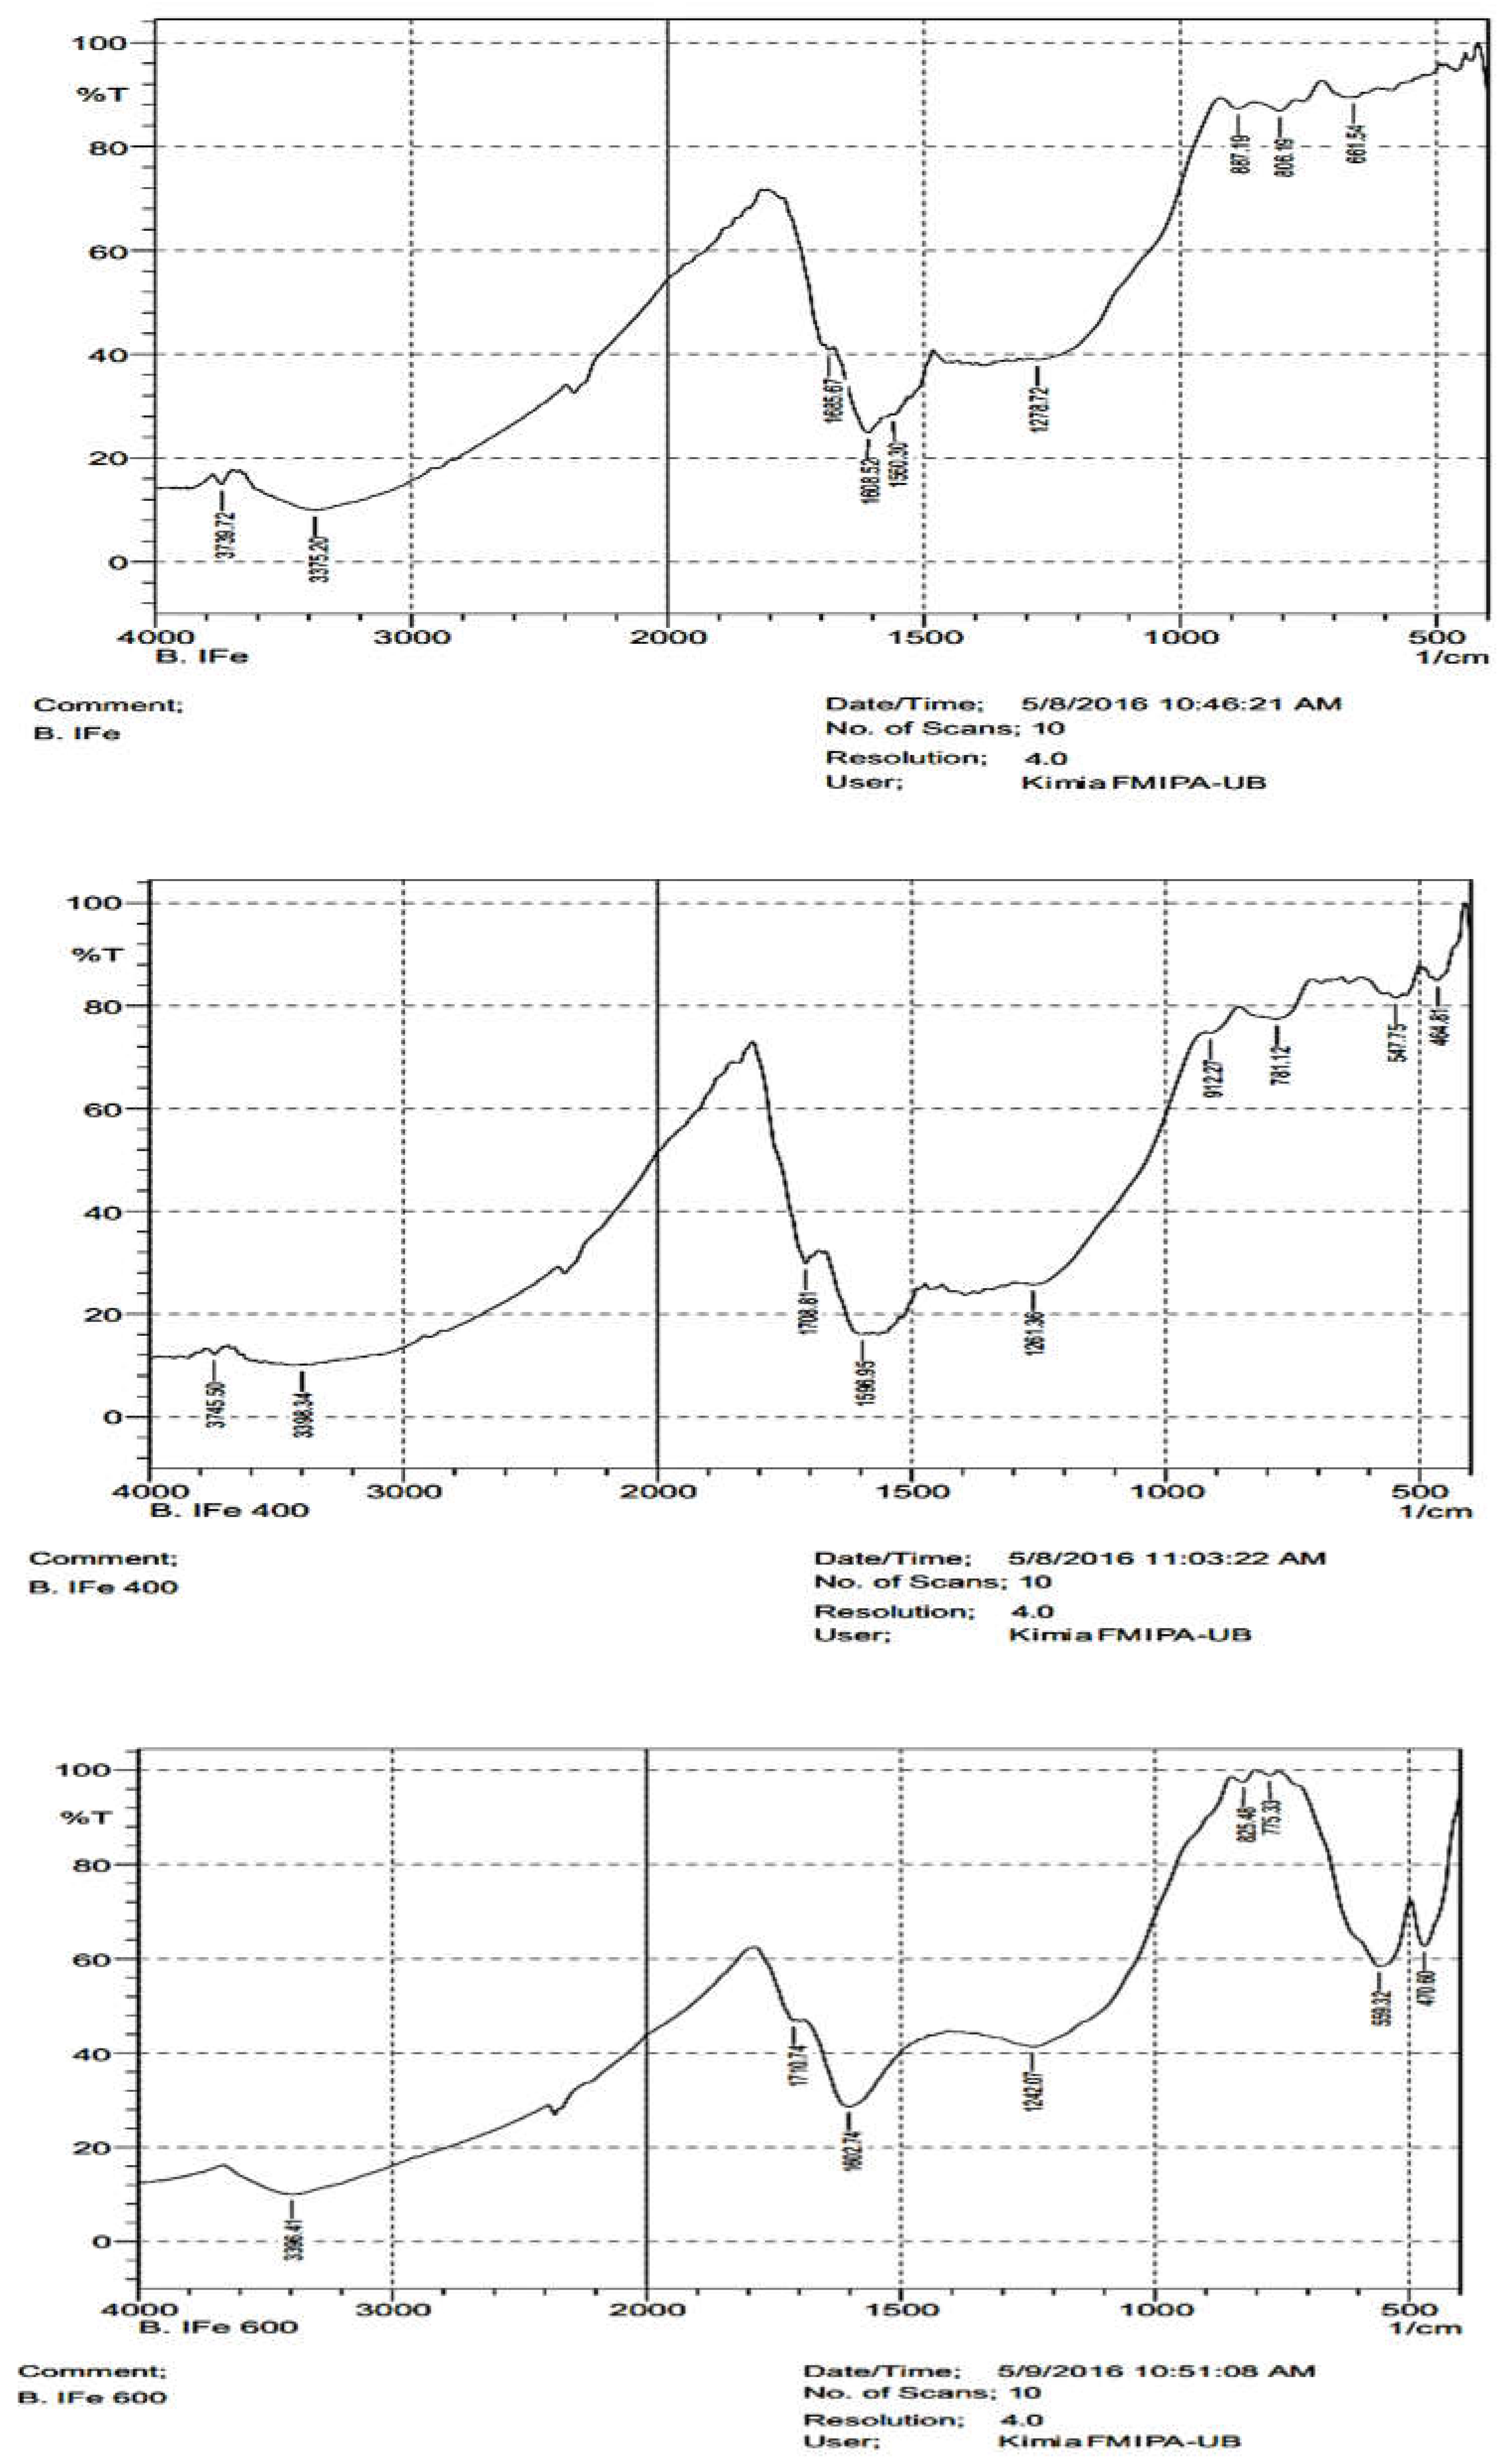
Characterization of the functional groups using FTIR spectrometry has been performed and the result is reported in Figure 3. All the composite FTIR spectra were obtained using the products synthesized in PUPT 2016. The activated biochar spectrum was obtained from PUPT 2015.
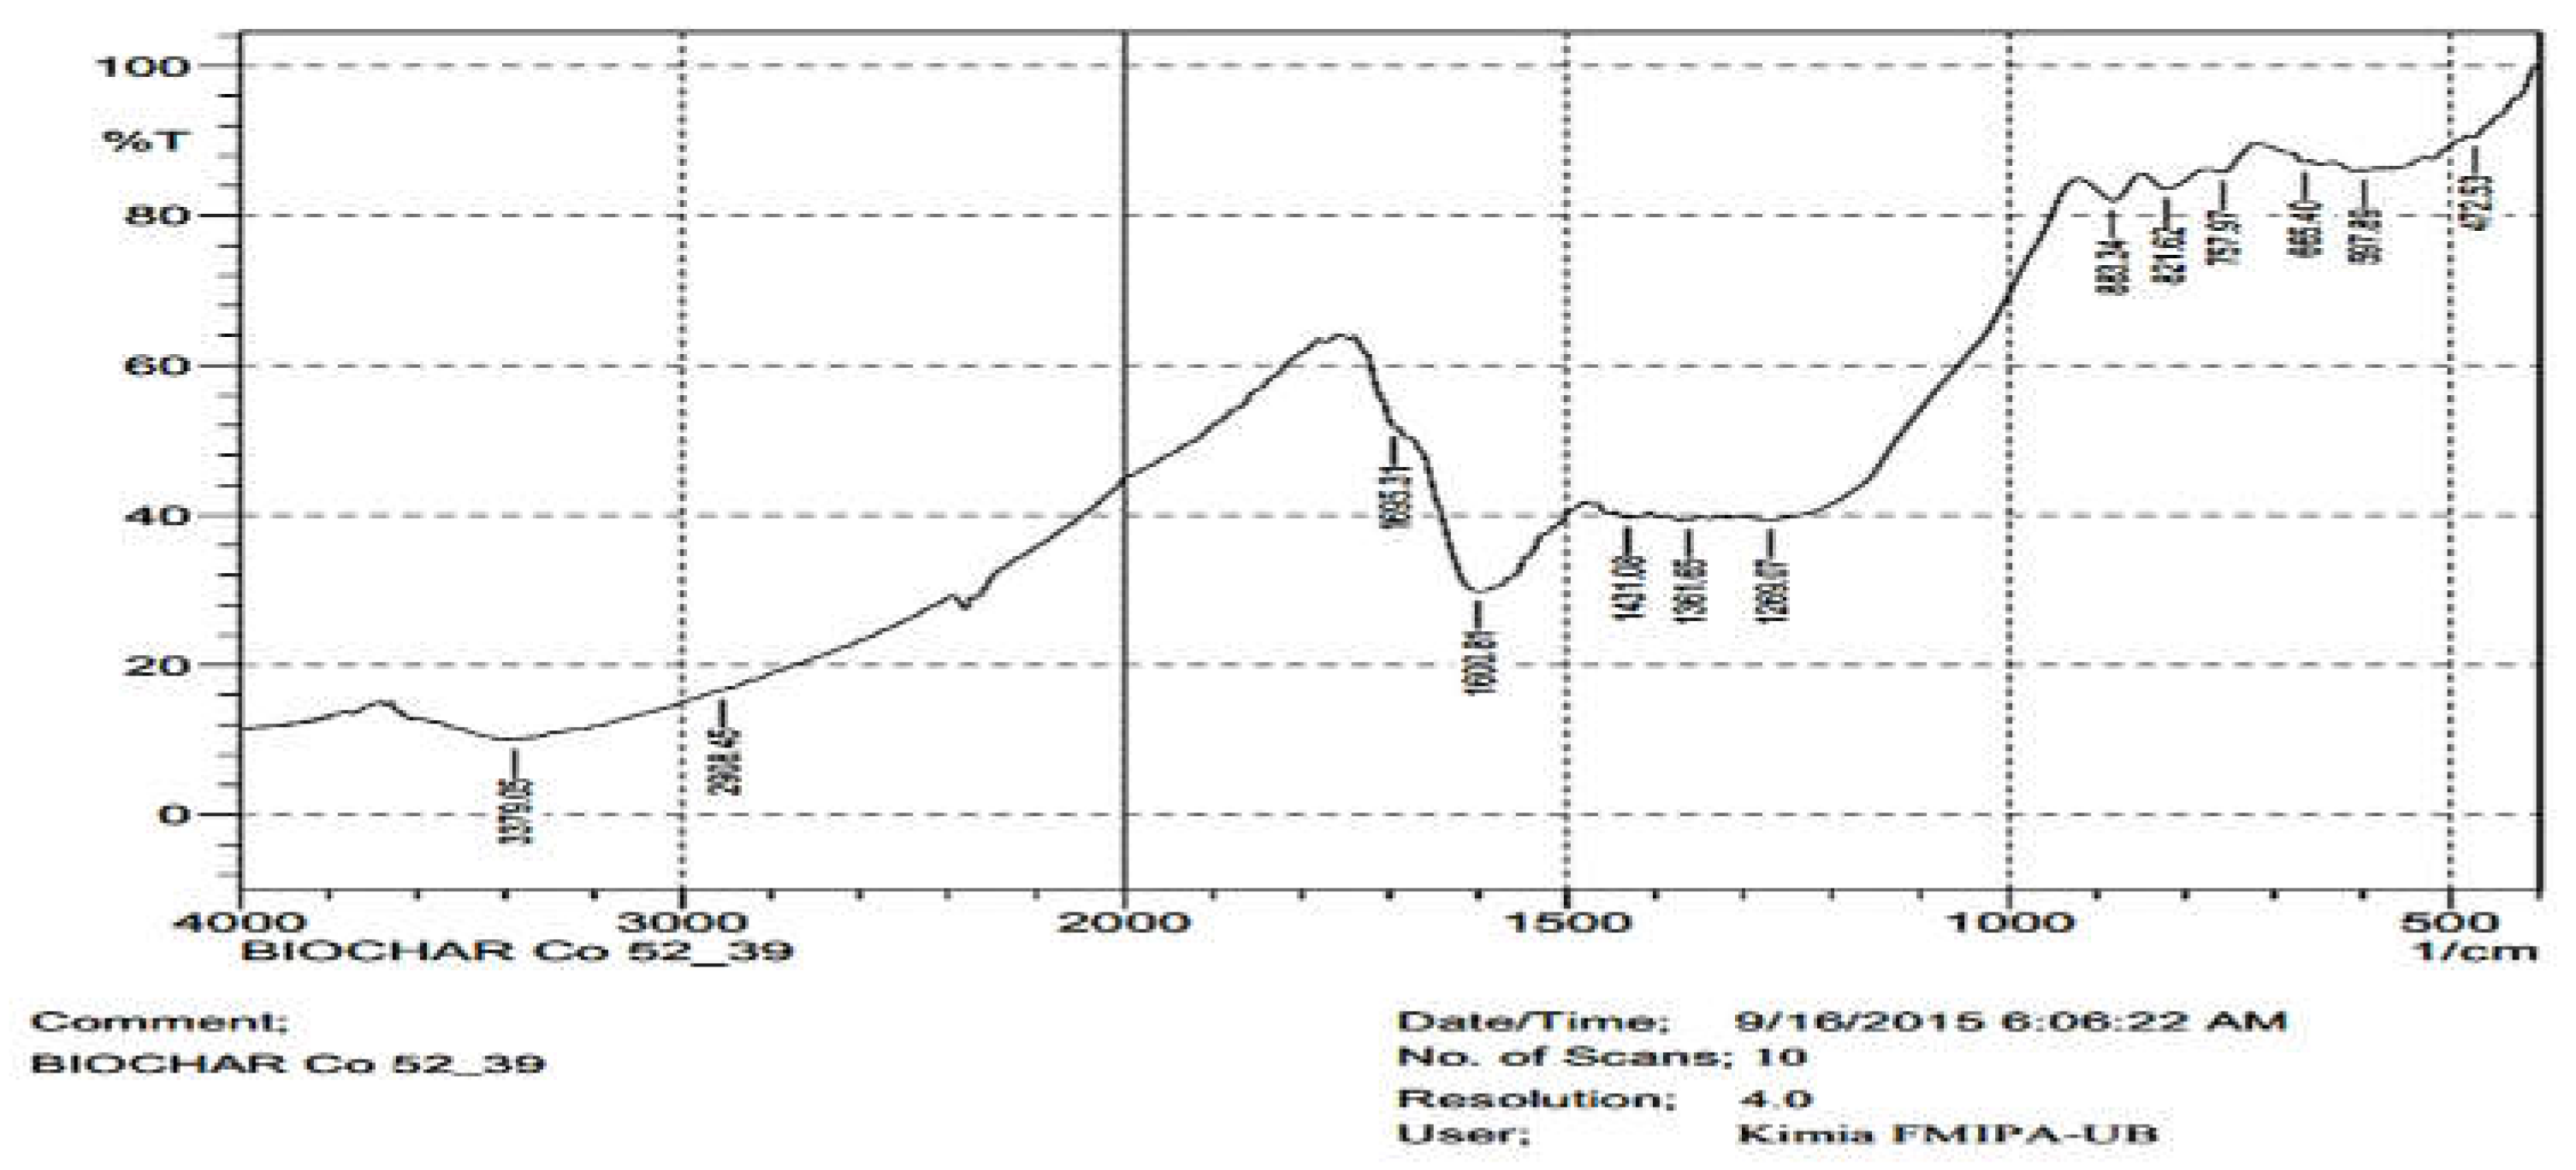
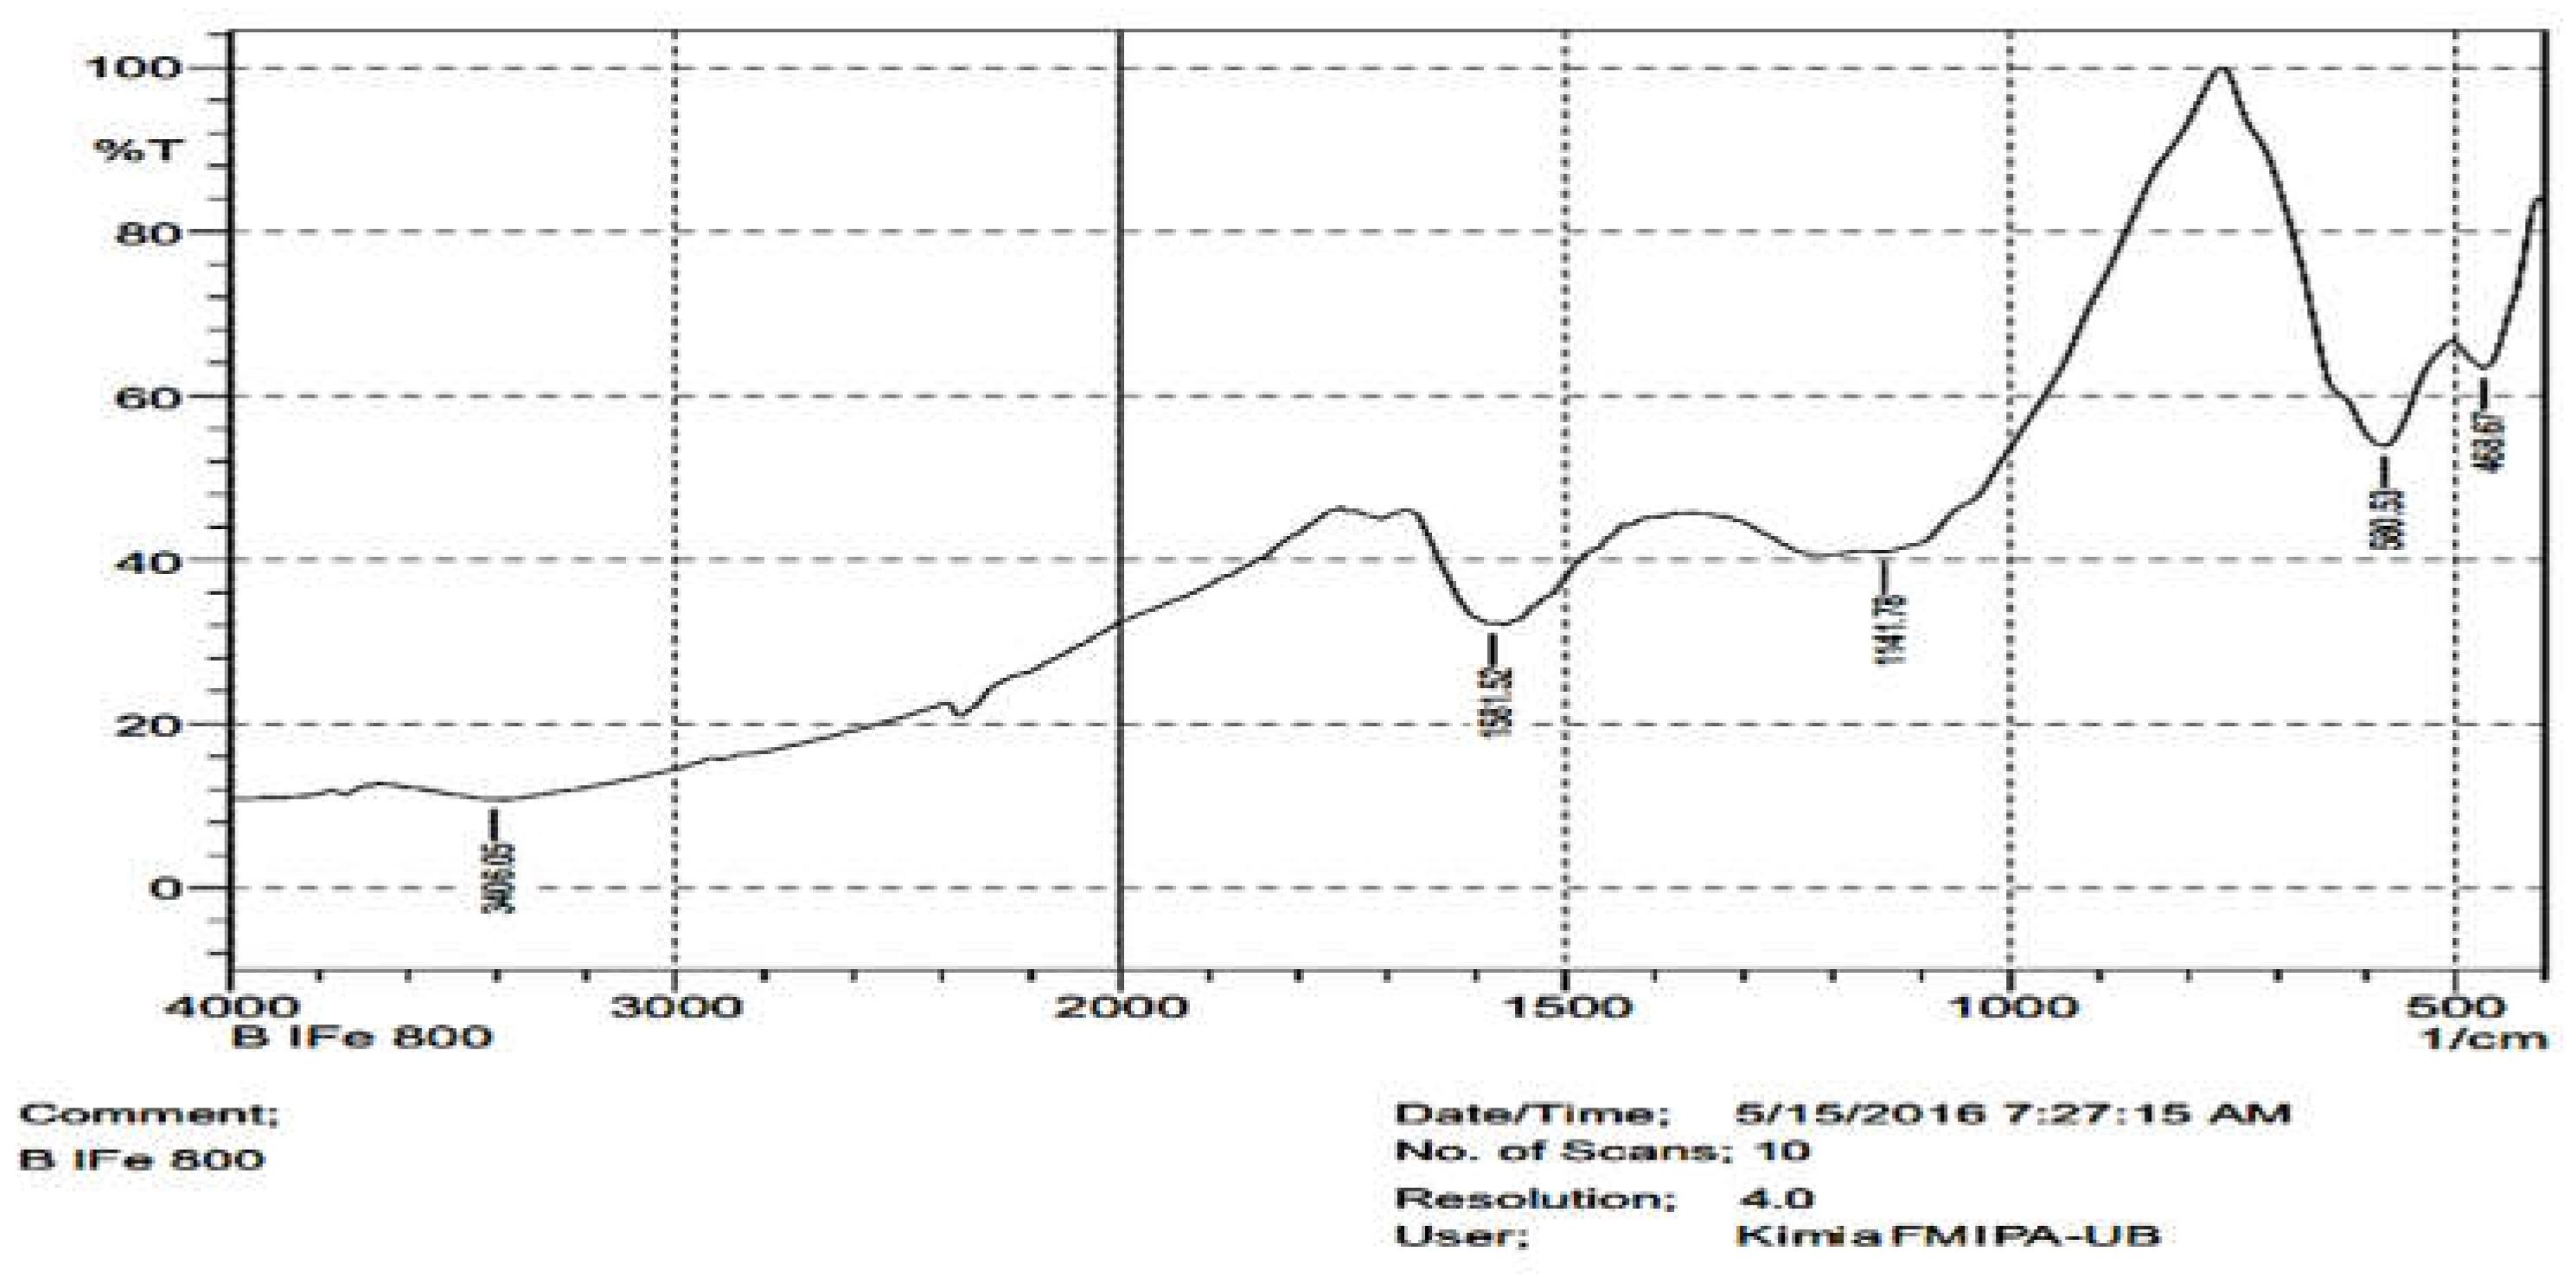
Those overlay FTIR spectra (Figure 3) were based on results of measurements in Figure 4. The overlay is needed to make easier comparation of those spectra, especially the bands at 3500, 1750 and 1200 cm-1.
Figure 3 showed that spectra of the composite before and after calcination till 400oC are relatively same. It means that calcination process relatively gave no significant change of surface functional groups. However, the composite calcined at 600oC provided the significant change of spectra pattern, especially related to a weakening band at about 1750 cm-1 and 3500 cm-1, but emerging 2 bands at about 600 and 490 cm-1. According to the previous researches, the band at 1750 cm-1 is band of C=O stretching vibration and about 3500 cm-1 is OH of hydrate or phenolic groups [61]. The unchanged bands in the region around 1200 cm-1 indicated the stretching of C-O bonds] [62]. By referring to the bands of Cu-O [63], the bands at 600 and 490 cm-1 may be connected to the stretching vibration of Fe–O. The composite which was calcined at 800oC showed the disappeared band of C=O at 1750 cm-1 and sharper band at about 600 cm-1. It indicated improvement of the iron oxide formation in the composites so that this characterization support presence of the iron oxide structures which were characterized by XRD method (Figure 1).

3.3. Porosity of the Composite

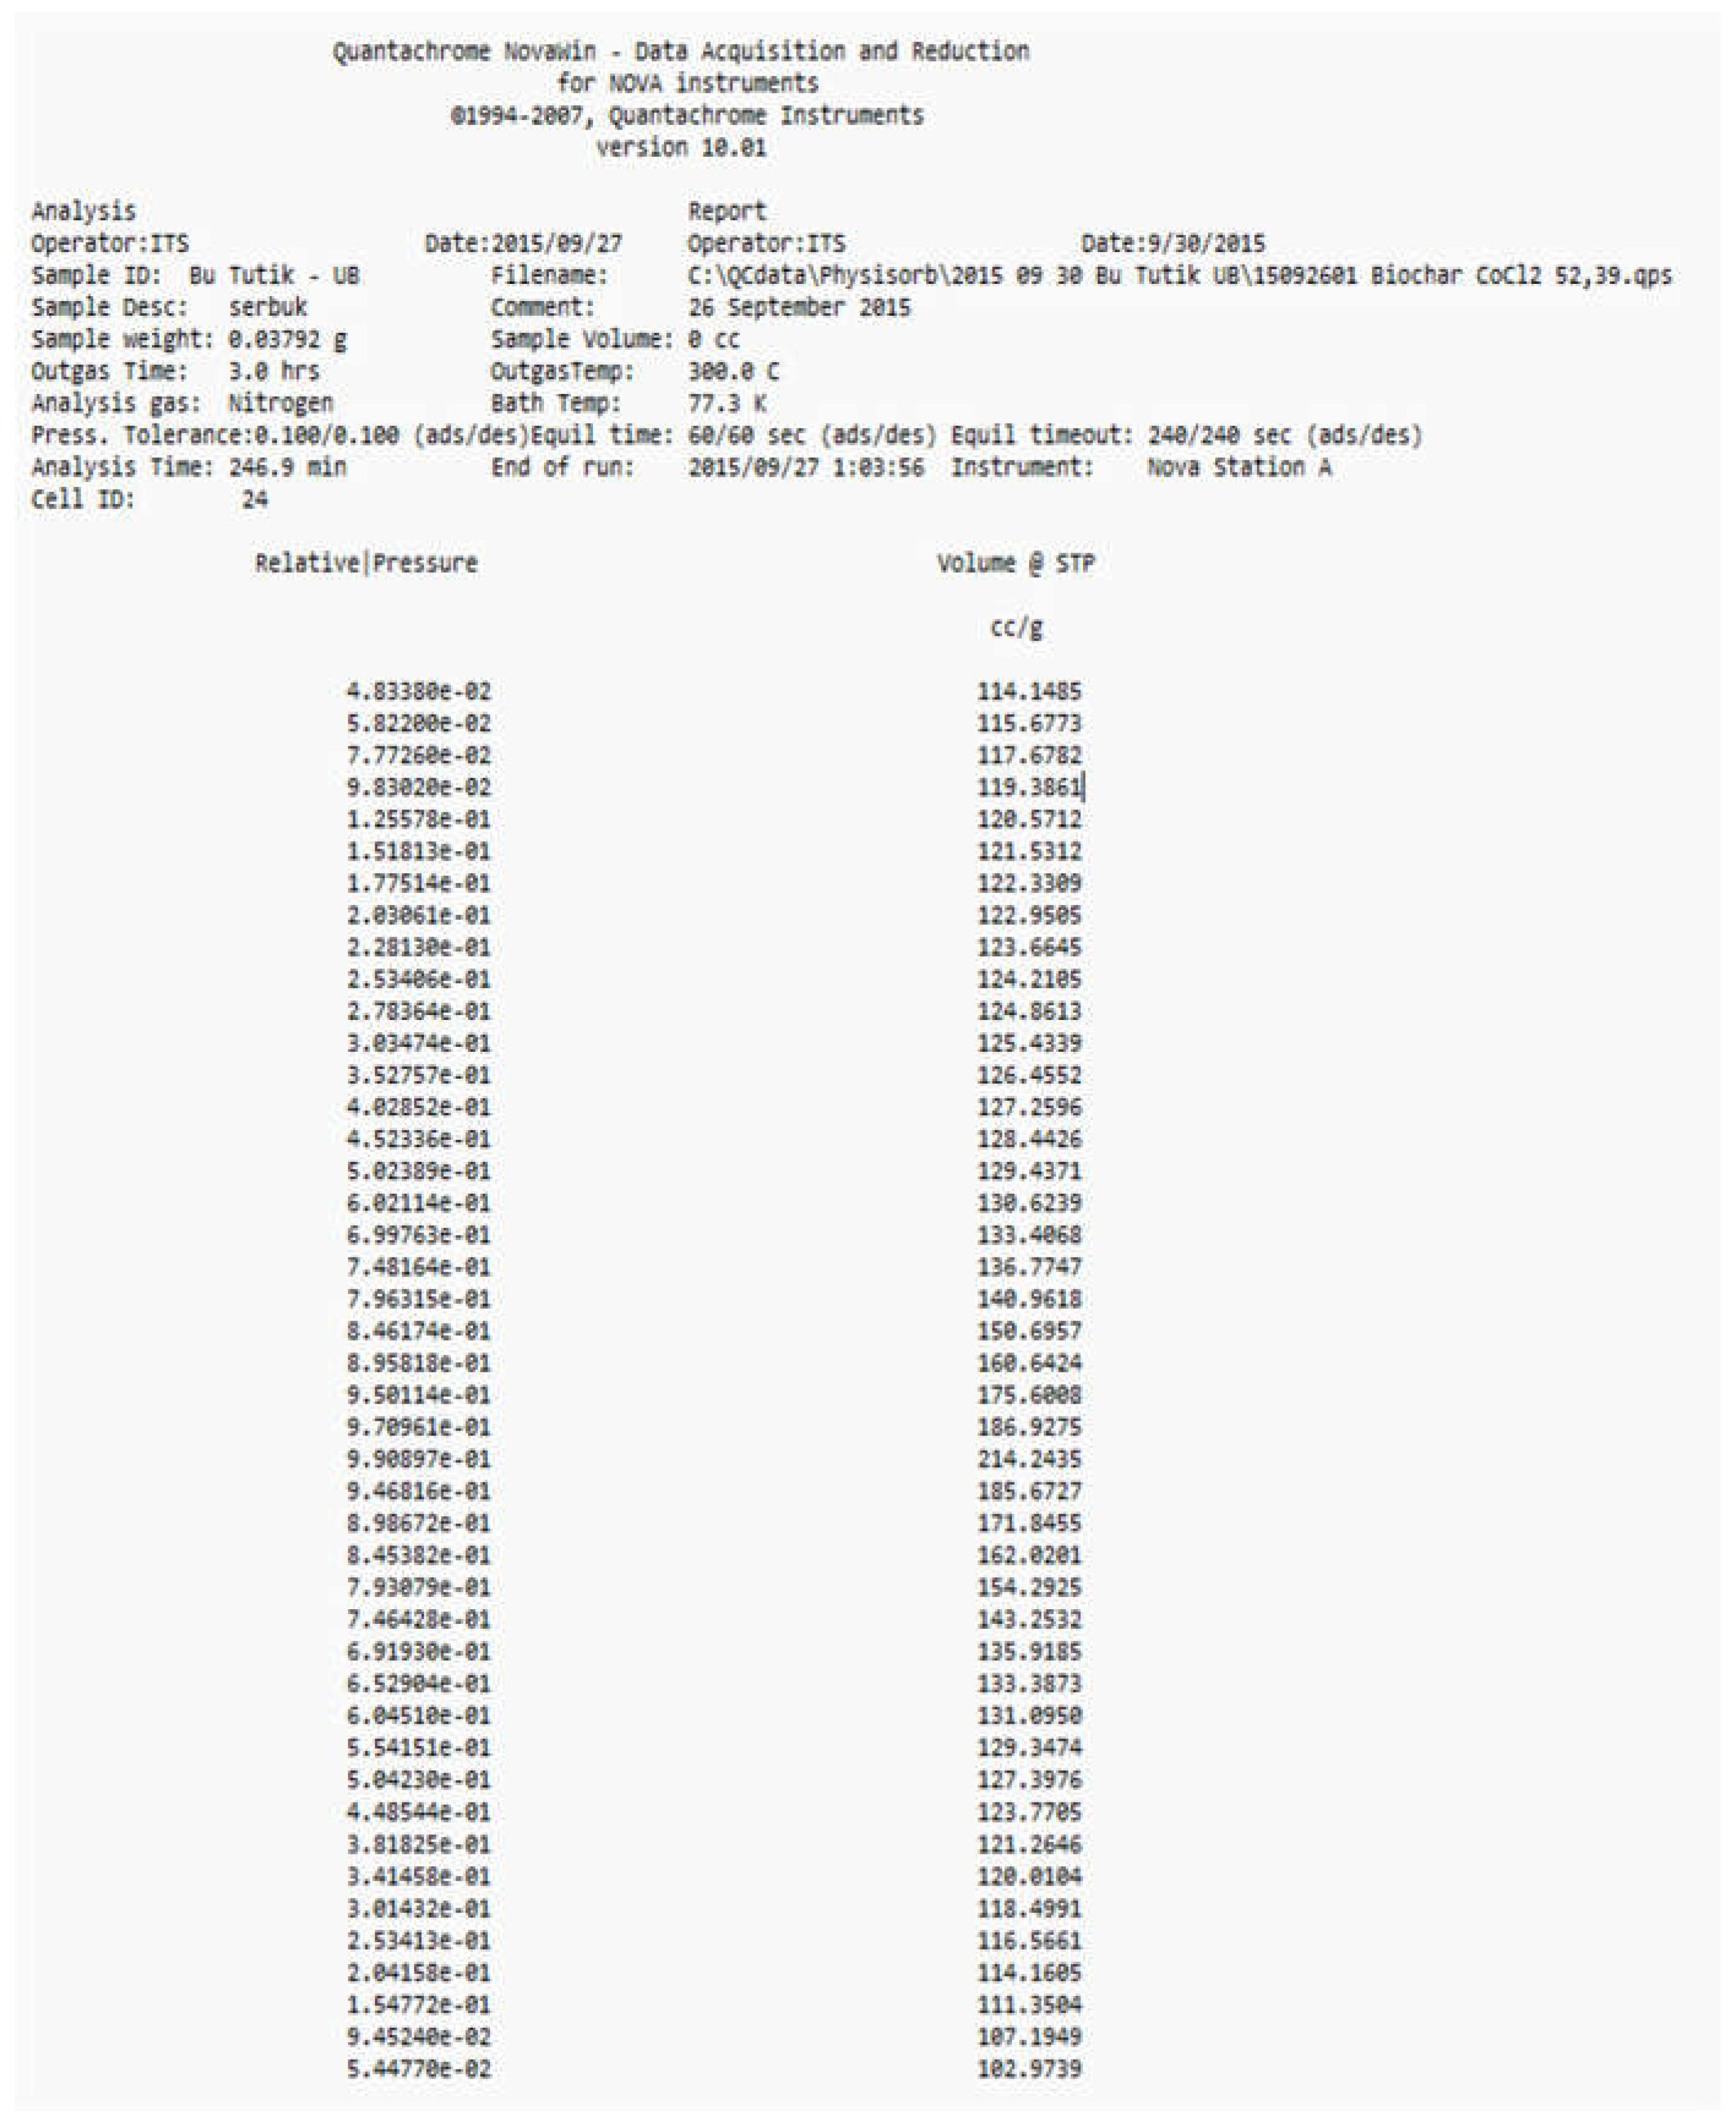
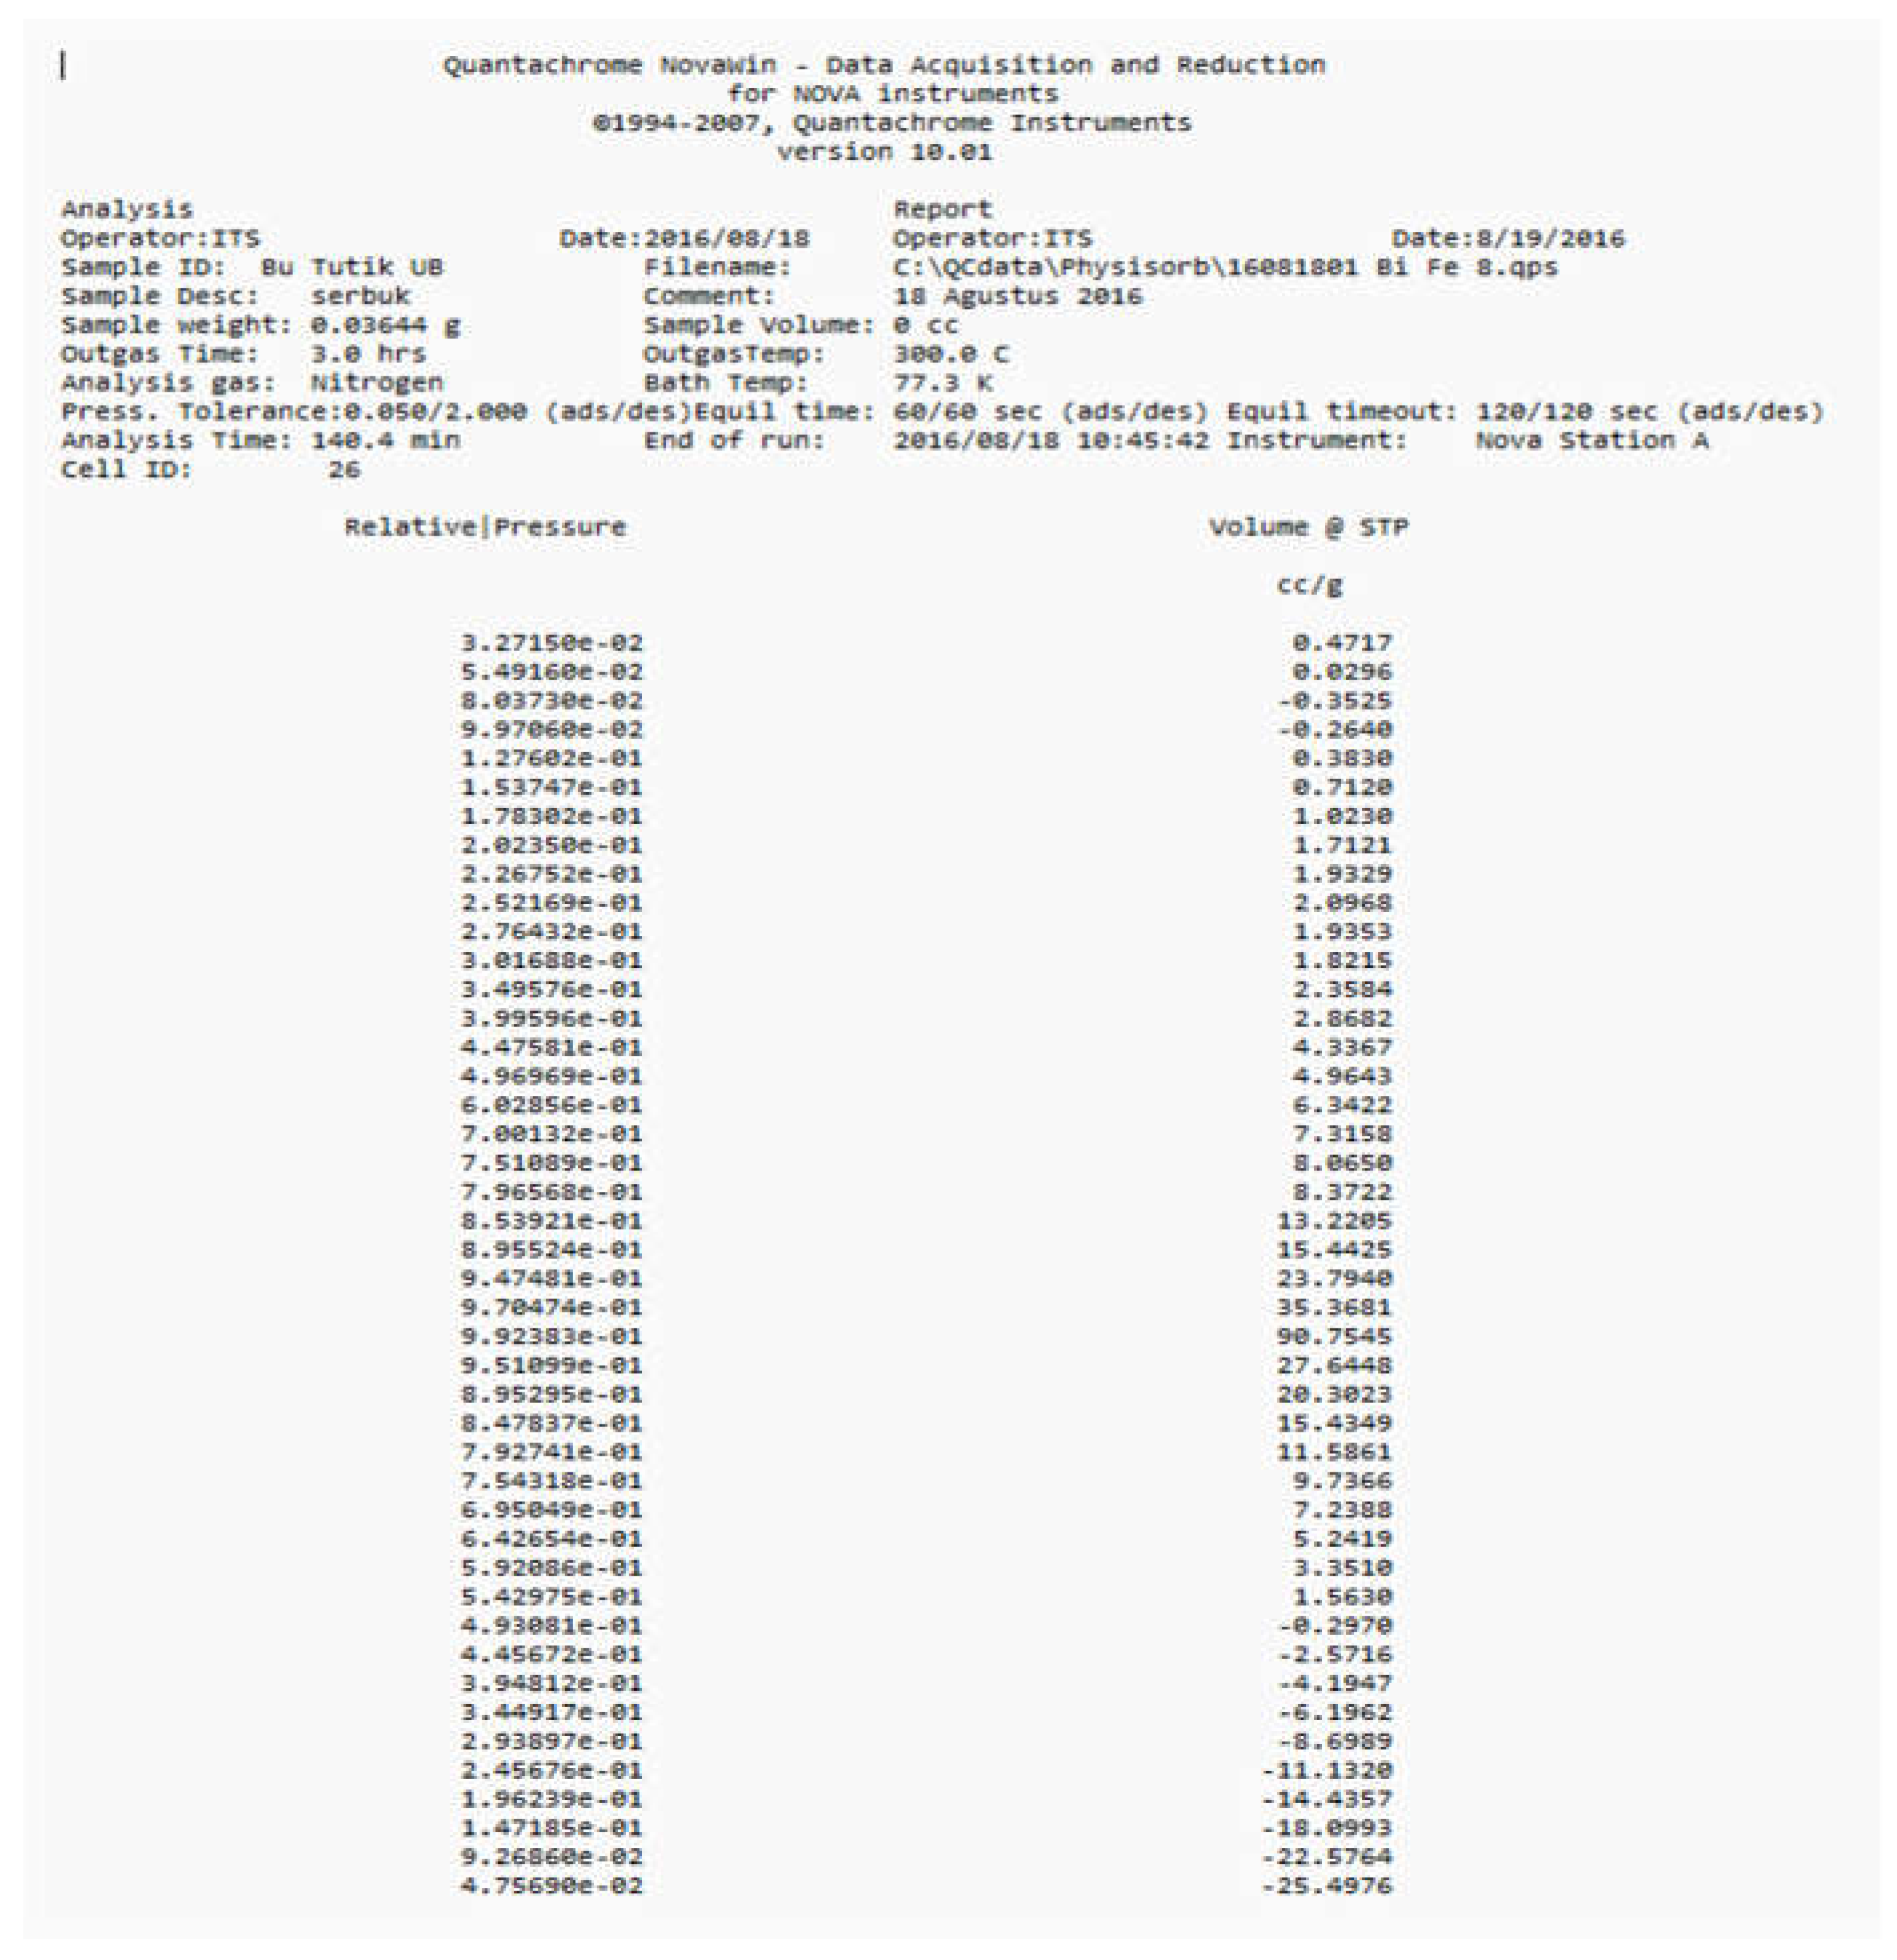
Pore and surface area were characterized using nitrogen gas adsorption method. Isotherm adsorptions of the biochar and the composite are reported in Figure 5. The isotherms were drawn based on raw data in Figure 6 and Figure 7. The composite calcined at 800 oC was chosen for this characterization due to its highest crystallinity (Figure 1).
Pattern of the isotherm can be used to identify pore size and porosity qualitatively, such as: 1) much higher position of the biochar curve means much higher nitrogen adsorption and indicates higher pore volume and surface area of the activated biochar than composite, 2) nitrogen adsorption at low P/Po indicates presence of micropores, 3) hysteresis pattern indicates presence of mesopores, and 4) increasing curve at almost P/Po = 1 indicates macropore or holes among particle solids which have hole size in the macropore area.
Quantitative data of surface are and pore volume for mesopore, micropore, and macropore areas were calculated and reported in Table 5. The specific surface area such as SBET was result of adsorption data treatment using BET method. Vp values were calculated based on the adsorption of nitrogen gas volume at P/Po = 0.99. The mesoporous and macroporous volumes and surface areas were calculated using Pierce Orr Dalla Vale (POD) method. The microporous volumes and surface areas were calculated from subtraction of Vp and SBET by mesoporous volume and surface area respectively [64].
Data of Table 5 showed that all pore volumes and surface areas of the composite, including mesopore, macropore, and micropore, were lower than of the activated biochar, which indicates the reduction of porosity by impregnation and calcination. Physically, it can be caused by occupation of the impregnant in its pores. It is supported by presence of various iron oxide structures by XRD characterization (Figure 1) and by presence of M-O vibrations by FTIR spectrometry characterization (Figure 3). Chemically, the activation reaction of the biochar surface may reduce some functional groups such as C=O and -OH as also supported by FTIR spectra (Figure 3).
Table 5 confirms that modification of iron oxides on the activated biochar reduced mesoporous volume much lower than other areas in sequence of Vmeso > Vmacro > Vmicro. It indicates that the impregnant especially occupied the mesopore. In other hand, the modification decreased the microporous surface area much lower than microporous and mesoporous areas. It indicates that the activation reaction on surface of the biochar especially affected damage of the microporous area much more than the others. The micropore is the dominant pores of the biochar. It is probably affected by usage of CoCl2 as activator of carbonization and FeCl3 as impregnant precursor. Physically salts can act as pore template.
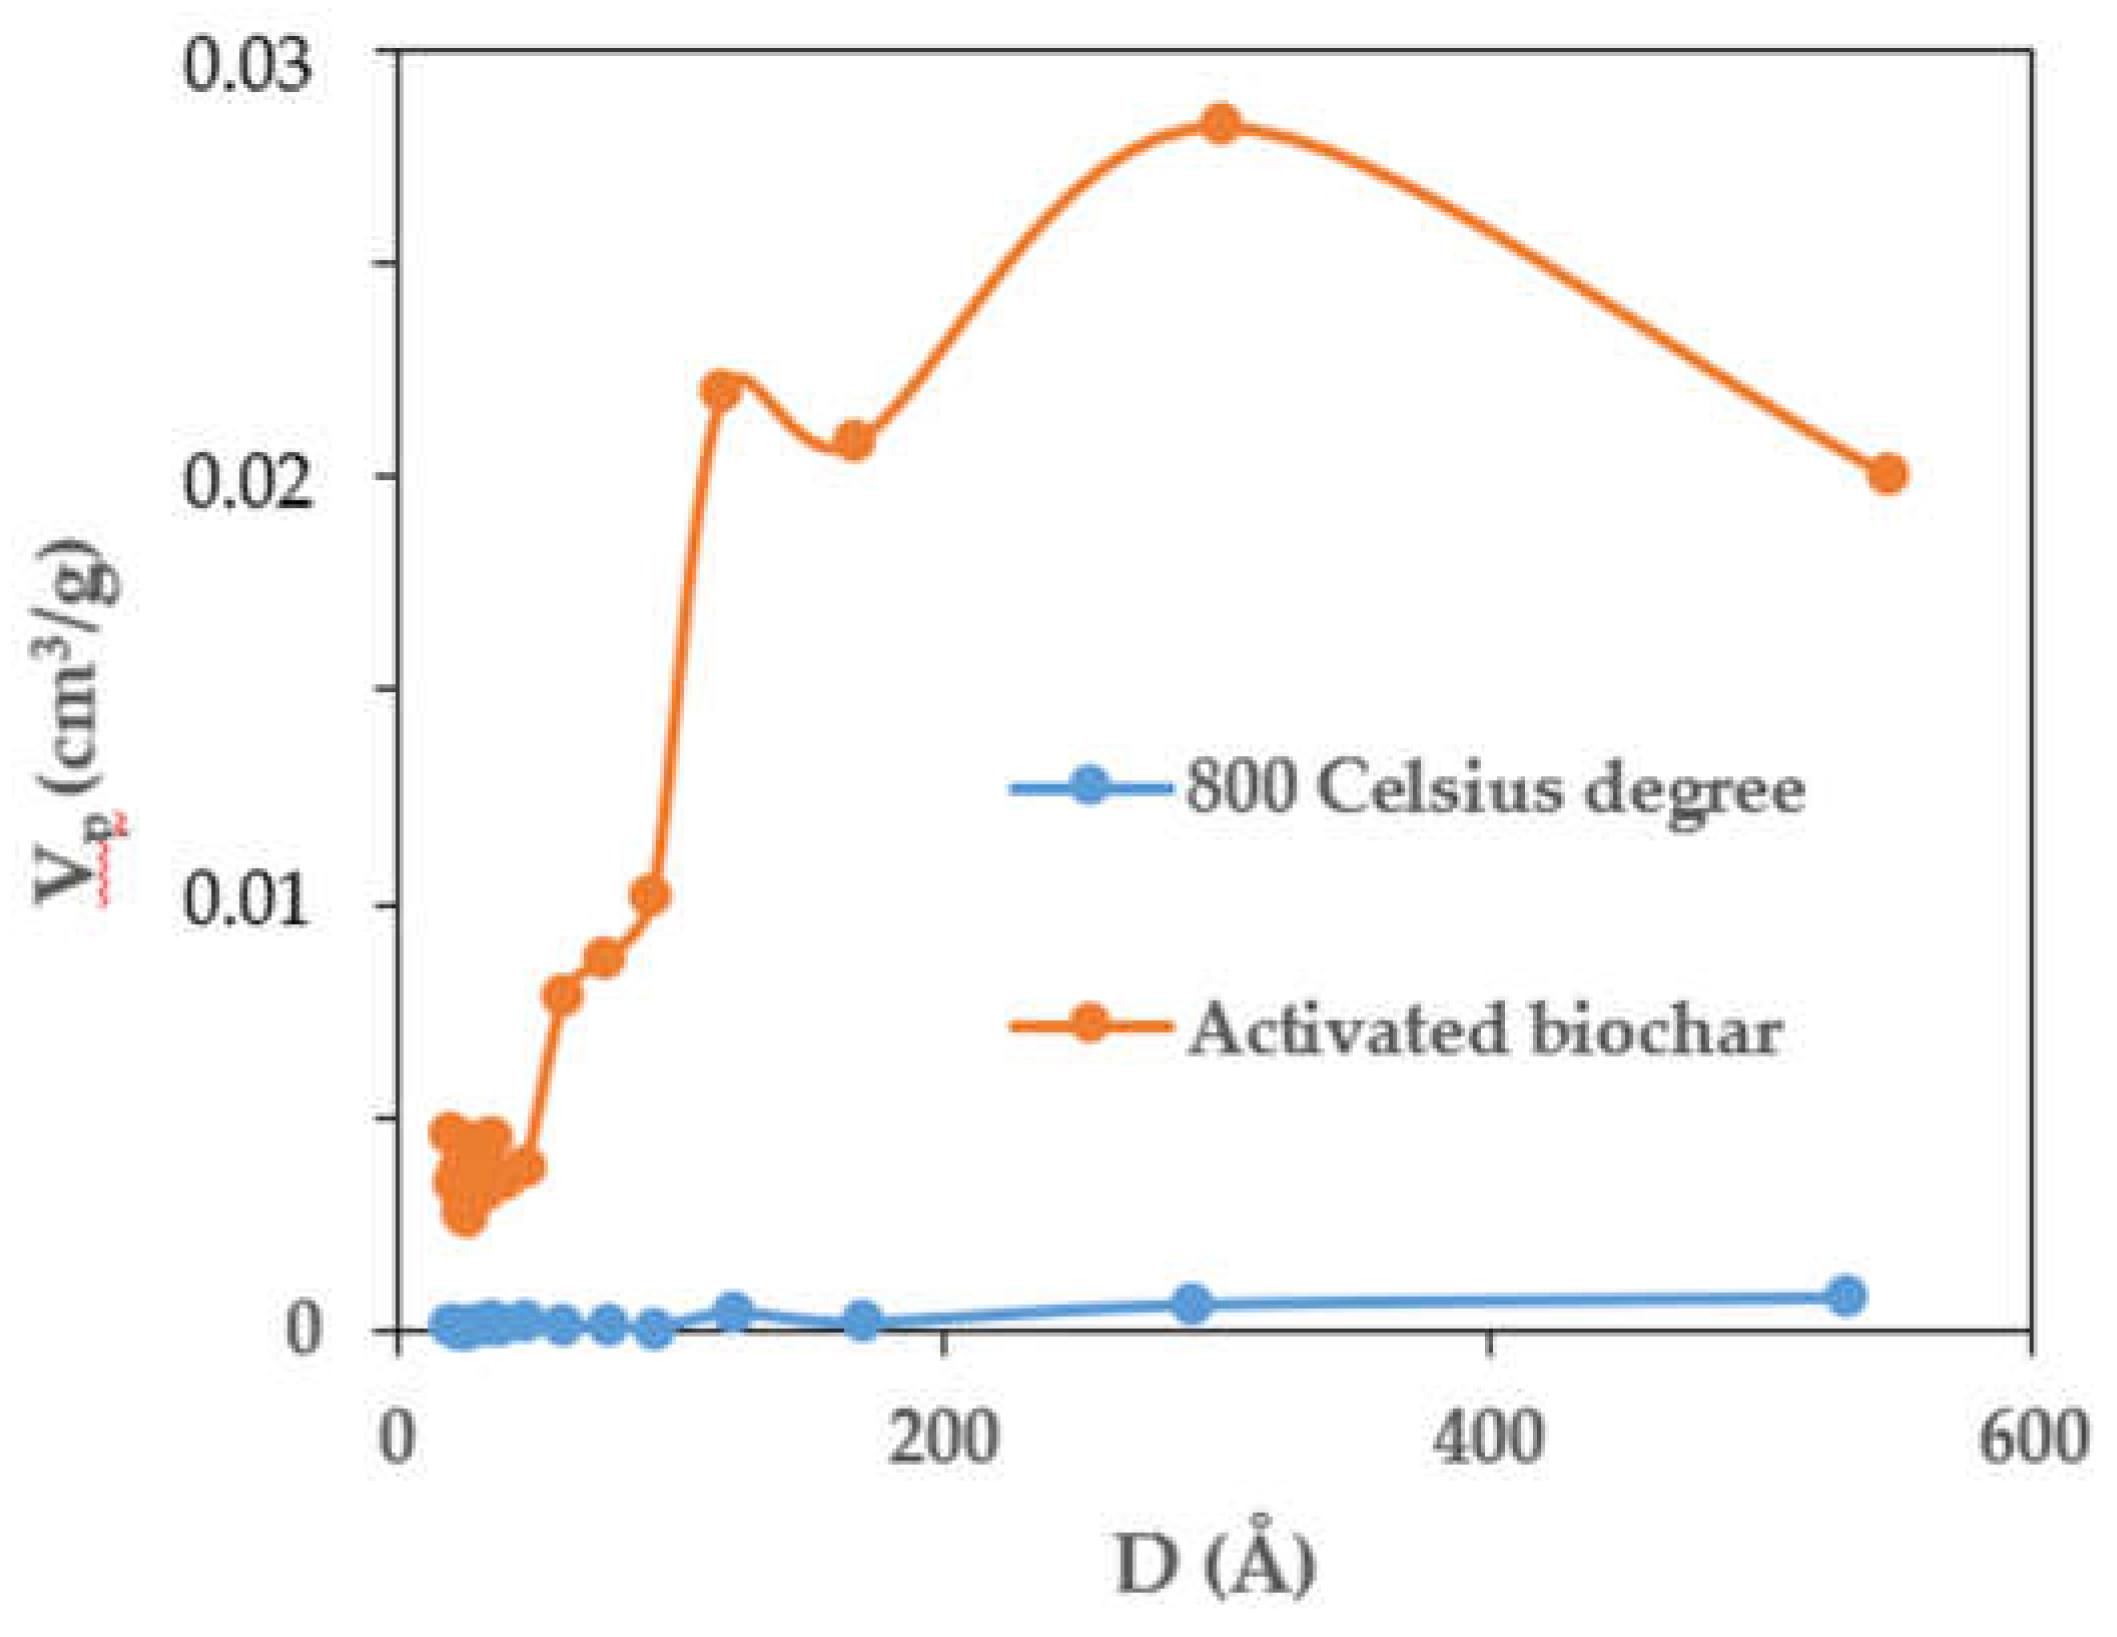
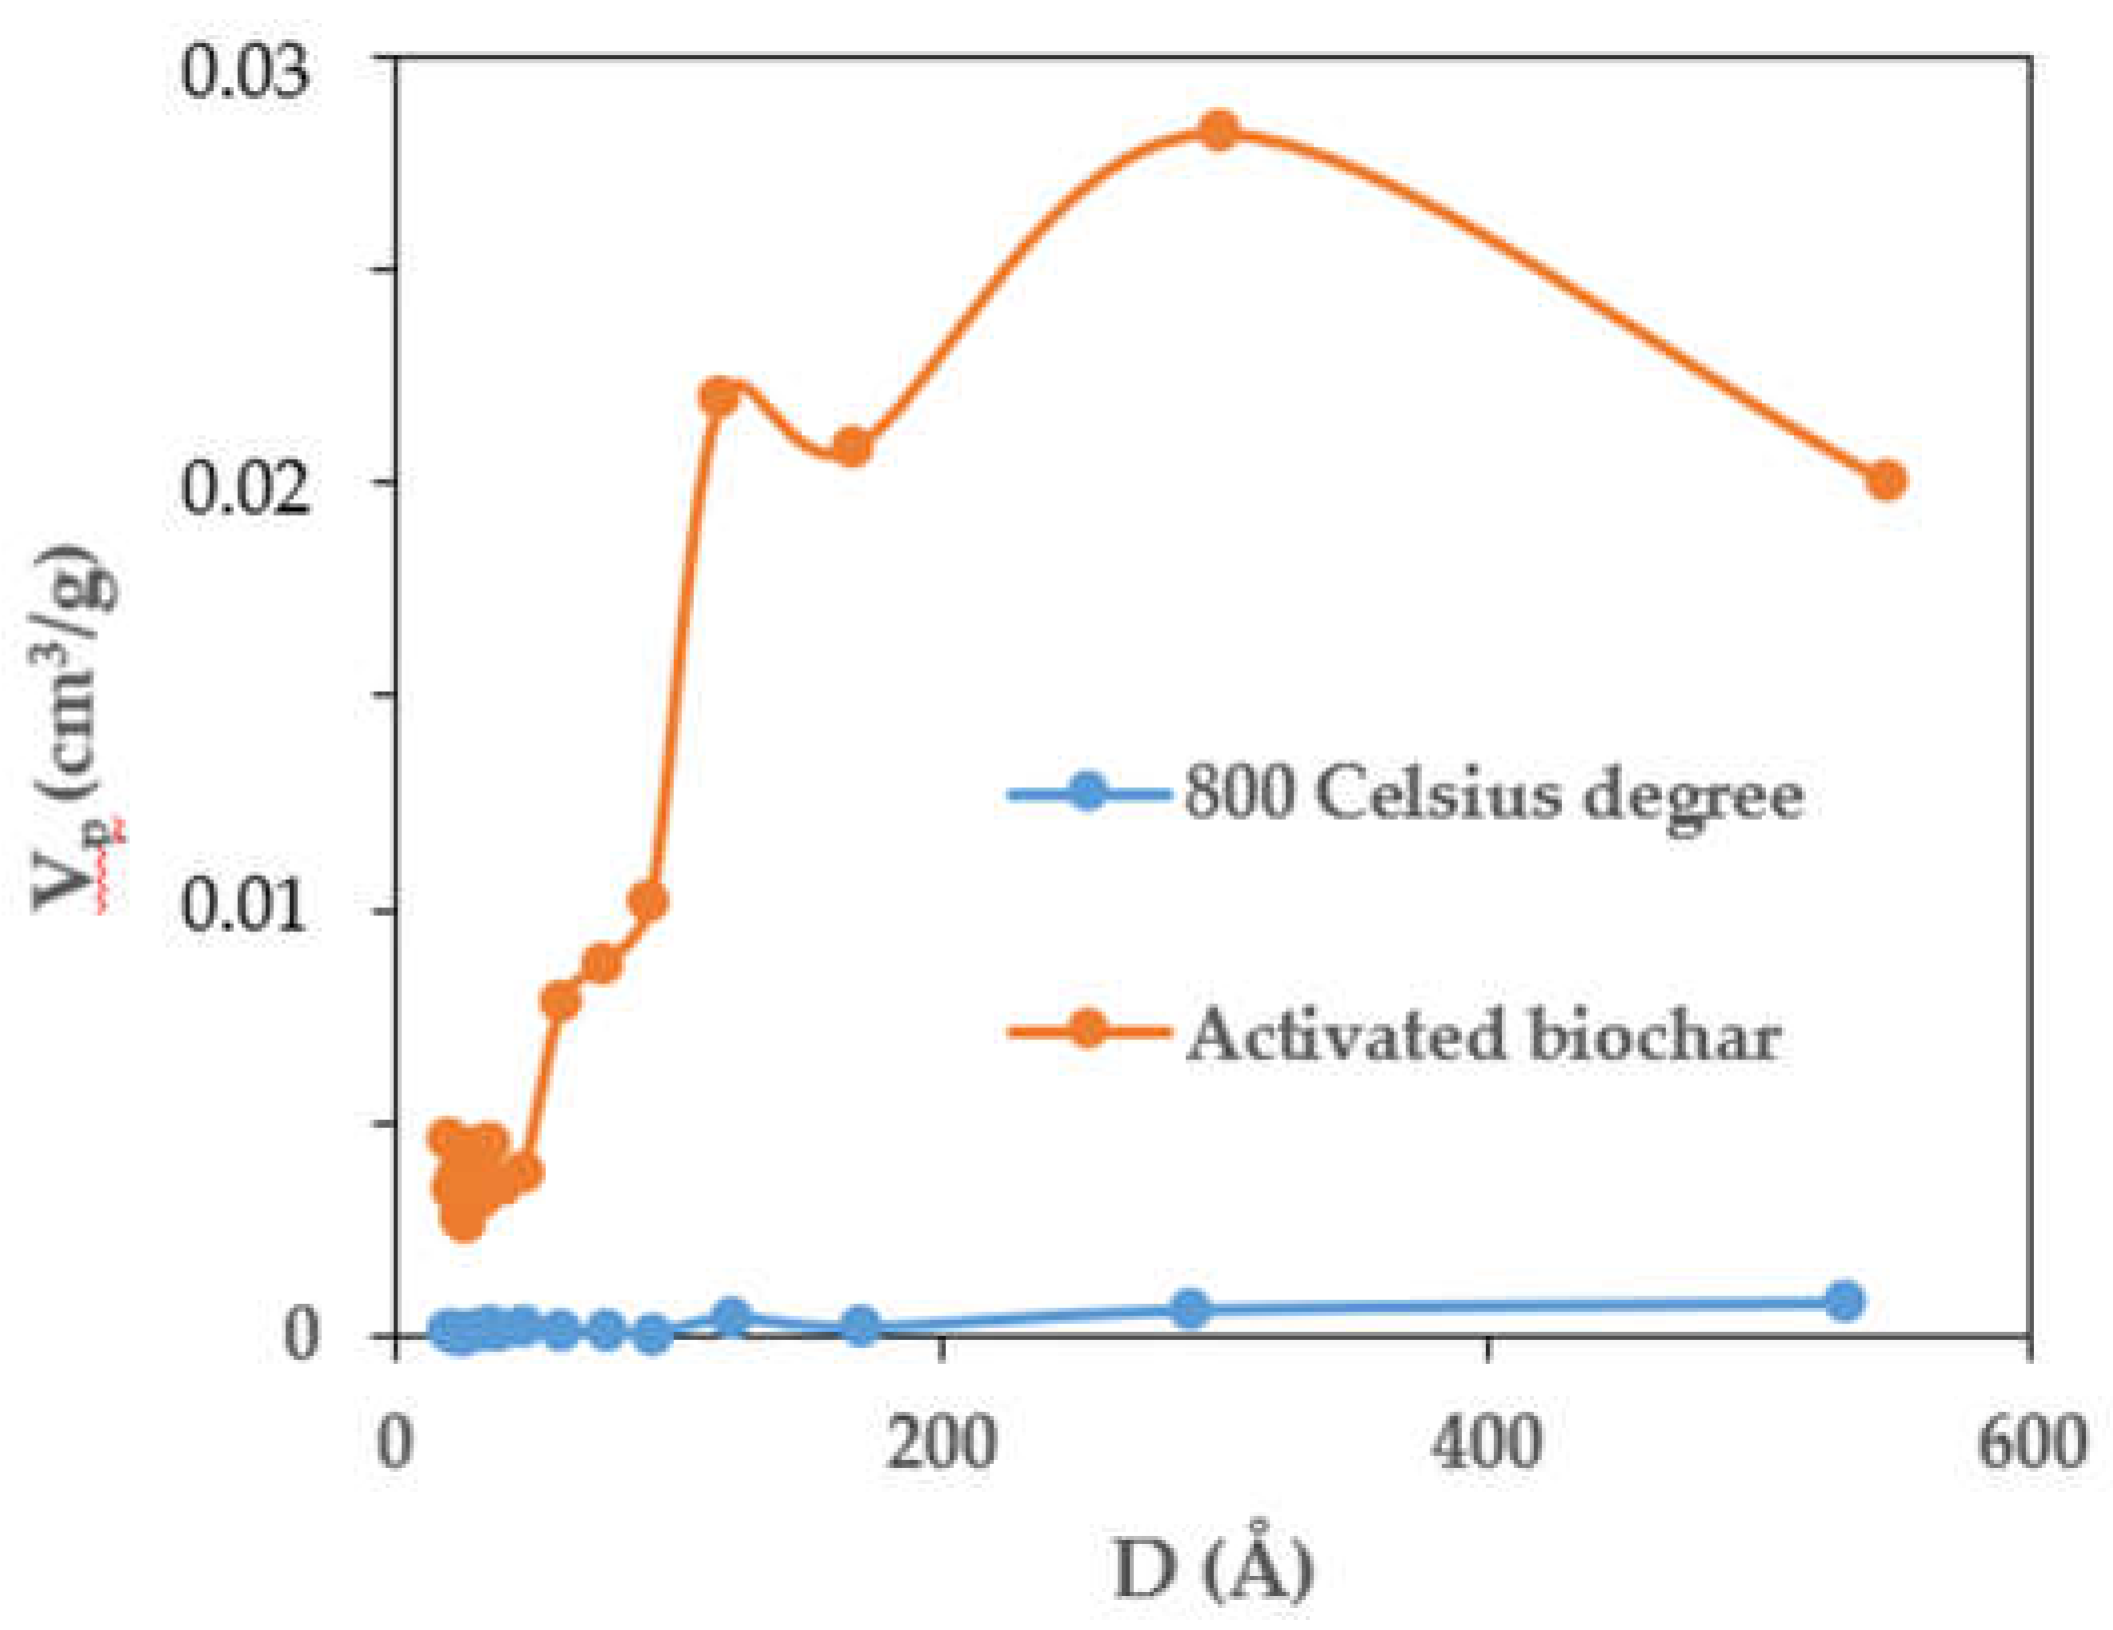
The modification of the activated biochar by the iron oxides also changed the pore size distribution (PSD) as reported in Figure 8. The are various PSD curves, but the curve of Vp and average pore diameter (D) relation was chosen due to closer to the reality. The PSD curves were made based on columns of average Vp and D in the POD table. Figure 8 shows that the activated biochar has not only much higher but also has clearer pattern of PSD curve than the composite. The maximum D (at X axis) is at more than 500 Å which indicates presence of the macropores. The curve pattern shows higher curve for mesoporous area (20–500 Å) than the others and 2 peaks at about 150 and 300 Å which indicate mesopore dominations over the others. However, the modification reduced it much lower which signed occupation of the iron oxides in the mesopores. It is match with the change of mesoporous volume in Table 5.

3.4. Adsorption

Adsorption test has been conducted by paracetamol as adsorbate model of organic pollutant. As a model, the paracetamol has polar functional groups (-OH and N-H) andlow polar (-CH3) also Lewis bases of N(at N-H) and O (at -OH and C-O). It makes interesting study of the adsorbate and adsorbent chemical interaction.
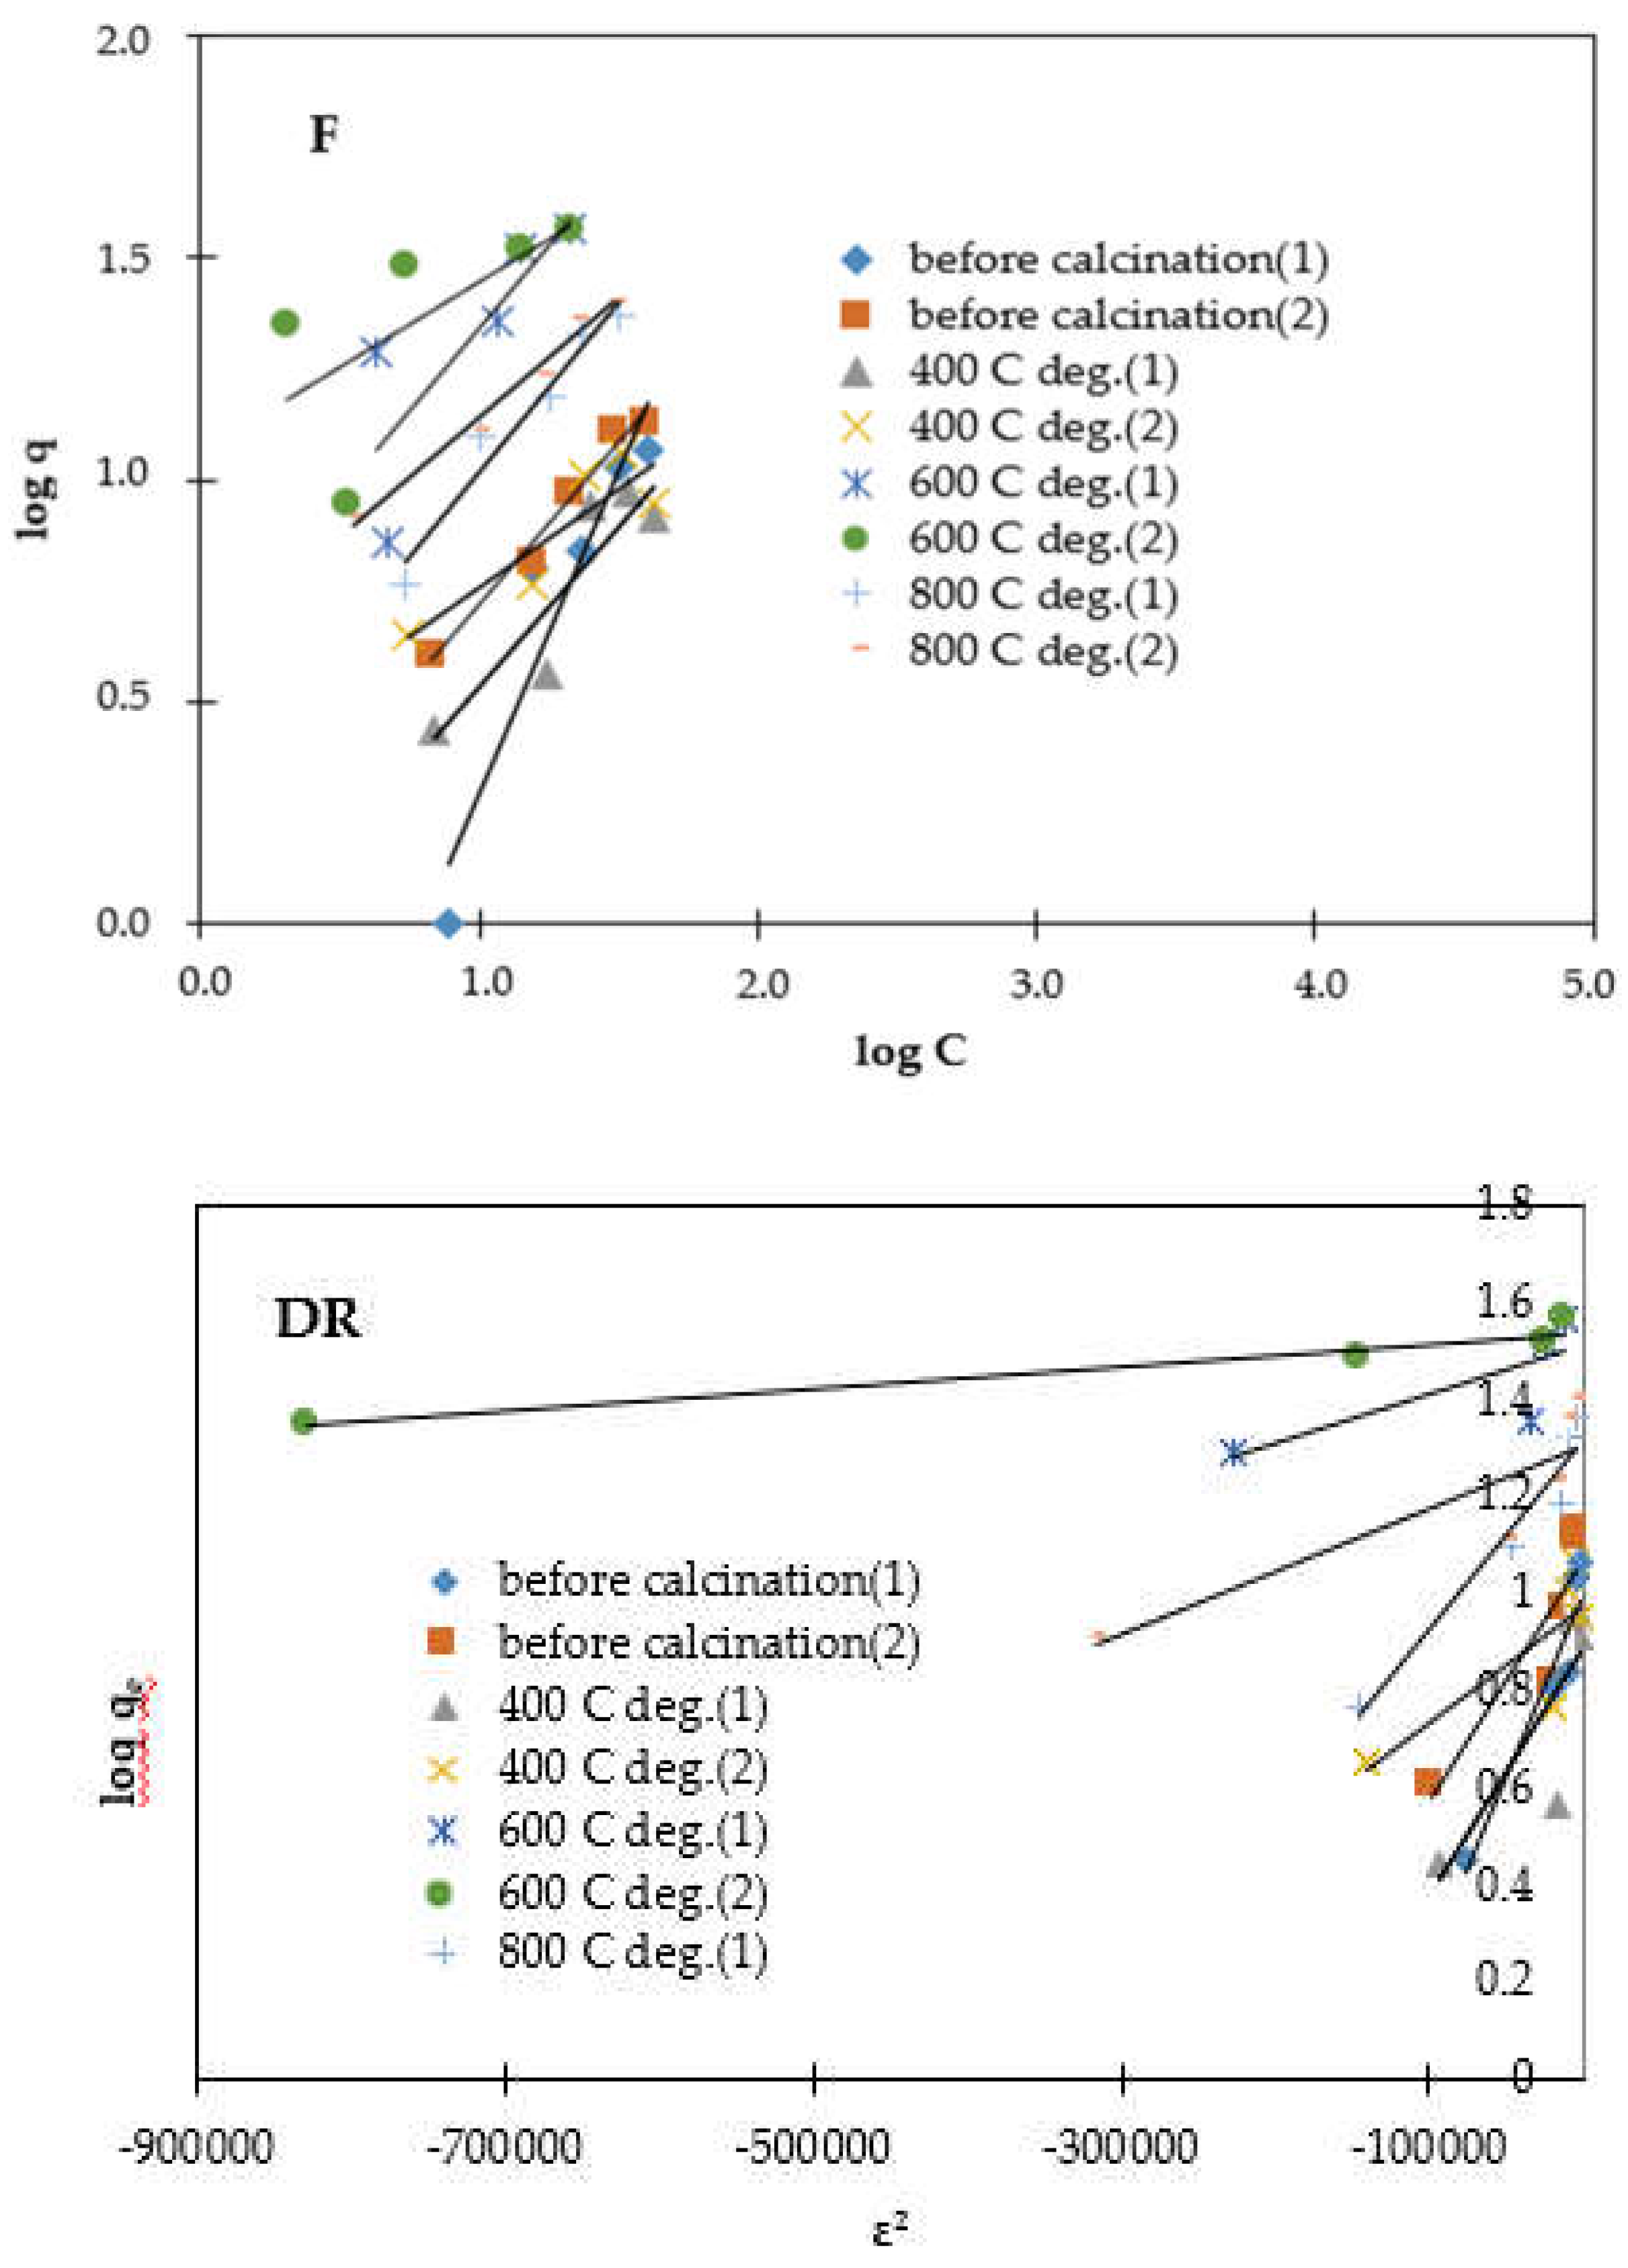
Three kinds of models (Freundlich, Langmuir, and Dubinin–Radushkevic) were used to treat adsorption data. The Langmuir model is based on an assumption that the adsorption occurs on a homogenous surface. Moreover, the Freundlich model employed assumption of heterogenous surface [65]. Dubinin–Radushkevic model describes the adsorption mechanism onto a heterogeneous surface by a Gaussian energy distribution [66]. The adsorption isotherms are reported in Figure 9. Parameters of adsorption which were calculated based on the isotherms are listed in Table 6
RL, i.e Langmuir separation factor can be used to predict efficiency of adsorption and affinity of adsorbent–adsorbate, i.e RL > 1 (unfavorable adsorption), RL=1 (linier adsorption), 0 < RL < 1 (favorable adsorption), RL = 0 (irreversible adsorption) [65]. The RL values in Table 6 are in the range of 0 < RL < 1, so that it indicated the favourable adsorptions.
A Freundlich constant, n, is an indicator of adsorption intensity [67]. Value of n between 1 and 10 describes favourable adsorption [55]. The n constant is also an indicator of surface heterogeneity. Higher n value indicates more heterogeneity of the adsorbent [68]. Data of n in Table 6 are in the range between 1 and 10. It indicated favorable adsorption. All calcined composites had lower n values, means lower surface heterogeneities. These conditions were supported by damage of the biochar surface and improvement of the iron oxide structure formations based on X-ray diffractograms (Figure 1). Those favorable adsorptions can be explained by 2 different things. Performances of the composites before calcination and after calcination at 400oC are probably caused by oxy functional groups of the activated biochar surface and Lewis acid of Fe(III) from FeCl3. In other hand, performances of the composites after calcination at 600 and 800oC may be caused by the Lewis acids such as Fe(III) and Fe(II) also Lewis base such as O atoms in the iron oxides.
Data in Table 6 showed that the correlation coefficient (R2) of both Freundlich and Langmuir isotherms decreased by calcination at 400oC, but increased again at higher temperatures. Correlation coefficient is an indicator how fit a model for describing adsorption isotherm. Decreasing of the correlation coefficient of both Freundlich and Langmuir models may be caused by decreasing of the activated biochar porosity due to the decomposition of biochar structure by calcination as supported by reduction of X-ray diffractogram wide peak of the biochar in Figure 1. However, increasing of the correlation coefficients from 400 to 800 oC may be related to increasing of the iron oxide crystalinity, supported by increasing of their peak intensities. So that, for Langmuir model, more homogeneous surface condition was achieved by increasing of iron oxide formation and more damage of the biochar. In this case, the different iron oxides (hematite, maghemite, magnetite) relatively did not affect homogeneity of the adsorbent surface based on Langmuir model.
In other side, the suitable heterogenous surface for Freundlich model was still achieved by formation of various iron oxides. It means that different crystal structures affect heterogeneity of the surface based on the Freundlich model. Although based on the n values heterogeneity of the surface decreased due to damage of the biochar surface, but this condition was still available for Freundlich model with different reason, i.e various iron oxide structures. So that, what the interesting things are that the same tendency for the correlation coefficients of both Langmuir and Freundlich models can be explained in different reasons.
DR isotherm showed different tendency. The correlation coefficient was relatively constant by increasing of calcination temperature to 600oC. It is probably because the composites in these conditions tended to have heterogenous surfaces, consisting of biochar – FeCl3 and biochar FexOy. However, the correlation coefficient is decreased by calcination at 800 oC. It is probably affected by decreasing of the composite heterogeneity due to increasing of iron oxide crystalinity and more damage of biochar structure.
Physical/chemical adsorption process can be predicted from adsorption energy (E) which is calculated using KD (Dubinin Radushkevich’s contant). Adsorption energy between 8 and 16 KJ/mol showed chemical adsorption, otherwise less than 8 Kj/mol indicated physical adsorption [67]. All data of energy in Table 6 are less than 8 KJ/mol, indicated that adsorption by composites before and after calcination is physical adsorption. However, the calcination made improvement of energy, so it indicates the improvement of adsorption strength by increasing of calcination temperatures. This tendency may be related to formation of the iron oxides which improved interaction strength of adsorbate and adsorbent.
Constant of qm is a maximum monolayer coverage which is calculated using Langmuir model. In other side, qs is a theoretical isotherm saturation capacity which is calculated using Dubinin–Radushkevich model [69]. Both parameters are used to determine adsorption performance of the composites. Data of qm and qs in Table 6 showed that based on Langmuir model, the highest capacity was achieved by calcination at 800 oC, whereas based on Dubinin–Radushkevic the highest capacity was obtained by calcination at 600 oC. Both capacities are higher than capacity obtained by composite before calcinations. The X–ray diffractogram patterns in Figure 1 showed that both calcined composites contain α-Fe2O3 impregnate structure. Based on data of porosity in Table 1, calcination caused lower porosity. Based on FTIR spectra in Figure 3, both calcinations reduce acid functional groups of biochar and improve formation of Fe–O bonding. Therefore, the increasing of capacity by calcination at 600 and 800 oC may be due to formation of α-Fe2O3 impregnate. Oxygen in α-Fe2O3 has ability to make H bond with polar functional groups of paracetamol which strengthen interaction of adsorbate–adsorbent. Therefore, α-Fe2O3 impregnate is more beneficial in the adsorption of paracetamol than FeCl3.
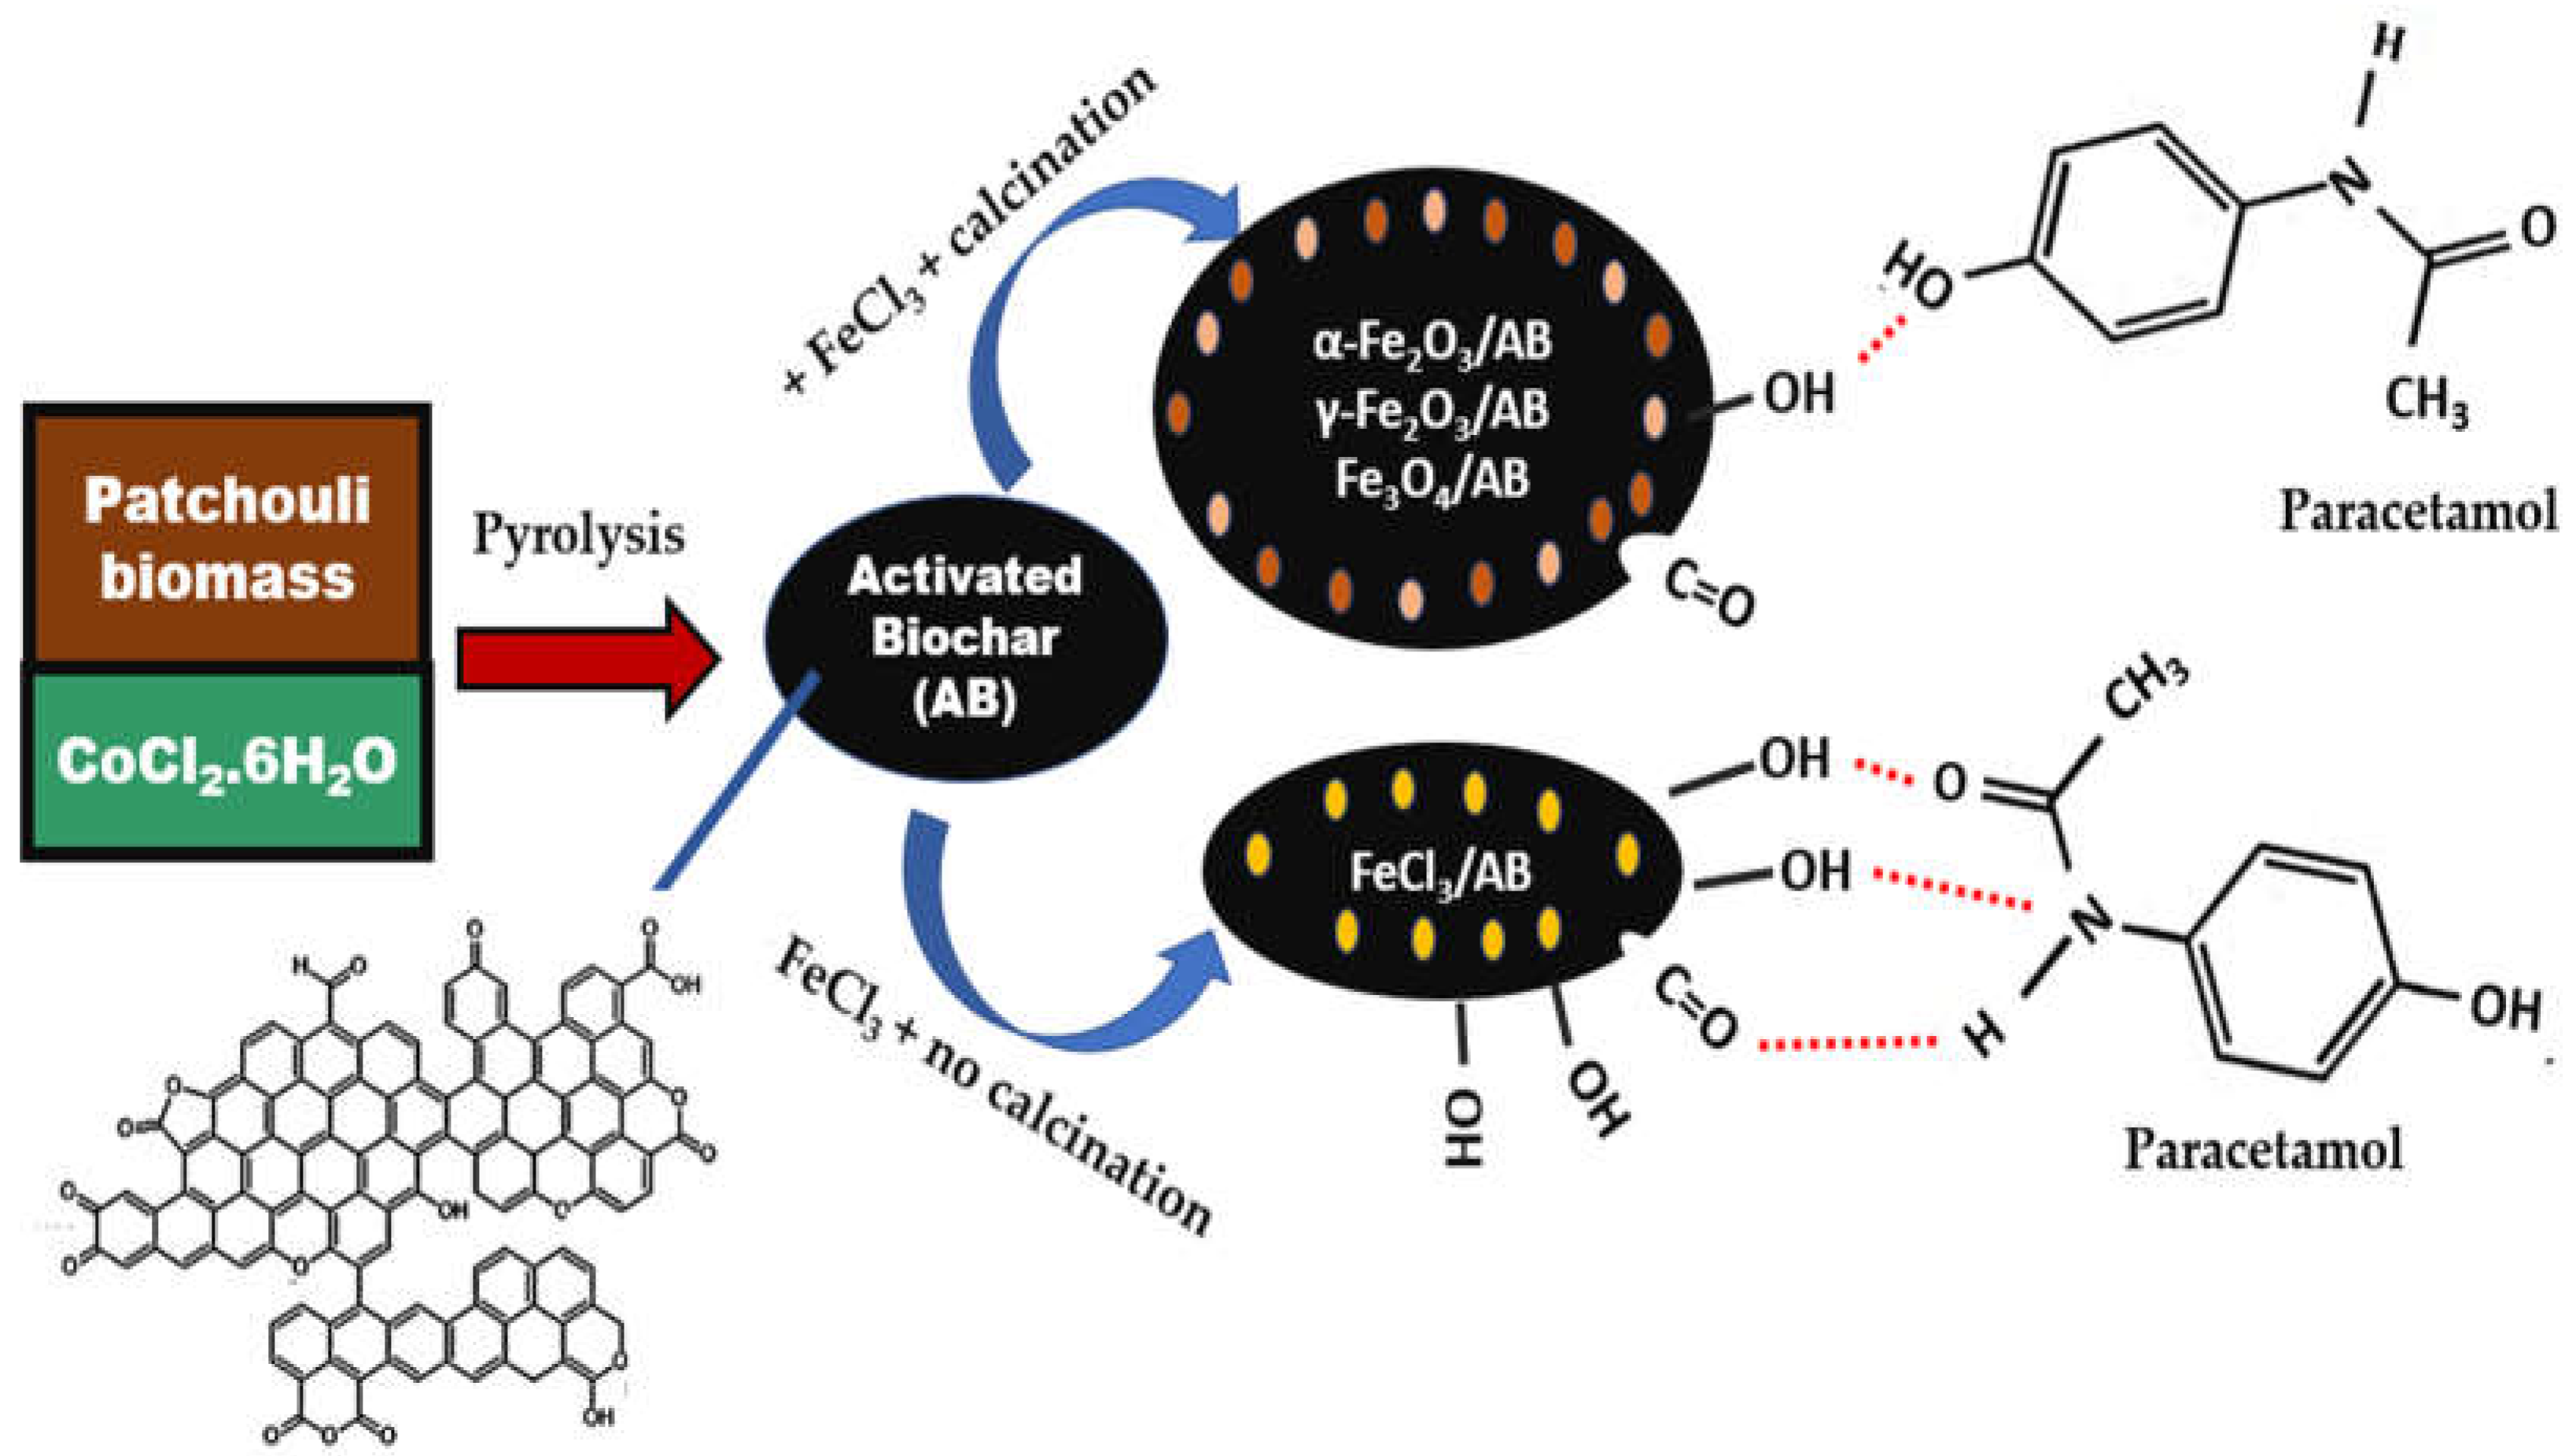
Based on functional group characterization and molecular attraction force of both the activated biochar surface and hematite, maghemite, and magnetite with paracetamol molecules, the graphical abstract can be designed in Figure 9 by including the chemical structure of biochar [7].
Figure 9. Transformation of patchouli biomass to the activated biochar (AB) by pyrolysis and chemical interaction of biochar and hematite with paracetamol molecules.
Preprints 115017 g010

5. Conclusions

This section is not mandatory but can be added to the manuscript if the discussion is unusually long or complex. Composite of FeCl3/AB has been synthesized at various calcination temperatures to form (α-Fe2O3, γ-Fe2O3, Fe3O4)/AB composite. Some conclusions can be obtained as follows: Pore characterization indicated the reduction of pore volume and surface area of biochar by impregnation and calcinations. X-ray diffraction characterization showed the formation of Fe2O3/AB at 600 and 800 oC. FTIR spectrophotometry characterization assigned the significant change of spectra at 600 oC by indicating the surface functional groups of C=O, C-O, OH, and Fe-O. Adsorption test of paracetamol gave the highest capacity at 800 oC (using Langmuir model) by resulting adsorption capacity of 56.37mg/g (R2 = 0.964) The highest adsorption energy was achieved at 800 oC, i.e 0.530 KJ/mol (physical adsorption) with RL value of 0.861 (favorable adsorption), and n value of 1.58 (favorable adsorption).

Availability Statement

The data supporting this study’s findings are included within the article (Tables and Figures) and available from the corresponding author upon reasonable request.

Author Contributions

Conceptualization, TS; methodology, TS; validation, TS.; formal analysis, TS; investigation, TS; writing—original draft preparation, TS; writing—review and editing, TS.; project administration, TS. All authors have agreed to the published version of the manuscript. All responsibilities of this publications are belong to TS as the head of PUPT 2015 and 2016 research projects.

Funding

All data in this paper are provided by our research project funded by PUPT 2015 and 2016.

Acknowledgement

The authors thank to Department of Chemistry, Brawijaya University for providing laboratory facilities to support research project.

Conflicts of Interest

The authors declare no conflict of interest.

References

  1. Ukoba, K.; Jen, T.C. Biochar and Application of Machine Learning: A Review; Intechopen, UK, 2022; pp. 1-20. [CrossRef]
  2. Ernsting, A. Biochar – A Climate Smart Solution? Climate Change and Agriculture. Report 2011, 1, 1-20. http://www.cidse.org/publications/just-food/food-and-climate/download/92_e8375ee2b26c274a112f516b61278168.html.
  3. Agarwal, M.; Tardio, J.; Mohan, S.V. Pyrolysis Biochar from Cellulosic Municipal Solid Waste as Adsorbent for Azo Dye Removal: Equilibrium Isotherms and Kinetics Analysis. International Journal of Environmental Science and Development 2015, 6(1), 67–72. [Google Scholar] [CrossRef]
  4. Xiao., J.; Bi., E.; Du., B.; Zhao., X.; Xing, C. Xiao. J.; Bi. E.; Du. B.; Zhao. X.; Xing, C. Surface Characterization of Maize-Straw-derived Biochar and Their Sorption Performance for MTBE and Benzene. Environmental Earth Sciences, 2014; 71, 5195–5205. [Google Scholar] [CrossRef]
  5. Krismawati, A. Nilam dan Potens Pengembangannya: Kalteng Jadikan Komoditas Rintisan. Tabloid Sinar Tani 2005, 26 http://www.litbang.pertanian.go.id/artikel/one/91/pdf/Nilam%20dan%20Potensi%20Pengembangannya.pdf.
  6. Setianingsih, T.; Masruri; Ismuyanto, B. (UB, Malang, Jawa Timur, Indonesia). Laporan Akhir PUPT 2015: Pembuatan Komposit Biochar-Metal Berbasis Limbah Tanaman Nilam Untuk Meminimasi Kontaminan Air Dalam Menunjang Ketersediaan Air Berkelanjutam, 2015. https://www.google.co.id/books/edition/Sintesis_Fasa_Padat_Komposit_Nano_Kaolin/euPpEAAAQBAJ?hl=en&gbpv=1&dq=tutik+setianingsih+darjito&pg=PP1&printsec=frontcover.
  7. Conte, P.; Bertani, R.; Sgarbossa, P.; Bambina, P.; Schmidt, H.-P.; Raga, R.; Lo Papa, G.; Chillura Martino, D.F.; Lo Meo, P. Recent Developments in Understanding Biochar’s Physical–Chemistry. Agronomy 2021, 11(615), 1–42. [Google Scholar] [CrossRef]
  8. Setyawan, H. Y; Sunyoto,N.M.S.; Sugiarto, Y.; Dewanti, B.S.D.; Widayanti, V.T.; Hakim, L.; Kurniawan, S.; Nugroho, G.A.; Ulandari, D.; Choirun, A.; Hanindipto,F.A.; Sundari,S.A.; Pamungkas, I.A.; Pratama,A.P.A, Wan, Z. Characterisation of biochar from various carbon sources, BIO Web of Conferences 90, 06003 (2024), ICGAB 2023, Malang, Indonesia, 24 of 23. 20 October. [CrossRef]
  9. Yaashikaaa,P.R., Kumara, P.S.; Varjanic, S.; Saravanan, A. Review A critical review on the biochar production techniques, characterization, stability and applications for circular bioeconomy. Biotechnology Reports, 2020; 28, 1–15. [CrossRef]
  10. Fenta, A.A. State of the art of biochar in Ethiopia. A review, Heliyon 2024, 10, 1–9. [Google Scholar] [CrossRef]
  11. Elangovan, R.; Rangasami, S.R.S.; Murugaragavan, R.; Sekaran, N.C. Characteristics of biochar: A review, The Pharma Innovation Journal 2022; 11(12), 243-246. https://www.thepharmajournal.com/archives/2022/vol11issue12/PartC/11-10-244-971.
  12. Nkoh, J.N.; Baquy, M.A.-A.; Mia, S.; Shi, R.; Kamran, M.A.; Mehmood, K.; Xu, R. A Critical-Systematic Review of the Interactions of Biochar with Soils and the Observable Outcomes. Sustainability 2021, 13, 1–22. [Google Scholar] [CrossRef]
  13. Gul, S.; Whalen, J.K.; Thomas, B.W.; Sachdeva, V.; Deng, H. Review Physico-chemical Properties and Microbial Responses in Biochar-amended Soils: Mechanisms and Future Directions Agriculture. Ecosystems and Environment. 2015, 206, 46–59. [Google Scholar] [CrossRef]
  14. Saha, P.; Bera, A,; Barman, A. A Review on Biochar and Its Application in Agriculture. Chem Sci Rev Lett 2022, 11, 184–188. [Google Scholar] [CrossRef]
  15. Paz-ferreiro, J.; Lu, H.; Fu, S.; Méndez, A.; and Gascó, G. Use of Phytoremediation and Biochar to Remediate Heavy Metal Polluted Soils: A Review. Solid Earth. 2014, 5, 65–75. [Google Scholar] [CrossRef]
  16. Domingues, M.T.; Buenoa, C.C.; Watanabea, C.H.; Fracetoa, L.F.; Loyola-liceac, J.C.; Crowleyb, D.; Rosaa, A.H. Polymeric Alginate Microspheres Containing Biochar to Immobilize Phosphate Ions. Chemical EngineeringTransactions. 2014, 37, 109–111. [Google Scholar]
  17. Ajema, L. Effects of Biochar Application on Beneficial Soil Organism Review. International Journal of Research Studies in Science, Engineering and Technology 2018, 5, pp.9–18. [Google Scholar]
  18. Saputra, E.; Putu, S.; Susilowati, L.E.; Dewi, R.A.S. Populasi bakteri dan respirasi mikroba tanah pada rhizosfer tanaman jagung ( Zea mays L.) yang diberi pupuk terpadu dan biochar sekam padi pada masa vegetatif maksimum. Agroteksos, 2023; 33, 680–689. [Google Scholar] [CrossRef]
  19. Kandel, A. , Dahal, S. , & Mahatara, S. A review on biochar as a potential soil fertility enhancer to agriculture. Archives of Agriculture and Environmental Science 2021, 6, 108–113. [Google Scholar] [CrossRef]
  20. Saleh, M.E.; El-refaey, A.E.; and Mahmoud, A.H. Effectiveness of Sunflower Seed Husk Biochar for Removing Copper Ions from Wastewater: A Comparative Study. Soil & Water Research 2016, 11, 53–63. [Google Scholar] [CrossRef]
  21. Song, Z.; Lian, F.; Yu, Z.; Zhu, L.; Xing, B.; Qiu, W. Synthesis and Characterization of A Novel MnOx-loaded Biochar and Its Adsorption Properties for Cu2+ in Aqueous Solution. Chemical Engineering Journal 2014, 242, 36–42. [Google Scholar] [CrossRef]
  22. Yu, X.; Qin, A.; Liao, L. ; Du,R.; Tian,N.; Huang,S.; and Chunwe. Removal of Organic Dyes by Anostructure ZnO-Bamboo Charcoal Composites with Photocatalysis Function. Advances in Materials Science and Engineering, 2015; 1–6. [Google Scholar] [CrossRef]
  23. Tan, X.; Liu, Y.; Gu, Y.; Xu, Y.; Zeng, G.; Hu, X.; Liu, S.; Wang, X.; Liu, S.; Li, J. Biochar-based nano - composites for the decontamination of waste. water: A review, Bioresource Technology 2016, 212, 318–333. [Google Scholar]
  24. Moosavi, E.; Dastgheib, S.; and Karimzadeh, R. Adsorption of Thiophenic Compounds from Model Diesel Fuel Using Copper and Nickel Impregnated Activated Carbons. Energies 2012, 5, 4233–4250. [Google Scholar] [CrossRef]
  25. Zhu, J.; Wei, S.; Chen, M.; Gu, H.; Rapole, B.S.; Pallavkar, S.; Ho, T.C.; Hopper, J.; Guo, G. Magnetic Nanocomposites for Environmental Remediation. Advanced Powder Technology 2013, 24, 459–467. [Google Scholar] [CrossRef]
  26. Ahuja, Kalia, R. A.; Sikka, A.R.; Chaitra, P. Nano Modifications of Biochar to Enhance Heavy Metal Adsorption from Wastewaters: A Review, ACS Omega 2022, 7, 45825–45836. [CrossRef]
  27. Wang, M.C.; Sheng, G.D.; Qiu, Y.P.A. Novel Manganese-oxide/Biochar Composite for Efficient Removal of Lead(II) from Aqueous Solutions. International Journal of Environmental Science Technology 2015, 12, 1719–1726. [Google Scholar] [CrossRef]
  28. Venkatesh, R.; Sekaran, P.R. ; Udayakumar,K.; Jagadeesh, D.; Raju, K.; Bay, M.B. Adsorption and Photocatalytic Degradation Properties of Bimetallic Ag/MgO/Biochar Nanocomposites, Hindawi Adsorption Science & Technology 2022, 2022, 1-14. [CrossRef]
  29. Han, Z.; Sani, B.; Mrozik, W.; Obst, M.; Beckingham, B.; Karapanagioti, H.K. , Werner D. Magnetite Impregnation Effects on the Sorbent Properties of Activated Carbons and Biochars. Water Research 2015, 70(1), 394–403. [Google Scholar] [CrossRef] [PubMed]
  30. Weidner, E.; Karbassiyazdi, E.; Altaee, A.; Jesionowski, T. Ciesielczyk, F. Hybrid Metal Oxide/Biochar Materials for Wastewater Treatment Technology: A Review. ACS Omega 2022, 7, 27062–27078. [Google Scholar] [CrossRef]
  31. Liang, H.; Zhu, C.; Wang, A.; Chen, F. Facile preparation of NiFe2O4/biochar composite adsorbent for efcient adsorption removal of antibiotics in water, Carbon Research 2024, 3(2), 1-13. [CrossRef]
  32. Wang, L.; Ok, Y.S. ; Tsang, DCW; Alessi, D. S.; Rinklebe, J.; Mašek, O.; Bolan, N.S.; Hou, D. Biochar composites: Emerging trends, field successes, and sustainability implications, Soil Use and Management 2022, 38, 14–38. [Google Scholar] [CrossRef]
  33. Halász, L.; Vincze, A.; Solymosi, J. Use of The Microwave Impregnation of Active Carbon. Arms Technology 2008, 7, 533–550. [Google Scholar]
  34. Fang, C.; Zhang, T.; Jiang, L. R.; and Wang, Y. Application of Magnesium Modified Corn Biochar for Phosphorus Removal and Recovery from Swine Wastewate. International Journal of Environmental Research and Public Health 2014, 11, 9217–9237. [Google Scholar] [CrossRef]
  35. Sahoo, N.G.; Rana, S.; Cho, J.W.; Li, L.; Chan, S.H. Polymer Nanocomposites Based on unctionalized Carbon Nanotubes, Progress in Polymer Science 2010, 35, 837-867. https://www.researchgate.net/publication /221950822_PolymerNanocomposites_ Based_on_Functionalized_Carbon_Nanotubes.
  36. Ilomuanya, M.; Ohere, A.F.; Zubair, S.A.; and Ukoma, U.U. Evaluation of adsorption capacity of acetaminophen on activated charcoal dosage forms available in Nigeria by in vitro adsorption studies and scanning electron microscopy. Tropical Journal of Pharmaceutical Research 2017, 16, 1105–1112. [Google Scholar] [CrossRef]
  37. Mohd, N.; Sudirman, M.F.A.E.; and Draman, S.F.S. Isotherm and Thermodynamic Study of Paracetamol Removal in Aqueous Solution by Activated Carbon. Journal of Engineering and Applied Sciences 2015, 10(20), 1819-6608. https://www.arpnjournals.org/jeas/research_papers/rp_2015/jeas_1115_2903.pdf.
  38. Ferreira, R.C.; Junior, O.M.C.; Carvalho, K.Q.; Arroyo, P.A.; and Barrosa, M.A.S.D. Effect of Solution pH on the Removal of Paracetamol by Activated Carbon of Dende Coconut Mesocarp, Chem. Biochem. Eng. Q. 2015, 29, 47–53. [Google Scholar] [CrossRef]
  39. Ferreira, R.C.; De Lima, H.H.C.; Cândido, A.A.; Junior, O.M.C.; Arroyo, P.A.; De Carvalho, K.Q.; Gauze, G.F.; Barros, M.A.S.D. Adsorption of Paracetamol Using Activated Carbon of Dende and Babassu Coconut Mesocarp. World Academy of Science, Engineering and Technology International Journal of Biotechnology and Bioengineering 2015, 9, 717–722. [Google Scholar]
  40. Jedynak, K.; Charmas, B. Adsorption properties of biochars obtained by KOH activation. Adsorption 2024, 30, 167–183. [Google Scholar] [CrossRef]
  41. Zhou, Y.; Cai, L.; Guo, J.; Wang, Y.; Ji, l.; Song, W. Preparation of Bi2MoO6/kelp biochar nanocomposite for enhancing degradability of methylene blue. Applied Ecology and Environmental Research 2018, 16(5), 5837–5847. [Google Scholar] [CrossRef]
  42. Fan, L.; Wang, X.; Miao,J.; Liu,Q.; Cai, J.; An,X.; Chen, F.; Cheng,L.; Chen, W.; Luo, H.; Zhang, X.; Zhang, K.; Ma, D. Na4P2O7-Modified Biochar Derived from Sewage Sludge: Effective Cu(II)-Adsorption Removal from Aqueous Solution. Adsorption Science & Technology 2023, Article ID 8217910, 1-15. [CrossRef]
  43. Khalil, M.M.; Afifi, A.A.; Mohamed, R.F. Synthesis, Characterization and Analytical Applications of Biochar Nanocomposites for Decontamination of Kohafawastewater Treatment Plants, Fayoum, Egypt. Plant Archives 2019, 19(2), 4559-4564. https://cabidigitallibrary.org by 203.78.117.254.
  44. Alwar, A.; Ahdiaty, R.; Doong, R. magnetic Fe3O4-CuO/biochar nanocomposite for adsorption of inorganic anions from aqueous solution. Rasayan J. Chem. 2022, 15(4), 2466–2476. [Google Scholar] [CrossRef]
  45. Wang, K.; Remón, J.; Jiang, Z.; Ding, W. Recent Advances in the Preparation and Application of Biochar Derived from Lignocellulosic Biomass: A Mini Review. Polymers 2024, 16, 851. [Google Scholar] [CrossRef]
  46. Díaz, B.; Sommer-Márquez, A.; Ordoñez, P.E.; Bastardo-González, E.; Ricaurte, M.; Navas-Cárdenas, C. Synthesis Methods, Properties, and Modifications of Biochar-Based Materials for Wastewater Treatment: A Review. Resources 2024, 13, 8. [Google Scholar] [CrossRef]
  47. Setianingsih, T. ; Masruri; Ismuyanto, B. Effect of Calcination Temperature on Structural Properties of Biochar-MCln Composite from Patchouli Biomass and Its Application for Drug Adsorption, International Journal of ChemTech Research 2016, 9, 610–621. [Google Scholar]
  48. Setianingsih, T., Masruri; Ismuyanto, B. Influence of Impregnation Ratio on physicochemistry of patchouli biochar using CoCl2 chemical activator for adsorption of drug pollutants, International Journal of Civil Engineering and Technology (IJCIET) 2017, 8(5), 709–716. https://iaeme.com/MasterAdmin/Journal_uploads/IJCIET/VOLUME_8_ISSUE_5/IJCIET_08_05_079.pdf.
  49. Setianingsih, T. ; Masruri; Ismuyanto, B. Study of Pyrolysis Temperature Influence on Physicochemistry of Patchouli Biochar and Patchouli pyrolysis Reaction Using CoCl2 Chemical Activator. J. Mater. Environ. Sci. 2021, 12, 787–797. [Google Scholar]
  50. Setianingsih, T. ; Masruri; Ismuyanto, B. Study of Chemical Activator in Preparation of Biochar Adsorbent from Patchouli Biomass for Removing Drug Contaminan. International Journal of ChemTech Research 2017, 10, 10–19. [Google Scholar]
  51. Setianingsih, T. ; Masruri; Ismuyanto, B. Synthesis of Patchouli Biochar Cr2O3 Composite Using Double Acid Oxidators for Paracetamol Adsorption. J. Pure App. Chem. Res. 2018, 7, 60–69. [Google Scholar] [CrossRef]
  52. Setianingsih, T. ; Masruri; Ismuyanto, B. Study of salt oxidator type influence on physichochemistry of patchouli biochar–Cr2O3 composite and organic contaminant adsorption. International Journal of Civil Engineering and Technology (IJCIET) 2021, 12, 17–28. [Google Scholar] [CrossRef]
  53. Setianingsih, T.; Masruri; Ismuyanto, B. Biochar dan Fungsionalisasi Biochar, UB Press, Malang, Indonesia, 2018; 93-111. https://books.google.co.id/books/about/Biochar_dan_Fungsionalisasi_Biochar.html?id=snLcDwAAQBAJ&redir_esc=y.
  54. Setianingsih, T. ; Masruri; Ismuyanto, B. (UB, Malang, Jawa Timur, Indonesia). Laporan Akhir PUPT 2016: Pembuatan Komposit Biochar-Metal Berbasis Limbah Tanaman Nilam Untuk Meminimasi Kontaminan Air Dalam Menunjang Ketersediaan Air Berkelanjutam, 2016. [Google Scholar]
  55. Li, D. , Tian, Y., Qiao, Y. Forming Active Carbon Monoliths from H3PO4 – loaded Sawdust with Addition of Peanut Shell Char. BioResources 2014, 9, 4981–4992. [Google Scholar]
  56. Manoj, K. and Kunjomana, A. G. Study of Stacking Structure of Amorphous Carbon by X-ray Diffraction Technique, International Journal of Electrochemical Science 2012, 7, 3127–3134. [Google Scholar]
  57. Setianingsih, T.; Darjito; Kamulyan, B. Sintesis Senyawa Anorganik dengan Metode Fasa Padat in Sintesis fasa Padat Komposit Nano Kaolin CNS Termodifikasi Fe(III) dan Zn(II) dengan Tanur Microwave; MNC Publishing: Malang, Indonesia, 2023; volume 1, pp. 20-22.
  58. Zhu, W.; Winterstein, J.; Maimon, I.; Yin, Q.; Yuan, L.; Kolmogorov, A.N.; Sharma, R.; Zhou, G. Atomic Structural Evolution during the Reduction of α-Fe2O3 Nanowires, J Phys Chem C Nanomater Interfaces 2016, 120(27), 14854–14862. [CrossRef]
  59. Setianingsih, T.; Kartini, K.; Arryanto, Y. Sintesis Karbon Mesopori Dari Fruktosa Dengan Menggunakan Aktivator Seng Borosilikat. Disertasi. Program Studi S3 Ilmu Kimia, FMIPA, UGM, Jogjakarta. https://etd.repository.ugm.ac.id/penelitian/detail/94598.
  60. Zhang, C. Porous biochar material for carbon capture and wastewater treatment. PhD Thesis, School of Chemistry and Chemical Engineering of Queen’s University Belfast, Belfast, United Kingdom. https://pureadmin.qub.ac.uk/ws/portalfiles/portal/491036656/PhD_Thesis_Chen_Zhang_Pure.pdf.
  61. Chayande. SP. and Yenkie, M.K.N. Chayande. SP. and Yenkie, M.K.N. Characterization of Activated Carbon Prepared From Almond Shells For Scavenging Phenolic Pollutants, Chemical Science Transaction 2013, 2(3): 835-840 http://www.e-journals.in/pdf/V2N3/835-840.
  62. Sahira, Mandira, A. Prasad, P.B. and Ram, P.R. Effects of Activating Agents on the Activated Carbons Prepared from Lapsi Seed Stone. Research Journal of Chemical and Environmental Sciences 2013, 3, 19–24. [Google Scholar]
  63. Lakshmi, P.K. Jayashree, M. Shakila, B.K., Gino, A.K. Green and Chemically Synthesized Copper Oxide Nanoparticles-A Preliminary Research Towards Its Toxic Behavior. International Journal of Pharmacy and Pharmaceutical Sciences 2015. 17(1), 156-150 http://innovareacademics.in/journals/index.php/ijpps/article/view/3868.
  64. Lowell, S.; Shields, J.E. Powder Surface Area and Porosity. 3nd ed. Chapman and Hall Ltd, New York, 1991 https://www.google.co.id/books/edition/Powder_Surface_Area_and_Porosity/mCz4CAAAQBAJ?hl=engbpv=1.
  65. Hamid, S.B.A. Chowdhury, Z.Z. and Zain, S.M. Base Catalytic Approach: A Promising Technique for the Activation of Biochar for Equilibrium Sorption Studies of Copper, Cu(II) Ions in Single Solute System. Materials 2014, 7: 2815-2832 https://www.mdpi.com/1996-1944/7/4/2815/pdf.
  66. Kyzioł-Komosińska, J. Rosik-Dulewska, C. Franus, M. Antoszczyszyn-Szpicka, P. Czupioł, J. Krzyżewska, I. Sorption Capacities of Natural and Synthetic Zeolites for Cu(II) Ions. Polish Journal of Environmental Studies 2015, 24, 1111–1123. [Google Scholar] [CrossRef]
  67. Mohammed, R.R. Decolorisation of Biologically Treated Palm Oil Mill Effluent (POME) Using Adsorption Technique, International Refereed Journal of Engineering and Science 2013, 2(2): 01-11 http://www.irjes.com/Papers/vol2-issue10/Version%20%201/A02100111.
  68. Ismadji, S., Tong, D.S., Edi, F., Soetaredjo, Ayucitra, A., Yu, W.H., Zhou, C.H. Bentonite-hydrochar Composite for Removal of Ammonium from Koi Fish Tank. Applied Clay Science 2015, 114, 467–475 http://ac.els-cdn.com/S0169131715300077/1-s2.0-S0169131715300077-main.pdf?_tid=ad641c86-9b31-11e6-820700000aacb361&acdnat=1477455014_c7b912891ee5da0008e5962 cc3c15c22.
  69. Olalekan, A.P. Dada A. O. Okewale A.O. Comparative Adsorption Isotherm Study of The Removal of Pb2+ and Zn2+ Onto Agricultural Waste. Research Journal of Chemical and Environmental Sciences 2013, 1, 22–27. [Google Scholar]
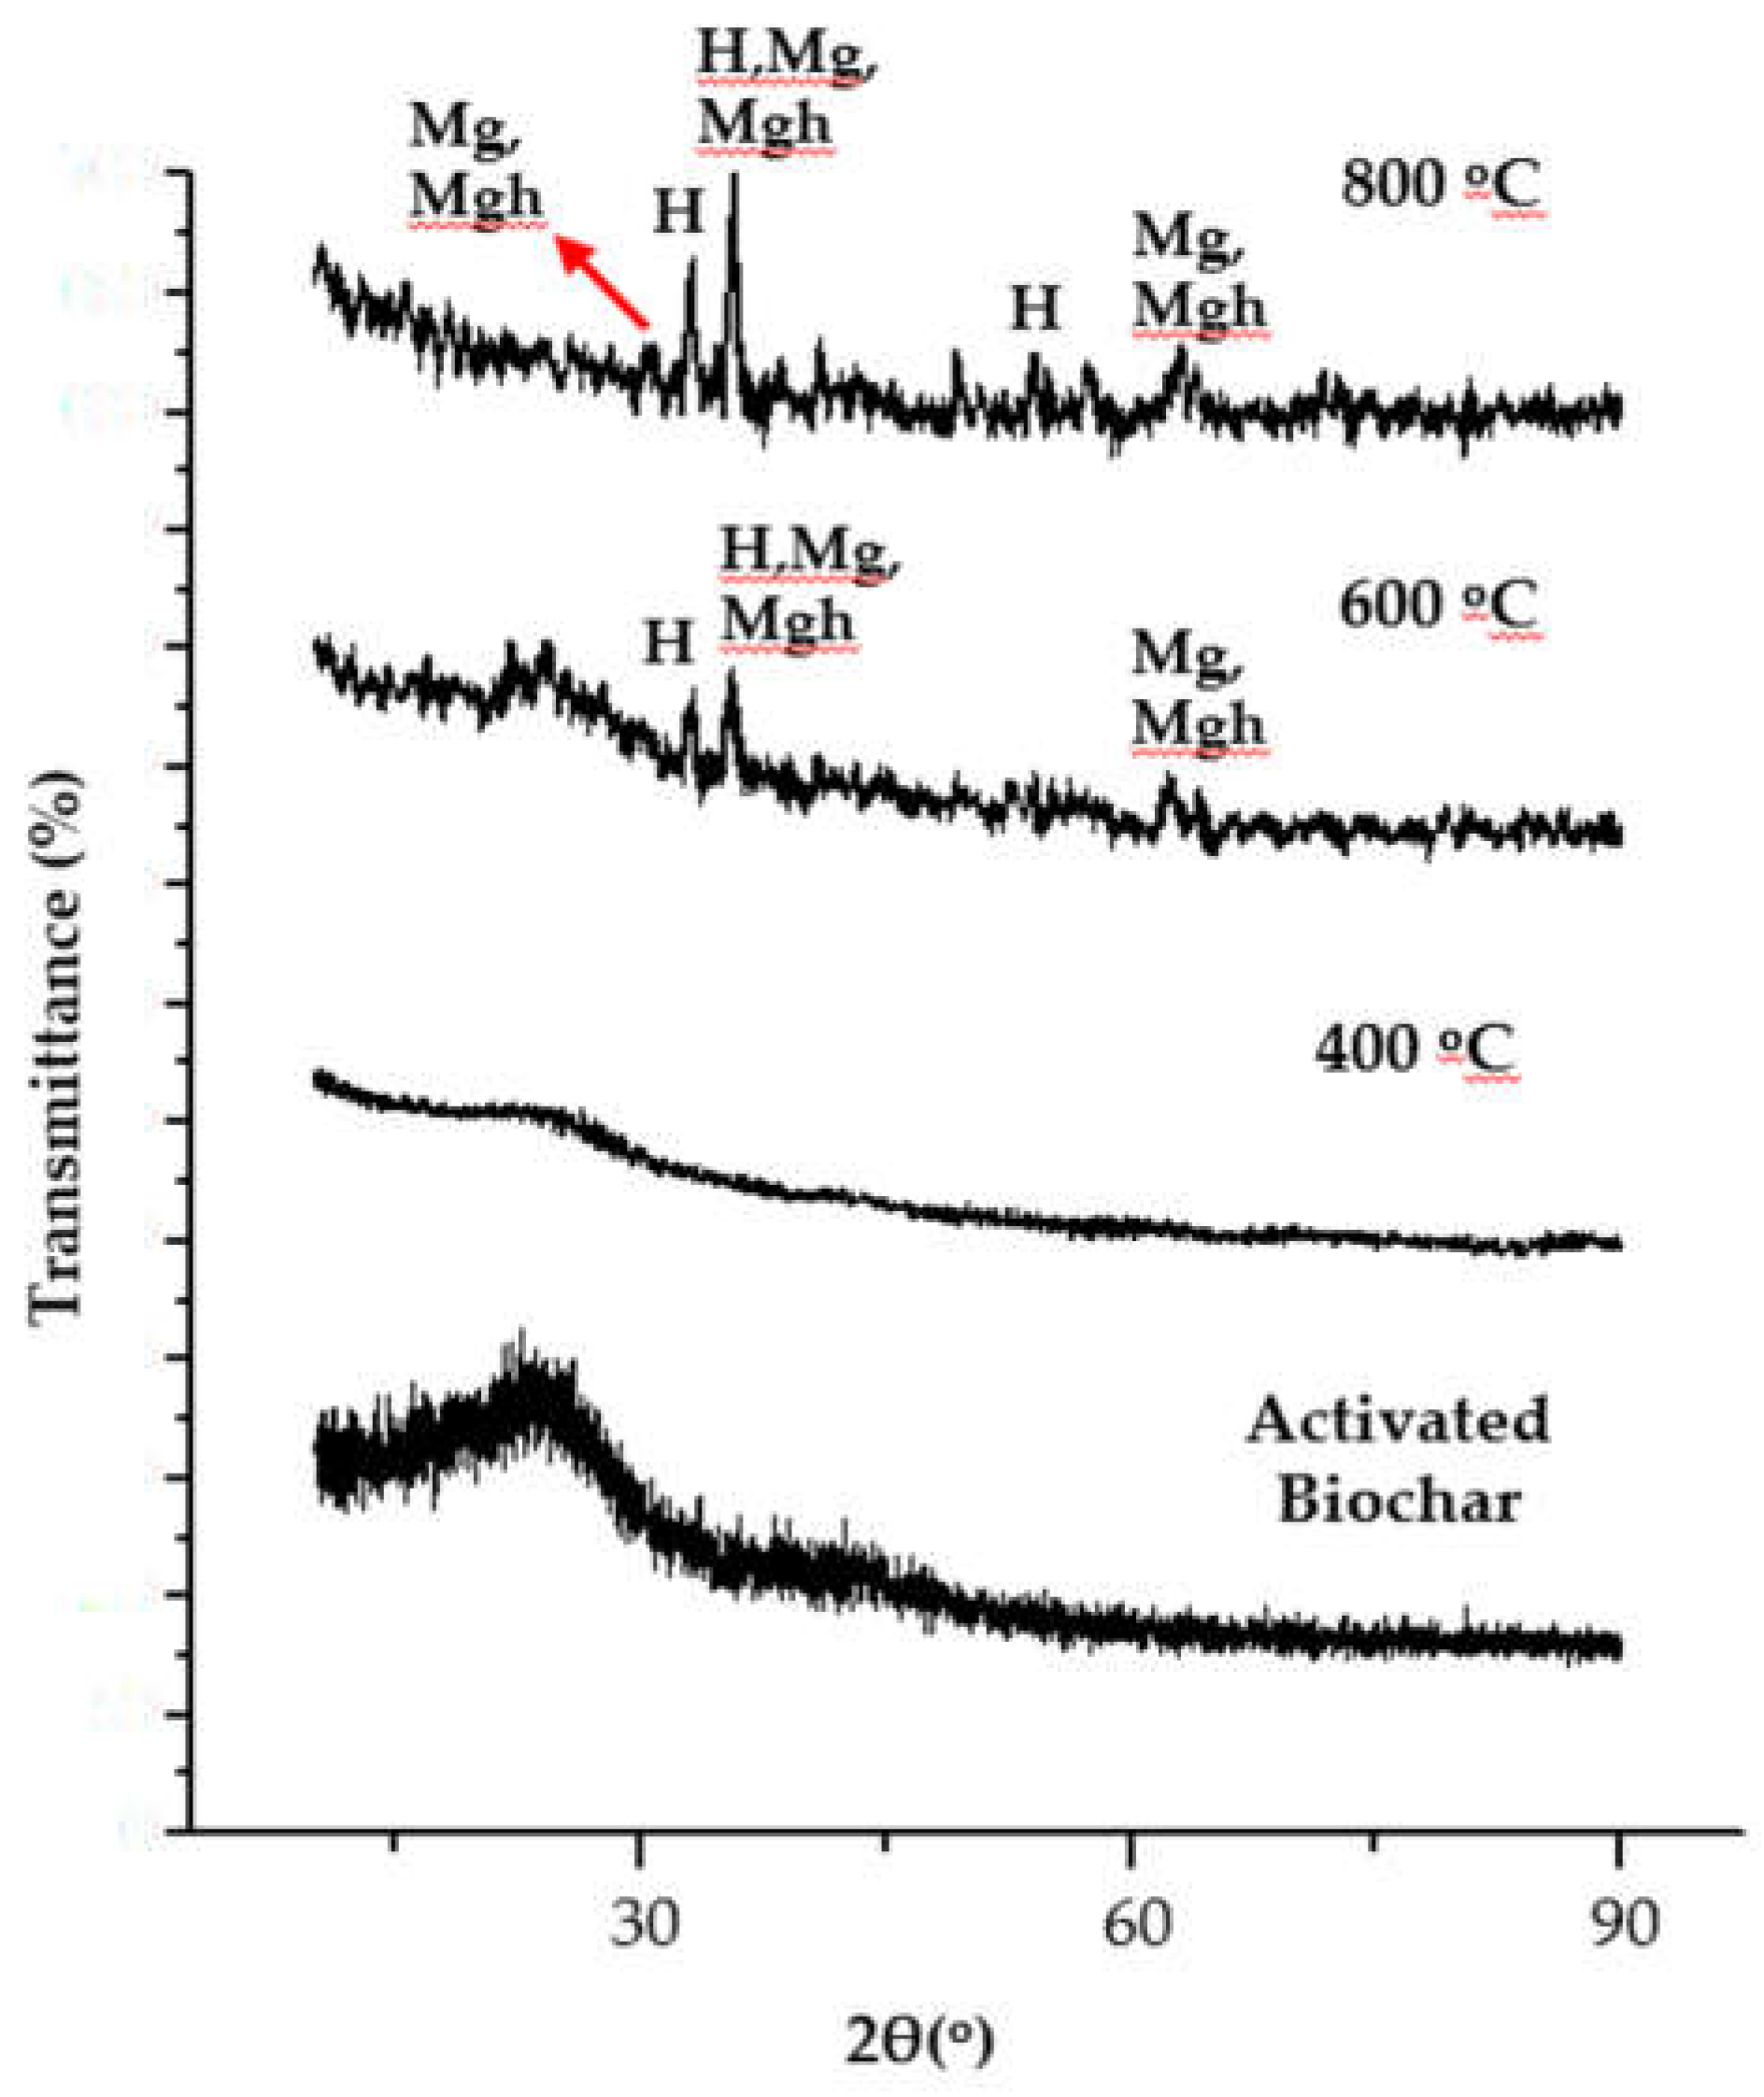
Figure 1. X-ray diffractograms of the activated biochar and the composites at various calcination temperatures. The codes are suitable for 3 or 2 of the 3 highest peaks of the standard crystal standards (H = Hematite, Mg = Magnetite, Mgh = Maghemite).
Preprints 115017 g001
Figure 2. Characterization results of the activated biochar and the composites from LSUM.
Preprints 115017 g002
Figure 3. Surface functional groups of the activated biochar and composites before and after calcination at various temperatures.
Preprints 115017 g003
Figure 4. Original FTIR spectra of the activated biochar and composites before overlay.
Preprints 115017 g004aPreprints 115017 g004bPreprints 115017 g004c
Figure 5. Adsorption–desorption isotherms of the activated biochar and composite which was produced by calcination at 800 oC.
Preprints 115017 g005
Figure 6. Raw data report of adsorption-desorption isotherm for the activated biochar.
Preprints 115017 g006
Figure 7. Raw data report of adsorption-desorption isotherm for the composite by calcination at 800oC.
Preprints 115017 g007
Figure 8. Pore size distribution of the activated biochar and the composite produced by calcination at 800 oC.
Preprints 115017 g008
Figure 8. Adsorption isotherms of paracetamol by the composites at various temperatures.
Preprints 115017 g009aPreprints 115017 g009b
Table 1. Interpretation of the composites’s X-ray diffractogram data using standard hematite.
600 oC 800 oC AMCSD
(α - Fe2O3/ hematite)………..
d(Å) I(cts) d(Å) I(cts) d(Å) IR hkl
33.11 2.71 27.34 33.11 2.71 49.97 2.70 100.00* 104
35.51 2.53 34.03 35.60 2.52 77.34 2.52 74.38* 110
40.98 2.20 18.64 2.21 22.00 113
43.36 2.09 16.22 2.08 2.02 202
45.36 2.00 8.49 2.08 2.02 202
47.13 1.93 3.56 1.84 38.07 024
49.45 1.84 20.78 1.84 39.00 24
52.79 1.73 8.91 54.08 1.70 23.99 1.70 46.28* 116
57.33 1.61 20.08 1.60 10.00 122
62.44 1.49 19.70 63.08 1.47 27.96 1.49 31.84 214
64.08 1.45 14.51 63.98 1.47 17.68 1.45 30.00 300
67.15 1.39 5.09 1.35 3.18 208
70.31 1.34 6.94 1.35 3.18 208
71.66 1.32 5.94 71.78 1.31 15.08 1.31 11.48 1010
72.79 1.30 13.55 1.31 1.73 119
74.74 1.27 10.36 1.26 7.50 220
77.51 1.23 8.37 1.23 1.26 306
79.28 1.21 9.20 79.42 1.21 4.51 1.21 1.01 223
80.90 1.19 8.10 80.85 1.19 8.82 1.19 1.68 312
82.60 1.17 7.45 1.16 6.13 0210
89.15 1.10 10.95 1.10 8.61 226
*3 main peaks.
Table 2. Interpretation of the composites’s X-ray diffractogram data using standard maghemite.
600 oC 800 oC AMCSD
(γ - Fe2O3/maghemite)
d (Å) I(cts) d (Å) I(cts) d(Å) IR hkl
30.36 2.94 14.99 2.94 33.71* 220
35.51 2.53 34.03 35.60 2.52 77.34 2.51 100* 311
43.36 2.09 16.22 2.08 16.89 400
52.79 1.73 8.91 1.70 11.16 422
54.08 1.70 23.99 1.70 11.16 422
57.33 1.61 20.08 1.60 21.09 511
62.44 1.49 19.70 63.08 1.47 27.96 1.47 40.17* 440
71.66 1.32 5.94 71.78 1.31 13.55 1.32 4.00 620
74.74 1.27 10.36 1.27 8.18 533
80.90 1.19 8.10 79.42 1.21 4.51 1.20 2.02 444
*3 main peaks.
Table 3. Interpretation of the composites’s X-ray diffractogram data using standard magnetite.
600 oC 800 oC AMCSD
(α – Fe3O4/magnetite)
d (Å) I(cts) d (Å) IR hkl
30.36 2.94 14.99 2.97 28.10* 220
35.51 2.53 34.03 35.60 2.52 77.34 2.53 100.00* 311
43.36 2.09 16.22 2.10 20.13 400
52.79 1.73 8.91 54.08 1.70 23.99 1.71 9.59 422
57.33 1.61 20.08 1.62 6.40 333
62.44 1.49 19.70 63.08 1.47 27.96 1.48 41.80* 440
71.66 1.32 5.94 71.78 1.31 15.08 1.33 3.54 620
74.74 1.27 10.36 1.28 8.82 533
79.28 1.21 9.20 79.42 1.21 4.51 1.21 2.64 444
89.15 1.10 10.95 1.09 5.54 553
*3 main peaks.
Table 4. Interpretation of the composites’s X-ray diffractogram data using molysite (FeCl3).
600 oC 800 oC AMCSD
(FeCl3 /molysite)
d(Å) I(cts) d(Å) I(cts) d(Å) I(cts) hkl
5.81 58.45* 003
5.03 36.21* 101
30.36 2.94 14.99 2.90 4.25 006
33.11 2.71 27.34 33.11 2.71 49.97 2.69 94.03* 213
42.07 2.15 11.98 2.10 4.01 205
50.81 1.80 9.18 1.81 2.91 314
*3 main peaks.
Table 5. Porosity data of the activated biochar and the composite (by calcination at 800oC).
Sample Vp SBET D Vmeso* Smeso* Vmicro** Smicro** Vmacro*** Smacro***
cm3/g m2/g nm cm3/g m2/g cm3/g m2/g cm3/g m2/g
Composite 0.140 7.113 78.598 0.002 1.602 0.138 5.510 0.004 0.140
Activated Biochar 0.330 471.672 27.980 0.137 87.096 0.193 384.580 0.065 2.730
*Vmeso, Smeso were taken from POD table at average D range of 2 – 50 nm **Vmicro = Vp – Vmeso, Smicro = SBET – Smeso *** Vmacro and Smacro were taken from POD table at range of average D > 50 nm.
Table 6. Adsorption parameters of paracetamol by the composite before and after calcination at various temperatures.
Model
Parameter No calcination 400 oC
600 oC
800 oC
(FeCl3/AB) (FexOy/AB) (FexOy/AB) (FexOy/AB)
Freundlich R2 (F) * 0.952 0.794 0.903 0.970
n 4.32 1.83 1.99 1.58
Langmuir R2 (L) * 0.975 0.827 0.867 0.964
qm (mg/g) 39.97 13.27 39.23 56.37
RL 0.953 0.957 0.939 0.861
Dubinin R. R2 (DR) * 0.953 0.957 0.939 0.861
E (KJ/mol) 0.283 0.348 0.427 0.530
qs (mg/g) 11.97 9.91 39.22 20.70
*L = Langmuir, F = Freundlich, and DR = Dubinin – Radushkevic AB = Activated Biochar.
Disclaimer/Publisher’s Note: The statements, opinions and data contained in all publications are solely those of the individual author(s) and contributor(s) and not of MDPI and/or the editor(s). MDPI and/or the editor(s) disclaim responsibility for any injury to people or property resulting from any ideas, methods, instructions or products referred to in the content.
Copyright: This open access article is published under a Creative Commons CC BY 4.0 license, which permit the free download, distribution, and reuse, provided that the author and preprint are cited in any reuse.
Prerpints.org logo

Preprints.org is a free preprint server supported by MDPI in Basel, Switzerland.

Subscribe

© 2024 MDPI (Basel, Switzerland) unless otherwise stated