Preprint
Article

Utilizing Insects as Bioindicators: An Approximation for Conservation in Urban Lentic Ecosystems from Central Chile

Altmetrics

Downloads

79

Views

32

Comments

0

A peer-reviewed article of this preprint also exists.

Submitted:

13 August 2024

Posted:

16 August 2024

You are already at the latest version

Alerts
Abstract
Regulations and guidelines on water quality are used according to physicochemical but scarcely biological variables to protect ecosystems and control water use. This study innovates using in-sects as bioindicators to establish the health status of an aquatic ecosystem in the Latin American's lentic bodies. Water quality in urban lentic bodies in the Metropolitan Region, Chile, was evaluated from of aquatic insect assemblages and physicochemical variables for conserving aquatic life. Evaluations were carried out in parallel in four sampling stations in three water bodies, two seasons, and 2–3-year series, with three replicates. Aquatic insects were randomly sampled and identified by families; abundance, and richness differences were compared with non-parametric tests. Family Biotic Indices (FBI) were calculated. Physicochemical variables were measured using portable multiparametric and laboratory chemical analysis to determine water quality. A new physicochemical variable (total suspended solids) was established, which had a greater incidence with the results obtained for the FBI. Based on the nitrogen and phosphorus levels in the water bodies, all of them were eutrophics. Given the ecosystem diversity and complexity, studies should delve deeper into wetlands to establish methods that contribute to determining water quality, using insects as bioindicators and physicochemical variables.
Keywords: 
Subject: Biology and Life Sciences  -   Insect Science

1. Introduction

A major concern of society in the face of the current climate and ecological crisis is its impact on water resources. Worldwide, climate change is predicted to affect these resources differently between regions, depending on their geographical characteristics and orographic conditions [1]. Industrial and agricultural activities impact water availability in central Chile, with a predominantly Mediterranean climate combined with climate change and a megadrought [2,3].
Conservation is a mission-oriented discipline where values are central among conservationists and other groups [4]. Studies on the role of values in conservation are located within the broader field of environmental factors. Research in this field has ranged from philosophical to sociological, anthropological, and psychological, exploring the range of environmental aspects from individual to population levels [5].
Biodiversity conservation is a global issue where the challenge is to integrate all levels of biodiversity to ensure the long-term evolutionary potential and resilience of biological systems [6]. The Chilean Standard 1.333 Of. 76 (NCh 1.333), “Water quality requirements for different uses [7], and the technical “Guide for the establishment of secondary environmental quality standards for continental surface and marine waters” [8] regulates water use and thus protect and preserves ecosystems supplying various species. NCh 1.333 set water quality criteria based on scientific requirements to “protect and preserve the quality of waters for specific uses, from degradation by contamination with waste of any type or origin” [7]. “Natural quality of continental waters” is defined as “the value of the unit or value of the concentration of an element or compound in the body and/or course of continental surface water, which corresponds to the estimate of the original situation of water without anthropic intervention plus the permanent, irreversible or unchangeable situations of anthropic origin” [8]. These documents conditioned water quality according to its physical and chemical variables (temperature [T], dissolved oxygen [DO], pH, among others) applicable to water uses such as human and animal consumption, irrigation, recreation, aesthetics, and aquatic life conservation. This traditional definition of water quality related to its uses is far from absolute but relative to the destination for this resource. It does not necessarily state natural quality [9]. Among the physicochemical variables used to determine water quality, T, DO, pH, and electrical conductivity (EC) are considered critical [10].
Biological variables were incorporated at the end of the 20th century, as they were considered more efficient in representing the continuous events that occur in a water body [11]. Our study focused on evaluating water quality for the development of aquatic life and highlights the limited experience in using biological variables in Latin America. Thus, a greater information collection and standardization of evaluation and monitoring methods is necessary [12].
Bioindicators are taxonomic groups or species capable of reflecting the conservation state, diversity, endemism, and disturbance degree of an ecosystem [11]. Studies on water quality bioindicators in Chile have focused mainly on the central-southern zone [12], where different biotic indices have been evaluated. Those studies have focused on rivers, that is, lotic bodies of water, understood as linear ecosystems that evacuate water falling over continental masses into the ocean. This gravitational transfer dissipates the potential energy contained in the water, resulting in important modifications in the morphology of the rivers [13]. There is a lack of studies on lagoons [14], that is, lentic ecosystems, large volumes of stored water with long retention and slow flow velocity [13]. These last waters reflect phenomena and events that occurred previously in the converging rivers, carrying elements and nutrients, which end up accumulating and may show disturbances that are not easy to detect in rivers, such as imbalances in the concentrations of certain polluting elements [15].
Studies of lentic water bodies, including aquatic organisms, highlight the importance of insect assemblages due to their abundance and ecological diversity [9]. They present five basic aspects: high species richness and diversity, easy manipulation, ecological fidelity, fragility to minimal disturbances (sensitivity), and short generational temporality. They are found in almost all habitats, with a wide range of responses to disturbances like pollution and sedentary habits that consider an aquatic system’s health status [16]. Among the aquatic insects used for this purpose, the most important are the juveniles of Ephemeroptera, Odonata, Plecoptera, Neuroptera, Hemiptera, Coleoptera, Trichoptera, Lepidoptera, and Diptera [15]. All these insects play the role of bioindicators and are part of biological indices, where they can be converted, through formulas, into numerical values that allow water to be classified into various qualities. The Family Biotic Index (FBI) is used widely, which allows for determining water quality classes based on assigning a score to each family of organisms based on their sensitivity to pollution and the number of existing morphospecies. This method estimates whether they have been affected by physical or chemical changes in their habitat [9,17].
The objective of this study was to contribute to the knowledge of the dynamics of aquatic insect assemblages as bioindicators of water quality, complementing the traditional use of physicochemical variables in urban lentic bodies for the conservation of aquatic life in the Metropolitan Region (MR), Chile, to strengthen the determination of the diverse classes of water quality in these bodies.

2. Materials and Methods

2.1. Study Areas

Three lentic bodies in the MR of Chile: Batuco Wetland (Batuco, Lampa), Carén Lagoon (Carén, Pudahuel) and Chada Reservoir (Chada, Paine), whose UTM (19H) coordinates are 6324095 N - 329375 E, 6299211 N - 328236 E, and 6247419 N - 347707 E; 481, 470 and 431 masl; and 275.0, 28.7 and 13.2 ha, respectively (Figure 1).
Batuco is the most important urban wetland in the RM, standing out for its aquatic birdlife. Among its main threats, strong anthropic disturbance stems from agricultural and livestock impacts and groundwater infiltration. This wetland is inserted in a scrubland and sclerophyllous forest region [18].
Carén is an urban water body that has suffered agro-industrial pollution events with organic matter discharge. It is currently part of the “Parque Carén” of the University of Chile, where the Technological Center for Food Innovation (CeTA) is located. It holds a Mediterranean forest, with plant species disappearing due to urban development [19,20]. Its fauna is composed of mostly native species of amphibians, reptiles, birds, and mammals, and is a major tourist attraction. This ecosystem has been exposed continuously to agro-industrial pollution, increasing its vulnerability [10].
Chada is a lentic reservoir with fluvial contribution intended for agricultural supply. This water body was enabled thanks to the works carried out under the Plan for the Construction and Rehabilitation of Small Reservoirs [21].

2.2. Sampling and Identification of Aquatic Insects

In each water body, four areas were chosen, representative of their diversity, each with a sampling station (SS) established randomly. These SS were GPS (Garmin) georeferenced, using UTM coordinates. Sampling was done in two seasons and in series of three and two years: spring (2015, 2017, 2018) and fall (2016, 2018) (Figure 1), except in Batuco, in spring 2017 and fall 2018.
Aquatic insect sampling was carried out in the same seasons and series of years indicated for each water body, taking three samples of aquatic insect specimens for each SS (Figure 1). Sampling was done by immersing a 1 L sterile polypropylene container in the water body, and removing it once filled. Next, the contents were filtered with a piece of tulle cloth attached to a plastic strainer, and the retained solid material was transferred to another 250 mL polypropylene container with 70% ethanol. Then, the samples were transferred to the Forest Entomology Laboratory, Faculty of Forestry Sciences and Nature Conservation, University of Chile, in Santiago, where they were again filtered with a 250 µm mesh sieve [10]. The samples were then cleaned, separated, and identified in Petri dishes under a stereoscopic magnifying glass and dissecting forceps, together with updated identification keys for the main families of aquatic insects [22,23]. From the insects already identified, both richness (average number of families/L) and abundance (average number of individuals/L of each family) were determined. The non-parametric Kruskal-Wallis (H’) statistical test was used, followed by Dunn’s multiple comparison tests to identify differences between SS (p < 0.05). Finally, the Mann-Whitney (W’) test was used between seasons, all with the InfoStat [24] statistical analysis program.

2.3. Determination of Water Quality Classes by Family Biotic Index (FBI)

Each SS of the three water bodies, by season and year, was classified according to its quality according to the Family Biotic Index (FBI) [17], adapted for Chile [14]. Water quality value results from FBI = 1/N Σ ni* ti, where ni is the number of individuals in a family, ti is the tolerance score of each family, and N is the total number of individuals in the SS sample. The resulting SS with this formula was located in one of the five water quality classes (modified from [25]): Class I, very good: 0.00-3.75; Class II, good: 3.76-4.63; Class III, regular: 4.64-6.12; Class IV, bad: 6.13-7.25; Class V, very bad: 7.26-10.00.

2.4. Measurement and Determination of Water Quality Classes Using Physicochemical Variables

In parallel with insect sampling, physicochemical water variables were measured in situ in 1 L samples of the same SS with a portable multiparameter (WTW Multi 340i, Weilheim) that provides instant results (pH, electrical conductivity [EC, µS/cm], total suspended solids [TSS, mg/L], temperature [T, ºC] and dissolved oxygen [DO, mg/L]). The historical T average per season (fall or spring) was determined from all the values by SS in each water body. Then, the difference between the historical T average and that measured in situ by SS was determined. In each SS, in turn, three subsamples were obtained in 50 mL Falcon-type tubes that were taken at 4°C to a subsequent laboratory analysis of the total values of phosphorus (P, µg/L) and nitrogen (N, µg/L), according to the methods indicated in the Official Chilean Water Quality Standard NCh 411/1-4 [26]. These last analyses were conducted in the Environmental Chemistry Laboratory of the Ecology and Environment Section of the Central Criminalistics Laboratory (LACRIM Central) of the Chilean Investigative Police (PDI), Santiago, Chile. All the values obtained in situ and in the laboratory were compared with references in the Guide [8] and the Official Chilean Standard NCh 1.333. Of 78 [7], concerning the requirements for waters intended for aquatic life. Thus, each SS of each season and year was classified according to a water quality class: exceptional, first, second, third, and fourth.

2.5. Principal Component Analysis (PCA) of Physicochemical and Biological Variables

Based on the results above, a Principal Component Analysis (PCA) was performed with the seven physicochemical variables (T, pH, EC, TSS, DO, P, and N) and the biological variable (FBI), with all the data for the three lentic bodies. The FactoMineR library was used for this analysis from the Rstudio program version 1.4.1106 [27].

3. Results

3.1. Abundance and Richness of Aquatic Insect Family Assemblages

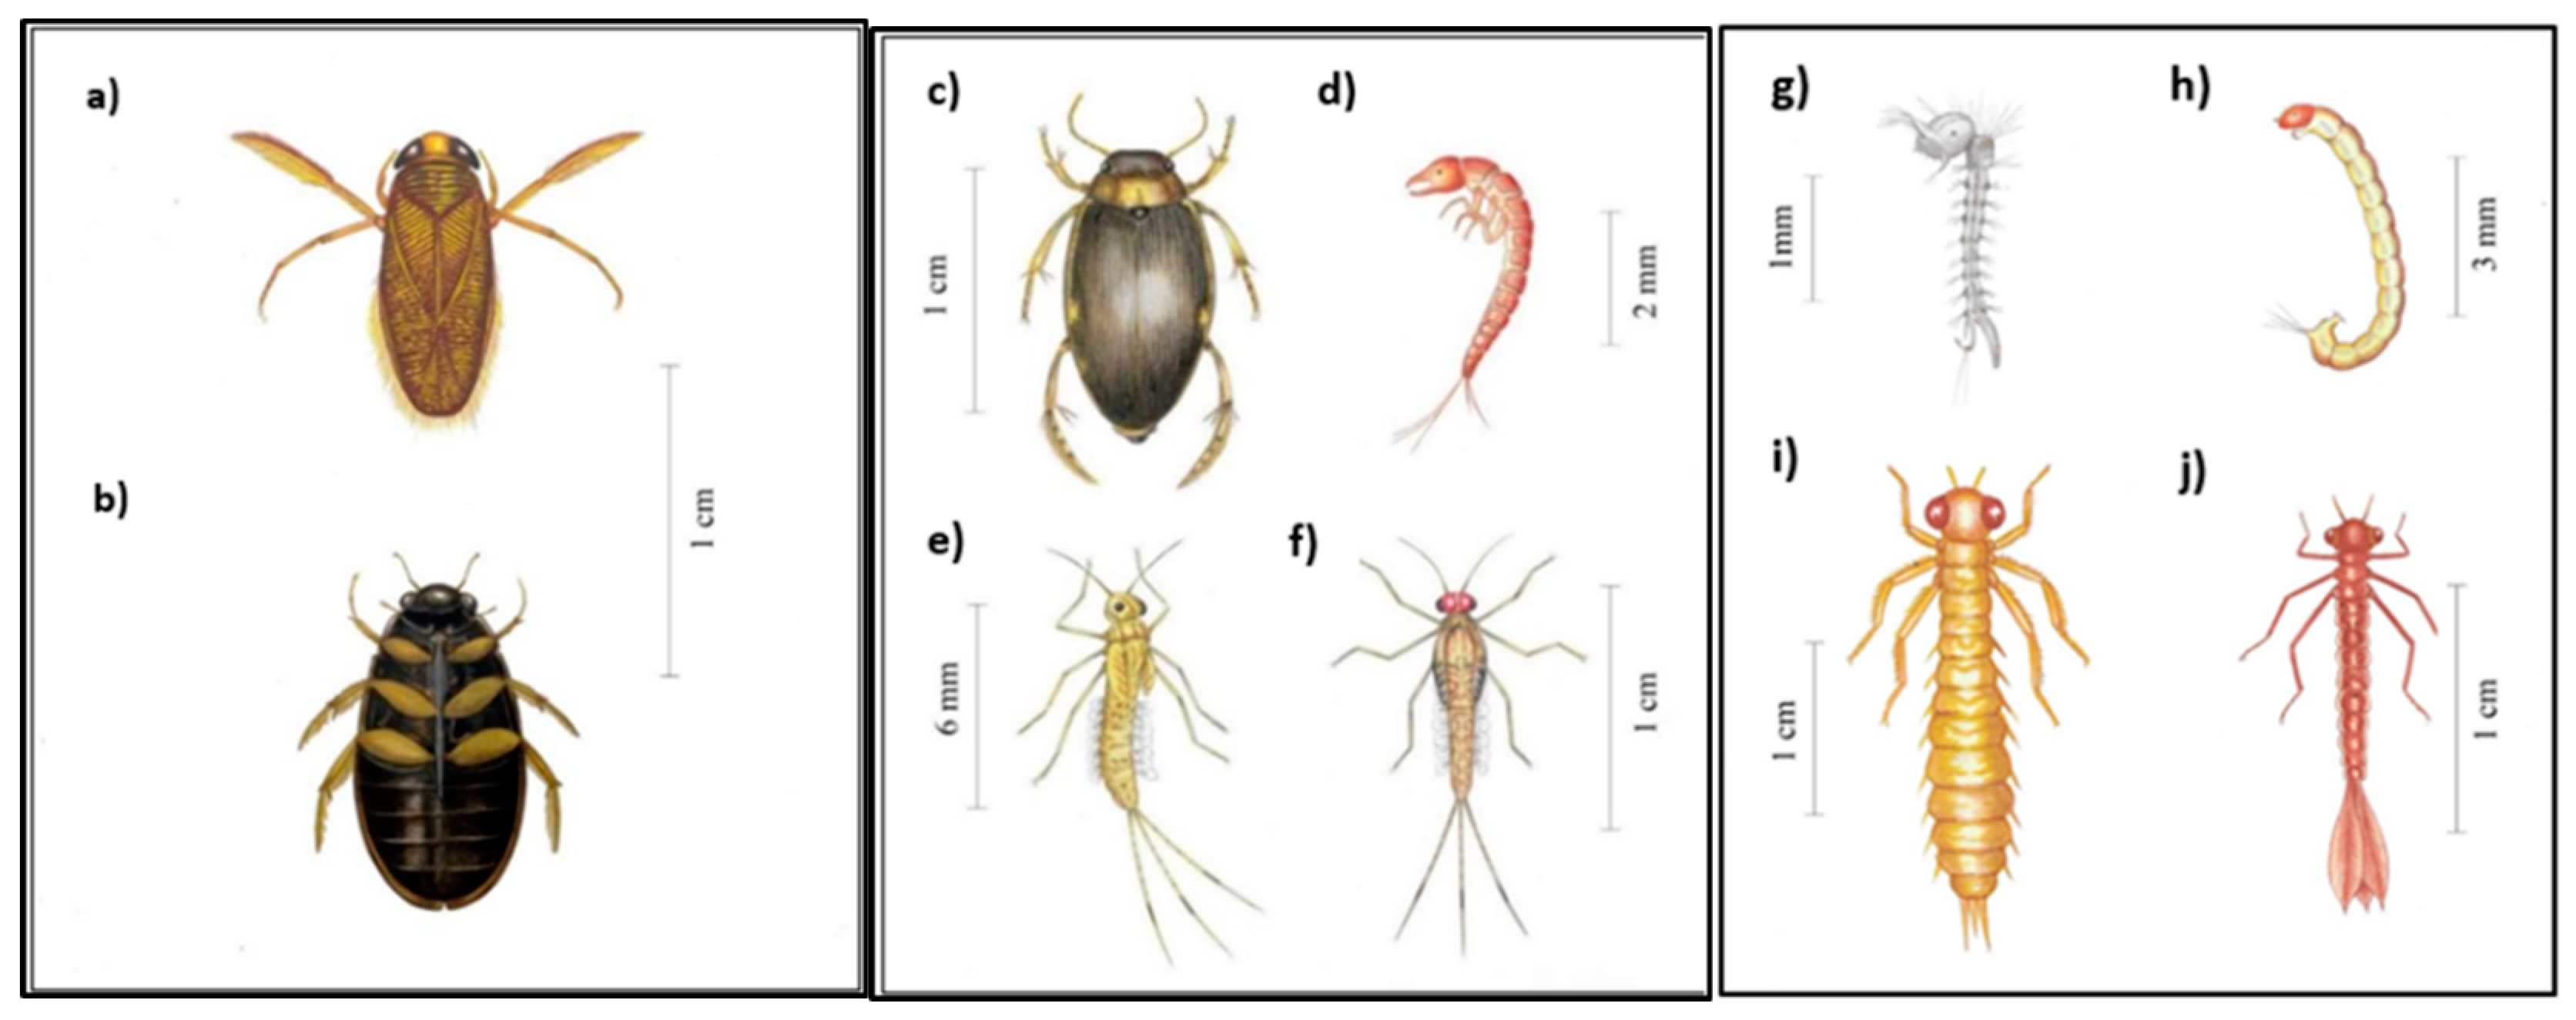
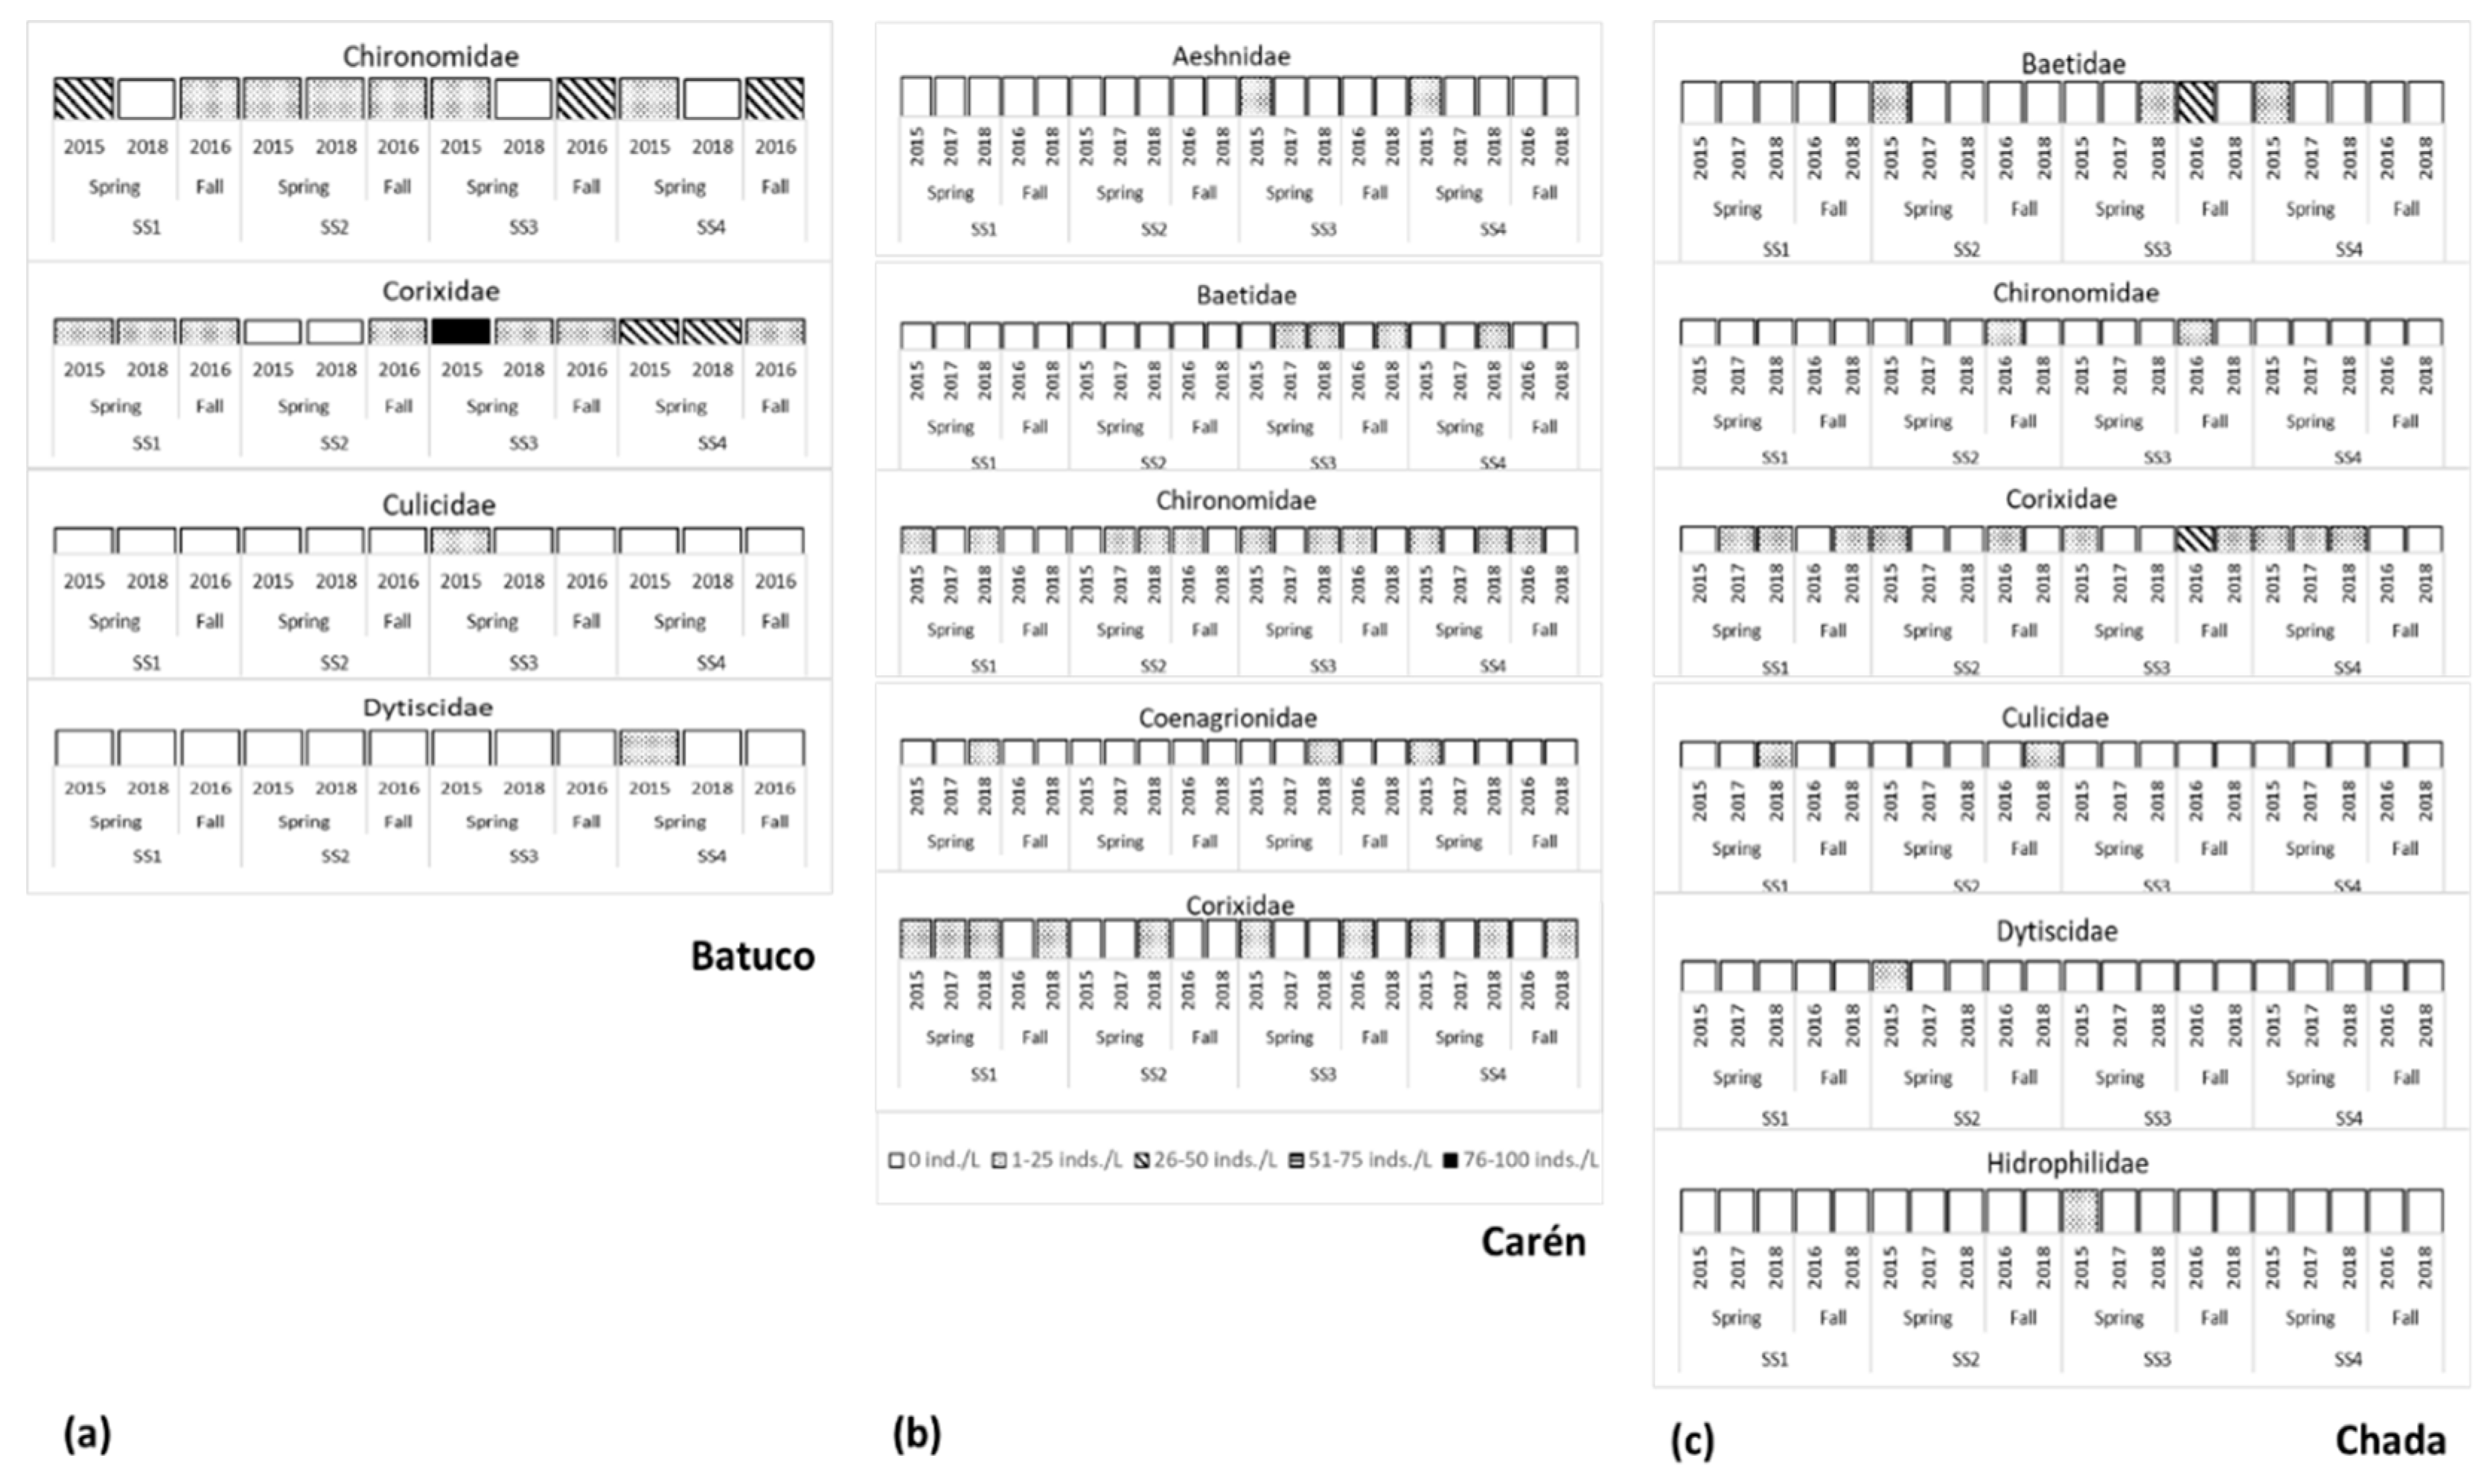
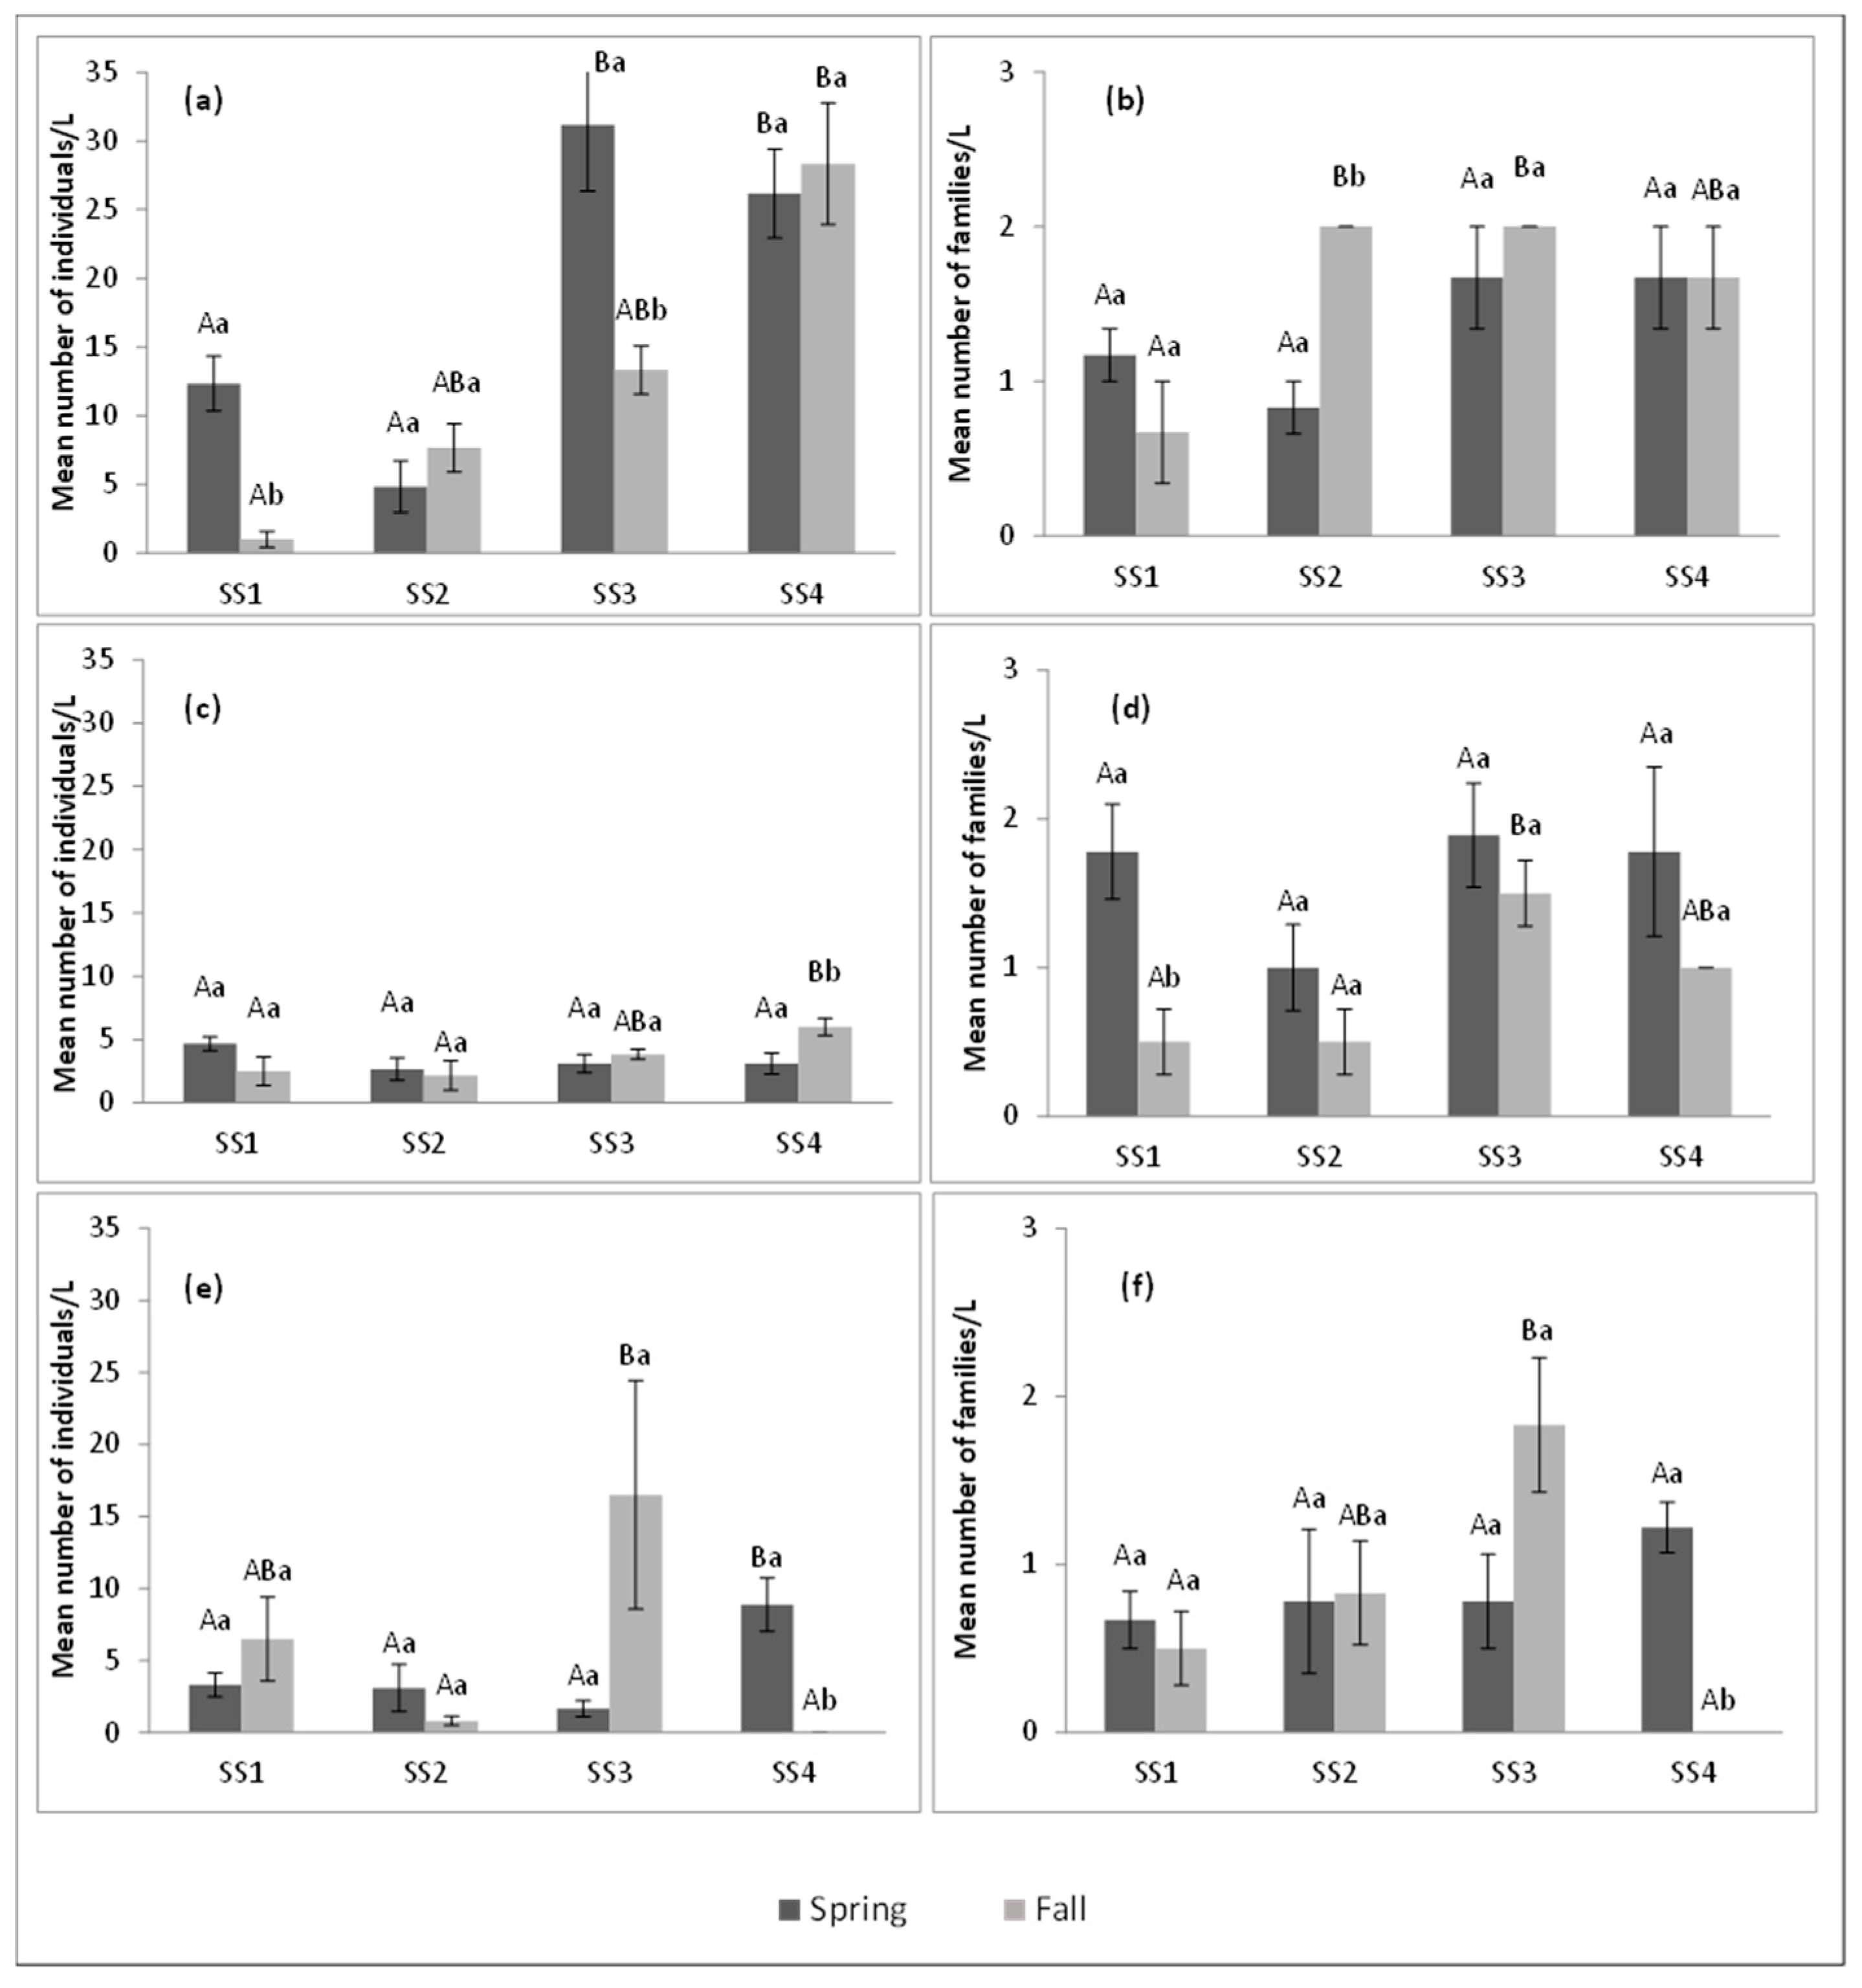
In Batuco (n=598 individuals), Corixidae was the most frequent insect family found in different seasons in all SS (Figure 2a and Figure 3b). In the fall, SS1 and SS4 had the least and greatest abundance, respectively (significant, H’=9.97; p=0.0188). In the spring, the abundance in SS1 and SS2 was significant, with levels between SS3 and SS4 (H’=18.41; p=0.0003). When considering abundance differences within the same SS across seasons, only SS1 and SS3 were significant (W=6.00; p=0.0238 for both SS) (Figure 4a). Regarding family richness, there were differences between SS in the fall (H’=5.86; p=0.0374). Between seasons, there were differences in SS2 (W=24.00; p=0.0238) (Figure 4b).
In Carén (n= 209 individuals), the most frequent insect family was Chironomidae (Figure 2h and Figure 5c)., followed by Corixidae (Figure 2a and Figure 3b). The greatest abundance occurred in SS4 in the fall (2016), while the greatest family richness occurred in the same SS in the spring (2015). In the falls, significant differences in abundance were found (H’=7.94; p= 0.0415). Between the different seasons, SS4 presented differences in abundance (W=66.5; 0.0288) (Figure 4c). There were differences in the richness of families between SS during the falls (H’=7.97; p=0.013). Between seasons, there were differences in SS1 (W=28.50; p=0.0224) and SS2 (W=21.00; p=0.0004) (Figure 4d).
In Chada (n= 296 individuals), Corixidae was also the most frequent insect family season and SS (Figure 2a and Figure 3c). The greatest family richness occurred in SS2 in the spring (2015) and SS3 in the fall (2016). In autumn, significant differences in abundance occurred between SS (H’=11.60; p= 0.0048). In the spring, SS4 had considerably greater abundance than the other SS (H’=11.78; p=0.0059). Between seasons, there were differences in abundance in SS4 (W=21.00; p=0.0004) (Figure 4e). There were differences in family richness between SS during the falls (H=11.22; p=0.0043). Between seasons, there were differences in SS4 (W=21.00; p=0.0004) (Figure 4f).

3.2. Water Quality from Physicochemical and Biological Variables

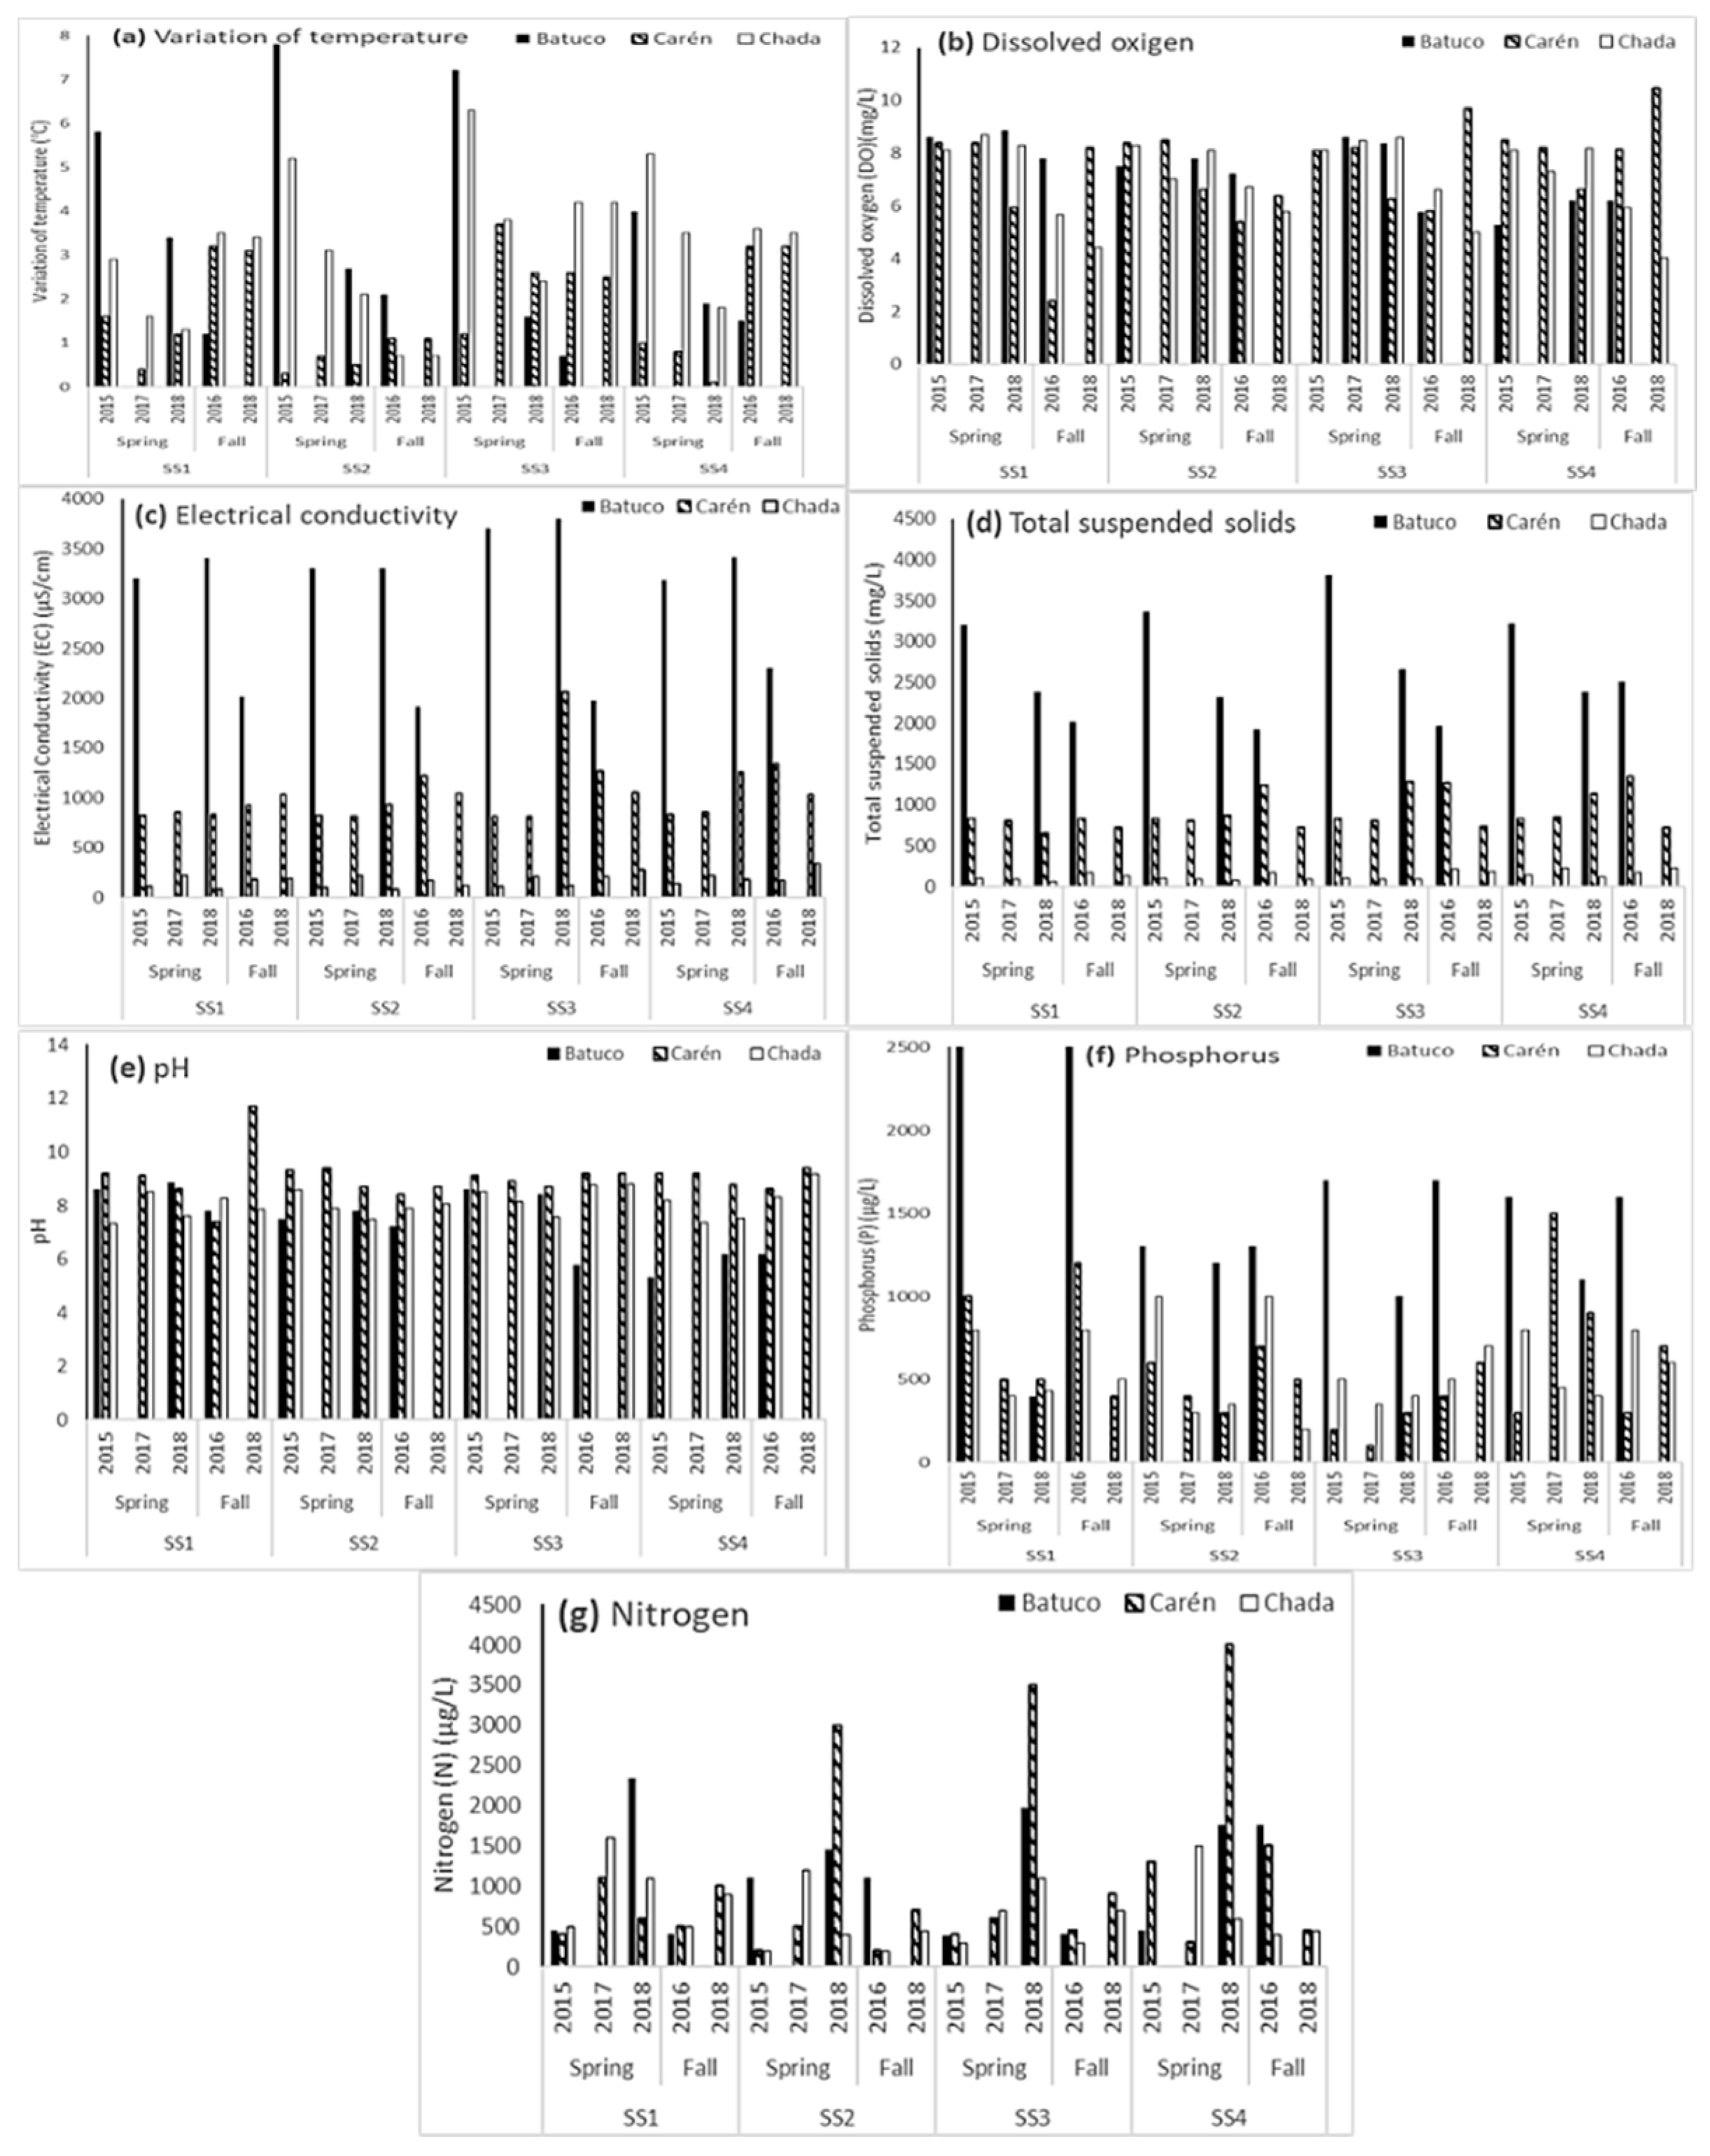
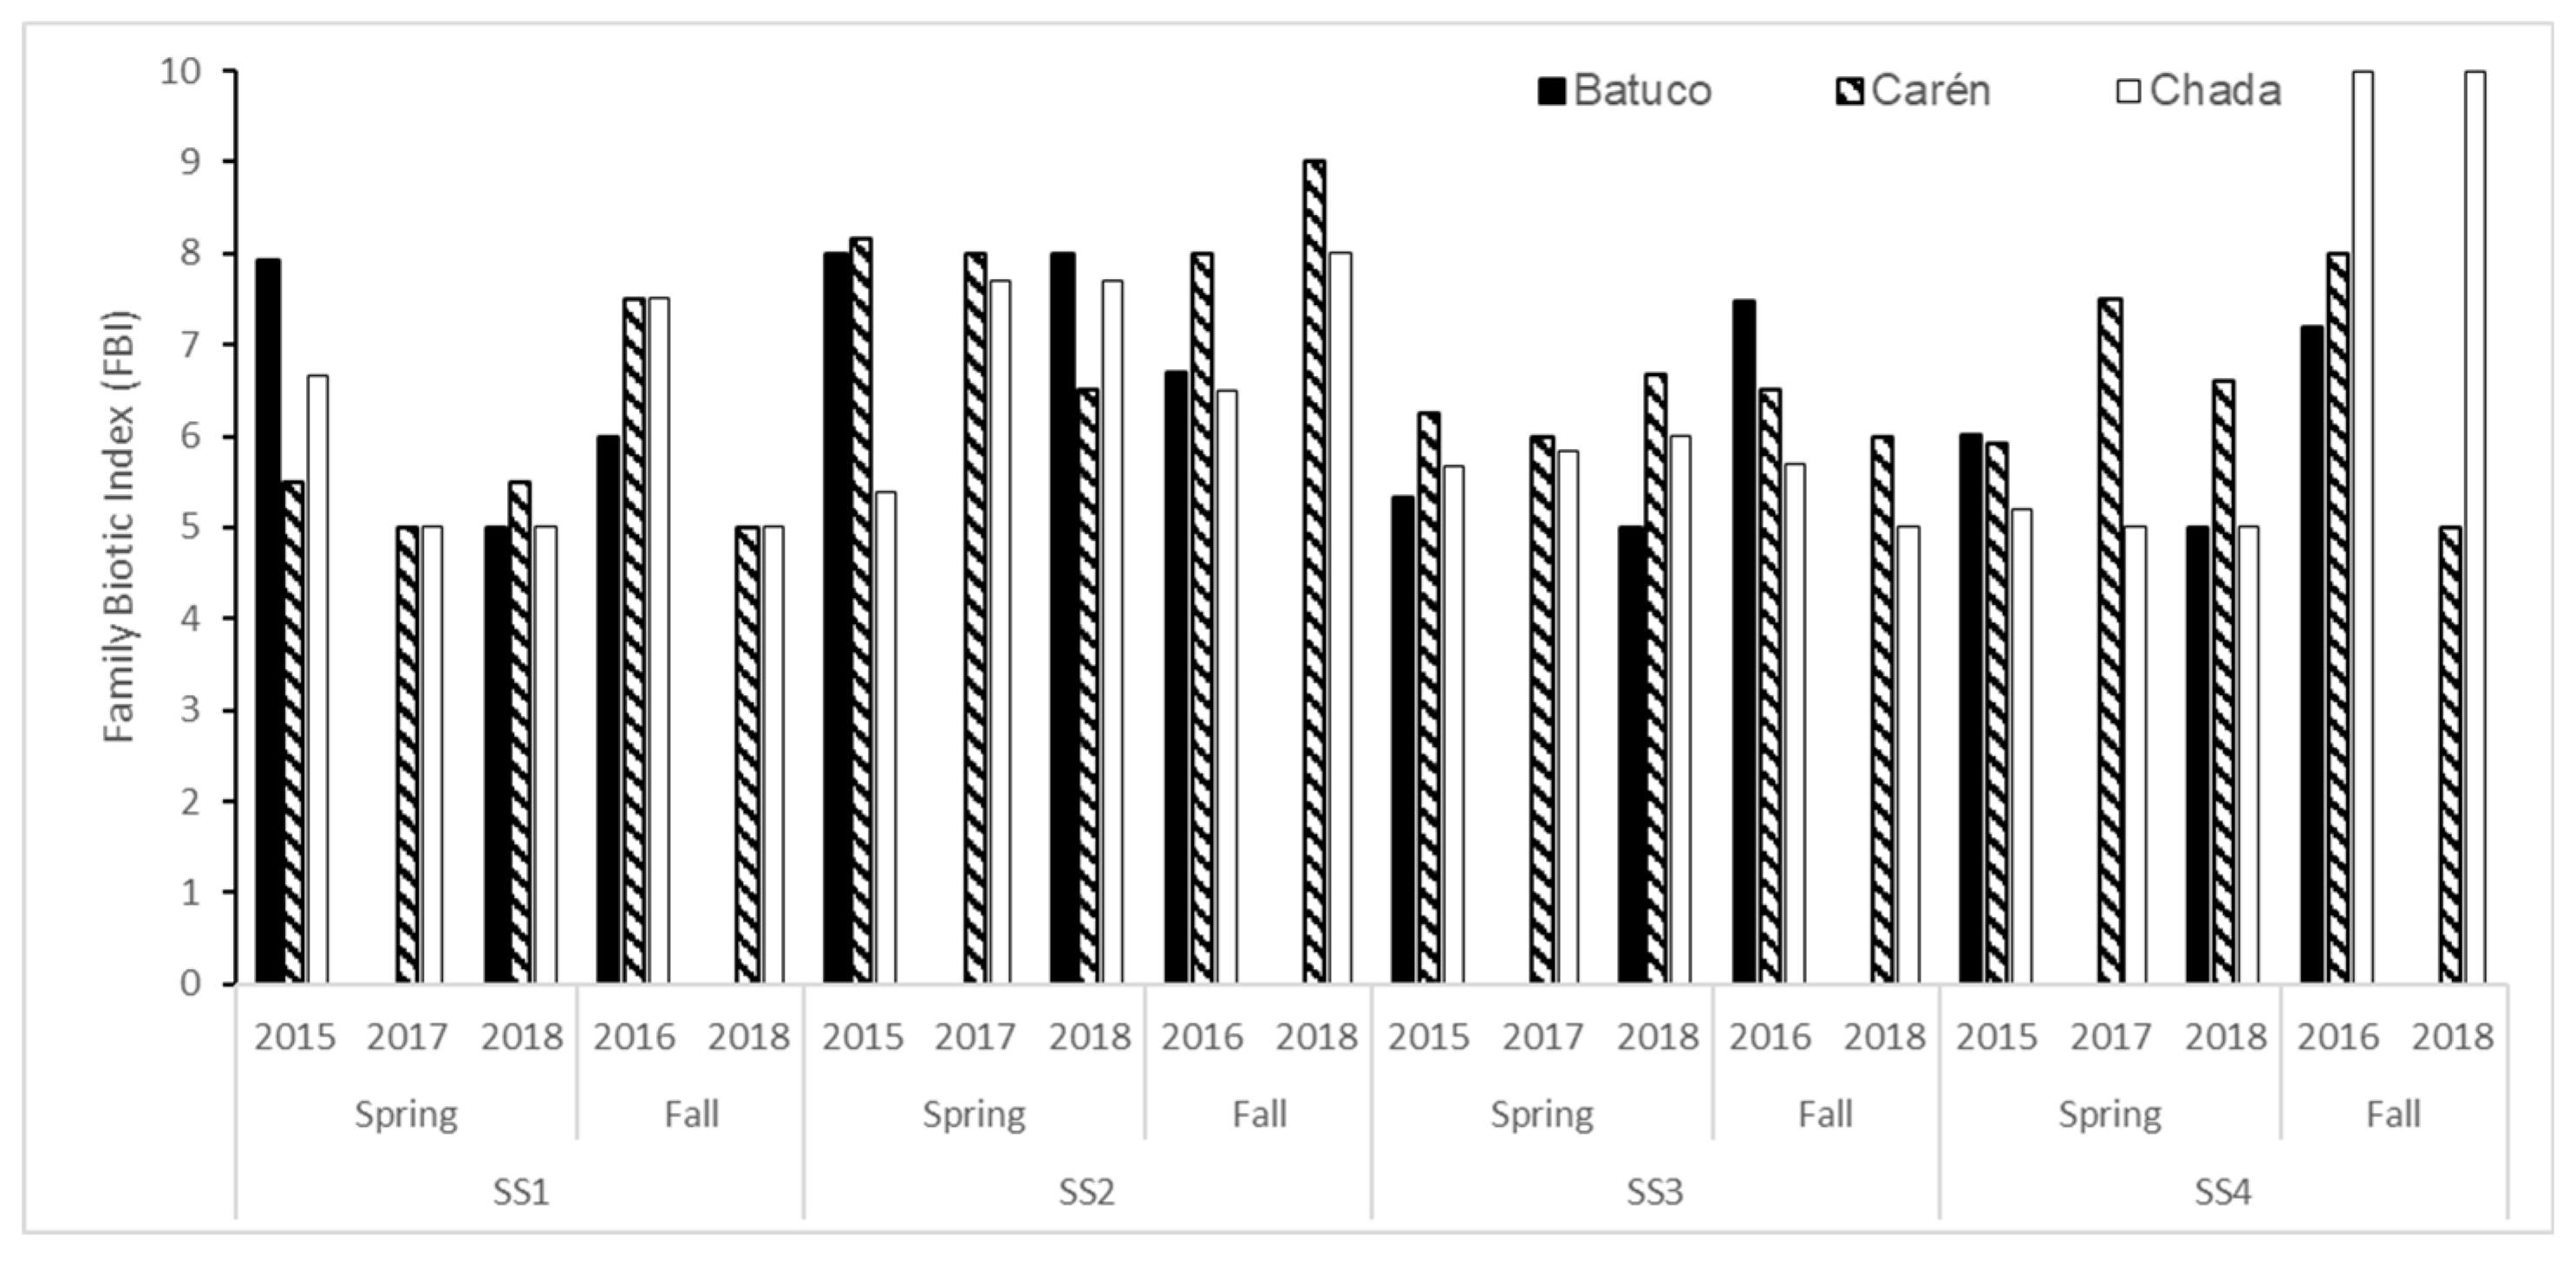
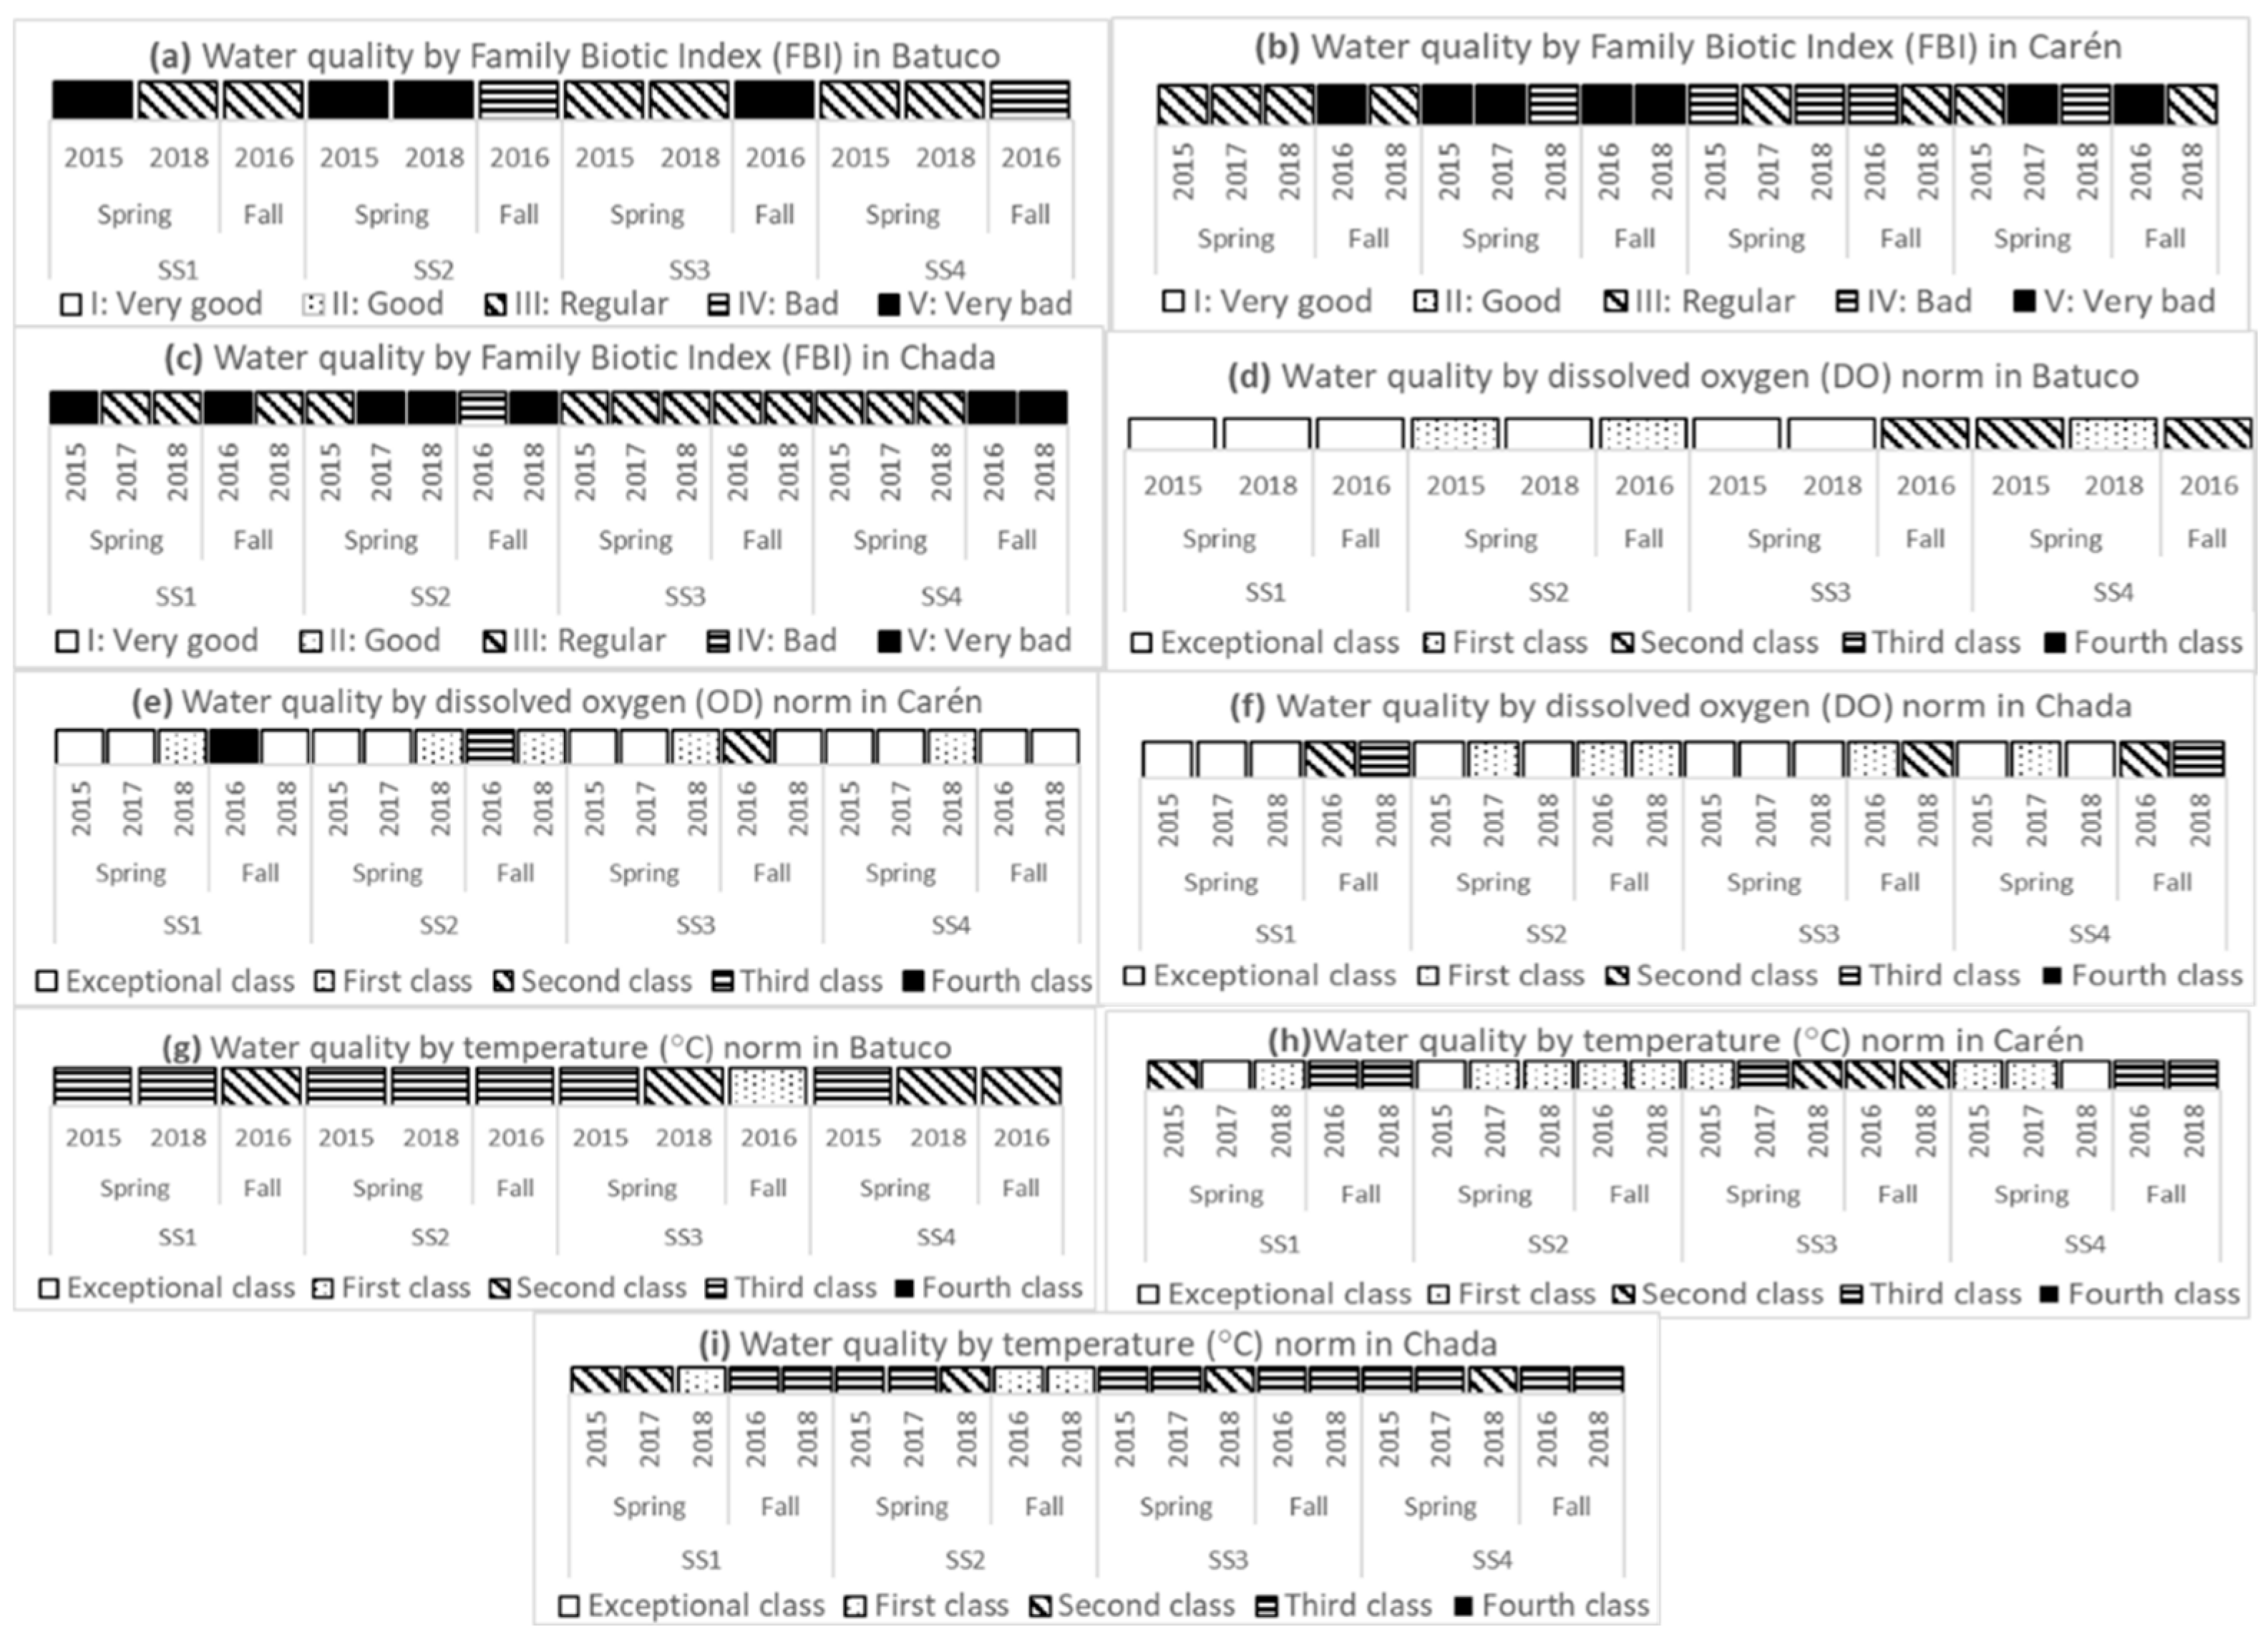
In Figure 5, Figure 6 and Figure 7, for each water body, SS, season, and year, the temperature variation (T), dissolved oxygen (DO), electrical conductivity (EC), total suspended solids (TSS), pH, phosphorus (P), nitrogen (N) and FBI are presented. The water qualities were obtained from the FBI (Figure 6) and from the Chilean Standard NCh 1.333 (INN Chile, 1987) and guide (CONAMA, 2004) through DO and T (Figure 7).

3.3. Principal Component Analysis (PCA)

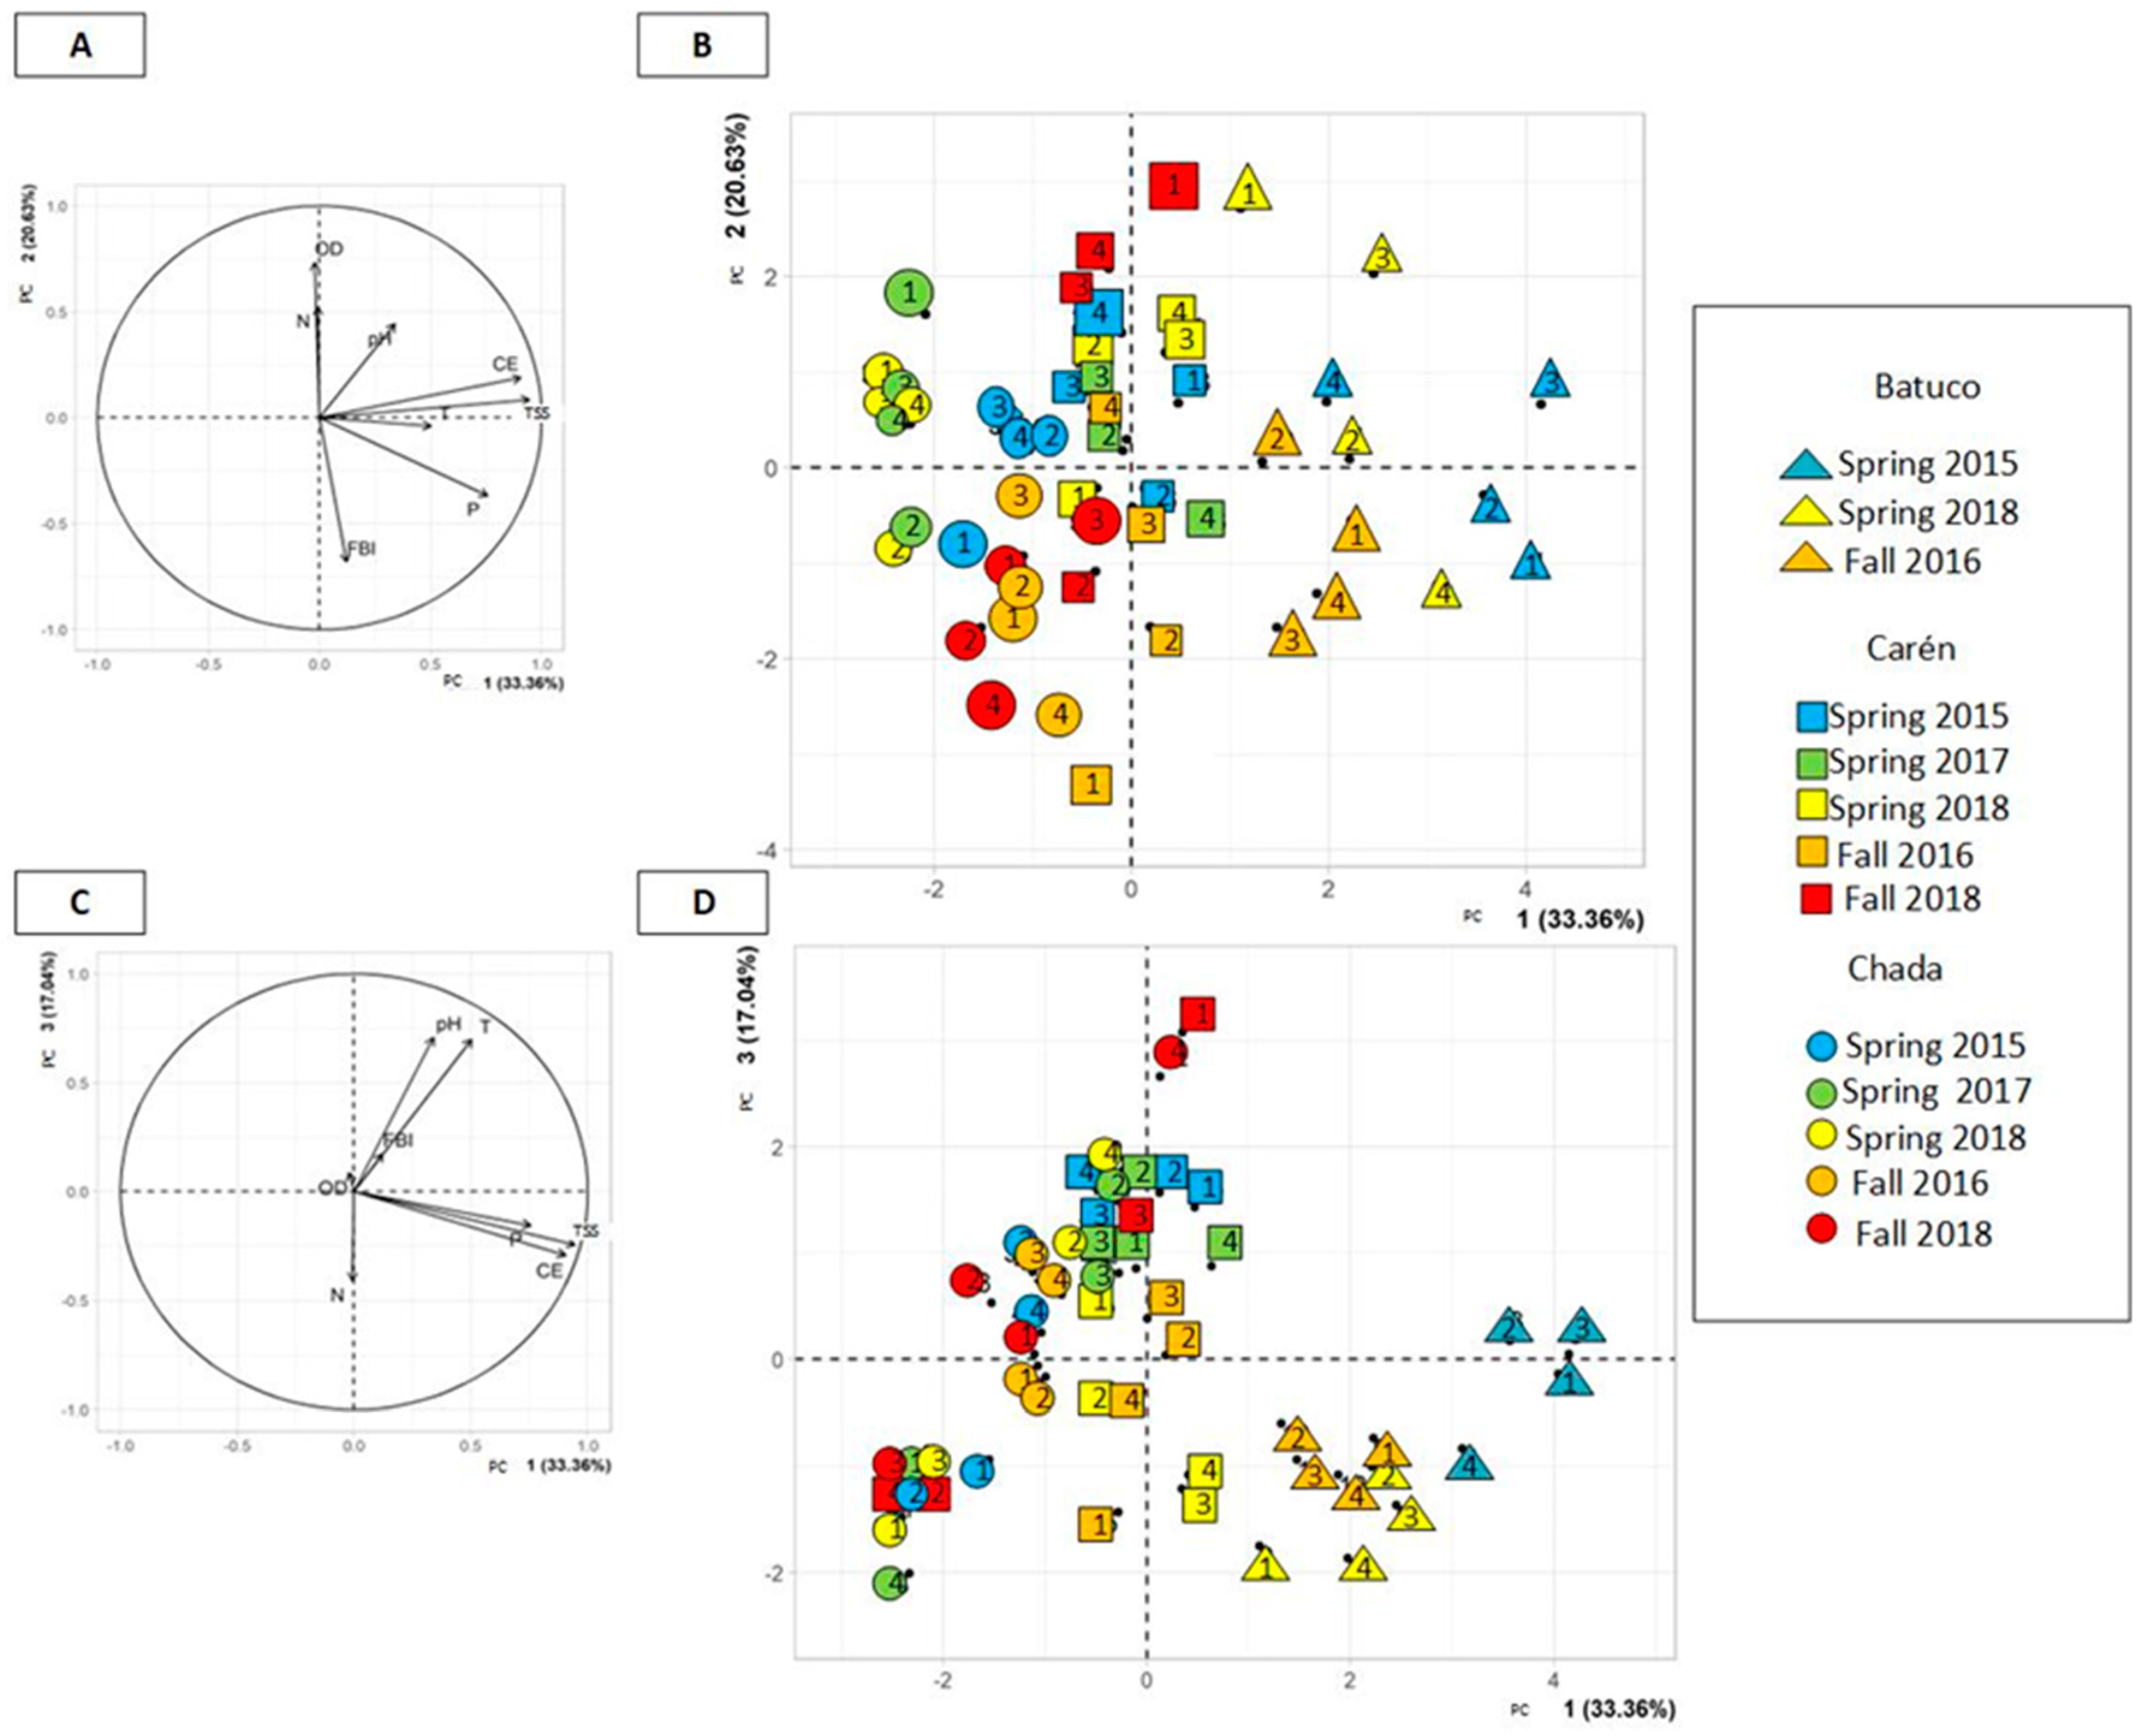
In the Principal Component Analysis (PCA), considering the seven physicochemical variables (T, pH, P, EC, TSS, N, and DO) and the biological variable (FBI) of water quality in the lentic bodies, the first three axes explained 71.03% of all the variation in the data (Figure 8).
The first main component (PC1), which explains 33.36% of the total variation, ranked the water bodies according to the degree of water quality deterioration as highly correlated with TSS, EC, P, T, pH, DO, and N, respectively. The results of PC1 in relation to PC2 (the second main component) and those of PC1 to PC3 (the third main component) are presented in Figure 8.
PC2, accounting for an additional 20.63%, was correlated with DO, N, pH, P, and FBI (Figure 8a,b), confirming the eutrophication level of the three water bodies. PC3, accounting for 17.04%, was correlated with pH, T, EC, and N (Figure 8c,d). Both PC1 and PC2 were closely related to TSS, P, and N, together explaining about 55% of the total variation.
The combination of PC1 and PC2 from the PCA variables determined that the variables that best explained the data distribution were DO, EC, TSS, P, and FBI. There was a disaggregation in Batuco for the other two water bodies, where EC and TSS had a positive correlation towards these variables in PC1 and PC2; DO had a positive correlation only in PC2; and P a negative correlation against these last variables only in PC2. This occurred in all SS and all seasons in this water body (Figure 8a, b). In Carén and Chada, the EC and TSS had values opposite to the positive correlation presented in the SS of Batuco, whose values corresponded mainly to the last spring samplings in Chada. In turn, the DO shows high values in Carén in most samplings in the fall (2018) and spring (2018, 2015). The FBI presented a negative correlation with some values in Carén, which indicated good quality classes.
The combination of PC1 and PC3 for this analysis indicates that T and pH were the best variables to explain the distribution of the data in both dimensions and TSS, EC, and P only for PC1, where the values in Batuco were correlated with the latter, making it again disaggregated from the other water bodies (Figure 8c, 8d). This combination between the two components did not allow for establishing differences between the values of the SS and seasons in Carén and Chada based on the physicochemical and biological variables.

4. Discussion

4.1. Analysis by Water Body

4.1.1. Batuco

Regarding insect abundance, SS1 and SS2 had small numbers of individuals/L, coinciding with the areas close to the main access to this water body. In the first samples, an evident anthropic impact was observed in the entire sector close to these SS but not in SS3 and SS4, which were very close to each other and further away from the places with greater anthropic intervention. In these last SS, different taxonomic groups of invertebrates were found, highlighting insects. Regarding family richness, among the significant differences between SS and between seasons, a lower richness stands out in SS1, both in the spring and fall, and in the spring in SS2. Again, these richness values are associated with the low abundance values in the SS that had greater disturbances. In the fall in SS2, the increase in richness (and a slight increase in abundance) could be related to an increase in water volume during the sampling date corresponding to this season. Despite the values obtained in the physicochemical variables, aquatic insects were also found with a high abundance in some cases. This could be because the insect families found, mainly SS1 and SS2, present a wide range of tolerance to changes in these variables. Regarding the FBI values, it is difficult to establish a pattern that allows associating the SS or seasons with a single quality class. This is because the index requires an abundance of individuals, family richness, and tolerance scores for each insect family. The quality classes corresponding to “bad” are mainly due to the presence of the Chironomidae (Diptera), which score 8 [14], and contribute directly to a high score value, therefore, to a “very bad” water quality. This family is known for living for long periods in waters with low DO concentrations [28], and the samples with a low value in this variable had a high abundance of these insects (fall [2015] in SS3; spring [2015] in SS4). The Corixidae family, with a score of 5 [14], contributes to a better-quality class, in this case, “regular”. During the spring (2015), SS3 and SS4 were the only ones where Culicidae and Dytiscidae were found. However, even though the score of these families contributes to a “bad” or “very bad” water quality [14], they were found in low proportion, and the samples were classified in a “regular” quality class.
From the DO, water quality was variable temporally and spatially, with the “Exceptional” class predominating, except for SS4, which quality was “Second”, coinciding with the least anthropic presence evidenced. A notable coverage of macrophytes occurred, which does not correspond to the high levels of DO, but to the eutrophic level of the water body. The high values of DO may be a consequence of the wind conditions and the low depth of the water body [29]. Regarding pH, despite being in a narrow range (between 8.0 and 8.9), there was a difference between the SS and the seasons in which these values met conditions for aquatic life, and in SS1 and SS2, in all seasons and the spring of SS3, the values did not meet this condition and had alkaline values (8.6). This coincides with these SS being in the most affected areas of this wetland, close to the main access, and subject to greater contamination and anthropogenic impacts. Water quality for the four SS was “Second” to “Third” according to the guide [8]; however, this guide was designed for continental freshwater bodies and marine waters, but it does not consider intermediate situations, such as the values of unique variables in this wetland, as is the case of the EC and TSS that exceeded the standard. This may be due to the high concentration of salts, shallow depth, and high evaporation, among other factors. In this same water body, also observed a high EC throughout the basin and the consequent saline composition of the soils [29]. He also indicated that the waters fluctuate from fresh to brackish and swampy, mainly due to the low permeability of the soils. Likewise, this variable was indirectly determined from the TSS between 1964 and 2006, allowing to verify that the EC has remained relatively constant, which confirms the relationship that exists between saline soils and the quality of their waters. Regarding the nutrient load (N and P) in the wetland, a high concentration of these was generally observed, in accordance with the water quality studies [30] carried out during 2017 in the wetland, with high N concentrations recorded that could be associated with the agricultural and livestock activity of the area, providing diffuse sources of nutrients from the use of fertilizers and external contributions of organic matter, enhancing the photosynthetic capacity of biological communities. Furthermore, the main tributary of the waters comes from the streams in the eastern part of the Lampa commune (irrigation overflow waters) and from indirect contributions from the nearest wastewater treatment plant [31]. Finally, this body had the worst quality destined for aquatic life [7,8] in relation to the other bodies studied, although applying a lower sampling effort.

4.1.2. Carén

In general, a low average number of individuals/L occurred throughout the seasons in all SS. The average did not exceed 5 inds./L, with no significant differences between SS during the spring and slight differences between SS3 and SS4 in the fall. This low abundance coincides with the characteristics of this water body, with many of its physical and chemical variables not favoring aquatic life development. Their abundance contrasts with the richness of families present. There, unique families were found in the water, as finding only one individual of a new family contributes greatly to the richness of the SS during the seasons. In this water body, quality classes corresponding to “very bad,” according to the FBI, were found in at least one of the samples taken in the fall. In SS4, in the spring (2017), and in almost all the samples at SS2, a “very bad” quality class was present (except in the spring of 2018). This may reflect a total absence of individuals, and it is assumed that in the absence of insects, there are no appropriate conditions for the development of aquatic life, or also the presence of Chironomidae individuals, which contributes to a “very bad” quality class. Corixidae, most frequent in freshwater bodies of the central zone [12], was found in low abundance in Carén, which could be related to its physicochemical variables. Insect families that were found in very low quantities, such as Aeshnidae, Coenagrionidae (Odonata, FBI score 4), and Baetidae (Ephemeroptera, FBI score 6) [14], contributed to the best possible quality classes, in this case a “Second” water body class.
Carén presented high pH levels in all seasons, exceeding those indicated by [32,33] for equivalent SS. However, the information obtained in those studies had as a reference the LA-1 section at a sampling station of the Colina Estuary close (1 km) to the lagoon, which could explain fluctuations in its physicochemical variables from Carén, for example, through dilution in the waters. On the other hand, the Pudahuel Series soils of this area are characterized by having a slightly basic pH of pumicitic origin [34]. Using as a reference SS4, which location was close to that used by the study [33], the DO values were similar in the same season and year around that last study, coinciding with the greatest values herein in the fall and winter. In the EC, in SS4, the difference between values was greater, although in all cases, the values in our study were lesser than those in the study [33], with the fall (2018) standing out with a difference close to 700 µS/cm. This may be because the SS used by [33] corresponded to one of the lagoon tributaries, a lotic water body. This water body had the second lowest water quality for aquatic life [7,8].

4.1.3. Chada

Differences in abundance were found both between SS and seasons. During the spring sampling, the only significantly different SS with greater abundance was SS4, coincidentally one of the farthest from the main access and, together with SS3, the one with the least anthropic intervention. However, in the fall sampling, no insects were found in SS4. One possible explanation is that this body of water corresponds to an irrigation reservoir, where the volume of water stored varies every certain number of months [35], and a controlled decrease in the water volume in the fall may have altered the establishment of aquatic insects in stations such as SS4. This was evident in the fall (2016) when the water level dropped to the point that this reservoir was fragmented into two small lagoons: SS1 and SS4 as part of a lagoon and SS2 and SS3 as part of another. This decrease meant that both SS1 and SS4 categorically had no water; therefore, no aquatic insects were found. Thus, in the fall, SS3 was the only SS containing water that had less anthropic disturbance. Regarding FBI, the SS that presented a “regular” water quality class was mainly focused on SS3 and SS4, except in the fall in the latter, where no insects were found, and scored a “very bad” quality class. In some samples, insects were not detected, which does not mean that the water does not have the conditions for aquatic life, but maybe the fact that Chada supplies surrounding agricultural activities with a variable volume of water according to its demand could condition their presence. The most frequent family was Corixidae (score 5), which contributes to a “regular” quality class, followed by Chironomidae (score 8). Despite reflecting a “bad” quality class, this family was found in low quantities, not negatively affecting the quality classes. The family that contributed most to a “regular” quality class was Baetidae (score 6) [14].
As per the physicochemical variables, it is noteworthy that, in the falls for each SS, the DO concentration decreased, and in no case was there a value equal to or greater than 7, which allows the development of aquatic life [7]. Aquatic insects from the Corixidae, Chironomidae, and Baetidae families were also found despite this DO deficiency. It is impossible to determine the same pattern of results in the case of pH since its values ranged between 7.3 and 9.2, with the highest value being found in SS4 in the fall (2018). Regarding EC, although the values fluctuated between 76 and 335 µs/cm, in all cases, a “low” EC can be considered for the other two water bodies. A possible explanation for these low values may be the geographical location; being close to the Andes Mountains, it may receive a lower influence of ion charge because of discharges from anthropic activities. Also, since the geology of an area determines the quantity and type of ions [36], this low EC could be determined mainly by its geology and geography. Another possible explanation for this temporal variation in the values of the physicochemical variables may be its artificiality, allowing it to be altered in its volume and, consequently, in the concentration of the elements that make up the variables above [21]. Also, the phenology of each insect family adjusts to the conditions of DO, pH, EC, and other variables (T, TSS, P, and N) that do not temporarily affect their life cycle. About the other water bodies, Chada had the best quality for aquatic life [7,8], mainly due to the DO and pH values, the latter with an acceptable level in all SS.

4.2. Global Analysis of the Three Water Bodies

The ACP to the water bodies evaluated generally coincided with the categorization made from the physicochemical variables, with a high degree of compliance in the EC, DO, pH, and TSS; however, they presented non-compliance in the temperature levels, with large fluctuations. This may be mainly due to the point sampling carried out on riverbanks on surface waters, where, due to the low depth, the temperature is like that of the environment, which varies between the spring and fall, considering the Mediterranean climate in the central zone of Chile [2].
Chada was the best-evaluated water body regarding the ACP, which coincides with the categorization from the physicochemical variables. This water body had a high degree of compliance in EC, DO, pH, and TSS. Through this analysis, temperature did not present any important tendency in the distribution of data; however, it influences very significantly the species of aquatic insects, determining their metabolism, primary productivity, respiration, and decomposition of organic matter; in addition, the temperature is closely related to DO, since at higher temperatures it decreases, which affects negatively water quality [37].
Based on the PCA, Batuco had the most unfavorable results for the water quality of the water bodies, coinciding with the water quality class obtained from the physicochemical variables separately. The negative correlation between FBI and DO can be explained by the fact that the greater the index value, the worse the quality. Meanwhile, DO tends to be greater when good water quality [14].
As previously noted, an inverse relationship between the FBI and DO variables was established using the PCA, which means that the greater DO, the lower the FBI value, and the lower values of the latter indicate a better water quality class [14]. For DO, low levels hinder the presence of aquatic life, an indicator of organic matter contamination [38].
From the discussion of the physicochemical variables in Carén, our results generally showed lower EC values than those obtained by the [34]. However, a greater concentration of the results was evident in DO, a situation like that occurring in Chada.
A positive correlation occurred between EC and TSS in the four Batuco SS, markedly separated from the other water bodies. This could be due to the very nature of this body, with high salinity values related to the EC, showing a unique situation that is not comparable to Chada or Carén. Along with these two variables, P had a similar trend, which was not reflected with N. However, the most important element to study the eutrophication processes is P, since, unlike N, it does not interact directly with the atmosphere, better reflecting what occurs in the water body [39]. Likewise, some studies establish that EC, as an indirect measure of the number of soluble ions, can cause phosphate precipitation [40,41]. Regarding P and pH, there was no relationship between both variables, so these variables appear independent, as determined by [42].

5. Conclusions

The incorporation of aquatic insects as bioindicators allows the ecosystem dynamic results to be evidenced through measurement sequences that reflect the interaction between physicochemical phenomena and anthropic disturbances of these bodies. The temporal analysis allowed the determination of a new physicochemical variable (TSS), which had a higher incidence and agreement with the biological variable (FBI). In the case of Chada, this study contributes to the conservation of this lentic body because it corresponds to the first record of water quality, constituting a basis for future studies. Additionally, the sequence of records of measurements carried out in the place would account for the dynamics of the ecosystem through the different seasons. Considering the diversity of these water bodies, it is possible to determine not only the water quality but also the conservation state of the whole environment.

Author Contributions

Conceptualization, A.H. and A.P.; methodology, A.H. and A.P.; statistical analysis, S.R. and F.V.; chemical analysis, A.P.; insect ID, A.H., A.P., S.R and, F.V. and J.A.: Supervision, A.H. and A.P.; Resources, A.H. and A.P.; Writing—Original draft preparation, A.H., A.P., S.R., F.V. and J.A.; Writing—Review and editing, A.H., A.P., S.R., F.V. and J.A.; project administration, A.H. and A.P.; funding acquisition, A.H. and A.P. All authors have read and agreed to the published version of the manuscript.

Funding

The research was supported by Project “Diversity of insects as bioindicators of continental water quality”, Framework Agreement (Universidad de Chile & LACRIM, PDI).

Data Availability Statement

The data are contained within this article.

Acknowledgments

The authors are thankful and sincerely appreciate the financial support through Project “Diversity of insects as bioindicators of continental water quality”, Framework Agreement (Universidad de Chile & LACRIM, PDI).

Conflicts of Interest

The authors declare no conflicts of interest.

References

  1. Formetta, G.; Marra, F.; Dallan, E.; Zaramella, M.; Borga, M. Differential orographic impact on sub-hourly, hourly, and daily extreme precipitation. Advances in Water Resources 2022, 159, 104084. [Google Scholar] [CrossRef]
  2. Tesser-Obregón, C. El agua y los territorios hídricos en la Región Metropolitana de Santiago de Chile. Casos de estudio: Tiltil, Valle de Mallarauco y San Pedro de Melipilla. Estudios Geográficos 2013, 74, 255–285. [Google Scholar] [CrossRef]
  3. Barría, P.; Chadwick, C.; Ocampo-Melgar, A.; Galleguillos, M.; Garreaud, R.; et al. Water management or megadrought: what caused the Chilean Aculeo Lake drying? Regional Environmental Change 2021, 21, 1–15. [Google Scholar] [CrossRef]
  4. Bruskotter, J.; Vucetich, J.A.; Dietsch, A.; Slagle, K.; Brooks; Nelson, M. Conservationists’ moral obligations toward wildlife: Values and identity promote conservation conflict. Biological Conservation 2019, 240, 108296. [Google Scholar] [CrossRef]
  5. Schultz, P. W.; Gouveia, V.; Cameron, L.; Tankha, G.; Schmuck, P.; Franěk, M. Values and their relationship to environmental concern and conservation behavior. Journal of Cross-Cultural Psychology 2005, 36, 457–475. [Google Scholar] [CrossRef]
  6. Rey, O.; Eizaguirre, C.; Angers, B.; Baltazar-Soares, M.; Sagonas, K.; Prunier, J.G.; Blanchet, S. Linking epigenetics and biological conservation: Towards a conservation epigenetics perspective. Functional Ecology 2020, 34, 414–427. [Google Scholar] [CrossRef]
  7. INN Chile (Instituto Nacional de Normalización Chile). Norma Chilena Oficial NCh 1333. Of. 78 modificada en 1987 “Requisitos de calidad de agua para diferentes usos”; INN Chile: Santiago, Chile, 1987. [Google Scholar]
  8. CONAMA (Comisión Nacional del Medio Ambiente, Chile). Guía para el establecimiento de las normas secundarias de calidad ambiental para aguas continentales superficiales y marinas; CONAMA: Santiago, Chile, 2004. [Google Scholar]
  9. Figueroa, R.; Soria, M.; Beltrán, M.; Correa-Araneda, J. Estudio de comunidades biológicas como bioindicadores de calidad de agua. In Estudio de comunidades biológicas como bioindicadores de calidad de agua; Chatata, B., Talavera, C., Villasante, F., Eds.; Universidad Nacional de San Agustín-CONCYTEC: Arequipa, Perú, 2016; pp. 23–34. [Google Scholar]
  10. Alvarado-Orellana, A.; Huerta-Fuentes, A.; Palma-Muñoz, A.; Rodríguez-Tobar, S. Variación estacional de la diversidad de coleópteros epigeos en la Laguna Carén (Santiago, Chile). Revista Colombiana Entomología 2018, 44, 266–272. [Google Scholar] [CrossRef]
  11. Chowdhury, S.; Dubey, V.K.; Choudhury, S.; Das, A.; Jeengar, D.; Sujatha, B.; Kumar, A.; Kumar, N.; Semwal, A.; Kumar, V. Insects as bioindicator: A hidden gem for environmental monitoring. Frontiers in Environmental Science 2023, 11, 1146052. [Google Scholar] [CrossRef]
  12. Figueroa, R.; Palma, A.; Ruiz, V.; Niell, X. Análisis comparativo de índices bióticos utilizados en la evaluación de la calidad de las aguas en un río mediterráneo de Chile: río Chillán, VIII Región. Revista Chilena de Historia Natural 2007, 80, 225–242. [Google Scholar] [CrossRef]
  13. Gobierno de Chile. 2011. Definición contenida, Guía para la Conservación y Seguimiento Ambiental de Humedales Andinos. Available online: https://bibliotecadigital.ciren.cl/server/api/core/bitstreams/45a24e5b-1b80-476d-9660-a01d14e971c7/content (accessed on 8th August 2024).
  14. Figueroa, R. Calidad ambiental de la cuenca hidrográfica del río Chillán, VIII Región, Chile. Ph.D. Thesis, Universidad de Málaga, Málaga, España, 2004. Dialnet. Available online: https://dialnet.unirioja.es/servlet/tesis?codigo=217023 (accessed on 8th August 2024).
  15. Laino-Guanes, R.M.; Bello-Mendoza, R.; González-Espinosa, M.; Ramírez-Marcial, N.; Jiménez-Otárola, F.; Musálem-Castillejos, K. Concentración de metales en agua y sedimentos de la cuenca alta del río Grijalva, frontera México-Guatemala. Tecnología y Ciencias del Agua 2015, 6, 61–74. [Google Scholar]
  16. Segnini, S.; Correa, I.; Chacón, M. Evaluación de la calidad del agua de ríos en los Andes venezolanos usando el índice biótico BMWP. In Enfoques y Temáticas en Entomología; Arrivillaga, J.C., El Souki, M., Herrera, B., Eds.; Sociedad Venezolana de Entomología: Caracas, Venezuela, 2009; pp. 217–254. [Google Scholar]
  17. Hinselhoff, W.L. Rapid field assessment of organic pollution with a family-level biotic index. Journal of the North American Benthological Society 1988, 7, 65–68. [Google Scholar]
  18. Badaracco, C.; Huerta, A.; Palma, A. Assemblage of riparian epigeal coleopteran of the Batuco wetland (Metropolitan Region, Chile). Gayana 2021, 85, 46–54. [Google Scholar]
  19. Universidad de Chile. 2017. Parque Carén: Pionera planta piloto de alimentos saludables inició su construcción. Available online: https://www.uchile.cl/noticias/137460/pionera-planta-piloto-de-alimentos-saludables-inicia-su-construccion (accessed on 8th August 2024).
  20. Universidad de Chile. 2024. Parque Carén-Universidad de Chile. Available online: https://caren.uchile.cl/presentacion/#parqueConclusions (accessed on 8th August 2024).
  21. Gobernación Provincial de Maipo. 2015. Tranque de Chada, riego y vida para la zona. Available online: www.gobernacionmaipo.gov.cl/noticias/tranque-de-chada-riego-y-vida-parala-zona/ (accessed on 8th August 2024).
  22. Camousseight, A. Estado de conocimiento de los Ephemeroptera de Chile. Gayana (Concepción) 2006, 70, 50–56. [Google Scholar] [CrossRef]
  23. Thyssen, P.J. Keys for Identification of Immature Insects. In Current Concepts in Forensic Entomology; Amendt, J., M. Goff, Campobasso, C., Grassberger, M., Eds.; Springer: Dordrecht, Netherlands, 2009; pp. 25–42. [Google Scholar]
  24. Di Rienzo, J.A.; Casanoves, F.; Balzarini, M.G.; González, L.; Tablada, M.; Robledo, C.W. InfoStat versión 2020; Centro de Transferencia InfoStat, FCA, Universidad Nacional de Córdoba: Córdoba, Argentina; Available online: http://www.infostat.com.ar (accessed on 8th August 2024).
  25. MOP-DGA (Ministerio de Obras Públicas-Dirección General de Aguas). Valores de los puntajes de FBI modificados para Chile; MOP-DGA: Santiago, Chile, 2010. [Google Scholar]
  26. INN Chile. Norma Chilena Oficial de Calidad de Agua NCh 411/1-4; INN Chile: Santiago, Chile, 1996. [Google Scholar]
  27. R Core Team. R: A language and environment for statistical computing; R Foundation for Statistical Computing: Vienna, Austria, 2016. [Google Scholar]
  28. Newall, P.; Tiller, D. Derivation of nutrient guidelines for streams in Victoria, Australia. Environmental Monitoring and Assessment 2002, 74, 85–103. [Google Scholar] [CrossRef] [PubMed]
  29. Mellado, C. Caracterización hídrica y gestión ambiental del Humedal Batuco. Master Thesis, Universidad de Chile, Santiago, Chile, 2008. [Google Scholar]
  30. Gesam Consultores Ambientales. Conservación, monitoreo y manejo para el humedal de Batuco, Línea de Base Ambiental; Gesam Consultores Ambientales: Santiago, Chile, 2018. [Google Scholar]
  31. The Nature Conservancy. 2018. Plan de manejo, Laguna de Batuco. Elaborado para Fundación San Carlos de Batuco. Available online: www.fsancarlos.cl/wp-content/uploads/2021/01/Plan-de-Manejo-Laguna-Batuco.pdf (accessed on 8th August 2024).
  32. MOP-DGA. Decreto 53; MOP-DGA: Santiago, Chile, 2020. [Google Scholar]
  33. SMA (Superintendencia del Medio Ambiente - Gobierno de Chile). Normas secundarias de calidad ambiental para la protección de las aguas de la cuenca del Río Maipo. Informe Técnico de Cumplimiento de Normas de Calidad del Agua; SMA: Santiago, Chile, 2020. [Google Scholar]
  34. Instituto Nacional de Investigación de Recursos Naturales (Chile). Suelos. Descripciones. Proyecto Aerofotogramétrico Chile/OEA/BID; IREN-CORFO: Santiago, Chile, 1964. [Google Scholar]
  35. Sandoval, J. El riego en Chile; Dirección de Obras Hidráulicas (DOH Chile) - Ministerio de Obras Públicas (MOP): Santiago, Chile, 2003. [Google Scholar]
  36. California Waterboard. (no date). Folleto informativo conductividad eléctrica/salinidad. Folleto Informativo 3.1.3.0. Available online: https://www.waterboards.ca.gov/water_issues/programs/swamp/docs/cwt/guidance/3130sp.pdf (accessed on 8th August 2024).
  37. Posada, E.; Mojica, D.; Pino, N.; Bustamante, C.; Monzón, A. Establecimiento de índices de calidad ambiental de ríos con bases en el comportamiento del oxígeno disuelto y de la temperatura. Aplicación al caso del río Medellín, en el Valle de Aburrá en Colombia. Dyna 2013, 80, 192–200. [Google Scholar]
  38. Michael-Kordatou, I.; Michael, C.; Duan, X.; He, X.; Dionysiou, D.D.; Mills, M.A.; Fatta-Kassinos, D. Dissolved effluent organic matter: Characteristics and potential implications in wastewater treatment and reuse applications. Water Research 2015, 77, 213–248. [Google Scholar] [CrossRef] [PubMed]
  39. Boyd, C.E. Eutrophication. In Water Quality; Boyd, C.E., Ed.; Springer: Cham, Switzerland, 2020; pp. 311–322. [Google Scholar]
  40. Carrera, D.; Crisanto, T.; Maya, M. Relación entre la composición química inorgánica del agua, la precipitación y la evaporación. Enfoque UTE 2015, 6, 25–34. [Google Scholar] [CrossRef]
  41. IEE (Instituto Espacial Ecuatoriano). 2013. Memoria Técnica Cantón Chone Proyecto: “Generación de Geoinformación para la Gestión del Territorio a Nivel Nacional, Escala 1: 25 000” Geomorfología, 2013. Available online: http://www.ideportal.iee.gob.ec/ (accessed on 8th August 2024).
  42. Carrera-Villacrés, D.; Guerrón-Varela, E.; Cajas-Morales, L.; González-Farinango, T.; Guamán-Pineda, E.; Velarde-Salazar, P. Relación de temperatura, pH y CE en la variación de concentración de fosfatos en el Río Grande, Cantón Chone. Congreso de Ciencia y Tecnología ESPE 2018, 13, 37–40. [Google Scholar] [CrossRef]
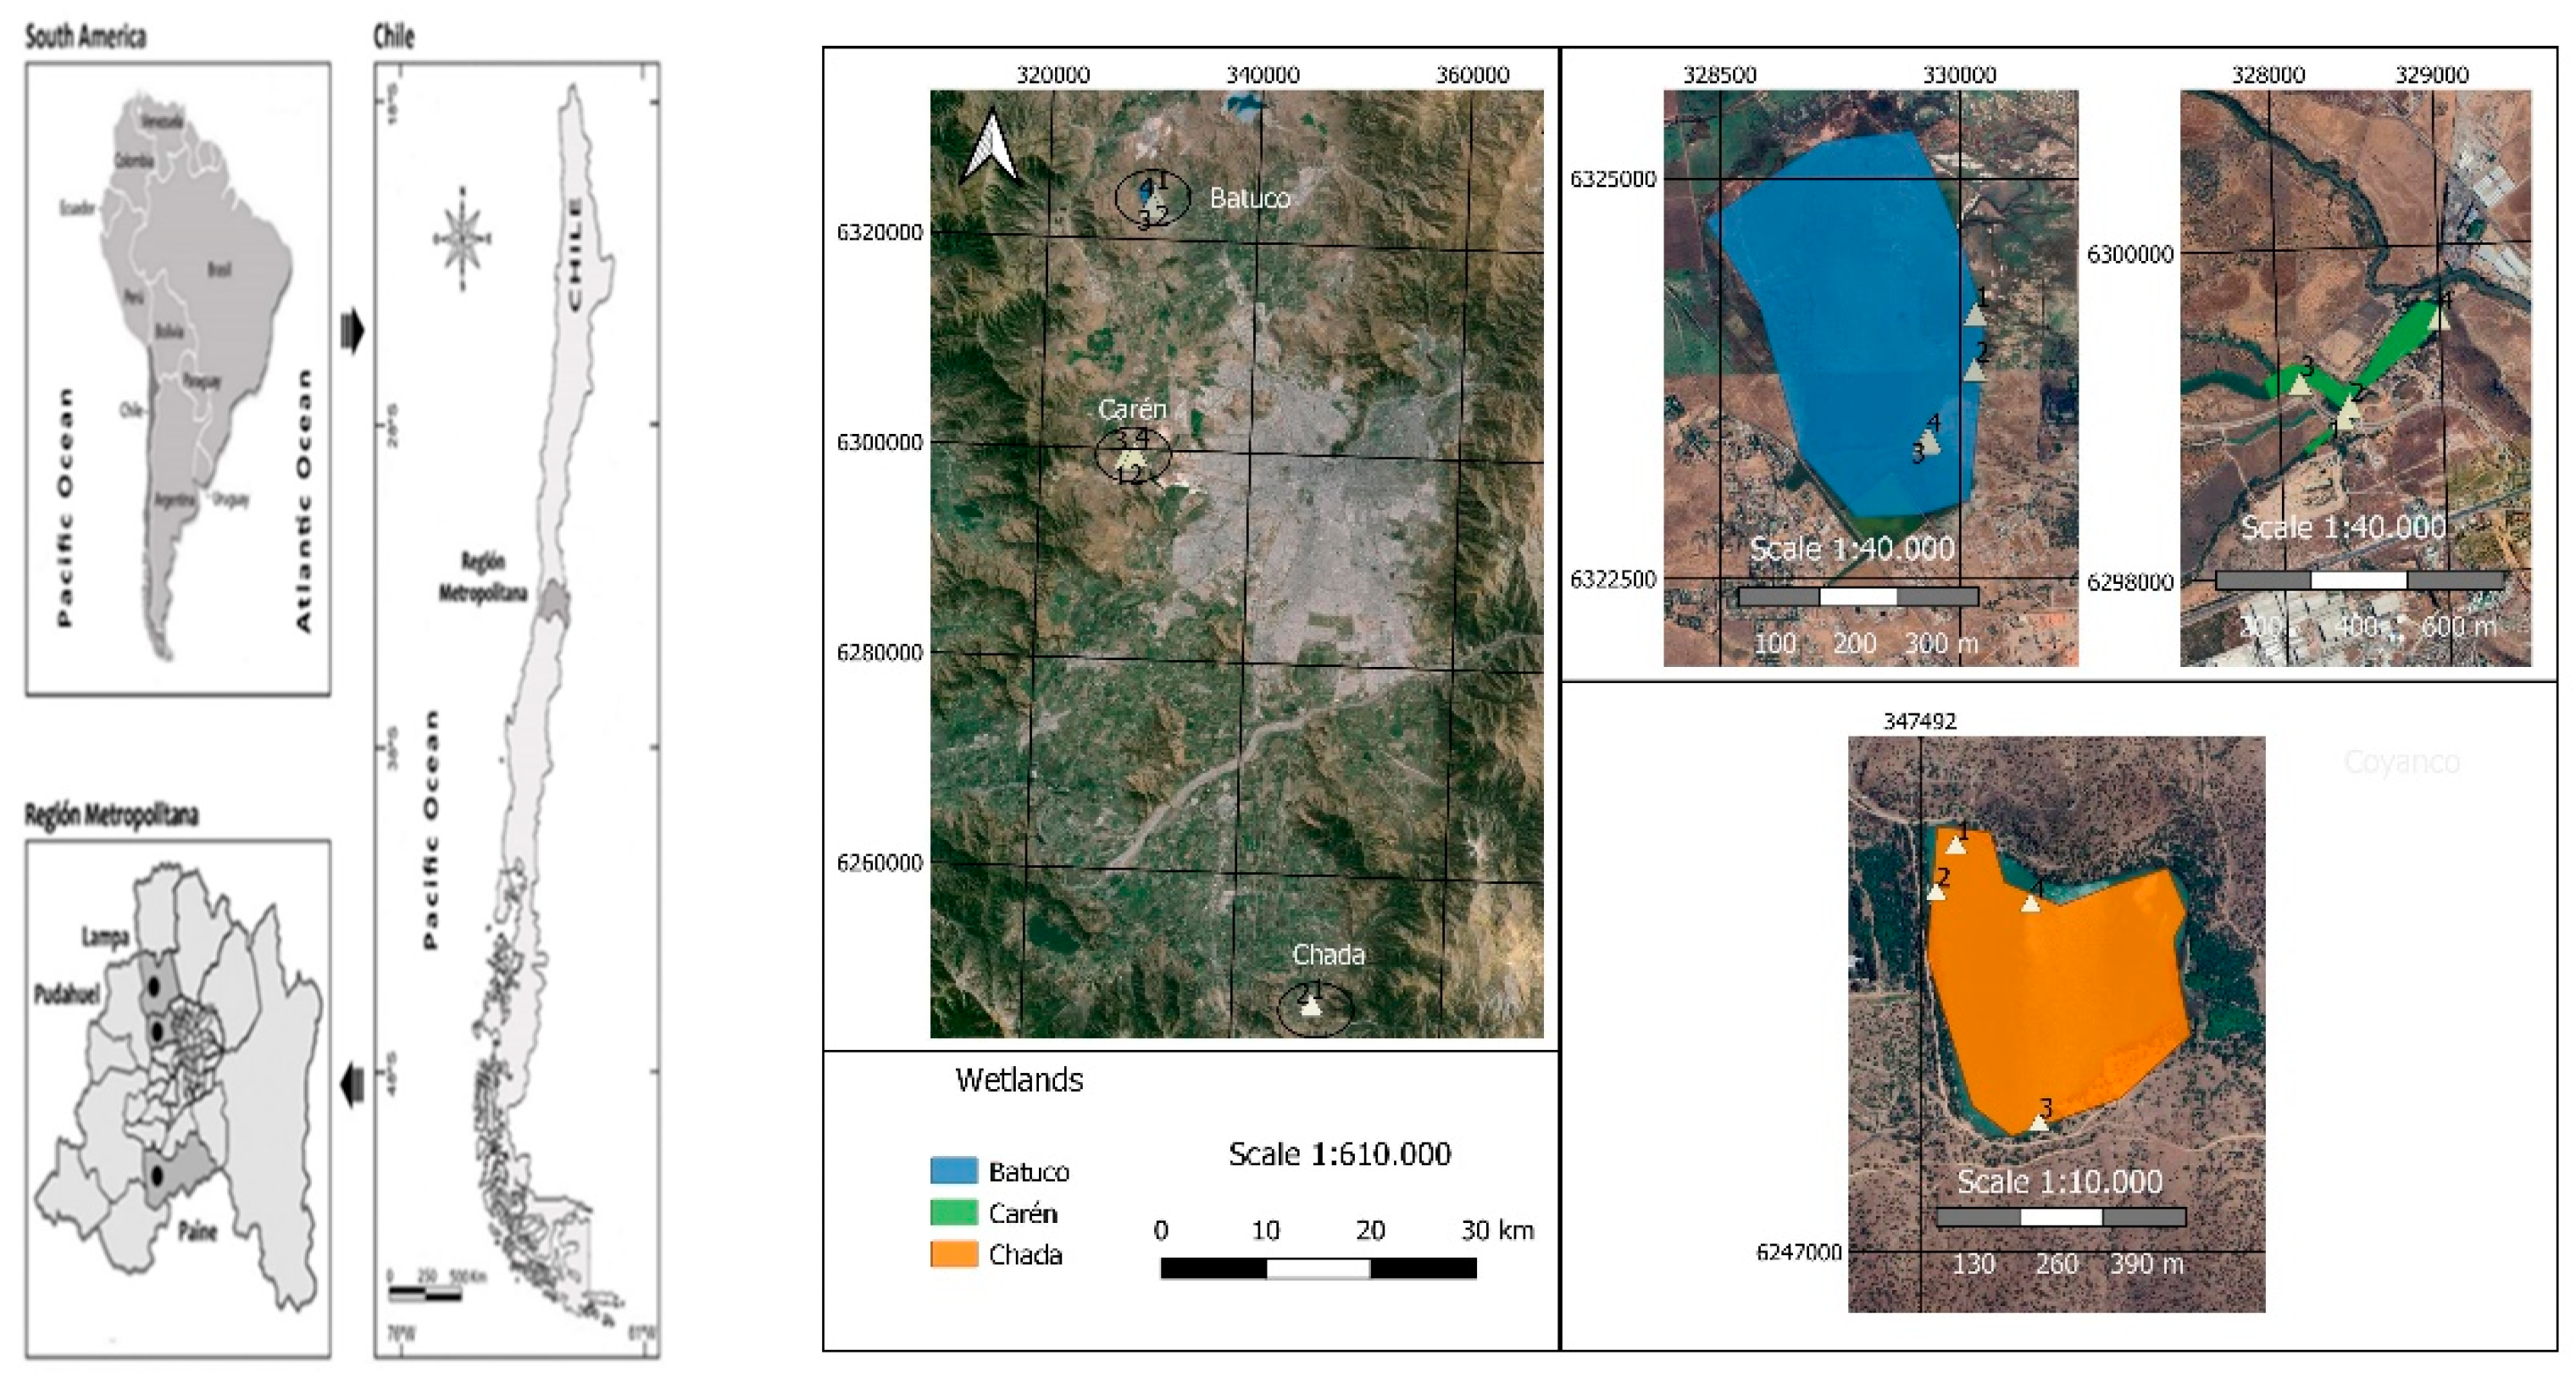
Figure 1. Geographic location of the three lentic bodies studied in the RM, Chile, with their four sampling stations (SS) (modified from Google 2018, Earth Pro ™ version 7.1.5.1557).
Preprints 115117 g001
Figure 2. Drawings of insect families identified in the water bodies. (a) Corixidae (Hemiptera), dorsal view; (b) Hydrophilidae (Coleoptera), ventral view. (c) Dytiscidae (Coleoptera) (adult), dorsal view; (d) Dytiscidae (larva), lateral view; (e) Baetidae (Ephemeroptera) (nymph), dorso-lateral view; (f) Baetidae (nymph), dorsal view.; (g) Culicidae (Diptera) (larva), dorsolateral view; (h) Chironomidae (Diptera) (larva), lateral view; (i) Aeshnidae (Odonata) (nymph), dorsal view; (j) Coenagrionidae (Odonata) (nymph), dorsal view. Courtesy of Carmen Tobar M., scientific illustrator.
Preprints 115117 g002
Figure 3. Abundance (ranges of individual numbers/L) of aquatic insect families by sampling station (SS), season, and year by water bodies, RM, Chile. (a) Batuco (n=598 individuals), (b) Carén (n = 209 individuals), c) Chada (n = 296 individuals).
Preprints 115117 g003
Figure 4. Abundance (mean ± SE) and richness (mean ± SE) of aquatic insects in lentic bodies of the Metropolitan Region by season and SS (n = 1,103 individuals). (a) Abundance in Batuco, (b) Richness in Batuco, (c) Abundance in Carén, (d) Richness in Carén, (e) Abundance in Chada, and (f) Richness in Chada. SS: Sampling station. SE: Standard error. Different upper- and lower-case letters indicate significant differences between SS (Dunn’s tests) and seasons (Mann-Whitney tests) (p < 0.05), respectively.
Preprints 115117 g004
Figure 5. Variation in temperature (T) (a), dissolved oxygen (DO) (b), electrical conductivity (EC)(c), total suspended solids (TSS) (d), pH (e), phosphorus (P) (f) and nitrogen (N) (g), in the three water bodies, SS, seasons and years.
Preprints 115117 g005
Figure 6. Family Biotic Index (FBI) values in the SS, seasons, and years by water bodies.
Preprints 115117 g006
Figure 7. Water quality class classification considering the Family Biotic Index (FBI), and from the Chilean Standard NCh 1.333 (INN Chile, 1987) and guide (CONAMA, 2004) with dissolved oxygen (DO) and temperature (T) in the water bodies, SS, seasons and years. (a) FBI in Batuco, (b) FBI in Carén, (c) FBI in Chada, (d) DO in Batuco, (e) DO in Carén, (f) DO in Chada, (g) T in Batuco, (h) T in Carén, and (i) T in Chada.
Preprints 115117 g007
Figure 8. Principal component analysis (PCA) from their axes with the three lentic bodies’ physicochemical and biological (FBI) water quality variables. (a) PC1 concerning PC2 (variables), (b) PC1 concerning PC2 (SS), (c) PC1 with PC3 (variables), and (d) PC1 with PC3 (SS).
Preprints 115117 g008
Disclaimer/Publisher’s Note: The statements, opinions and data contained in all publications are solely those of the individual author(s) and contributor(s) and not of MDPI and/or the editor(s). MDPI and/or the editor(s) disclaim responsibility for any injury to people or property resulting from any ideas, methods, instructions or products referred to in the content.
Copyright: This open access article is published under a Creative Commons CC BY 4.0 license, which permit the free download, distribution, and reuse, provided that the author and preprint are cited in any reuse.
Prerpints.org logo

Preprints.org is a free preprint server supported by MDPI in Basel, Switzerland.

Subscribe

© 2024 MDPI (Basel, Switzerland) unless otherwise stated