1. Introduction
China boasts substantial shale gas reserves, with its recoverable reserves comprising approximately 32% of the total recoverable natural gas reserves. Shale gas has emerged as a clean and efficient energy resource, positioning it as an exceptionally promising alternative to traditional natural gas sources [
1,
2]. The revolution in shale gas extraction technology, initiated in North America, has progressively advanced in the southern Sichuan region for medium-deep shale gas development, achieving a significant level of success. Deep shale gas, residing at burial depths of 3500-4500 m, represents a pivotal resource, with an estimated reserve of 8.7×10
12 m
3, which accounts for 87% of the total shale gas resources at burial depths below 4500 m. This has earmarked it as a strategic priority for future exploration and development endeavors [
3]. However, the research on deep shale gas development is impeded by the high-temperature and high-pressure reservoir conditions, along with the intricate pore structure of shale, which has resulted in an immature state of related development technology. There is an urgent need for further clarification on the characteristics of gas and water storage [
4].
Typically, primary shale reservoirs contain some water, and hydraulic fracturing is frequently utilized to improve permeability within these reservoirs. Post-fracturing fluid backdrafting, a portion of the water remains sequestered within the formation [
5,
6]. Shale is characterized by a substantial content of inorganic minerals and a minor fraction of organic matter [
7]. Kerogen, the predominant organic component, makes up over 80% of the total organic matter [
8]. Inorganic minerals exhibit pronounced hydrophilic properties, facilitating water retention. Concurrently, the polar functional groups on the kerogen skeleton also display hydrophilicity, leading to the formation of water clusters on its surface and imparting mixed wettability to the organic matter [
9,
12].
Beyond the shale rock types, the pore structure significantly influences the distribution of water. Li et al. [
13] found through theoretical calculations, compared to slit pores, circular pores have stronger wall interactions, enhancing the water film thickness within the aperture under identical conditions and increasing susceptibility to capillary condensation. Zhang et al. [
14] investigated the water distribution characteristics within the pores of shale from the Lower Silurian Longmaxi Formation in southern Sichuan using isothermal adsorption experiments. The findings indicate that small pores (<5 nm) in clay-rich shale samples are entirely filled by water molecules, while the surfaces of larger pores are predominantly covered by a water film. Moreover, water competes with shale gas for adsorption on the surfaces of inorganic minerals and at hydrophilic/neutral adsorption sites on organic matter. This competition not only diminishes the shale's adsorption capacity significantly but may also obstruct gas flow channels [
15,
16,
17,
18,
19]. Shale reservoirs are highly heterogeneous, with a mixed distribution of organic and inorganic matter and varying wettability. The formation of nanopores of diverse sizes and shapes creates a complex pore network, leading to an intricate distribution of gas and water within these reservoirs [
20]. Therefore, elucidating the occurrence characteristics of methane/water in shale nanopores is crucial for shale gas resource assessment and production dynamics evaluation.
The occurrence of methane/water in shale has primarily been studied through isothermal adsorption experiments [
21,
22] and molecular simulation methods [
23,
24,
25,
26,
27,
28,
29,
30,
31]. Isothermal adsorption experiments face limitations in observing the gas-water distribution characteristics within shale nanopores. In contrast, molecular simulation can examine these characteristics at the microscopic scale by constructing realistic shale nanopore models. Previous molecular simulation studies on the gas/water distribution in shale have predominantly employed single-medium models, such as those of illite [
23], kerogen [
24,
25,
26], and montmorillonite [
27]. Sui et al. [
27] explored the impact of cation exchange on the gas/water distribution in a montmorillonite slit model, demonstrating that water molecules adsorb to the pore walls and cluster around cations, thereby effectively inhibiting methane adsorption. Huang et al. [
25] identified two forms of water distribution in kerogen under varying water content conditions, with water molecules migrating and aggregating into clusters within the pore centers at high water content levels, exposing functional groups available for gas adsorption.
However, the aforementioned single-medium models fail to capture the mixed distribution of organic and inorganic matter in shale reservoirs and are insufficient for studying the actual gas/water distribution characteristics in shale. Consequently, some researchers have endeavored to develop composite pore models for shale [
29,
30,
31]. Wu et al. [
29] built a shale organic and inorganic composites by adsorbing kerogen fractions on silica surfaces. Hantal et al. [
30] initiated contact between the surfaces of a bulk phase illite model and a bulk phase amorphous carbon model, simulating the annealing of the composite model using a reactive force field to form new chemical bonds at the contact surfaces, effectively constructing a molecular model of the shale organic-inorganic composite. Huang et al. [
31] created a composite molecular model of montmorillonite-kerogen by inserting kerogen molecules into the slits of sodium-montmorillonite and employing the dummy particle approach to expand the pore size distribution in the model.
The current composite pore models for shale, which are a simple fusion of organic and inorganic matter, are limited by their small size, relatively simple pore structure, and lack of nanoslits. The pore composition of these models significantly deviates from the actual shale pore composition, diminishing their representativeness of real shale.
In light of these limitations, this work proposes a set of molecular modeling methods for complex nanoscale pore-slit media in shale. By integrating the characterization results of shale pore composition and type, and building upon our previously established deep shale kerogen unit [
32], we have developed a molecular model of complex nanoporous media of deep shale. Utilizing molecular simulation methods, this study delves into the microdistribution characteristics of methane/water within the complex nanoporous medium of deep shale under the high-temperature and high-pressure reservoir conditions.
2. Methodology
2.1. Molecular Modeling of Complex Nanoporous Media of Deep Shales
In this study, we focus on the deep Longmaxi Formation shale within the Luzhou block of the Sichuan Basin, China. Utilizing the high-resolution scanning electron microscope modular automated processing system technique, we quantitatively characterize the shale pore and slit compositions to develop a molecular model that accurately reflects the intricate shale porous structure. The resulting normalized pore and slit compositions are detailed in
Table 1.
As demonstrated in
Table 1, the shale samples exhibit minimal variation in normalized pore and slit compositions, with the maximum absolute deviation from the mean value across samples from different wells being less than 3%. This consistency justifies the use of the mean pore and slit compositions to construct a representative nanoporous media model for the target shales. Organic pores constitute the majority of the shale's pore system, with a mean pore composition of 79.22%. Inorganic pores and slits are present in lesser compositions, with organic slits being the least abundant. This quantitative characterization underscores the predominance of organic pores in the deep Longmaxi Formation shale, providing a foundation for our subsequent modeling.
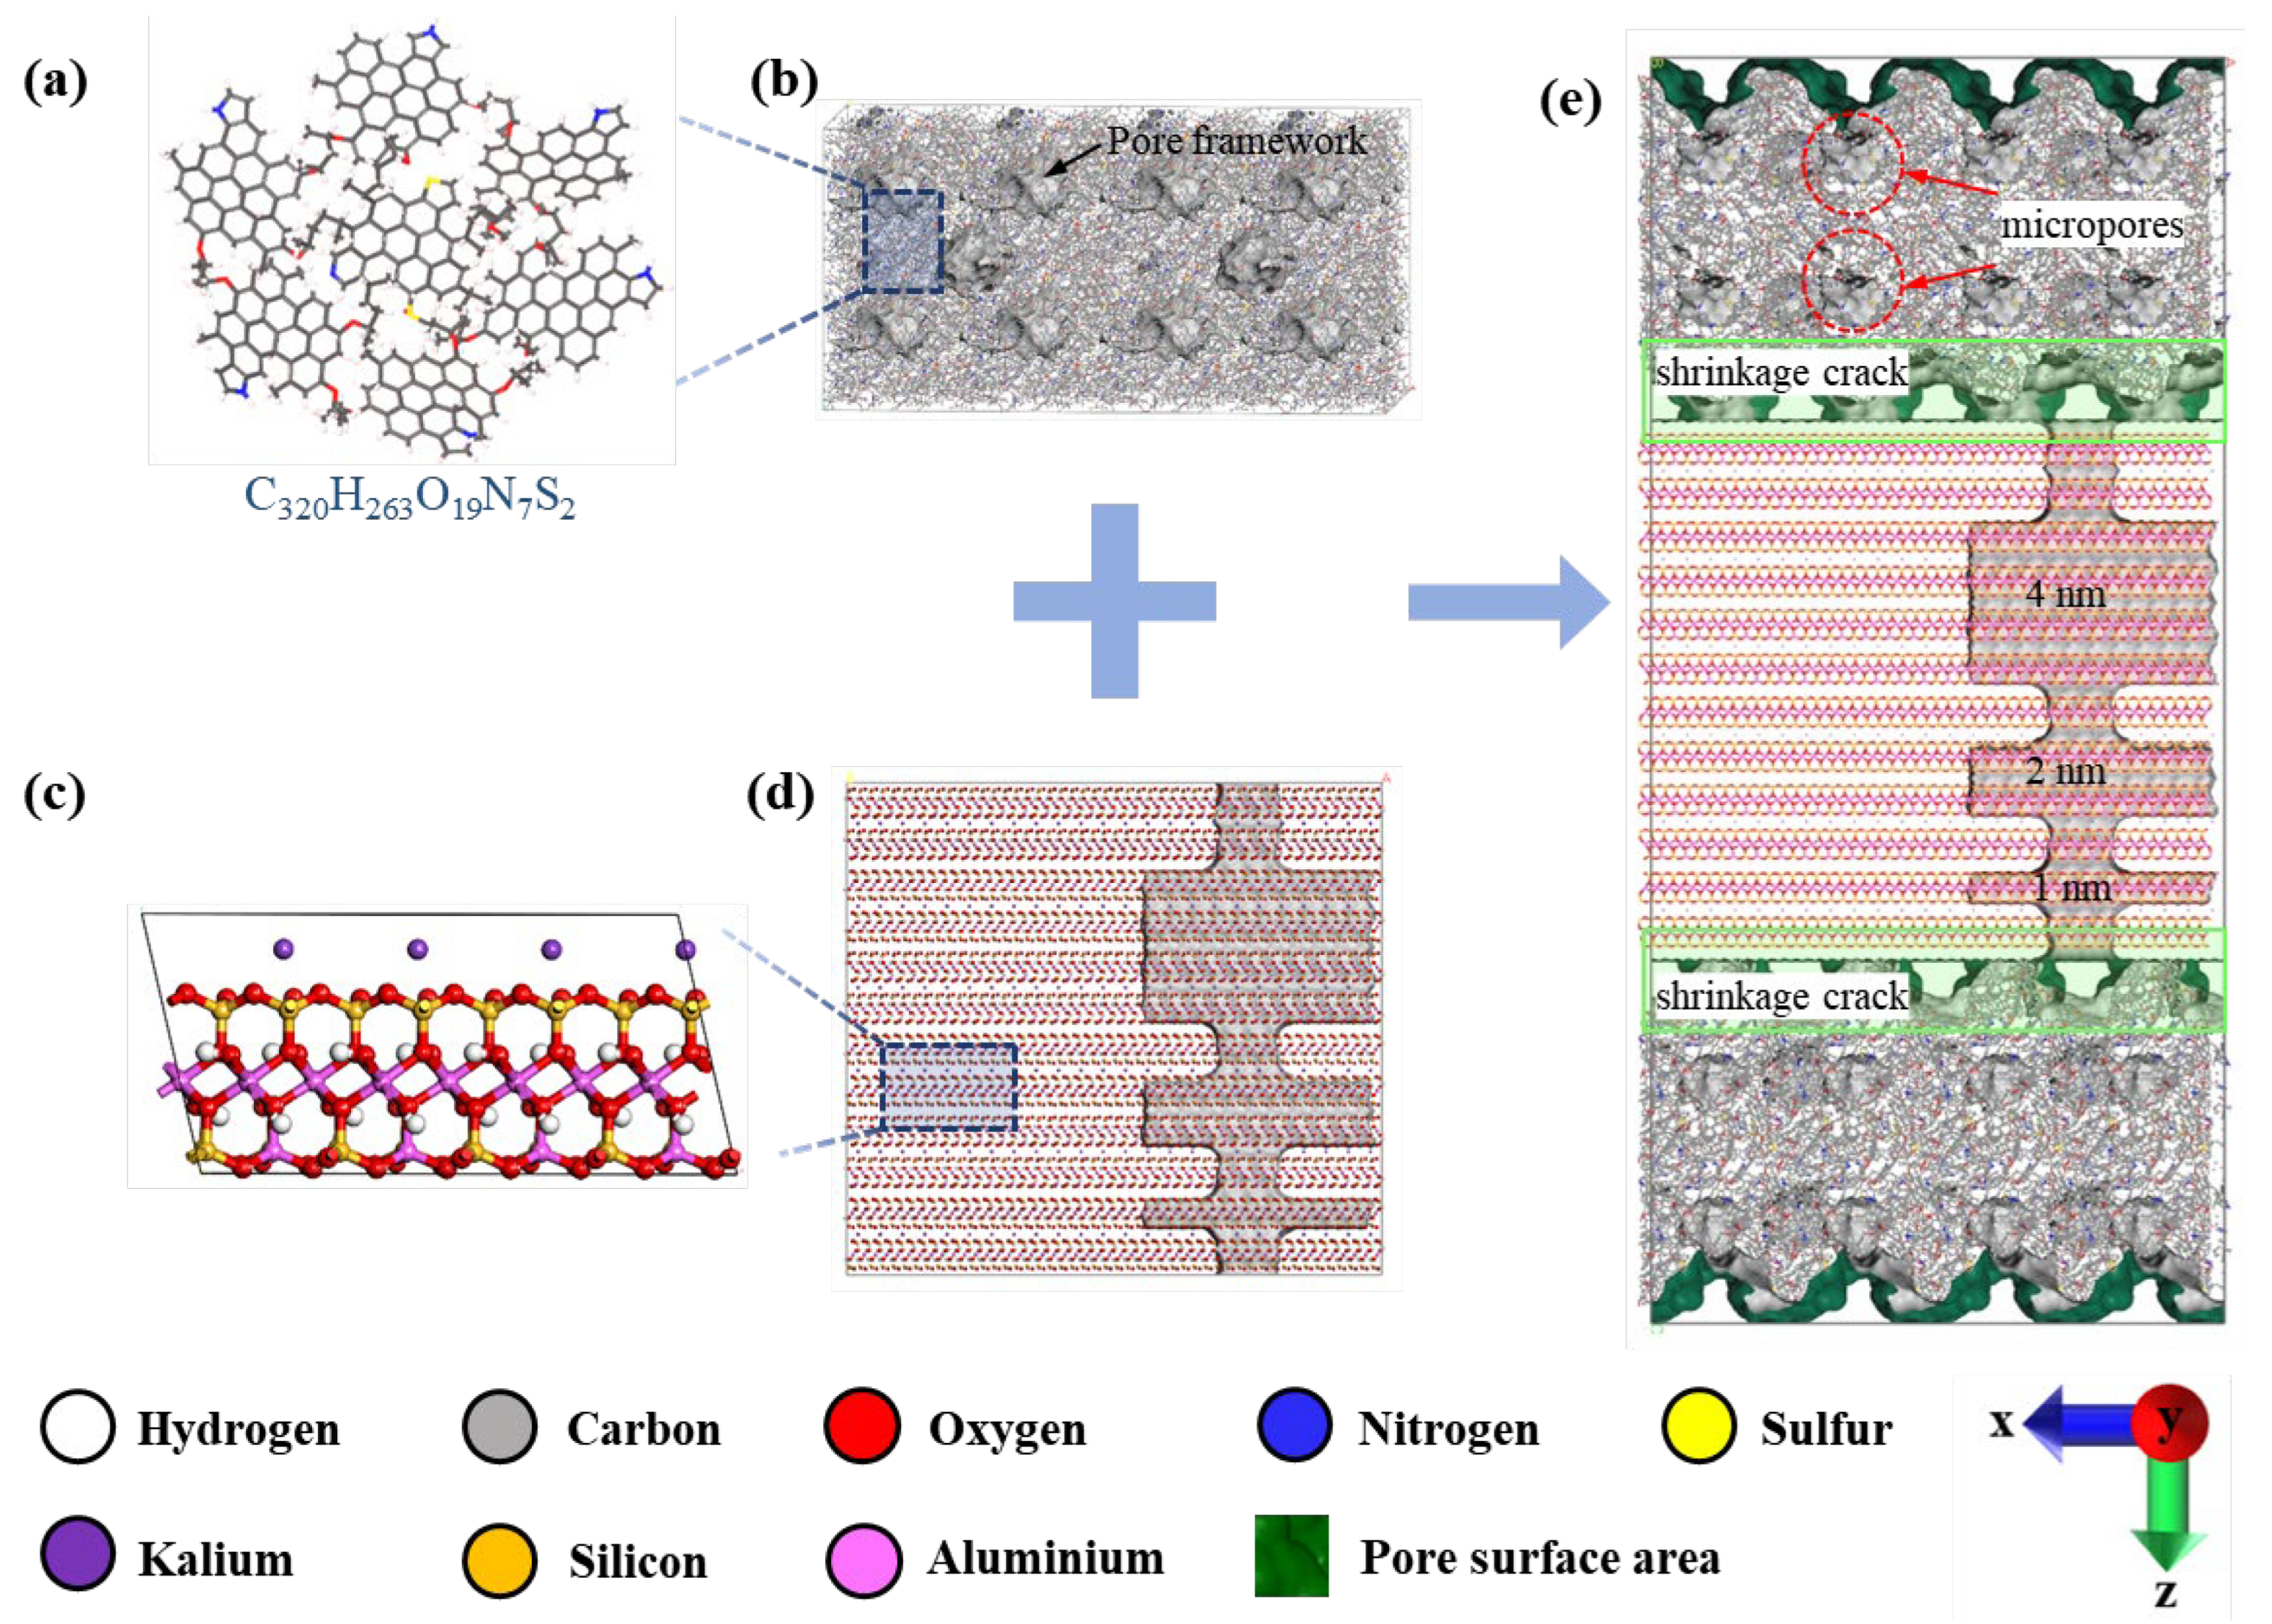
The scanning electron microscopy reveals a pronounced abundance of micropores and ultramicropores within the organic matrix of the deep shale samples from the targeted formation. These pores exhibit a relatively uniform distribution, indicative of a pervasive network throughout the organic matter. Additionally, we observe a higher frequency of slit-like inorganic pores, which are predominantly aligned in parallel orientations. The interface between organic and inorganic media is characterized by the formation of slit-like pore spaces, primarily attributed to the shrinkage of organic matter.
The shale mineral composition analysis further identifies illite as the predominant inorganic clay mineral present in the target shale [
23], with its structural unit depicted in
Figure 1(c). The organic matter is characterized by the kerogen structural unit we previously constructed for the targeted deep shale [
32] (
Figure 1a), having the chemical formula C
320H
263O
19N
7S
2.
In light of these characteristics, this work endeavors to construct a molecular model that encapsulates the complexity of the nanoporous media of the deep shales, incorporating dual rock types and a diversity of pore types. This comprehensive approach aims to provide a more accurate representation of the subsurface nanoporous structure of shale, essential for understanding the storage behavior of water and methane.
In this study, the methodology for constructing the kerogen matrix is founded on our previous research [
32]. The kerogen matrix is characterized by ultramicropores with size less than 7 Å. We have developed the organic pore block for the target shale based on the kerogen matrix. To augment the pore space within the model, we introduced spherical micropores with a diameter of 16 Å in the center of the kerogen matrix using a deletion method. These introduced micropores merged with the pre-existing intermolecular ultramicropores, significantly expanding the model's pore volume. The kerogen matrix model, now enhanced with micropores, was uniformly scaled up by a factor of two along the x and y axes. Subsequently, additional micropores of 16 Å were created at the center of the expanded model. The final step involved extending the kerogen matrix model by a factor of two along the x and z axes, yielding the organic pore block model depicted in
Figure 1(b). The dimensions of this extended model are 129.5 Å, 64.7 Å, and 64.7 Å along the x, y, and z axes, respectively.
The illite matrix was crafted from the established illite molecular model. The illite molecular model was sectioned along the cleavage plane (001), with each slice consisting of two illite TOT layered structures. The x- and y-axis dimensions of the illite model were refined to match the dimensions of the extended organic pore block. The illite matrix was then uniformly extended along all three axes, culminating in the formation of the extended illite block model. The dimensions of this illite block correspond to those of the organic block in the x and y axes, measuring 129.5 Å and 64.7 Å, respectively. The z-axis dimension of the illite block model, set at 119.2 Å, was determined based on the required size of the inorganic pores to be integrated into the model. The illite block model lacks ultramicropores accessible to methane molecules. To account for pore size effects, this study created three types of inorganic pores with varying heights (40 Å, 20 Å, and 10 Å). These pores are parallel and uniform in length and width, with specific dimensions determined by aligning with the shale's pore and slit composition. An inorganic slit was created in the illite block model to construct the illite pore-slit block model (
Figure 1(d)). The inorganic slit, aligned with the z-direction and traversing the three distinct heights of inorganic pores, has identical dimensions in length and width, calibrated to fit the shale's pore and slit compositions.
The composite pore-slit model for the target shale integrates the organic pore block model with the inorganic pore-slit block model. The organic and inorganic blocks, along with an inverted organic block, are superimposed along the z-axis. During this stacking process, adjustments to the periodicity of the organic block model in the z-direction lead to irregular contact surfaces between the organic and inorganic blocks. This irregularity fosters the creation of organic-inorganic slit pores. By refining the organic-inorganic slit pores and the dimensions of the illite slits, the pore and slit compositions of the model are calibrated to match these of the shale samples, culminating in the shale composite nanoporous media model (
Figure 1(e)).
2.2. Simulation and Calculation Details
In this study, the molecular models are constructed using the Materials Studio software [
33], the molecular simulations are implemented using the Large-Scale Atomic/Molecular Massively Parallel Simulator (LAMMPS)[
34], and the post-processing analysis is performed using the VMD software[
35]. The CVFF[
36] and ClayFF[
37] force fields are employed to describe kerogen and illite, respectively. The TraPPE united-atom force field[
38] and the SPC/E force field[
39] are employed to describe methane and water, respectively. The Van der Waals interactions are truncated at a radius of 12.5 Å. The electrostatic interactions are calculated using the Ewald summation method. The simulation step is set as 1 fs. The temperature is maintained by the Nosé -Hoover thermostat.
To recover the water distribution under reservoir conditions, the grand canonical Monte Carlo (GCMC) method was first used to load a fixed number of water molecules into the shale model, and then the molecular dynamics (MD) method was used to equilibrate the water distribution. The equilibrium of methane is achieved based on the shale model after water recovery utilizing the hybrid GCMC and MD methods. Furthermore, the pressure is converted to fugacity as an input parameter in the simulation through the Peng-Robinson equation [
40]. According to the high temperature and high pressure conditions of the targeted deep shale reservoir, the simulation pressure is 100 MPa and the temperature is 120 °C. For each GCMC simulation, 3×10
7 steps are simulated to reach the equilibrium state, and then 3×10
7 steps are simulated to produce the equilibrium data. The shale composite model remains fixed during MD simulations, and methane/water molecules are free to move.
The free pore volume in the shale model is calculated using the probe method proposed by Connolly [
41]. Probe molecules with a fixed radius are randomly inserted into the simulated system and the probes roll over the atomic van der Waals surface to determine the solid backbone surface, and the region wrapped around the backbone surface is identified as the free pore volume. The pore size distribution curve is calculated based on the contact area in the solid skeleton obtained by the Metropolis Monte Carlo integration method [
42].
In this paper, to quantitatively describe the water content in the shale composite nanopores, the water content is defined as the ratio of the pore volume occupied by water molecules to the original pore volume [
40]. The probe corresponding to the size of helium molecules is used to detect the pore volume of the shale model before and after water occupation, and the water content is calculated by equation (1).
Wherein, Sw is the water content, %; is the pore volume after water adsorption, Å3; is the original pore volume, Å3.
The number density profile can quantitatively characterize the adsorption characteristics of methane and water along a certain direction in the shale composite model. The fluid number density can be calculated by, equation (2).
Wherein is the fluid number density at a certain region in the shale model, N/Å3; n is the fluid molecular number at a certain region in the shale model, N; V is the volume of the certain region in the shale model, Å3.
Radial distribution function (RDF) represents the occurrence probability of a particle at a given distance from the reference particle, which can reflect the interaction between the two particles. In this work, RDF is used to analyze the preferential adsorption sites of water and methane in the shale model. The calculation formula for RDF is as follows.
Wherein, is RDF, is the number of particle B surrounding particle A within the range of and , is the total number of particles, is the distance from the reference particle, is the distance difference, is a certain simulation time, is the total simulation time.
3. Results and Discussion
3.1. Water Microdistribution Characteristics
3.1.1. Spatial Distribution Characteristics of Water
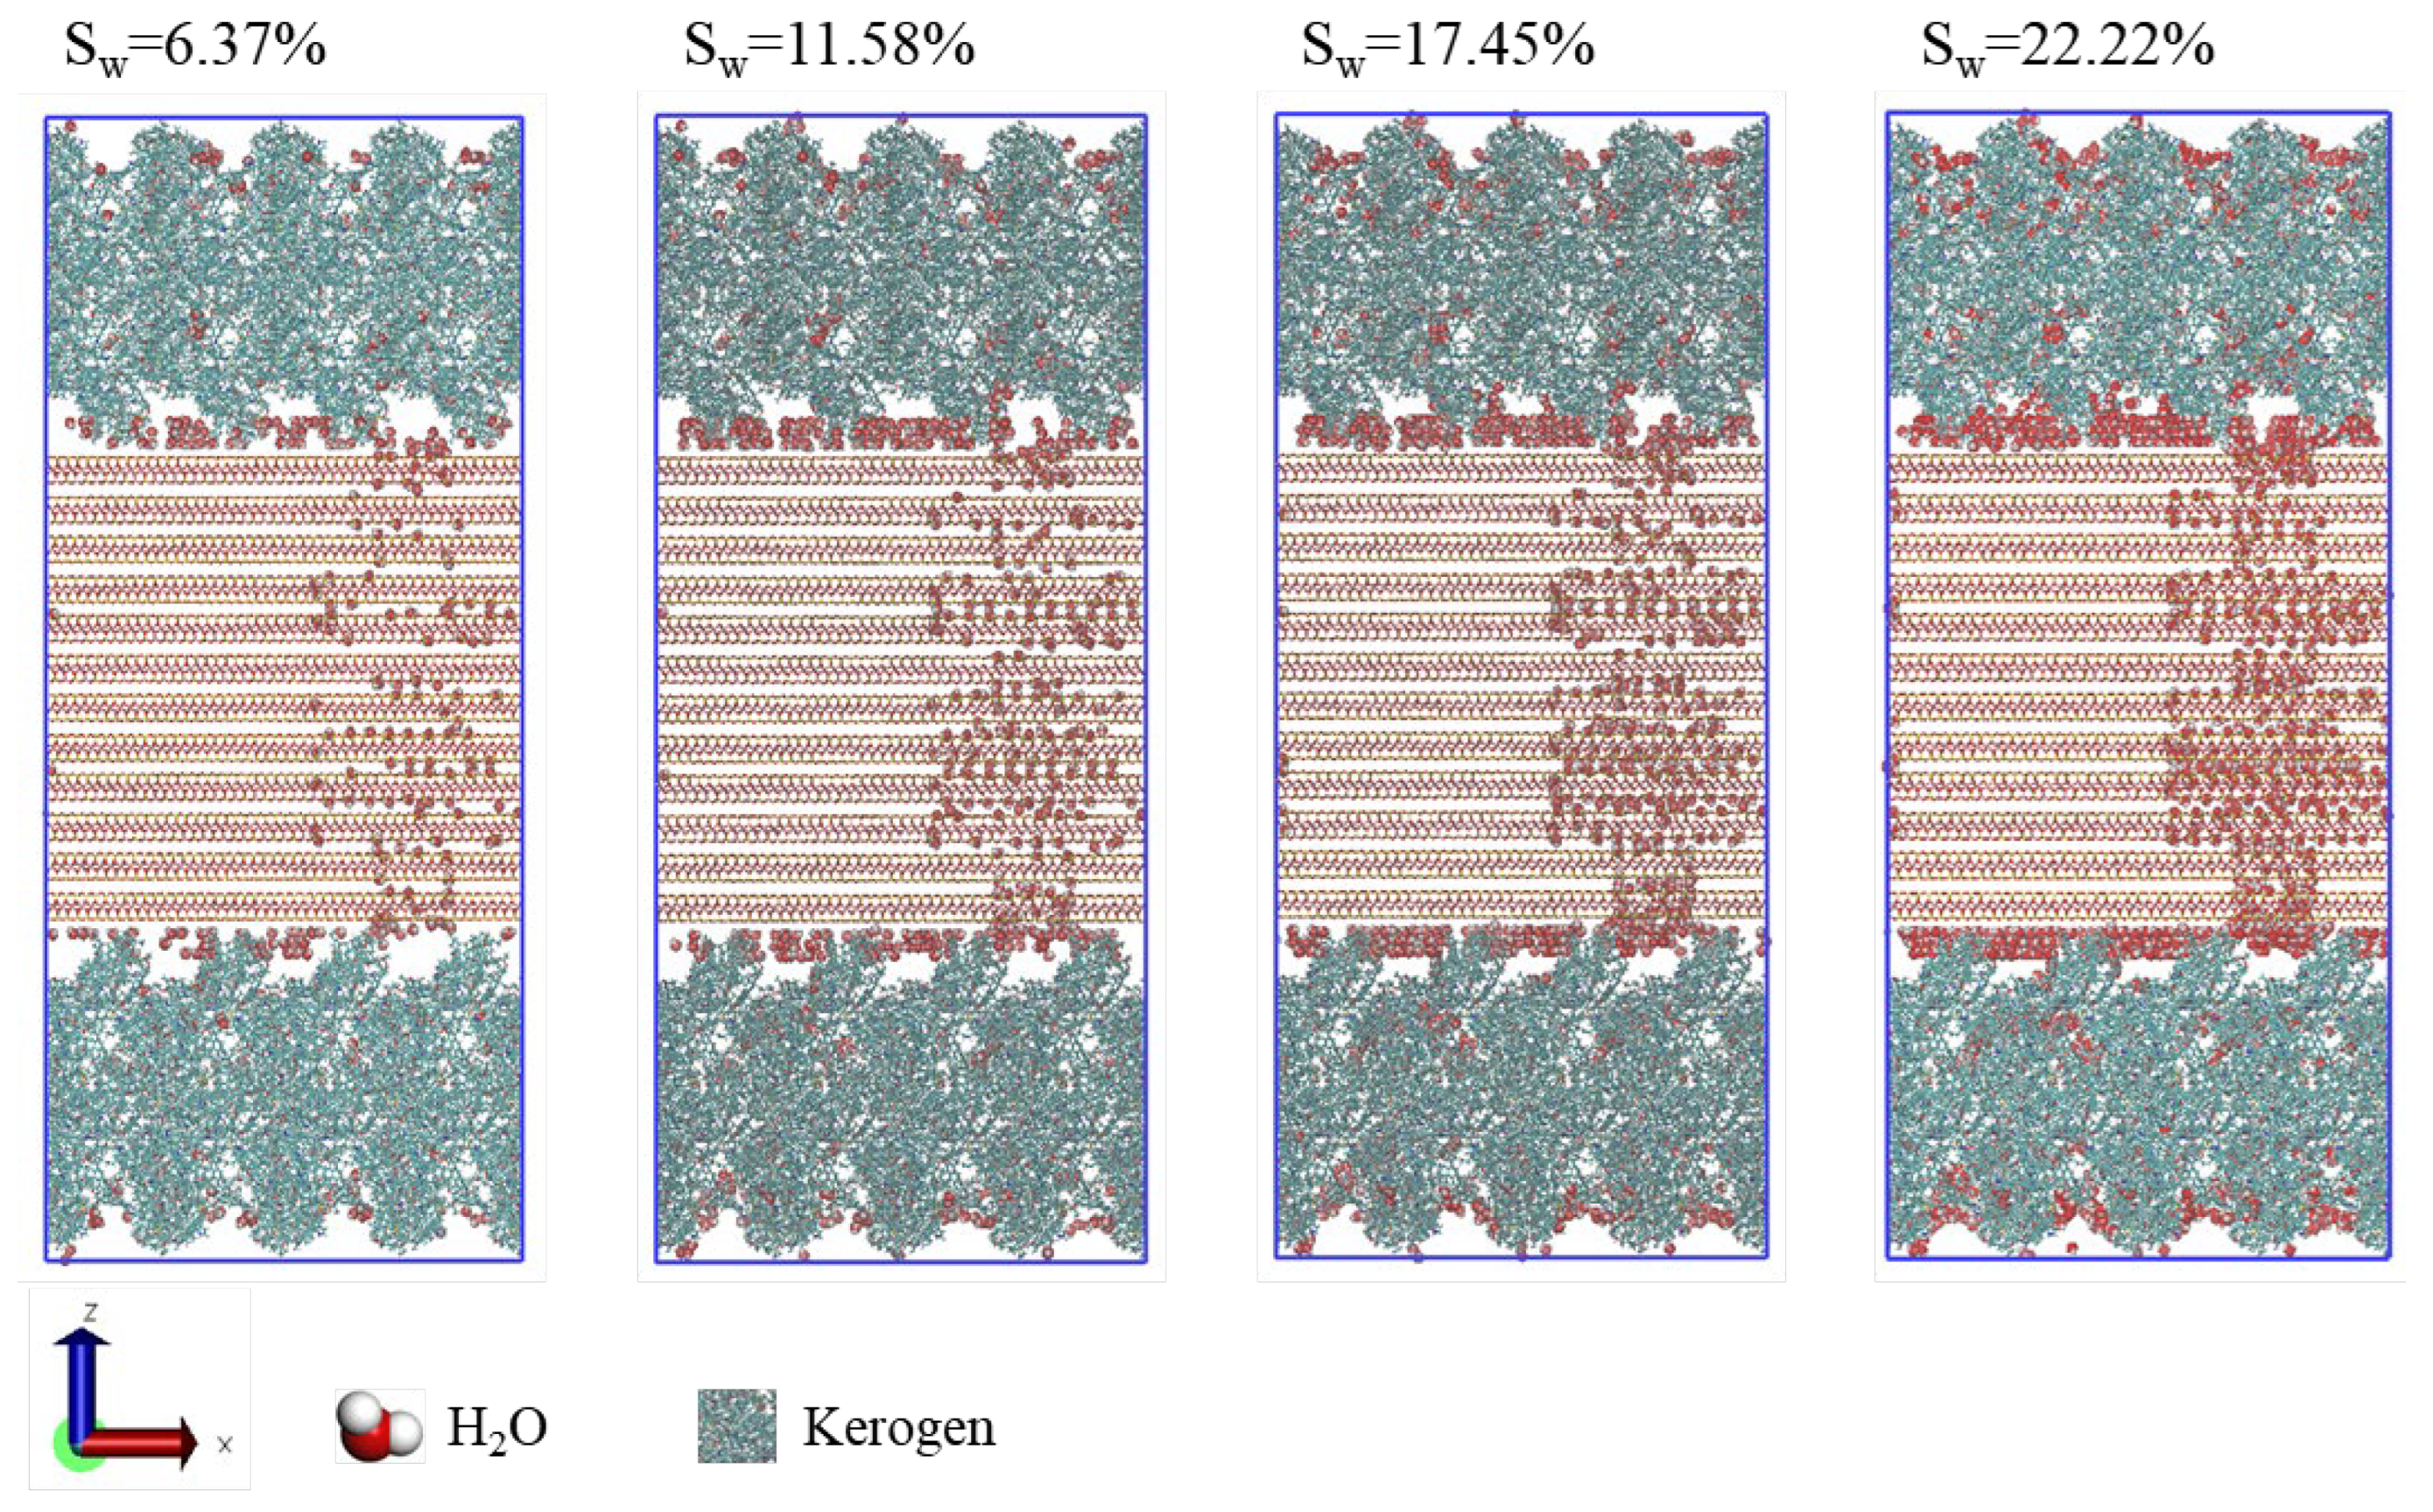
Figure 2 illustrates the equilibrium distribution of water within the shale model under varying water contents. Within the micropores of the kerogen, water molecules are adsorbed onto the pore wall surfaces, eschewing aggregation into clusters at the pore centers. The presence of heteroatom polar sites within the kerogen framework endows the surface with mixed wetting characteristics and a substantial water adsorption capacity [
43]. Water molecules tend to aggregate and adhere to the illite surfaces, particularly at the shrinkage cracks between organic and inorganic matter, underscoring the strong hydrophilic nature of shale illite. In contrast to their behavior in kerogen, water molecules within the illite pores and slits exhibit a more pronounced dispersion, rather than forming clusters. This suggests that the illite surface harbors a multitude of energetic sites that engage water molecules more effectively than hydrogen bonding between water molecules. As water content increases, there is a concomitant rise in the presence of water molecules within the kerogen, illite, and shrinkage cracks, yet the equilibrium distribution of water maintains a consistent pattern across different water contents.
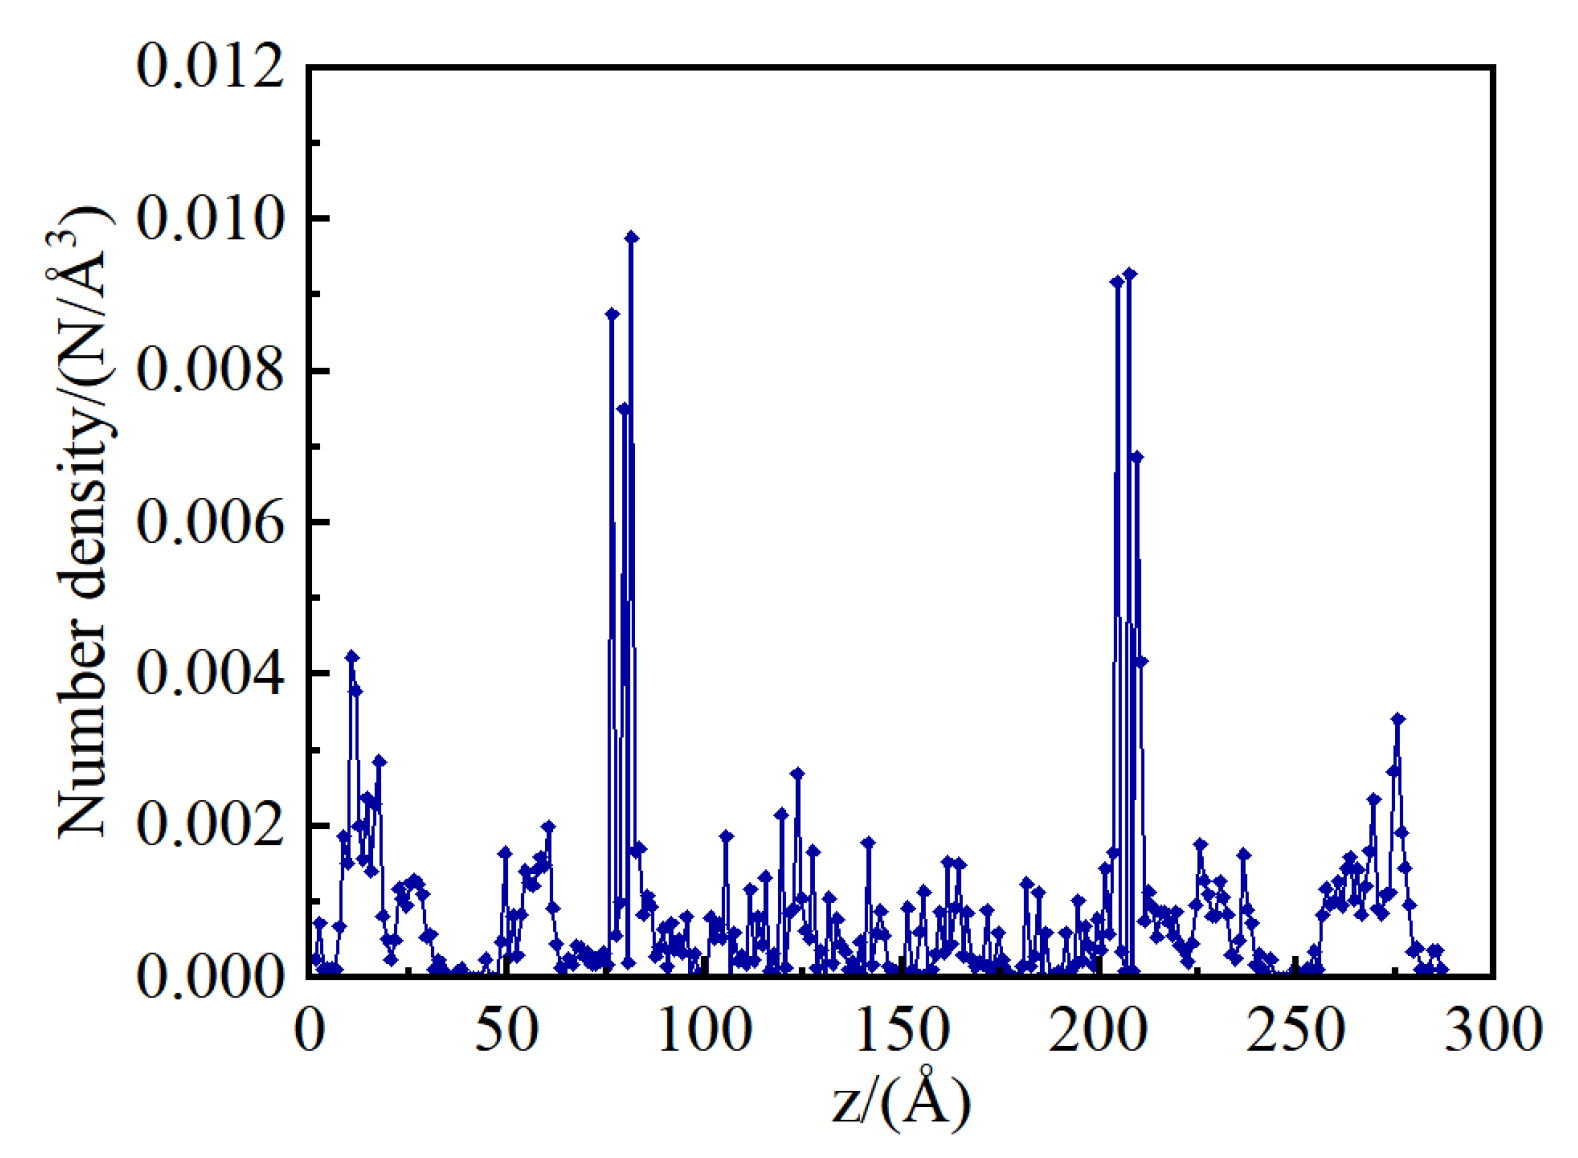
Figure 3 presents the water number density profiles along the z-axis within the shale model at a water content of 22.22%. In the shrinkage cracks, water molecules accumulate on the illite surfaces, manifesting as three distinct density peaks that correspond to the three layers of water adsorption. Within the kerogen micropores, water molecules are adsorbed and form aggregated number density peaks on the pore surfaces. In the illite pores, distinct number density peaks are less apparent, with water molecules primarily adsorbed in a dispersed manner at the high-energy sites on the pore walls.
3.1.2. Effect of Water on Pore Structure
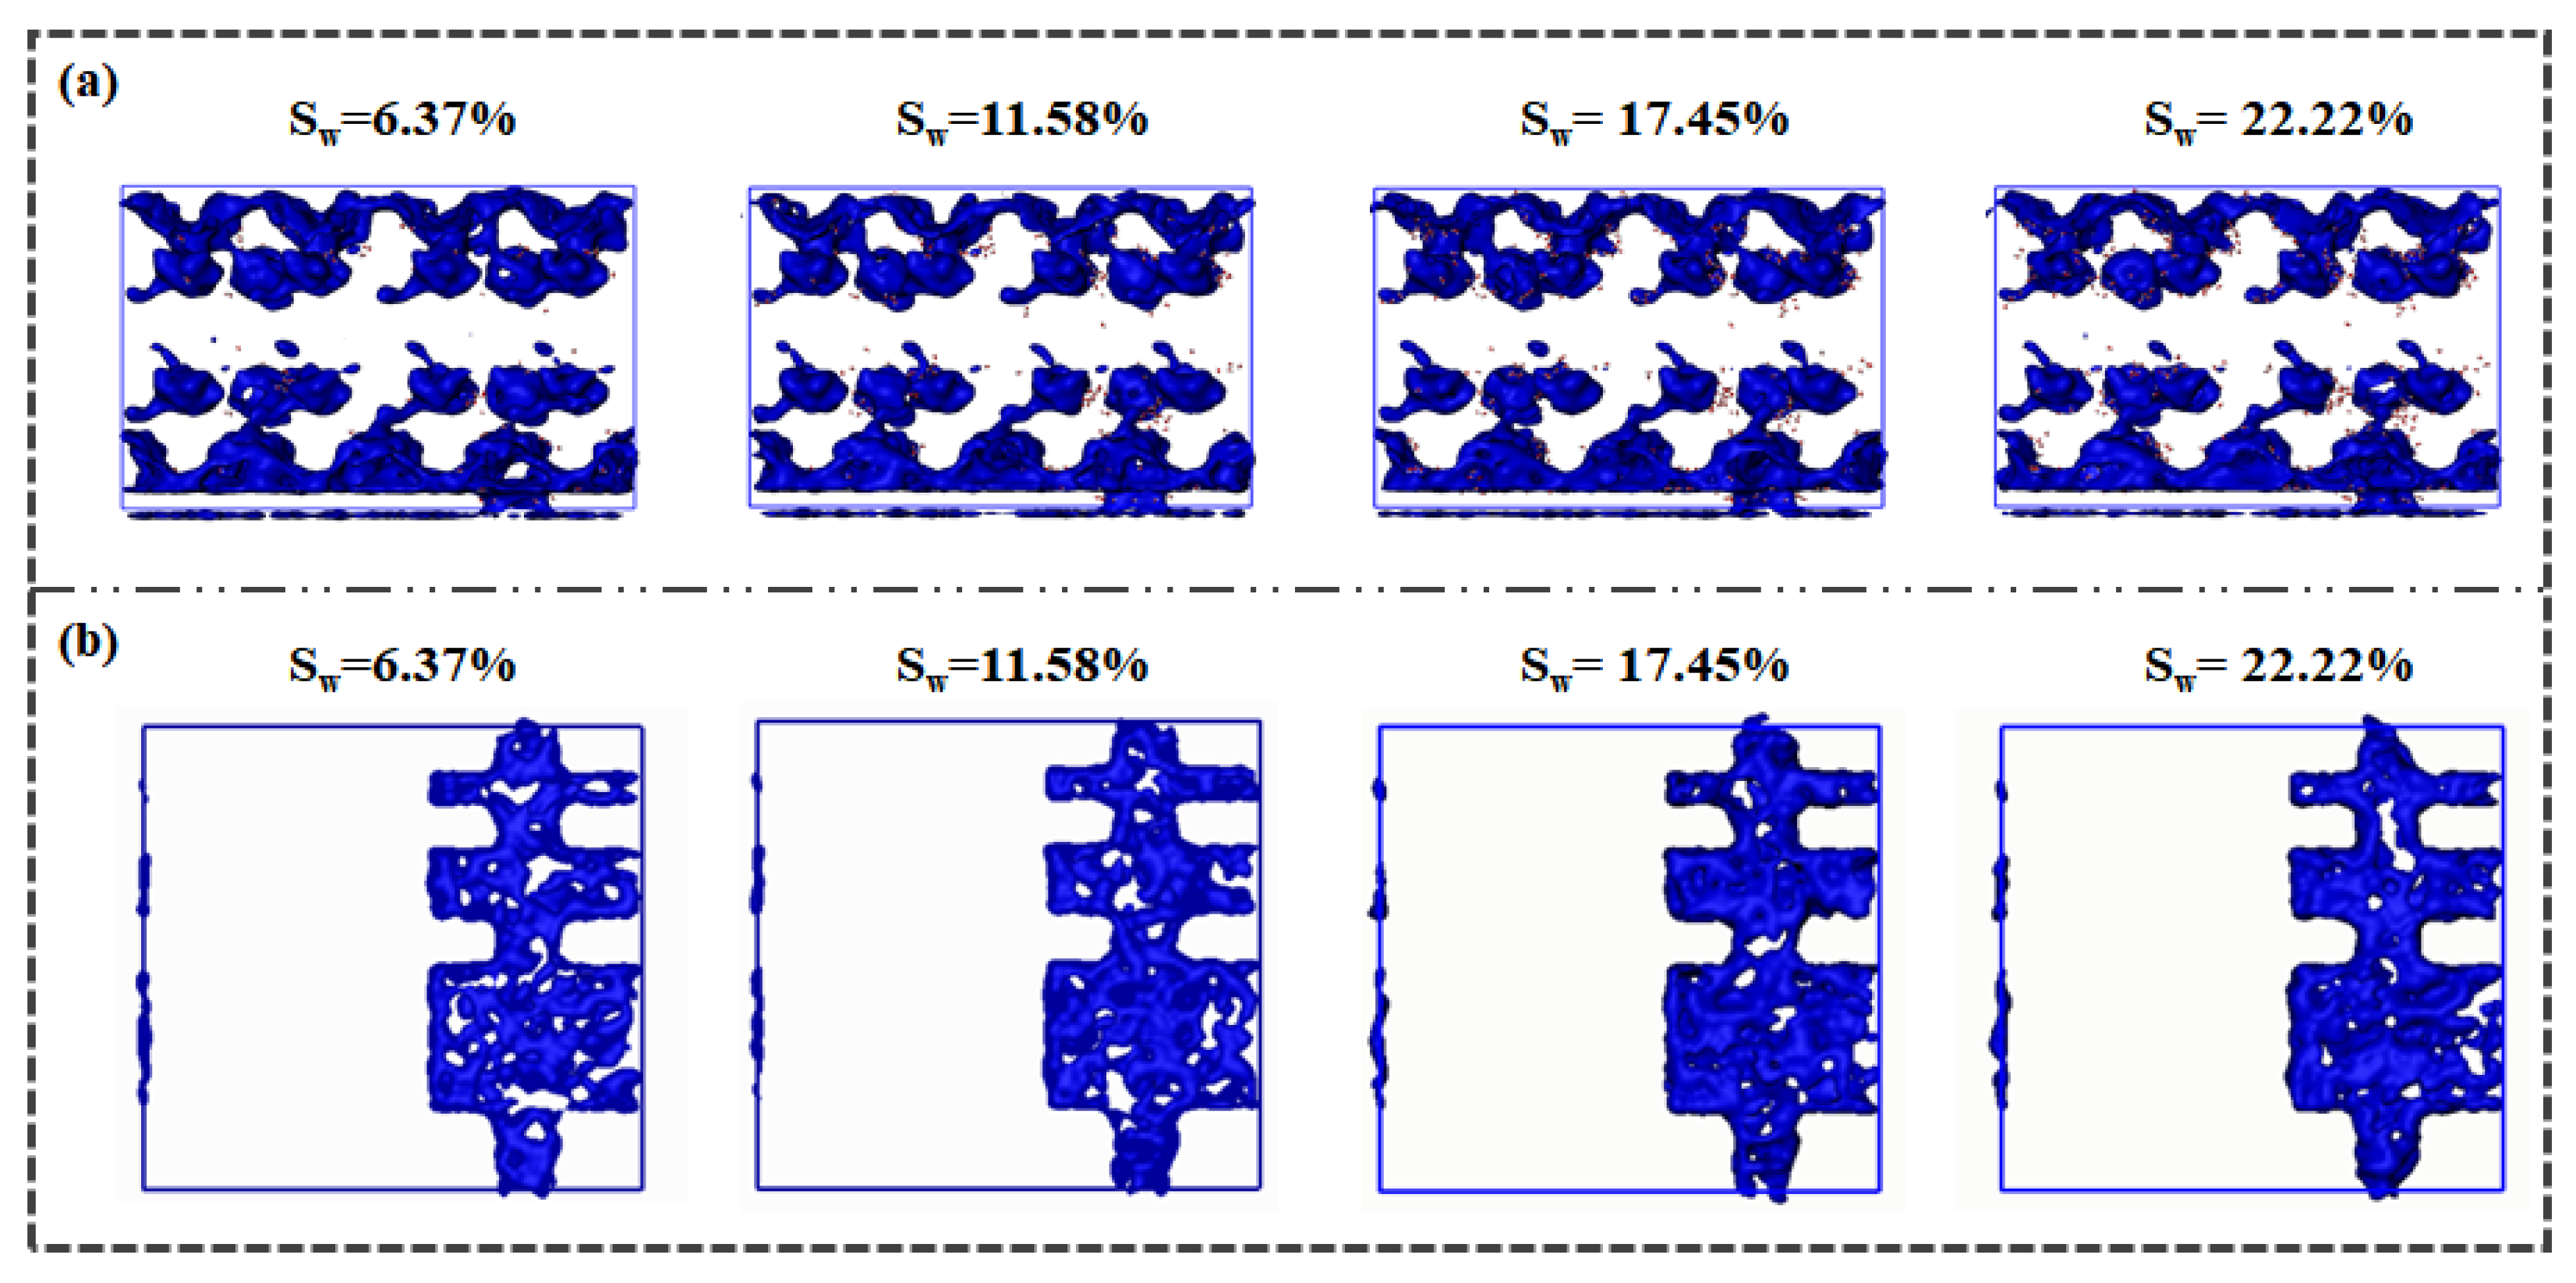
Figure 4 delineates the pore distribution within the shale model under varying water contents. Utilizing the Connolly surface method, we calculate the pore distribution in the water-bearing model once water distribution achieves equilibrium. In the water-bearing kerogen medium (
Figure 4(a)), water molecules predominantly populate the vicinity of pore surfaces, exerting minimal influence on the distribution of residual pores within the kerogen. The topological structure of pore distribution within the kerogen remains consistent across different water contents. However, localized increases in water content lead to a diminution in pore size as water molecules occupy the pore space.
In the water-bearing illite medium (
Figure 4(b)), water molecules are primarily adsorbed onto the illite pore surfaces in a punctate pattern, with scant distribution in the central regions of the illite pores. An escalation in water content results in a more contiguous distribution of water molecules along the illite pore walls, effectively increasing the pore wall thickness and concomitantly reducing the available pore space.
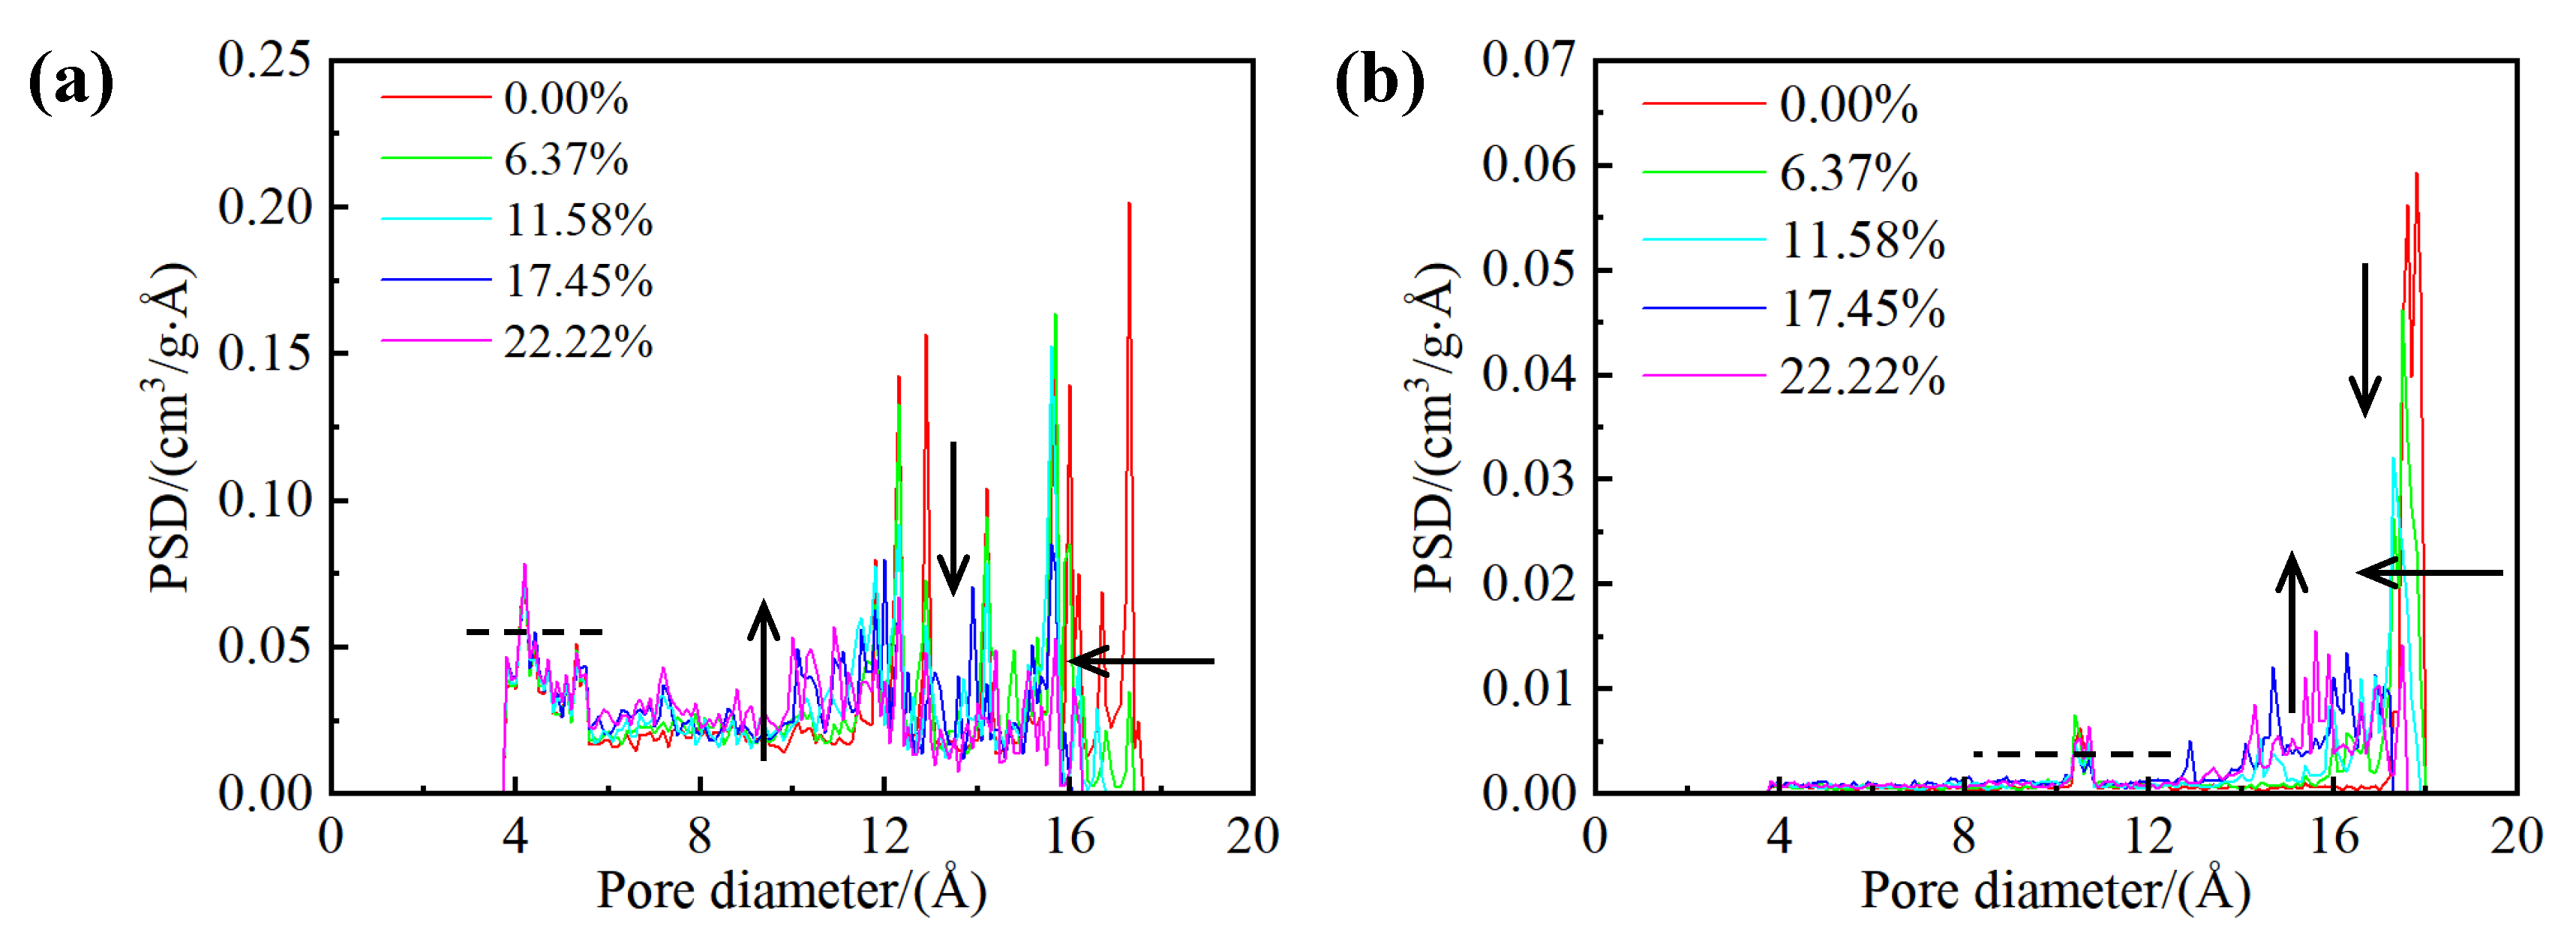
Figure 5 presents the pore size distribution curves for both kerogen and illite media across different water-bearing shale models. The impact of water on the pore size distribution curves is analogous in both kerogen and illite structures. An increase in water content precipitates a decrease in the maximum pore diameter for both structures due to water adsorption on the pore walls. Additionally, the partitioning effect of water molecules diminishes the proportion of larger-sized pores within both kerogen and illite structures, while simultaneously augmenting the proportion of smaller-sized pores. The occurrence and transport of water molecules within the larger nanopores significantly alter the pore size distribution curve within this diameter range. In contrast, the influence of water on the pore size distribution curve is considerably more restrained within the smaller pore diameter range.
3.1.3. Preferential Adsorption Sites of Water
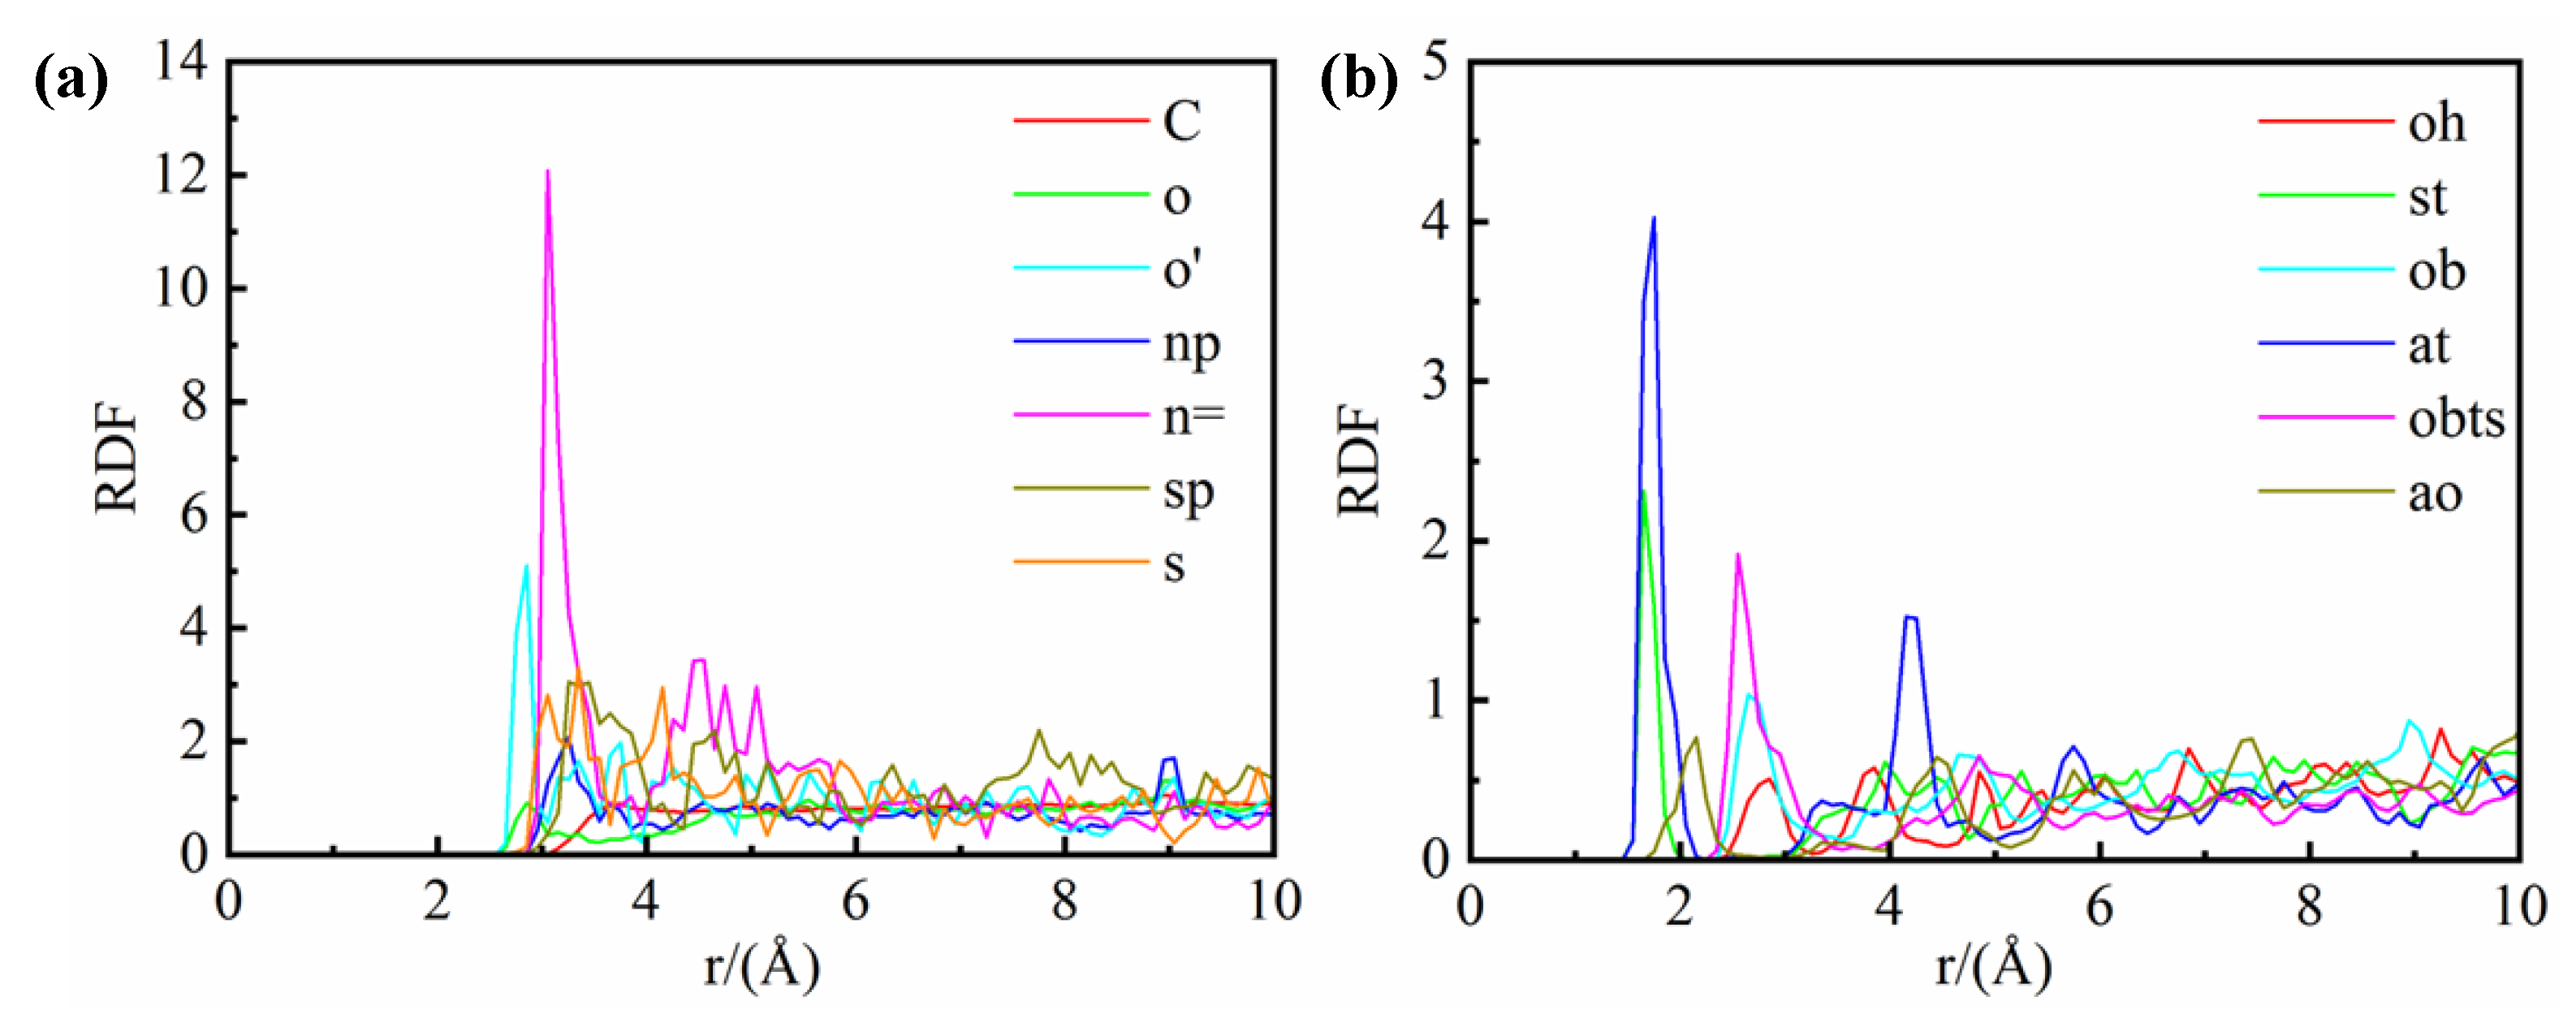
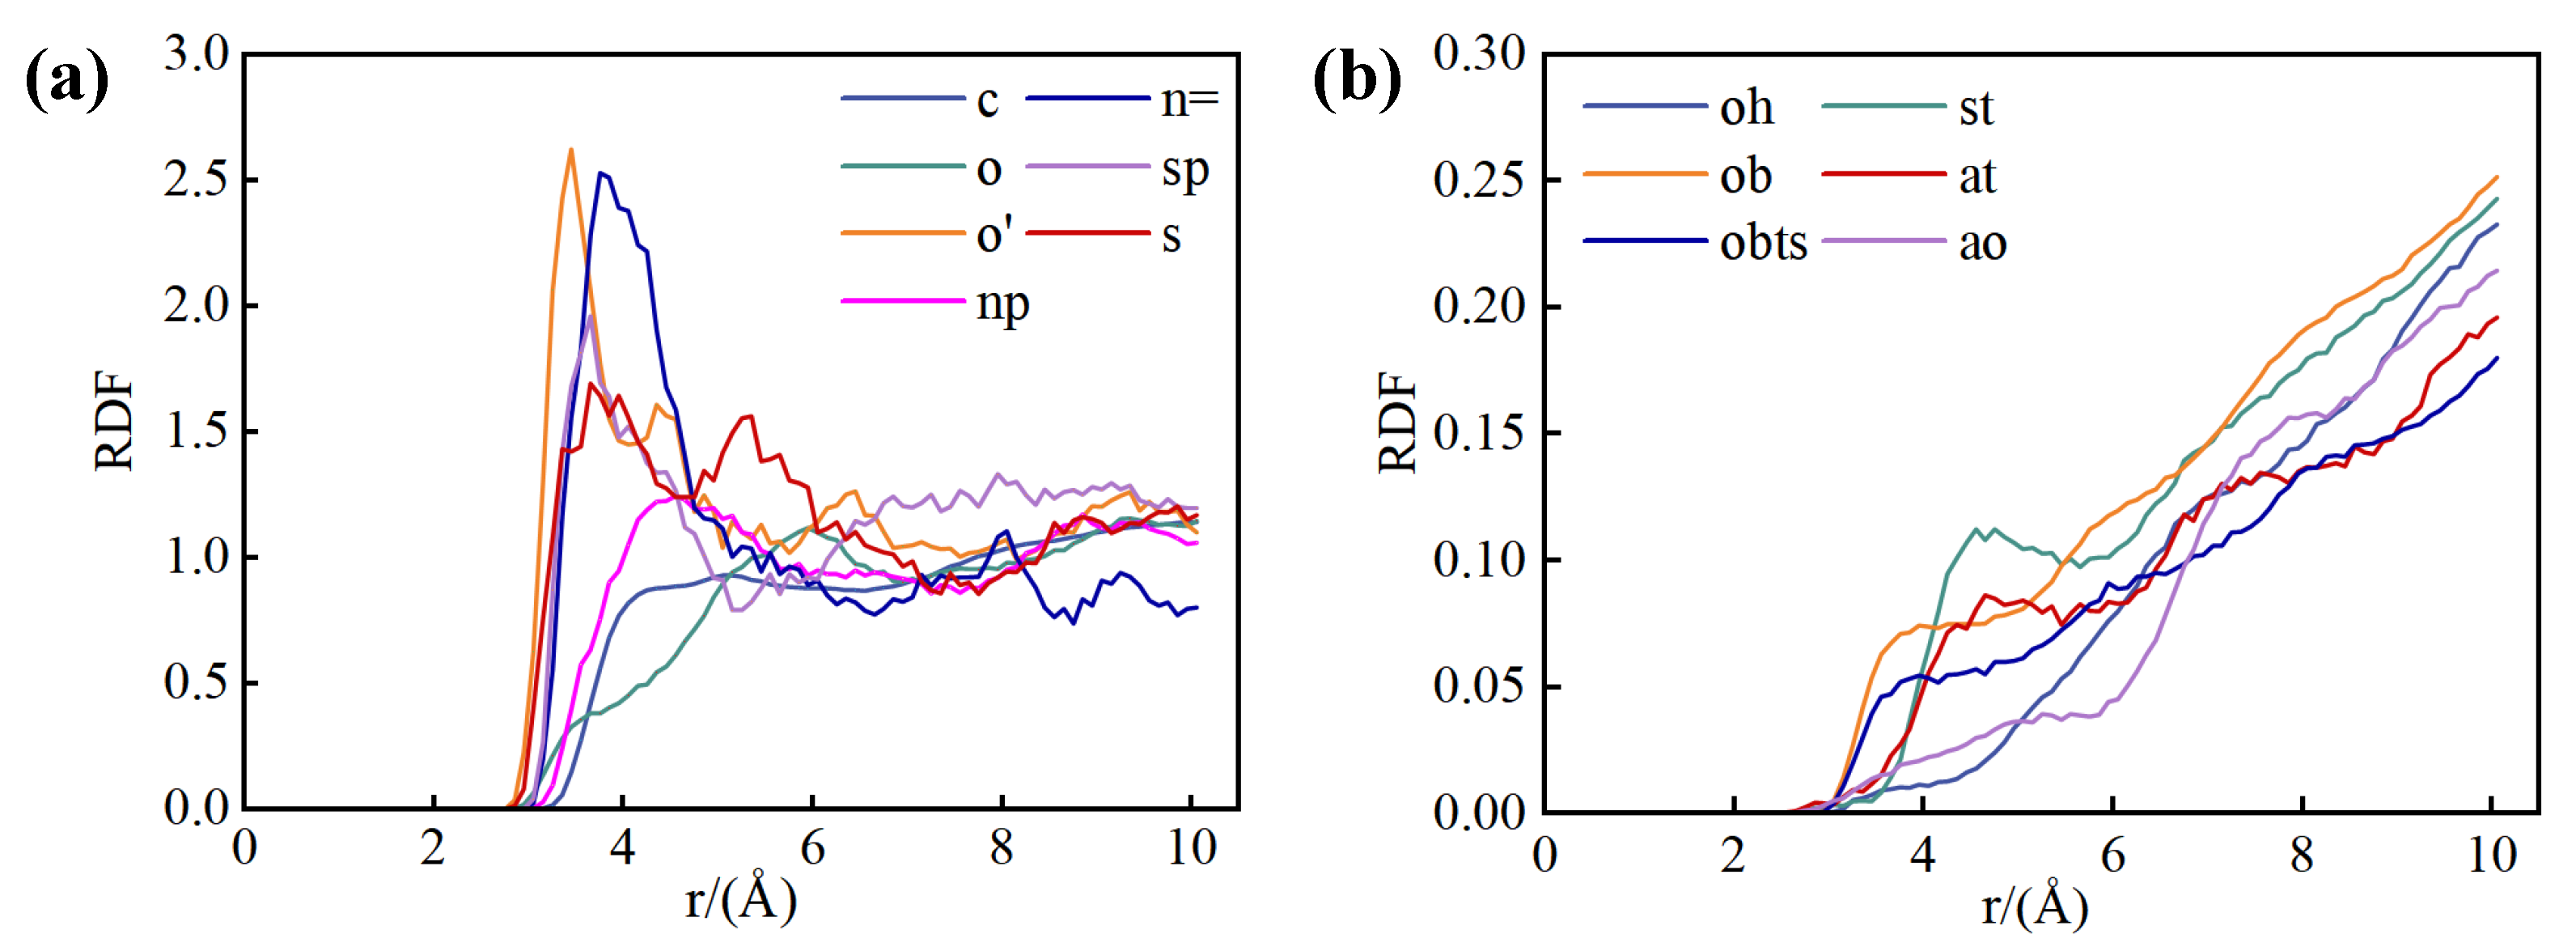
Figure 6 presents the RDF curves of water molecules in relation to distinct sites within the shale structure, a pivotal tool for assessing the affinity of these sites for water. This analysis is instrumental in identifying the preferred adsorption sites of water molecules across the shale composite model. The RDF of water molecules associated with various atomic sites are calculated and juxtaposed for both kerogen and illite to delineate their relative affinities. The initial RDF peak for each site corresponds to its affinity for water molecules, with higher peaks signifying stronger interactions.
Within the kerogen (
Figure 6(a)), the n= site exhibits the most pronounced initial peak, indicating the greatest affinity, followed sequentially by the o' site, and then the sp and s sites. Other sites within the kerogen exhibit negligible affinity for water molecules. Consequently, water molecules are preferentially adsorbed onto N atoms within the six-membered rings of kerogen, succeeded by S=O sites, and finally S atoms within the five-membered rings. The location of these sites in the kerogen chemical structure is depicted in
Figure 7(a).
Figure 6(b) portrays the RDF curves of water molecules in relation to various sites within the illite structure. The initial RDF peak for water molecules is most pronounced at the at site, followed by the st site, and then the obts site. This suggests that in illite, the most favored adsorption sites for water molecules are the tetrahedral aluminum atom (at), the tetrahedral silicon atom (st), and the tetrahedral aluminum oxygen atom (obts). The positions of these sites within the illite structure are detailed in
Figure 7(b). The collective distribution of these preferential adsorption sites reveals that water molecules are particularly attracted to the vicinity of tetrahedral substitution sites within the illite framework.
3.2. Microdistribution Characteristics of Methane and Water
3.2.1. Competitive Adsorption between Methane and Water
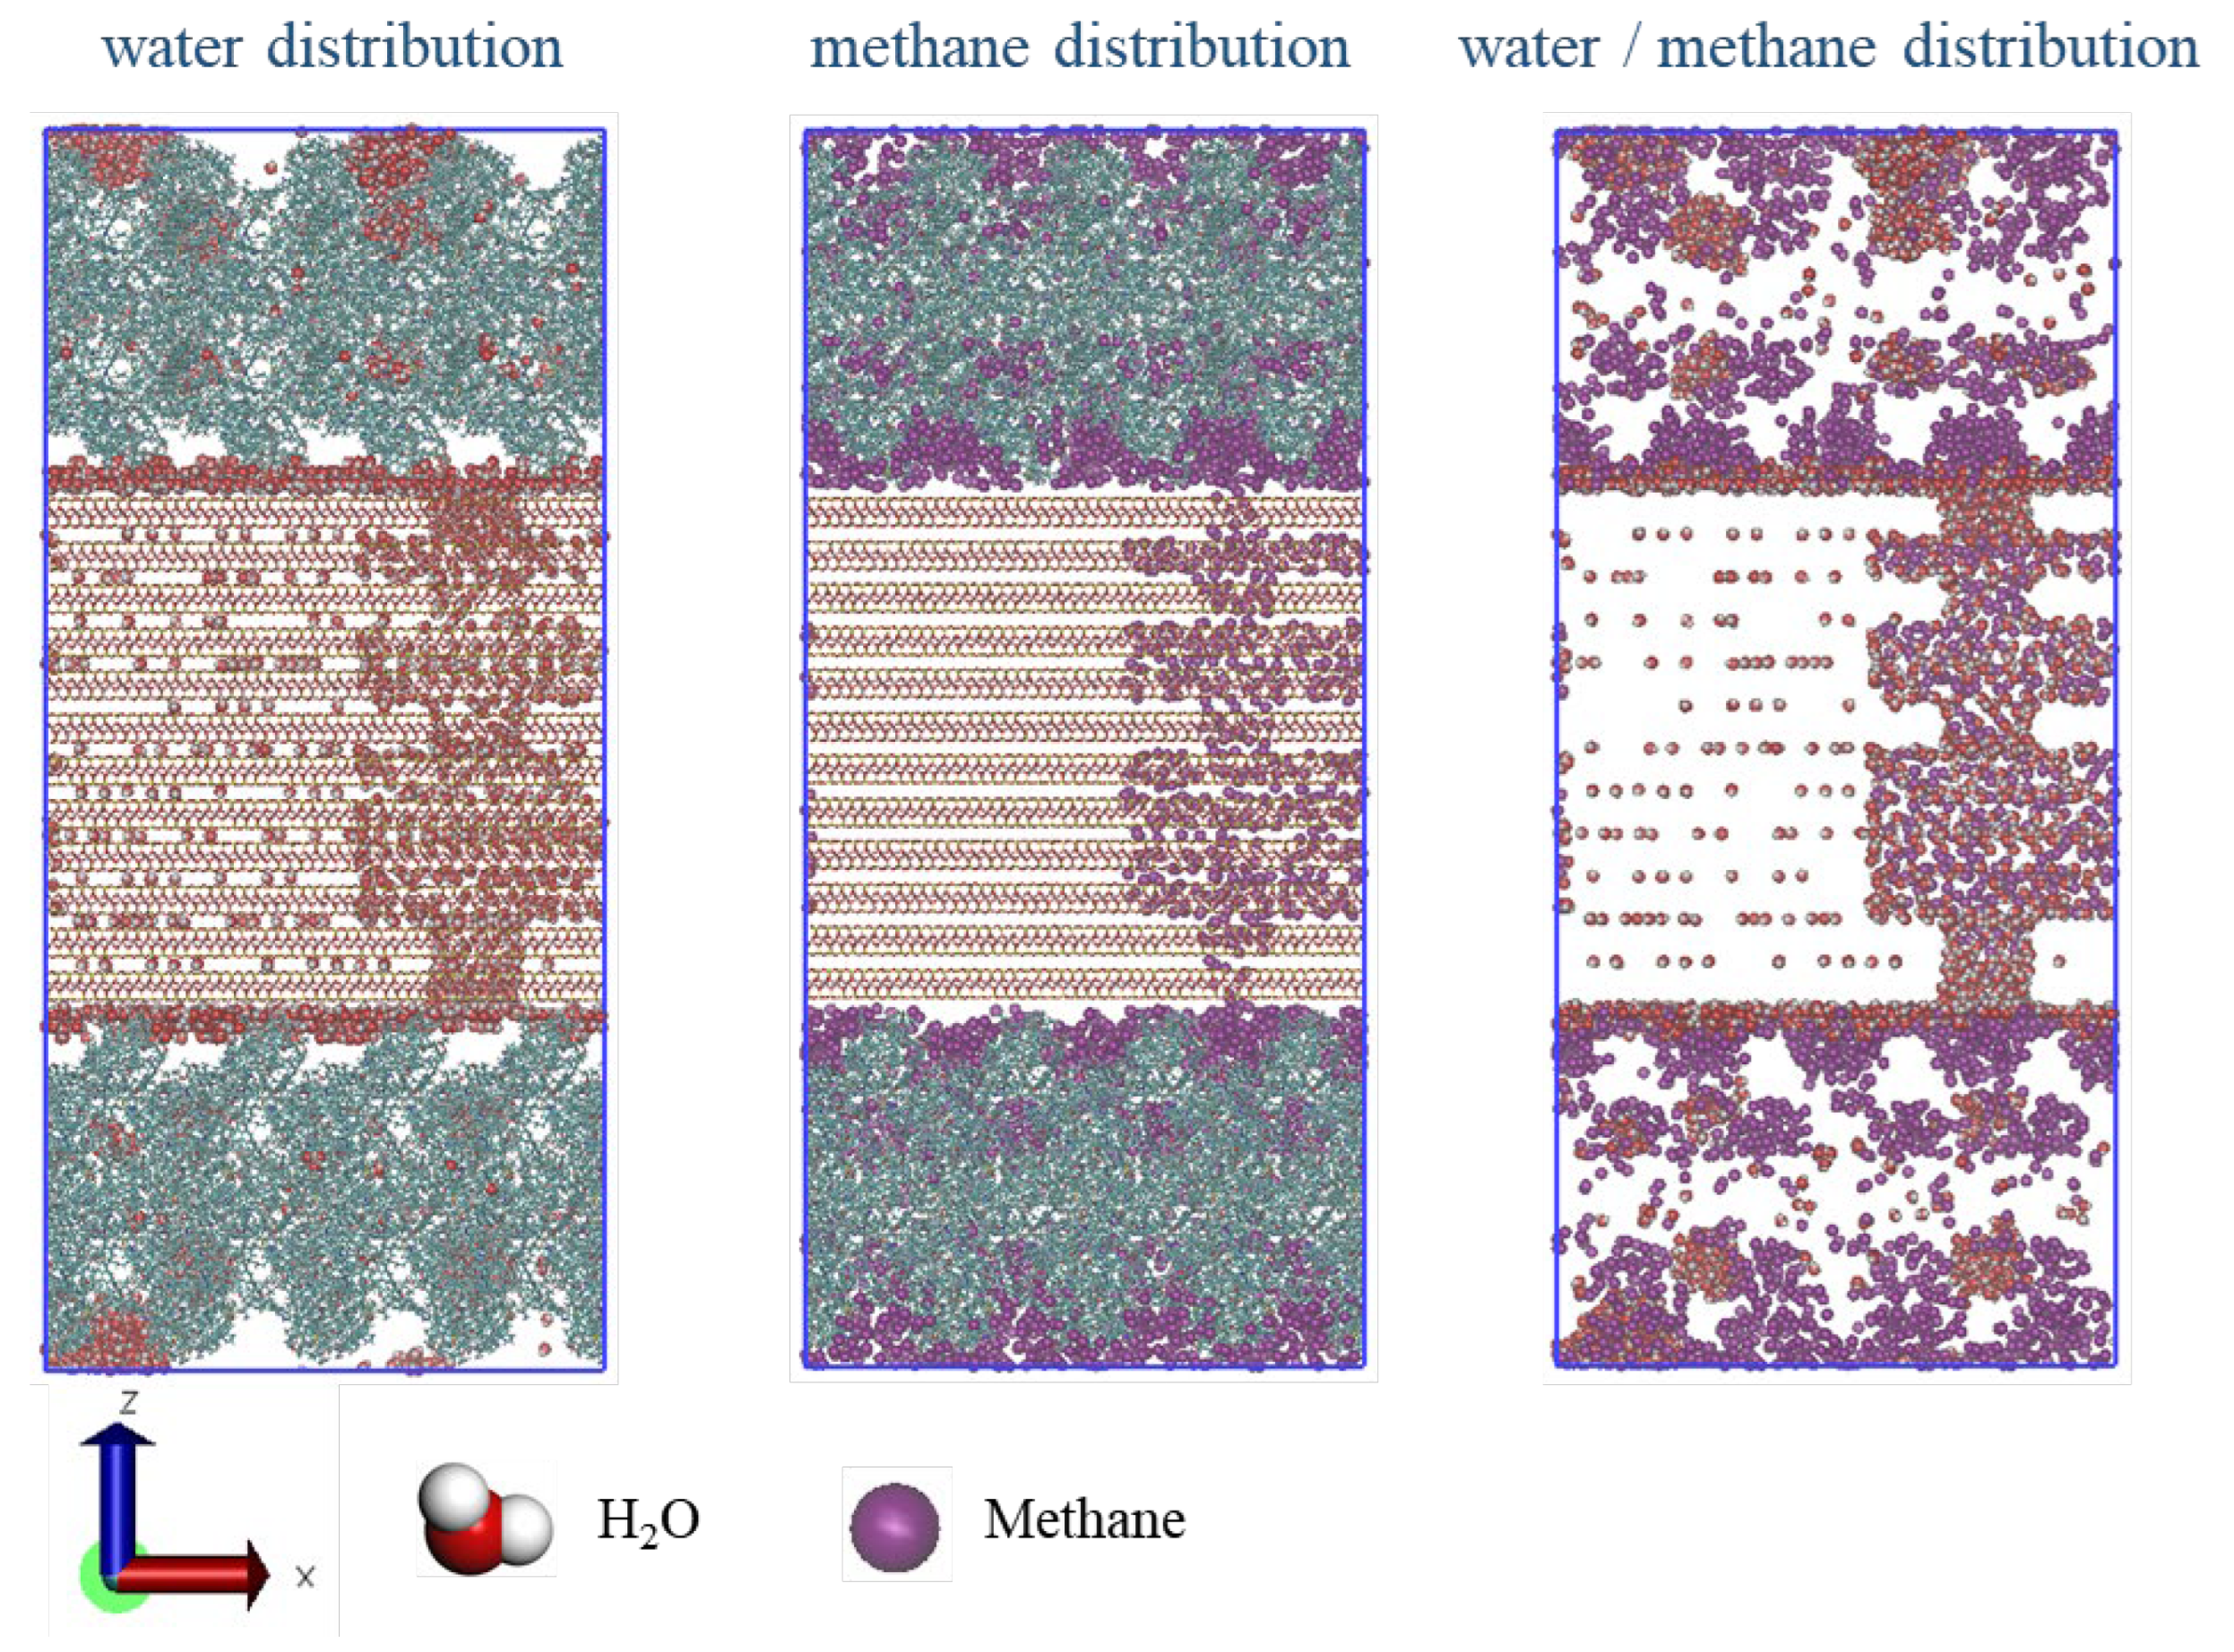
Figure 8 depicts the equilibrium distribution configuration of methane and water within the shale model at an elevated water content of 29.26%. The kerogen matrix contains water molecules primarily in clustered formations, with a sparse distribution at the heteroatom polar sites of the kerogen skeleton, thereby exhibiting mixed wetting characteristics. In the shrinkage cracks where organic and inorganic matter intersect, water molecules are adsorbed in layers on the illite surface, highlighting the strong hydrophilic nature of shale illite. Within the illite, water molecules are adsorbed on the pore wall surfaces, with some confined to monolayer positions between the crystal layers. Methane is distributed in the interior of illite pores, along the kerogen side of the shrinkage crack, and within the kerogen matrix, specifically in areas unoccupied by water. Comparative analysis of methane and water distribution reveals that water molecules tend to occupy the same pore sites where methane is adsorbed.
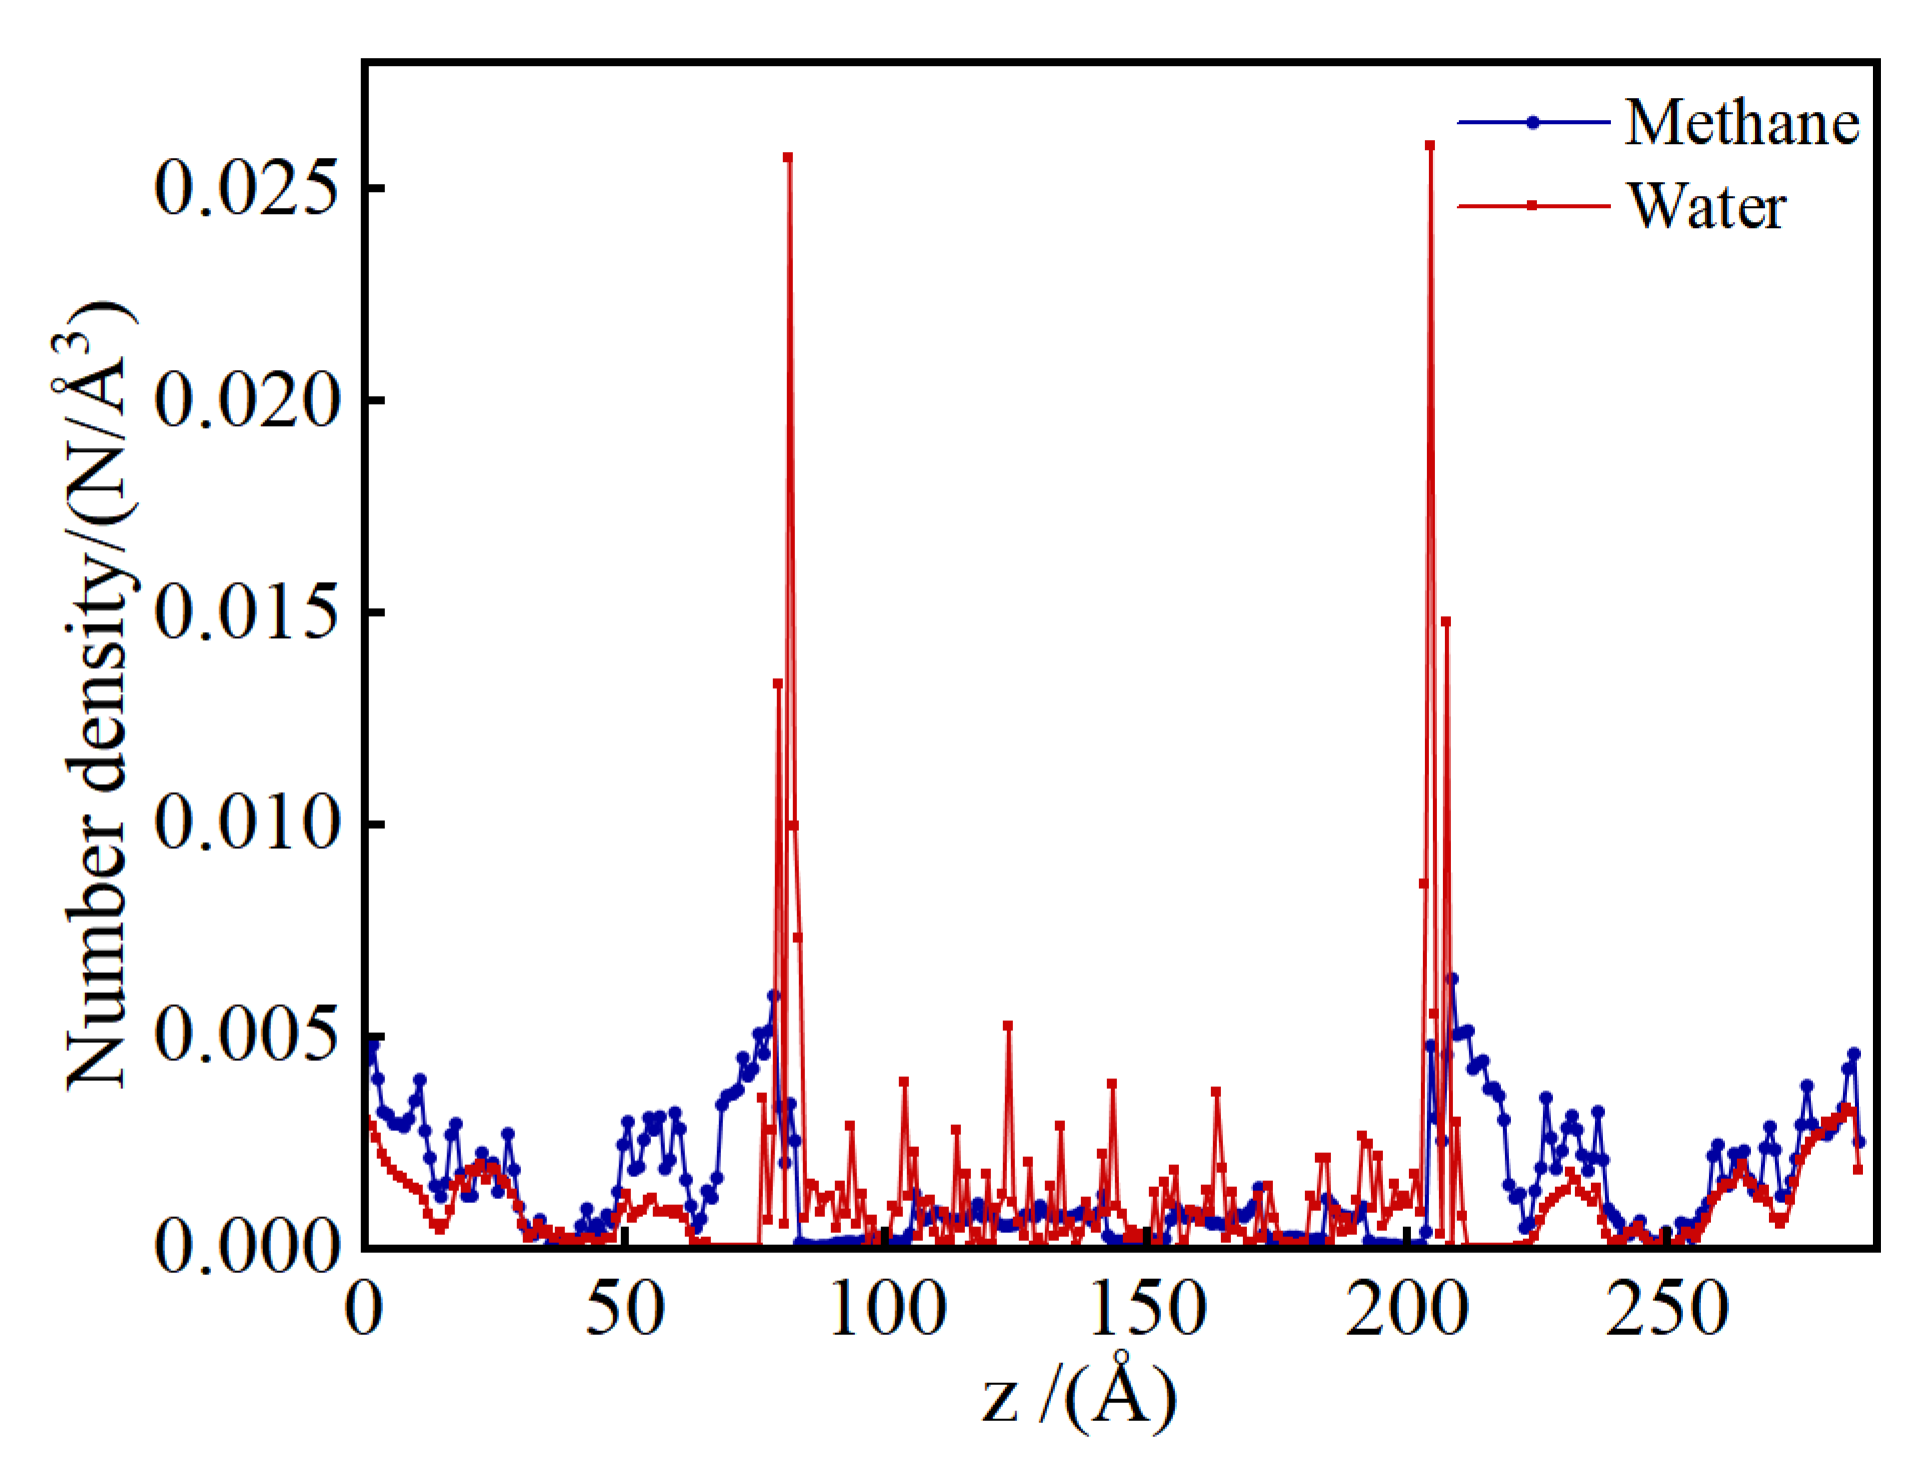
Figure 9 presents the number density profiles of methane and water along the z-direction in the shale model at the same high water content of 29.26%. The water number densities are substantially higher than methane densities in both shrinkage cracks and within illite. In contrast, within the kerogen, methane number densities exceed those of water. Water forms three distinct adsorption layers on the illite surfaces within the shrinkage cracks, and the water number densities inside illite and kerogen are comparable, lacking a clear stratification pattern. The methane number density follows the order: shrinkage crack > interior of kerogen > interior of illite. Additionally, the coexistence of two methane adsorption layers within the water molecule layers in the shrinkage cracks indicates a competitive adsorption process between water and methane molecules.
Figure 10 presents the RDF curves of methane interacting with various sites within the kerogen and illite structures at a water content of 29.26%. Within the kerogen framework (
Figure 10(a)), the methane molecule interacts most prominently with the o' site, as indicated by the initial RDF peak's intensity, followed sequentially by the n= site, and then the sp and s sites. Consequently, the favorable adsorption sites for methane in kerogen are the nitrogen atoms on the six-membered rings, the S=O site, and the sulfur atoms on the five-membered rings. A comparison with
Figure 6 reveals that the preferential adsorption site for methane in kerogen overlaps with that for water molecules, suggesting that in water-bearing pores, water molecules may usurp the methane adsorption sites, thereby diminishing the methane adsorption capacity.
In contrast, as depicted in
Figure 10(b), methane molecules exhibit no specific affinity for any particular adsorption sites within the water-bearing illite structure. This lack of selectivity implies that methane adsorption on illite is greatly influenced by the presence of water molecules, which is a significant observation for understanding the competitive interactions between methane and water within shale media.
3.2.2. Effect of Water Content on Methane/Water Distribution
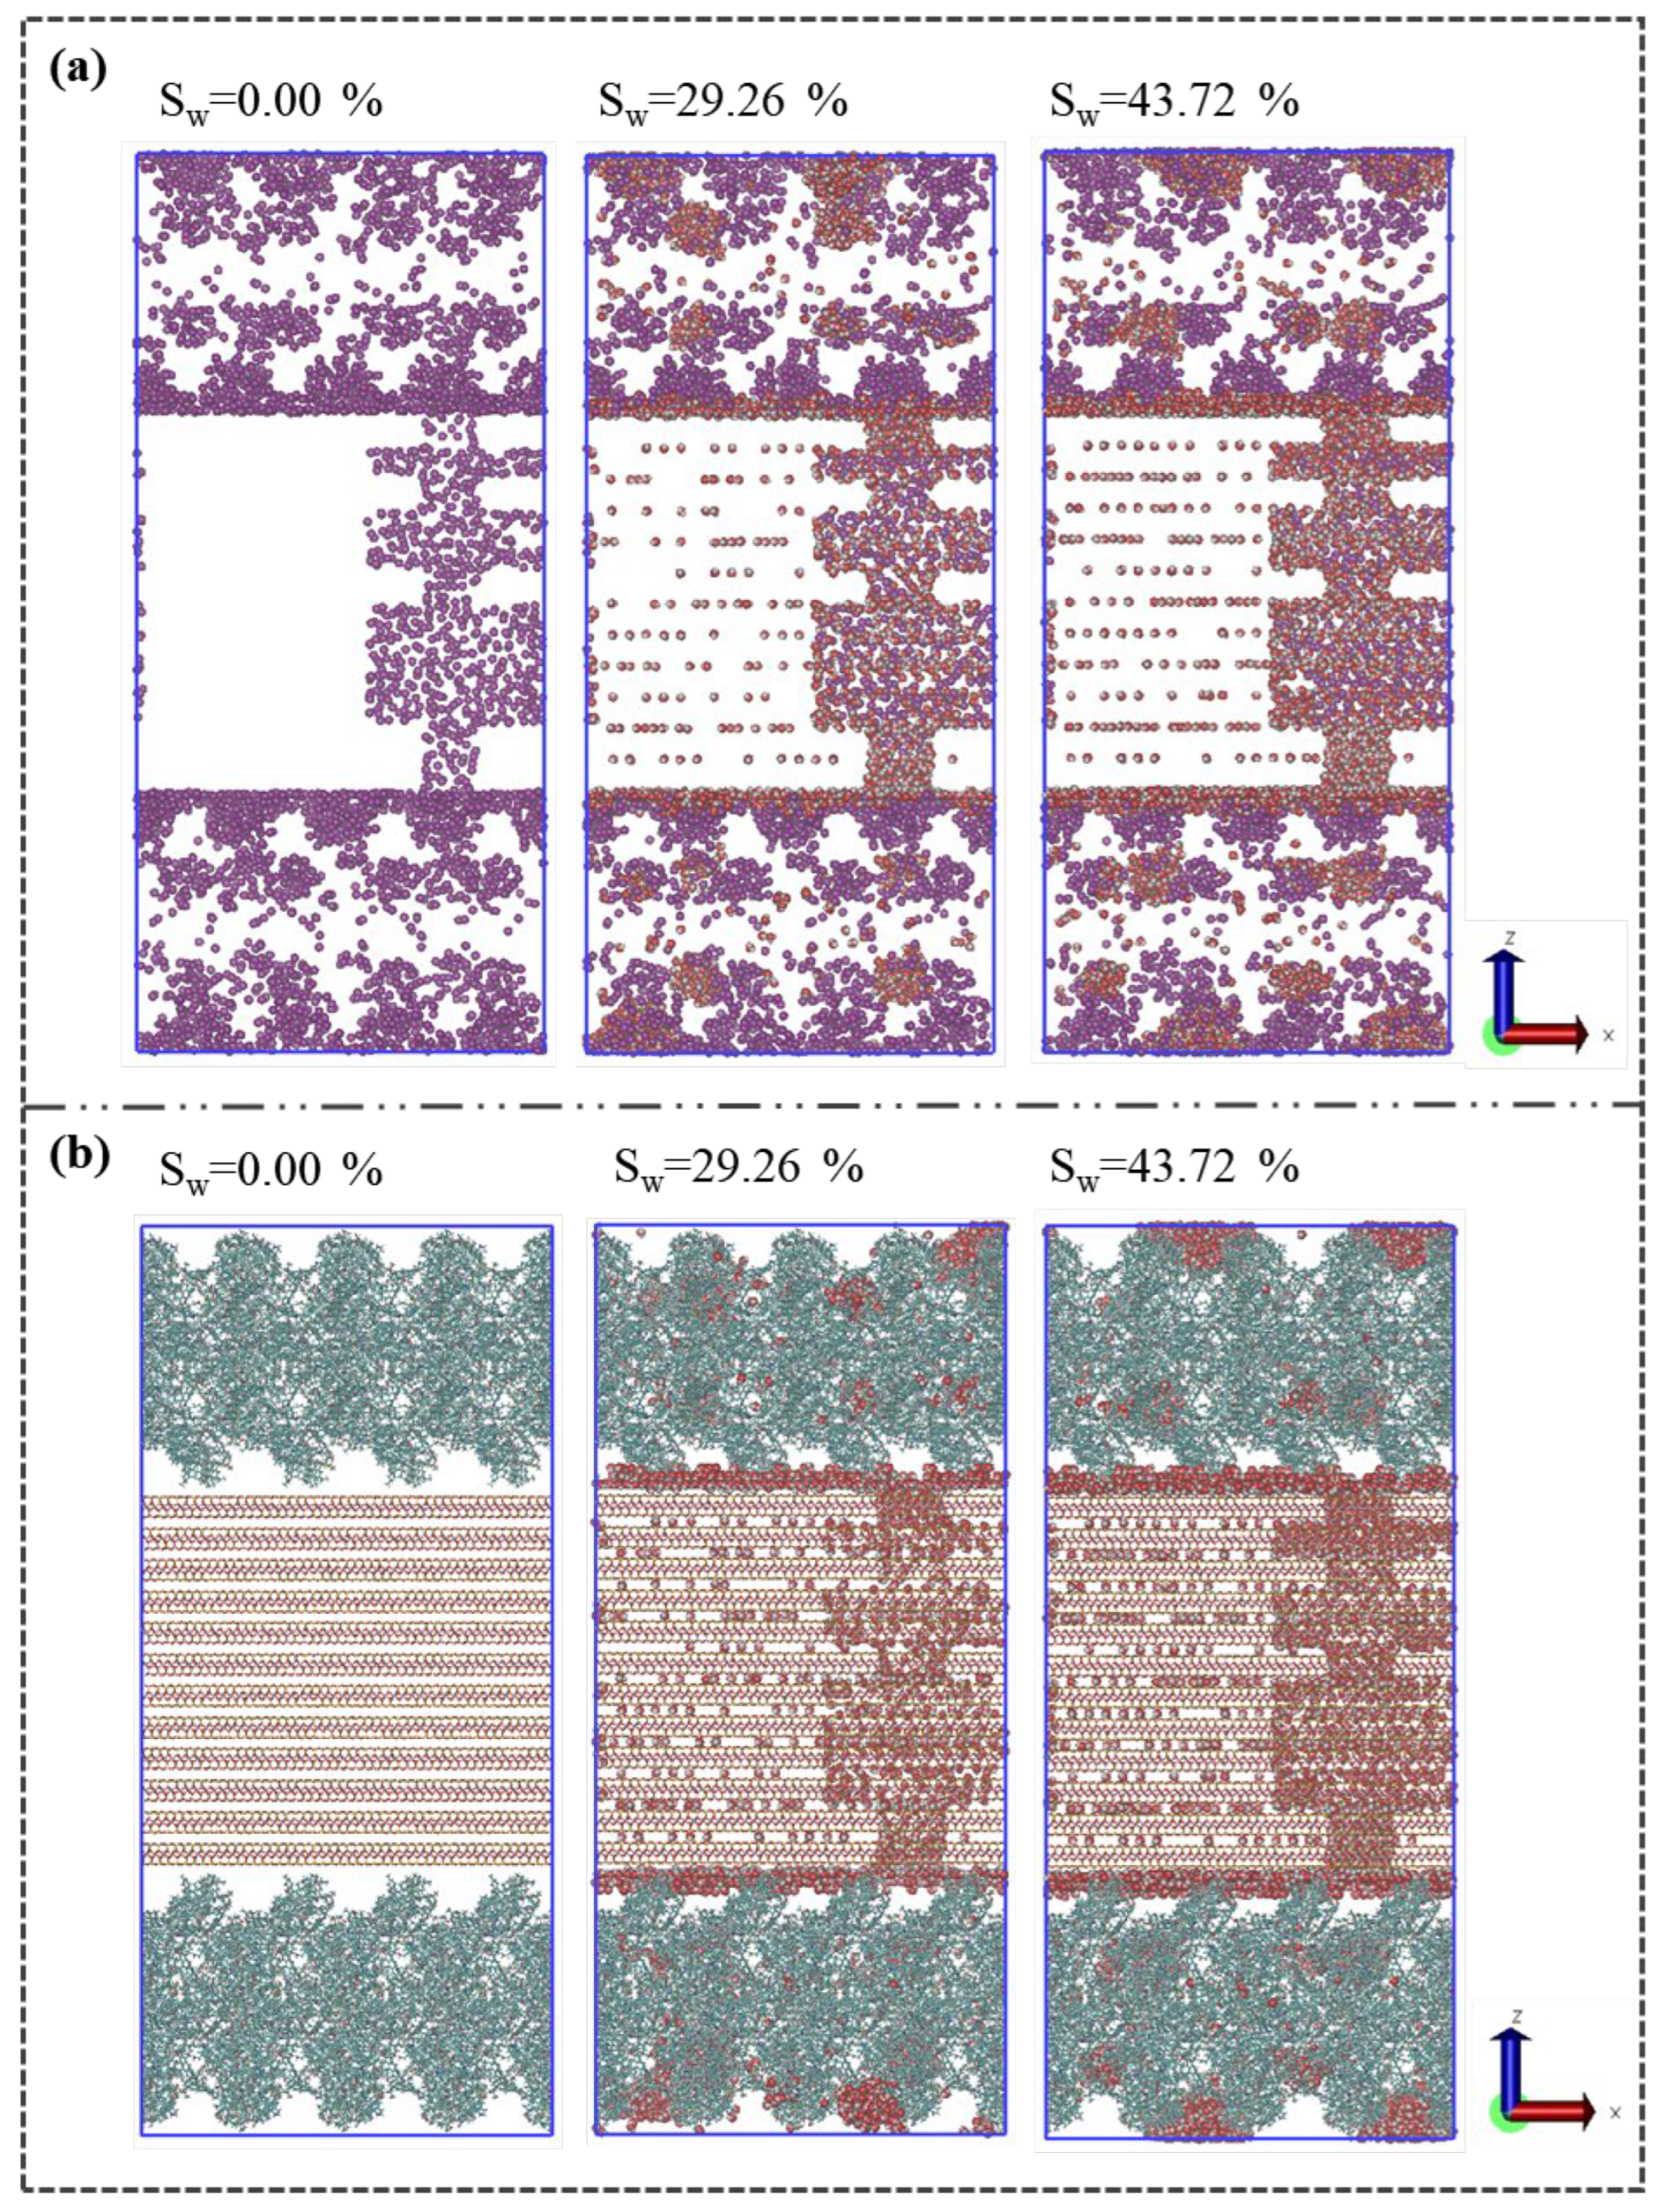
Figure 11 presents the distribution configuration of methane and water at varying water contents. As depicted in
Figure 11(a), the concentration of methane within the internal pores of illite, the shrinkage cracks, and the micropores of kerogen significantly decreases with rising water content. The competitive adsorption between methane and water in the intermolecular pores of kerogen leads to a dispersed methane-water distribution, a phenomenon driven by shifts in water distribution that subsequently influence methane distribution.
Figure 11(b) shows that with increasing water content, the water molecules within illite rises substantially, and the water adsorption layer on the illite surface in the shrinkage crack intensifies. Concurrently, water clusters within the kerogen migrate and expand.
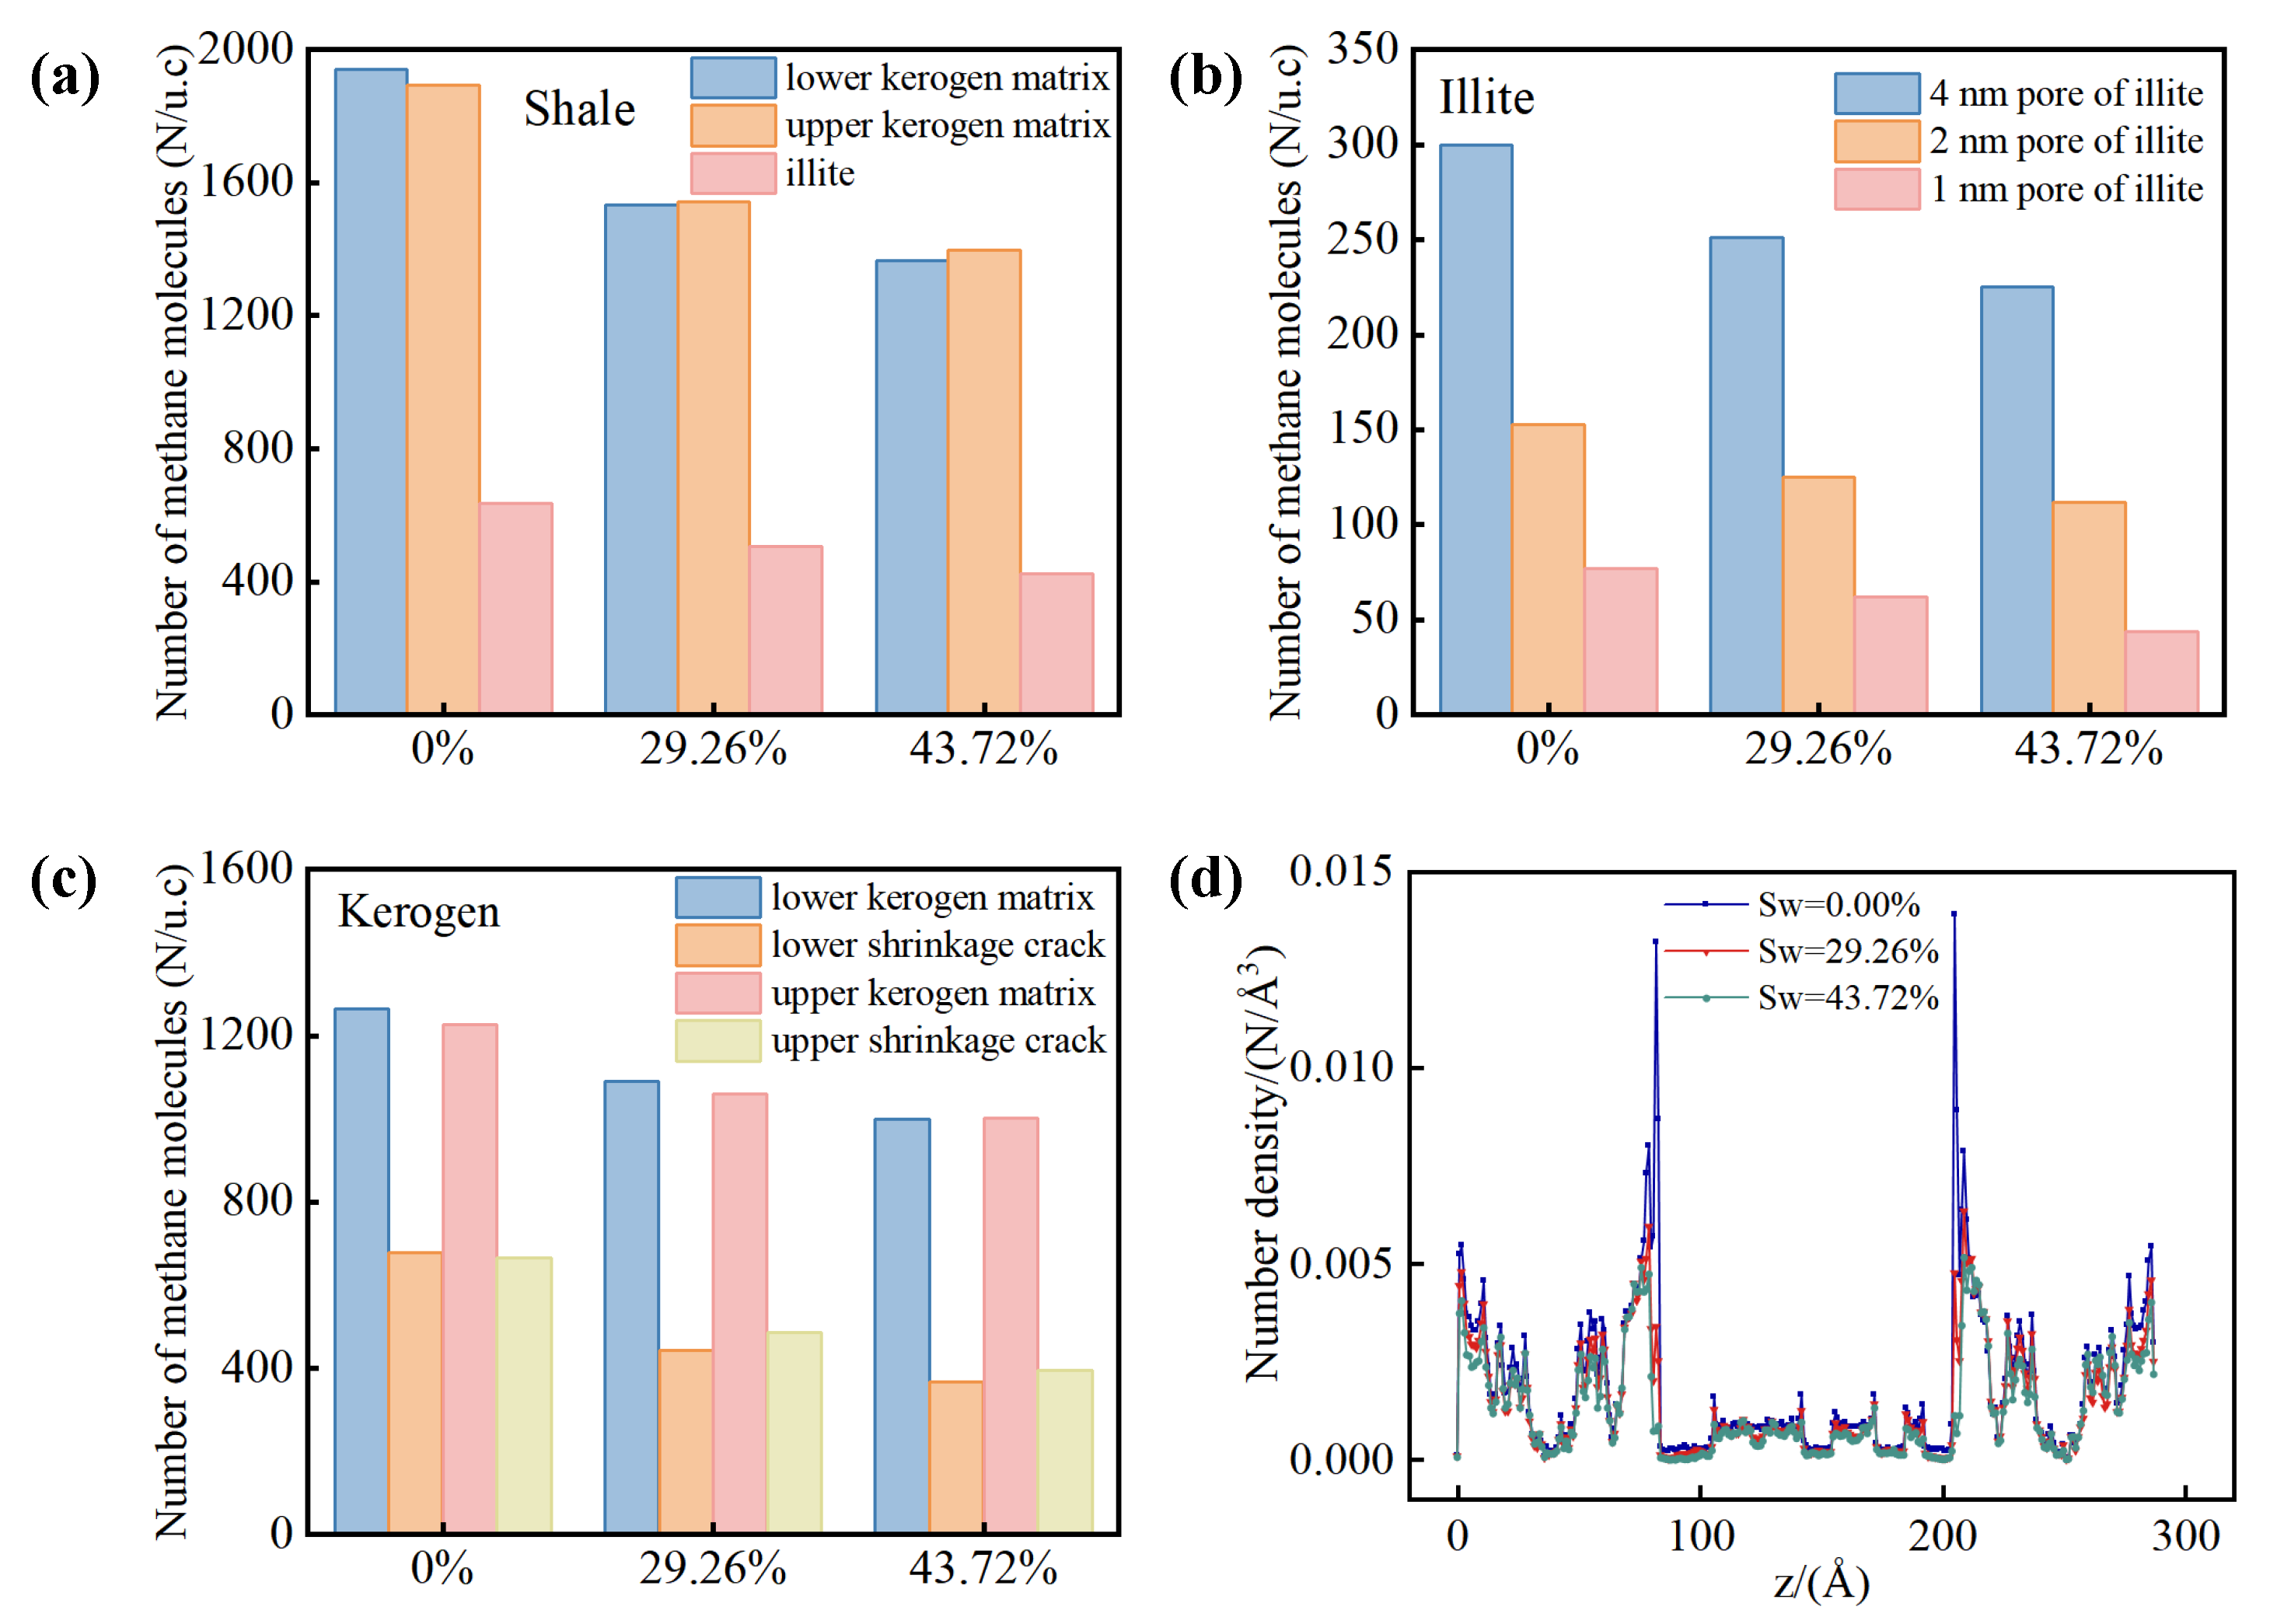
Figure 12 displays the distribution of methane in the shale composite model under differing water contents. Methane quantities are observed to decrease as water content increases in both shale kerogen and illite. Notably, the methane quantity within illite pores exhibits less variation compared to the kerogen region, as shown in
Figure 12(a). At equivalent water contents, the methane quantity in the upper and lower kerogens is nearly identical, a result of similar pore structures. As water content escalates, the methane quantity within each illite pore diminishes, with a more pronounced reduction in larger pores compared to smaller ones, as illustrated in
Figure 12(b). In kerogen media, the methane quantity decrease in shrinkage cracks is more substantial than in matrix pores, as indicated in
Figure 12(c).
Figure 12(d) presents the methane number density profiles along the z-direction of the shale model under various water contents. An increase in water content accelerates the decline of the initial methane adsorbed layer density on the external surface of illite within the shrinkage crack compared to the secondary layer. Additionally, the migration and aggregation of water clusters lead to localized reductions in water content within the kerogen, which in turn correspond to increases in methane content in those areas.
4. Conclusions
This study proposes a molecular modelling approach for the complex nanoporous media of shales, constructing a sophisticated molecular model that captures the intricacies of a nanocomposite media with two rock components in deep shale formations. Utilizing molecular simulation methods, we have delineated the microdistribution characteristics of water and methane within these confined nanospaces under the high-temperature and high-pressure conditions of deep shale reservoirs. The key findings are as follows:
Both water and methane exhibit identical preferential adsorption sites on shale kerogen, engaging in competitive adsorption near the N atoms on the six-membered rings and around the S=O sites. Water is particularly favored near the tetrahedral substitution sites on illite, whereas methane lacks specific adsorption preferences on water-bearing illite, with its adsorption capacity significantly inferior to that of water.
Water tends to form clusters on the kerogen surface, leading to localized reductions in pore size, and form a water film on the illite surface, effectively increasing the pore wall thickness. The impact of water on illite's pore space is more pronounced than on kerogen. An enrichment of water content leads to a contraction in the proportion of larger micropores and a corresponding expansion in the proportion of smaller micropores within both kerogen and illite structures.
Within the shale kerogen matrix, methane content surpasses water content, while the converse is true for shale illite. On the outer surface of illite, water can form up to three adsorption layers, where methane and water compete for spaces on the water film.
water diminishes methane content in shales by occupying preferential adsorption sites and pore volumes. This reduction is more pronounced in shrinkage pores compared to matrix pores within shale kerogen and in larger pores compared to smaller ones within shale illite.
The insights yielded from this research contribute to a nuanced understanding of the competitive interactions between water and methane within the nanoconfines of deep shale reservoirs, offering critical implications for the evaluation and management of shale gas resources.
Author Contributions
Conceptualization, X.Y., J.L. and L.H.; methodology, X.Y., J.L., L.C., and L.H.; validation, X.Y., J.L. and L.H.; formal analysis, J.L., L.C., J.Z. and S.Z.; investigation, S.Z. and Q.Y.; resources, Q.C. and Z.Q.; data curation, X.Y., J.L. and L.C.; writing—original draft preparation, X.Y., J.L., L.H., S.Z., L.C. and J.Z.; writing—review and editing, X.Y., J.L., L.H., S.Z, L.C. and J.Z.; visualization, Q.Y., Q.C. and Z.Q.; supervision, X.Y.; project administration, J.L. and L.H.; funding acquisition, X.Y. and L.H. All authors have read and agreed to the published version of the manuscript.
Funding
This research was supported by the National Natural Science Foundation of China (No. 52204031), the Natural Science Foundation of Sichuan Province (No. 2023NSFSC0947), the Major Science and Technology Projects of PetroChina (No. 2023ZZ21) and the Southwest Oil and Gas Field Branch Technology Project (No. 20230312-02).
Institutional Review Board Statement
Not applicable.
Informed Consent Statement
Not applicable.
Data Availability Statement
The raw data supporting the conclusions of this article will be made available by the authors upon request.
Conflicts of Interest
The authors declare no conflicts of interest.
References
- Iddphonce, R.; Wang, J.; Zhao, L. Review of CO2 injection techniques for enhanced shale gas recovery: Prospect and challenges. J. Nat. Gas Sci. Eng. 2020, 77, 103240. [Google Scholar] [CrossRef]
- Paylor, A. The social–economic impact of shale gas extraction: a global perspective. Third World Q. 2016, 38, 340–355. [Google Scholar] [CrossRef]
- Li, X.; Lu, S.; Zhao, S.; Li, W.; Li, J.; Zhang, X.; Zhang, P.; Wang, J.; Liu, L. Gas-in-place content and occurrence state of deep shale gas in the Luzhou area, Sichuan Basin, China. Mar. Pet. Geol. 2024, 160. [Google Scholar] [CrossRef]
- Feng, Y.; Xiao, X.; Gao, P.; Hu, D.; Liu, R.; Li, G.; Lu, C.; Zhou, Q. Water distribution in pore systems and its influences on gas-bearing property of deep shale: A case study of the Longmaxi Formation in the Luzhou area, southern Sichuan Basin. Mar. Pet. Geol. 2024, 163. [Google Scholar] [CrossRef]
- Xin, H.; You, Y.; Yue, X.; Feng, S.; An, W.; Li, Q.; Liang, X. Impact of fracturing fluid retention and flowback on development effect after large scale fracturing in shale oil wells: A case study from the shale oil of Chang 7 Member, Yanchang Formation, Ordos Basin. Unconv. Resour. 2024, 4, 100060. [Google Scholar] [CrossRef]
- Wanniarachchi, W.A.M.; Ranjith, P.G.; Perera, M.S.A. Shale gas fracturing using foam-based fracturing fluid: a review. Environ. Earth Sci. 2017, 76, 91. [Google Scholar] [CrossRef]
- Lin, D.; Xi, Z.; Tang, S.; Lash, G.G.; Li, J.; Gou, Q.; Zhang, K.; Mei, X.; Wang, K. Enrichment mechanism of organic matter and silicon in lower Cambrian shale of the Yangtze Platform. Palaeogeogr. Palaeoclim. Palaeoecol. 2024. [Google Scholar] [CrossRef]
- Schettler, P.D.; Parmoly, C.R. The measurement of gas desorption isotherms for Devonian shale. GRI Devonian Gas Shale Technology Review 1990, 7, 4–9. [Google Scholar]
- Wang, Q.; Huang, L. Molecular insight into competitive adsorption of methane and carbon dioxide in montmorillonite: Effect of clay structure and water content. Fuel 2018, 239, 32–43. [Google Scholar] [CrossRef]
- Li, J.; Li, X.; Wang, X.; Li, Y.; Wu, K.; Shi, J.; Yang, L.; Feng, D.; Zhang, T.; Yu, P. Water distribution characteristic and effect on methane adsorption capacity in shale clay. Int. J. Coal Geol. 2016, 159, 135–154. [Google Scholar] [CrossRef]
- Li, J.; Li, X.; Wu, K.; Wang, X.; Shi, J.; Yang, L.; Zhang, H.; Sun, Z.; Wang, R.; Feng, D. Water Sorption and Distribution Characteristics in Clay and Shale: Effect of Surface Force. Energy Fuels 2016, 30, 8863–8874. [Google Scholar] [CrossRef]
- Hu, Y.; Devegowda, D.; Striolo, A. Microscopic dynamics of water and hydrocarbon in shale-kerogen pores of potentially mixed wettability. SPE J. 2015, 20, 112–124. [Google Scholar]
- Li, J.; Li, X.; Wu, K.; Feng, D.; Zhang, T.; Zhang, Y. Thickness and stability of water film confined inside nanoslits and nanocapillaries of shale and clay. Int. J. Coal Geol. 2017, 179, 253–268. [Google Scholar] [CrossRef]
- Li, P.; Zhang, J.; Rezaee, R.; Dang, W.; Tang, X.; Nie, H.; Chen, S. Effect of adsorbed moisture on the pore size distribution of marine-continental transitional shales: Insights from lithofacies differences and clay swelling. Appl. Clay Sci. 2020, 201, 105926. [Google Scholar] [CrossRef]
- Yang, F.; Xie, C.; Ning, Z.; Krooss, B.M. High-Pressure Methane Sorption on Dry and Moisture-Equilibrated Shales. Energy Fuels 2016, 31, 482–492. [Google Scholar] [CrossRef]
- Li, W.; Stevens, L.A.; Uguna, C.N.; Vane, C.H.; Meredith, W.; Tang, L.; Li, Q.; Snape, C.E. Comparison of the impact of moisture on methane adsorption and nanoporosity for over mature shales and their kerogens. Int. J. Coal Geol. 2021, 237. [Google Scholar] [CrossRef]
- Hu, H.; Hao, F.; Guo, X.; Dai, F.; Lu, Y.; Ma, Y. Investigation of methane sorption of overmature Wufeng-Longmaxi shale in the Jiaoshiba area, Eastern Sichuan Basin, China. Mar. Pet. Geol. 2018, 91, 251–261. [Google Scholar] [CrossRef]
- Zhang, T.; Javadpour, F.; Li, J.; Zhao, Y.; Zhang, L.; Li, X. Pore-Scale Perspective of Gas/Water Two-Phase Flow in Shale. SPE J. 2021, 26, 828–846. [Google Scholar] [CrossRef]
- Ross, D.J.K.; Bustin, R.M. The importance of shale composition and pore structure upon gas storage potential of shale gas reservoirs. Mar. Pet. Geol. 2009, 26, 916–927. [Google Scholar] [CrossRef]
- Huang, L.; Feng, X.; Yang, Q.; Xu, Z.; Tian, B.; Chen, Q.; Chen, Z.; Wang, L.; Liu, Y.; Yang, F. Measurement and modeling of moisture equilibrium and methane adsorption in shales from the southern Sichuan Basin. Chem. Eng. J. 2024, 489. [Google Scholar] [CrossRef]
- Li, W.; Stevens, L.A.; Zhang, B.; Zheng, D.; Snape, C.E. Combining molecular simulation and experiment to understand the effect of moisture on methane adsorption in kerogens. Chem. Eng. J. 2023, 454. [Google Scholar] [CrossRef]
- Zou, J.; Rezaee, R.; Yuan, Y.; Liu, K.; Xie, Q.; You, L. Distribution of adsorbed water in shale: An experimental study on isolated kerogen and bulk shale samples. J. Pet. Sci. Eng. 2019, 187, 106858. [Google Scholar] [CrossRef]
- Chen, G.; Lu, S.; Liu, K.; Han, T.; Xu, C.; Xue, Q.; Shen, B.; Guo, Z. GCMC simulations on the adsorption mechanisms of CH4 and CO2 in K-illite and their implications for shale gas exploration and development. Fuel 2018, 224, 521–528. [Google Scholar] [CrossRef]
- Huang, L.; Ning, Z.; Wang, Q.; Qi, R.; Zeng, Y.; Qin, H.; Ye, H.; Zhang, W. Molecular simulation of adsorption behaviors of methane, carbon dioxide and their mixtures on kerogen: Effect of kerogen maturity and moisture content. Fuel 2018, 211, 159–172. [Google Scholar] [CrossRef]
- Huang, L.; Ning, Z.; Wang, Q. Effect of organic type and moisture on CO2/CH4 competitive adsorption in kerogen with implications for CO2 sequestration and enhanced CH4 recovery. Appl. Energy 2018, 210, 28–43. [Google Scholar]
- Huang, L.; Ning, Z.; Wang, Q. Molecular insights into kerogen deformation induced by CO2/CH4 sorption: effect of maturity and moisture. Energy Fuels 2019, 33, 4792–4805. [Google Scholar]
- Sui, H.; Yao, J.; Zhang, L. Molecular Simulation of Shale Gas Adsorption and Diffusion in Clay Nanopores. Computation 2015, 3, 687–700. [Google Scholar] [CrossRef]
- Babaei, S.; Ghasemzadeh, H.; Tesson, S. Methane adsorption of nanocomposite shale in the presence of water: Insights from molecular simulations. Chem. Eng. J. 2023, 475. [Google Scholar] [CrossRef]
- Wu, T.; Xue, Q.; Li, X.; Tao, Y.; Jin, Y.; Ling, C.; Lu, S. Extraction of kerogen from oil shale with supercritical carbon dioxide: Molecular dynamics simulations. J. Supercrit. Fluids 2016, 107, 499–506. [Google Scholar] [CrossRef]
- Hantal, G.; Brochard, L.; Pellenq, R.J.M. Role of interfaces in elasticity and failure of clay–organic nanocomposites: toughening upon Interface weakening? Langmuir 2017, 33, 11457–11466. [Google Scholar]
- Huang, L.; Zhou, W.; Xu, H.; Wang, L.; Zou, J.; Zhou, Q. Dynamic fluid states in organic-inorganic nanocomposite: Implications for shale gas recovery and CO2 sequestration. Chem. Eng. J. 2021, 411. [Google Scholar] [CrossRef]
- Huang, S.; Ma, X.; Yang, H.; Wu, J.; Zhang, J.; Zhao, S.; Zhang, D.; Ren, C.; Huang, L. Experimental characterization and molecular modeling of kerogen in Silurian deep gas shale from southern Sichuan Basin, China. Energy Rep. 2022, 8, 1497–1507. [Google Scholar] [CrossRef]
- Materials Studio. A material modeling software of Accelrys Company, United States [EB/OL].
- Plimpton, S. Fast parallel algorithms for short-range molecular dynamics. J. Comput. Phys. 1993, 117, 1–19. [Google Scholar]
- Humphrey, W.; Dalke, A.; Schulten, K. VMD: Visual molecular dynamics. J. Mol. Graph. 1996, 14, 33–38. [Google Scholar] [CrossRef]
- Cygan, R.T.; Liang, J.-J.; Kalinichev, A.G. Molecular Models of Hydroxide, Oxyhydroxide, and Clay Phases and the Development of a General Force Field. J. Phys. Chem. B 2004, 108, 1255–1266. [Google Scholar] [CrossRef]
- Hagler, A.T.; Lifson, S.; Dauber, P. Consistent force field studies of intermolecular forces in hydrogen-bonded crystals. 2. A benchmark for the objective comparison of alternative force fields. J. Am. Chem. Soc. 1979, 101, 5122–5130. [Google Scholar] [CrossRef]
- Martin, M.G.; Siepmann, J.I. Transferable Potentials for Phase Equilibria. 1. United-Atom Description of n-Alkanes. J. Phys. Chem. B 1998, 102, 2569–2577. [Google Scholar] [CrossRef]
- Berendsen, H.J.C.; Grigera, J.R.; Straatsma, T.P. The missing term in effective pair potentials. J. Phys. Chem. 1987, 91, 6269–6271. [Google Scholar] [CrossRef]
- Mathias, P.M.; Copeman, T.W. Extension of the Peng-Robinson equation of state to complex mixtures: Evaluation of the various forms of the local composition concept. Fluid Phase Equilibria 1983, 13, 91–108. [Google Scholar] [CrossRef]
- Gelb, L.D.; Gubbins, K.E. Pore Size Distributions in Porous Glasses: A Computer Simulation Study. Langmuir 1998, 15, 305–308. [Google Scholar] [CrossRef]
- Connolly, M.L. Solvent-Accessible Surfaces of Proteins and Nucleic Acids. Science 1983, 221, 709–713. [Google Scholar] [CrossRef] [PubMed]
- Zou, J.; Rezaee, R.; Yuan, Y.; Liu, K.; Xie, Q.; You, L. Distribution of adsorbed water in shale: An experimental study on isolated kerogen and bulk shale samples. J. Pet. Sci. Eng. 2019, 187, 106858. [Google Scholar] [CrossRef]
|
Disclaimer/Publisher’s Note: The statements, opinions and data contained in all publications are solely those of the individual author(s) and contributor(s) and not of MDPI and/or the editor(s). MDPI and/or the editor(s) disclaim responsibility for any injury to people or property resulting from any ideas, methods, instructions or products referred to in the content. |
© 2024 by the authors. Licensee MDPI, Basel, Switzerland. This article is an open access article distributed under the terms and conditions of the Creative Commons Attribution (CC BY) license (http://creativecommons.org/licenses/by/4.0/).

