Submitted:
14 August 2024
Posted:
15 August 2024
You are already at the latest version
Abstract

Keywords:
1. Introduction
2. Results
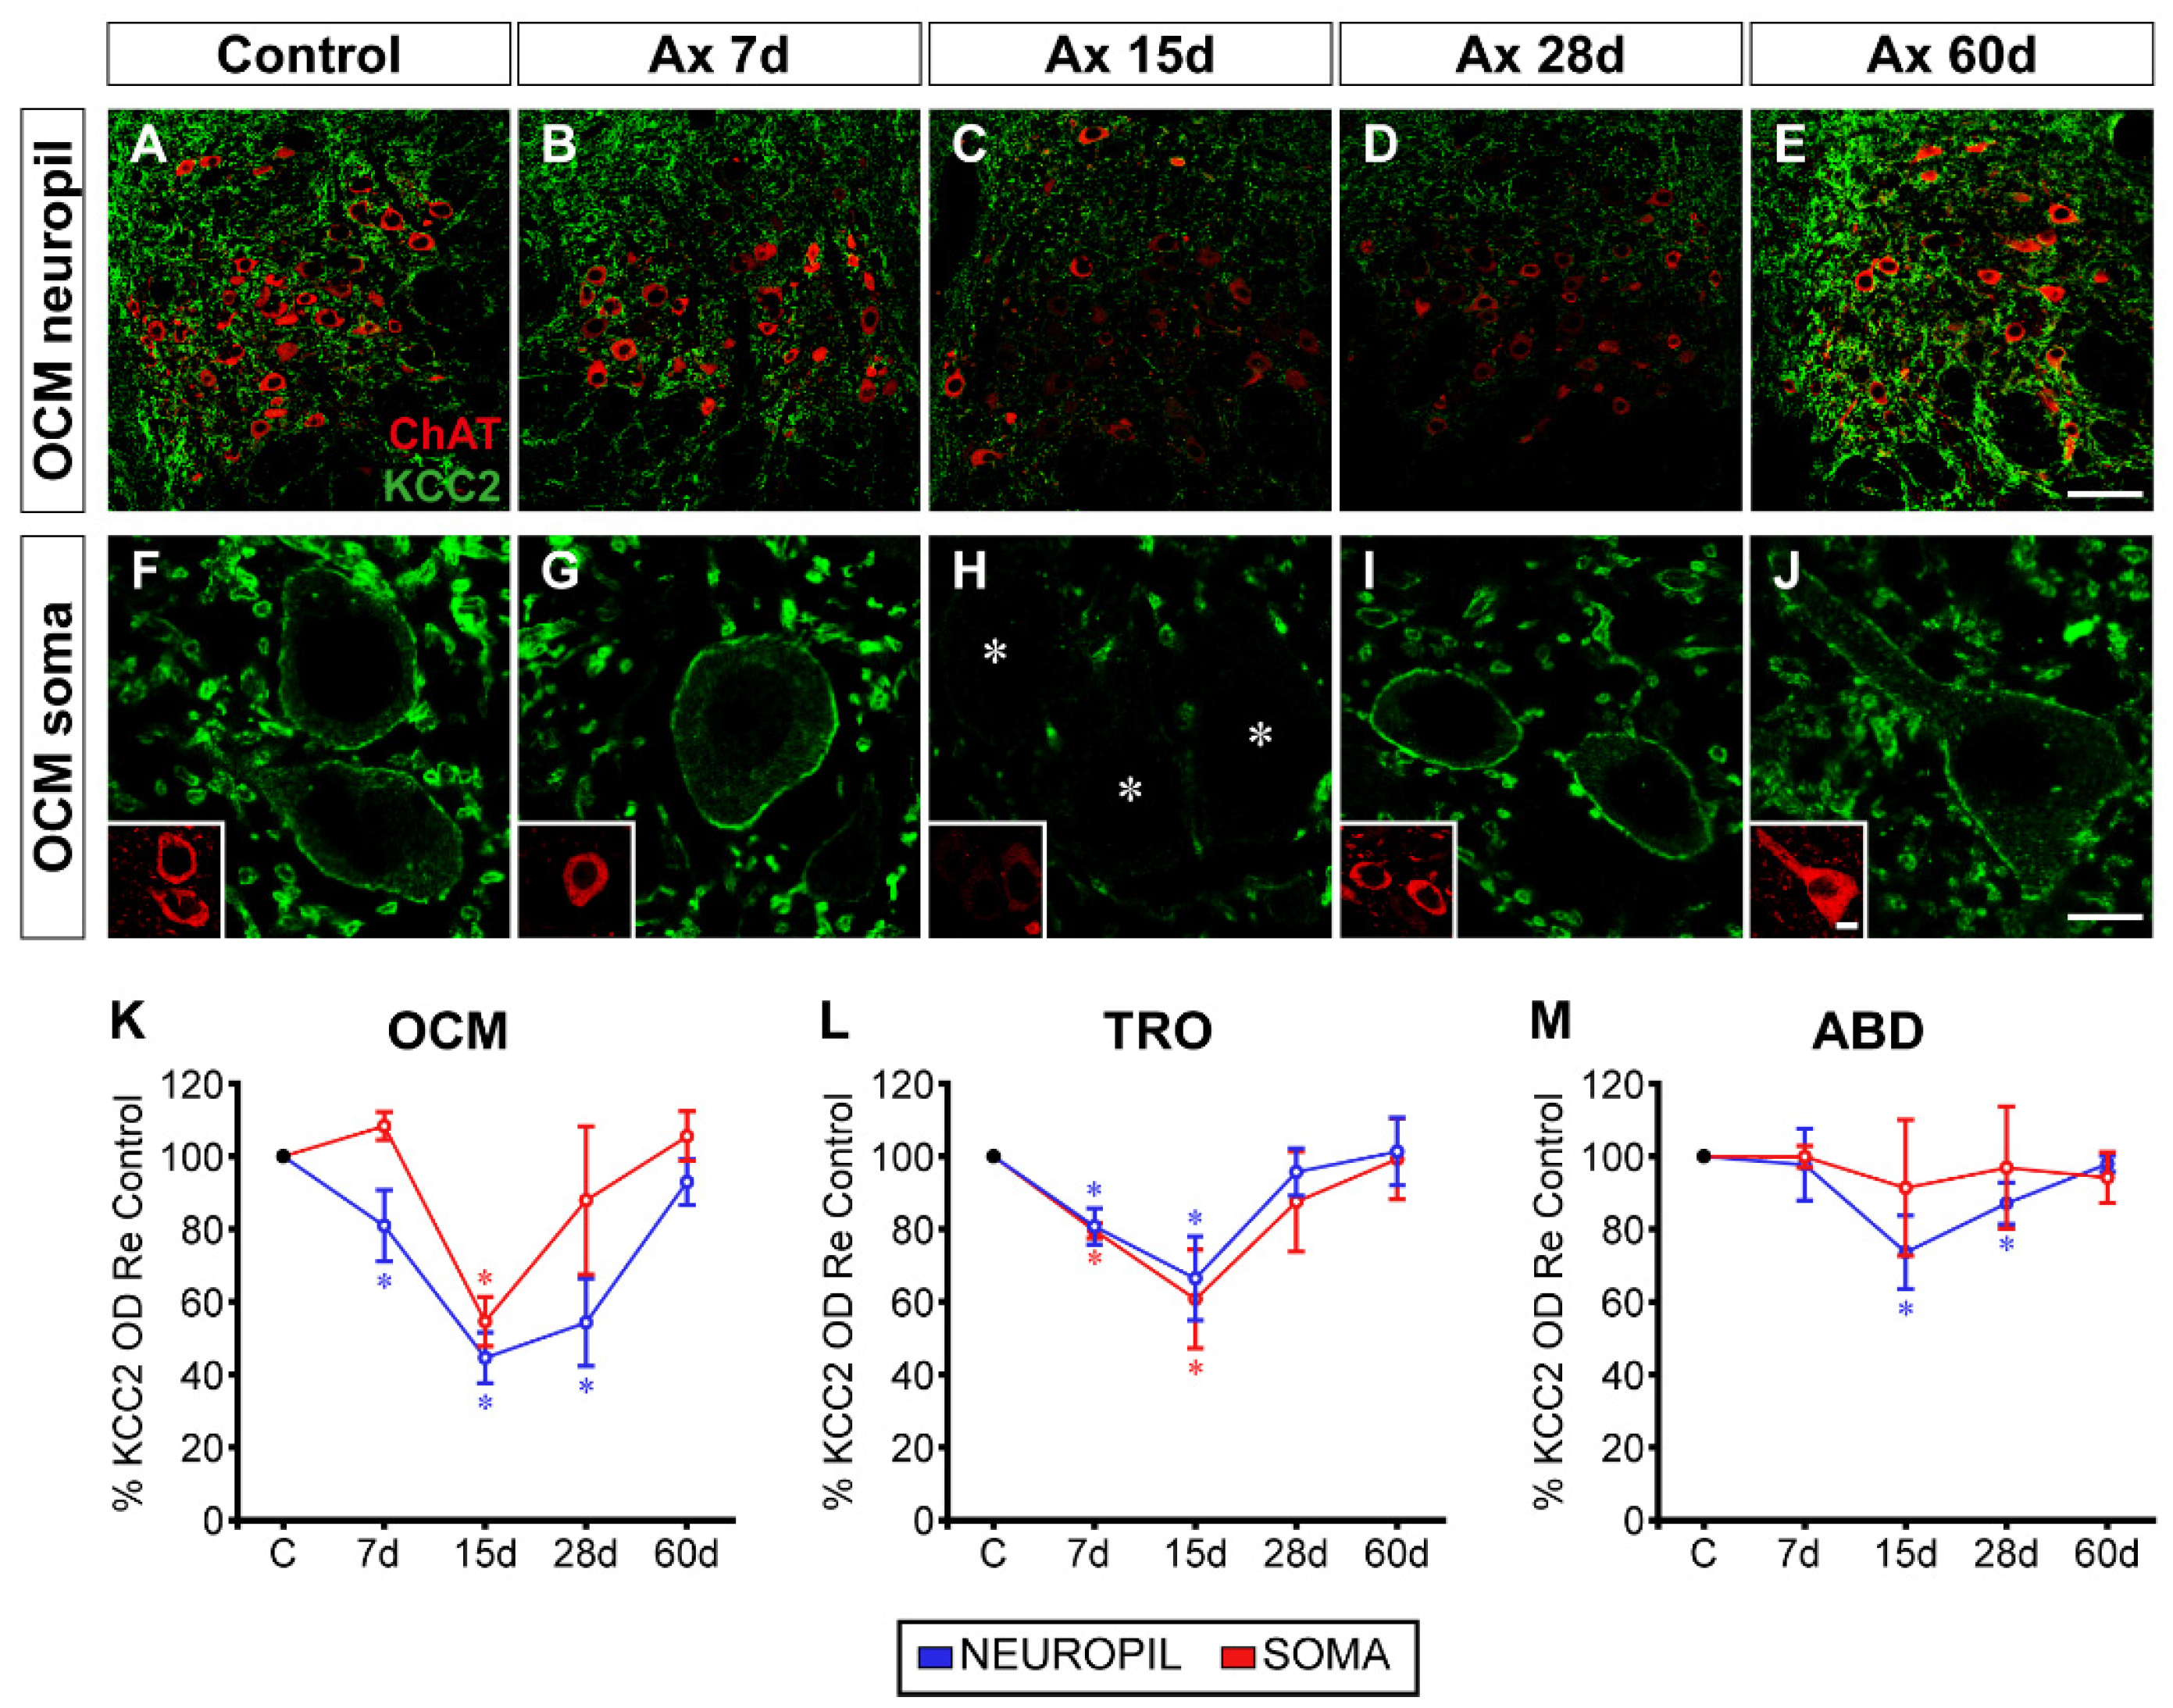
2.1. Time Course of Changes in KCC2 Levels after Axotomy of Extraocular Motoneurons
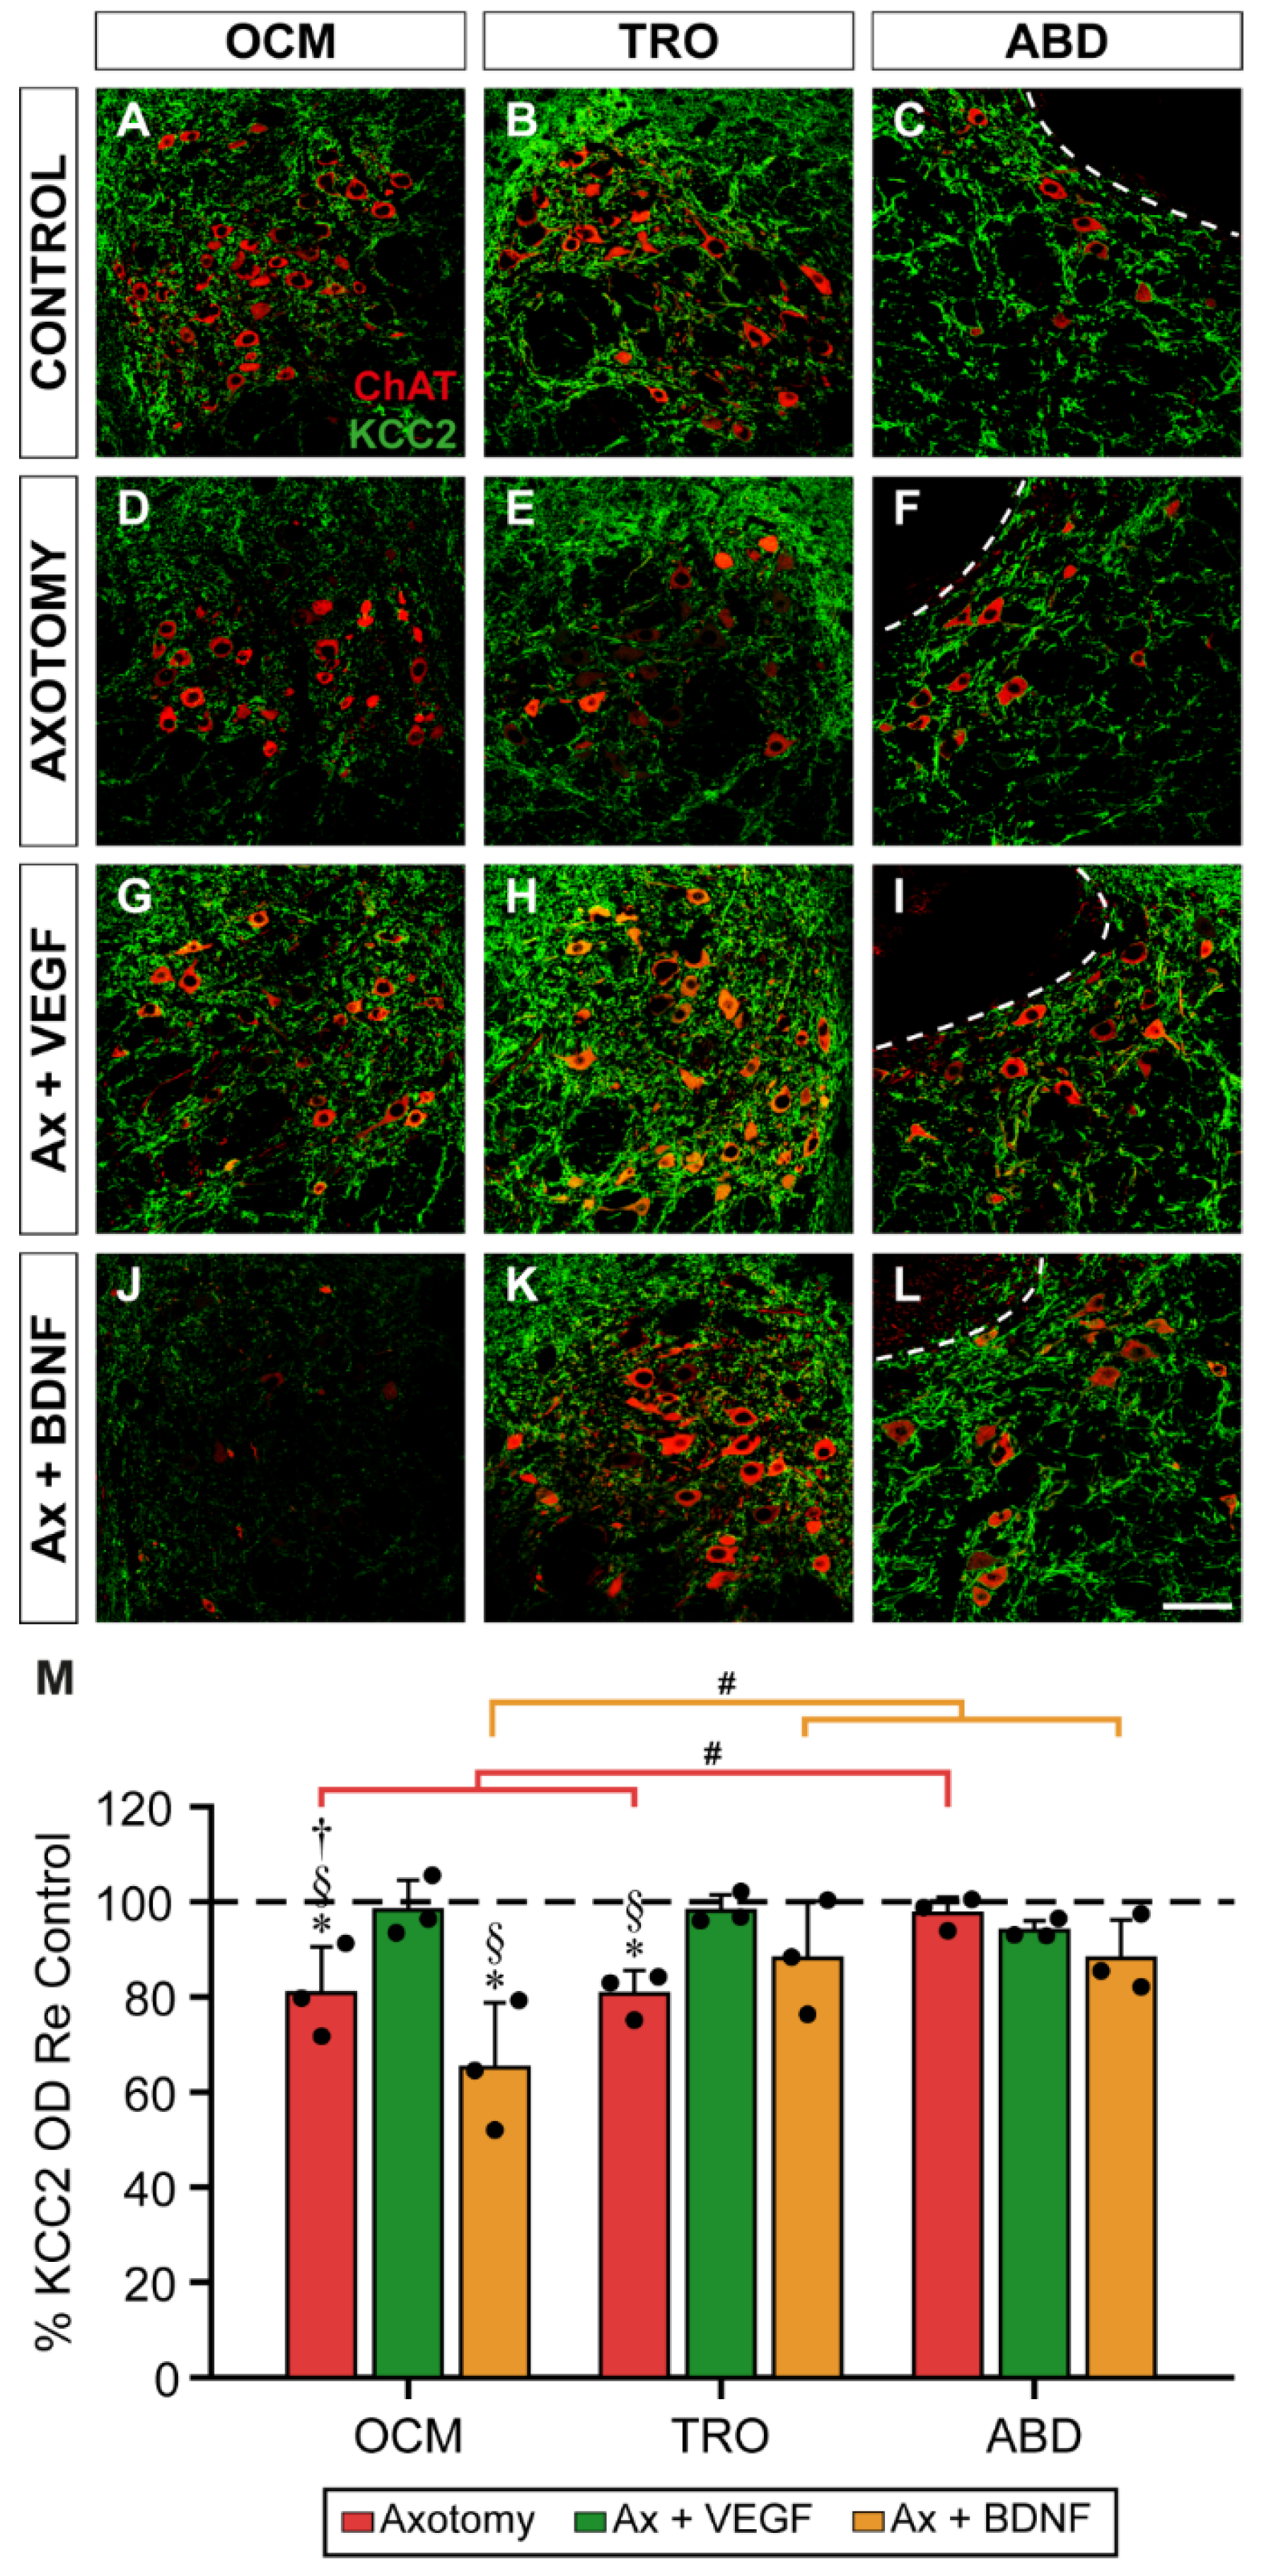
2.2. Neuropil Changes in KCC2 7 Days after Axotomy Plus VEGF or BDNF Administration
2.3. Effects of Axotomy and VEGF or BDNF Administration in KCC2 Levels on the Soma Surface of the Motoneurons at 7 Days Post-Lesion
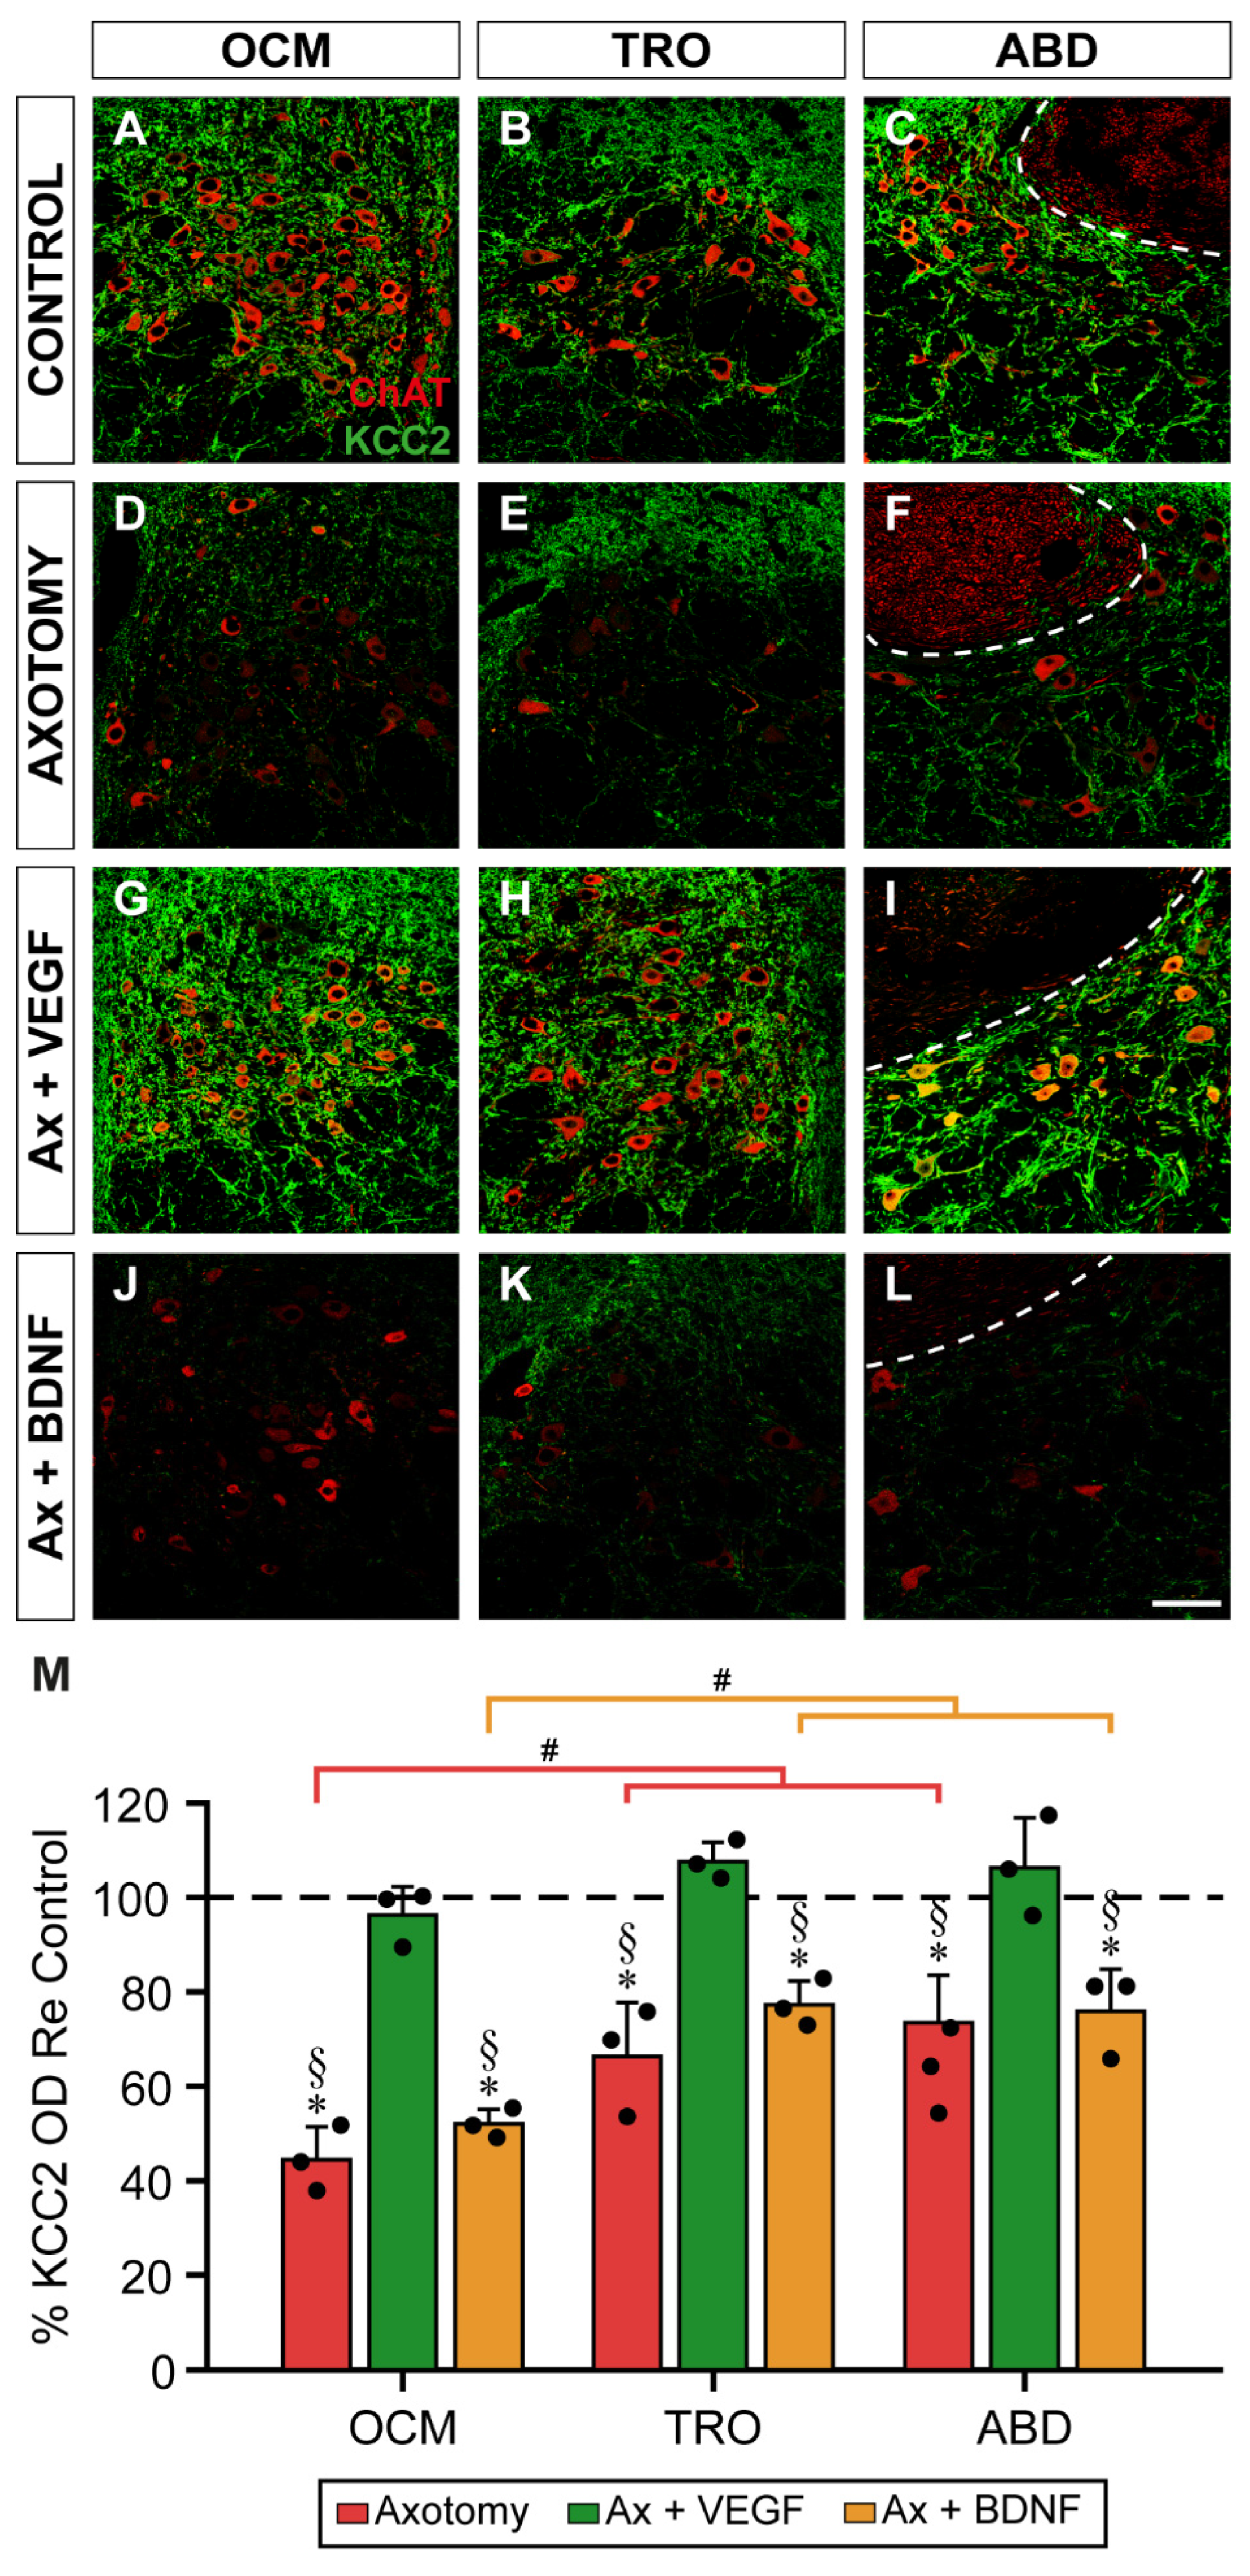
2.4. Changes in KCC2 Levels after Axotomy and VEGF or BDNF Administration in the Neuropil of Extraocular Motor Nuclei at 15 Days Post-Lesion
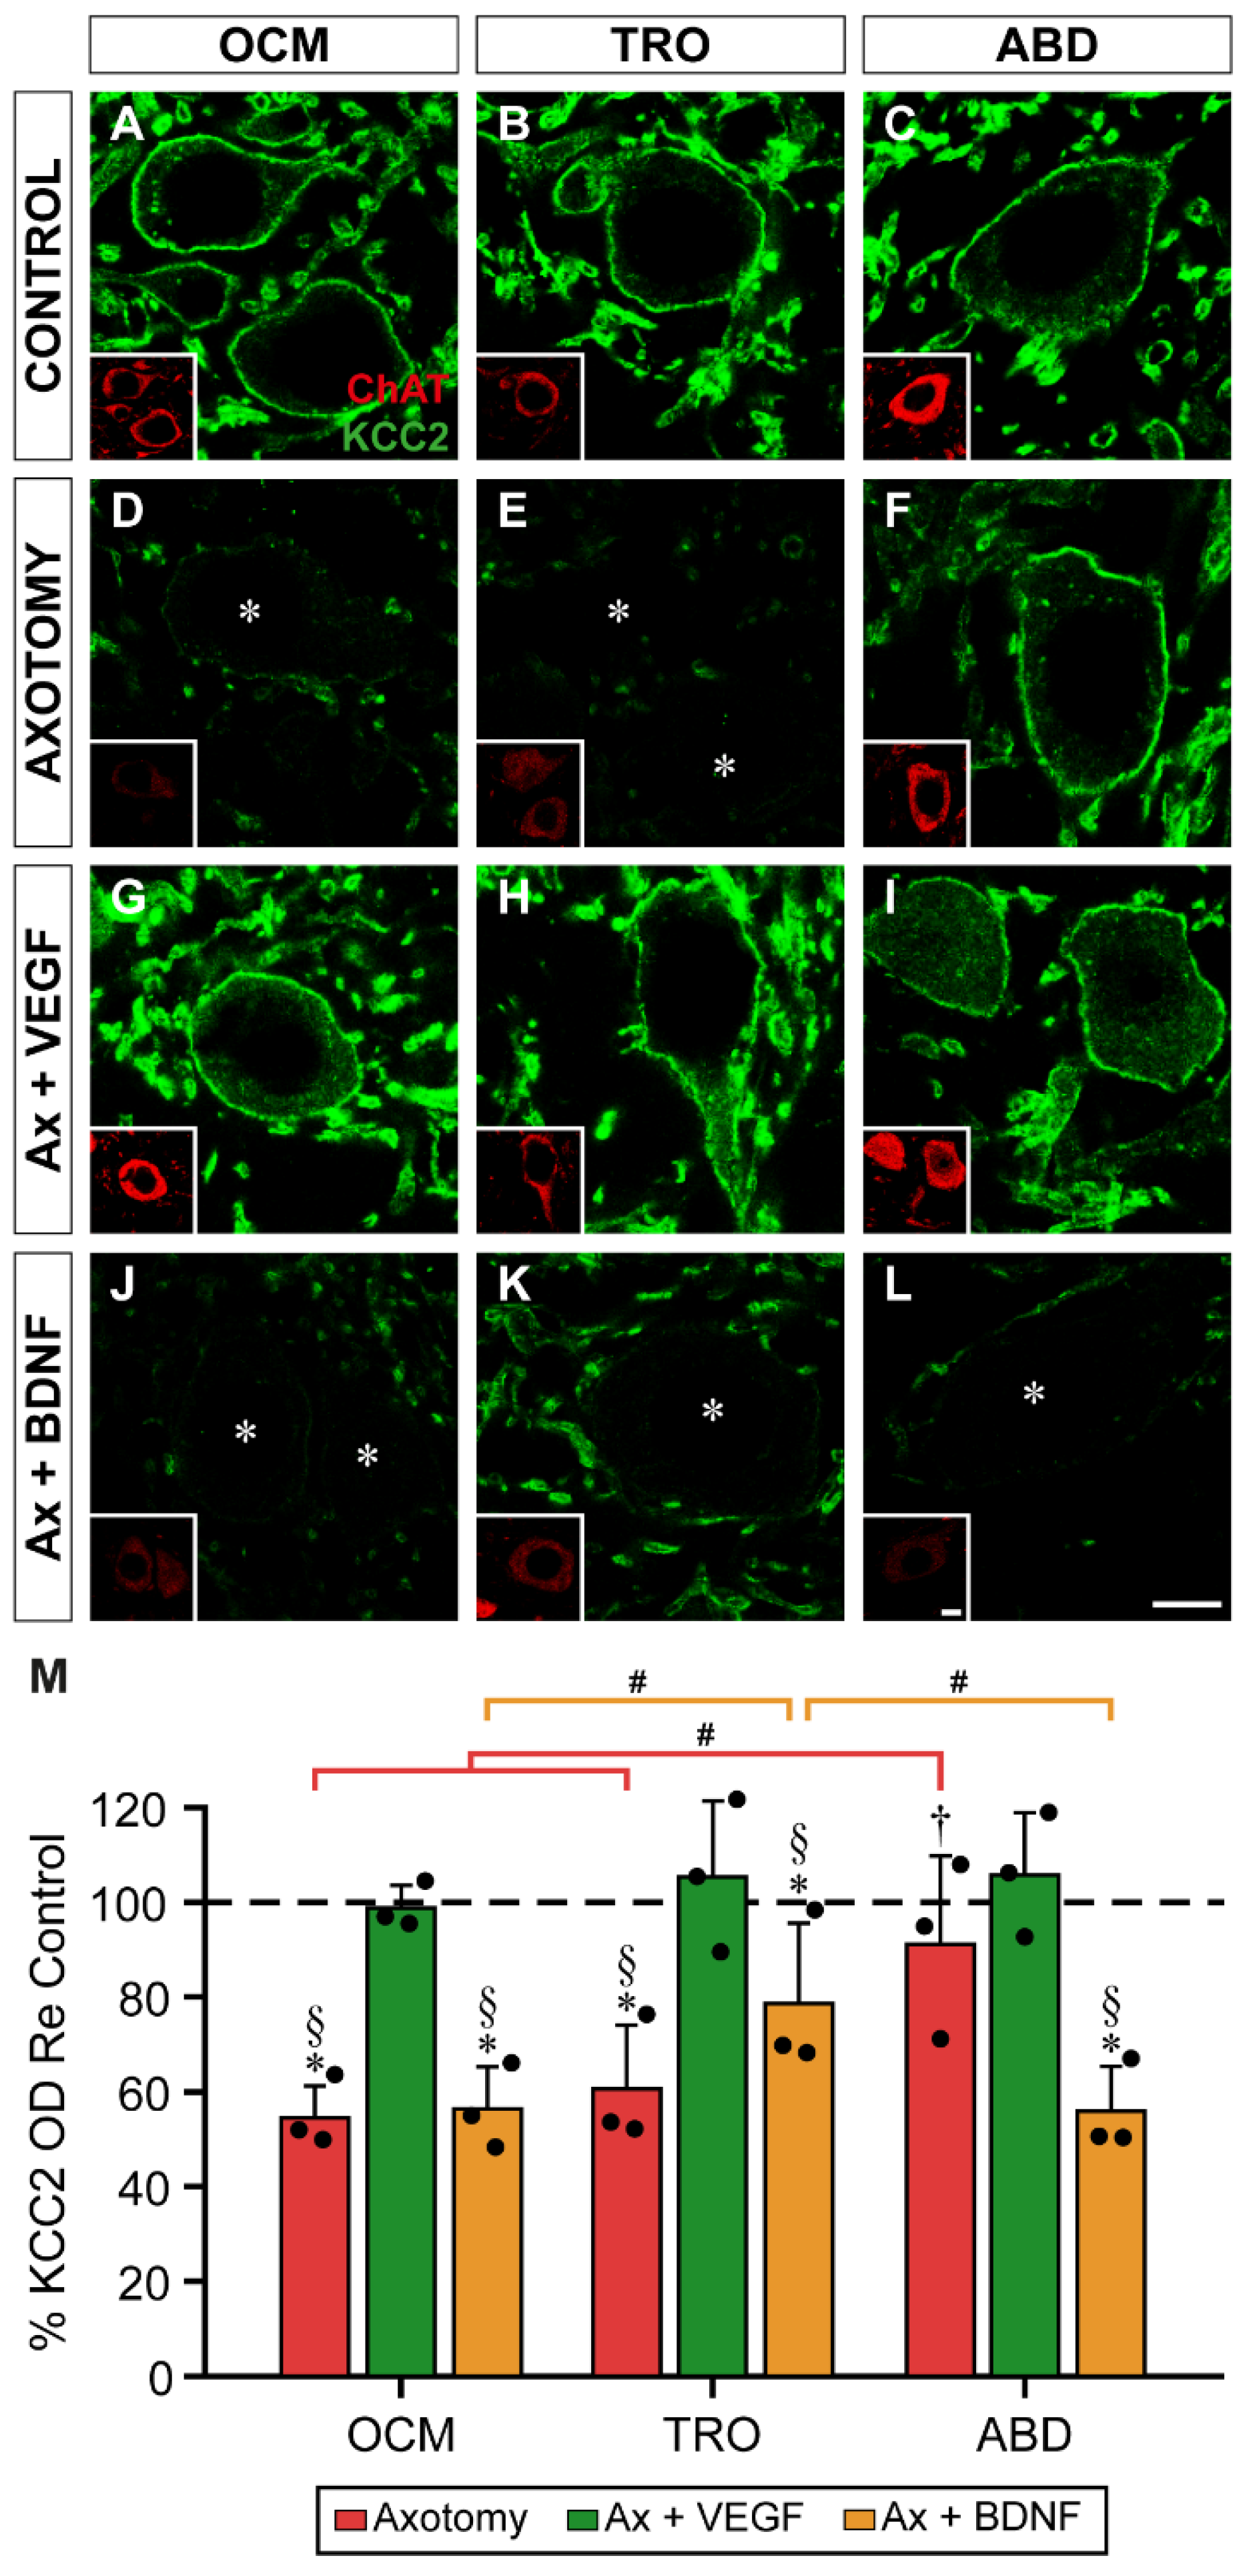
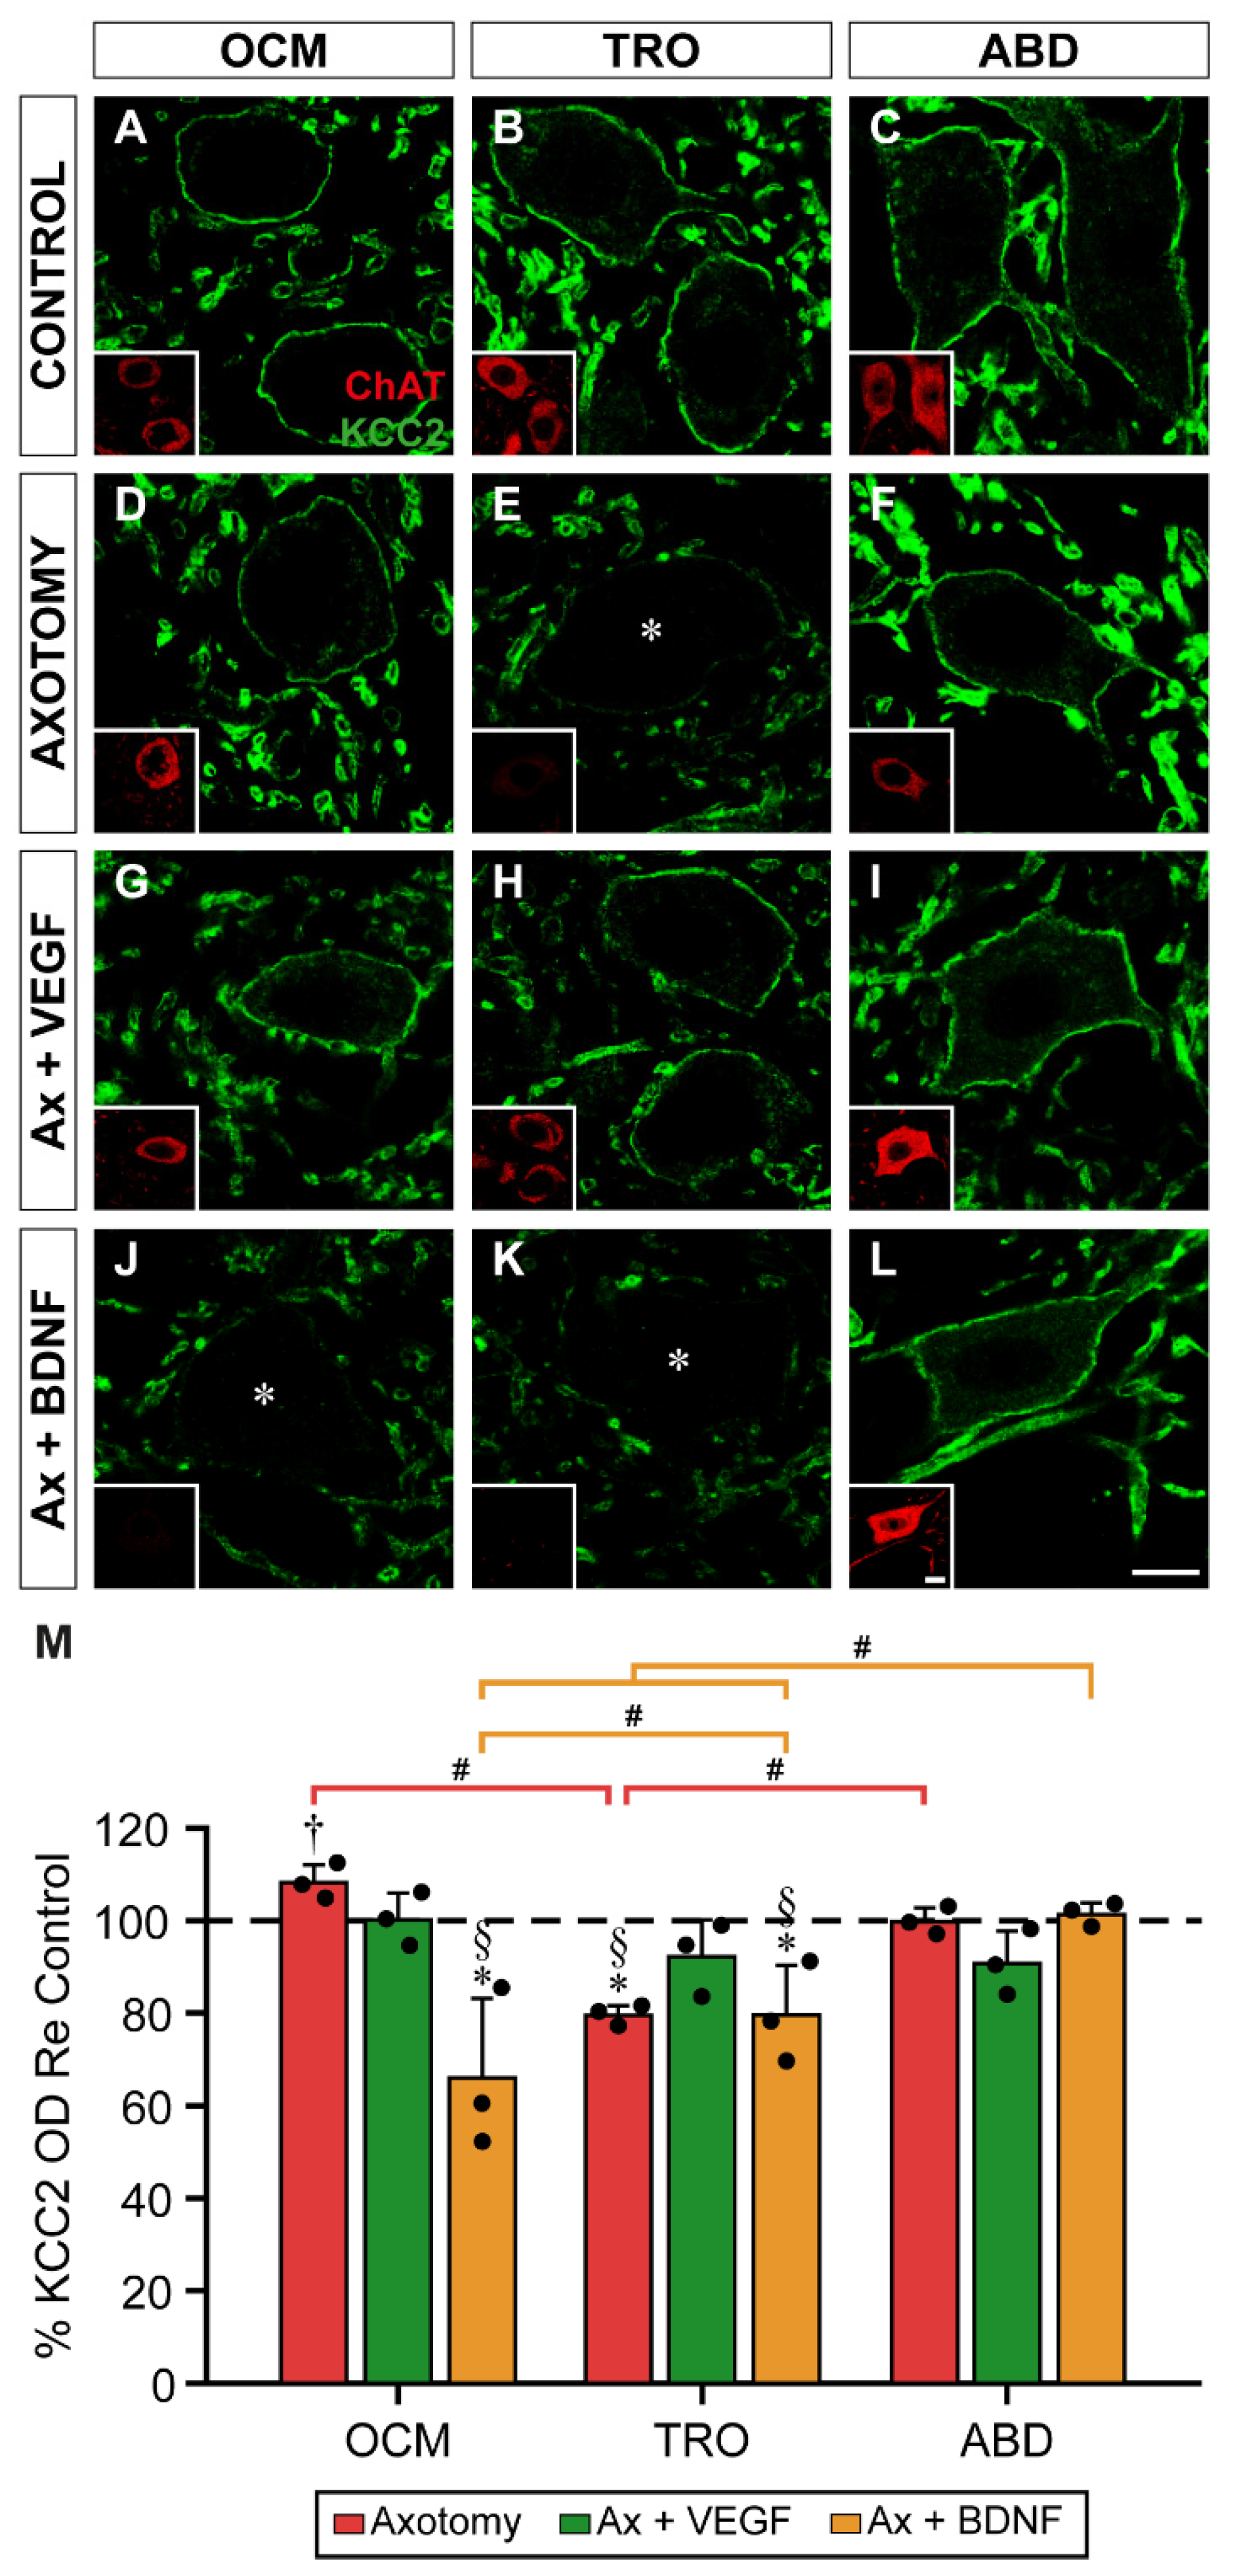
2.5. KCC2 Optical Density in Motoneuron Plasma Membrane 15 Days after Axotomy and VEGF or BDNF Treatment
3. Discussion
3.1. VEGF Prevented KCC2 Downregulation in Axotomized Extraocular Motoneurons
3.2. Effects of BDNF Administration in KCC2 Levels of Axotomized Extraocular Motoneurons
4. Materials and Methods
Animals and Surgical Procedures
Immunofluorescence and Quantification
Statistics
Author Contributions
Funding
Institutional Review Board Statement
Informed Consent Statement
Data Availability Statement
Conflicts of Interest
References
- Akita, T.; Fukuda, A. Intracellular Cl- dysregulation causing and caused by pathogenic neuronal activity. Pflugers Arch. 2020, 472, 977–987. [Google Scholar] [CrossRef] [PubMed]
- Virtanen, M.A.; Uvarov, P.; Mavrovic, M.; Poncer, J.C.; Kaila, K. The multifaceted roles of KCC2 in cortical development. Trends Neurosci. 2021, 44, 378–392. [Google Scholar] [CrossRef]
- Pressey, J.C.; de Saint-Rome, M.; Raveendran, V.A.; Woodin, M.A. Chloride transporters controlling neuronal excitability. Physiol. Rev. 2023, 103, 1095–1135. [Google Scholar] [CrossRef]
- Kim, H.R.; Martina, M. Bidirectional Regulation of GABAA Reversal Potential in the Adult Brain: Physiological and Pathological Implications. Life (Basel) 2024, 14, 143. [Google Scholar] [CrossRef]
- Rivera, C.; Voipio, J.; Payne, J.A.; Ruusuvuori, E.; Lahtinen, H.; Lamsa, K.; Pirvola, U.; Saarma, M.; Kaila, K. The K+/Cl- co-transporter KCC2 renders GABA hyperpolarizing during neuronal maturation. Nature 1999, 397, 251–255. [Google Scholar] [CrossRef]
- Peerboom, C.; Wierenga, C.J. The postnatal GABA shift: A developmental perspective. Neurosci. Biobehav. Rev. 2021, 124, 179–192. [Google Scholar] [CrossRef]
- Shimizu-Okabe, C.; Kobayashi, S.; Kim, J.; Kosaka, Y.; Sunagawa, M.; Okabe, A.; Takayama, C. Developmental formation of the GABAergic and glycinergic networks in the mouse spinal cord. Int. J. Mol. Sci. 2022, 23, 834. [Google Scholar] [CrossRef]
- Raol, Y.H.; Joksimovic, S.M.; Sampath, D.; Matter, B.A.; Lam, P.M.; Kompella, U.B.; Todorovic, S.M.; González, M.I. The role of KCC2 in hyperexcitability of the neonatal brain. Neurosci. Lett. 2020, 738, 135324. [Google Scholar] [CrossRef] [PubMed]
- Ben-Ari, Y.; Cherubini, E. The GABA polarity shift and bumetanide treatment: Making sense requires unbiased and undogmatic analysis. Cells 2022, 11, 396. [Google Scholar] [CrossRef]
- Kalemaki, K.; Velli, A.; Christodoulou, O.; Denaxa, M.; Karagogeos, D.; Sidiropoulou, K. The developmental changes in intrinsic and synaptic properties of prefrontal neurons enhance local network activity from the second to the third postnatal weeks in mice. Cereb. Cortex 2022, 32, 3633–3650. [Google Scholar] [CrossRef]
- Delpy, A.; Allain, A.E.; Meyrand, P.; Branchereau, P. NKCC1 cotransporter inactivation underlies embryonic development of chloride-mediated inhibition in mouse spinal motoneuron. J. Physiol. 2008, 586, 1059–1075. [Google Scholar] [CrossRef]
- Branchereau, P.; Cattaert, D. Chloride homeostasis in developing motoneurons. Adv. Neurobiol. 2022, 28, 45–61. [Google Scholar] [CrossRef]
- Coull, J.A.; Boudreau, D.; Bachand, K.; Prescott, S.A.; Nault, F.; Sík, A.; De Koninck, P.; De Koninck, Y. Trans-synaptic shift in anion gradient in spinal lamina I neurons as a mechanism of neuropathic pain. Nature 2003, 424, 938–942. [Google Scholar] [CrossRef] [PubMed]
- Tillman, L.; Zhang, J. Crossing the chloride channel: The current and potential therapeutic value of the neuronal K+-Cl- cotransporter KCC2. Biomed. Res. Int. 2019, 2019, 8941046. [Google Scholar] [CrossRef]
- Belperio, G.; Corso, C.; Duarte, C.B.; Mele, M. Molecular mechanisms of epilepsy: The role of the chloride transporter KCC2. J. Mol. Neurosci. 2022, 72, 1500–1515. [Google Scholar] [CrossRef]
- Lam, P.; Newland, J.; Faull, R.L.M.; Kwakowsky, A. Cation-chloride cotransporters KCC2 and NKCC1 as therapeutic targets in neurological and neuropsychiatric disorders. Molecules 2023, 28, 1344. [Google Scholar] [CrossRef]
- McMoneagle, E.; Zhou, J.; Zhang, S.; Huang, W.; Josiah, S.S.; Ding, K.; Wang, Y.; Zhang, J. Neuronal K+-Cl- cotransporter KCC2 as a promising drug target for epilepsy treatment. Acta Pharmacol. Sin. 2024, 45, 1–22. [Google Scholar] [CrossRef] [PubMed]
- Nascimento, A.A.; Pereira-Figueiredo, D.; Borges-Martins, V.P.; Kubrusly, R.C.; Calaza, K.C. GABAergic system and chloride cotransporters as potential therapeutic targets to mitigate cell death in ischemia. J. Neurosci. Res. 2024, 102, e25355. [Google Scholar] [CrossRef]
- Ferrari, D.C.; Ben-Ar, Y. Disruptions in chloride transporter activity in autism spectrum disorders. In Neuronal Chloride Transporters in Health and Disease; Tang, X., Ed.; Elsevier: London, UK, 2020; pp. 549–568. [Google Scholar]
- Mohaghghegh, H.; Ananloo, E.S.; Hadjighasemm, M.; Karimipour, M.; Hashemizadeh, S.; Abhari, S.A.A. NKCC1 to KCC2 mRNA Ratio in Schizophrenia and Its Psychopathology: a Case Control Study. J. Mol. Neurosci. 2022, 72, 1670–1681. [Google Scholar] [CrossRef] [PubMed]
- Boulenguez, P.; Liabeuf, S.; Bos, R.; Bras, H.; Jean-Xavier, C.; Brocard, C.; Stil, A.; Darbon, P.; Cattaert, D.; Delpire, E.; Marsala, M.; Vinay, L. Down-regulation of the potassium-chloride cotransporter KCC2 contributes to spasticity after spinal cord injury. Nat. Med. 2010, 16, 302–307. [Google Scholar] [CrossRef]
- Bos, R.; Sadlaoud, K.; Boulenguez, P.; Buttigieg, D.; Liabeuf, S.; Brocard, C.; Haase, G.; Bras, H.; Vinay, L. Activation of 5-HT2A receptors upregulates the function of the neuronal K-Cl cotransporter KCC2. Proc. Natl. Acad. Sci. U.S.A. 2013, 110, 348–353. [Google Scholar] [CrossRef] [PubMed]
- Bilchak, J.N.; Yeakle, K.; Caron, G.; Malloy, D.; Côté, M.P. Enhancing KCC2 activity decreases hyperreflexia and spasticity after chronic spinal cord injury. Exp. Neurol. 2021, 338, 113605. [Google Scholar] [CrossRef]
- Mòdol, L.; Mancuso, R.; Alé, A.; Francos-Quijorna, I.; Navarro, X. Differential effects on KCC2 expression and spasticity of ALS and traumatic injuries to motoneurons. Front. Cell. Neurosci. 2014, 8, 7. [Google Scholar] [CrossRef]
- Akhter, E.T.; Griffith, R.W.; English, A.W.; Alvarez, F.J. Removal of the potassium chloride co-transporter from the somatodendritic membrane of axotomized motoneurons is independent of BDNF/TrkB signaling but is controlled by neuromuscular innervation. eNeuro 2019, 6, ENEURO.0172‐19.2019. [Google Scholar] [CrossRef] [PubMed]
- Yafuso, T.; Kosaka, Y.; Shimizu-Okabe, C.; Okura, N.; Kobayashi, S.; Kim, J.; Matsuda, K.; Kinjo, D.; Okabe, A.; Takayama, C. Slow progression of sciatic nerve degeneration and regeneration after loose ligation through microglial activation and decreased KCC2 levels in the mouse spinal cord ventral horn. Neurosci. Res. 2022, 177, 52–63. [Google Scholar] [CrossRef]
- Cheung, D.L.; Toda, T.; Narushima, M.; Eto, K.; Takayama, C.; Ooba, T.; Wake, H.; Moorhouse, A.J.; Nabekura, J. KCC2 downregulation after sciatic nerve injury enhances motor function recovery. Sci. Rep. 2023, 13, 7871. [Google Scholar] [CrossRef] [PubMed]
- Toyoda, H.; Ohno, K.; Yamada, J.; Ikeda, M.; Okabe, A.; Sato, K.; Hashimoto, K.; Fukuda, A.J. Induction of NMDA and GABAA receptor-mediated Ca2+ oscillations with KCC2 mRNA downregulation in injured facial motoneurons. J. Neurophysiol. 2003, 89, 1353–1362. [Google Scholar] [CrossRef] [PubMed]
- Kim, J.; Kobayashi, S.; Shimizu-Okabe, C.; Okabe, A.; Moon, C.; Shin, T.; Takayama, C. Changes in the expression and localization of signaling molecules in mouse facial motor neurons during regeneration of facial nerves. J. Chem. Neuroanat. 2018, 88, 13–21. [Google Scholar] [CrossRef] [PubMed]
- Tatetsu, M.; Kim, J.; Kina, S.; Sunakawa, H.; Takayama, C. GABA/glycine signaling during degeneration and regeneration of mouse hypoglossal nerves. Brain Res. 2012, 1446, 22–33. [Google Scholar] [CrossRef]
- Nabekura, J.; Ueno, T.; Okabe, A.; Furuta, A.; Iwaki, T.; Shimizu-Okabe, C.; Fukuda, A.; Akaike, N. Reduction of KCC2 expression and GABAA receptor-mediated excitation after in vivo axonal injury. J. Neurosci. 2002, 22, 4412–4417. [Google Scholar] [CrossRef]
- Calvo, P.M.; de la Cruz, R.R.; Pastor, A.M.; Alvarez, F.J. Preservation of KCC2 expression in axotomized abducens motoneurons and its enhancement by VEGF. Brain Struct. Funct. 2023, 228, 967–984. [Google Scholar] [CrossRef] [PubMed]
- Aguado, F.; Carmona, M.A.; Pozas, E.; Aguiló, A.; Martínez-Guijarro, F.J.; Alcantara, S.; Borrell, V.; Yuste, R.; Ibañez, C.F.; Soriano, E. BDNF regulates spontaneous correlated activity at early developmental stages by increasing synaptogenesis and expression of the K+/Cl- co-transporter KCC2. Development 2003, 130, 1267–1280. [Google Scholar] [CrossRef] [PubMed]
- Ludwig, A.; Uvarov, P.; Soni, S.; Thomas-Crusells, J.; Airaksinen, M.S.; Rivera, C. Early growth response 4 mediates BDNF induction of potassium chloride cotransporter 2 transcription. J. Neurosci. 2011, 31, 644–649. [Google Scholar] [CrossRef] [PubMed]
- Shulga, A.; Thomas-Crusells, J.; Sigl, T.; Blaesse, A.; Mestres, P.; Meyer, M.; Yan, Q.; Kaila, K.; Saarma, M.; Rivera, C.; Giehl, K.M. Posttraumatic GABA(A)-mediated [Ca2+]i increase is essential for the induction of brain-derived neurotrophic factor-dependent survival of mature central neurons. J. Neurosci. 2008, 28, 6996–7005. [Google Scholar] [CrossRef] [PubMed]
- Eftekhari, S.; Mehrabi, S.; Soleimani, M.; Hassanzadeh, G.; Shahrokhi, A.; Mostafavi, H.; Hayat, P.; Barati, M.; Mehdizadeh, H.; Rahmanzadeh, R.; Hadjighassem, M.R.; Joghataei, M.T. BDNF modifies hippocampal KCC2 and NKCC1 expression in a temporal lobe epilepsy model. Acta Neurobiol. Exp. 2014, 74, 276–287. [Google Scholar] [CrossRef] [PubMed]
- Lee-Hotta, S.; Uchiyama, Y.; Kametaka, S. Role of the BDNF-TrkB pathway in KCC2 regulation and rehabilitation following neuronal injury: A mini review. Neurochem. Int. 2019, 128, 32–38. [Google Scholar] [CrossRef] [PubMed]
- Beverungen, H.; Klaszky, S.C.; Klaszky, M.; Côté, M.P. Rehabilitation decreases spasticity by restoring chloride homeostasis through the brain-derived neurotrophic factor-KCC2 pathway after spinal cord injury. J. Neurotrauma. 2020, 37, 846–859. [Google Scholar] [CrossRef]
- Miletic, G.; Miletic, V. Loose ligation of the sciatic nerve is associated with TrkB receptor-dependent decreases in KCC2 protein levels in the ipsilateral spinal dorsal horn. Pain 2008, 137, 532–539. [Google Scholar] [CrossRef]
- Tsuruga, K.; Hashimoto, T.; Kato, R.; Kato, R.; Uchida, Y.; Hase, T.; Morimoto, Y. Plantar injection of formalin in rats reduces the expression of a potassium chroride cotransporter KCC2 in the spinal cord and a kinase inhibitor suppresses this reduction. Biomed. Res. 2016, 37, 243–249. [Google Scholar] [CrossRef]
- Ma, J.J.; Zhang, T.Y.; Diao, X.T.; Yao, L.; Li, Y.X.; Suo, Z.W.; Yang, X.; Hu, X.D.; Liu, Y.N. BDNF modulated KCC2 ubiquitylation in spinal cord dorsal horn of mice. Eur. J. Pharmacol. 2021, 906, 174205. [Google Scholar] [CrossRef]
- Hu, Z.; Yu, X.; Chen, P.; Jin, K.; Zhou, J.; Wang, G.; Yu, J.; Wu, T.; Wang, Y.; Lin, F.; Zhang, T.; Wang, Y.; Zhao, X. BDNF-TrkB signaling pathway-mediated microglial activation induces neuronal KCC2 downregulation contributing to dynamic allodynia following spared nerve injury. Mol. Pain 2023, 19, 17448069231185439. [Google Scholar] [CrossRef] [PubMed]
- Rivera, C.; Voipio, J.; Thomas-Crusells, J.; Li, H.; Emri, Z.; Sipilä, S.; Payne, J.A.; Minichiello, L.; Saarma, M.; Kaila, K. Mechanism of activity-dependent downregulation of the neuron-specific K-Cl cotransporter KCC2. J. Neurosci. 2004, 24, 4683–4691. [Google Scholar] [CrossRef]
- Hudson, K.E.; Grau, J.W. Ionic plasticity: Common mechanistic underpinnings of pathology in spinal cord injury and the brain. Cells 2022, 11, 2910. [Google Scholar] [CrossRef]
- Zhao, S.; Wang, F.; Wang, L.; Xu, Y.; Lv, L.; Duan, W.; Bai, R.; Meng, Z.; Shao, X. Involvement of the BDNF-TrkB-KCC2 pathway in neuropathic pain after brachial plexus avulsion. Brain Behav. 2022, 12, e2464. [Google Scholar] [CrossRef]
- Fritzsch, B. Evolution and development of extraocular motor neurons, nerves and muscles in vertebrates. Ann. Anat. 2024, 253, 152225. [Google Scholar] [CrossRef] [PubMed]
- Calvo, P.M.; de la Cruz, R.R.; Pastor, A.M. Synaptic loss and firing alterations in axotomized motoneurons are restored by vascular endothelial growth factor (VEGF) and VEGF-B. Exp. Neurol. 2018, 304, 67–81. [Google Scholar] [CrossRef]
- Calvo, P.M.; Hernández, R.G.; de la Cruz, R.R.; Pastor, A.M. VEGF is an essential retrograde trophic factor for motoneurons. Proc. Natl. Acad. Sci. U.S.A. 2022, 119, e2202912119. [Google Scholar] [CrossRef] [PubMed]
- Oosthuyse, B.; et al. Deletion of the hypoxia-response element in the vascular endothelial growth factor promoter causes motor neuron degeneration. Nat. Genet. 2001, 28, 131–138. [Google Scholar] [CrossRef]
- Calvo, P.M.; Hernández, R.G.; Pastor, A.M.; de la Cruz, R.R. VEGF and neuronal survival. Neuroscientist 2024, 30, 71–86. [Google Scholar] [CrossRef]
- Tovar-y-Romo, L.B.; Tapia, R. VEGF protects spinal motor neurons against chronic excitotoxic degeneration in vivo by activation of PI3-K pathway and inhibition of p38MAPK. J. Neurochem. 2010, 115, 1090–1101. [Google Scholar] [CrossRef]
- Lladó, J.; Tolosa, L.; Olmos, G. Cellular and molecular mechanisms involved in the neuroprotective effects of VEGF on motoneurons. Front. Cell. Neurosci. 2013, 7, 181. [Google Scholar] [CrossRef] [PubMed]
- Rivera, C.; Li, H.; Thomas-Crusells, J.; Lahtinen, H.; Viitanen, T.; Nanobashvili, A.; Kokaia, Z.; Airaksinen, M.S.; Voipio, J.; Kaila, K.; Saarma, M. BDNF-induced TrkB activation down-regulates the K+-Cl- cotransporter KCC2 and impairs neuronal Cl- extrusion. J. Cell. Biol. 2002, 159, 747–752. [Google Scholar] [CrossRef] [PubMed]
- Patel, D.C.; Thompson, E.G.; Sontheimer, H. Brain-derived neurotrophic factor inhibits the function of cation-chloride cotransporter in a mouse model of viral infection-induced epilepsy. Front. Cell Dev. Biol. 2022, 10, 961292. [Google Scholar] [CrossRef]
- Carter, B.M.; Sullivan, B.J.; Landers, J.R.; Kadam, S.D. Dose-dependent reversal of KCC2 hypofunction and phenobarbital-resistant neonatal seizures by ANA12. Sci. Rep. 2018, 8, 11987. [Google Scholar] [CrossRef]
- Tashiro, S.; Shinozaki, M.; Mukaino, M.; Renault-Mihara, F.; Toyama., Y.; Liu, M.; Nakamura, M.; Okano, H. BDNF induced by treadmill training contributes to the suppression of spasticity and allodynia after spinal cord injury via upregulation of KCC2. Neurorehabil. Neural Repair 2015, 29, 677–689. [Google Scholar] [CrossRef]
- Carmona, M.A.; Pozas, E.; Martínez, A.; Espinosa-Parrilla, J.F.; Soriano, E.; Aguado, F. Age-dependent spontaneous hyperexcitability and impairment of GABAergic function in the hippocampus of mice lacking trkB. Cereb. Cortex 2006, 16, 47–63. [Google Scholar] [CrossRef]
- Huang, Y.J.; Lee, K.H.; Grau, J.W. Complete spinal cord injury (SCI) transforms how brain derived neurotrophic factor (BDNF) affects nociceptive sensitization. Exp. Neurol. 2017, 288, 38–50. [Google Scholar] [CrossRef] [PubMed]
- Morcuende, S.; Benítez-Temiño, B.; Pecero, M.L.; Pastor, A.M.; de la Cruz, R.R. Abducens internuclear neurons depend on their target motoneurons for survival during early postnatal development. Exp. Neurol. 2005, 195, 244–256. [Google Scholar] [CrossRef]
- Morcuende, S.; Matarredona, E.R.; Benítez-Temiño, B.; Muñoz-Hernández, R.; Pastor, A.M.; de la Cruz, R.R. Differential regulation of the expression of neurotrophin receptors in rat extraocular motoneurons after lesion. J. Comp. Neurol. 2011, 519, 2335–2352. [Google Scholar] [CrossRef]
- Morcuende, S.; Muñoz-Hernández, R.; Benítez-Temiño, B.; Pastor, A.M.; de la Cruz, R.R. Neuroprotective effects of NGF, BDNF, NT-3 and GDNF on axotomized extraocular motoneurons in neonatal rats. Neuroscience 2013, 250, 31–48. [Google Scholar] [CrossRef]
- Acosta, L.; Morcuende, S.; Silva-Hucha, S.; Pastor, A.M.; de la Cruz, R.R. Vascular endothelial growth factor (VEGF) prevents the downregulation of the cholinergic phenotype in axotomized motoneurons of the adult rat. Front. Mol. Neurosci. 2018, 11, 241. [Google Scholar] [CrossRef] [PubMed]
- Davis-López de Carrizosa, M.A.; Morado-Díaz, C.J.; Tena, J.J.; Benítez-Temiño, B.; Pecero, M.L.; Morcuende, S.R.; de la Cruz, R.R.; Pastor, A.M. Complementary actions of BDNF and neurotrophin-3 on the firing patterns and synaptic composition of motoneurons. J. Neurosci. 2009, 29, 575–587. [Google Scholar] [CrossRef] [PubMed]
- Evinger, C. Extraocular motor nuclei: location, morphology and afferents. In Neuroanatomy of the Oculomotor System; Büttner-Ennever, J.A., Ed.; Elsevier: Amsterdam, Netherlands, 1988; pp. 81–117. [Google Scholar]
- Uvarov, P.; Ludwig, A.; Markkanen, M.; Pruunsild, P.; Kaila, K.; Delpire, E.; Timmusk, T.; Rivera, C.; Airaksinen, M.S. A novel N-terminal isoform of the neuron-specific K-Cl cotransporter KCC2. J. Biol. Chem. 2007, 282, 30570–30576. [Google Scholar] [CrossRef] [PubMed]
- Markkanen, M.; Karhunen, T.; Llano, O.; Ludwig., A.; Rivera, C.; Uvarov, P.; Airaksinen, M.S. Distribution of neuronal KCC2a and KCC2b isoforms in mouse CNS. J. Comp. Neurol. 2014, 522, 1897–1914. [Google Scholar] [CrossRef]
Disclaimer/Publisher’s Note: The statements, opinions and data contained in all publications are solely those of the individual author(s) and contributor(s) and not of MDPI and/or the editor(s). MDPI and/or the editor(s) disclaim responsibility for any injury to people or property resulting from any ideas, methods, instructions or products referred to in the content. |
© 2024 by the authors. Licensee MDPI, Basel, Switzerland. This article is an open access article distributed under the terms and conditions of the Creative Commons Attribution (CC BY) license (http://creativecommons.org/licenses/by/4.0/).


