1. Introduction
Baryonic matter occurs as interstellar gas and stellar material in galaxies. The relationship between interstellar gas, stars and metals is a central issue for understanding the cosmic baryon cycle in galaxies [
29,
35,
45]. Stars form from the collapse of interstellar gas clouds consisting mainly of hydrogen and helium, evolve with time undergoing nuclear fusion reactions thereby creating metals i.e. elements heavier than helium [
3,
5,
25,
36]. It is well established that external pressure on gas clouds reduces the critical cloud mass for collapse to the Bonnor-Ebert mass [
1,
11] being considerably smaller than the Jeans mass for the spontaneous collapse of gas clouds. Therefore it is interesting to investigate both, the spontaneous star formation of gas clouds as well as the triggered star formation due to the interaction of the gas with already formed stars. During the stellar evolution part of the metal-enriched stellar matter is continuously fed back into the interstellar medium (ISM) by stellar winds and outflows [
9,
39,
45]. Moreover, at the termination of stellar fusion reactions the powerful novae and supernovae resulting from the fatal star’s collapse eject further stellar material to the ISM whereas the central cores of the original stars, depending on the stellar mass, end up as locked-in matter in the form of white dwarfs, neutron stars and black holes [
14,
15,
24,
37,
41,
47]. While the locked-in matter no longer can fed the gaseous component, the supersonic nova and supernova outflows can trigger efficient star formation in the ambient ISM by providing strong enough external pressure [
6,
12,
16,
26,
28,
31,
43].
It is the purpose of the present study to describe the linear and nonlinear temporal evolution of the interstellar gas and stellar matter in galaxies by a compartmental model. The nonlinearity stems from the triggered star formation process. compartmental models are very successful in analysing and/or predicting the temporal development of infection diseases and epidemics since their invention about a hundred years ago by [
21] and the subsequent refinement by [
20]. Here persons from a considered population with many
N persons are assigned to different compartments. In the simple SIR-model these compartments are
S (susceptible),
I (infectious) and
R (recovered/removed), respectively. Time-dependent infection and recovery rates then regulate the transitions between the compartments
and
, respectively (for reviews see [
13,
17,
18].
In the present manuscript we restrict the analysis to the case of spontaneous star formation only, whereas the additional influence of triggered star formation will be the subject in future papers of this series. The organization of this manuscript is as follows: in
Section 2 we introduce the general compartmental description of the cosmic baryonic matter by formulating the relevant dynamical equations including spontaneous as well as triggered star formation. In
Section 3. the dynamical equations are solved analytically for the case of negligible spontaneous star formation. The analytical solutions are applied to the present-day (redshift
) gaseous fraction of the universe and the observed cosmic star formation history (
Section 4. The comparison of the theoretical results with the observations are the subjects of
Section 5 (in the special case of neglected stellar feedback) and
Section 6 (including stellar feedback). The summary and conclusion (
Section 7 completes the manuscript.
2. GSL-Compartmental Model for the Baryonic Matter Cycle
We consider the total system of baryonic matter either in stars or in interstellar gas and introduce the compartments
G (gas),
S (stars) and
L (locked-in matter in white dwarfs, neutron stars and black holes).
,
and
denote the relative fractions of baryonic matter in the three compartments, respectively, as a function of time
t, so that the sum constraint
holds at all times
t after the begin of the baryonic evolution at time
.
The temporal evolution of the three fractions , and is controlled by the spontaneous star formation rate (SFR) , the triggered star formation from the interaction of gas and stars with the assumed rate , the continuous feedback rate of stellar to gaseous matter, and the formation rate of white dwarfs, neutron stars and black holes from stellar evolution. The non-zero feedback rate is essential for the existence of gaseous heavier metals beyond helium and lithium from processed stellar baryons in the universe.
The dynamical equations for the three fractions then read
and
respectively. The spontaneous SFR starts in the truly metal-free primordial gas at the recombination era at
during which charged electrons and protons became bound to form electrically neutral hydrogen atoms, so that the gas could decouple from the global expansion and begin to cool efficiently and contract [
22]. As initial condition we adopt
as the whole baryonic gaseous matter was subject to spontaneous star formation. The initial time
corresponds to the redshift
.
The introduction of gaseous and stellar fractions as the basic dynamical variables has the advantage that the results can be applied to a variety of astrophysical systems [
44] including individual galaxies, clusters of galaxies and the whole universe. In each particular case one has to multiply the derived fractions as a function of time with the respective total mass of baryonic matter.
On the other hand our approach is simplified as we only consider space-averaged rates for star formation, stellar feedback and stellar evolution without accounting for details such as the initial stellar mass function. Of course, these averaged rates can be varied for applications to different astrophysical objects. Our approach is different but bears some similarities with the earlier investigated bathtub [
42] or gas regulator [
33] models for galaxy evolution considering the competition between the flow of gas into galaxies, conversion into stars by in-situ star formation and ejection out of galaxies by stellar feedback. including individual galaxies, clusters of galaxies and the whole universe.
We are particularly interested in the formation rate
of new stars as a function of time,
Obviously, the first term represents the rate from triggered star formation, whereas the second term is the rate from spontaneous star formation.
As mentioned above we restrict our analysis here to the case of negligible triggered star formation. In this case exact analytical solutions of the dynamical equations of the GSL-model (1)–(5) can be derived. The derived exact analytical solutions hold for stationary rates as well as for the case of the same time dependence of all rates.
3. Negligible Triggered Star Formation
Here, for
, the GSL-model Equations (2)–(4) simplify to the linear equations
and
Introducing the dimensionless time variable
Equations (7)–(9) become
with the dimensionless ratios
3.1. Stationary Ratios
In the following we adopt stationary ratios const. and const., so that our solution allows for arbitrary but given time dependent spontaneous rates .
The first Equation (11a) readily provides
which upon insertion in Equation (11b) yields
Equation (14) is solved by
with
and with the two integration constants
, implying for Equation (13)
The initial conditions (5), i.e.
and
provide
so that
and
Consequently,
For infinitely large times
we note that
and
, whereas
. While
and
monotonically decrease and increase, respectively, the stellar fraction
first increases from zero to the maximum value
at
and the
S approaches zero in the course of time,
.
The new star formation rate (
6) for stationary SFR coefficient
in this case is
3.2. Negligible Stellar Feedback
In the special case of negligible stellar feedback
one obtains
corresponding to
. Likewise
and
While
and
in this case are monotonically decreasing or increasing, respectively, one finds that
rises first to the maximum value
at
and then decreases to the final value
.
In the special case of
Equations (25)–(27) simplify to
Here
rises first to the maximum value
at
and then decreases to the final value
.
3.3. Negligible Stellar Evolution
In the special case of negligible stellar evolution
one obtains
corresponding to
and
. In
Figure 1 we compare the derived exact analytic solutions with the numerical solutions of Equations (7)–(9) for several illustrative examples. For the numerical code we use a single-step solver based on a modified Rosenbeck formula of order 2, implemented by [
40] as ode23s in
. The excellent agreement proofs the validity of our derivations.
4. Cosmic Star Formation History
As astrophysical application we consider the present-day (redshift ) gas/star matter ratio and the cosmic star formation history (SFH) of the universe which is proportional to the star formation rate (6) as a function of real time.
The present-day gas/star matter ratio
in our Milky Way is about 0.1 and a bit higher in galaxy clusters. If we take this ratio as characteristic for the whole universe and allow for a possible contribution of hidden baryons in the intergalactic gas a value
seems to be reasonable.
With respect to the cosmic SFH far ultraviolet and infrared measurements have indicated [
27] that the best fit SFR density per time
t is
where the time
has been expressed as a function of redshift
z using a flat
CDM Friedmann cosmology [
4,
32,
38,
46], and where
kg in SI-units
1. The data used for the best fit (32) are given in Table 1 of [
27]. The SFR density (32) attains its maximum value
at redshift
, is practically constant at small redshifts well below unity, and it decreases at large redshifts
.
Also available in Table 2 and Figure 11 of [
27] is the integrated stellar density
which according to [
27] fulfills
and is therefore more explicitly given by
where according to [
27]
R is the return factor or the mass fraction of newly born stars that is put back into the interstellar gas which has been treated as free fit parameter. As we will argue below within the compartmental model considered here
has to be replaced by the time- or redshift dependent term
with the fraction
of locked-in stellar matter.
We first discuss the relation of our dynamical evolution time scale
for stationary spontaneous SFRs with the lookback time and redshift
z in a flat
CDM Friedmann cosmology. In a flat
CDM Friedmann cosmology with
and
km
the lookback time
is related to the redshift according to [
2,
19,
32]
The lookback time
from now (redshift
) back to redshift
z refers to the time that would have elapsed on the clock of an observer moving with the Hubble flow between these redshifts. The lookback time (34) corresponds to the age of the universe
given by
The relation between the real time
t, the lookback time
and the age of the universe
is given by
implying
Consequently,
so that for a constant spontaneous SFR coefficient
one obtains
For later use we note that
with
Accordingly, the reduced time (39) for all values of
z is well approximated by
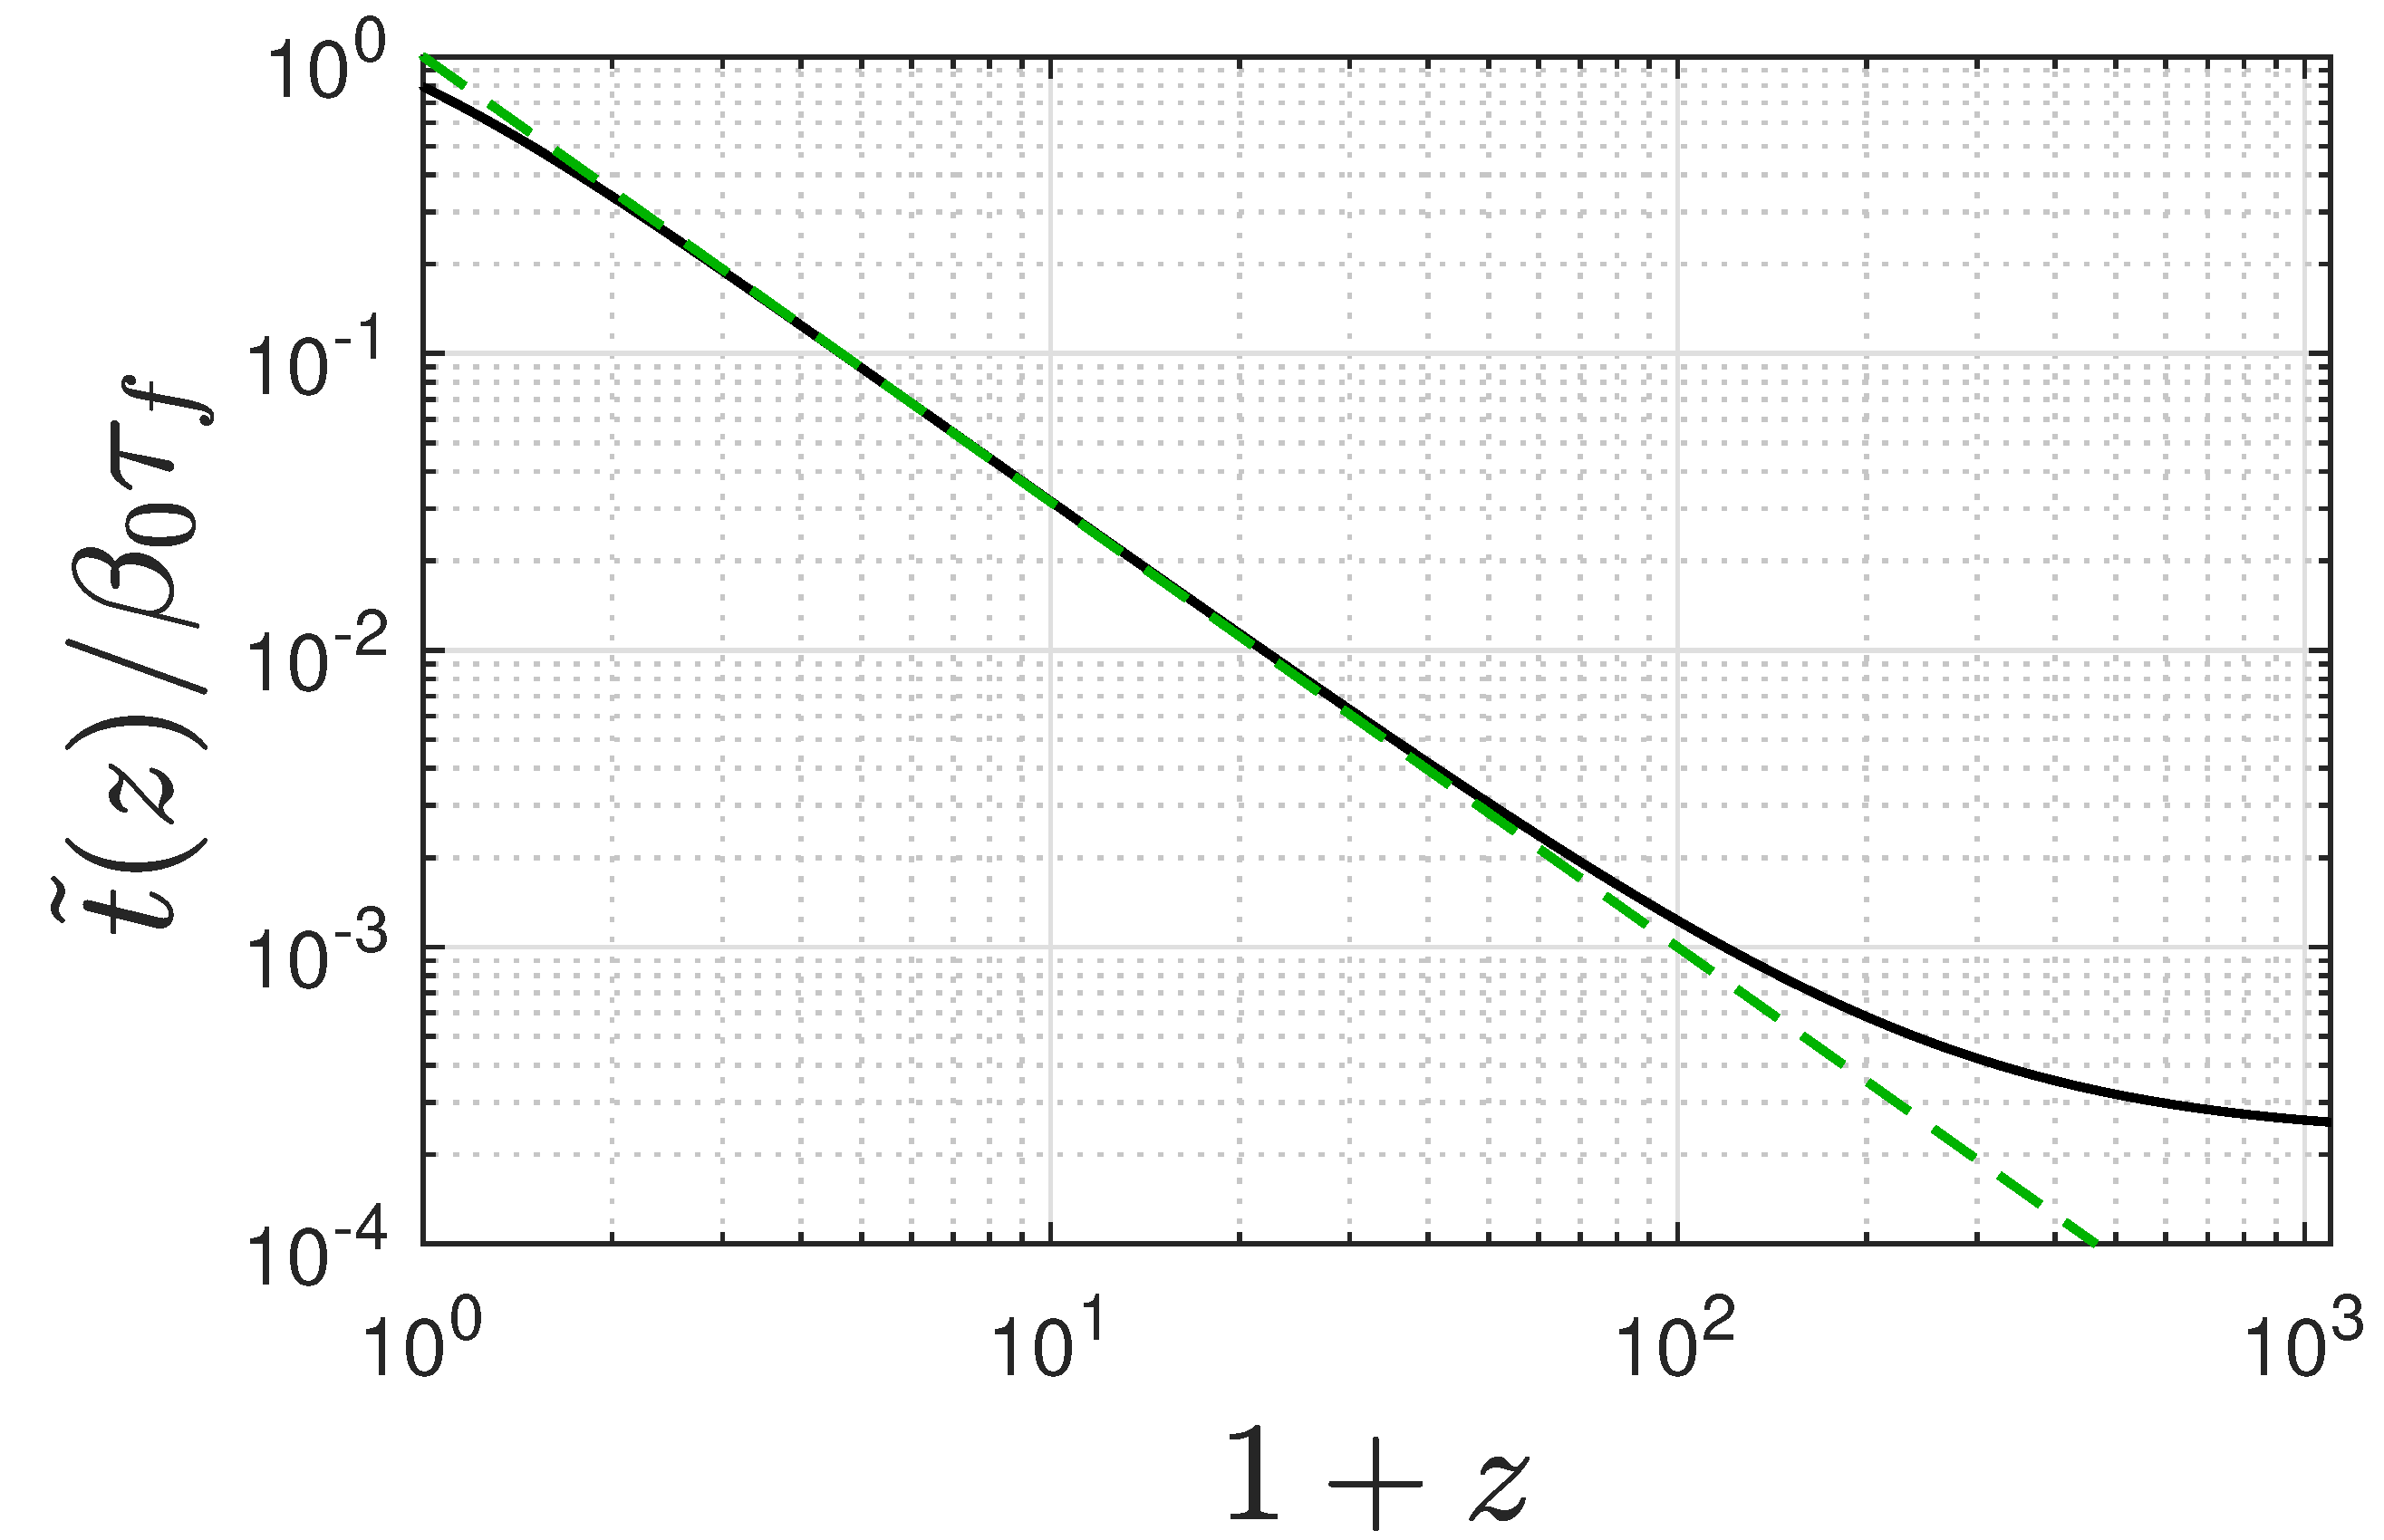
In
Figure 2 we show the variation of Equation (39) as a function of the redshift
z. Obviously, large redshifts correspond to early dynamical times
, whereas small redshifts correspond to late dynamical times. Also shown in
Figure 2 is the approximation (42).
In the following two sections we calculate the SFR density and the stellar density for the case of spontaneous star formation without and with stellar feedback using our results from the earlier
Section 3. We do not consider triggered star formation here. We adopt a flat universe with
so that the critical density does not evolve with redshift and is given by
Consequently, with
the matter density of the universe then is
The matter density (44) includes contributions from dark matter and from baryonic matter, where the latter is a factor 8 smaller than the dark matter contribution [
10]. Hence the baryonic matter density is given by
For general
the theoretical cosmic SFR density and the integrated stellar density as a function of redshift
, or equivalently,
with
.
Using Equation (46) then provides for the integrated stellar mass density according to Equation (33)
with
kg
, where we have replaced
. This factor enters the calculation of
but not the calculation of the SFR density (46) because all stars are born as luminous main sequence stars. The fraction
results from the stellar evolution to locked-in stellar matter, so that only the fraction
contributes to the observed integrated density of luminous stars.
4.1. Observational Constraints
In the following Sections. we compare the predictions the GSL-model without triggered star formation with the observations. We require for the GSL-model to be in accord with the following five observational constraints:
First, the observed peak SFR density has large error bars ´
and occurs in the redshift range
[
8] and
[
7].
Secondly, we require for the observed peak redshift
As third constraint we use the observed integrated stellar mass density at
[
30,
34]
As fourth constraint we demand that in order to have at least one maximum of at positive z. As fifth more stringent constraint we require that exhibits exactly one maximum within the redshift range . While constraints 1 to 4 can be dealt with analytically, the fifth constraint is verified by solving a highly nonlinear equation, the later Equation (93), numerically.
5. Results for Model without Stellar Evolution
We start with the spontaneous star formation without stellar evolution (
). The omission of stellar evolution is justified as the evolution of most luminous stars occurs on a time scale of the order of the Hubble time [
37]. Note that for
the fraction (
21) of non-luminous locked-in stellar matter vanishes.
5.1. SFR Density
We employ the expression (29) for
. With
from Equation (42), the SFR density (46) becomes
where we introduce
In terms of
Equation (51) reads
The first derivative of the function
is given by
which is positive for all values of
, so that the function
has no local extrema in this case.
In order to have a minimum of
, corresponding to an extremum of
, the ratio
has to be rather small. For these values of
we can conclude already that the gas fraction at infinitely large times
is below 4 percent.
Provided restriction (56) holds, two extrema occur at
in terms of the two branches of the Lambert function discussed in
Appendix A, where
. The maximum of
is determined by
employing the principal branch
, while
determines the position of the minimum. We need to require that the minimum does not exist for positive redshift values
z, i.e.
corresponding to
which, since
, requires
or with Equation (52) that
as first constraint on the value of the spontaneous SFR coefficient
. The maximum then occurs at the peak redshift
For small
, Taylor expansion yields
The peak SFR density evaluates to
where we used the expansion
and Equation (63). Equating (64) and (48) yields
This
-value
2 is partially consistent with the lower limit (61) especially for large values of the observed peak SFR density (48). It implies according to Equations (52) and (63)
however, only if one adopts large values of the observed peak SFR density (49) within its large error bars. The upper constraint on
is consistent with the observational requirement (49).
Consequently, for large values of the observed peak SFR as well as the spontaneous formation rate (65), and values of
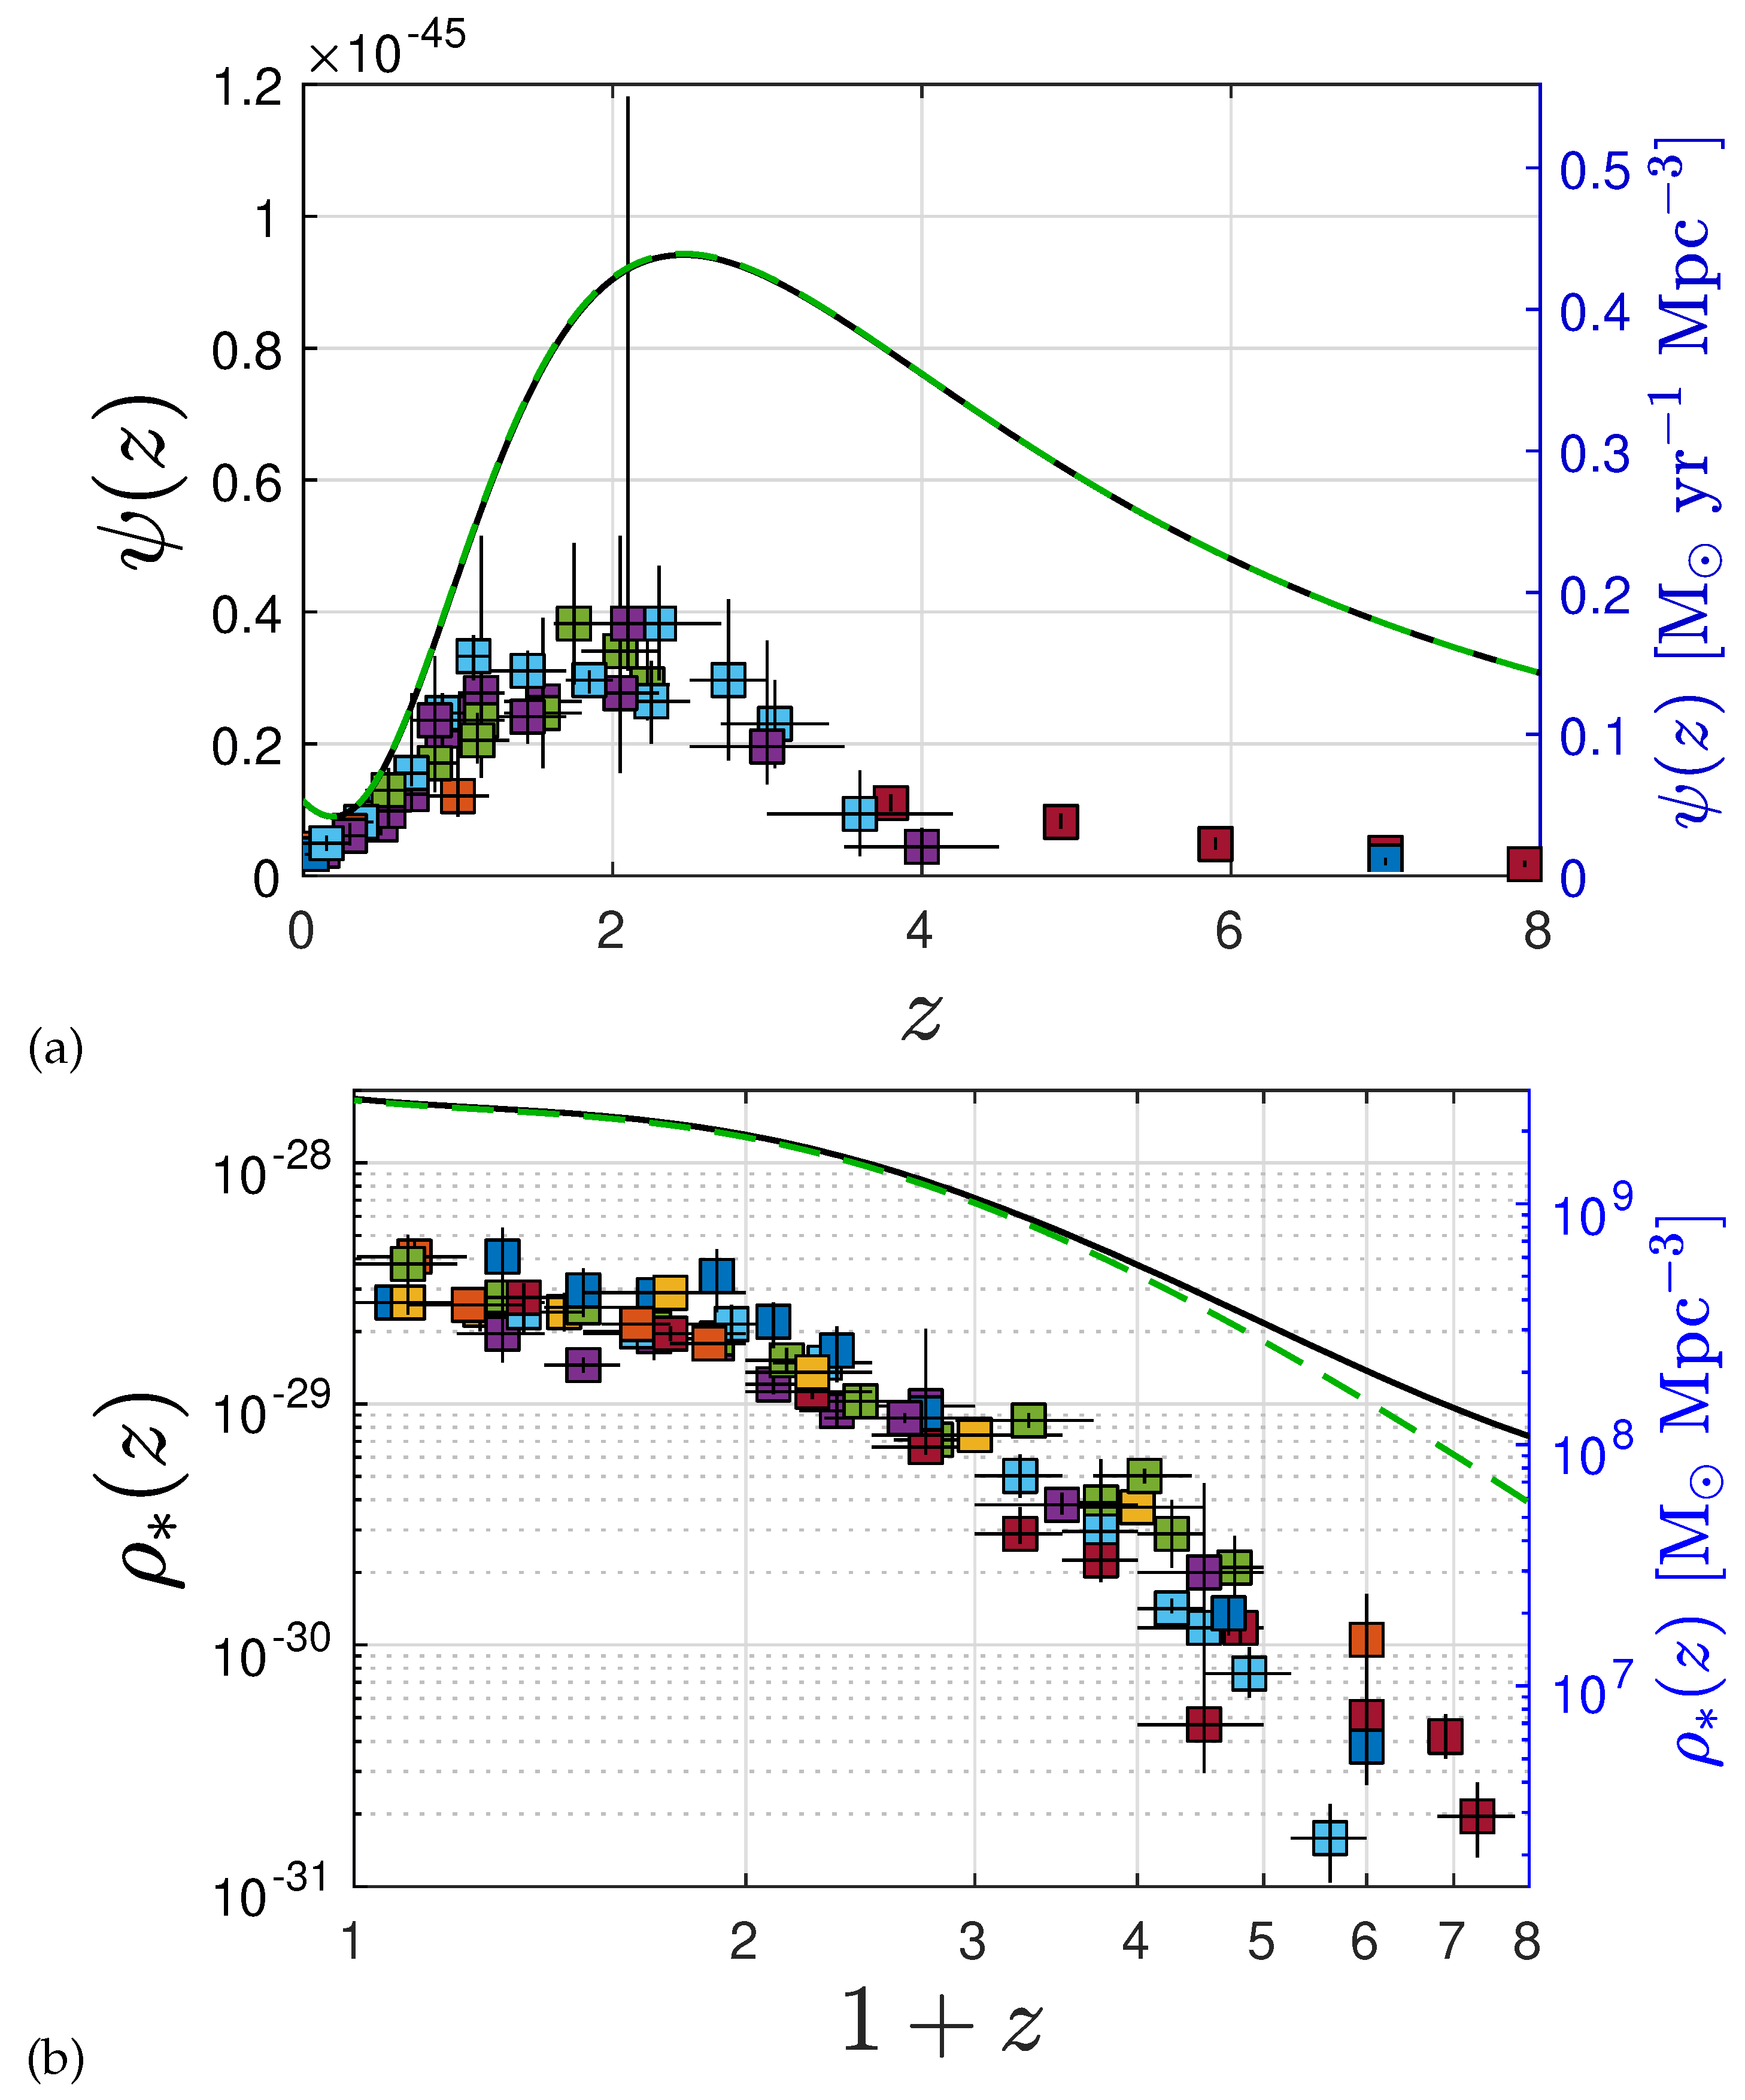
below the small value (56), the GS-model with spontaneous star formation indeed provides a rough but far from optimal fit to the observed SFR density (see
Figure 3).
5.2. Stellar Density
Here we calculate the integrated stellar density for the spontaneous star formation model. With the help of
the integrated stellar mass density (47) with
becomes
where
is the lower incomplete gamma function. The stellar mass density thus monotonically decreases from the value
in a power-law like fashion at large redshifts
,
since
to lowest order in
. Equating the result (69) with the observed value (50) provides
where we scale
in units of
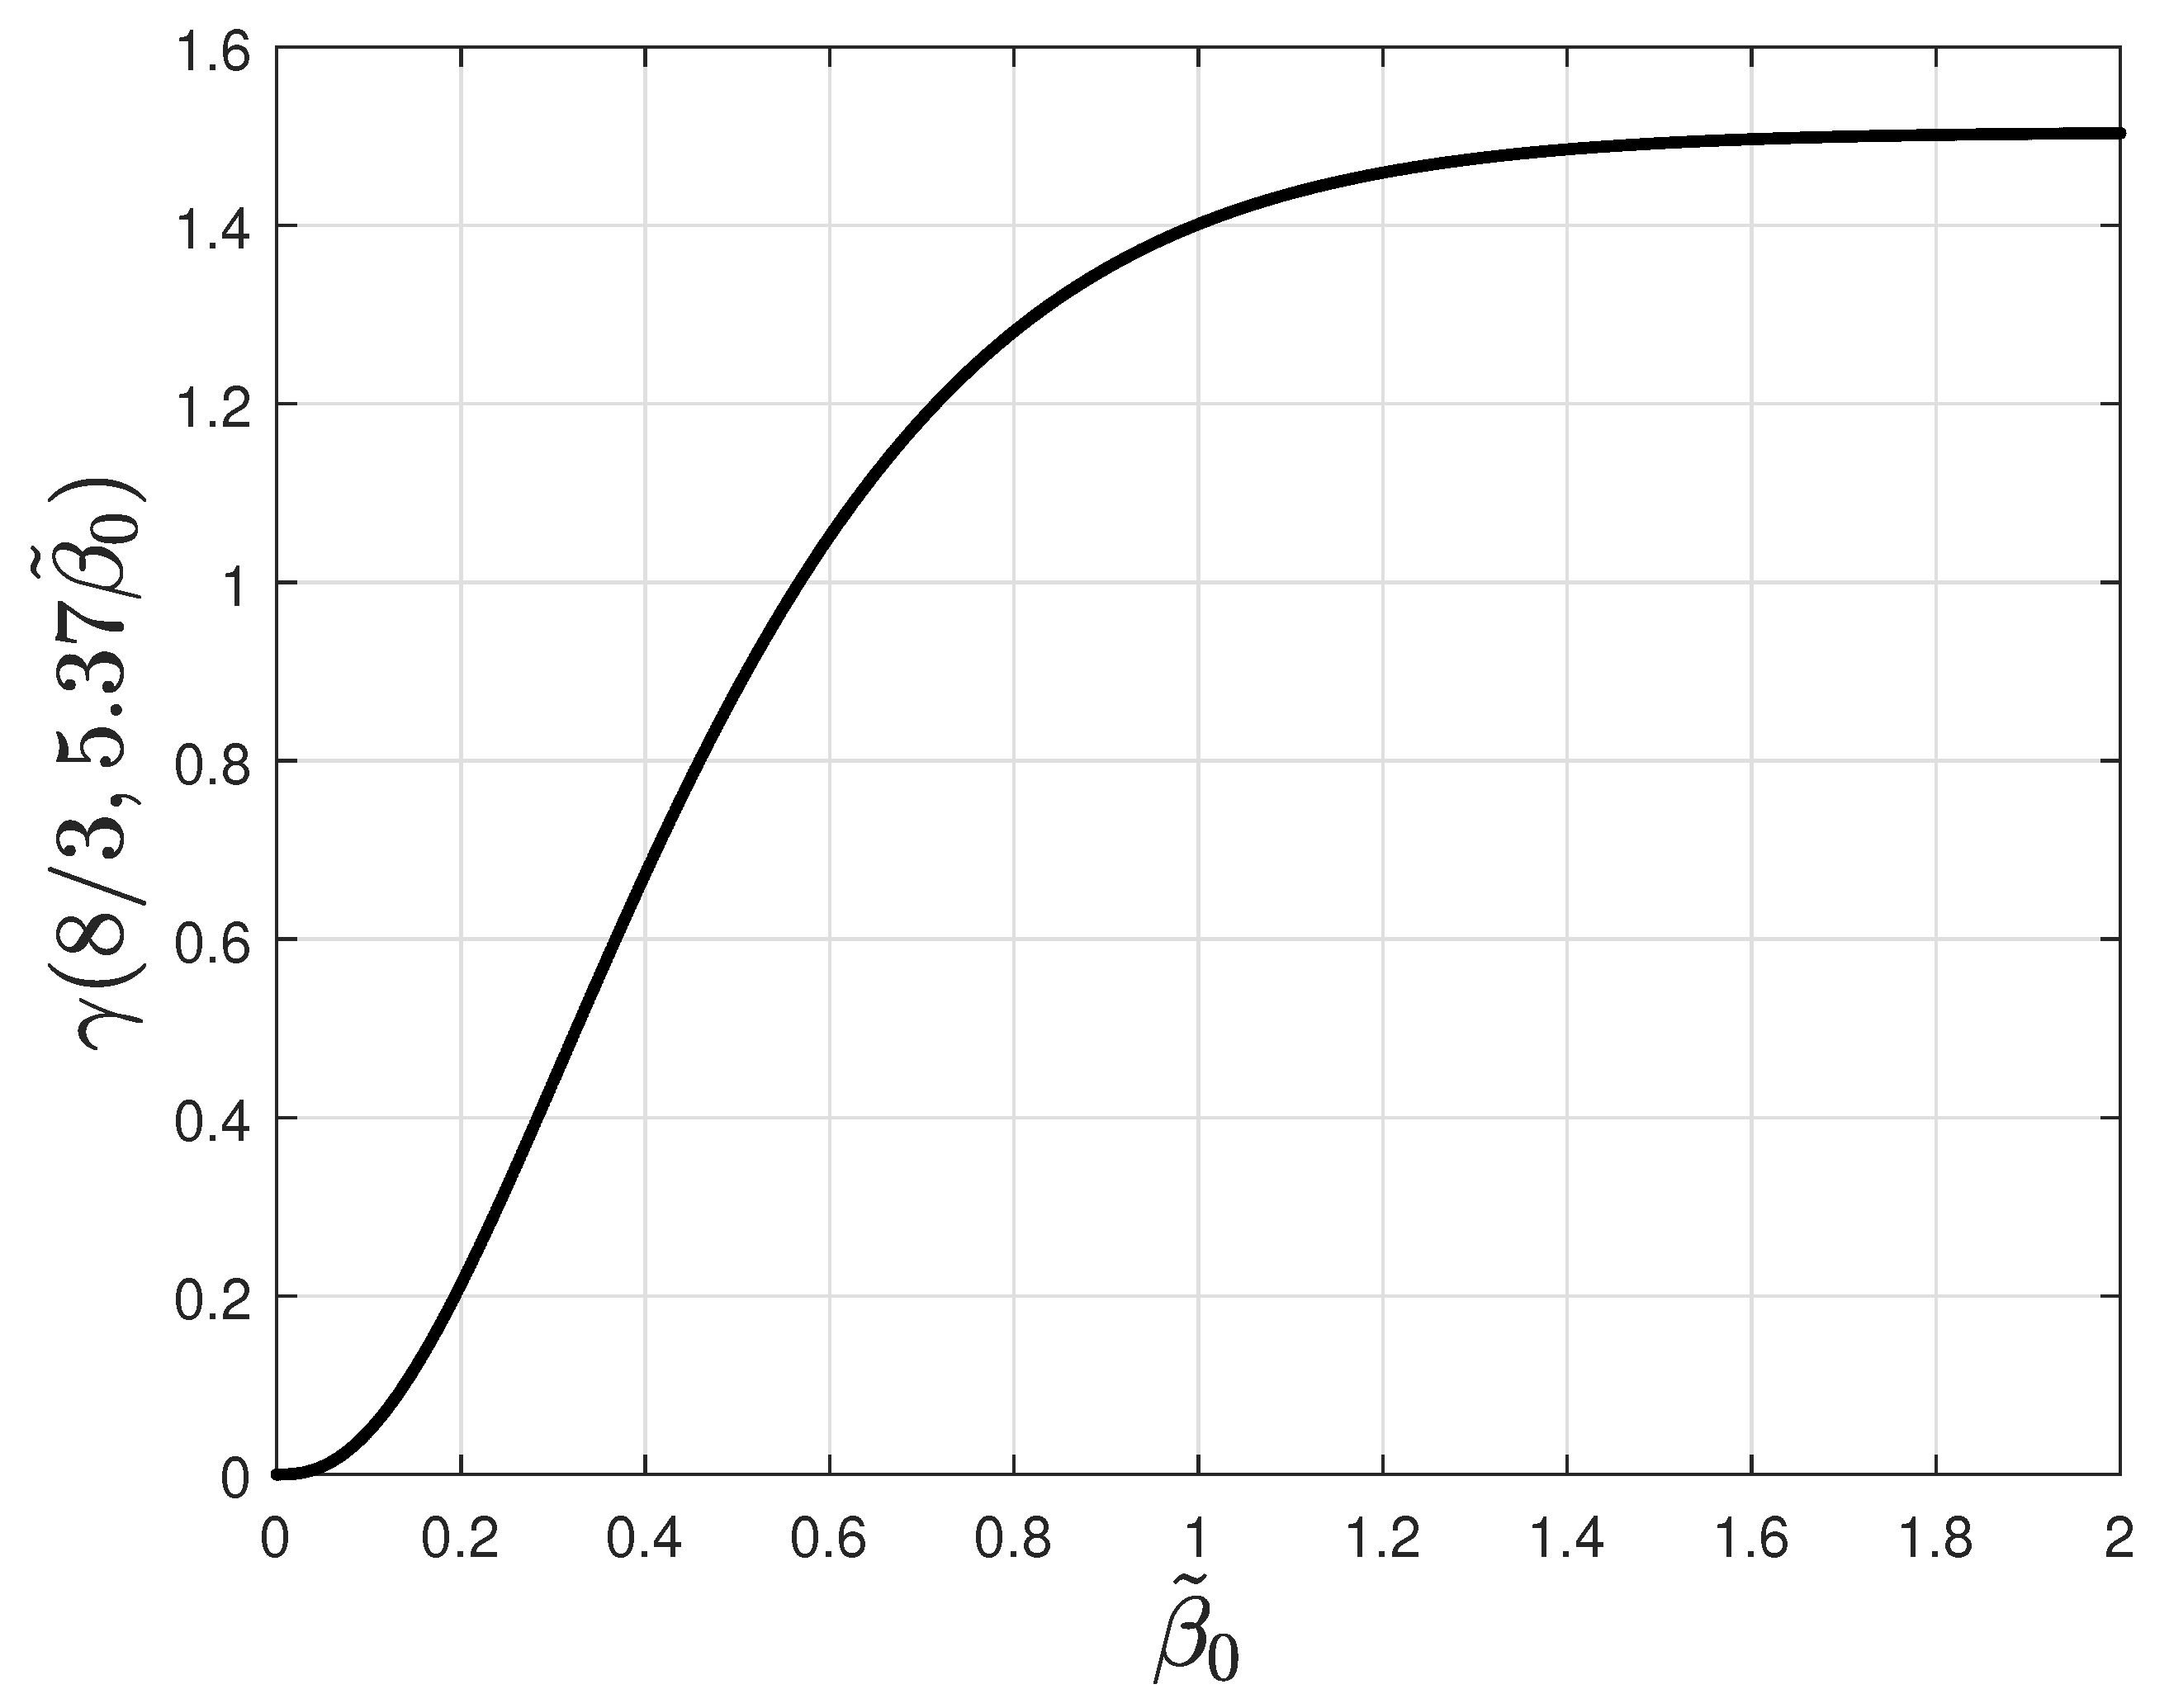
Hz. The function
is shown in
Figure 4 and varies from 0 to the finite value
at large arguments. For the nominal values
and
one obtains from Equation (71)
which leads to
The two determinations (65) and (74) of the rate of spontaneous star formation, resulting from reproducing the peak value of the SFR density and the present-day integrated stellar mass density within their partially large uncertainties, exclude each other by at least a factor 2.8. E.g. it is not possible to explain with one single
-value these two constraints with the GS-model.
Adopting as a best compromise value
we compare in
Figure 3 the SFR density and the integrated stellar densities for
. This choice implies as peak redshift
. Only because of the large error bars in the peak SFR density the theoretical results of the simplified GS-model are marginally consistent with the observations. This
Figure 3 also illustrates the basic dilemma of this simplified model very well. Because of the dependencies
in Equation (64) and
in Equation (69) on the only free parameter
, it is obvious that by decreasing
from its compromise value 2 would decrease
to smaller values, but would increase at the same time
. Alternatively, increasing
from its compromise value 2 would decrease
to smaller values, but at the same time would make
even larger.
With this compromise value
and the ratio
the present-day gas fraction is
basically identical to the gas fraction at infinite time
, and in marginal agreement with the observation (31).
5.3. Special Case: Negligible Stellar Feedback () and Stellar Evolution ()
The results of the last subsections include as special case the GS-model without stellar feedback (
) and stellar evolution (
). As in this case some of the theoretical results are severely simplified and thus more transparent we include a detailed analysis of this case here. The SFR density (51) simplifies to
with
The density (76) attains its maximum value
at the peak redshift
The two observational constrains (49) and (48) for
and the peak SFR density then provide the constraints
and
respectively, which are consistent which each other due to the large uncertainty in the peak SFR density.
The integrated stellar mass density (68) simplifies to
The stellar mass density thus monotonically decreases from the value
in a power-law like fashion at large redshifts
,
since
. The estimate (74) for
from the result (83) with the observed value (50) for the nominal values and
remains unchanged, i.e.
The two determinations by Equations (80)–(81) and Equation (85) of the rate of spontaneous star formation, resulting from reproducing the peak redshift and peak value of the SFR density and the present-day integrated stellar mass density within their partially large uncertainties, exclude each other. E.g. it is not possible to explain with one single
-value these three constraints with the simplified GS-model. Again a compromise value of
is suggested. With this compromise value
and the present-day gas fraction in the case of neglected stellar feedback is
another strong disagreement with the observational constraint (31) of this model.
6. SFR and Stellar Density for Spontaneous Star Formation with Stellar Feedback
Here we extend the analysis of the previous section by including additionally stellar feedback (
) besides spontaneous star formation (
) and stellar evolution
by using (
19), instead of (29), for
.
6.1. Theoretical Results
With
from Equation (42) and Equation (19) for
the SFR density (46) becomes
with
,
,
, as before in Equation (77), and the function
3
Likewise with Equation (
21) one obtains
with
. Consequently, the integrated stellar density (47) is given by
Moreover, the gas fraction (
19) as a function of redshift reads
The first derivative of the function (88) is given by
so that a maximum occurs at
given by the solution of the transcendental equation
As an aside we note that for
the Equation (93) correctly reduces to
in agreement with
Section 5.3. Likewise for
one obtains
and with
, with
Z defined in Equation (53), Equation (93) simplifies to
reproducing with
correctly the determining Equation (54) for the extrema in the case of negligible stellar feedback.
6.2. Constraints on Parameters
First, the observed present-day integrated stellar mass density (50) provides from Equation (90)
Adopting values of
and assuming
, all incomplete
-functions are well approximated by
, so that the constraint (95) simplifies to
Secondly, the observed peak redshift (49) yields for
As third constraint we infer from Equations (48) and (87)
or
with
according to Equation (88), and where we inserted Equation (97).
As fourth constraint we demand that
in order to have a maximum of
. With
and Equation (92) one has to demand that
leading, after insertion of Equation (77), to
6.2.1. Results for standard Hubble constant value
In
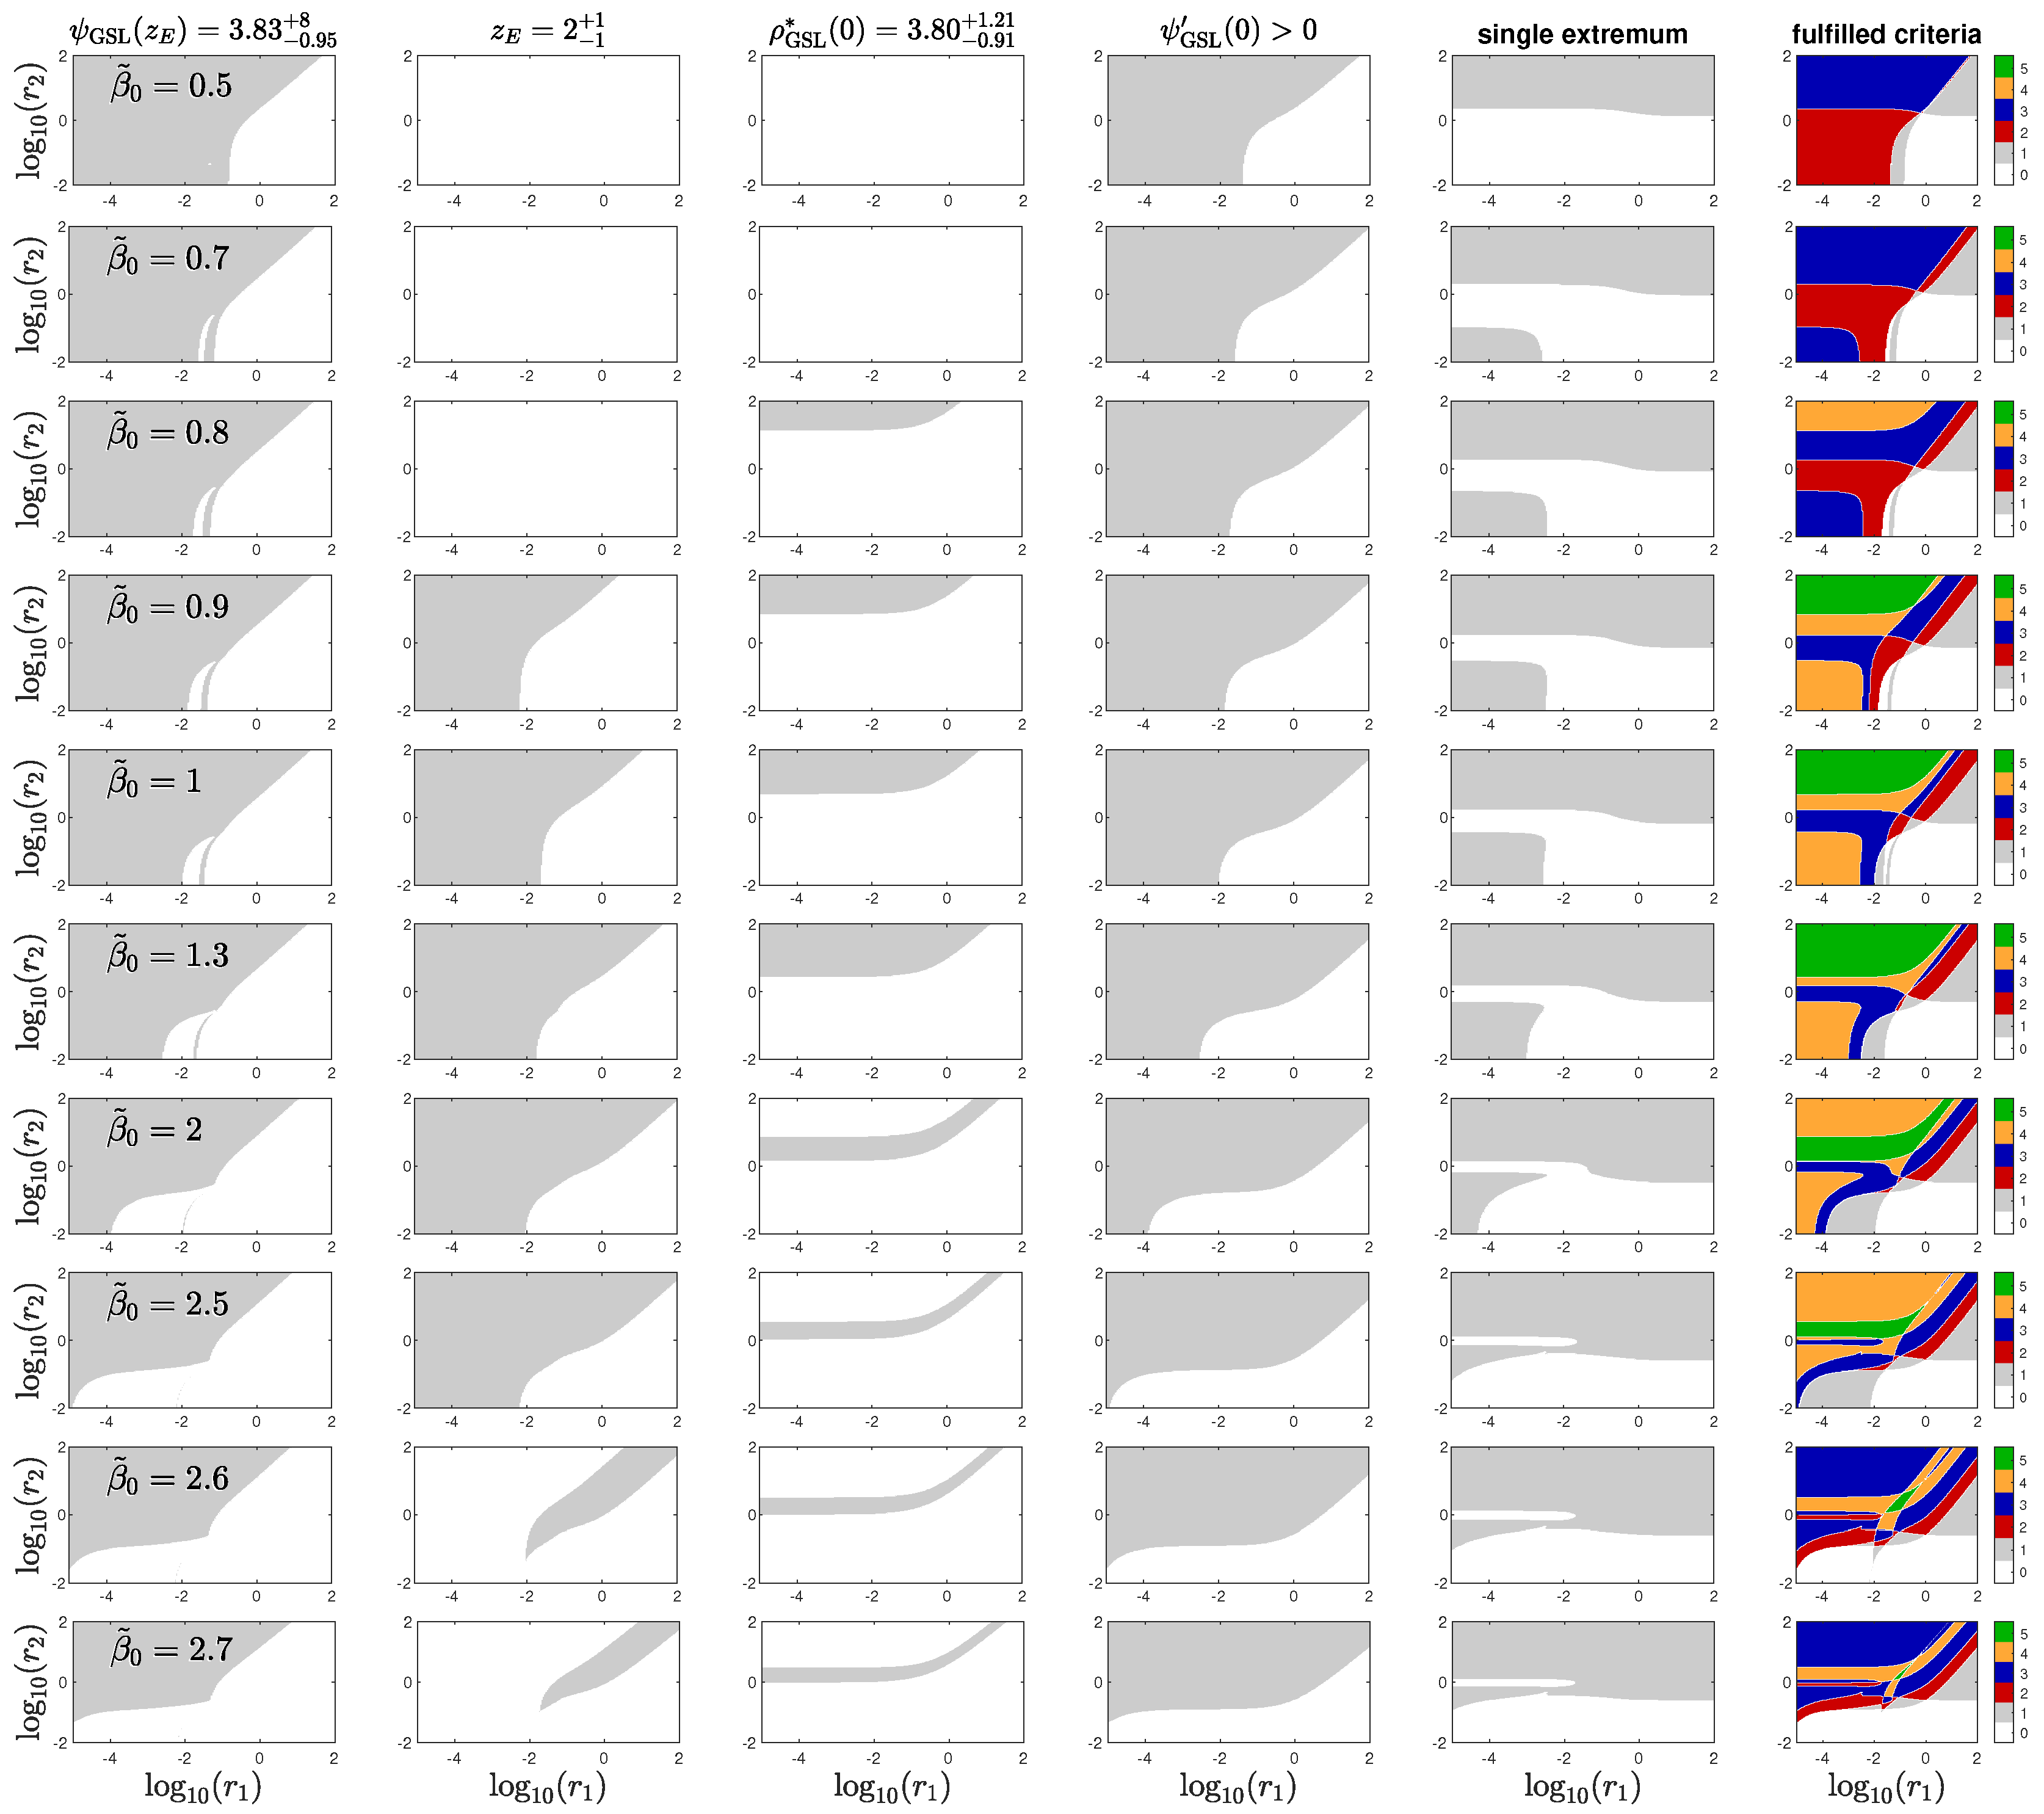
Figure 5 we calculate for the wide range of values of
the compatibility of the five constraints on
,
,
, and
in the
–
-parameter plane over 9 decades of values each. Obviously, the tightest constraints on
and
are provided by the constraints on
and
. The green regions on the rightest panel (labeled summary) for the values of
indicates the range of parameters
and
where all five constraints are fulfilled. parameter-range Although there is no set of fit parameters
, where all four parameter constraints are fulfilled. This is certainly a significant improvement of the GSL-model with spontaneous star formation over the simplified models considered in
Section 5.
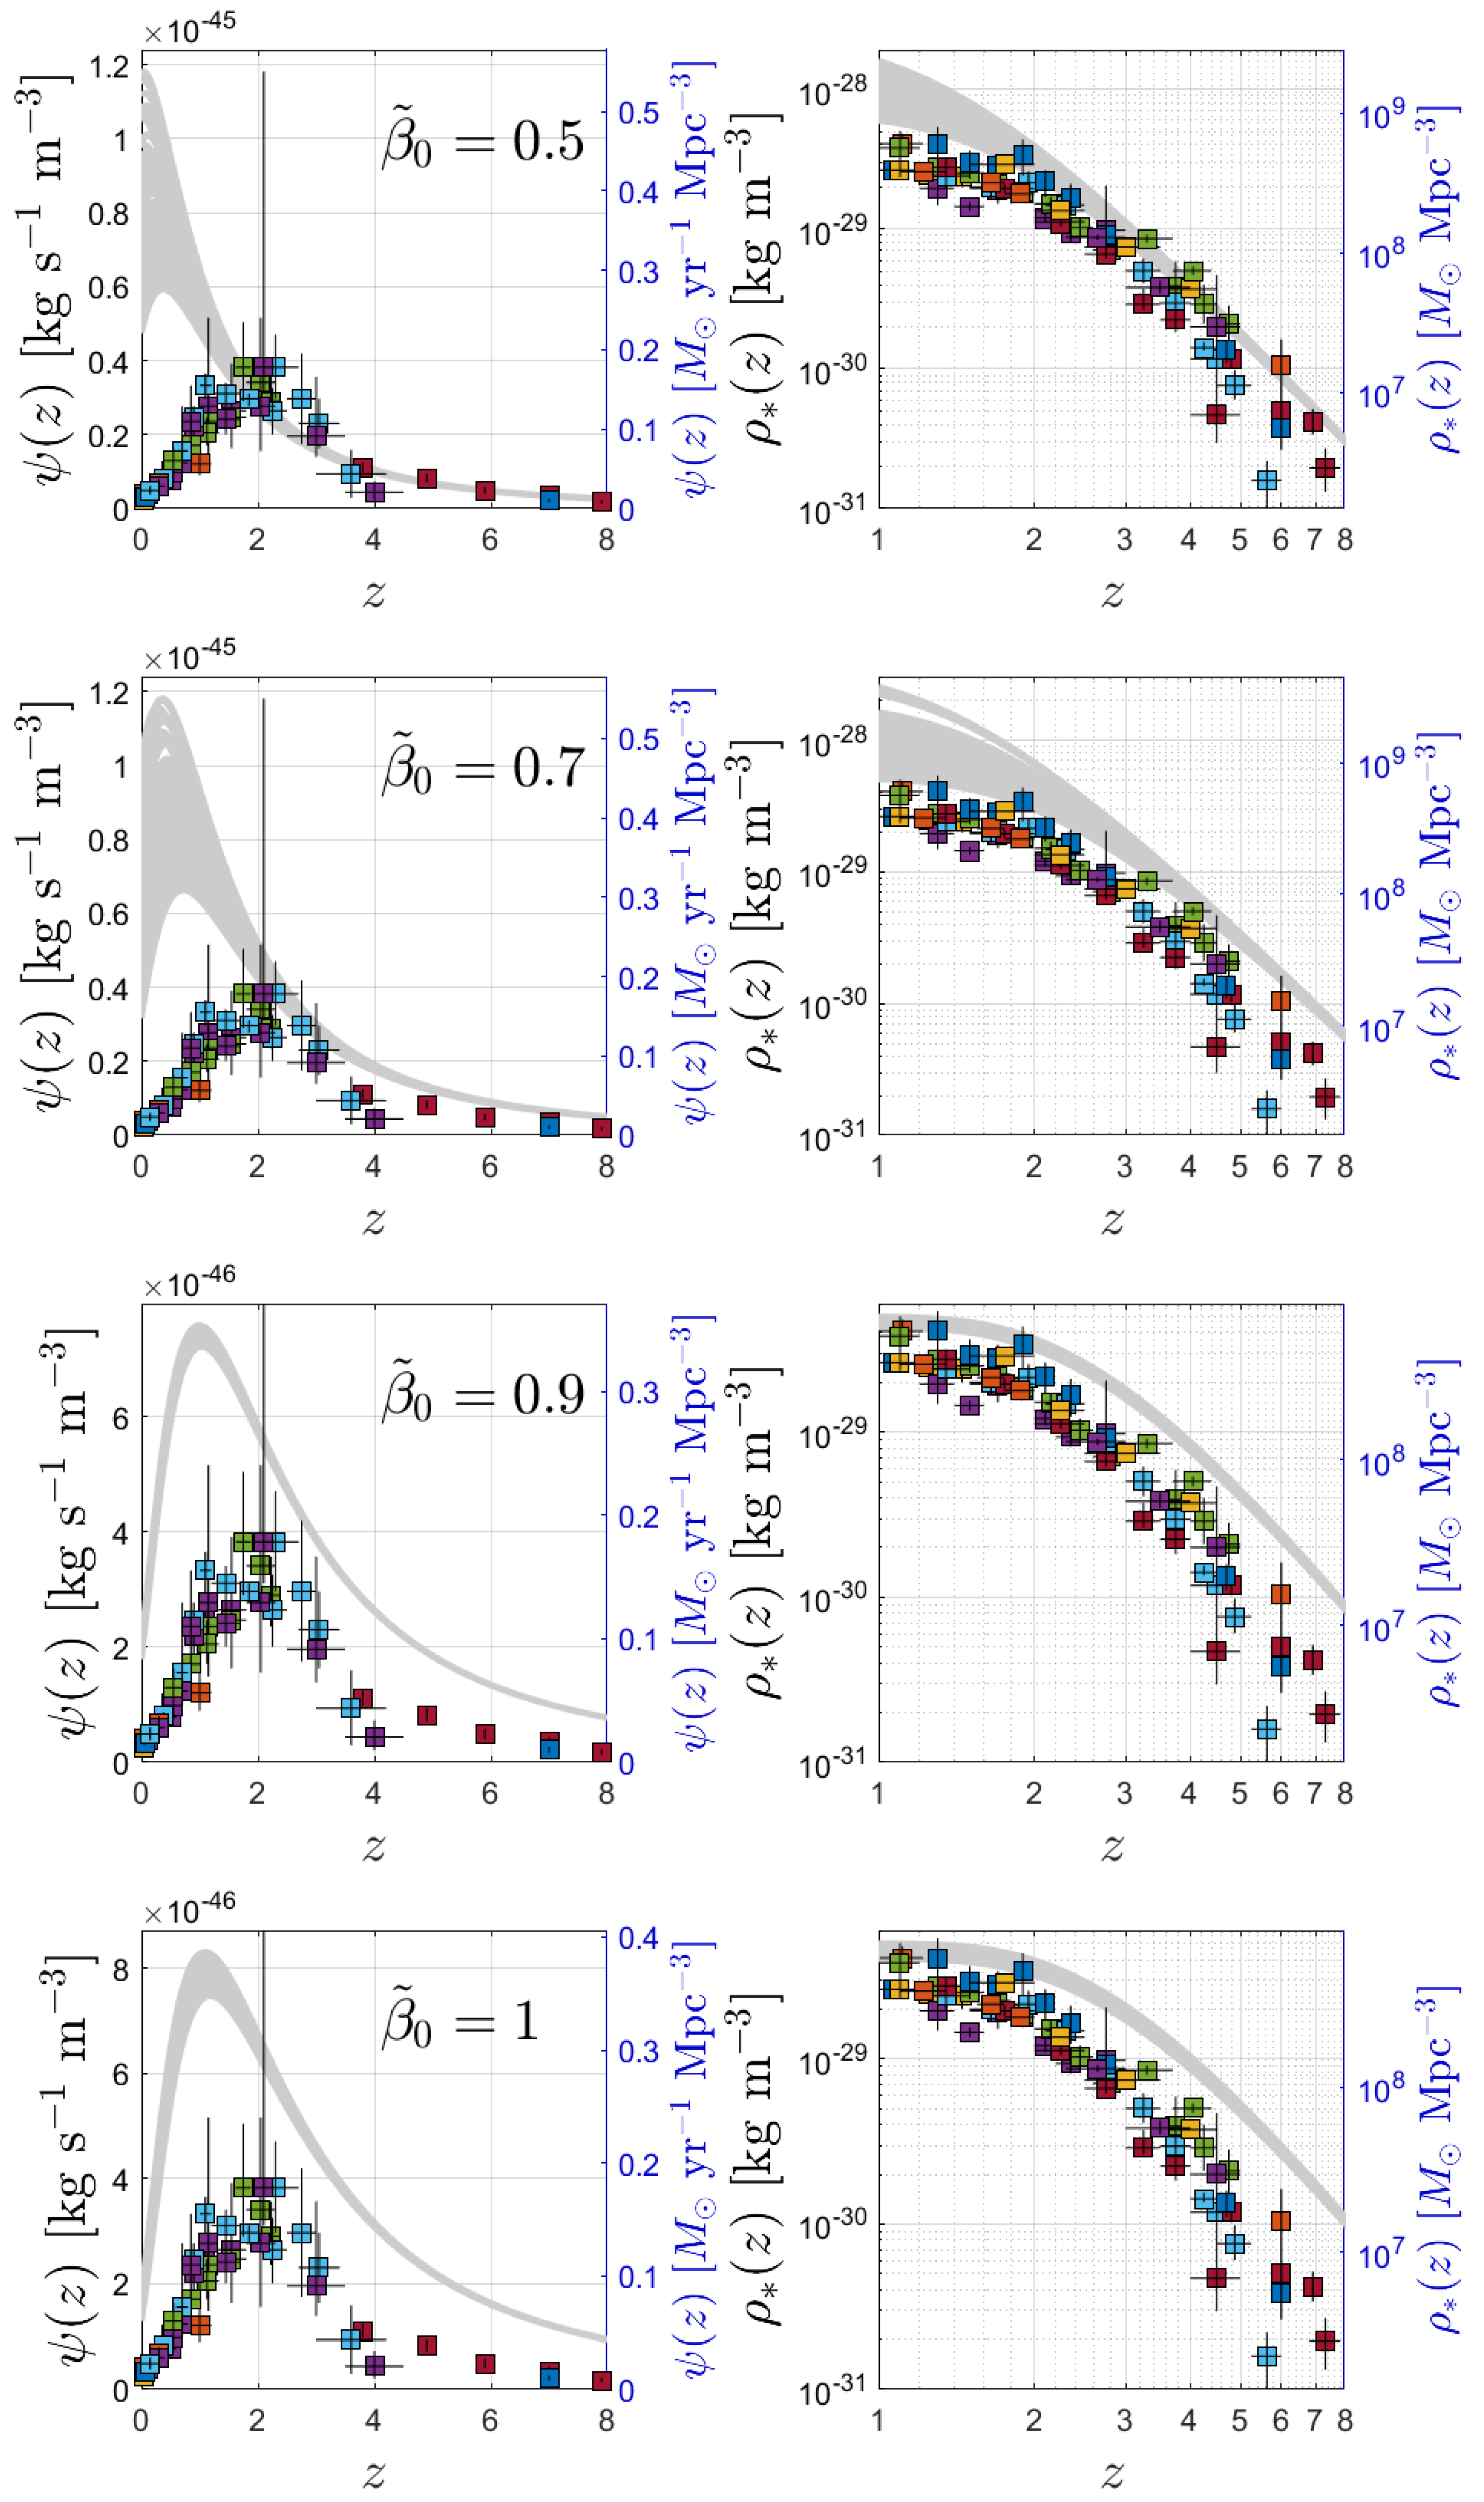
To illustrate this improvement we compare in Figure for six different values of
the redshift dependencies of the SFR density and the integrated stellar density, for all pairs of (
) values residing either within the green (all five constraints fulfilled for
) within the blue (three constraints fulfilled for
) areas of the corresponding panels in
Figure 5. Although the agreement is not perfect for any
triplet, it is certainly an improvement as compared to the model ignoring stellar feedback in
Section 5. Even with three free parameters it is still not possible to reproduce the observations nearly perfectly with the GSL-model for spontaneous star formation only. It defines a challenge for future work to demonstrate that the inclusion of the triggered star formation process can remedy the situation significantly.
For each of these four
values we also determine the ranges of the present-day gas fraction from Equation (91)
Using all admissible (
) pairs we obtain
for
,
for
,
for
, and
for
. All these values are within precision below about 2 percent.
Figure 5.
For each value there is one line. Each plot versus and (double-logarithmic). From left to right: Constraint 1: kg according to Equation (48), constraint 2: (49), constraint 3: kg (50), constraint 4: the sign of , constraint 5: the existence of a single extremum in for positive z, and the summary in the last column. The gray-shaded region highlights the parameter regime for which a quantity is within the allowed range, or . The summary displays the amount of simultaneously fulfilled criteria. For all five criteria are fulfilled over ranges of and values.
Figure 6.
(Left column) Experimentally reported
(symbols) and
according to Equation (87) (family of gray lines) as well as (Right column) reported
(symbols) and
according to Equation (90) (family of gray lines) for
and various
(increasing from top to bottom). The families are created using 1000 randomly chosen, but eligible (
) pairs for given
(specified in the panels). The eligible pairs reside in the green regions of the corresponding panel in Fig.
Figure 5. Notice that for
and
no green regions exist: i.e. not all constraints can be fulfilled. For those two values, the eligible pairs are from the blue regions.
6.2.2. Smaller Values of the Hubble Constant
We have noticed before the strong dependency of the constraints on the adopted value of the Hubble constant with
,
and
. Lowering the values of the Hubble constant to values of
km
or even of
km
indeed provides better agreements of our theoretical results in Figure with the observations as in this case
and
are reduced by the factors 0.755 and 0.663, respectively, whereas the peak redshift increases by the factors 1.07 and 1.11, respectively. In
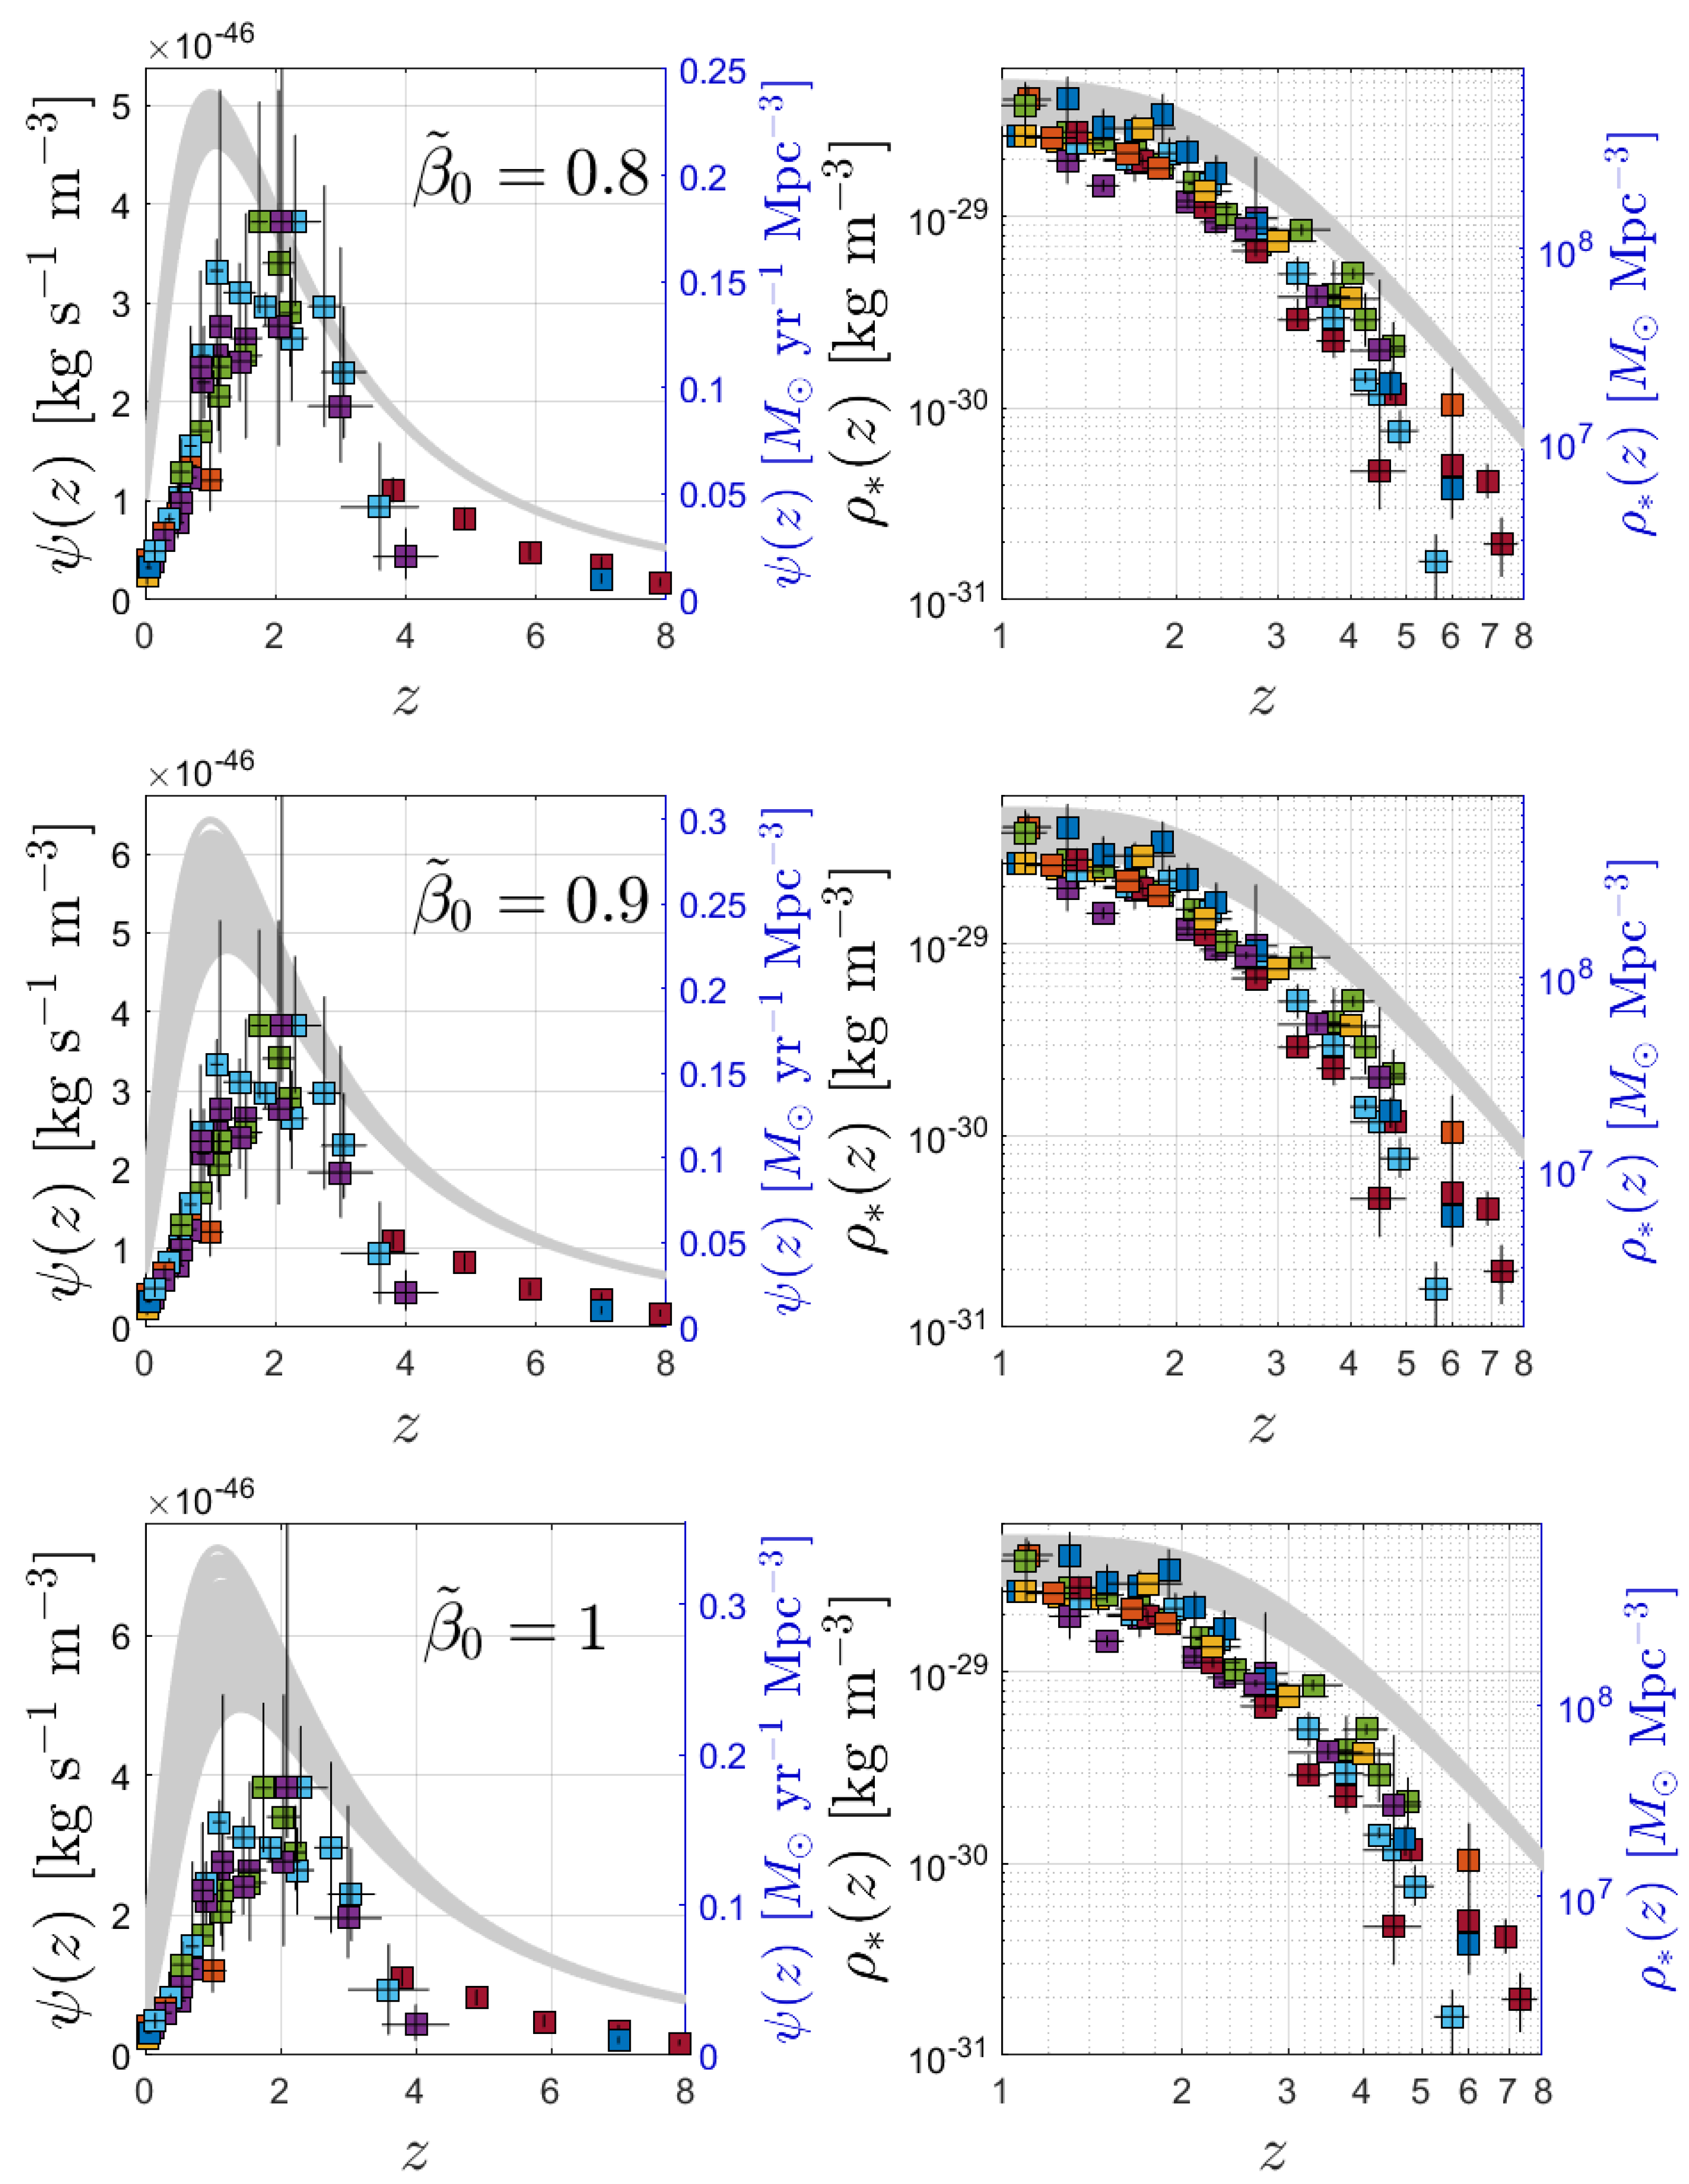
Figure 7 we show the comparison for
.
Figure 7.
Same as
Figure 6 for
km s
(corresponding to
) for
,
, and
(from top to bottom).
Figure 7.
Same as
Figure 6 for
km s
(corresponding to
) for
,
, and
(from top to bottom).
6.3. Special Case of Negligible Stellar Feedback
The general investigation of the case with stellar evolution (
) has indicated that the special case of negligible stellar evolution (
) also meets all constraints. For completeness we consider this special case here in more detail. We readily find from Equations (88) and (89) that
which also hold for
, where
. The function
has a single maximum at
, so that the SFR density
attains its maximum
at the peak redshift
Consequently,
Likewise with
and
in this case Equation (90) simplifies to
and in the particular case
while Equations (109) and (110) imply for
whereas for
where we approximated both incomplete gamma functions by
and
. Note that with the limit
one can infer directly Equation (112) from Equation (111).
The three constraints (48)–(50) then provide
and
Whereas the first two constraints (114) and (115) restrict the value of
, we illustrate in
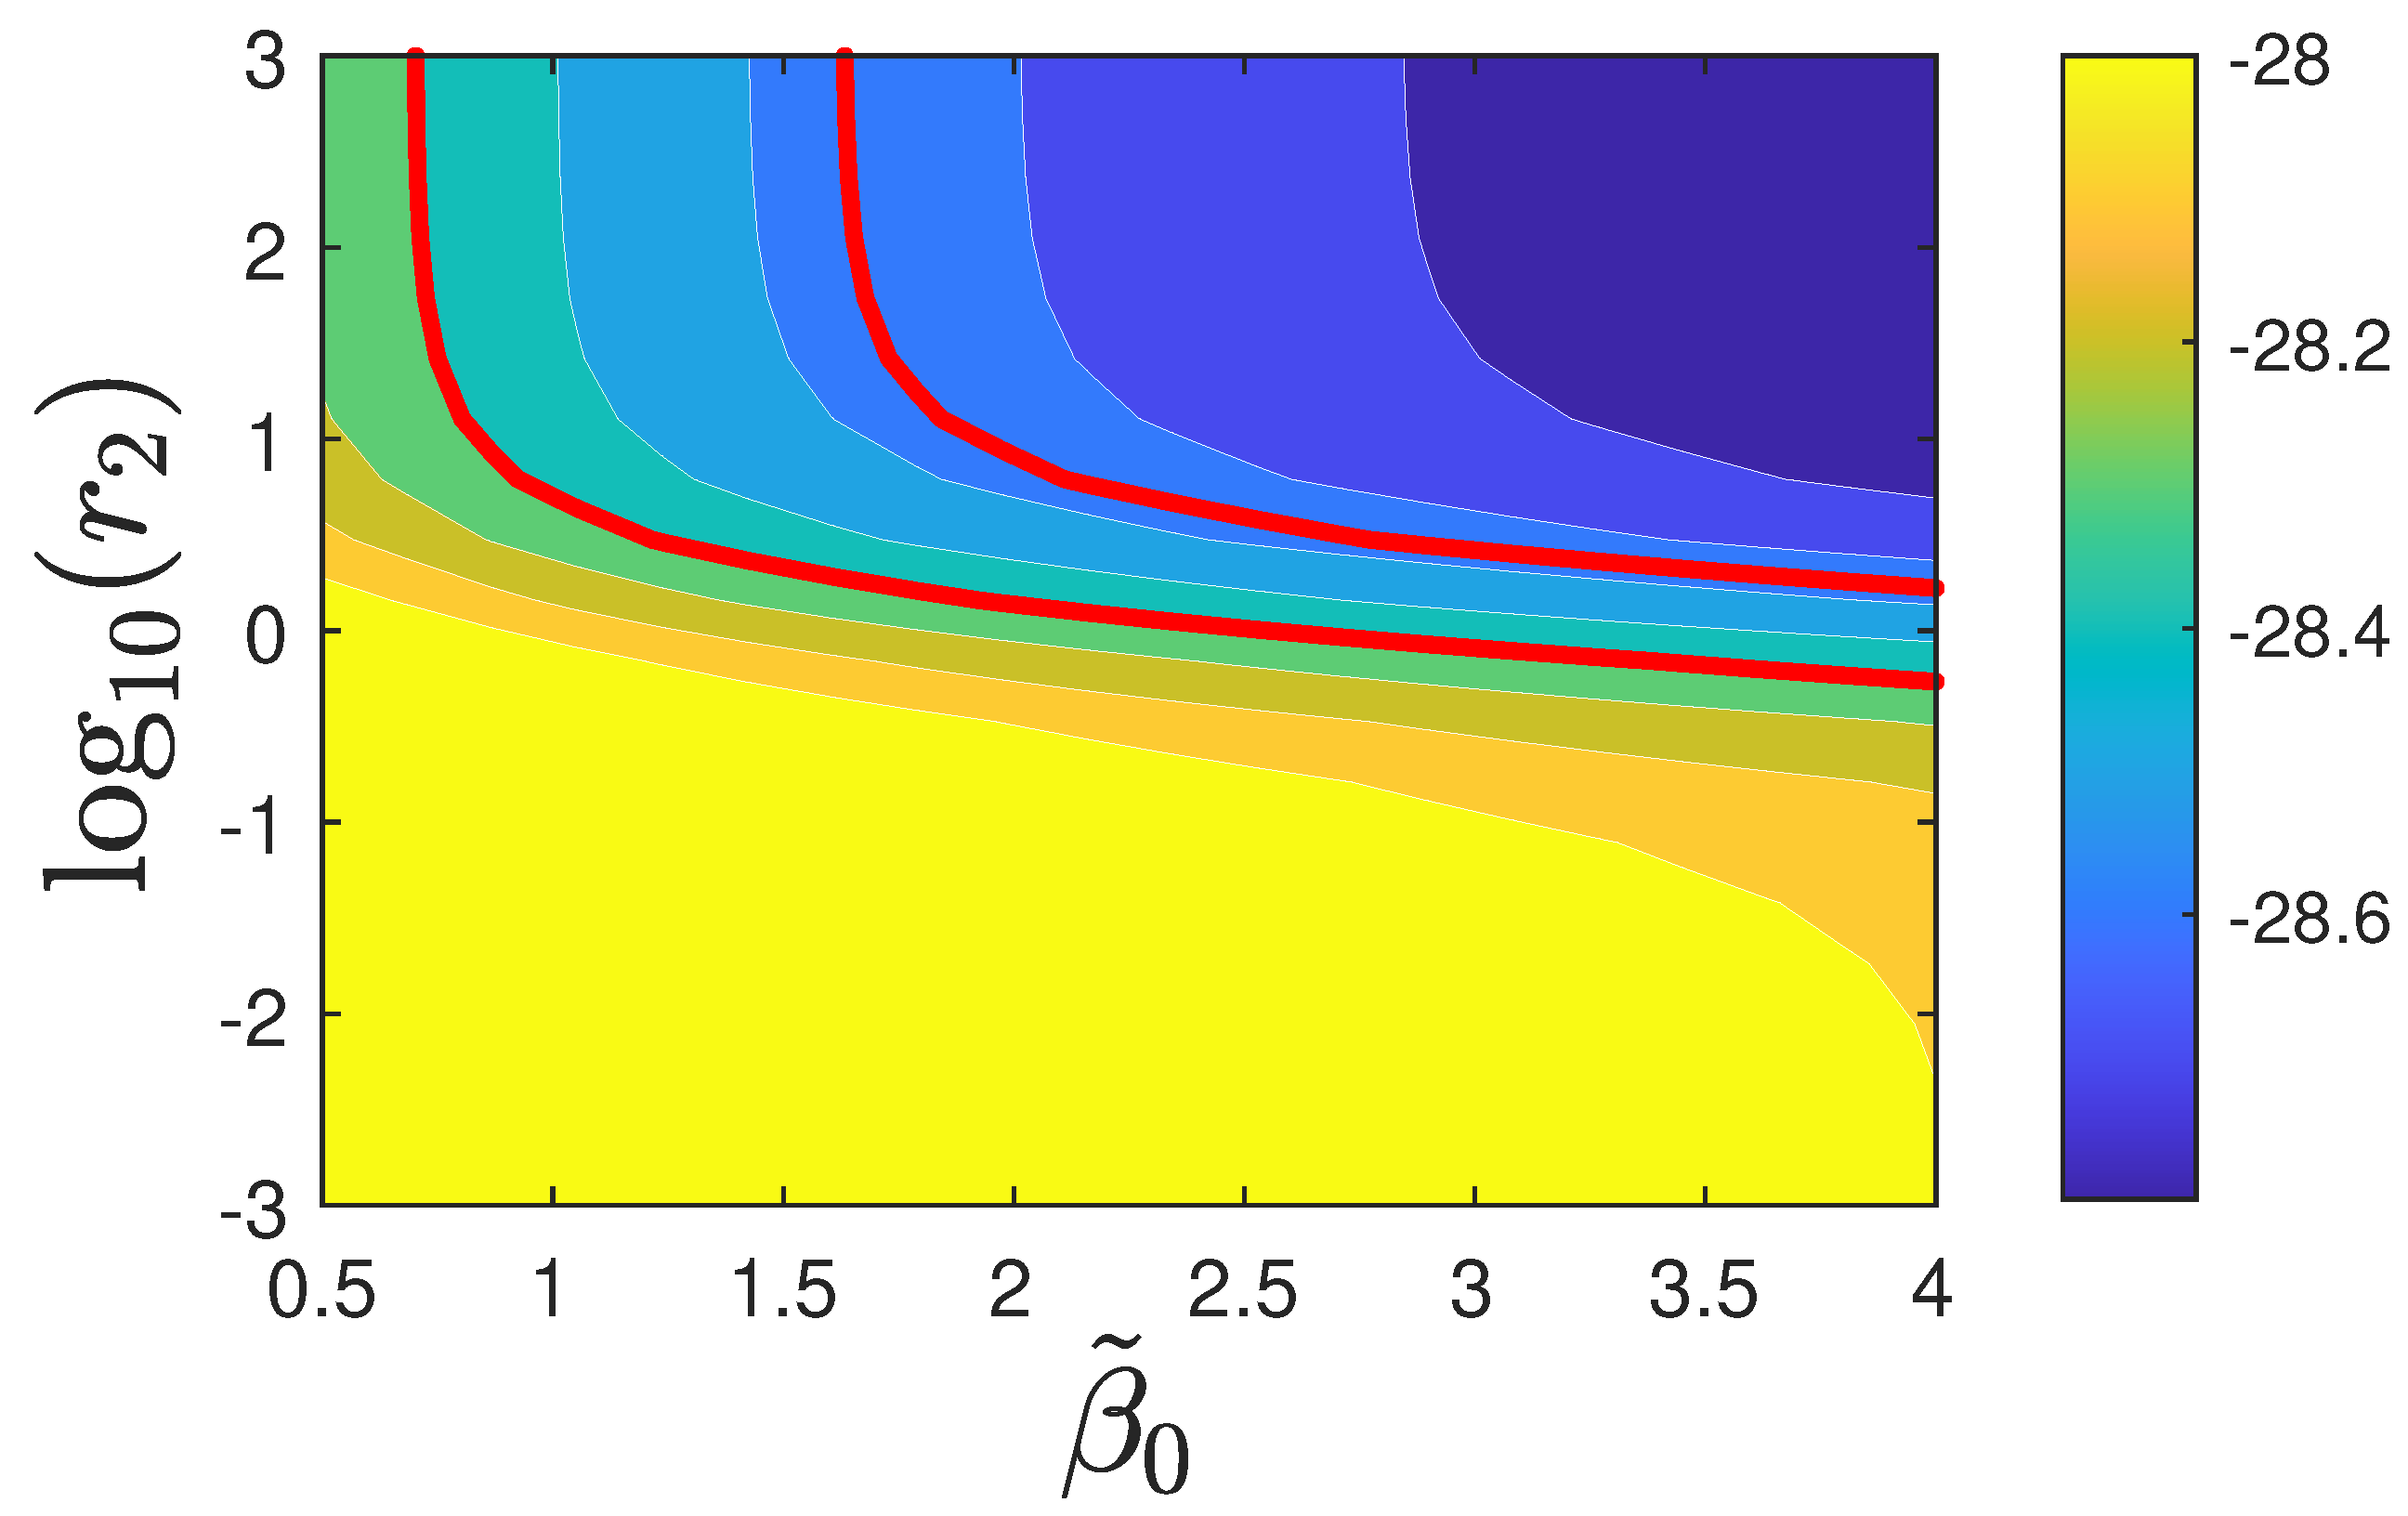
Figure 8 the allowed range of values values of the parameters
and
in the case
provided by constraint (116) from the observed
.
For
, in the limit
so that
kg
. This latter expression agrees with the values for
shown in
Figure 8 at
.
Using Equations (25)–(27) and Equation (42) one obtains in the case of negligible stellar feedback for the redshift dependencies of the three fractions
Adopting for
the value
as best choice from constraints (114) and (115) then provides
from the third constraint (116). In
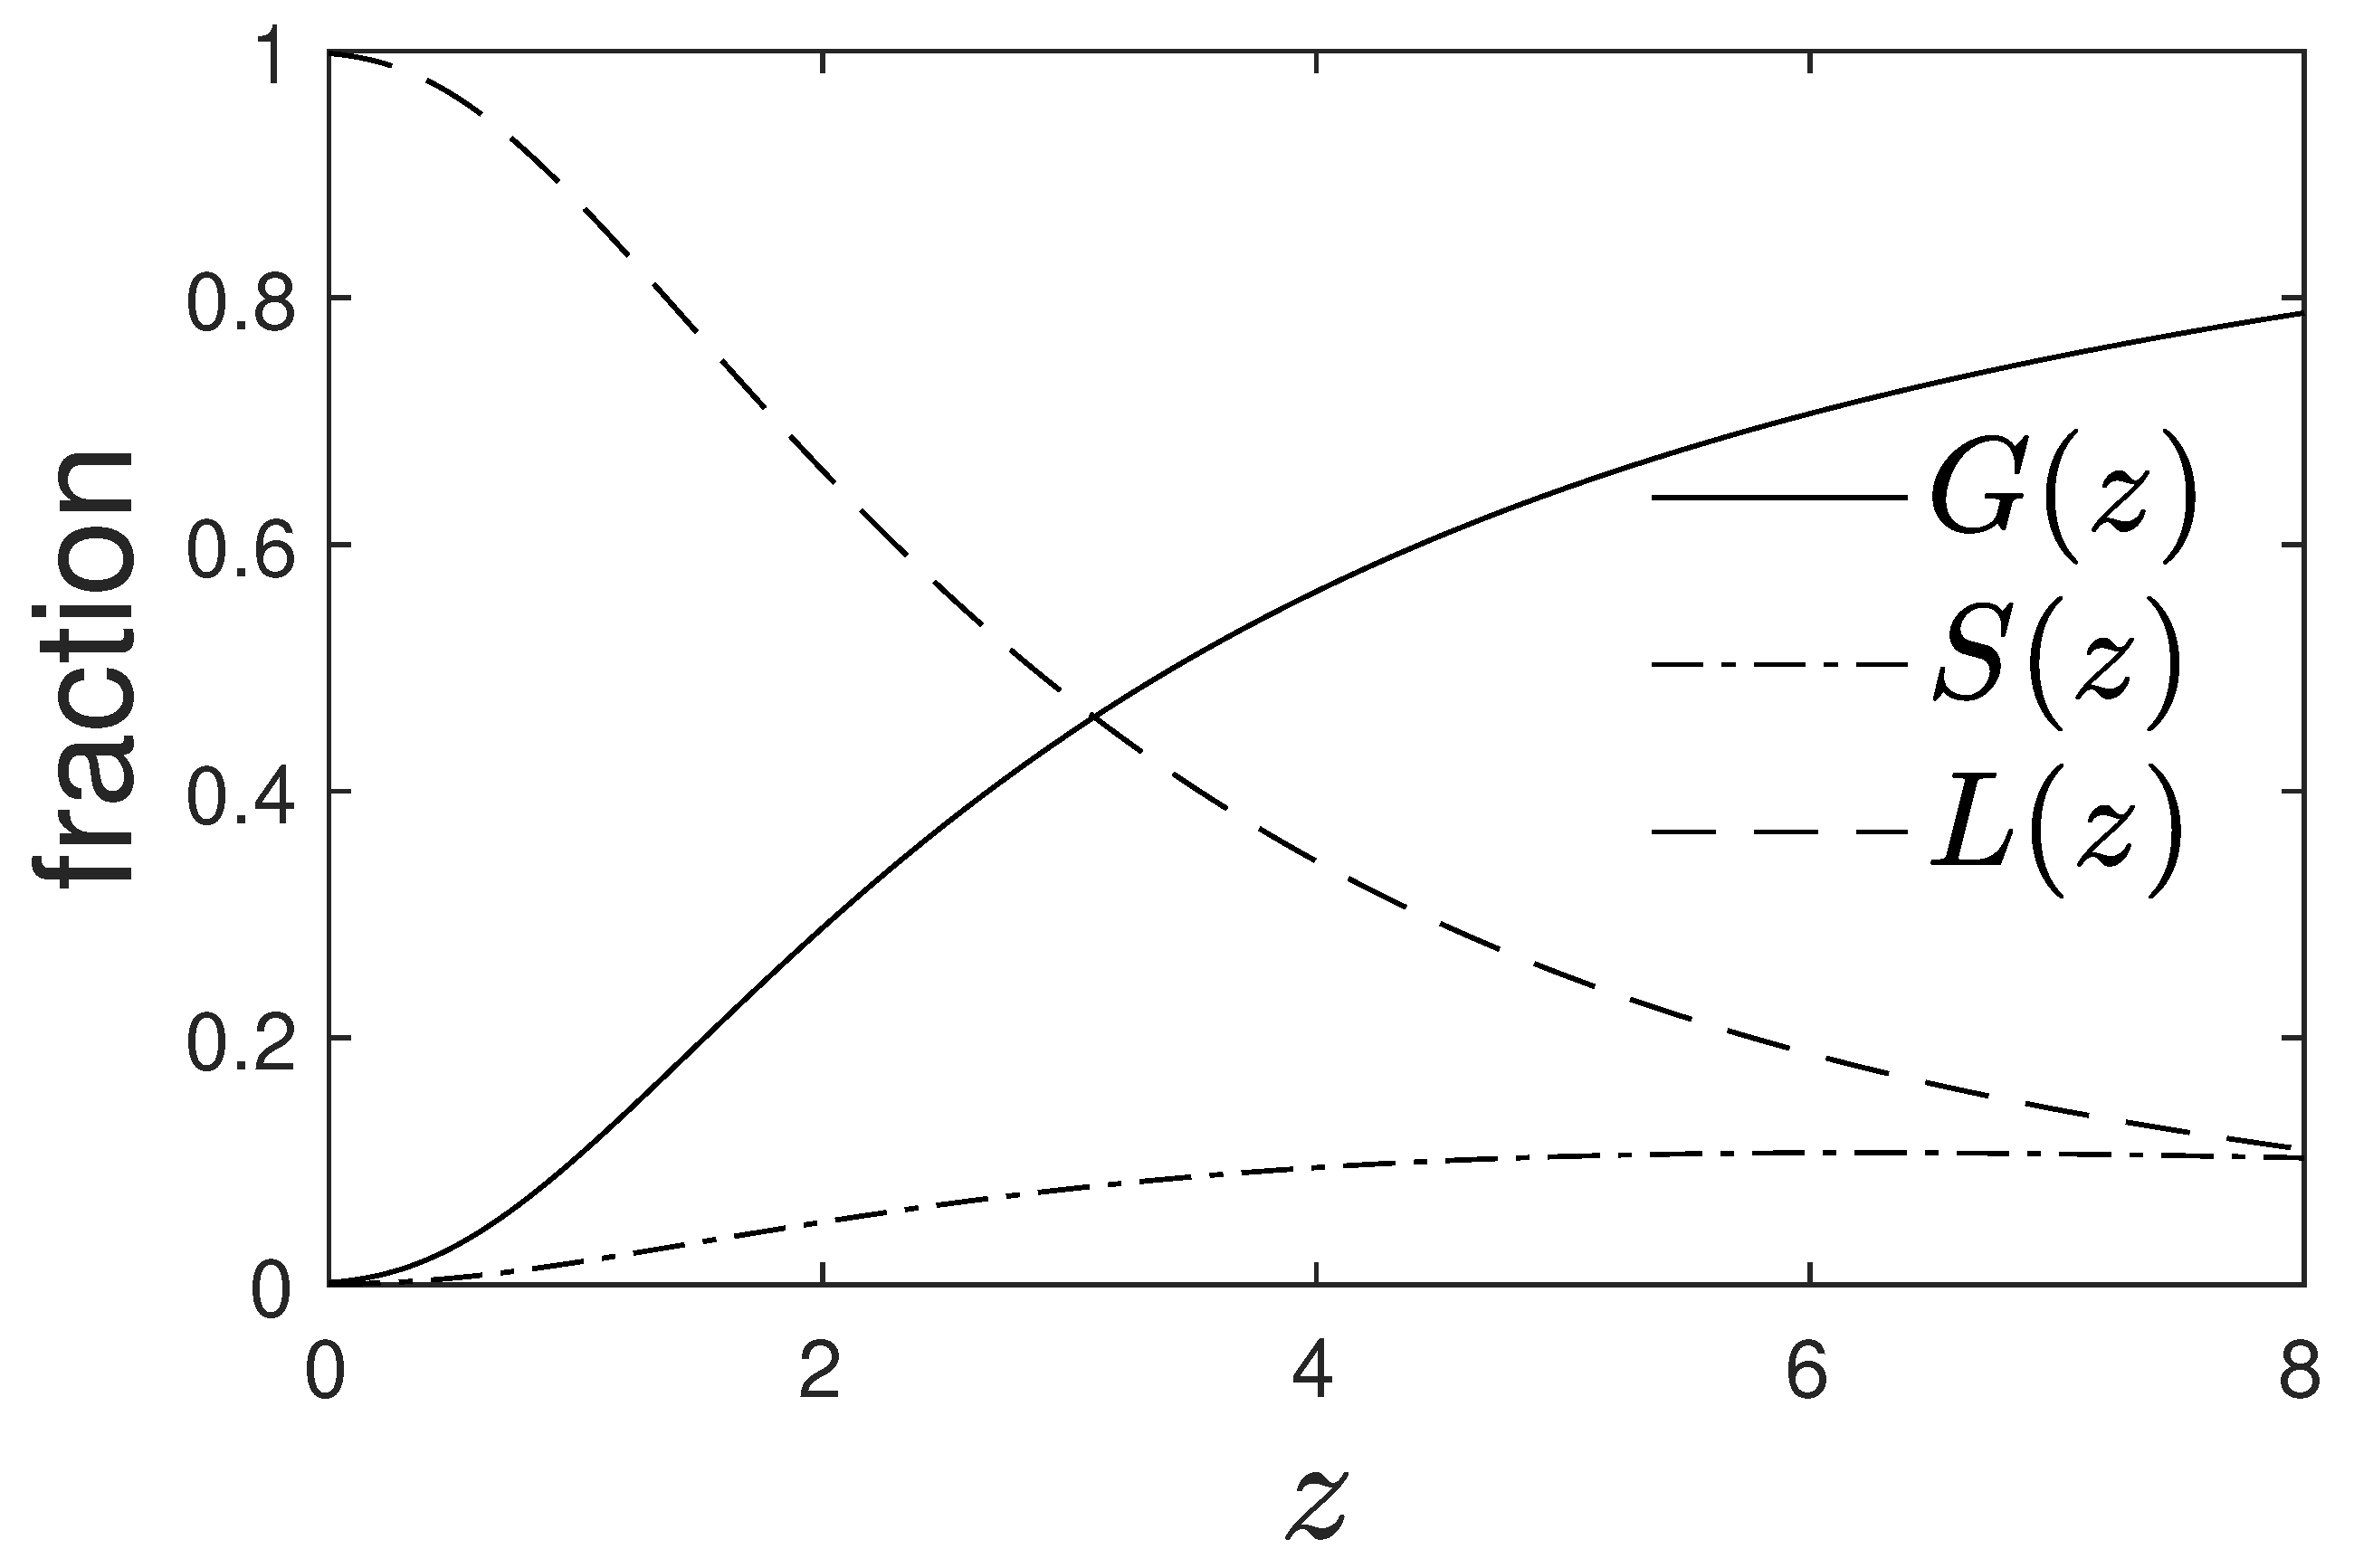
Figure 9 we show the redshift dependencies of the three fractions (118) for the parameter set
. For the present-day values at
we then find
,
. The vast majority (more than 99.4 percent) of the baryons in the the present universe reside in form of locked-in stellar matter in white dwarfs, neutron stars and black holes.
7. Summary and Conclusions
The compartmental description, well-known from the description of infection diseases and epidemics, is applied to describe the temporal evolution of the baryonic matter in interstellar gas and stars. The introduction of gaseous and stellar fractions of the total baryonic matter as the basic dynamical variables is advantageous because it allows to apply the description to a variety of astrophysical systems.
In this first paper of a series the competition of spontaneous star formation, stellar feedback and stellar evolution is theoretically investigated in order to understand the baryonic matter cycle whereas the inclusion of also the triggered star formation process will be the subject of the second paper of this series. Luminous baryonic matter occurs as interstellar and intergalactic gas with the fraction as well as in main-sequence stars with the fraction . The third compartment with fraction denotes weakly luminous matter in white dwarfs, neutron stars and black holes (referred to as locked-in matter) which have no significant stellar feedback to the gaseous matter compartment. The temporal evolution of the three fractions are controlled by the respective rates of spontaneous star formation (), of stellar feedback () of stellar to gaseous matter, and of the formation () of white dwarfs, neutron stars and black holes from stellar evolution.
By introducing the dimensionless reduced time variable for arbitrarily but given time-dependent spontaneous SFR coefficient , as well as the ratios and , the derived exact solutions of the dynamical equations hold for stationary rates as well as for the case of the same time dependence of all rates. The accuracy of the analytical solutions is proven by the favorite comparison with the exact numerical solutions of the dynamical equations.
Of particular interest is the understanding of the cosmic star formation history and the present-day gas fraction with compartmental models. For a flat CDM Friedmann cosmology the relationship between the reduced time variable and the cosmological redshift z is used to calculate the redshift dependence of the cosmological star formation rate, the integrated stellar density and the present-day gas fraction from the derived gaseous fraction determining the formation rate of news stars.
The comparison with the observed cosmological star formation rate and the integrated stellar density indicates that the simplified GS-model ignoring stellar evolution cannot explain the observations reasonably well with one single stationary spontaneous SFR coefficient . The best compromise value Hz implies a present-day gas fraction in the universe of about percent.
However, the situation is considerably improved in the full GSL-model including stellar evolution, although the agreement with observations is not perfect. Here the observed cosmological star formation rate and the integrated stellar density as a function of redshift are reasonably well explained by the compartmental model without triggered star formation by the competition of spontaneous star formation and stellar evolution whereas the influence of stellar feedback is less important. The action of stellar evolution provides a significant redshift dependent reduction factor when calculating the integrated stellar density from the star formation rate. Then the fits to the observation allow us conclusions on the relative importance of spontaneous star formation, stellar evolution and feedback in the early universe after the recombination era until today. Lowering the value of the Hubble constant to smaller than the nominal one () improves the agreement of the GSL-Model with the observations. The present-day gas, luminous star and locked-in stellar matter fractions indicate that the vast majority of the baryons (more than 99.4 percent) resides in the form of locked-in stellar matter in white dwarfs, neutron stars and black holes. These objects are the astrophysical sites for any hidden baryons.
The non-perfect agreement of the GSL-model with only spontaneous star formation process defines a challenge for future work to demonstrate that the inclusion of the triggered star formation process can remedy the situation significantly. In conclusion, this work has demonstrated that compartmental models of the type introduced here lead to new and original insights on the cosmological baryonic matter cycle in the universe.
Acknowledgments
R.S. gratefully acknowledges the institutional support by the Astrophysics Group headed by Prof. Dr. Wolfgang Duschl and Prof. Dr. Sebastian Wolf at the Institut für Theoretische Physik und Astrophysik of the Christian-Albrechts-Universität in Kiel, Germany.
Appendix A. Lambert Functions
In this manuscript we encounter transcendental equations of the form
with arbitrary values of
A and
C. Substituting
then yields for Equation (
A1)
which can be solved (see Appendix G in [
23] as
in terms of Lambert functions. Consequently, the solution of Equation (
A1) is given by
where we used Lambert’s equation
defining the Lambert function
. The Lambert Equation (
A5) can only be solved for real-valued
z if
. One obtains the principal branch
for arguments
and the two branches
and
if
. For these negative real arguments the principal branch has values
and the lower branch
has values smaller than
.
References
- Bonnor, W. B. Monthly Notices R. Astron. Soc 1956, 16, 351. [Google Scholar]
- Boylan-Kolchin, M.; Weisz, D.R. Monthly Notices R. Astron. Soc. 2021, 505, 2764. [Google Scholar] [CrossRef]
- Carroll, B.W.; Ostlie, D.A. An Introduction to Modern Astrophysics, 2nd ed.; Cambridge University Press: Cambridge, 2017. [Google Scholar]
- Carroll, S.M.; Press, W.H.; Turner, E.L. Ann. Rev. Astron. Astrophys. 1992, 30, 499. [CrossRef]
- Clayton, D. D. Principles of Stellar Evolution and Nucleosynthesis; University of Chicago Press: Chicago, 1983. [Google Scholar]
- Cousin, M.; Lagache, G.; Bethermin, M.; Guiderdoni, B. Astron. Astrophys. 2015, 575.
- Cucciati, O., Tresse, L., Ilbert, O., et al. Astron. Astrophys 2012, 539, A31. [CrossRef]
- Dahlen, T., Mobasher, B., Dickinson, M., et al. Astrophys. J. 2007.
- Dave, R.; Finlator, K.; Oppenheimer, B.D. Monthly Notices R. Astron. Soc. 2011, 416, 1354. [Google Scholar]
- Davis, A.J.; Khochfar, S.; Dalla, V.C. Monthly Notices R. Astron. Soc. 2014, 443, 985. [Google Scholar] [CrossRef]
- Ebert, R. Z. Astrophysik 1955, 37, 215. [Google Scholar]
- Elmegreen, B.G. Astrophys. J. 1997, 477, 196. [Google Scholar]
- Estrada, E. Phys. Rep. 2020, 869, 1. [CrossRef] [PubMed]
- Frank, J.; King, A.; Raine, D. Accretion Power in Astrophysics, 3rd ed.; Cambridge University Press: Cambridge, 2002. [Google Scholar]
- Hansen, C.J.; Kawaler, S.D.; Trimble, V. Stellar Interiors: Physical Principles, Structure, and Evolution, 2nd ed.; S: (New York, 2004. [Google Scholar]
- Hennebelle, P.; Chabrier, G. Astrophys. J. Lett. 2011, 743, L29. [Google Scholar]
- Hethcote, H.W. Biomathematics. In Applied Mathematical Ecology; Levin, S.A., Hallam, T.G., Gross, L.J., Eds.; Springer: Berlin, 1989; Vol. 18, pp. 119–144. [Google Scholar]
- Hethcote, H.W. SIAM. Rev 2000, 42, 599. [Google Scholar]
- Hogg, D.W. 2000, arXiv:astro-ph/9905116.
- Kendall, D.G. Proceedings of the Third Berkeley Symposium on Mathematical Statistics and Probability; University of California Press: Berkeley, CA, USA, 1956; p. 149. [Google Scholar]
- Kermack, W.O.; McKendrick, A.G. Proc. R. Soc. A 1927, 115, 700.
- Klessen, R.S.; Glover, S.C. Annu. Rev. Astron. Astrophys. 2023, 61, 65. [CrossRef]
- Kröger, M.; Schlickeiser, R. J. Phys. A 2020, 53, 505601. [CrossRef]
- Lang, K.R. Astrophysical Formulae: Space, Time, Matter, and Cosmology, 3rd ed.; Springer: Berlin, 1999. [Google Scholar]
- Lang, K.R. The Life and Death of Stars; Cambridge University Press: Cambridge, 2013. [Google Scholar]
- Low, M. M. M.; Klessen, R.S. Control of Star Formation by Supersonic Turbulence. Rev. Mod. Phys. 2004, 76, 125–194. [Google Scholar]
- Madau, P.; Dickinson, M. Annu. Rev. Astron. Astrophys 2014, 52, 415. [CrossRef]
- Maoz, D.; Graur, O. Astrophys. J. 2017, 848, 25. [CrossRef]
- Mercado, F. J., Bullock, J. S., Boylan-Kolchin, M., et al. Monthly Notices R. Astron. Soc. 2021, 501, 5121. [Google Scholar]
- Moustakas, J., Coil, A. L., Aird, J., et al. Astrophys. J. 2013. [Google Scholar]
- Naoz, S.; Perna, R. Astrophys. J. 2014. [Google Scholar]
- Peebles, P. J. E. Principles of Physical Cosmology; Princeton University Press: Princeton, NJ, United States, 1993. [Google Scholar]
- Peng, Y.; Maiolino, R. Monthly Notices R. Astron. Soc. 2014, 443, 3643. [Google Scholar] [CrossRef]
- Perez-Gonzalez, P. G., Rieke, G. H., Villar, V., et al. Astrophys. J. 2008, 675, 234. [Google Scholar]
- Péroux, C.; Howk, J.C. Annu. Rev. Astron. Astrophys. 2020, 58, 363. [CrossRef]
- Phillips, A. The Physics of Stars; John Wiley & Sons: Chichester, 1999. [Google Scholar]
- Portinari, L.; Chiosi, C.; Bressan, A. Astron. Astrophys 1998, 334, 505. [Google Scholar]
- Ryden, B. Introduction to Cosmology, 2nd ed.; C: (Cambridge, 2017. [Google Scholar]
- Sadoun, R.; Shlosman, I.; Choi, J.-H.; Romano-Diaz, E. Astrophys. J. 2016, 829. [Google Scholar]
- Shampine, L.F.; Reichelt, M. SIAM. J. Sci. Comput. 1997, 18, 1. [Google Scholar]
- Shapiro, S.L.; Teukolsky, S.A. Black Holes, White Dwarfs, and Neutron Stars: The Physics of Compact Objects; Wiley-Interscience: New York, 1983. [Google Scholar]
- Somerville, R.S.; Dave, R. Annu. Rev. Astron. Astrophys. 2015, 53, 51. [Google Scholar] [CrossRef]
- Tielens, A.G.G.M. The Physics and Chemistry of the Interstellar Medium; Cambridge University Press: Cambridge, 2005. [Google Scholar]
- Tinsley, B. M. Fundament. Cosmic Phys. 1980, 5, 287. [Google Scholar]
- Tortora, C.; Hunt, L.K.; Ginolfi, M. Astron. Astrophys 2022, 657. [Google Scholar]
- Weinberg, S. Cosmology; Oxford University Press: Oxford, 2008. [Google Scholar]
- Woosley, S. E.; Janka, H.-T. Nat. Phys. 2005, 1, 147. [CrossRef]
| 1 |
Note that . |
| 2 |
We emphasize the extremely sensitive dependence on the value of the Hubble constant and also on the ratio as with the upper limit ( 45) for the factor . |
| 3 |
To evaluate for large arguments (implying ) numerically, one can use . |
|
Disclaimer/Publisher’s Note: The statements, opinions and data contained in all publications are solely those of the individual author(s) and contributor(s) and not of MDPI and/or the editor(s). MDPI and/or the editor(s) disclaim responsibility for any injury to people or property resulting from any ideas, methods, instructions or products referred to in the content. |
© 2024 by the authors. Licensee MDPI, Basel, Switzerland. This article is an open access article distributed under the terms and conditions of the Creative Commons Attribution (CC BY) license (http://creativecommons.org/licenses/by/4.0/).
