1. Introduction
Earthquake often takes place in particular regions across the world.On a worldwide scale, this disaster causes 2.5 million deaths and destroyed many buildings and infrastructure between 1900 to 2018.[
1] Therefore, it is important to apply novel technologies as an early warning system to reduce injuries and destruction. [
2]
The recent mega earthquakes damaged to the gas pipeline and infra-structures of the urban area. During the Kobe earthquake The shutdown of the related valves to isolate these blocks began six hours after the earthquake and the last block was isolated 15 hours after the earthquake.[
3] Other destructive earthquakes such as San Fernando earthquake in 1971, the Loma Prieta seismic event of 1989, Izmit earthquake in 1999 and San Salvador seismic event in 2001, resulted in damaging the pipelines and infra-structures and left sever injuries[
4].
The risk of a catastrophic earthquake threatens Iran every year.[
1] Tehran, the capital of Iran, is one of the most populated cities in the world. The city is surrounded by several active faults and thus is at a high risk of a sudden destructive earthquake. The gas transmitting network on the other hand, spreads throughout the city. Thus, occurring catastrophic disasters same to Kobe and Izmit events is probable in Tehran.
Many of natural disasters are unpredictable. Therefore, it is necessary to develop a technology to collect appropriate indicators as fast as possible. IoT is known as one of the pioneering technologies, which is susceptible to data changes and can send the sensed critical data in real-time to the cloud server. Nowadays, IoT plays a dynamic role in diverse areas such as national defense, smart grid, intelligent transportation, smart home, and healthcare[
5,
6,
7].
Lack of real-time precise information about response of structures and infra-structures, leads to the amplification of the disaster. The IoT technology seems to be an appropriate tool to monitor and manage such issues at early moments of post-event which consequently leads to reduce the fatalities and indirect impacts. On the other hand, pairing the IoT and Fuzzy system can help a crisis manager to create more proactive and efficient network capable of forecasting and managing earthquake. Such a network may associate with tens of sensing nodes to measure accelerometer and dispatch them to the cloud server. The measured data is being compared to the pre-defined values in the fuzzy system to check if the significant changes created.
This paper aims to define the sensor network design for earthquake early warning developed system based on IoT architecture incorporating practical experiences and theoretical knowledge. The system is proposed for possible safe shutdown of a gas and electric transmission network.
This model considers an additional element which may attach to the operational sensors and can process the data using the decision-making criteria (DMC). The DMC is defined in the cloud layer and can execute the relevant scenario to reduce indirect loss.
2. Literature Review
Following introducing IoT by Kevin Ashton in 1999, the number of internet-connected devices quickly increased. Nowadays, internet-connected devices are engaged in many application domains[
8].
IoT is a system of interrelated computing devices, mechanical and digital machines, objects or people that are provided with unique identifiers and the ability to transfer data over a network without requiring human to human or human to computer interaction.
The system consists of sensors or devices which communicate with the cloud through some kind of connectivity. Once the data gets to the cloud, software processes it and then might decide to perform an action, such as sending an alert or automatically adjusting the sensors or devices IoT without need to the user command.
Nowadays, transportation and logistics, healthcare, smart environment, business, manufacturing to home, knowledge management can benefit from IoT technologies. Furthermore, the increasing new smart things and internet-connected devices developed by companies suggests that, in the near future, futuristic uses (including robot taxi, city information model, and enhanced game room) will be accessible[
9,
10,
11].
Technology is capable of aiding relief operation planning as well as managing and analyzing the long-term effects of a particular disaster[
12].One of the main activities of such technologies is timely delivery of relief supplies from the distribution centers to hospitals matching with the medical teams’ schedule [
13]. Crisis management planning is strongly dependent on the climatic conditions, the topology, and habitat as well as available resources [
14].
Fuzzy logic term was introduced by [
15]. It is a form of different valued logic numbers between 0 and 1. It is utilized to handle the concept of halfway truth, where the truth esteem may extend between half wrong and right. Civil engineering field especially on earthquake engineering use fuzzy logic techniques often in crisis management [
16], crisis management in gas transmission networks[
17], hazard evaluation [
18], motion earthquake records[
19], Earthquake Prediction[
20].
3. Theoretical Background
An image of the current literature associated with the studied topic is presented herein. the key role of technology in disaster management is helping to relief forces to More purposeful helping to injury. Undoubtedly, effective emergency reaction management after an earthquake is an important component of seismic risk reduction. Studies have revealed that inappropriate emergency reaction or a subsequent catastrophe may grow the death toll of an earthquake by up to 10 [
21].
In the international leading position, Japan ascribes high significance to observation experiment of indoor and outdoor, landslide debris flow, the forecast model research, the early warning system research as well as the development in debris flow and landslide monitoring[
22]. Individuals will have time to respond from a few to a dozens of seconds in anywhere according to their places. Based on the performance report of the Japan Meteorological Agency (JMA) earthquake early warning (EEW) system for the Mw 9.0 Tohoku earthquake in 2011 [
23,
24], an EEW was issued more than 15 sec before outset of tough ground motion in the Tohoku that was relatively close to the epicenter. This is a decent instance of an EEW system effectiveness. Istanbul Earthquake Rapid Response and Early Warning System (IERREWS) defined as an EWS solution for earthquake threat. The system collects seismological data via 100 robust motion accelerometers, which allows the seismic wave propagation to be understood better [
25]
The fast loss estimate systems is applied in Japan and Taiwan at present defined respectively [
26,
27].
A fast loss estimate instrument known as Earthquake Loss Estimation Routine [
28] was made by the European Commission(EC) funded Network of Research Infrastructures for European Seismology(NERIES)[
29] to be applied by European agencies, among them the European Mediterranean Seismological Center (EMSC) to compute and broadcast earthquake loss estimations of near-real-time to the related emergency reaction organizations[
30].
The effectiveness of (EEW) systems to mitigate earthquake hazards and reduce casualties from earthquakes, especially major ones, has been fully demonstrated in Japan and Mexico[
31]. In Mexico, earthquake alerts from the seismic alert system transmitted to Mexico City more than 60 sec before the destructive waves hitting the region owing to the 12 digitally strong motion field stations along the Coast of Guerrero. For the EEW system, in Japan, more than 1000 nationwide uniform distribution stations provide basic monitoring data in the real time. Both inland and offshore earthquakes are observed, and warnings are generated if the maximum seismic intensity on land is greater than five lower (approximatelyVII for modified Mercalli intensity). The proposed on-site EEWS has reached an 80% successful rate of accurately predicting the earthquake intensity levels, and is capable of automatically sending an alarm message at least eight seconds before the peak S-wave trains come even close to the earthquake epicenter[
32].
USGS has been working on the method to detect the earthquake just after it begins. In this method, first P-wave energy is calculated which provides the location and intensity of the earthquake[
33] .
According to Buzduga et al. [
34], if there is any survivor in a collapsed building, the electrostatic sensor transmits the information via radio transmitter received by radio receiver and the exact location of the survivor will be detected by the microcontroller attached to it.
Dan Wang et al. implemented an earthquake alarm system using wireless sensors. This implementation is faster than that of the others. The key is to position the sensor in a place where to make the overall system more efficient [
35].
The performance of earthquake early warning (EEW) systems is significantly affected by P-wave arrival picking. EEW's automated P-wave selecting algorithms have had issues with incorrectly picking up noise and missing P-waves. A convolution neural network (DPick)-based automatic algorithm has been developed.[
36]
Sultanova et al. Have conducted extensive studies on the Strength of underground pipelines under seismic effects.[
37]
Alphonsa A et al. demonstrated a method in which P-waves sensed by the sensors transferred by a Zigbee transmitter to a Zigbee receiver which is an IoT. The IoT transfers warning message to the smartphones [
38].
4. System Structure
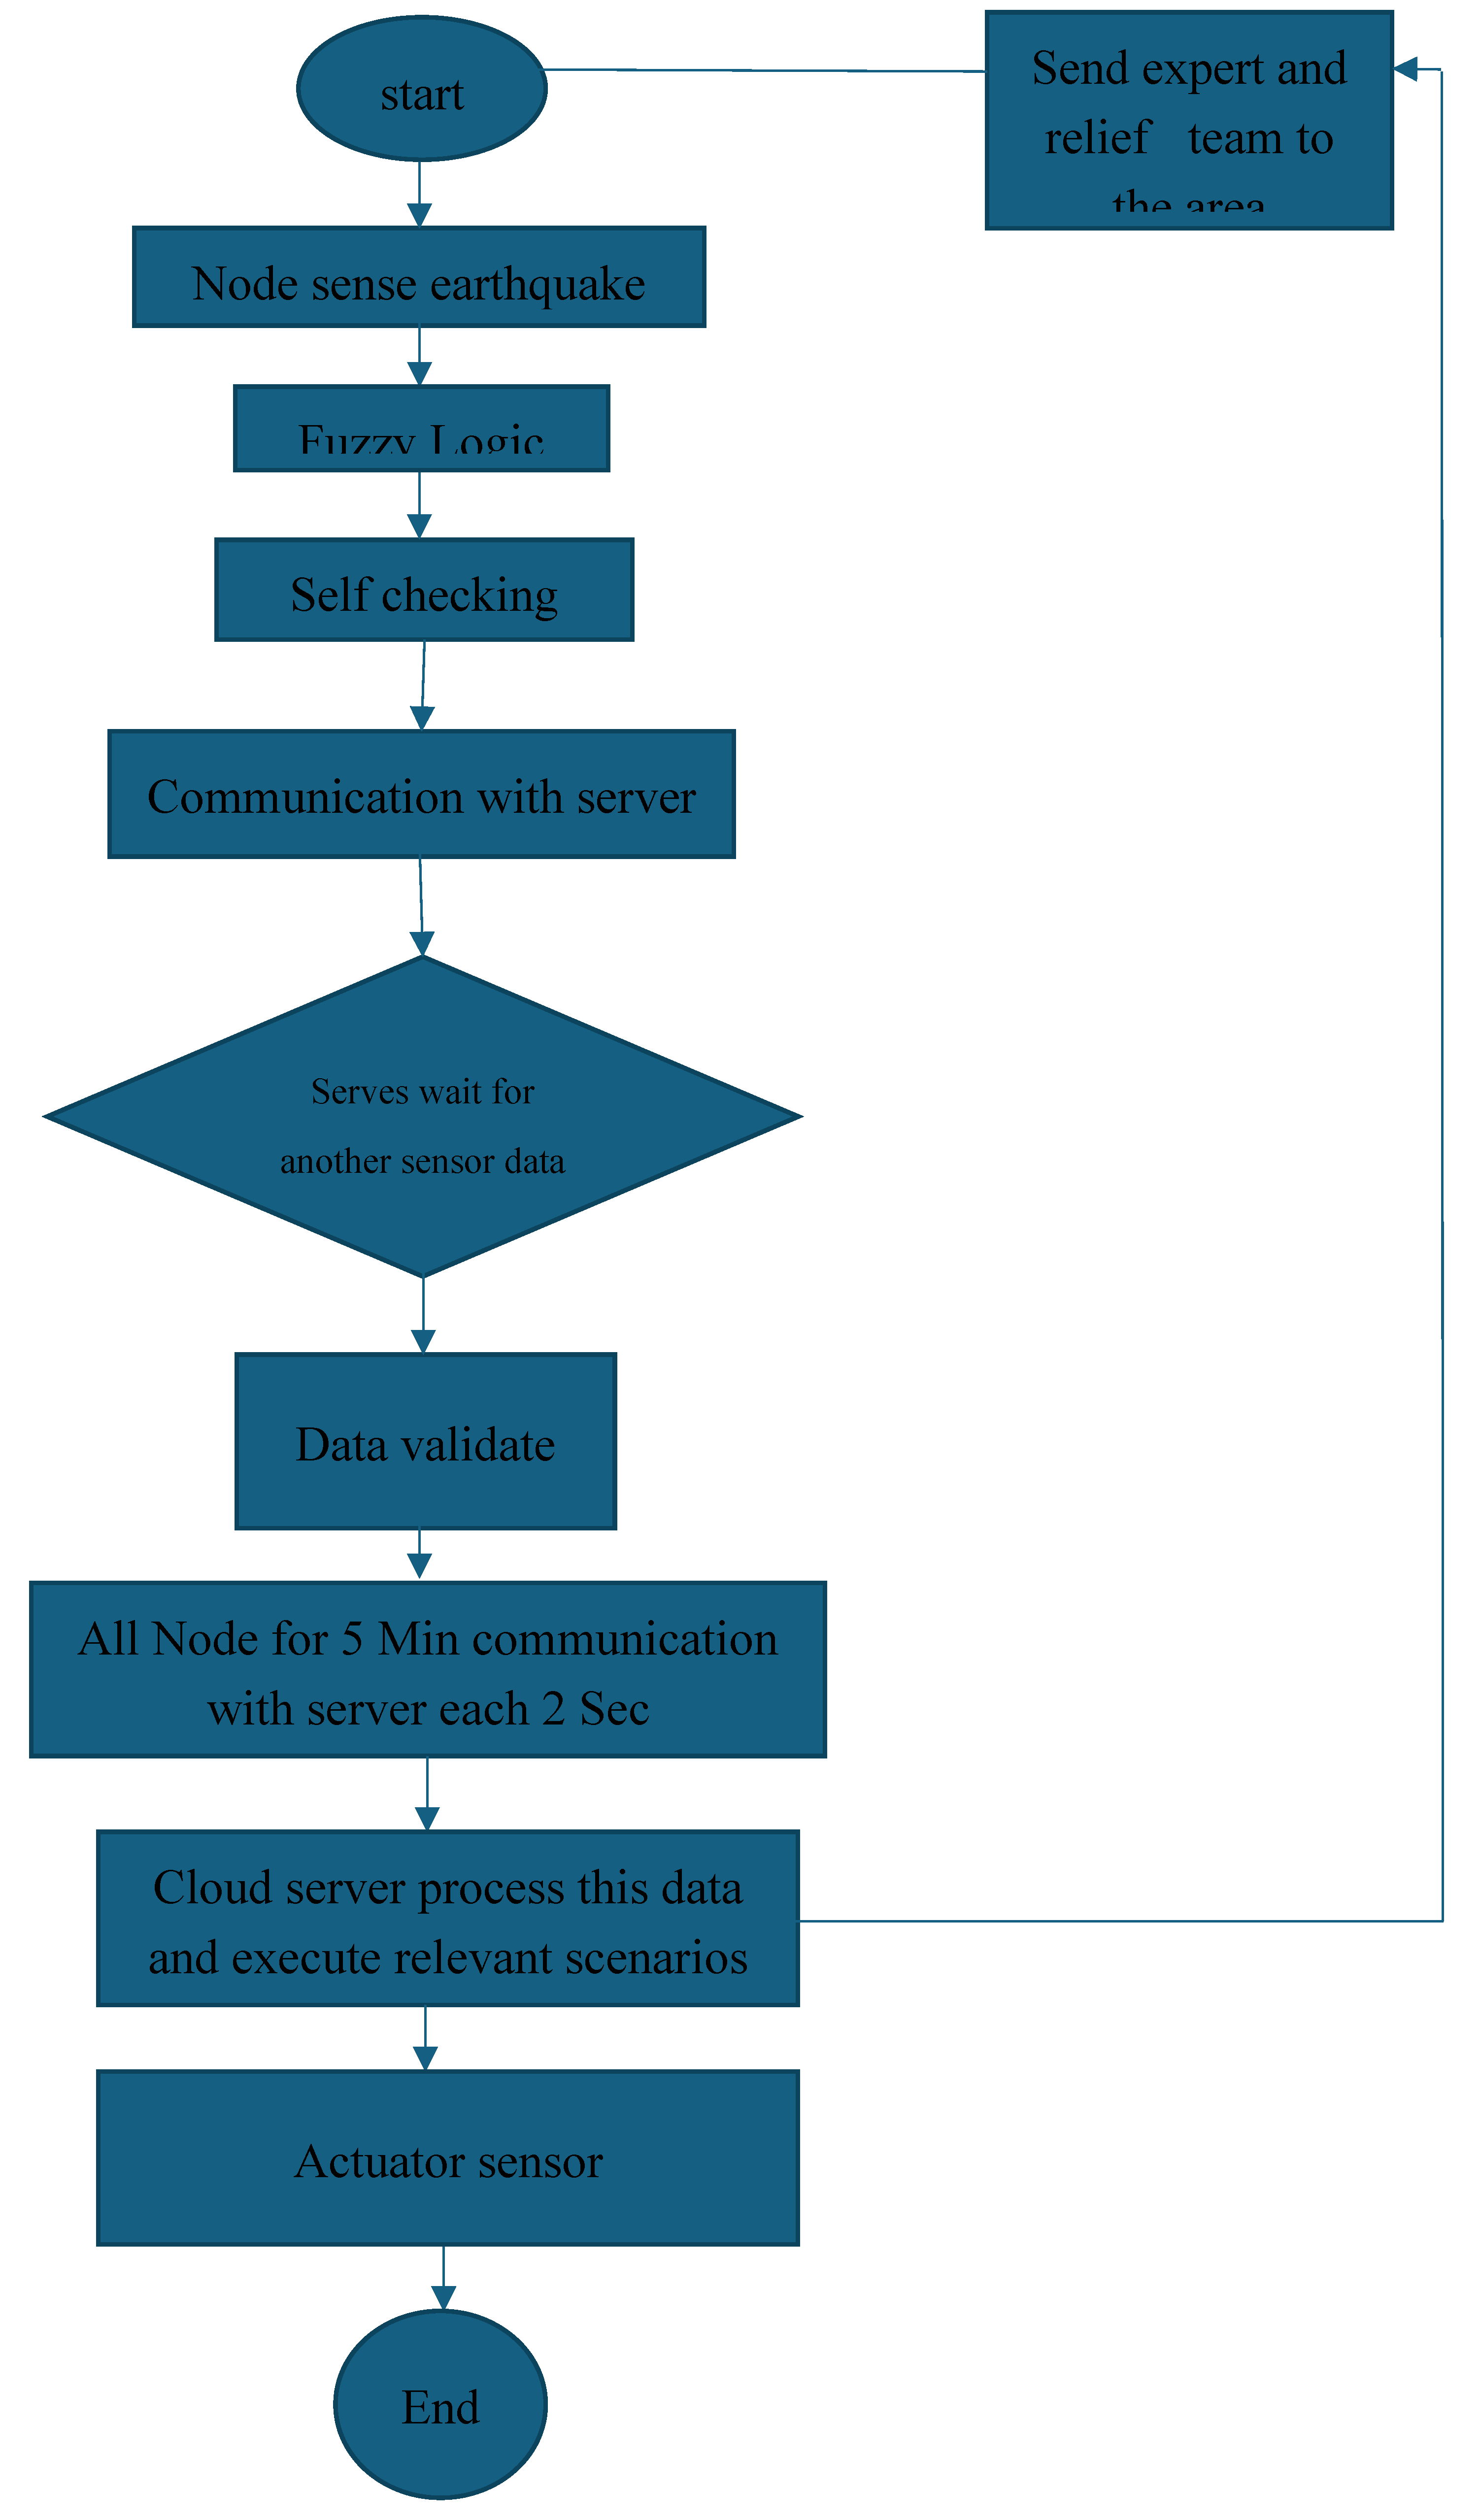
The architecture of an early warning system was developed based on IoT technology and fuzzy system with respect to expert knowledge and international researchers. This systems with P - wave recognition could shot-down Gas, Electric network before the destructive earthquake wave occurs.The system is an advanced version of early warning system discussed in the literature. The system consisted of five sensors measure multi parameters described in sensor section. the data is uploaded to the cloud through multi-hop wireless communication from the data aggregator. After local and server validation this data will be processed in cloud server and after that system executes the relevant scenarios and Operational sensors are given operational commands. (
Figure 1)
By using an early warning systems before occurring earthquakes, human errors could be highly reduced .Hein Hilary thinks more than 85% of enterprise safety accidents are caused by human’s unsafe behavior. A large number of accident investigations indicate the same results. Hence, it is important to monitor the unsafe behaviors of the employees in an enterprise accident early warning system[
39,
40].
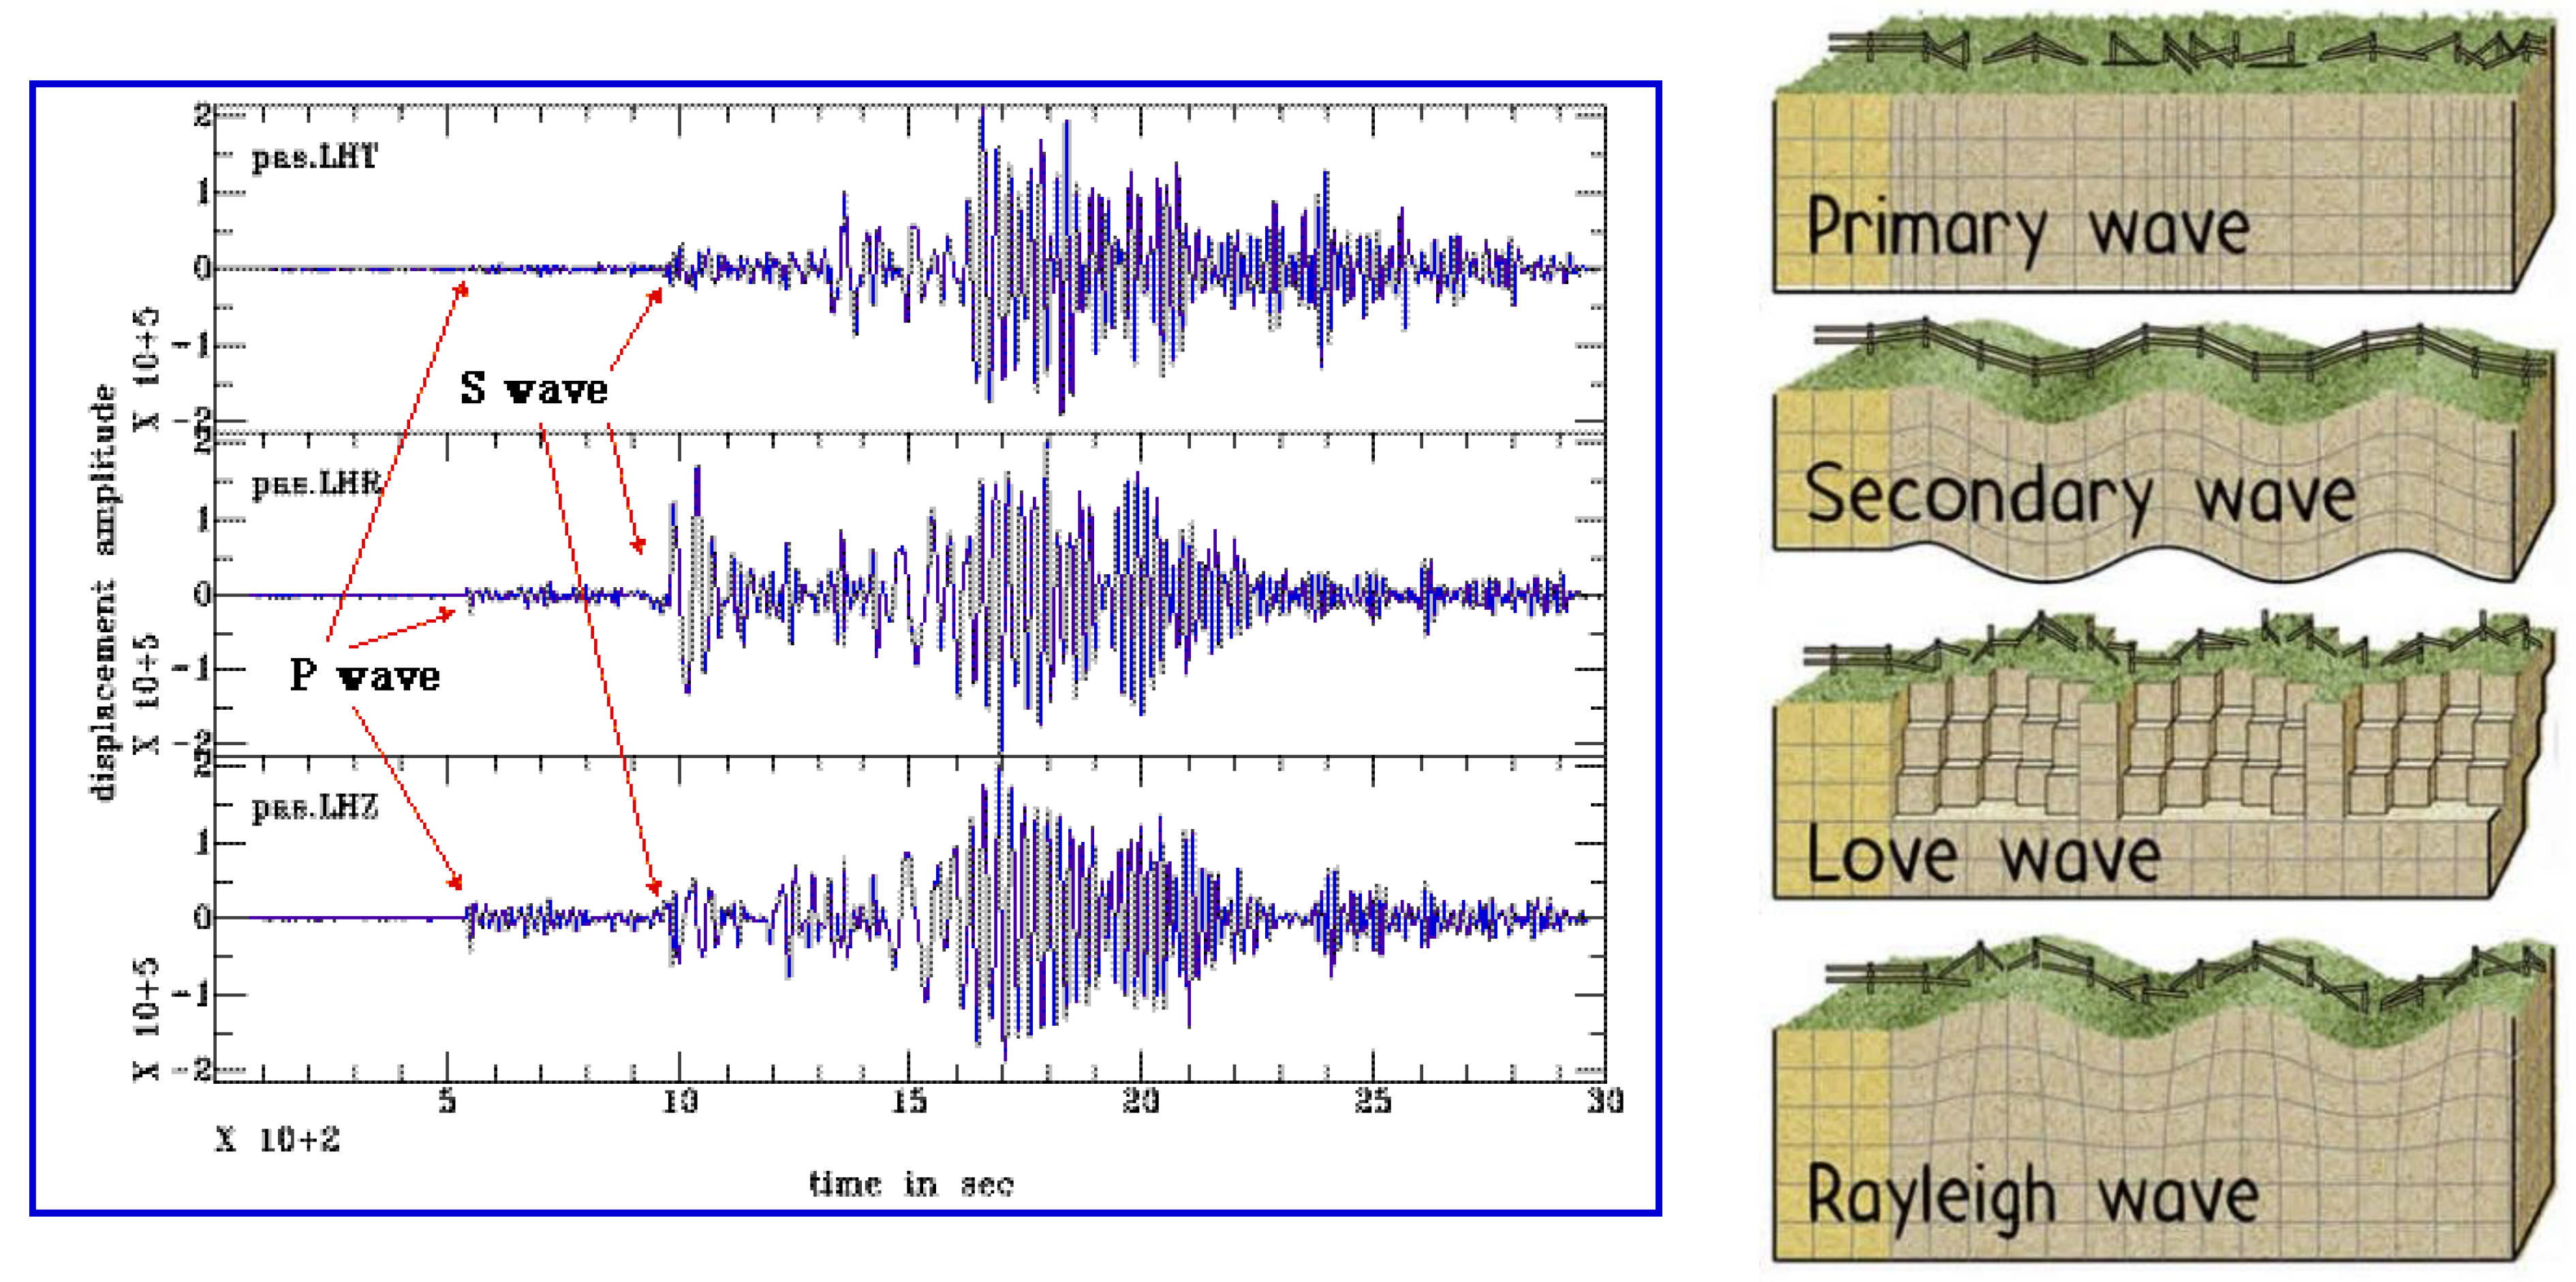
The acquiring of the real-time accelerogram based on the three axes data paves the way for the early identification of the primary seismic wave (P-wave); the first seismic wave that occurs after an earthquake with a prominent compression component. Any Earthquake rises 3 types of Seismic Waves .( Figure.2):
The P wave travels faster than the other seismic waves but is less dangerous than the others because it is a compression wave and usually does not generate heavy damages. Whilst the S wave travels about half of the P Wave’s speed. It is a transverse wave and causes dangerous shakings. The R/L Waves are the surface waves originated at the epicenter by a combination of P and S waves. Surface waves travel through the earth’s crust before losing all the energy. Generating horizontal and vertical oscillations of structures, R/L waves are damaging waves. R/L Waves travel more slowly than other Seismic Waves (about to 1/3 of the P-waves speed). Earthquake guard exploits this characteristic of the R/L waves to ‘predict’ the earthquake before it is felt by the people [
41].
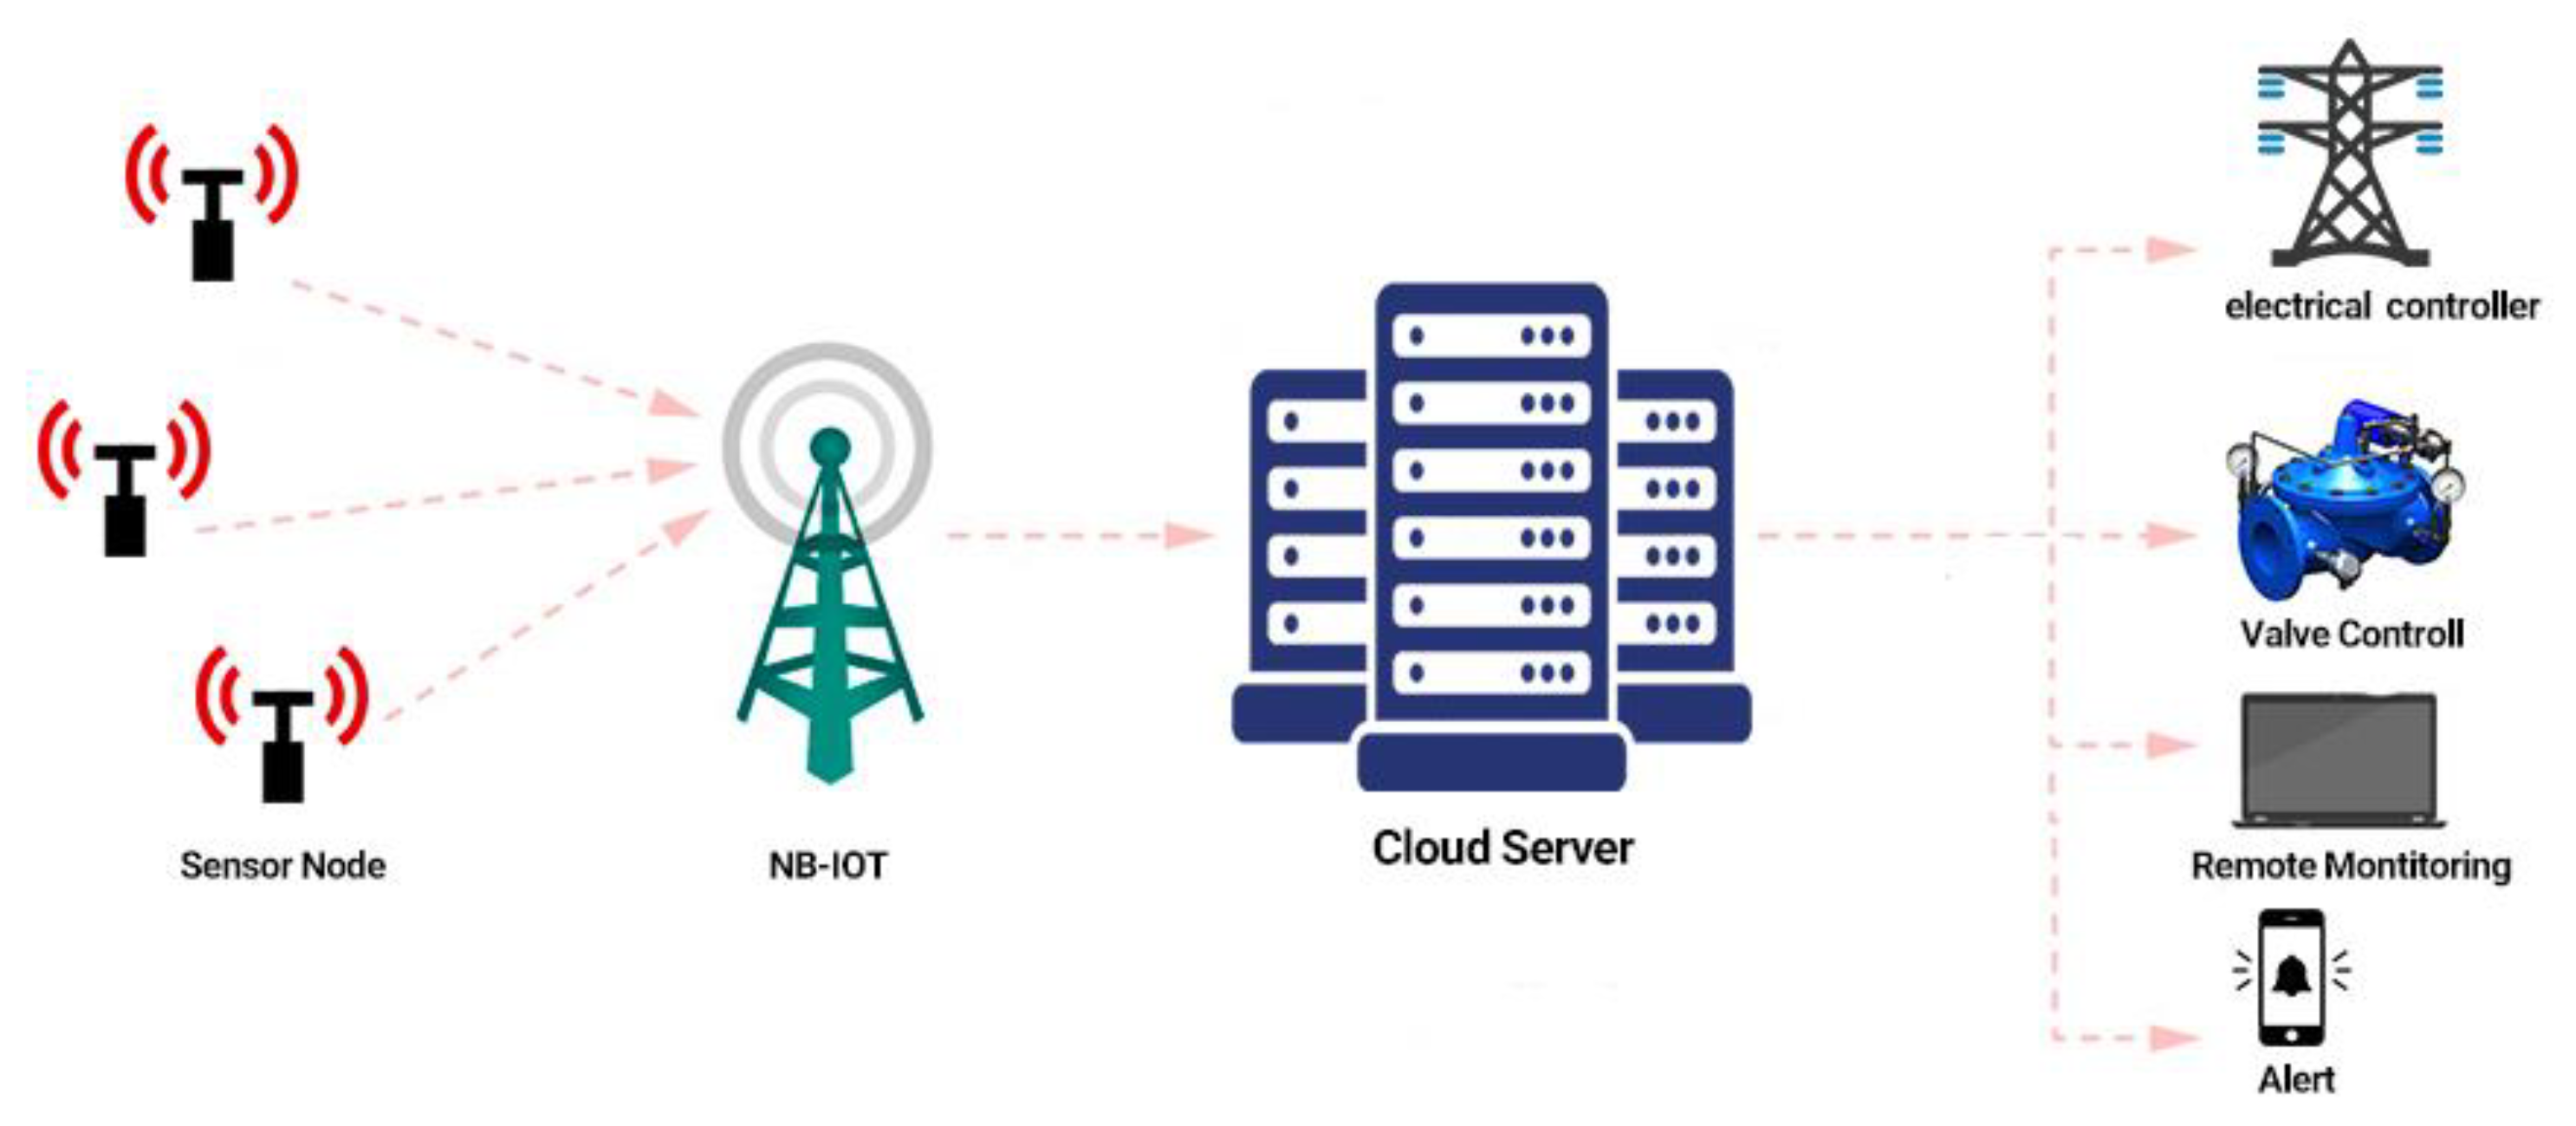
The suggested IoT-based solution to manage disaster effectively contains three steps which is presented in
Figure 3 :
1. Information Gathering sensors and Actuator sensors
2. Information Transmission
3. Information Processing and Decision making
5. Information Gathering Sensors and Actuator Sensors
This section divided in 2 parts, section one is about the kind of sensor which is getting information, and section two is about actuator sensor to execute cloud server commands.
5.1. Receivers
This sector is also one of the most significant parts, because the procedure of data processing is the same as the eye system. It is necessary to measure the exact data used in the decision-making stage.
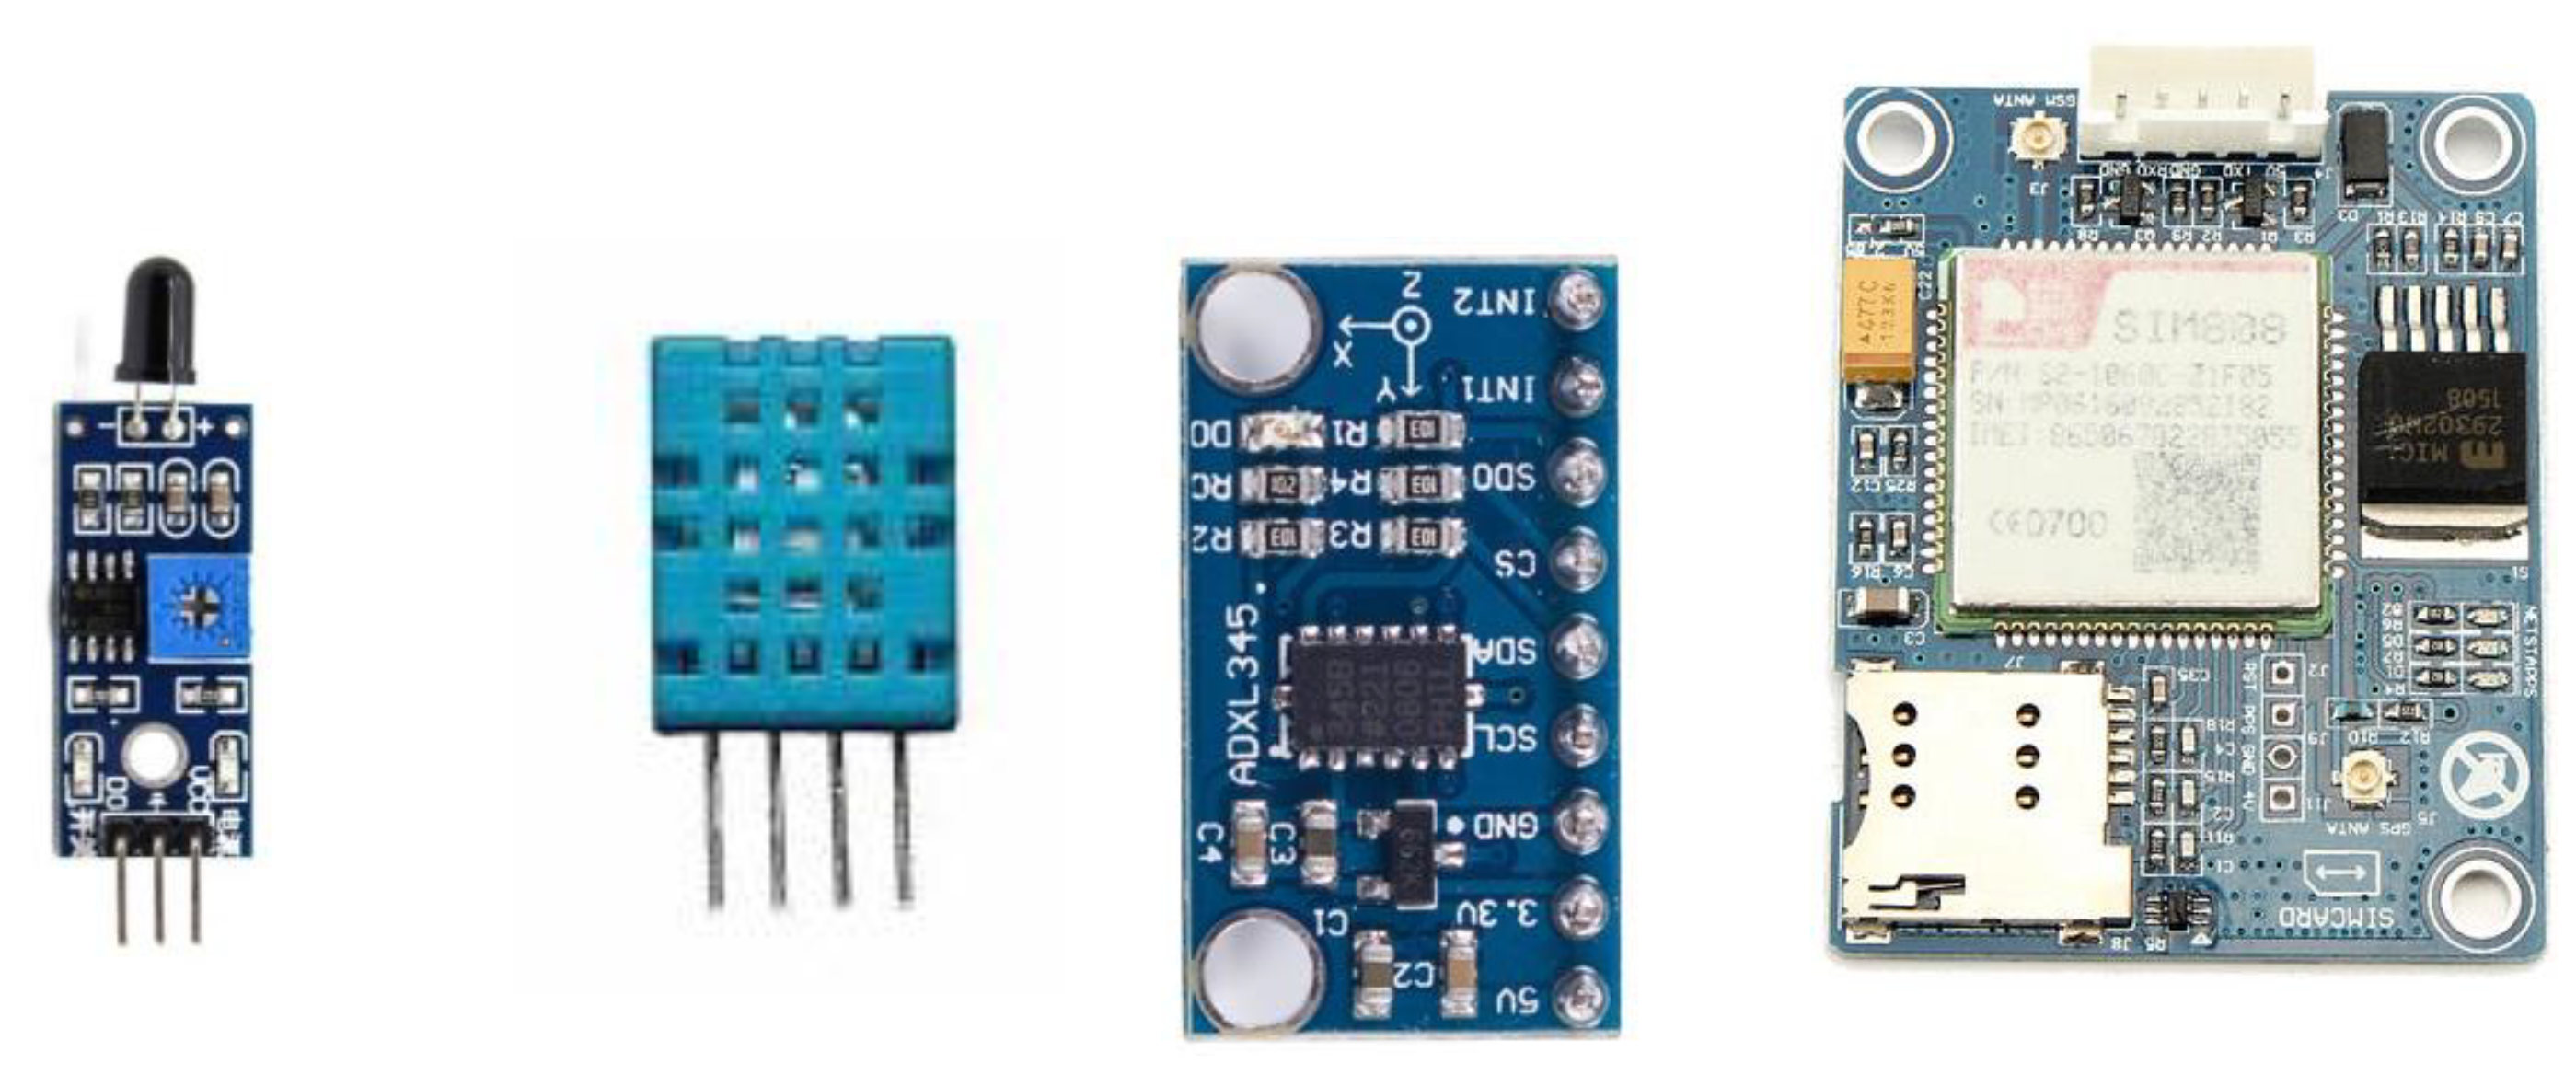
Each node is made up various hardware devices and consists five sensors; PGA (peak ground accelerator) sensor, fire detection sensor, temperature sensor, humidity sensor GPS sensors to monitor real data. (
Figure 4)
5.2. Actuator Sensors
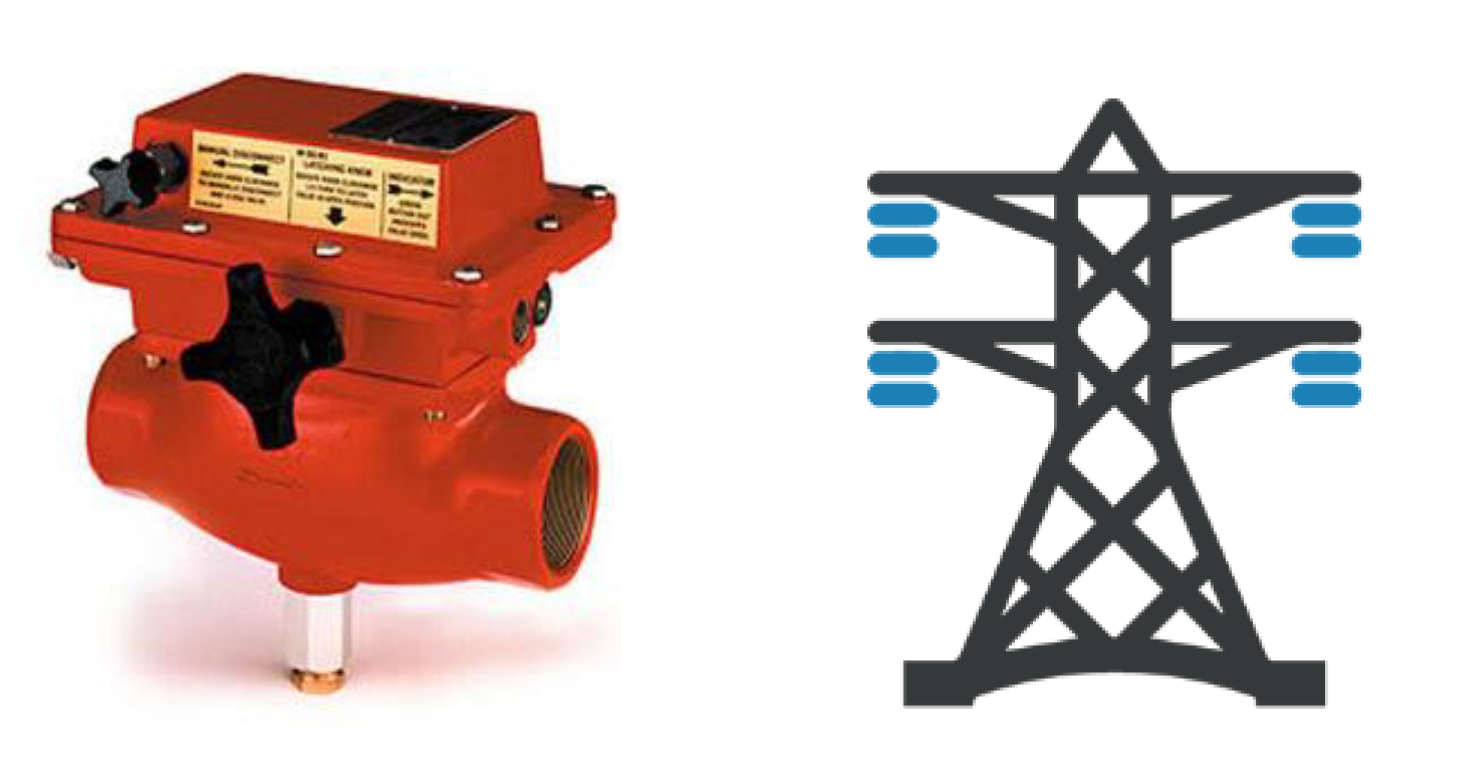
Actuator sensors should be settled upon the gas distribution and electrical substations. Then the server sends the signal to the actuator sensor to disconnect or connect the area controlling by each sensor.(
Figure 5)
The expert monitor the site after the earthquake and restore the area, where has not been serious damage.
5.3. Receiver Sensor Position:
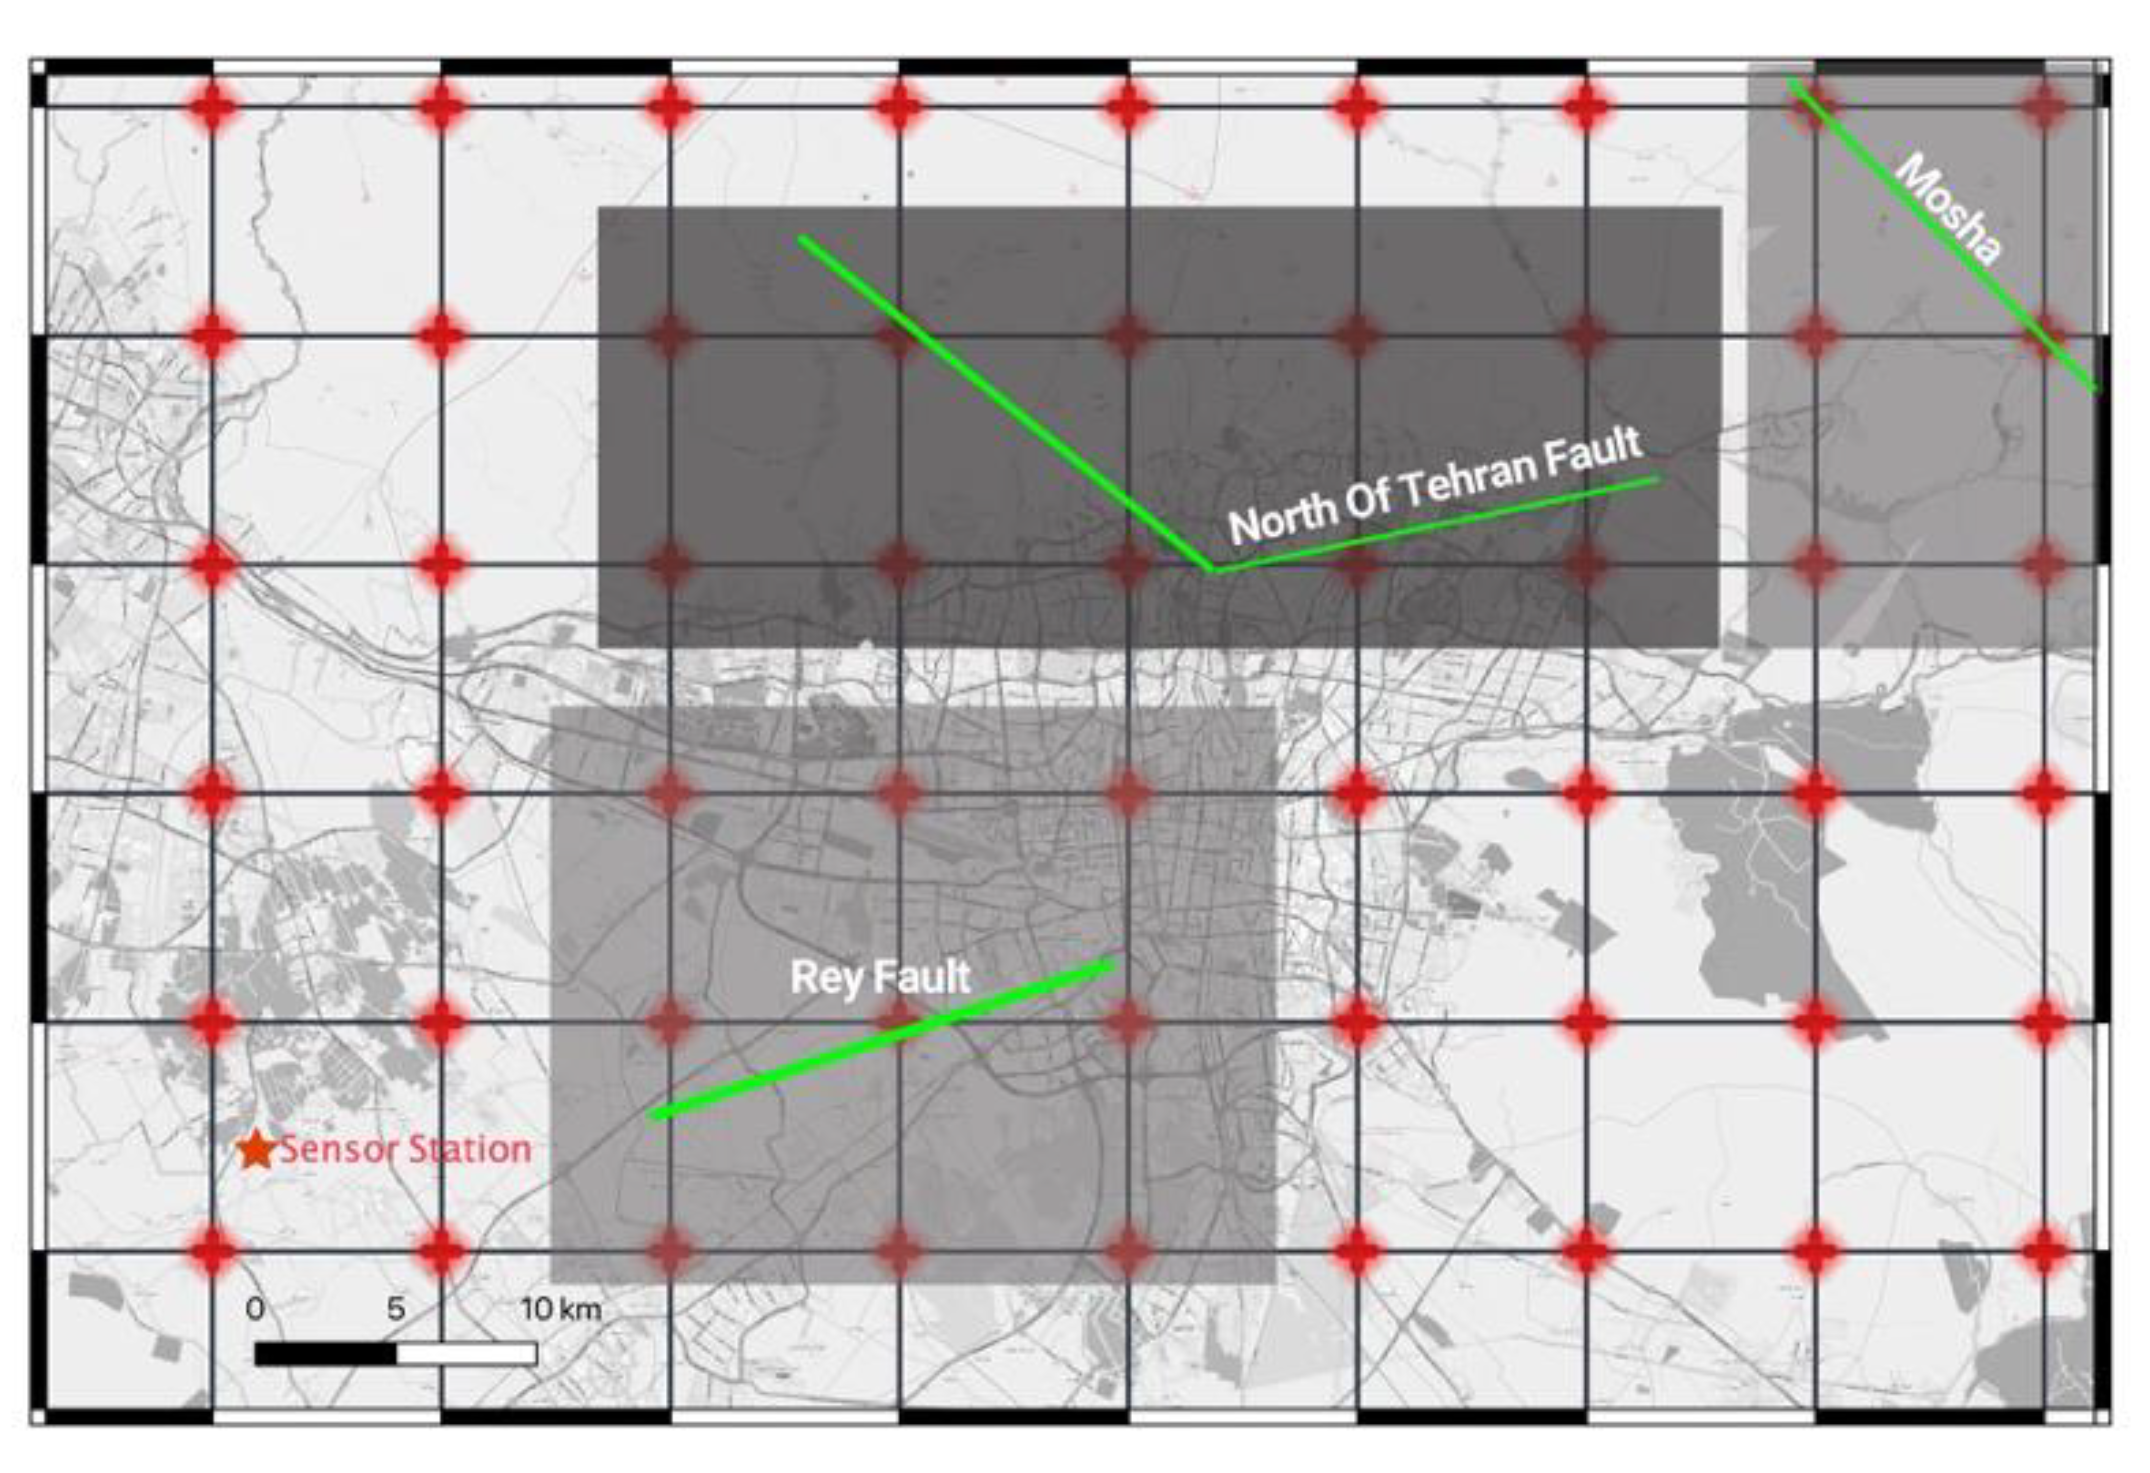
To create an effective monitoring sensor network, it is necessary to install an adequate number of sensors and distribute sensors in the territory who need to be monitored. According to [
42] the sensors should be within 10 kilometers from each other to detect earthquake (
Figure 6). Our network conversant area of 1350 Km2 (30 km × 45 km) and uses 54 sensing nodes.
According to the Tehran Fault Scenario, the sensors defined in these areas (see
Figure 6) transmit data corresponding to each fault to the server. Such adjacent sensors that are not within the range of scenario faults operate according to the unknown fault scenario.
5.4. Validating input date
The system is equipped with a self-validation device to check sensor value to decrease the number of errors in the system and prevent from a huge and inefficient data. When the PGA value is more than the defined value(0.1 G) in the system, the data is transmitted to server and sensor will be connected to cloud server directly for 5 minutes every 2 seconds. The next is to check the data received at the same time from at least 2 nearest nodes. This double check reduces the fake alarm and improve accuracy in the system.
6. Information Transmission
Transmission layers are a fusion of various networks. It securely transfers the information obtained from the perceptual layer to the application layer or vice versa.
IoT transmission has developed fast and created different ways to communicate between things to things or things to a human. We compare the best framework in transmission in
Table 1, then choose a better transitions framework for the research concept.
The research is designed to access a secure, low power, stable and cost-effective technology. Narrowband-IoT(NB-IoT) technology is the best way for this project. Considering the broader concept of Internet of things, early warning system may be regarded as a critical and key element of the concept in smart cities; so early warning systems do not require to be linked to a separate communication system, which will reduce the cost of maintenance.
7. Information Processing and Execute Command by Using Fuzzy Logic
Due to the severe damages caused by previous earthquakes, collision of gas and electricity network, or gas leakage leaded to the secondary explosions and damages. This study aims to reduce this type of damage by using the defined fuzzy system.
To detect damages of the gas and electrics network, fuzzy logic methods were used with inclusion of four criteria, of gas pipeline, gas compressor, Distribution Circuits, Electric boost station as shown in
Figure 7.
7.1. Input Criteria
The values received from the sensors are transformed into fuzzy sets like ’Low probability risk failures’, ’Medium probability risk failures’, ’High probability risk failures’, based on Hazus methodology[
46] (
Table 2)
7.1.1. Gas Network
HAZUS methodology is divided in two vulnerable sections of the gas network. Section one is about the compressor station and section two is about gas pipeline. Both of these components are seismically vulnerable. It is worth mentioning that their probable failure can cause fire disasters. So that, this part discusses stages based on these boundaries.[
46].
The fuzzy scenarios defined are appropriate to the conditions of the gas and electricity facilities in Tehran. Compressor stations are regarded to be an Anchored of Compressor Stations.
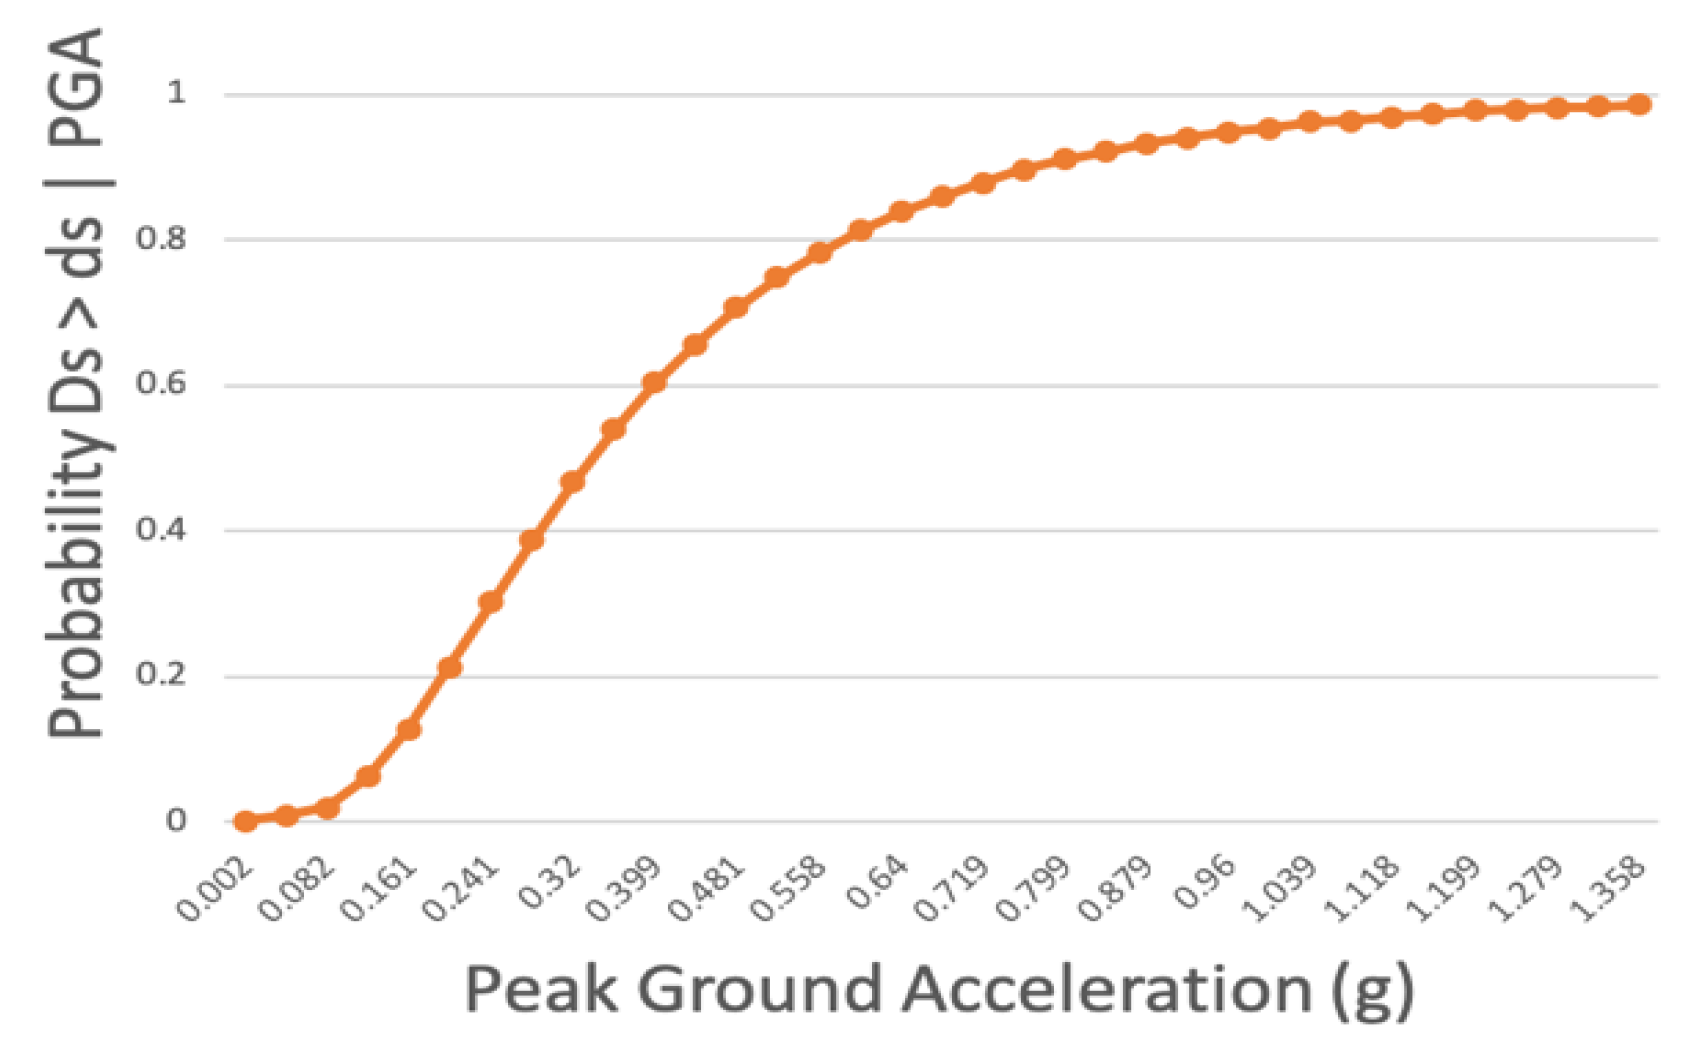
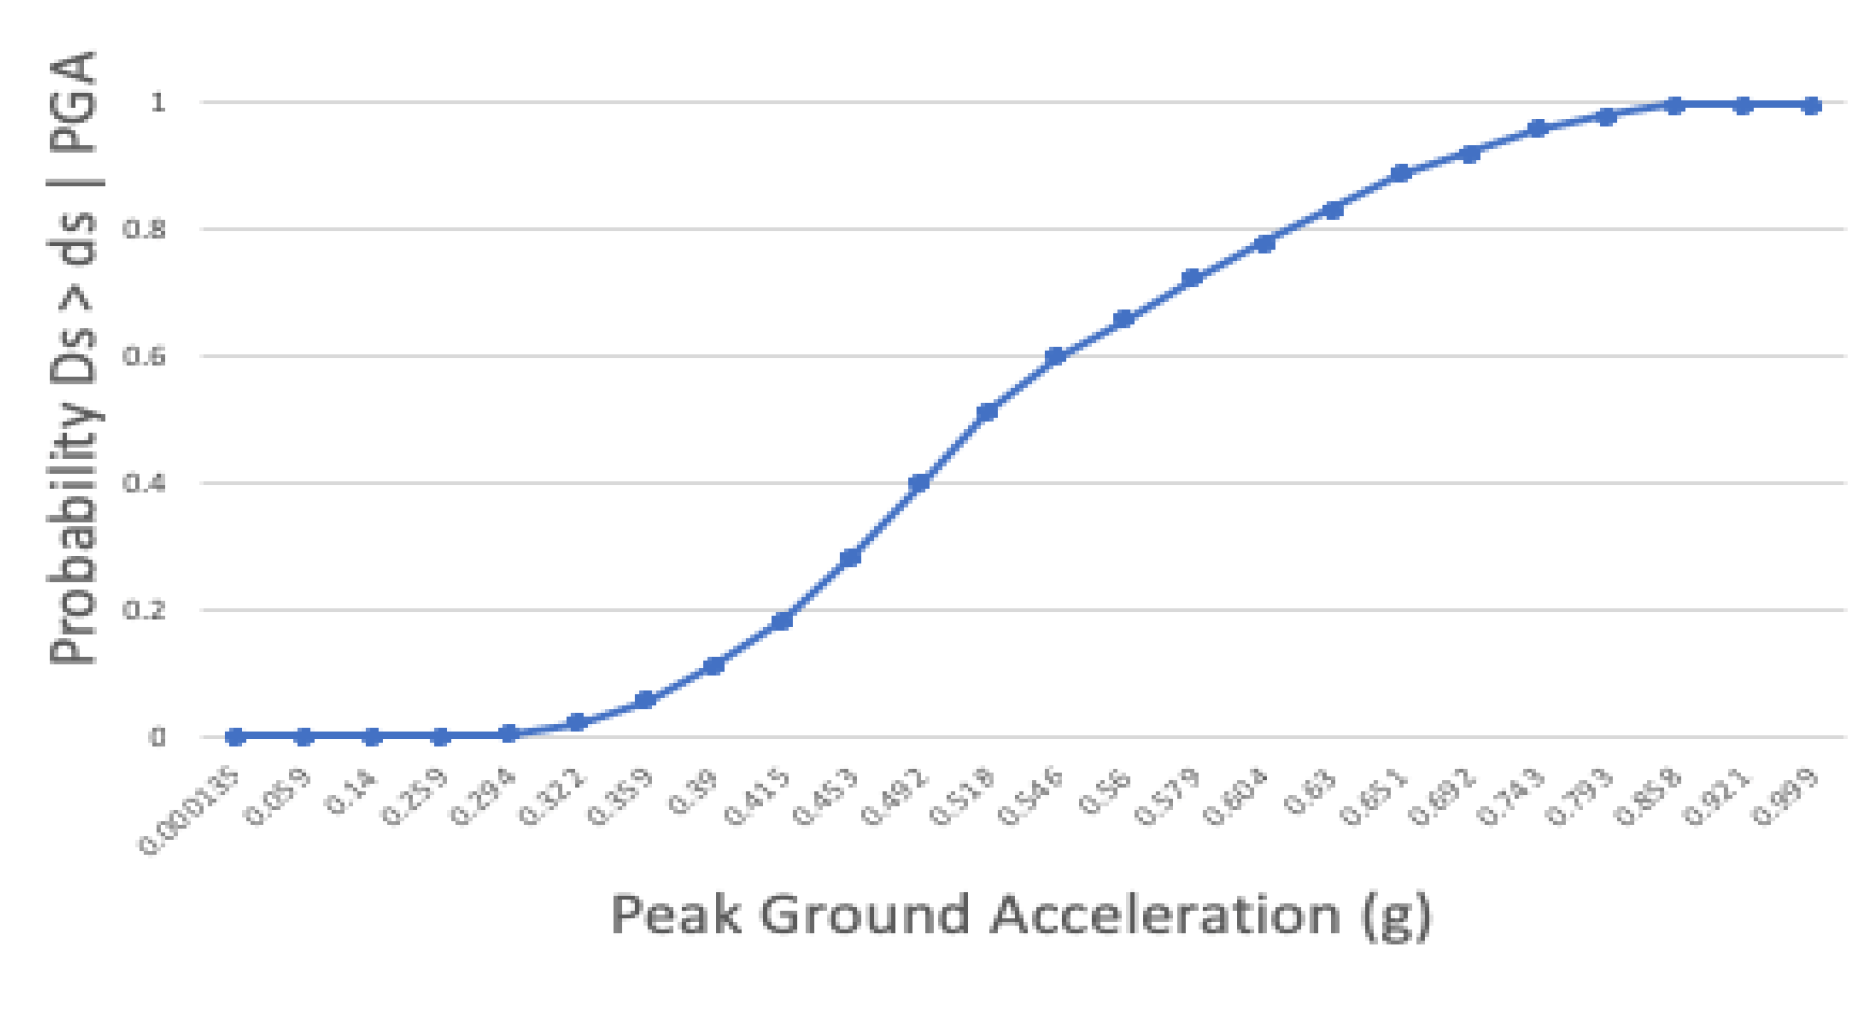
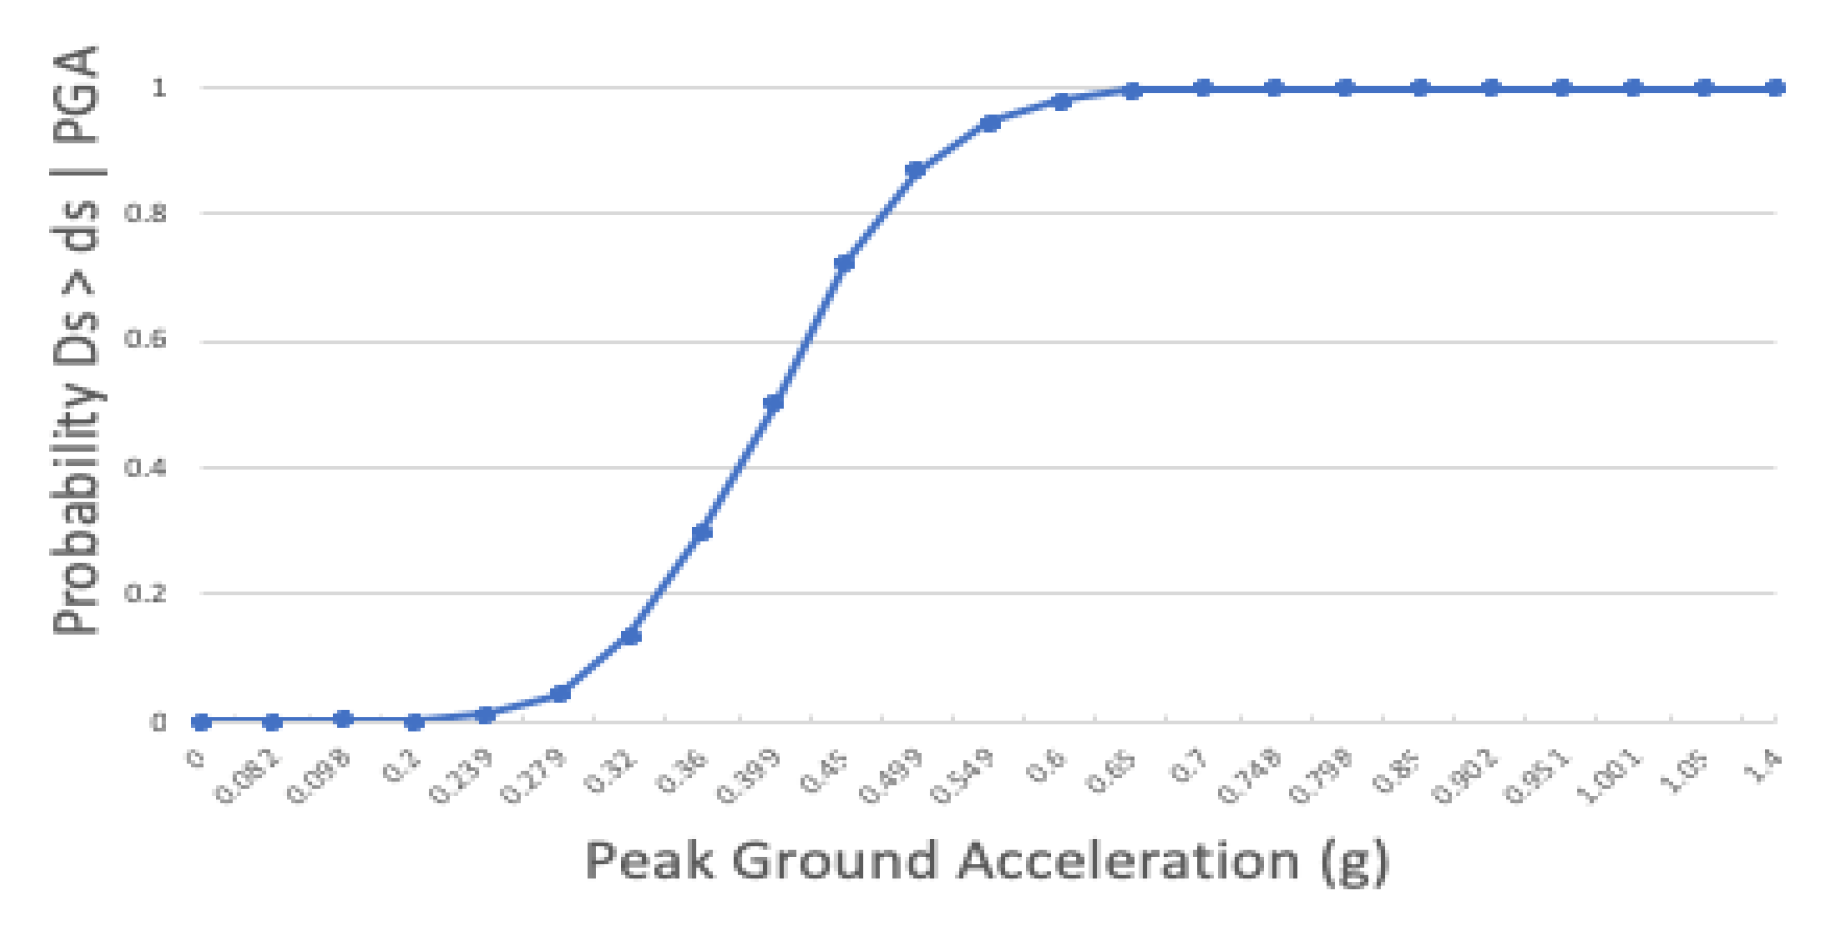
The damage States Definition in
Figure 8 is based on the HAZUS methodology for Compressor Stations; and since HAZUS has not determined an accurate level of failure for gas pipeline, the damage States Definitions for gas pipelines according to [
47] is displayed in
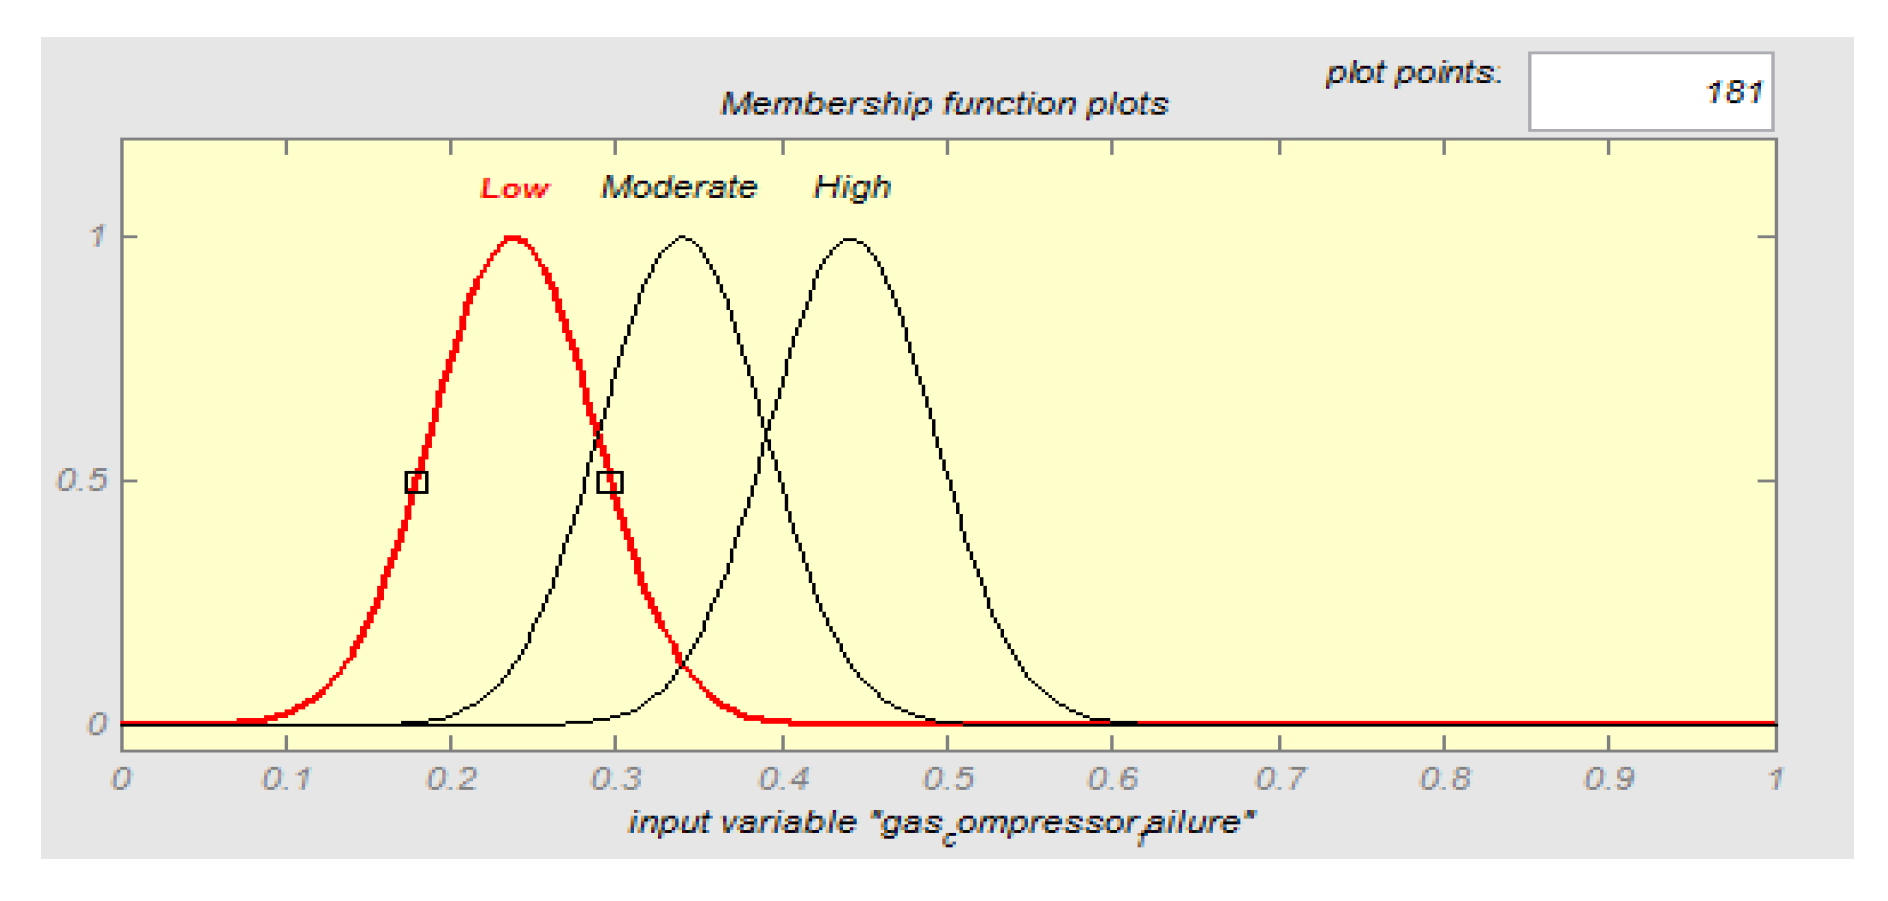
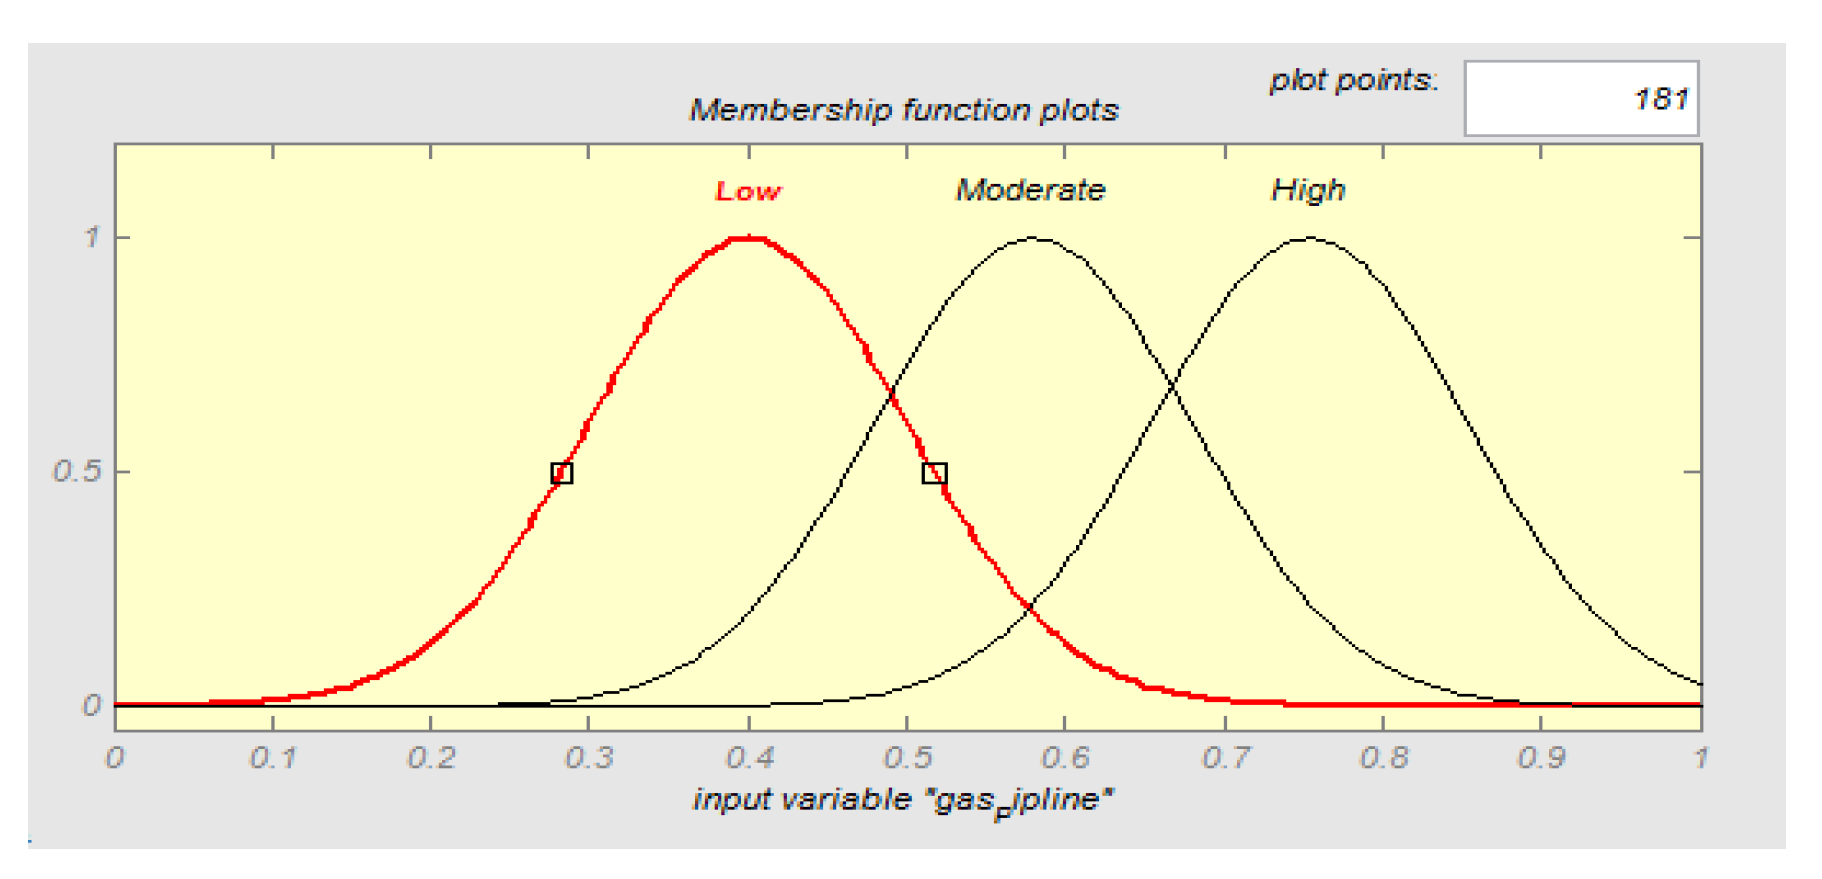
Figure 9.The membership function for Gas Compressor Stations and gas pipelines shown in
Figure 10 and
Figure 11.
7.1.2. Electrical Network
Electrical network vulnerability in HAZUS methodology is also divided in two:
Distribution Circuits
Electric boost station.
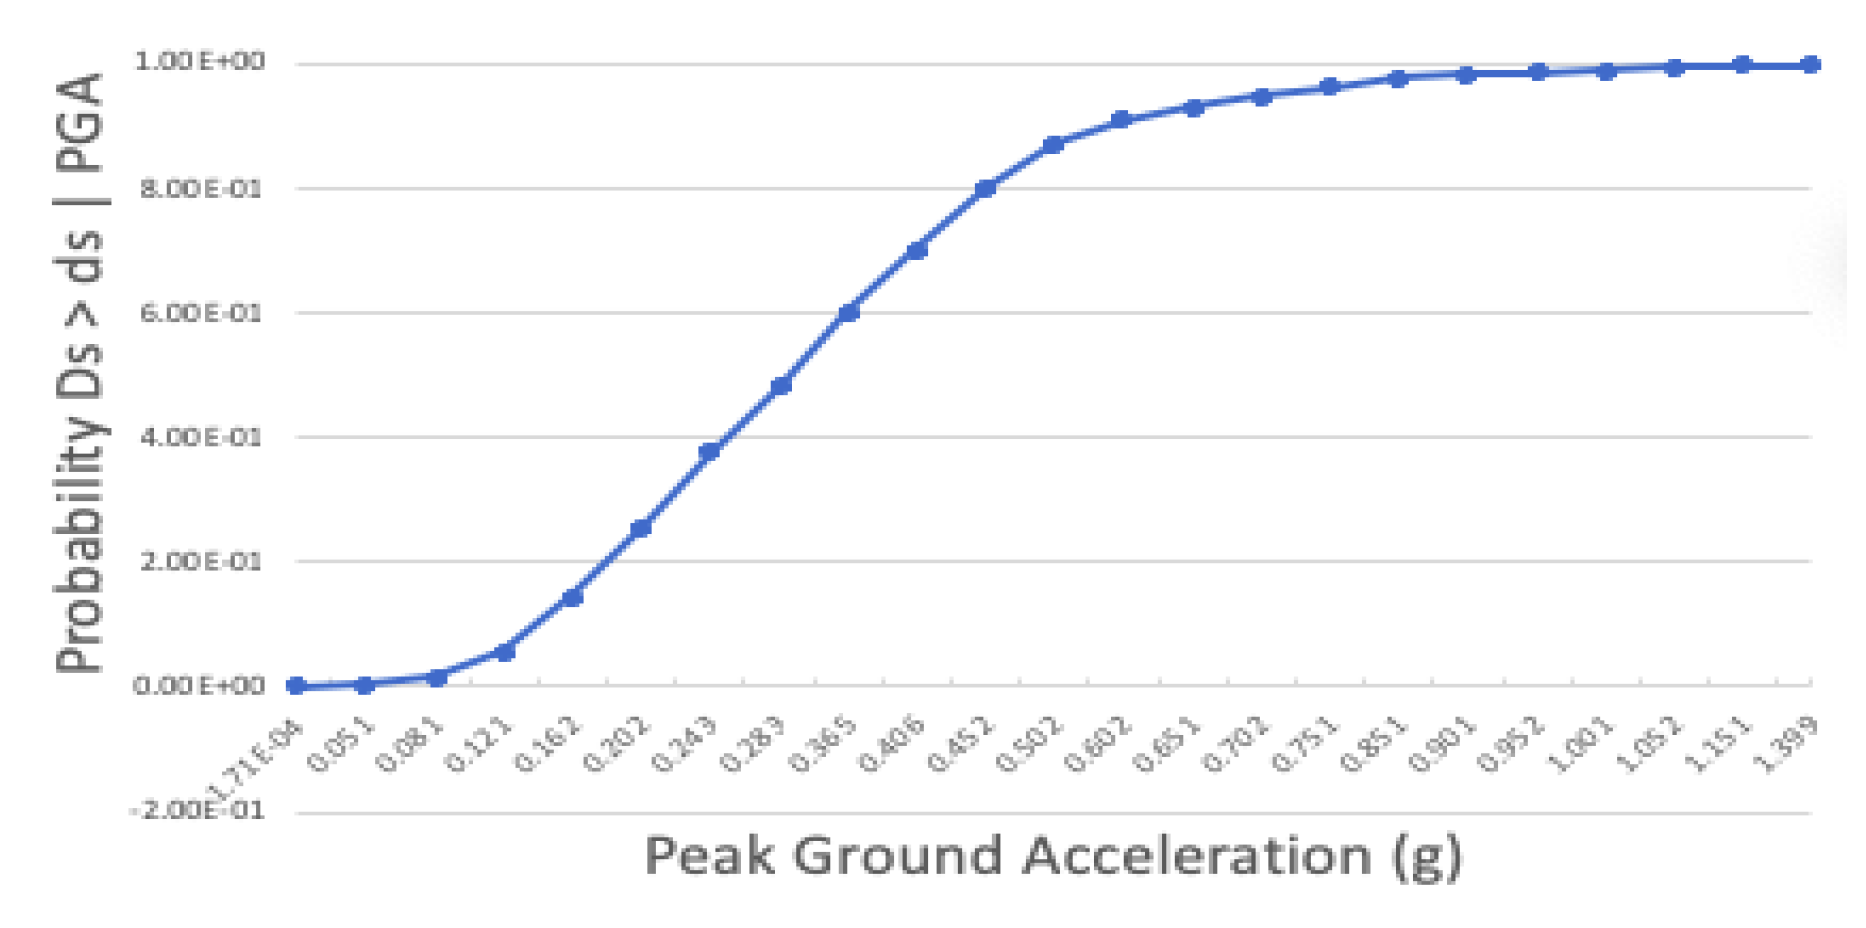
Damage state of Distribution Circuits (contain poles, wires, in-line equipment and utility-owned equipment at customer sites) and Low voltage Substations power (34 kV to 150 kV) shown in
Figure 12 and
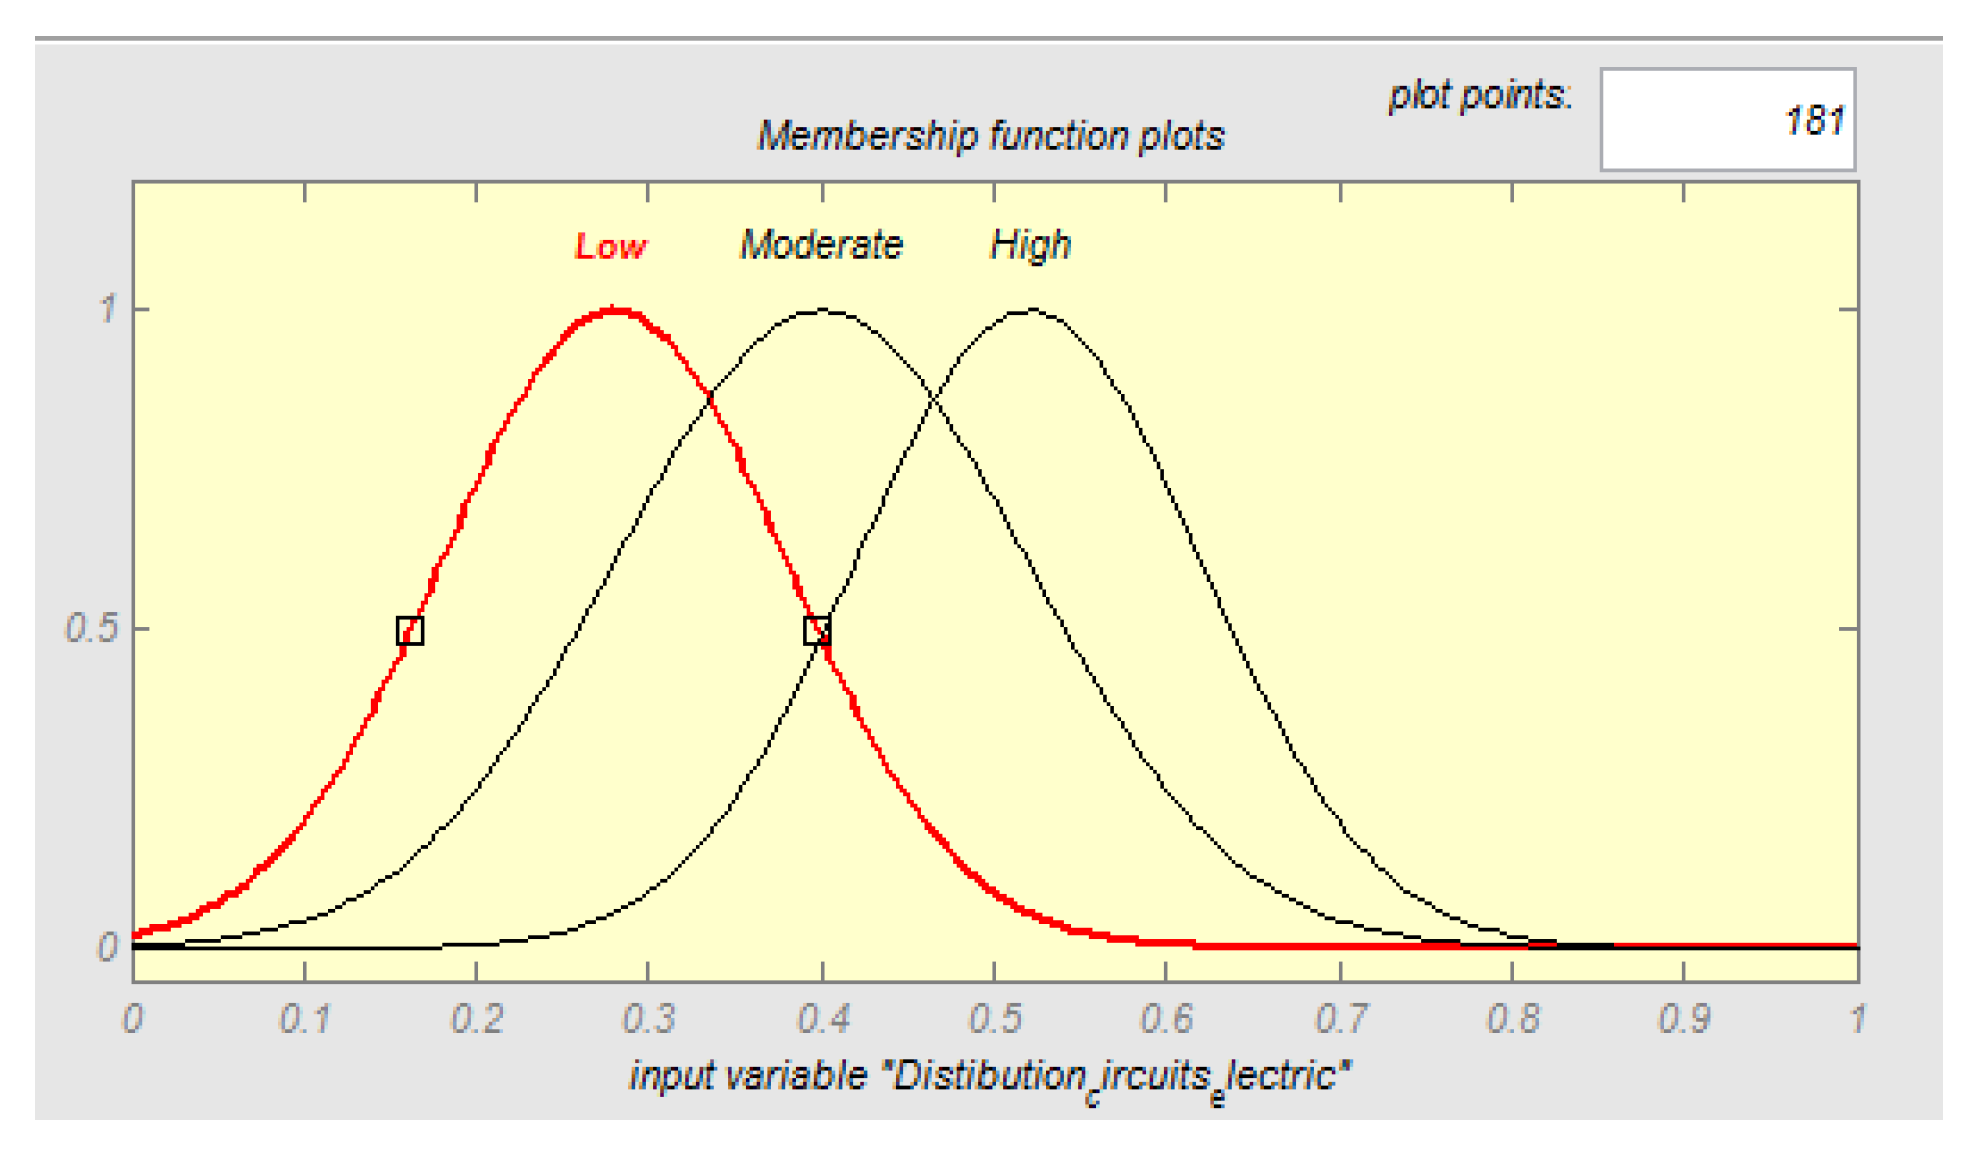
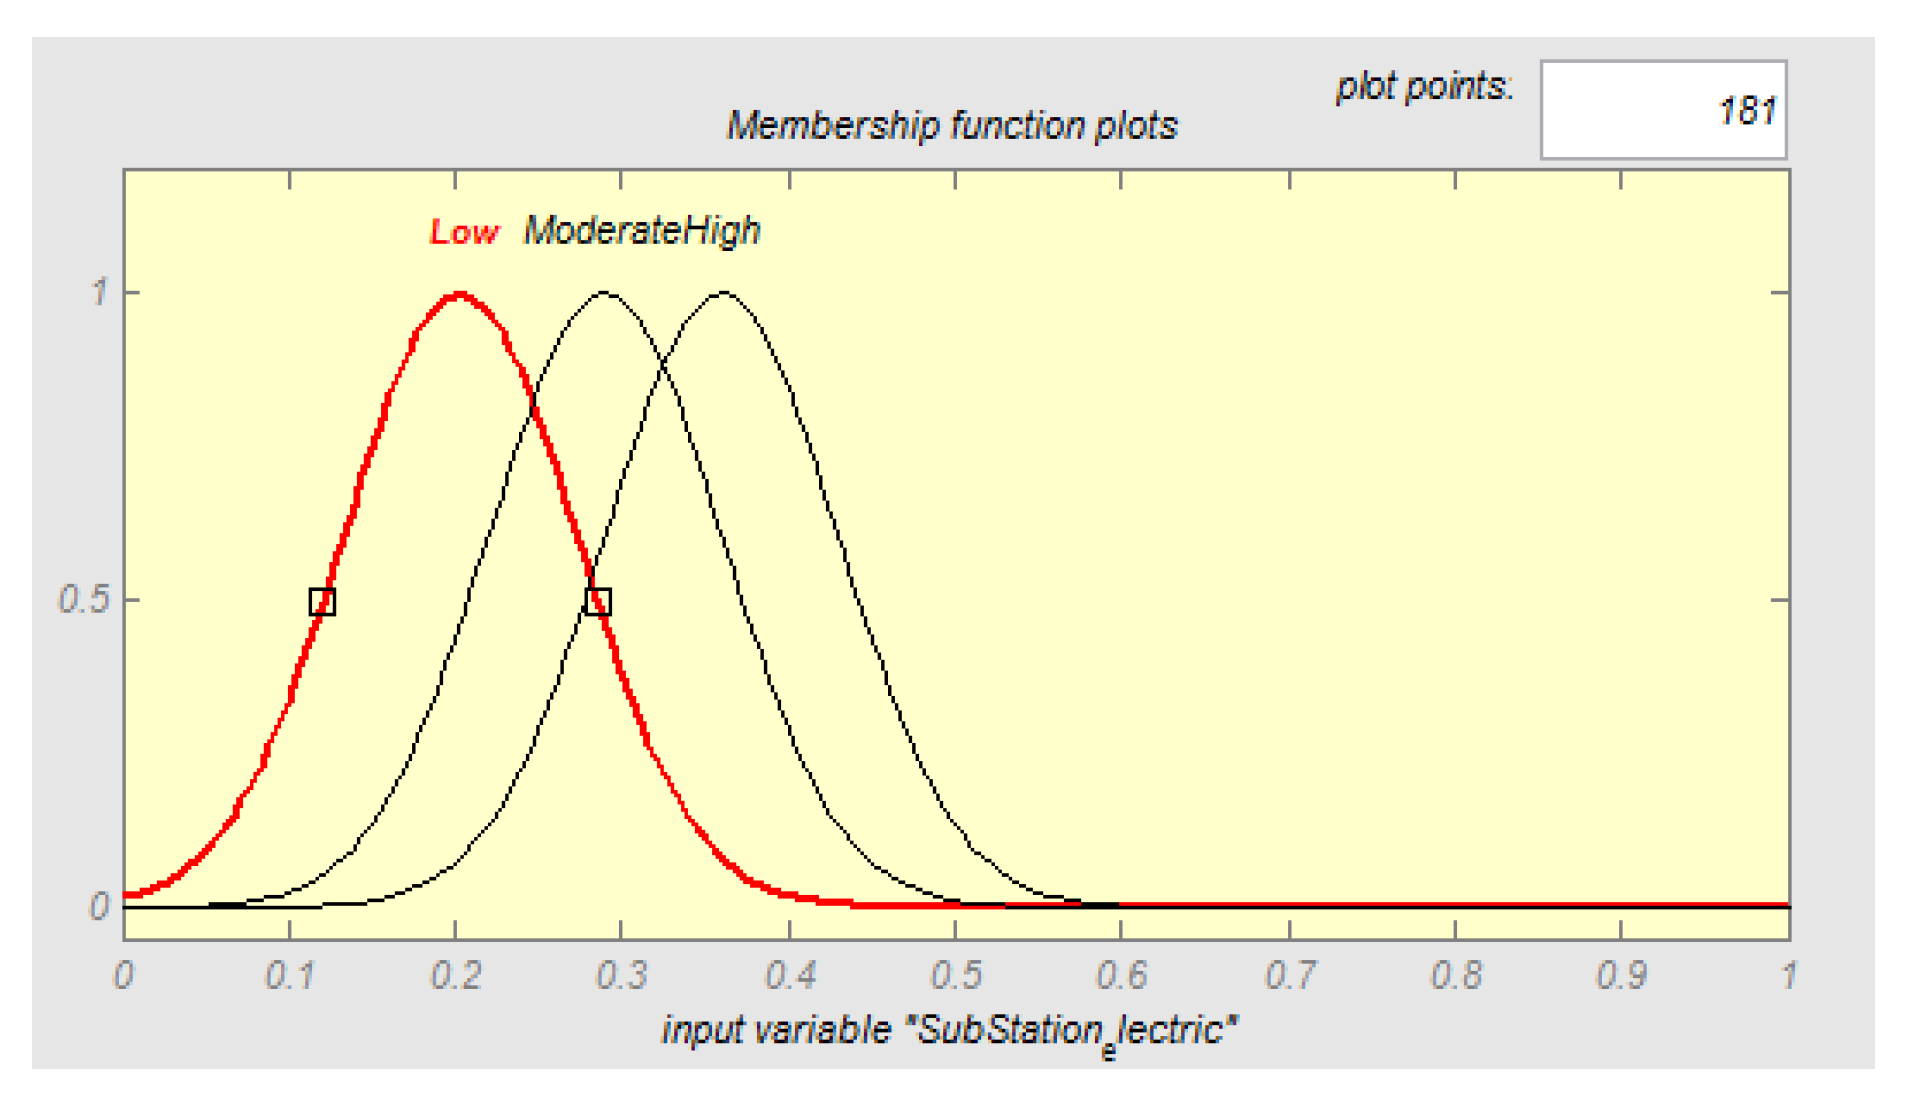
Figure 13.The membership function for Distribution circuits and Substations electric shown in
Figure 14 and
Figure 15.
Low voltage (34 kV to 150 kV) are regarded for substation power for Tehran city.
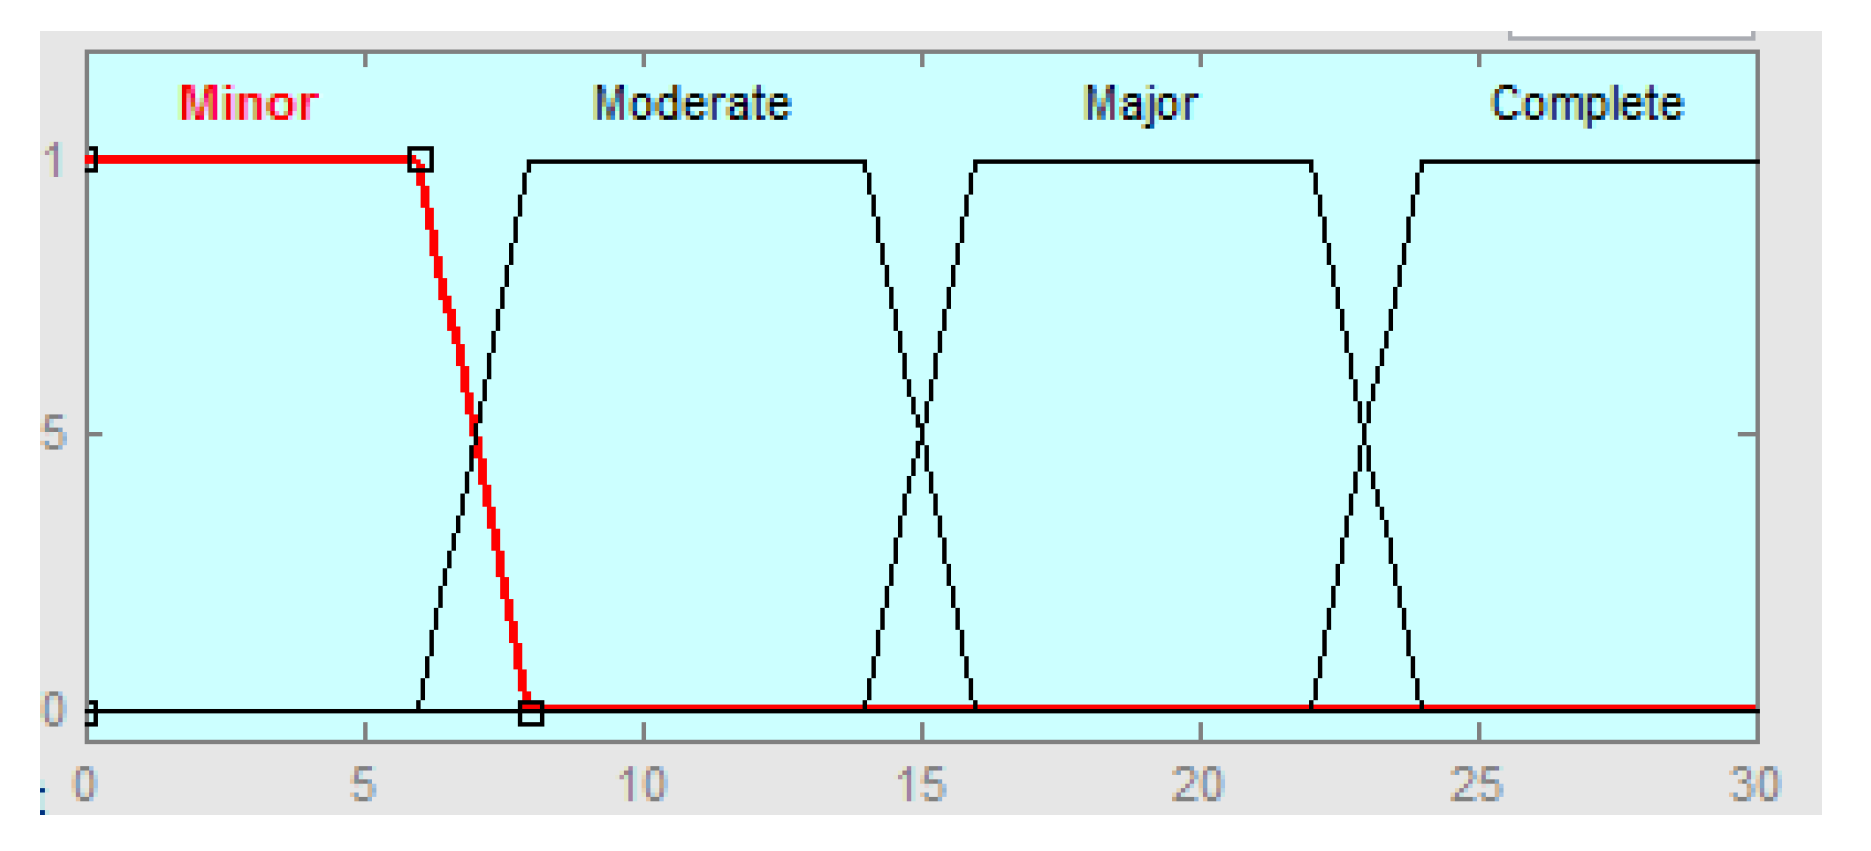
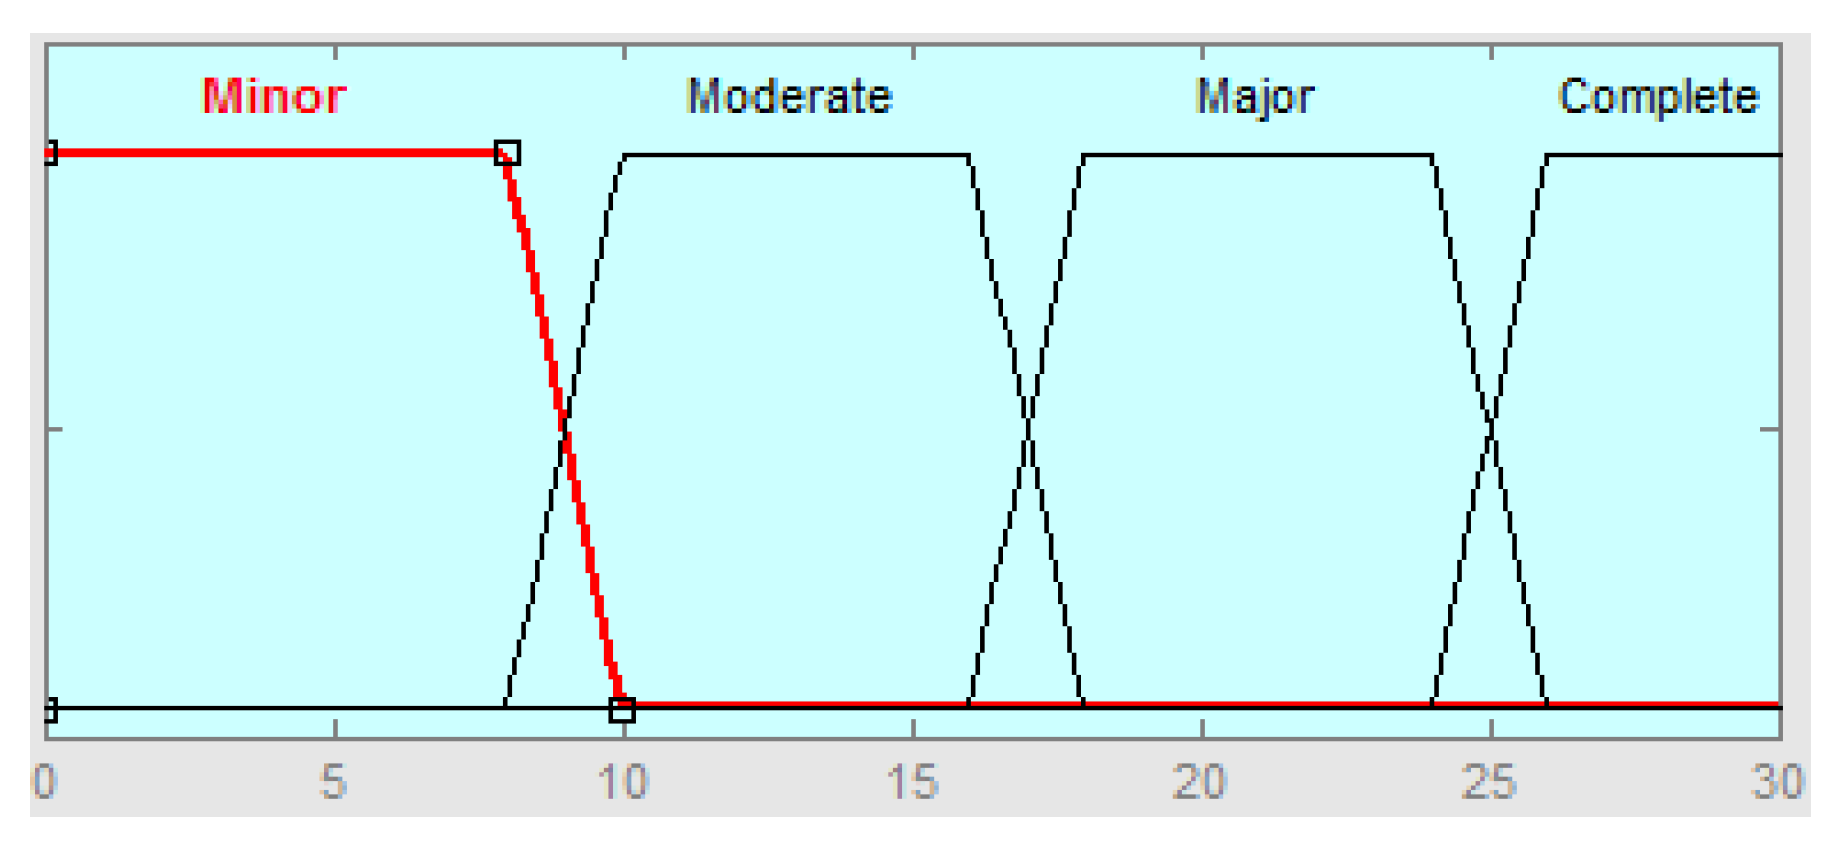
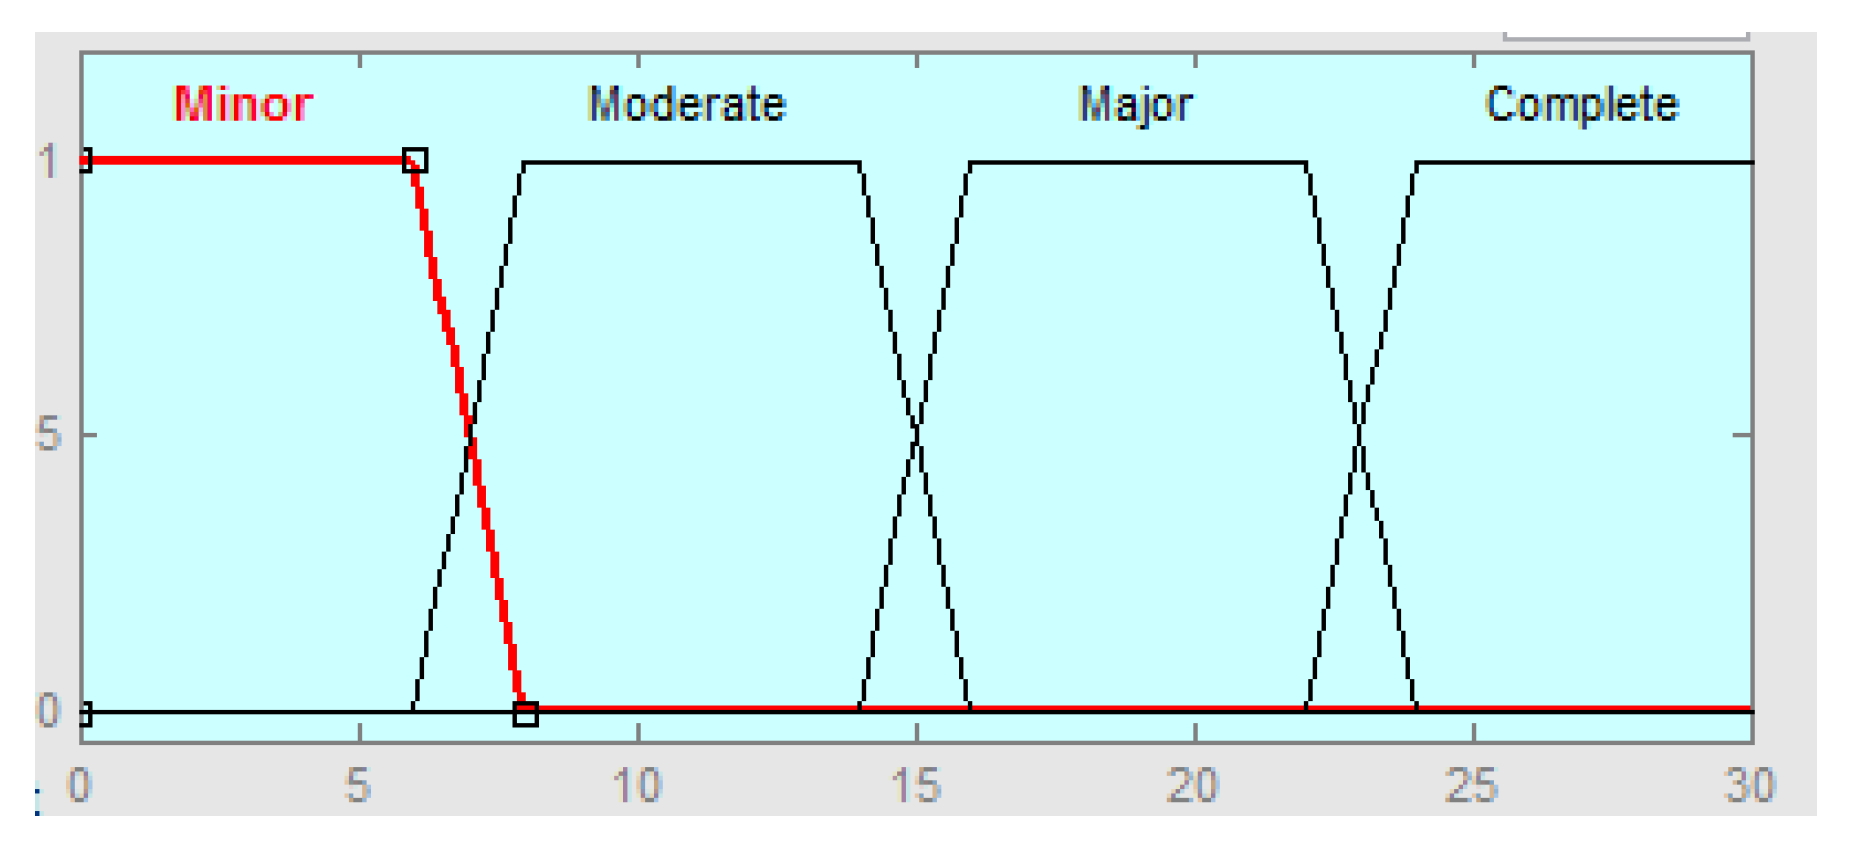
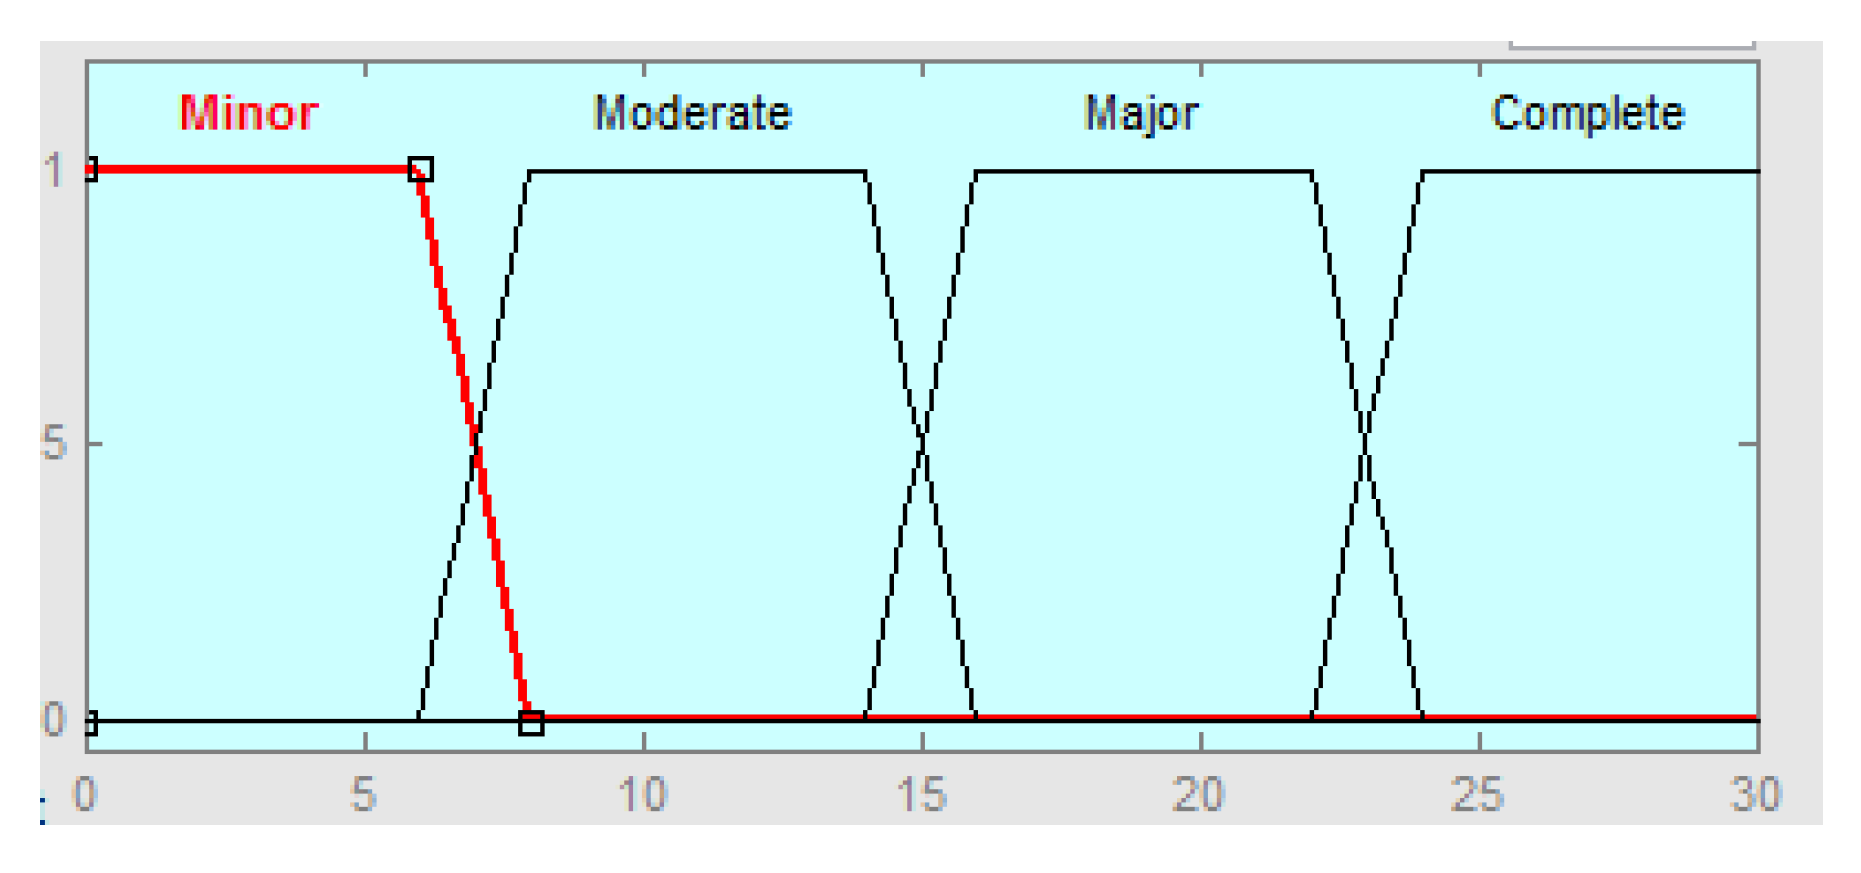
7.2. Output criteria
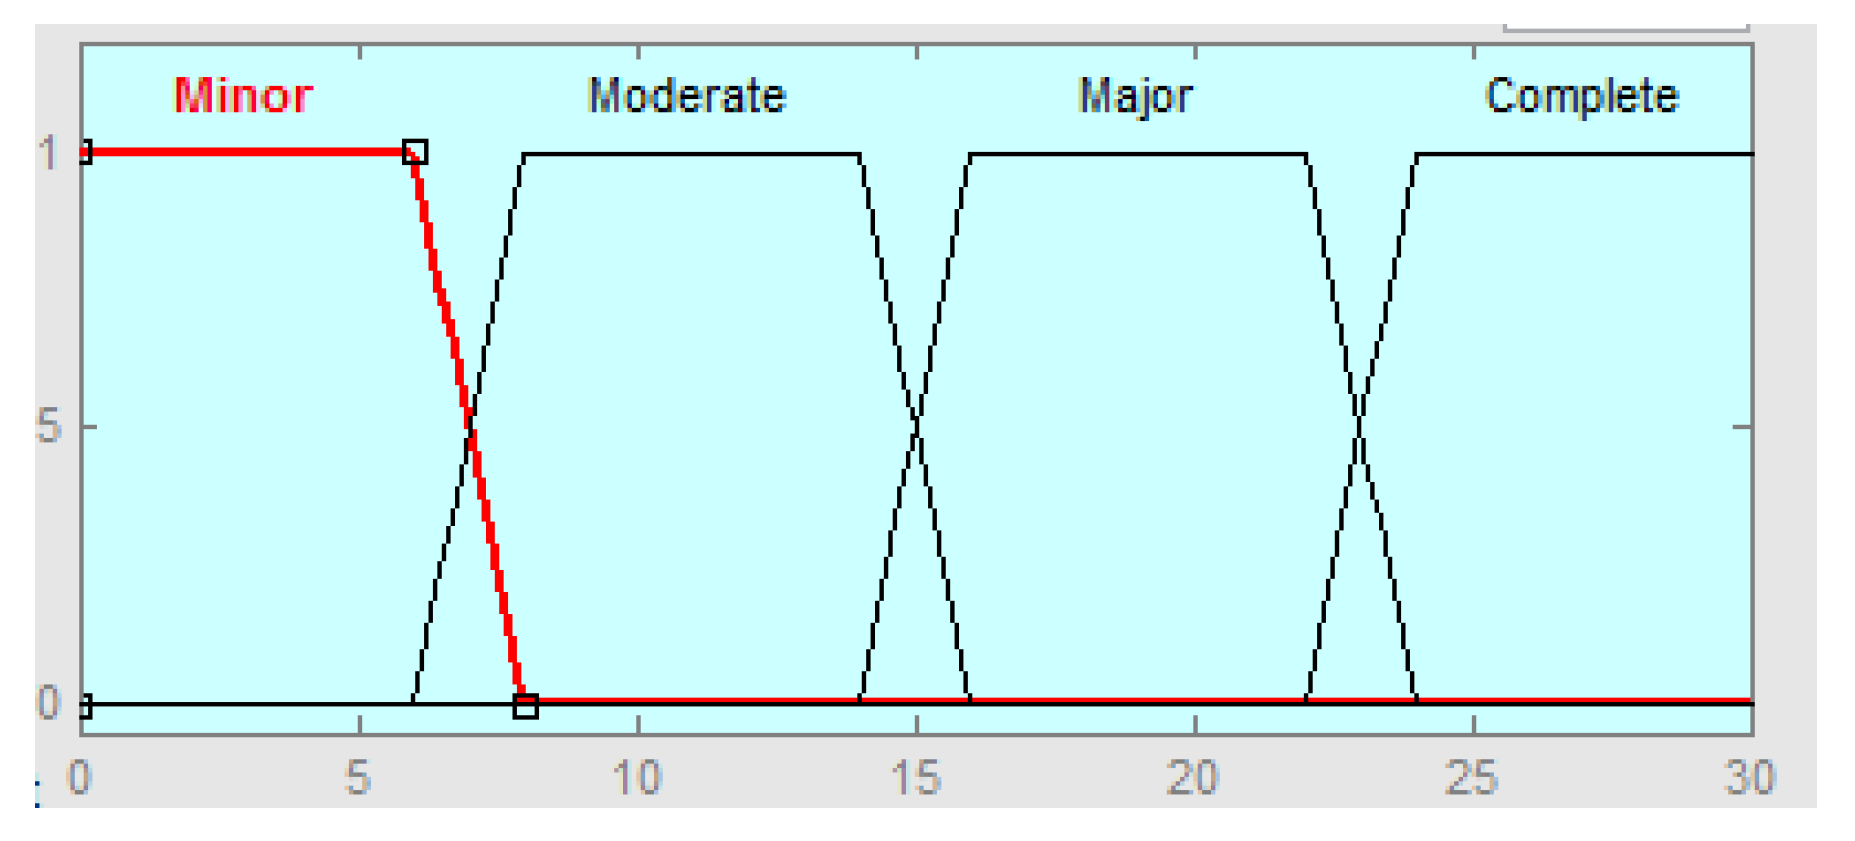
Table 3.
- Shot-down command Gas.
Table 3.
- Shot-down command Gas.
| Linguistic Variables |
Define |
range |
| R1 |
Minor area |
0-6 |
| R2 |
Moderate area |
8-14 |
| R3 |
Major area |
16-22 |
| R4 |
Complete area |
24-30 |
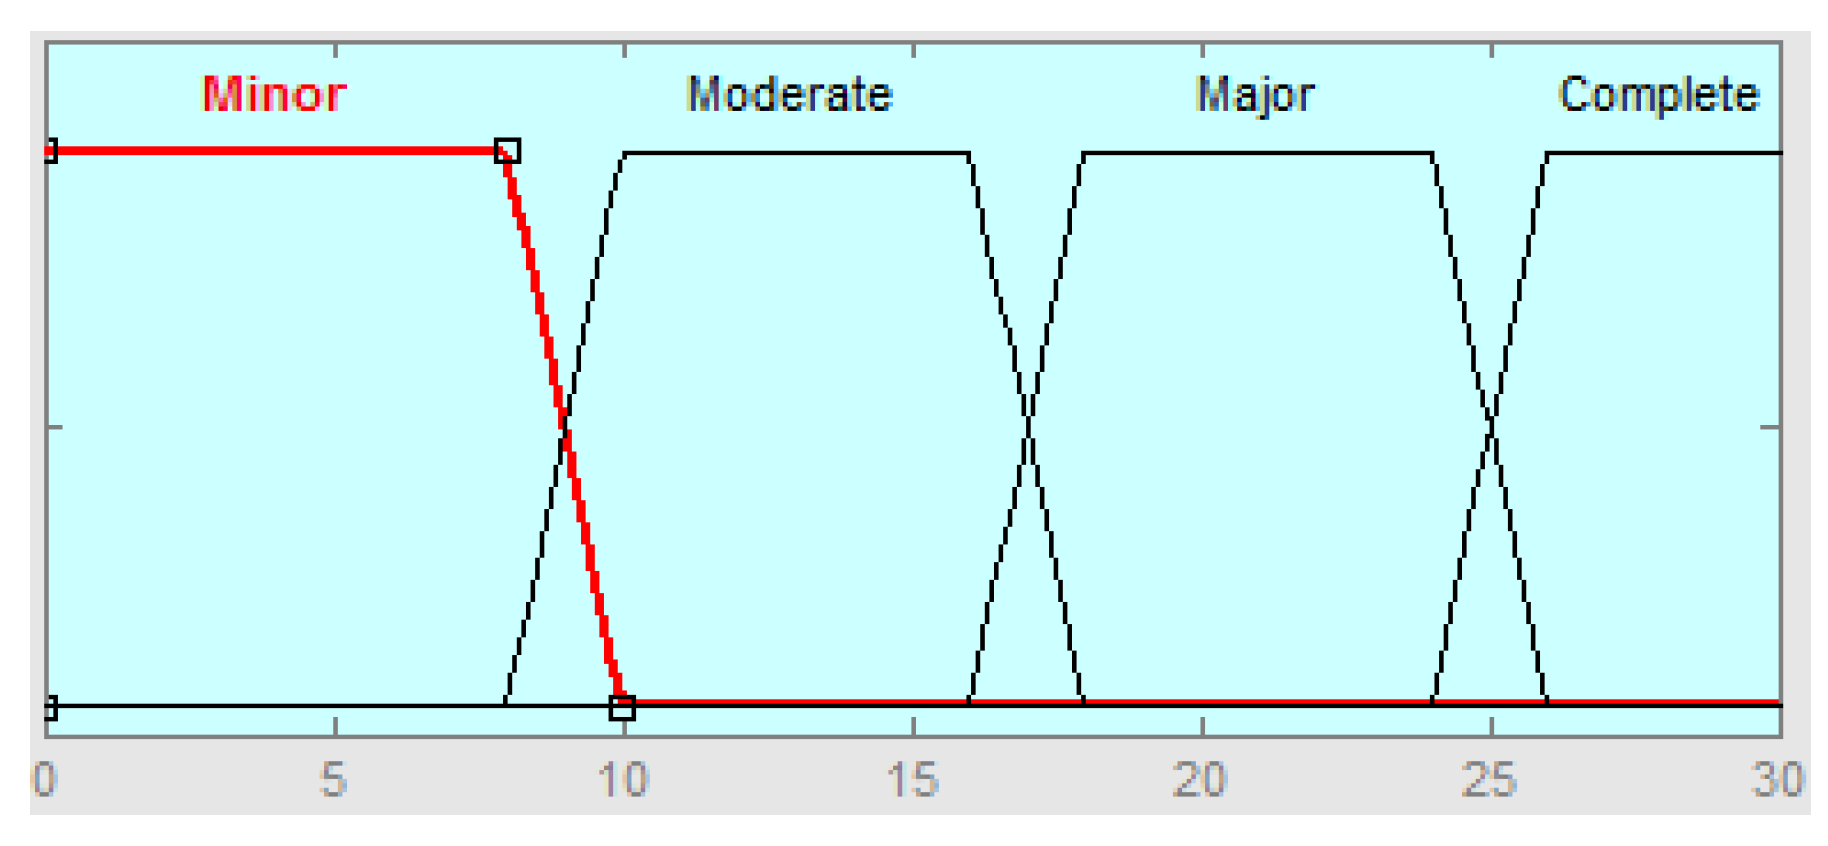
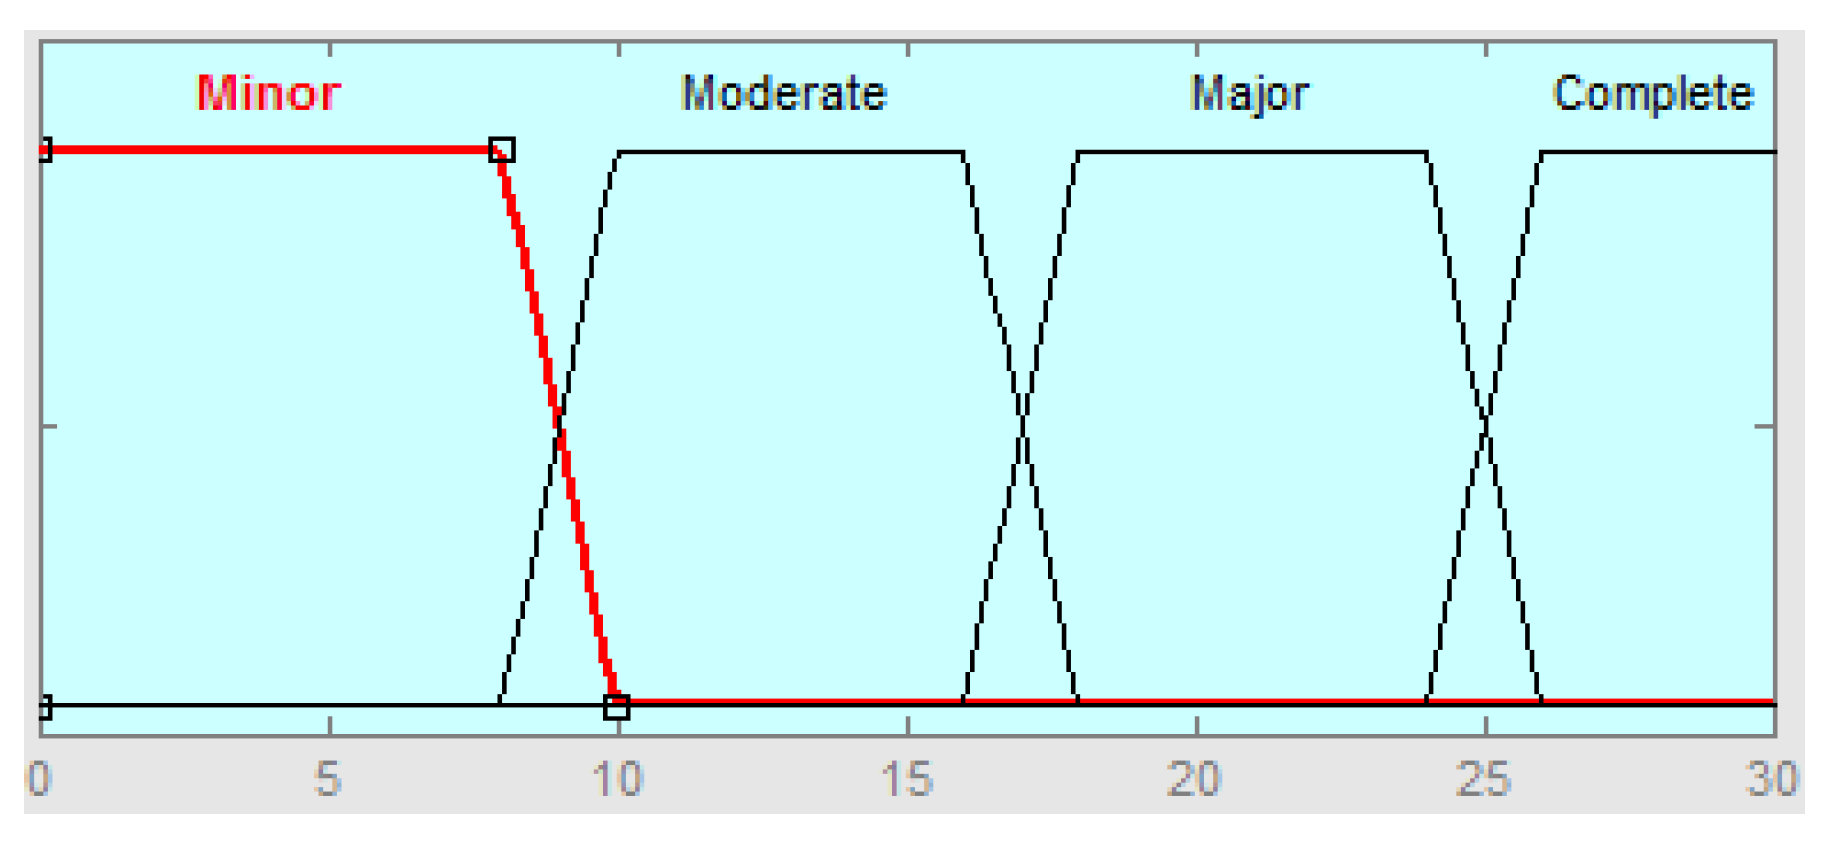
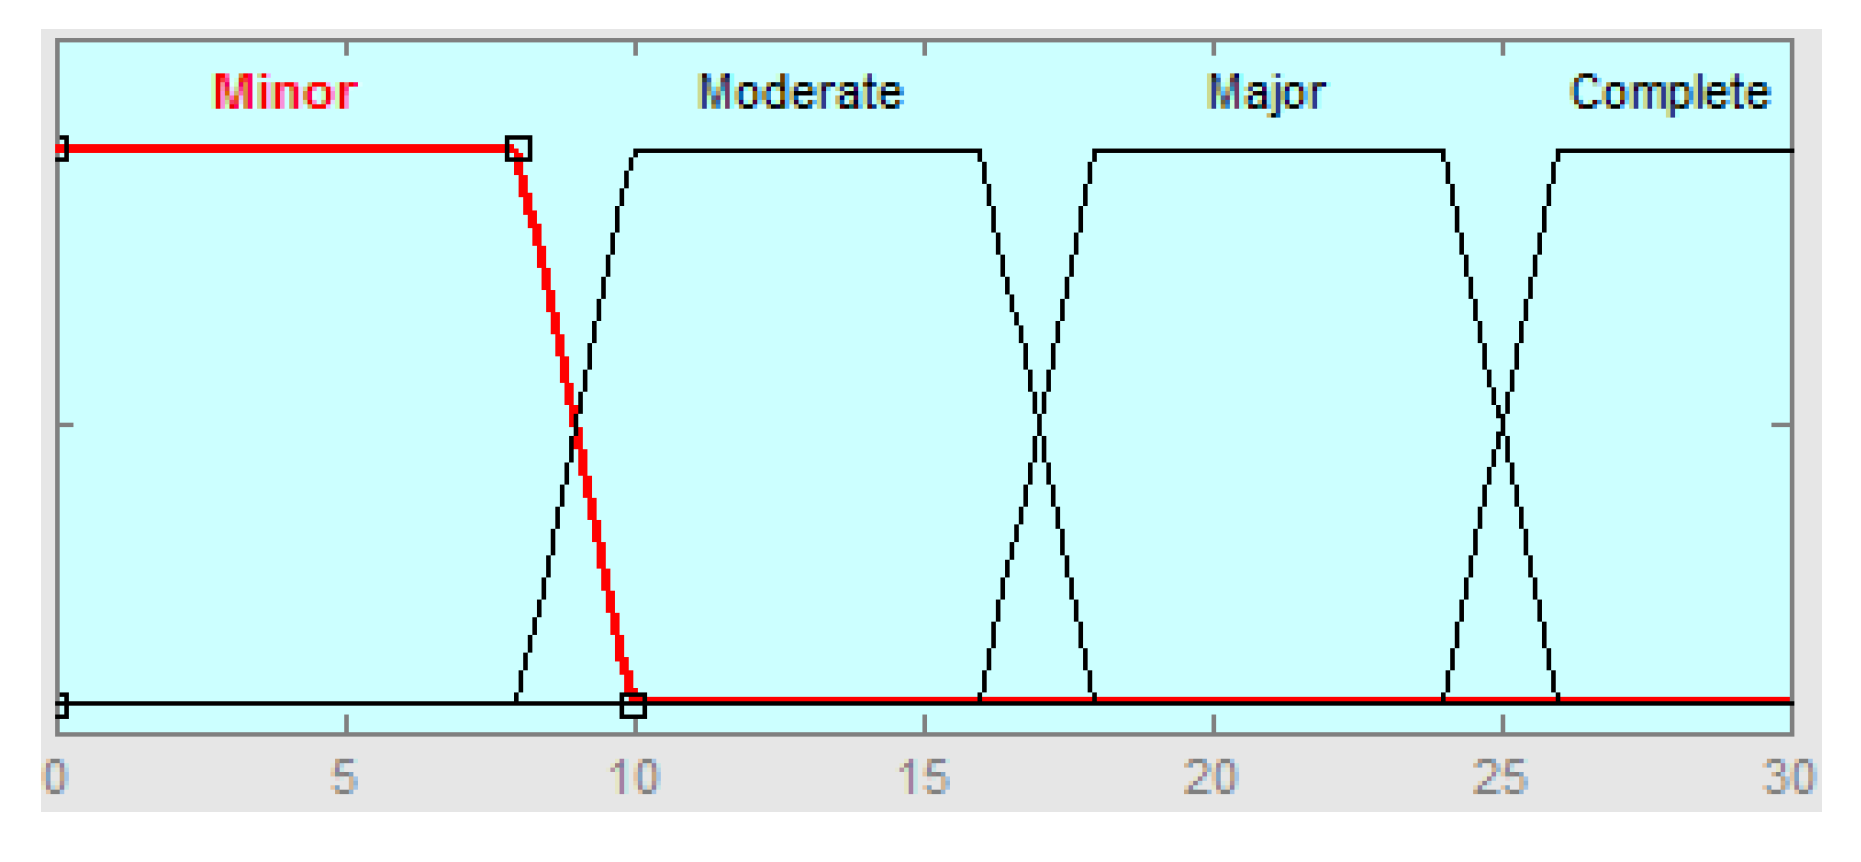
Table 4.
Shot-down command Electric.
Table 4.
Shot-down command Electric.
| Linguistic Variables |
Define |
range |
| R1 |
Minor area |
0-8 |
| R2 |
Moderate area |
10-16 |
| R3 |
Major area |
18-24 |
| R4 |
Complete area |
26-30 |
7.3. Case Study: Tehran City
In the Middle East, Tehran as Iran capital, is the second-largest metropolitan region with a population about 8.5 million[
48]. This city is a high seismic hazard area [
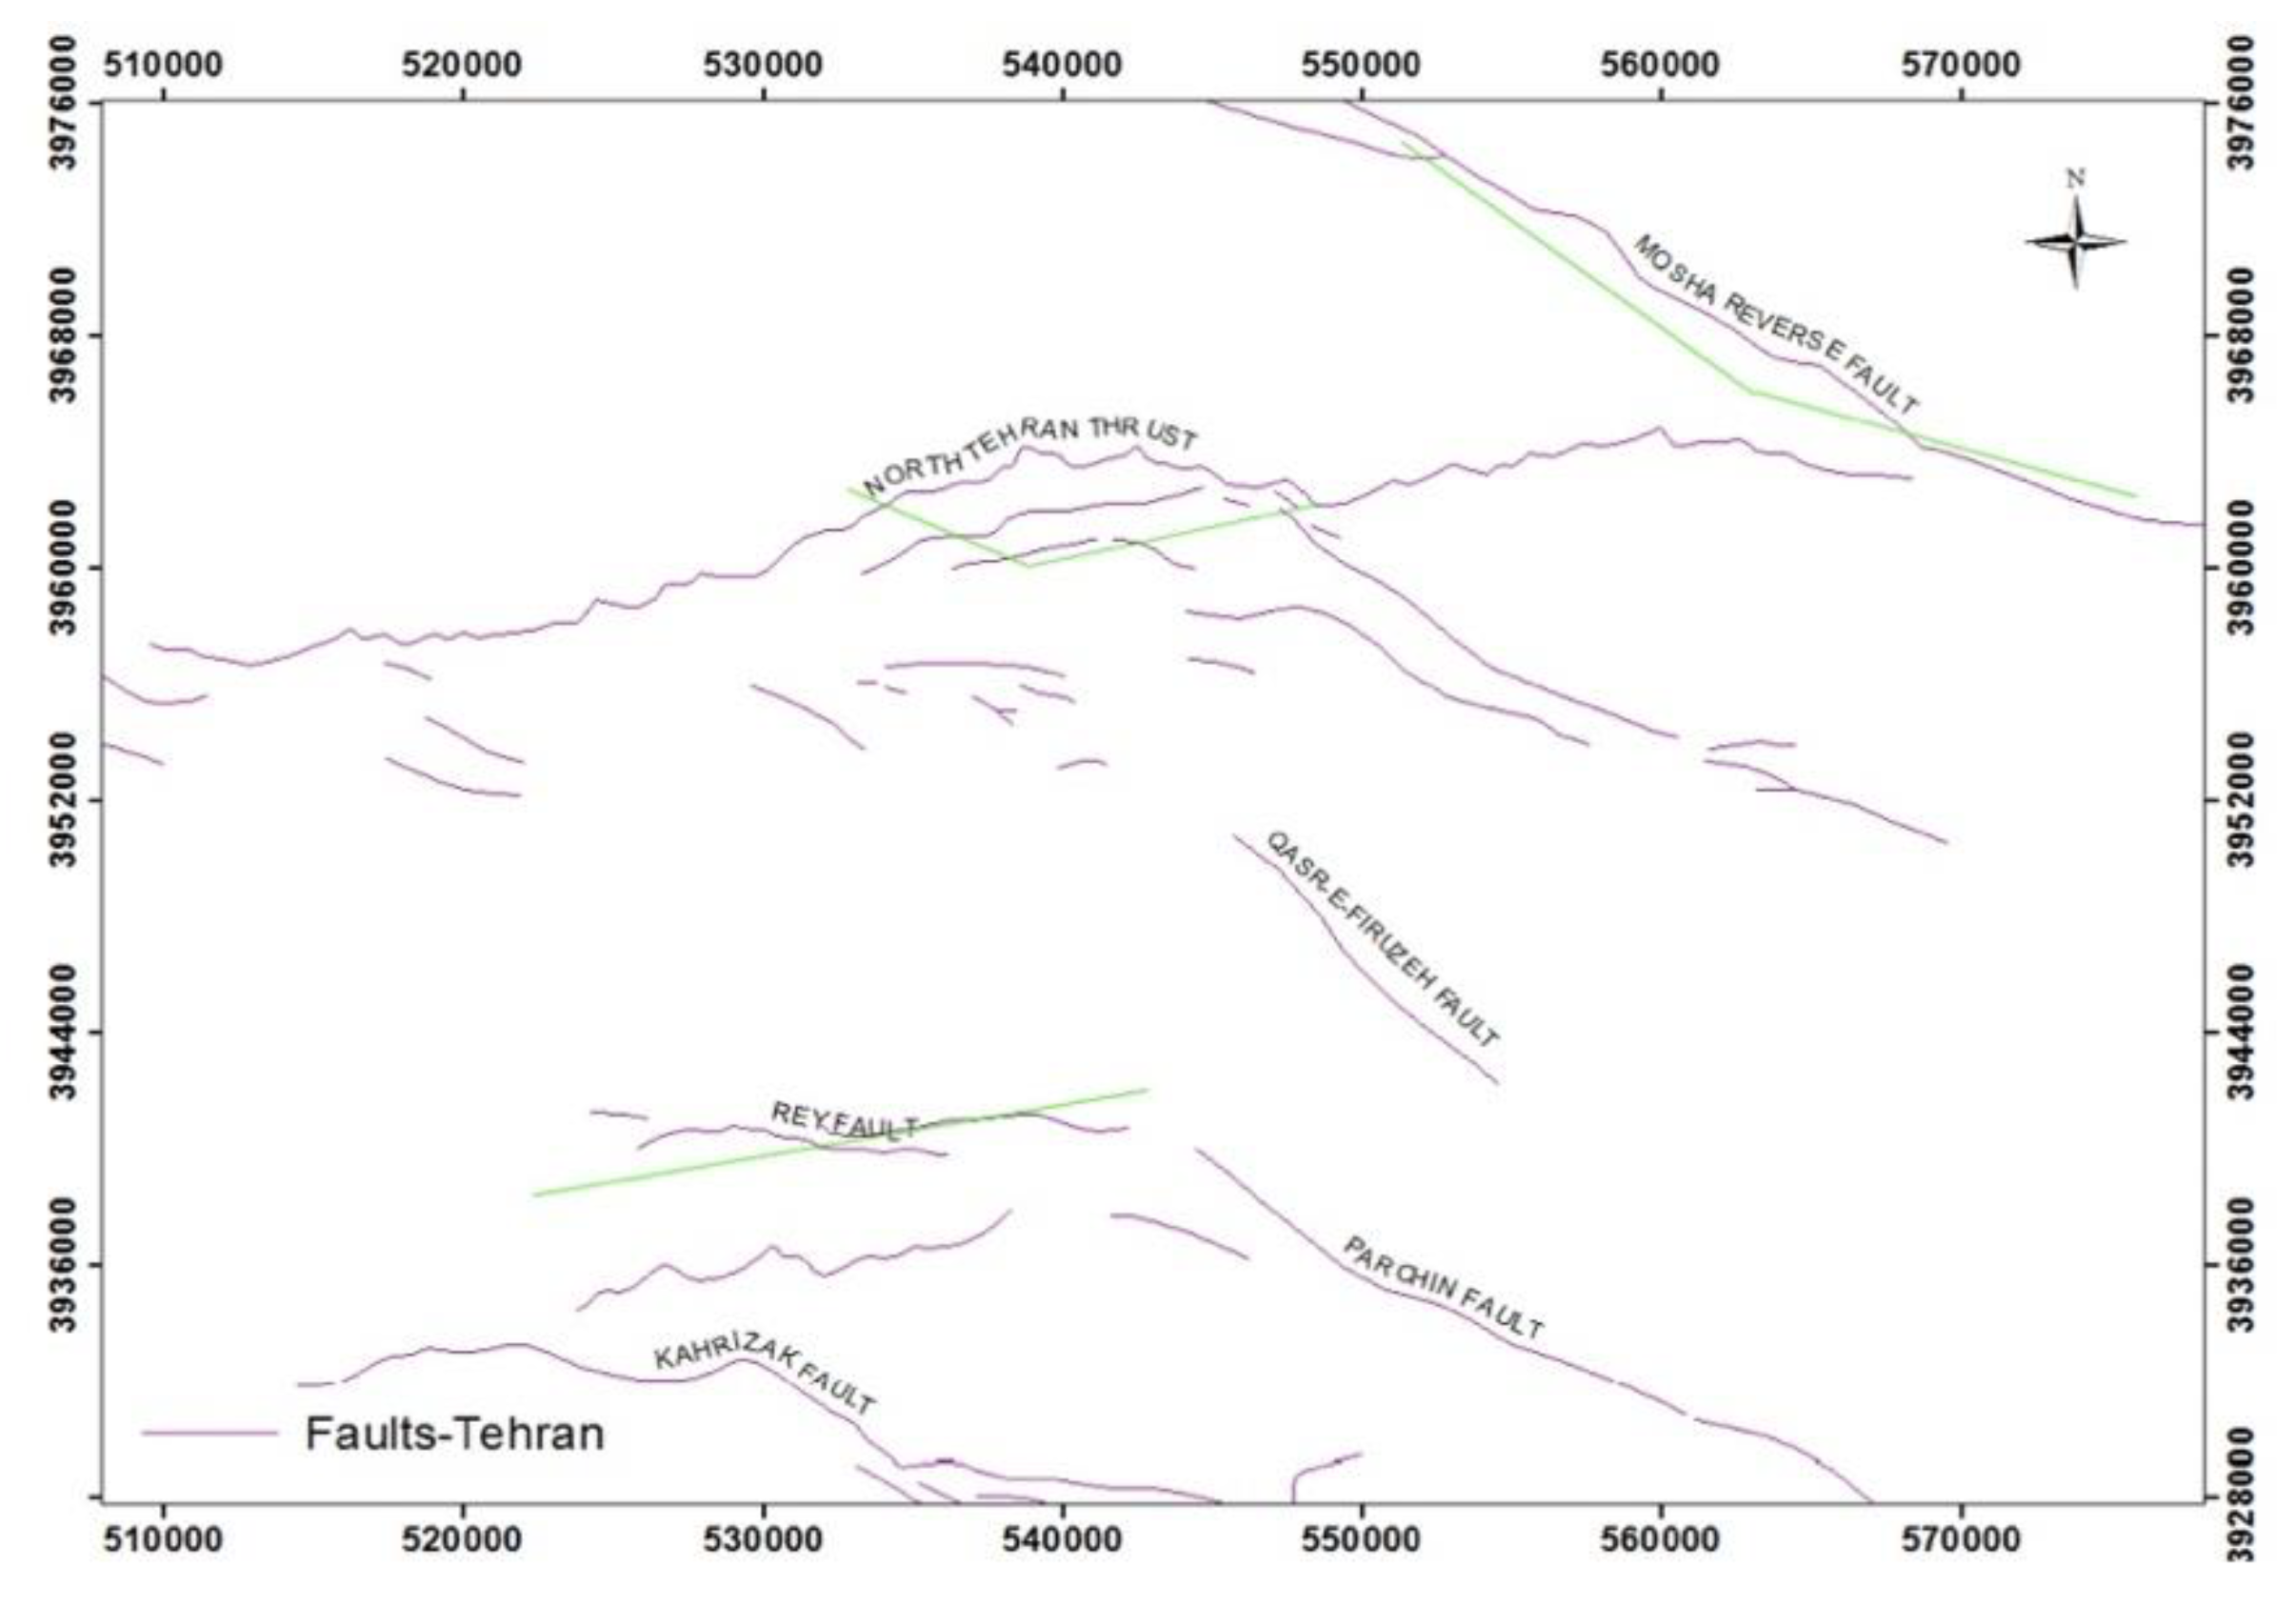
49] which can cause significant damages to economic, social and political sectors in the event of an earthquake. (
Figure 24). Hence, it is important to use early warning system to prevent secondary destructive damage. Furthermore, there exists more than 65,000 gas riser and approximately 100km long gas pipeline and make it impossible to manage the city in a traditional way in critical time.
Cooperating with the Tehran Municipality in 2000, the International Co-operation Agency of Japan (JICA) developed the Tehran earthquake damage reduction program. The agency evaluated the different kinds of earthquake events in Tehran and their damage and casualties.
In
Table 5, more thorough data on the characteristics of the faults is presented [
50]
7.4. Rules
Tehran, it is located on three major faults, "NTF", "Ray" and "Mosha". If they are activated, it can Bring irreparable damage to the city. [
50] .
The final commands issued by the system are defined based on the scenario faults mentioned and for the areas outside the scenario faults, the unknown fault scenario will be implemented. The number of scenarios and rules defined for post-earthquake loss control in Tehran are 72, the scenarios being defined based on the opinion of experts.
These values set like ‘Minor or R1’, ‘Moderate or R2’, ‘Major or R3’, ‘Complete or R4’.(
Table 6 and
Table 7) These functions indicate how radically the gas or electricity should be shot-down command base on the failure level caused and the Maximum amount of PGA produced from each fault. According to these outputs, actions alert and disconnect the valve of gas and electricity executed to prevent secondary destructive damage.
One of the main purposes of an early warning systems is to alert people. The fuzzy system sends alert notifications to minimize human casualties with reporting “medium damage state” by the system, if earthquake damage to the gas and electricity network.
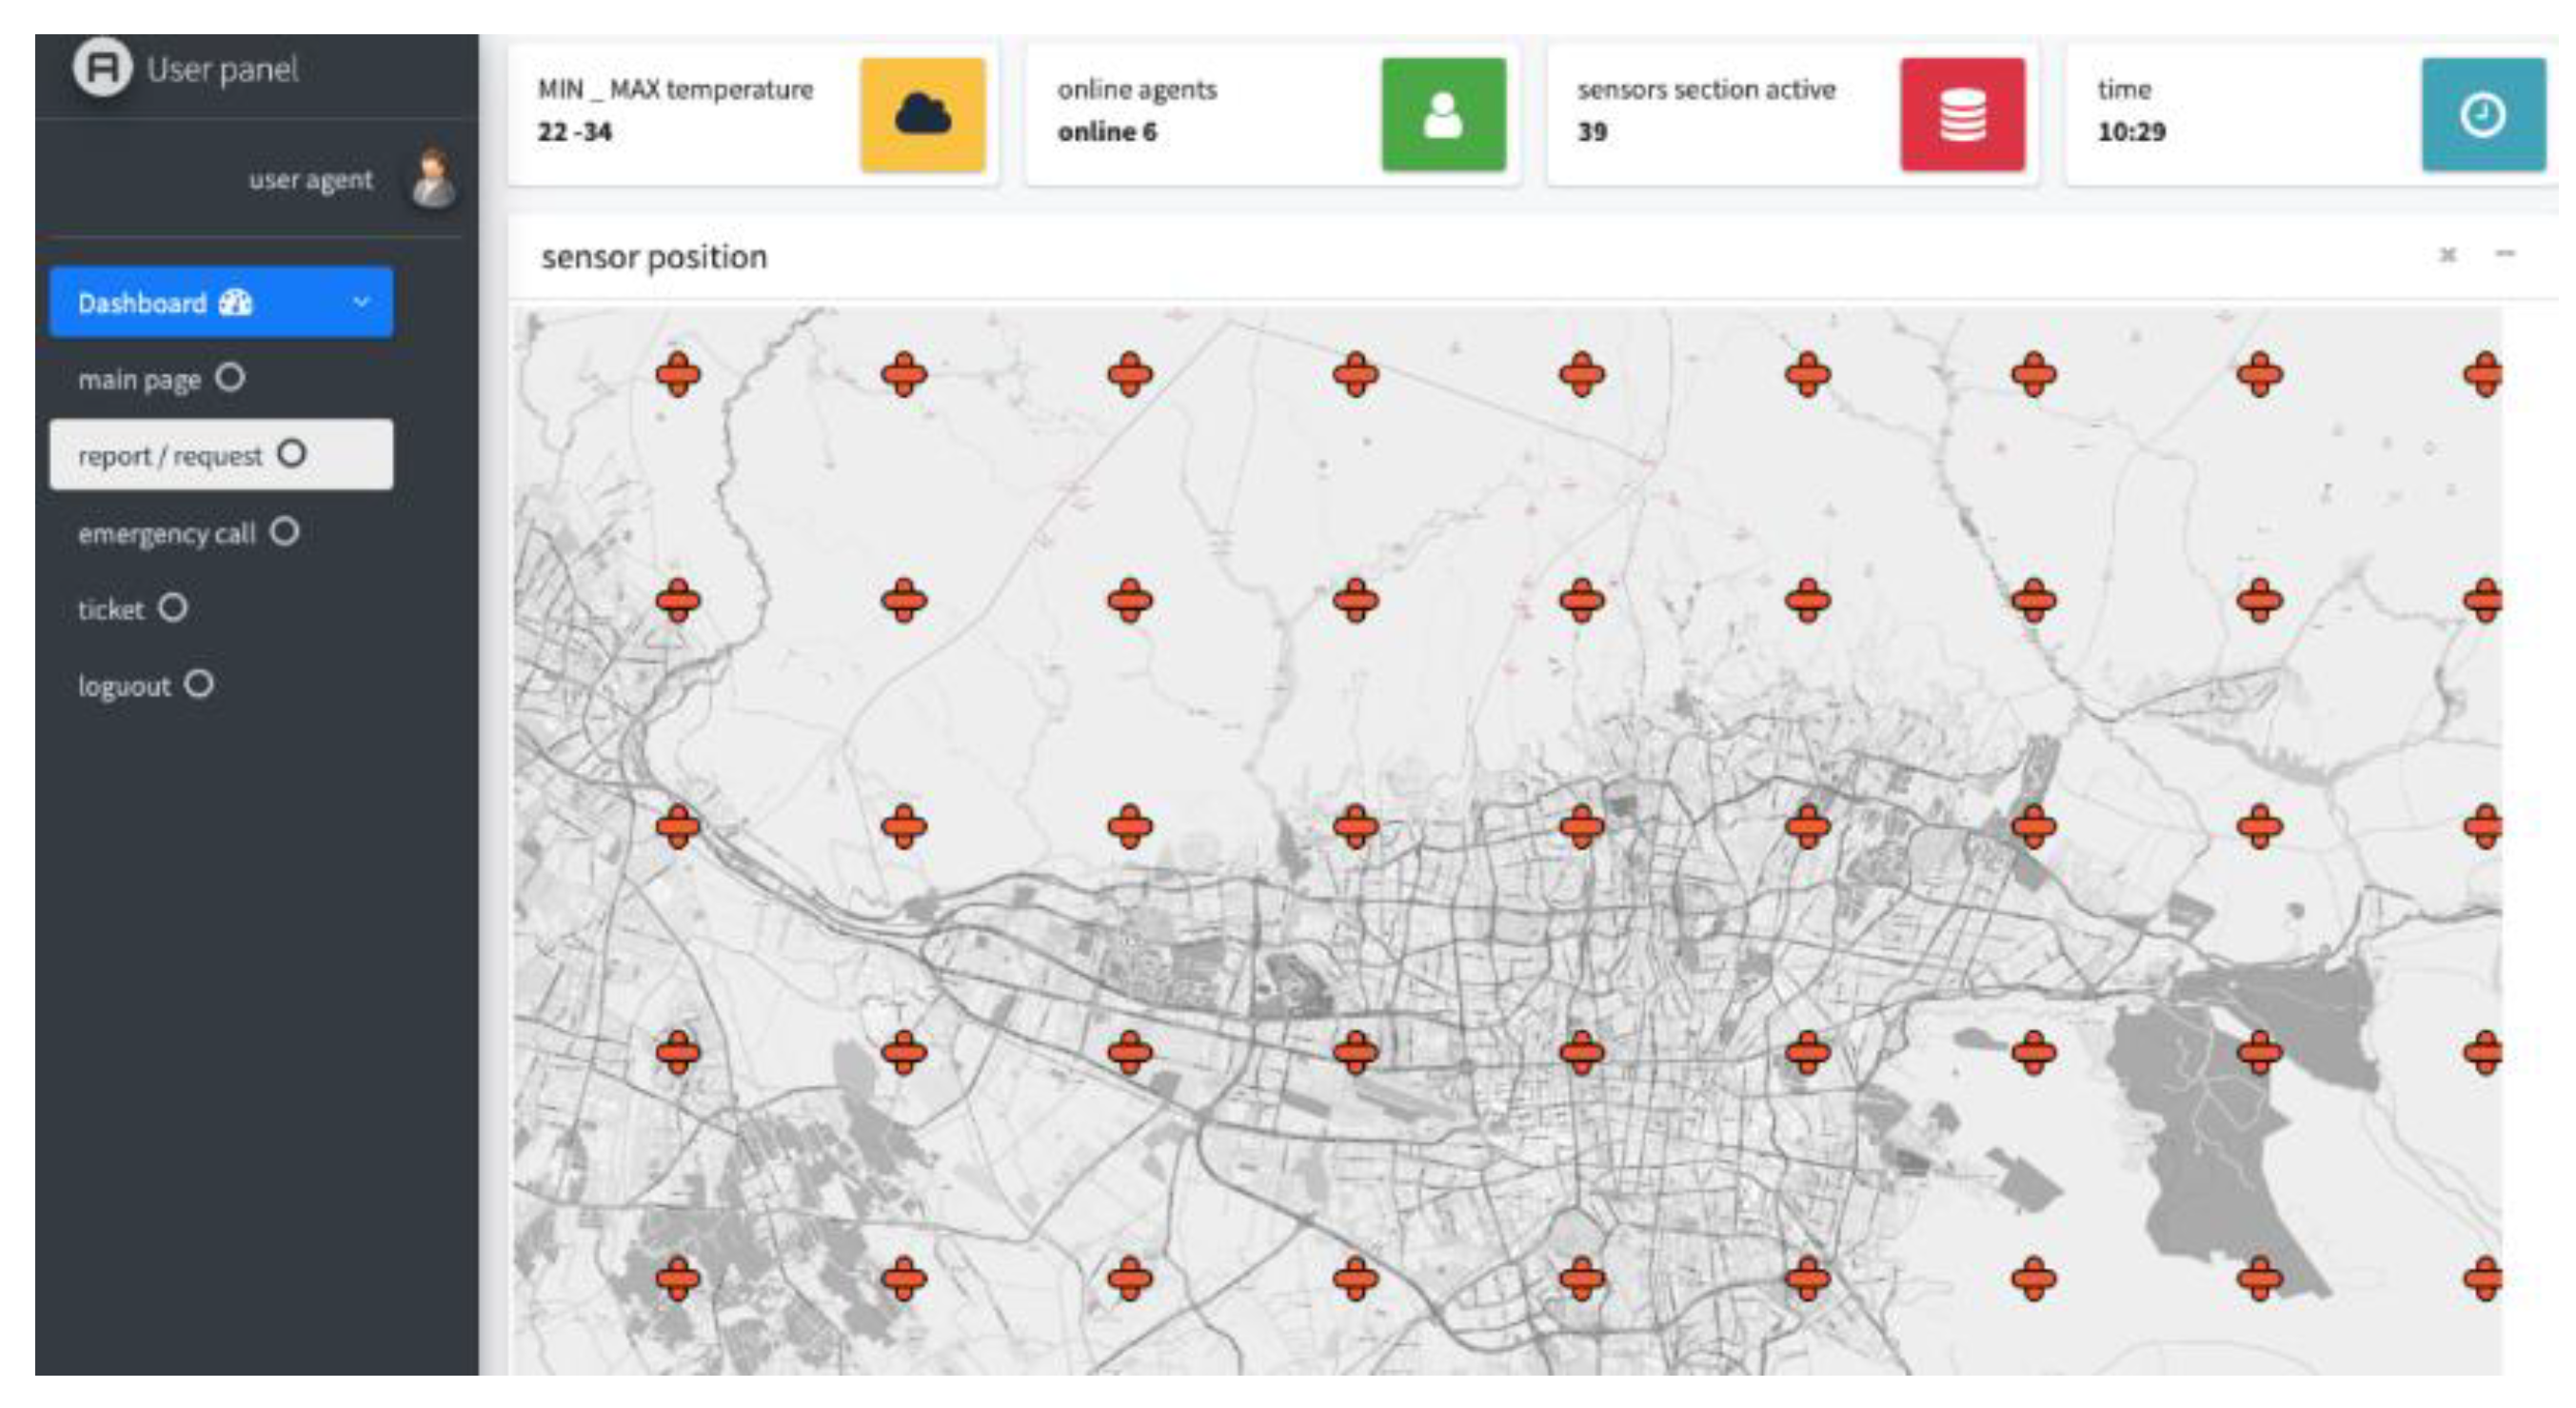
Each section sends comprehensive information of region such as temperature, location, an acceleration earthquake magnitude, temperature, humidity and these data will be shown in monitoring dashboard.(figure 25) this data will provide emergency relief teams to save the injured and reducing secondary damage.
7.5. Result
In the first chapter of the JICA studies, which is the only documented source of Seismic hazard assessment and enforcement measures to prevent secondary hazards in Tehran's metropolitan area, it identified the radius that gas and electricity lines would have to be shot-down as scenario faults became active. Using the results of these studies, the performance of the fuzzy system defined in the following table is investigated which shows acceptable results.
In addition to gas and electricity transmission lines, the proposed systems consider the gas pressure boost compressor stations as well as power pressure boost station in the defined fuzzy system.
In the following table(
Table 8) the system outputs according to the potential of each fault are presented. [
50]
8. Conclusion
It is impossible to know where and when a seismic event can happen, thus it is known that an earthquake is unpredictable event (time - place - intensity) at the epicentre. So, the best way to mitigate damages to infrastructure, assets and even human lives, is the early warning system, where a real-time architecture and an efficient communication between actors becomes a requirement. Considering the Tehran metropolitan population and high seismic potential in accordance with Iran's 2800 standard, it is regarded as a case study. Expansion of gas equipment and electric station at this metropolis surface turns into a zone of inevitability which by the start of an earthquake could bring a lot of casualties to the city. Given the current conditions resulted in disrupting the flow of lifeline, informing the points Damage seen during an earthquake is impossible for the relevant organizations in the early hours. Regarding the risks of gas explosion accidents in the aftermath of earthquakes such as Cuba Japan and Turkey's Izmit of the previous studies, an early warning system in Tehran is essential to lessen the damage in an earthquake crisis.
This research mainly aims to crisis management based on the use of IoT which other than the capability to send an alert 5 to 50 seconds before a destructive wave as the same as previous Early warning system, this system can send operational command even during the earthquake. In this paper, HAZUS boundaries failure for gas and electrical networks and experts used to define the criteria and rule of fuzzy system. first, data of each early warning station compares to the defined value, second, if the data is more than define value, this data should sent to the cloud server. After processing and validation data in the cloud server according to the scenario conditions associated with executing. The defined evaluation algorithms will eliminate many system errors. The output of this fuzzy system is to send the command to the actuator sensor to disconnect the gas distribution system and electrical substations of the area (whenever required) to prevent secondary destructive damage.
The results of the system were similar and slightly cautious, according to the Tehran city risk analysis, which was carried out by JICA research group. In addition to that, in the event of an earthquake crisis, the electric and gas network will alarm to the people in the region and relief forces to reduce human casualties.
References
- Database, E.O.C.I.D. Total number of deaths as a result of natural disasters.; Université catholique de Louvain – Brussels – Belgium, 2019.
- mali, j.r. and m. s.kumbhar. Wireless sensor based Landslide Detection. may 2016, 7. [CrossRef]
- KATAYAMA, T. EARTHQUAKE DISASTER RISK MITIGATION BEFORE AND AFTER THE 1995 KOBE EARTHQUAKE. 13th World Conference on Earthquake Engineering 2004.
- Manshoori, M.R. Evaluation of Seismic Vulnerability and Failure Modes for Pipelines. Procedia Engineering 2011, 14, 3042–3049. [Google Scholar] [CrossRef]
- {Hui}, L.Y.a.J.F.a.Y. Study on application modes of military Internet of Things (MIOT). 2012, 10.1109/CSAE.2012.6273031. [CrossRef]
- Wang, H.Z.L. Design and Research of Urban Intelligent Transportation System Based on the Internet of Things. 2012. [Google Scholar] [CrossRef]
- Maglogiannis, C.D.I. Bringing IoT and Cloud Computing towards Pervasive Healthcare. 2012. [CrossRef]
- Atzori, L.; Iera, A.; Morabito, G. The Internet of Things: A survey. Computer Networks 2010, 54, 2787–2805. [Google Scholar]
- Thoma, M., et al. On IoT-services: Survey, Classification and Enterprise Integration. in 2012 IEEE International Conference on Green Computing and Communications. 2012.
- Song, Z., A.A. Cardenas, and R. Masuoka. Semantic middleware for the Internet of Things. in 2010 Internet of Things (IOT). 2010.
- Jeretta Horn Norda, A.K. , ∗, Joanna Paliszkiewiczc, The Internet of Things: Review and theoretical framework. Expert Systems With Applications, 2019. 133: p. 97–108.
- Dai, J., S. Wang, and X. Yang. Computerized support systems for emergency decision making. Annals of Operations Research 1994, 51, 313–325. [CrossRef]
- Lee, E.K.; Maheshwary, S.; Mason, J.; Glisson, W. Decision support system for mass dispensing of medications for infectious disease outbreaks and bioterrorist attacks. Annals of Operations Research 2006, 148, 25–53. [Google Scholar] [CrossRef]
- Duhamel, C.; Santos, A.C.; Brasil, D.; Châtelet, E.; Birregah, B. Connecting a population dynamic model with a multi-period location-allocation problem for post-disaster relief operations. Annals of Operations Research 2016, 247, 693–713. [Google Scholar] [CrossRef]
- L.A.Zadeh. Fuzzy sets. Information and Control 1965, 8, 338–353.
- Hoda Nokhbatolfoghahaayee, M.B.M. , Masoud Shafiee. Fuzzy decision support system for crisis management with a new structure for decision making. Expert Systems with Applications 2010, 37, 3545–3552. [Google Scholar] [CrossRef]
- Hoda Nokhbeh Foghahaayeea, M.B.M. , Hasan Montazer Torbatib. Fuzzy decision support software for crisis management in gas transmission networks. Applied Soft Computing 2014, 18, 82–90. [Google Scholar]
- Sßen, Z. Supervised fuzzy logic modeling for building earthquake hazard assessment. Expert Systems with Applications 2011, 38, 14564–14573. [Google Scholar] [CrossRef]
- Abraham Ahumada, A.A. , Ashraf Ayoub Fuzzy logic-based attenuation relationships of strong motion earthquake records. Expert Systems with Applications 2015, 42, 1287–1297. [Google Scholar]
- Arash Andalib, M.Z., Farid Atry. A Fuzzy Expert System for Earthquake Prediction,Case Study: The Zagros Range. In Third International Conference on Modeling, Simulation and Applied Optimization, UAE.
- Dr Andrew Coburn, D.R.S. Front Matter. In Earthquake Protection, 2002; [CrossRef]
- H. Takaoka, H.H. H. Takaoka, H.H., S. Ikematsu & M. Hikida. Prediction Of Landslide-induced Debris Flow Hydrograph: The Atsumari Debris Flow Disaster In Japan. 2006. [CrossRef]
- Hoshiba, M.; Ozaki, T. Earthquake Early Warning and Tsunami Warning of the Japan Meteorological Agency, and Their Performance in the 2011 off the Pacific Coast of Tohoku Earthquake M9. In Early Warning for Geological Disasters: Scientific Methods and Current Practice, Wenzel, F., Zschau, J., Eds. Springer Berlin Heidelberg: Berlin, Heidelberg, 2014. pp. 1–28. [CrossRef]
- Hoshiba, M.; Iwakiri, K.; Hayashimoto, N.; Shimoyama, T.; Hirano, K.; Yamada, Y.; Ishigaki, Y.; Kikuta, H. Outline of the 2011 off the Pacific coast of Tohoku Earthquake (Mw 9.0) —Earthquake Early Warning and observed seismic intensity—. Earth, Planets and Space 2011, 63, 7. [Google Scholar] [CrossRef]
- Erdik, M.; Fahjan, Y.; Ozel, O.; Alcik, H.; Mert, A.; Gul, M. Istanbul Earthquake Rapid Response and the Early Warning System. Bulletin of Earthquake Engineering 2003, 1, 157–163. [Google Scholar] [CrossRef]
- Fumio, Y. Seismic monitoring and early damage assessment systems in Japan. Progress in Structural Engineering and Materials 2001, 3, 66–75. [Google Scholar] [CrossRef]
- Yeh, C.-H., C.-H. Loh, and K.-C. Tsai. Overview of Taiwan Earthquake Loss Estimation System. Natural Hazards 2006, 37, 23–37. [CrossRef]
- Bogazici University, D.o.E.E.I. ELER v3.1 2010.
- Özbey, C.; Sari, A.; Manuel, L.; Erdik, M.; Fahjan, Y. An empirical attenuation relationship for Northwestern Turkey ground motion using a random effects approach. Soil Dynamics and Earthquake Engineering 2004, 24, 115–125. [Google Scholar] [CrossRef]
- Strasser, S. , Bommer,Erdik. State-of-the-Art of European Earthquake Loss Estimation Software. 2008.
- Doi, K. The operation and performance of Earthquake Early Warnings by the Japan Meteorological Agency. Soil Dynamics and Earthquake Engineering 2011, 31, 119–126. [Google Scholar]
- Seng, C.-C.J.L.a.Z.-P. Development of the On-Site Earthquake Early Warning Systems for Taiwan Using Neural Networks. 2009. [CrossRef]
- USGS. ShakeAlert, early earthquake warning. 2012.
- Buzduga, A.G., C. Ciufudean and V. Vlad System for the detection earthquake victims construction and principle of operation. 2015.
- Dan Wang, Y.N. Wireless Sensor Networks for Earthquake Early Warning Systems of Railway Lines. 2012.
- Wang Yanwei, L.X., Wang Zifa,Shi Jianping,and Bao Enhe. Deep learning for P-wave arrival picking in earthquake early warning. EARTHQUAKE ENGINEERING AND ENGINEERING VIBRATION 2021. [CrossRef]
- Rikhsieva, K.S.J.K.P.L.B. Strength of underground pipelines under seismic effects. Magazine of Civil Engineering 2020, 93. [Google Scholar] [CrossRef]
- Alphonsa, A.; Ravi, G. Earthquake early warning system by IOT using Wireless sensor networks. In Wireless Communications, Signal Processing and Networking (WiSPNET), International Conference on. 2016; pp. 1201–1205.
- Liu, M.; Sun, X.H.; Yang, W.Y. Analysis and control of unsafe behavior. Environ. 2008. [Google Scholar]
- Xie, Y.H. Misunderstandings and Countermeasures for the prevention of unsafe behavior. 2016.
- Aki, K., Richards, P. Quantitative Seismology, 2 University Science Books, Sausalito 2004.
- M. Mojarab, M.M.s., M Porois,N norozi,Z asadi. Feasibility study of Tehran earthquake rapid earthquake warning network design. Managing environmental hazards 2017, 4, 63–81.
- Schneider, E. “INTERNET OF THINGS” white paper. TECHNOLOGY, ECONOMIC VIEW AND TECHNICAL STANDARDIZATION 2018, 1. [Google Scholar]
- Chen, M.; Miao, Y.; Hao, Y.; Hwang, K. Narrow Band Internet of Things. IEEE Access 2017, 5, 20557–20577. [Google Scholar] [CrossRef]
- U. Raza, P.K.a.M.S. Low Power Wide Area Networks: An Overview, IEEE Communications Surveys & Tutorials 2017, 19, 855–873. [Google Scholar] [CrossRef]
- Federal Emergency Management Agency, W. Hazus EARTHQUAKE LOSS ESTIMATION METHODOLOGY; Federal Emergency Management Agency: Federal Emergency Management Agency, 2002.
- G. Lanzano a, E.S.b., *, F. Santucci de Magistris a, G. Fabbrocino a. Seismic vulnerability of gas and liquid buried pipelines. Journal of Loss Prevention in the Process Industries 2014, 28, 72–78.
- Nations, U. The World’s Cities. United Nations 2016. [Google Scholar]
- standards, i.b.c.a. iranian code of practice for seismic resistant design of buildings standard 2800 v 4edition; iranian building codes and standards: iranian building codes and standards, 2015; Vol. 4, pp. 212.
- JICA, J.I.C.A.a.T.D.M.a.M.C. The study on seismic microzonation of the Greater Tehran Area in the Islamic Republic of Iran. 2000.
Figure 1.
– Flow chart system.
Figure 1.
– Flow chart system.
Figure 2.
– There type of seismic waves P,S,R/L[
41].
Figure 2.
– There type of seismic waves P,S,R/L[
41].
Figure 3.
– IoT early warning system architecture.
Figure 3.
– IoT early warning system architecture.
Figure 4.
- Receiver Sensors.
Figure 4.
- Receiver Sensors.
Figure 5.
- Gas and Electrical Actuator.
Figure 5.
- Gas and Electrical Actuator.
Figure 6.
- sensor position.
Figure 6.
- sensor position.
Figure 7.
- Fuzzy system of Early warning system.
Figure 7.
- Fuzzy system of Early warning system.
Figure 8.
- Fragility Curves for Compressor Stations with Anchored Components[
46].
Figure 8.
- Fragility Curves for Compressor Stations with Anchored Components[
46].
Figure 9.
- Fragility curves for gas pipelines[
47].
Figure 9.
- Fragility curves for gas pipelines[
47].
Figure 10.
membership function Gas Compressor Stations.
Figure 10.
membership function Gas Compressor Stations.
Figure 11.
membership function gas Pipeline.
Figure 11.
membership function gas Pipeline.
Figure 12.
Fragility curves Distribution Circuits [
46].
Figure 12.
Fragility curves Distribution Circuits [
46].
Figure 13.
Fragility curves for Low voltage Substations [
46].
Figure 13.
Fragility curves for Low voltage Substations [
46].
Figure 14.
membership function Distribution circuits.
Figure 14.
membership function Distribution circuits.
Figure 15.
membership function Substations electric.
Figure 15.
membership function Substations electric.
Figure 16.
membership function shot-down command -gas - Rey fault.
Figure 16.
membership function shot-down command -gas - Rey fault.
Figure 17.
membership function shot-down command - electric - Rey fault.
Figure 17.
membership function shot-down command - electric - Rey fault.
Figure 18.
membership function shot-down command- gas-North of Tehran fault (NTF).
Figure 18.
membership function shot-down command- gas-North of Tehran fault (NTF).
Figure 19.
membership function shot-down command - electric -North of Tehran fault(NTF).
Figure 19.
membership function shot-down command - electric -North of Tehran fault(NTF).
Figure 20.
membership function shot-down command- gas- Mosha fault.
Figure 20.
membership function shot-down command- gas- Mosha fault.
Figure 21.
membership function shot-down command- electric –Mosha fault.
Figure 21.
membership function shot-down command- electric –Mosha fault.
Figure 22.
membership function shot-down command - gas- undefined fault.
Figure 22.
membership function shot-down command - gas- undefined fault.
Figure 23.
membership function shot-down command - electric – undefined fault.
Figure 23.
membership function shot-down command - electric – undefined fault.
Figure 24.
Fault around the region of Tehran [
50].
Figure 24.
Fault around the region of Tehran [
50].
Figure 25.
– Monitoring Dashboard.
Figure 25.
– Monitoring Dashboard.
Table 1.
- Transport layer[
43,
44,
45].
Table 1.
- Transport layer[
43,
44,
45].
|
Technology
|
Frequency
|
Data Range
|
Transmission Range
|
Date rate (up and down link)
|
Power Usage
(energy Consumption )
|
Operating life (battery)
|
Cost
|
2G/3G
|
Cellular Bands
|
10Mbps |
35 Km
|
No limitation |
High
|
4-8hours
36 days(idle) |
High
|
| Bluetooth 4 LE |
2.4Ghz |
24 Mbps |
50 m |
No limitation |
Low |
Hours |
Low |
| 802.15.4 |
subGhz, 2.4GHz |
250 kbps |
200m |
No limitation |
Low |
Up to 4 years |
Low |
| LORA |
SubGhz, 2.4GHz (868/915 MHz)
|
More than 50kbps |
2-10km |
EU:30bps-50kbps
US:100-900 kbps |
Low |
10-20years(idle)/
120 hours(communication)/ |
Medium |
| LTE Cat 0/1 |
Cellular Bands |
1-10 Mbps |
Several kilometers |
Up to 1 MBPs |
Medium |
2-3 hours (communication)/12days(idle) |
High |
| NB-IoT |
Cellular Bands
(180KHZ) |
0.1-1 Mbps |
10-15km |
150kbps (NB) up to 1mbps |
Medium |
|
High |
| SIGFOX |
subGhz
|
< 1 kbps
|
Several kilometers
|
4x8b/day (down)
100bps(up |
Low
|
10-20years(idle)/
120 hours(communication)/ |
Medium
|
| WiMax |
subGhz |
34 Mbps-1Gbps |
40km |
No limitation |
Low |
hours |
Low |
| WIFI |
subGhz,
2.4Ghz, 5Ghz |
0.1-54Mbps |
up to 10m |
No limitation |
Medium |
4-8hours
50 days(idle) |
Low |
| ZigBee |
2.4Ghz |
250 kbps |
10-500 m |
No limitation |
Low |
Up to 2 years |
Medium |
Table 2.
- value of linguistic variable.
Table 2.
- value of linguistic variable.
Criteria
Variable |
Low probability risk failures |
Medium probability risk failures |
High probability risk failures |
| Gas Compressor Stations |
Acceleration 0-0.238 |
Acceleration 0.238-0.34 |
Acceleration 0.34-1.0 |
| Gas Pipeline |
Acceleration 0-0.406 |
Acceleration 0.406-0.58 |
Acceleration 0.58-1.0 |
| Distribution circuits electric |
Acceleration 0-0.28 |
Acceleration 0.28-0.4 |
Acceleration 0.4-1.0 |
| Low voltage Substations |
Acceleration 0-0.203 |
Acceleration 0. 203-0.29 |
Acceleration 0.29-1.0 |
Table 5.
Name of Tehran Fault with Detail[
50].
Table 5.
Name of Tehran Fault with Detail[
50].
| Name |
Magnitude (Mw) |
fault Length(km) |
| Mosha fault |
7.3 |
68 |
| North of Tehran fault(NTF) |
7.3 |
90 |
| Rey fault |
6.6 |
20 |
Table 6.
– shot-down - Gas Network.
Table 6.
– shot-down - Gas Network.
| Fault Name |
Damage to gas pipeline
Damage to compressor station |
Low |
Medium |
High |
| Rey |
Low |
R1 |
R3 |
R3 |
| Medium |
R3 |
R3 |
R3 |
| High |
R3 |
R3 |
R4 |
| NTF |
Low |
R1 |
R3 |
R3 |
| Medium |
R3 |
R3 |
R3 |
| High |
R3 |
R3 |
R4 |
| Mosha |
Low |
R1 |
R2 |
R3 |
| Medium |
R2 |
R2 |
R3 |
| High |
R3 |
R3 |
R4 |
| Undefined |
Low |
R1 |
R2 |
R3 |
| Medium |
R2 |
R3 |
R3 |
| High |
R3 |
R3 |
R4 |
Table 7.
- shot-down - Electric Network.
Table 7.
- shot-down - Electric Network.
| Fault Name |
Damage to electric network
Damage to electric station |
Low |
Medium |
High |
| Rey |
Low |
R1 |
R3 |
R3 |
| Medium |
R3 |
R3 |
R3 |
| High |
R3 |
R3 |
R4 |
| NTF |
Low |
R1 |
R3 |
R3 |
| Medium |
R3 |
R3 |
R3 |
| High |
R3 |
R3 |
R4 |
| Mosha |
Low |
R1 |
R2 |
R3 |
| Medium |
R2 |
R2 |
R3 |
| High |
R3 |
R3 |
R4 |
| Undefined |
Low |
R1 |
R2 |
R3 |
| Medium |
R2 |
R3 |
R3 |
| High |
R3 |
R3 |
R4 |
Table 8.
: Potential of each fault and shot-down command.
Table 8.
: Potential of each fault and shot-down command.
|
Fault
|
Maximum PGA (G) [50] |
Network
|
shot-down command by system
|
Shot-down command by
[50]
|
| Rey |
0.5 G |
Gas |
19 km |
18 km |
| Rey |
0.5 G |
Electric |
23 km |
20 km |
| NTF |
0.3 G |
Gas |
13 km |
10 km |
| NTF |
0.3 G |
Electric |
16 km |
12 km |
| Mosha |
0.1 G |
Gas |
4 km |
2 km |
| Mosha |
0.1 G |
Electric |
6 km |
0 km |
|
Disclaimer/Publisher’s Note: The statements, opinions and data contained in all publications are solely those of the individual author(s) and contributor(s) and not of MDPI and/or the editor(s). MDPI and/or the editor(s) disclaim responsibility for any injury to people or property resulting from any ideas, methods, instructions or products referred to in the content. |
© 2024 by the authors. Licensee MDPI, Basel, Switzerland. This article is an open access article distributed under the terms and conditions of the Creative Commons Attribution (CC BY) license (http://creativecommons.org/licenses/by/4.0/).
