Preprint
Brief Report

Machine Learning Classification of Schizophrenia and Bipolar Disorder Using Electrophysiology: Insights from Baseline and Post-Stimulus Conditions

Altmetrics

Downloads

155

Views

140

Comments

0

Submitted:

15 August 2024

Posted:

16 August 2024

You are already at the latest version

Alerts
Abstract
Importance: Neuropsychiatric disorders like schizophrenia and bipolar disorder lack objective diagnostic markers, hindering accurate diagnosis and treatment. A novel approach using patient-derived cerebral organoids and digital analysis of electrophysiological recordings could provide much-needed objective biomarkers.Objective: To develop a digital analysis pipeline that can identify distinct electrophysiological signatures of schizophrenia and bipolar disorder using multi-electrode array recordings from patient-derived cerebral organoids.Design: This was an experimental study using previously published data. The study type can be classified as a case-control study, comparing cerebral organoids and 2D neuronal cultures derived from patients with schizophrenia, bipolar disorder, and healthy controls. The study utilized multi-electrode array recordings for analysis. Setting: The study was conducted in a laboratory setting using previously recorded data. Main Outcomes and Measures: The primary outcome was the accuracy of a support vector machine classifier in distinguishing between healthy control, schizophrenia, and bipolar disorder samples based on electrophysiological features extracted from the recordings. Key cellular-digital biomarkers were identified using minimum redundancy maximum relevance feature selection.Results:Our Support Vector Machine classifier achieved 95.8% accuracy in distinguishing SCZ from control samples in 2D neuronal cultures under both baseline and post-electrical stimulation (PES) conditions. For cerebral organoids, classification accuracy was 83.3% under baseline conditions, improving to 91.6% under PES when distinguishing between control, SCZ, and BPD samples. Key features for classification included channel-specific measures such as median, covariance, autocorrelation, and kurtosis of neural activity. Confusion matrices visualize classification performance, with most misclassifications occurring in the BPD class under baseline conditions. These results demonstrate that our digital analysis pipeline can effectively distinguish between healthy control and patient-derived samples using electrophysiological features from multi-electrode array recordings, particularly under PES conditions.Conclusions and Relevance: This digital analysis pipeline demonstrates the potential to identify objective electrophysiological signatures of schizophrenia and bipolar disorder using patient-derived cerebral organoids. This approach could lead to improved diagnostic accuracy and personalized treatment strategies for neuropsychiatric disorders.
Keywords: 
Subject: Biology and Life Sciences  -   Life Sciences

Main Text

Neuropsychiatric disorders, such as schizophrenia (SCZ) and bipolar disorder (BPD), pose a significant global health burden, affecting millions of individuals worldwide [1]. Precise prevalence estimates of these disorders are impossible to obtain due to clinical and methodological factors, such as the complexity of neuropsychiatric diagnosis, their overlap with other disorders, and varying methods for determining diagnoses. Given these complexities, SCZ and other psychotic disorders are often combined in prevalence estimation studies [2].
To address the critical need for objective diagnostic markers in neuropsychiatry, this study explores the clinical application of novel digital technologies. By leveraging cerebral organoids (COs) derived from patient-specific induced pluripotent stem cells (iPSCs) [3] and multi-electrode array technology (MEA), we have developed a digital analysis pipeline (DAP) that builds upon the foundation established by electroencephalography (EEG) analyses [4,5,14,15,16,19]. This approach aims to uncover distinct electrophysiological signatures associated with SCZ and BPD, offering a physiologically relevant and comprehensive assessment of neural network dynamics.
COs recapitulate key aspects of human brain development and provide a physiologically relevant in vitro model system to investigate the neurophysiological mechanisms underlying complex psychiatric disorders [5]. The application of MEA in patient-derived COs enables comprehensive analysis of neural network dynamics and extraction of digital biomarkers that can serve as objective diagnostic indicators, complementing insights gleaned from traditional EEG techniques [6]. By bridging the gap between advanced in vitro models, cutting-edge electrophysiological analysis, and machine learning-driven feature extraction, this research presents a promising approach to addressing the critical need for validated digital markers in the field of neuropsychiatry.
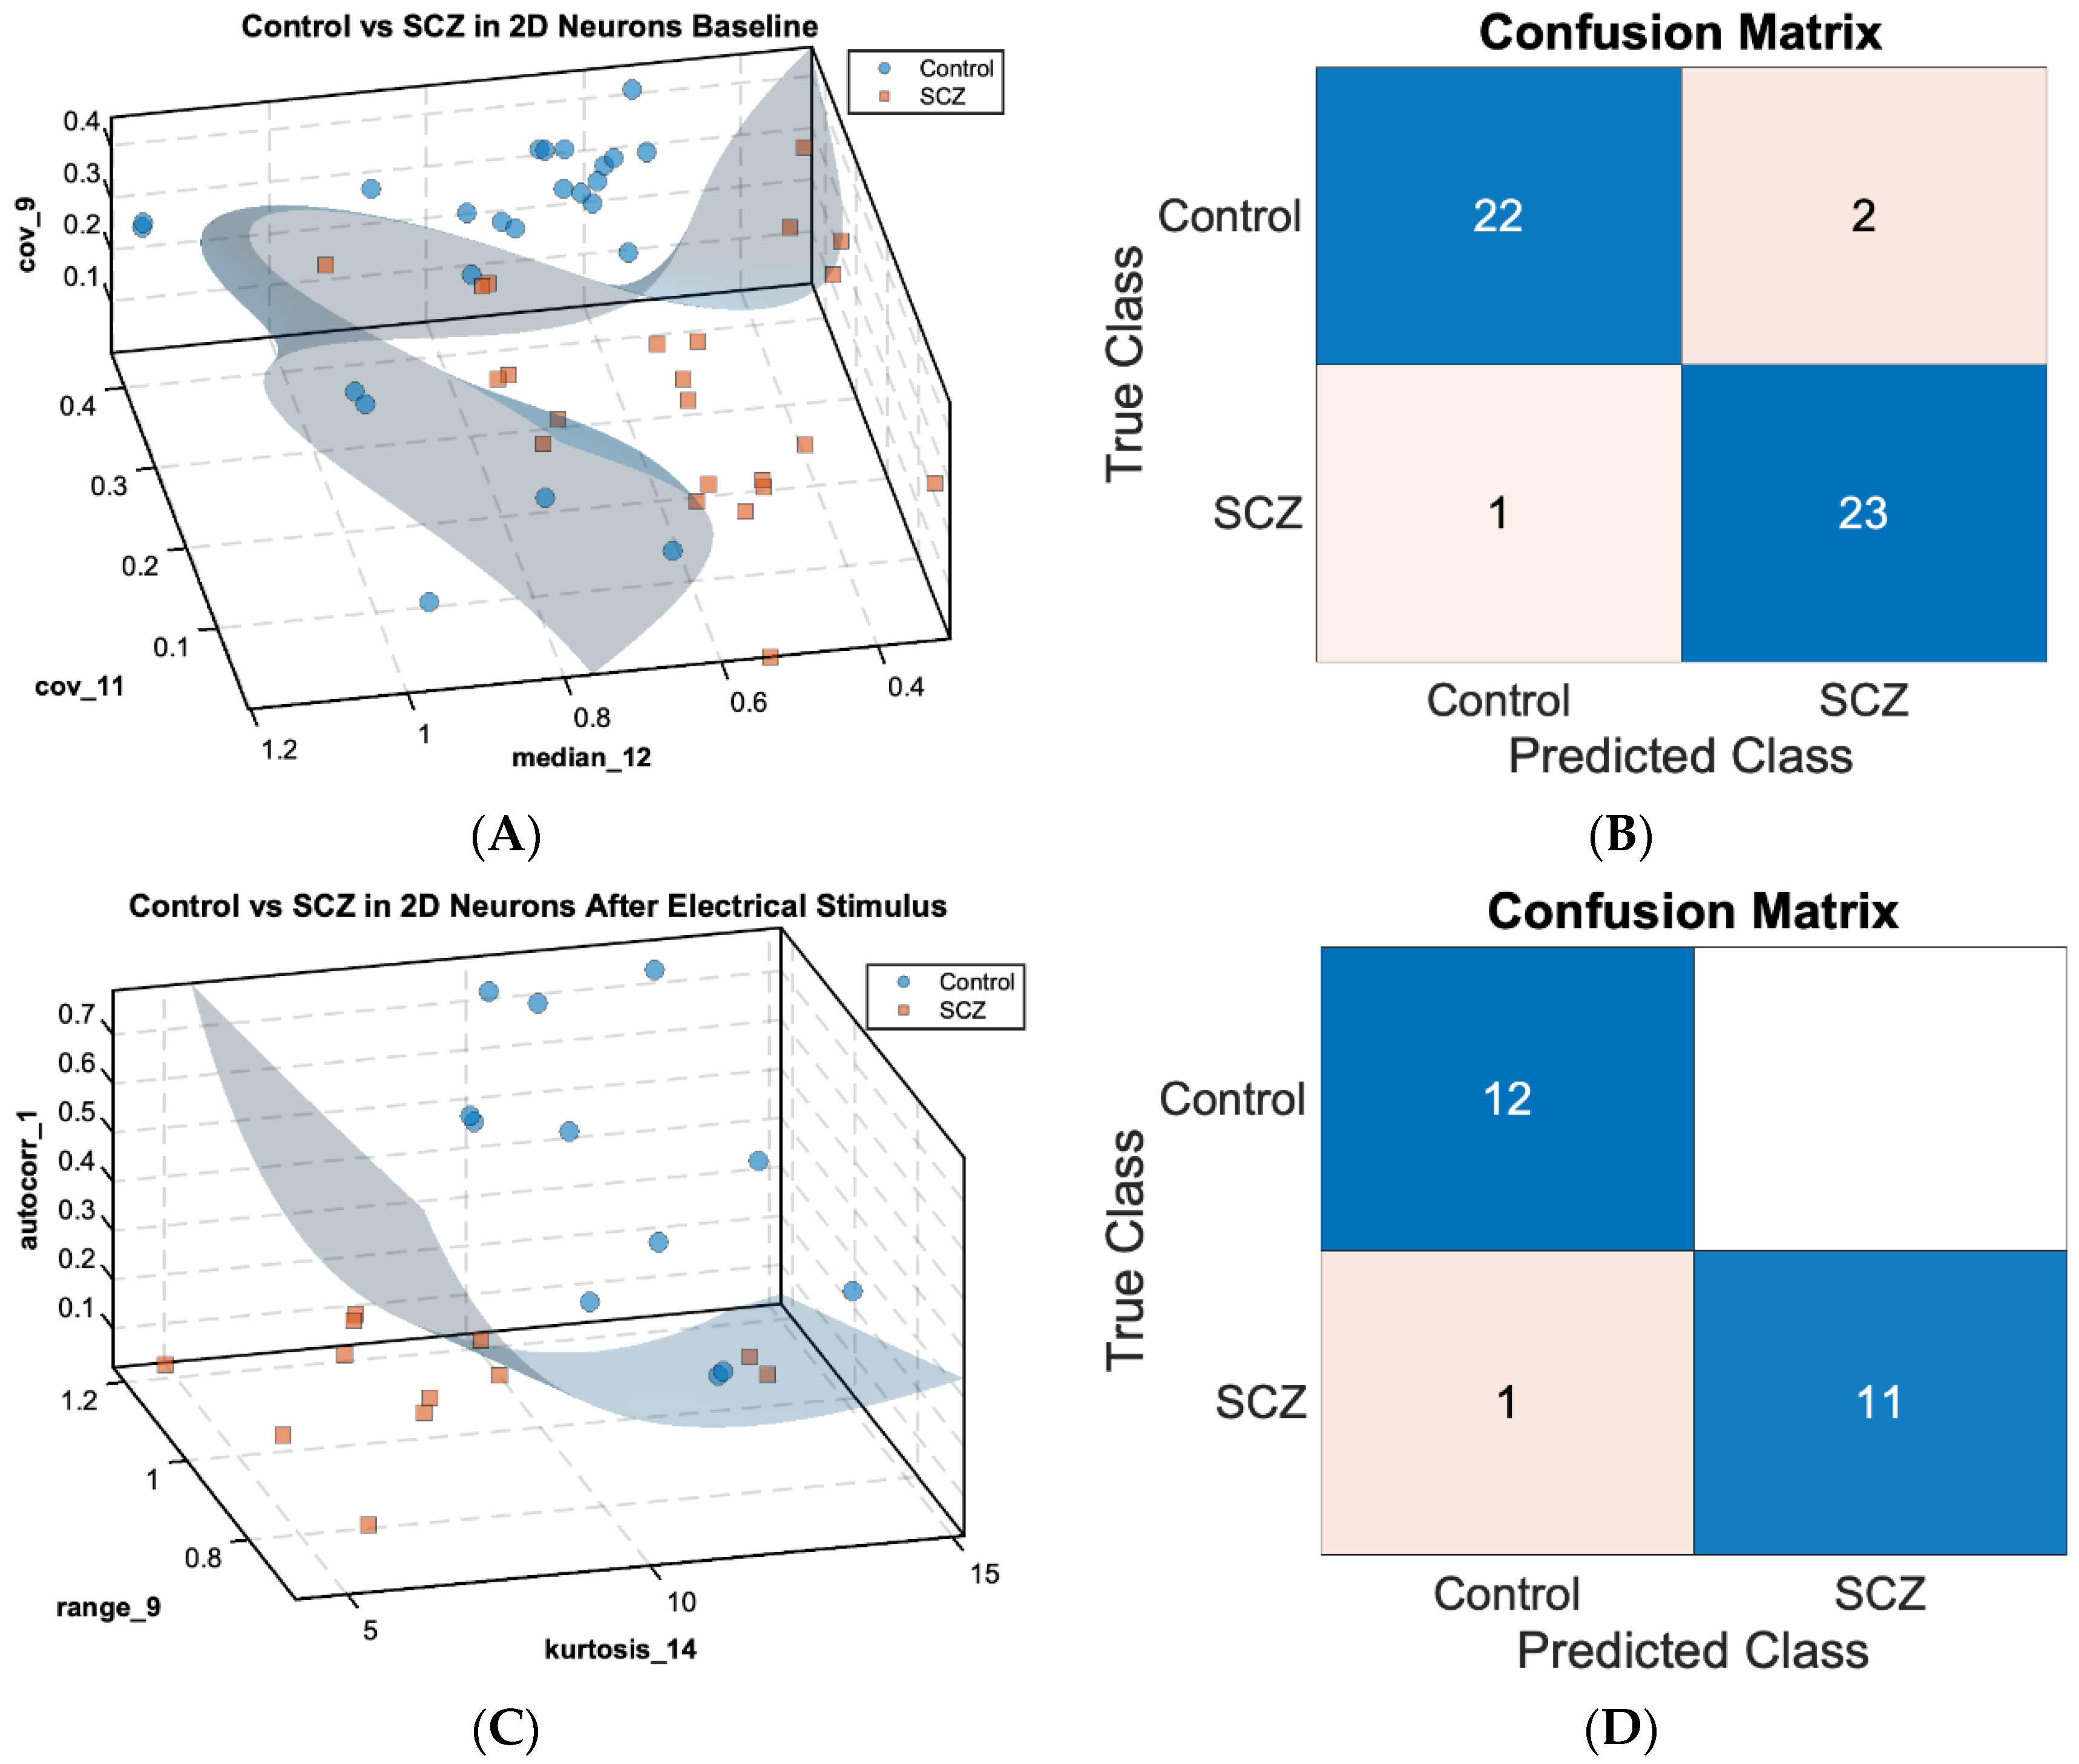
The DAP designed in this study investigates the electrophysiological properties of COs and cortical neurons in monolayer culture (2DNs) derived from patients with SCZ and BPD. Utilizing MEA and Stimulus-Response Dynamic Network Modeling (SRDNM), we analyzed neural recordings to identify influential nodes in the neural network. An extensive feature map of the sink index dynamics was computed for each channel and screened by a feature selection algorithm [20] to identify the features most significant to cohort classification. These features were then used to train a Support Vector Machine (SVM) classifier to distinguish different patient-derived organoids from healthy controls (Figure 1A,C).
Raw MEA recordings were retrieved from our previously published studies [7,8,9]. These studies compared cortical neurons in monolayer, including co-cultured excitatory and inhibitory neurons [10], derived from iPSCs from SCZ patients and healthy control individuals. Our studies also compared iPSC-derived COs from SCZ and BPD patients and healthy control individuals that were cultured for nine months. COs have increased cellular diversity and network functionality with complex electrophysiological properties which can enable a more comprehensive understanding of neural dynamics underlying neuropsychiatric disorders.
Figure 1A,C show scatterplots in a 3-dimensional feature space with the SVM decision boundary for 2DNs separating the healthy control cohort (n = 24 for baseline, n = 12 for post-electrical stimulus (PES) condition, as blue dots) versus the SCZ cohort (n = 24 for baseline, n = 12 for PES condition, as orange squares) under baseline (Figure 1A) and PES conditions (Figure 1C). The scatterplots illustrate the separation of control and SCZ neurons based on significant features of the sink index, indicating that features related to channel-wise sink index dynamics can distinguish healthy and SCZ populations with high accuracy.
In the control versus SCZ baseline (Figure 1A), three sink index features were identified as critical to cohort separation: median of channel 12 ( r = 0.86 ) and covariance of channels 9 ( r = 0.42 ) and 11 ( r = 0.45 ) , achieving a classification accuracy of 0.958. In the PES condition (Figure 1C), sink index features identified include the autocorrelation of channel 1 ( r = 0.78 ), range of channel 9 ( r = 1.22 ) , and kurtosis of channel 14 ( r = 11.4 ) , achieving the same accuracy of 0.958 in the validation test. The respective confusion matrices (Figure 1B,D) provide a visual representation of classification performance. Only three instances among the 48 samples in the baseline condition and one instance among the 24 samples in the PES conditions were misclassified, indicating a robust separation between control and SCZ classes under both paradigms.
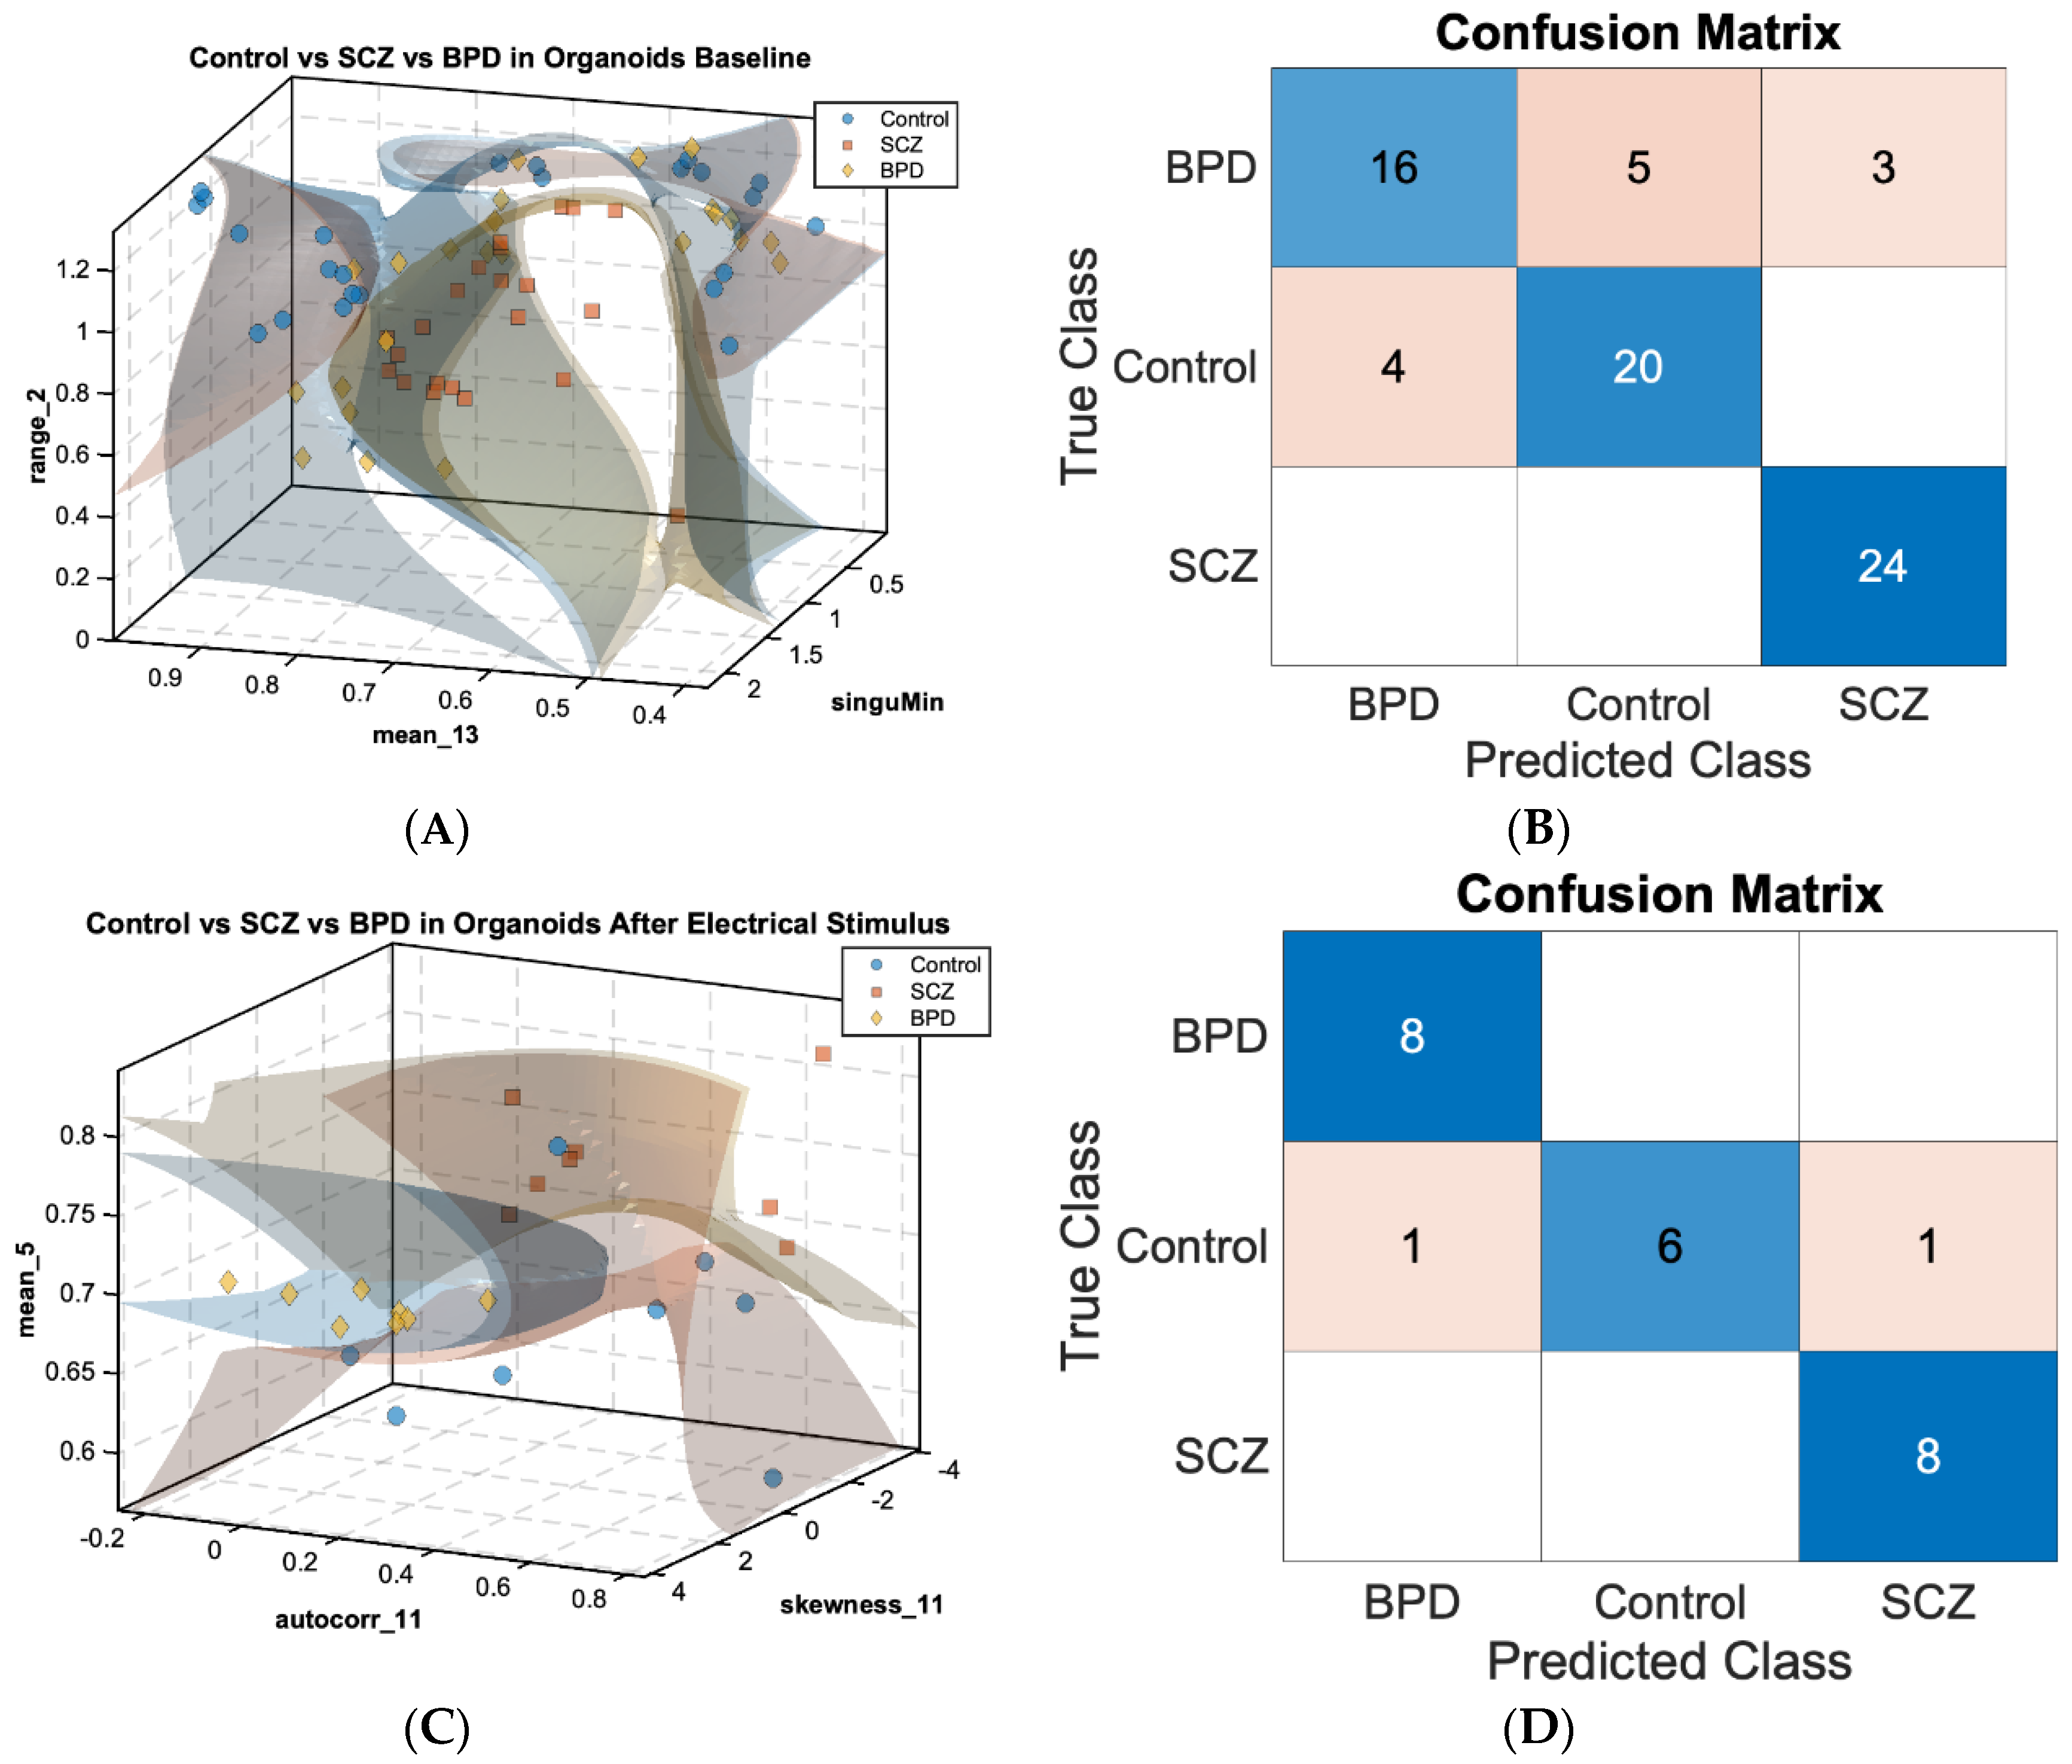
Similarly, Figure 2A,C show 3D scatterplots displaying SVM decision boundaries for the three cohorts: control (n = 24 for baseline, n = 8 for PES condition, as blue dots), SCZ (n = 24 for baseline, n = 8 for PES condition, as orange squares), and BPD (n = 24 for baseline, n = 8 for PES condition, as yellow diamonds) in COs under the baseline (Figure 2A) and PES conditions (Figure 2C), respectively.
In the baseline condition (Figure 2A), the MRMR feature selection algorithm identified the sink index features significant to classification as the range of channel 2 ( r = 1.28 ) , mean of channel 13 ( r = 0.64 ) , and all-channel-minimum singular value ( r = 2.21 ) . These features were able to separate control, SCZ, and BPD COs with an accuracy of 0.833, despite an imbalance in cohort sizes. In the PES condition (Figure 2C), selected sink index features were the mean of channel 5 ( r = 0.27 ) , autocorrelation of channel 11 ( r = 1.13 ) , and skewness of channel 11 ( r = 8.46 ) , with a significant improvement in classification accuracy to 0.916. The respective confusion matrices (Figure 2B,D) demonstrate the classification performance. These results show that most misclassified instances under baseline conditions were distributed in the BPD class. However, we were able to improve the classification accuracy significantly in the PES condition as the BPD cohort was densely clustered in the identified feature space; only two within control cohorts among 24 instances that were misclassified as diseased cohorts. Hence, while we were not able to clearly distinguish BPD cohorts and control cohorts under baseline conditions, we were able to distinguish between healthy cohorts and disease cohorts (Control vs SCZ, Control vs BPD, SCZ vs BPD) using analyses of MEA recordings from the PES conditions.
These results demonstrate that for the 2DN and CO cohorts an SVM classifier can effectively distinguish healthy control and patient-derived organoids and neurons, utilizing extracted cellular-digital biomarkers regarding sink index features from MEA data. More importantly, symptoms of diseased cohorts were significantly manifested in the selected feature space under the PES condition for both 2DNs and COs thus we were able to distinguish more clearly among all cohorts, especially in COs. The clear separation of classes in the scatter plots and the high classification accuracy depicted in the confusion matrices underscore the potential of this DAP for identification of electrophysiological signatures associated with neuropsychiatric disorders.
The application of MEA technology in patient-derived COs offers a relevant and controlled environment for studying electrophysiological correlates of neuropsychiatric disorders. Clinical research [11,12] has identified significant barriers to the effective diagnosis and treatment of neuropsychiatric disorders, including the subjective nature of current diagnostic methods and the lack of reliable biomarkers. Given the challenge of subjective diagnostic methods [11,12], our DAP provides ways to improve diagnostic accuracy by utilizing a quantifiable and objective method for assessing neural activity. Moreover, it manages and interprets complex, high-dimensional, time-varying data using advanced machine learning techniques [13], facilitating the extraction of meaningful features that distinguish SCZ and BPD. Since traditional animal models have limitations in replicating human brain physiology [6], studies of human COs can bridge the gap between in vitro studies and clinical applications. Our study addresses the critical need for validated digital biomarkers, offering a set of objective, reproducible indicators that improve diagnostic precision and inform personalized treatment strategies.
Online Methods

This study aims to employ the SRDNM, approach and the sink index to identify features as biomarkers to classify healthy controls from patients with schizophrenia or bipolar disorder. These methodologies will utilize data derived from MEA recordings to uncover distinct neural activity patterns associated with these psychiatric conditions.

Data Preprocessing

Electrophysiological recordings were obtained from COs derived from patients with SCZ and BPD using MEA. Preprocessing involved several steps to ensure high-quality spike train data for analysis: first, the raw data were bandpass filtered between 0.5 and 3000 Hz using a fourth-order Butterworth filter and notch filtered at 60 Hz (and harmonics) with a 2 Hz stopband to remove power line noise. Spike times were identified by appending the frequency-adjusted index of the peak voltage during each spiking period to the start time of the spiking period. These spike times were used to populate a binarized time series (with 1 at each spike time). The spike train data were then down sampled to 1 kHz by re-registering the time of each spike to the corresponding index in the downsampled paradigm. In case of spike collocation, the spike marker at the designated time was incremented. Finally, the spike train was rate coded by calculating the average spike count over a sliding window of 200 milliseconds.

Stimulus-Response Dynamic Network Modeling

Stimulus-response dynamic network models (SRDNMs) were used to capture the stimulus-response relationships [18] in the neural network of COs. The model notation includes time t = 1 ,   2 ,   3 ,   in milliseconds,   n t   R L as an L - dimensional vector of neural firing rate measurements, u t R K as a K - dimensional vector of electrical stimulation inputs, and w t R L as an L - dimensional vector of Gaussian white noise [16].
The state evolution equation is given by:
n t + 1 = A n ( t ) + B u ( t ) + w ( t )
where A R L × L is the state transition matrix that captures how current neural activity affects future activity and B R L × K captures the influence of stimulation.
The matrix A in the SRDNMs represents the connectivity of the network, where each element A i j signifies the influence of node j on node i . The A matrix thus encapsulates the dynamic interactions among nodes in the network, with rows representing the influence received by a node and columns representing the influence exerted by a node [19].

Extracting Features from SRDNMs

After estimating SRDNMs from the data, sink index features were extracted from the state transition matrix A in equation (1) to characterize the network properties of COs. While sources are nodes that highly influence other nodes while not themselves receiving high influence, sinks are nodes that receive high influence from other nodes but do not themselves highly influence other nodes. The ideal sink is defined as a node that receives maximal influence from all the other nodes in the network but does not impact the future activity of them, which means it will have nearly all zeros in its column vector in the A matrix while having large absolute value in its row vector.
By computing the sum of the absolute values across its row and column in the state transition matrix A , the amount of influence to and from the channel was quantified, showing each channel’s sink characteristics. Then channels are ranked based on the row sums with the highest sum (most influenced) gets the highest rank, which is N , and these row ranks are normalized by the number of channels. Similarly, channels are also ranked based on the column sums with the highest sum (most influential) gets the highest rank and these column ranks are also normalized.
The sink index s i n k i measures the distance between channel i and the ideal sink, which is defined as a channel whose normalized row rank is equal to 1 and normalized column rank is equal to 1 N , and is computed as:
s i n k i = 2 ( r i , , c i ) ( 1 , 1 N ) 2
where r i is the row rank of channel i and c i is the column rank of channel i in terms of influence from and to the rest of the network, and N is the number of MEA channels. The larger the sink index, the more likely the channel is a sink [19].
The sink index was used to construct a 2D sink representation for each network, and a feature map including all the statistical features of the sink index was computed for each channel and fed to a feature selection algorithm.

Feature Selection Using MRMR

The minimum redundancy maximum relevance (MRMR) feature selection framework [20] was employed to identify the most informative features from the SRDNM. MRMR optimizes feature selection by maximizing relevance to the response variable while minimizing redundancy among the features selected. Features were ranked such that the mutual information with the class labels was maximized while the mutual information between potential features was kept to a minimum. A subset of features that passed the MRMR criterion were selected for further analysis and cohorts’ classification.

Cohorts Classification

To classify the COs data, we utilized a Support Vector Machine (SVM) classifier. The selected features from the MRMR framework were used as input to the SVM. The SVM aims to find the optimal hyperplane that maximizes the margin between different classes. In our case, the classes represent different patient-derived organoids, including SCZ and BPD.
The classification process involved the following steps: first, the data were split into training and testing sets. The training set was used to train the SVM model, and the testing set was used to evaluate its performance. A Bayesian optimization with cross-validation was performed to tune the hyperparameters of the SVM, including the kernel type (linear, polynomial, or radial basis function) and regularization parameter. The performance of the SVM classifier was assessed using validation loss, accuracy, precision, recall, and F1-score. The results demonstrated that the SVM classifier, combined with the selected features, effectively distinguished between the different classes of COs, providing valuable insights into the electrophysiological properties associated with neuropsychiatric disorders.

Code Availability

The rate coded SRDNM of MEA recording analysis are available free and open source (https://github.com/ckhdd/RateCoded_MEA_Analysis).

Supplementary Materials

Online Methods.

Data Availability Statement

Requests for additional study data will be evaluated by the corresponding author upon request.

Acknowledgments

Dr. Karmacharya was funded by grants from the NIH (MH113858; MH086846).

Conflicts of Interest

The authors have declared no competing interest.

References

  1. Bray, N. J. & O’Donovan, M. C. The genetics of neuropsychiatric disorders. Brain Neurosci Adv 2, (2019).
  2. Schizophrenia. National Institute of Mental Health (NIMH).
  3. Lancaster, M. A. & Knoblich, J. A. Generation of cerebral organoids from human pluripotent stem cells. Nat. Protoc. 9, 2329–2340 (2014).
  4. Passaro, A. P. & Stice, S. L. Electrophysiological Analysis of Brain Organoids: Current Approaches and Advancements. Front. Neurosci. 14, 622137 (2020).
  5. Trujillo, C. A. et al. Complex Oscillatory Waves Emerging from Cortical Organoids Model Early Human Brain Network Development. Cell Stem Cell 25, 558–569.e7 (2019).
  6. Eichmüller, O. L. & Knoblich, J. A. Human cerebral organoids — a new tool for clinical neurology research. Nat. Rev. Neurol. 18, 661–680 (2022).
  7. Kathuria, A. et al. Transcriptomic landscape and functional characterization of induced pluripotent stem cell–derived cerebral organoids in schizophrenia. JAMA Psychiatry 77, 745–754 (2020).
  8. Kathuria, A. et al. Transcriptome analysis and functional characterization of cerebral organoids in bipolar disorder. Genome Med. 12, 34 (2020).
  9. Kathuria, A. et al. Synaptic deficits in iPSC-derived cortical interneurons in schizophrenia are mediated by NLGN2 and rescued by N-acetylcysteine. Transl. Psychiatry 9, 321 (2019).
  10. Kathuria, A., Lopez-Lengowski, K., Watmuff, B. & Karmacharya, R. Comparative Transcriptomic Analysis of Cerebral Organoids and Cortical Neuron Cultures Derived from Human Induced Pluripotent Stem Cells. Stem Cells Dev. 29, 1370–1381 (2020).
  11. Taslim, S. et al. Neuropsychiatric Disorders: Bridging the Gap Between Neurology and Psychiatry. Cureus 16, e51655 (2024).
  12. Bahn, S., Noll, R., Barnes, A., Schwarz, E. & Guest, P. C. Challenges of introducing new biomarker products for neuropsychiatric disorders into the market. Int. Rev. Neurobiol. 101, 299–327 (2011).
  13. Iyortsuun, N. K., Kim, S.-H., Jhon, M., Yang, H.-J. & Pant, S. A Review of Machine Learning and Deep Learning Approaches on Mental Health Diagnosis. Healthcare (Basel) 11, (2023).
  14. Li, A. et al. Neural fragility as an EEG marker of the seizure onset zone. Nat. Neurosci. 24, 1465–1474 (2021).
  15. Smith, R. J. et al. Stimulating native seizures with neural resonance: a new approach to localize the seizure onset zone. Brain 145, 3886–3900 (2022).
  16. Li, A. et al. Linear time-varying model characterizes invasive EEG signals generated from complex epileptic networks. Conf. Proc. IEEE Eng. Med. Biol. Soc. 2017, 2802–2805 (2017).
  17. McCullagh, P. Generalized Linear Models. (Champman and Hall/CRC, 2001).
  18. Beauchene, C. et al. Steering Toward Normative Wide-Dynamic-Range Neuron Activity in Nerve-Injured Rats With Closed-Loop Peripheral Nerve Stimulation. Neuromodulation 26, 552–562 (2023).
  19. Gunnarsdottir, K. M. et al. Source-sink connectivity: a novel interictal EEG marker for seizure localization. Brain 145, 3901–3915 (2022).
  20. Ding, C. & Peng, H. Minimum redundancy feature selection from microarray gene expression data. J. Bioinform. Comput. Biol. 3, 185–205 (2005).
Figure 1. (A) 3D scatter plot illustrating the separation of control and SCZ 2D neurons (2DNs) under baseline conditions using an SVM classifier at accuracy of 0.958. Sink index features, calculated by equation (2), were selected for cohort prediction by minimum redundancy maximum relevance (MRMR). Significant sink index features identified include covariance of channels 9 and 11, and median of channel 12. (B) Confusion matrix depicting classification performance of the 2DNs SVM in the baseline condition. (C) 3D scatter plot illustrating the separation of control and SCZ 2DNs post-electrical stimulation (PES) using an SVM classifier at accuracy of 0.958. Sink index features were selected for cohort prediction by MRMR. Significant sink index features identified include the autocorrelation of channel 1, range of channel 9, and kurtosis of channel 14. (D) Confusion matrix depicting classification performance of the 2DNs SVM model in the PES condition.
Preprints 115356 g001
Figure 2. (A) 3D scatter plot illustrating the separation of control, SCZ, and BPD Cerebral Organoids (COs) under baseline conditions using an SVM classifier at accuracy of 0.833. Sink index features, calculated by equation (2), were selected for cohort prediction by minimum redundancy maximum relevance (MRMR). Significant sink index features identified include the range of channel 2, the mean of channel 13, and the all-channel-minimum singular value. (B) Confusion matrix depicting classification performance of the COs SVM in the baseline condition. (C) 3D scatter plot illustrating the separation of control, SCZ, and BPD COs PES using an SVM classifier at accuracy of 0.916. Sink index features were selected for cohort prediction by MRMR. Significant sink index features identified include the mean of channel 5, autocorrelation of channel 11, and skewness of channel 11. (D) Confusion matrix depicting classification performance of the COs SVM model in the PES condition.
Preprints 115356 g002
Disclaimer/Publisher’s Note: The statements, opinions and data contained in all publications are solely those of the individual author(s) and contributor(s) and not of MDPI and/or the editor(s). MDPI and/or the editor(s) disclaim responsibility for any injury to people or property resulting from any ideas, methods, instructions or products referred to in the content.
Copyright: This open access article is published under a Creative Commons CC BY 4.0 license, which permit the free download, distribution, and reuse, provided that the author and preprint are cited in any reuse.
Prerpints.org logo

Preprints.org is a free preprint server supported by MDPI in Basel, Switzerland.

Subscribe

© 2024 MDPI (Basel, Switzerland) unless otherwise stated