Submitted:
15 August 2024
Posted:
16 August 2024
You are already at the latest version
Abstract
Keywords:
1. Introduction
2. Materials and Methods
3. Results and Discussion
3.1. Phase Composition and Grain Structure

3.2. Mechanical Properties
3.3. Deformation Mechanisms
4. Conclusions
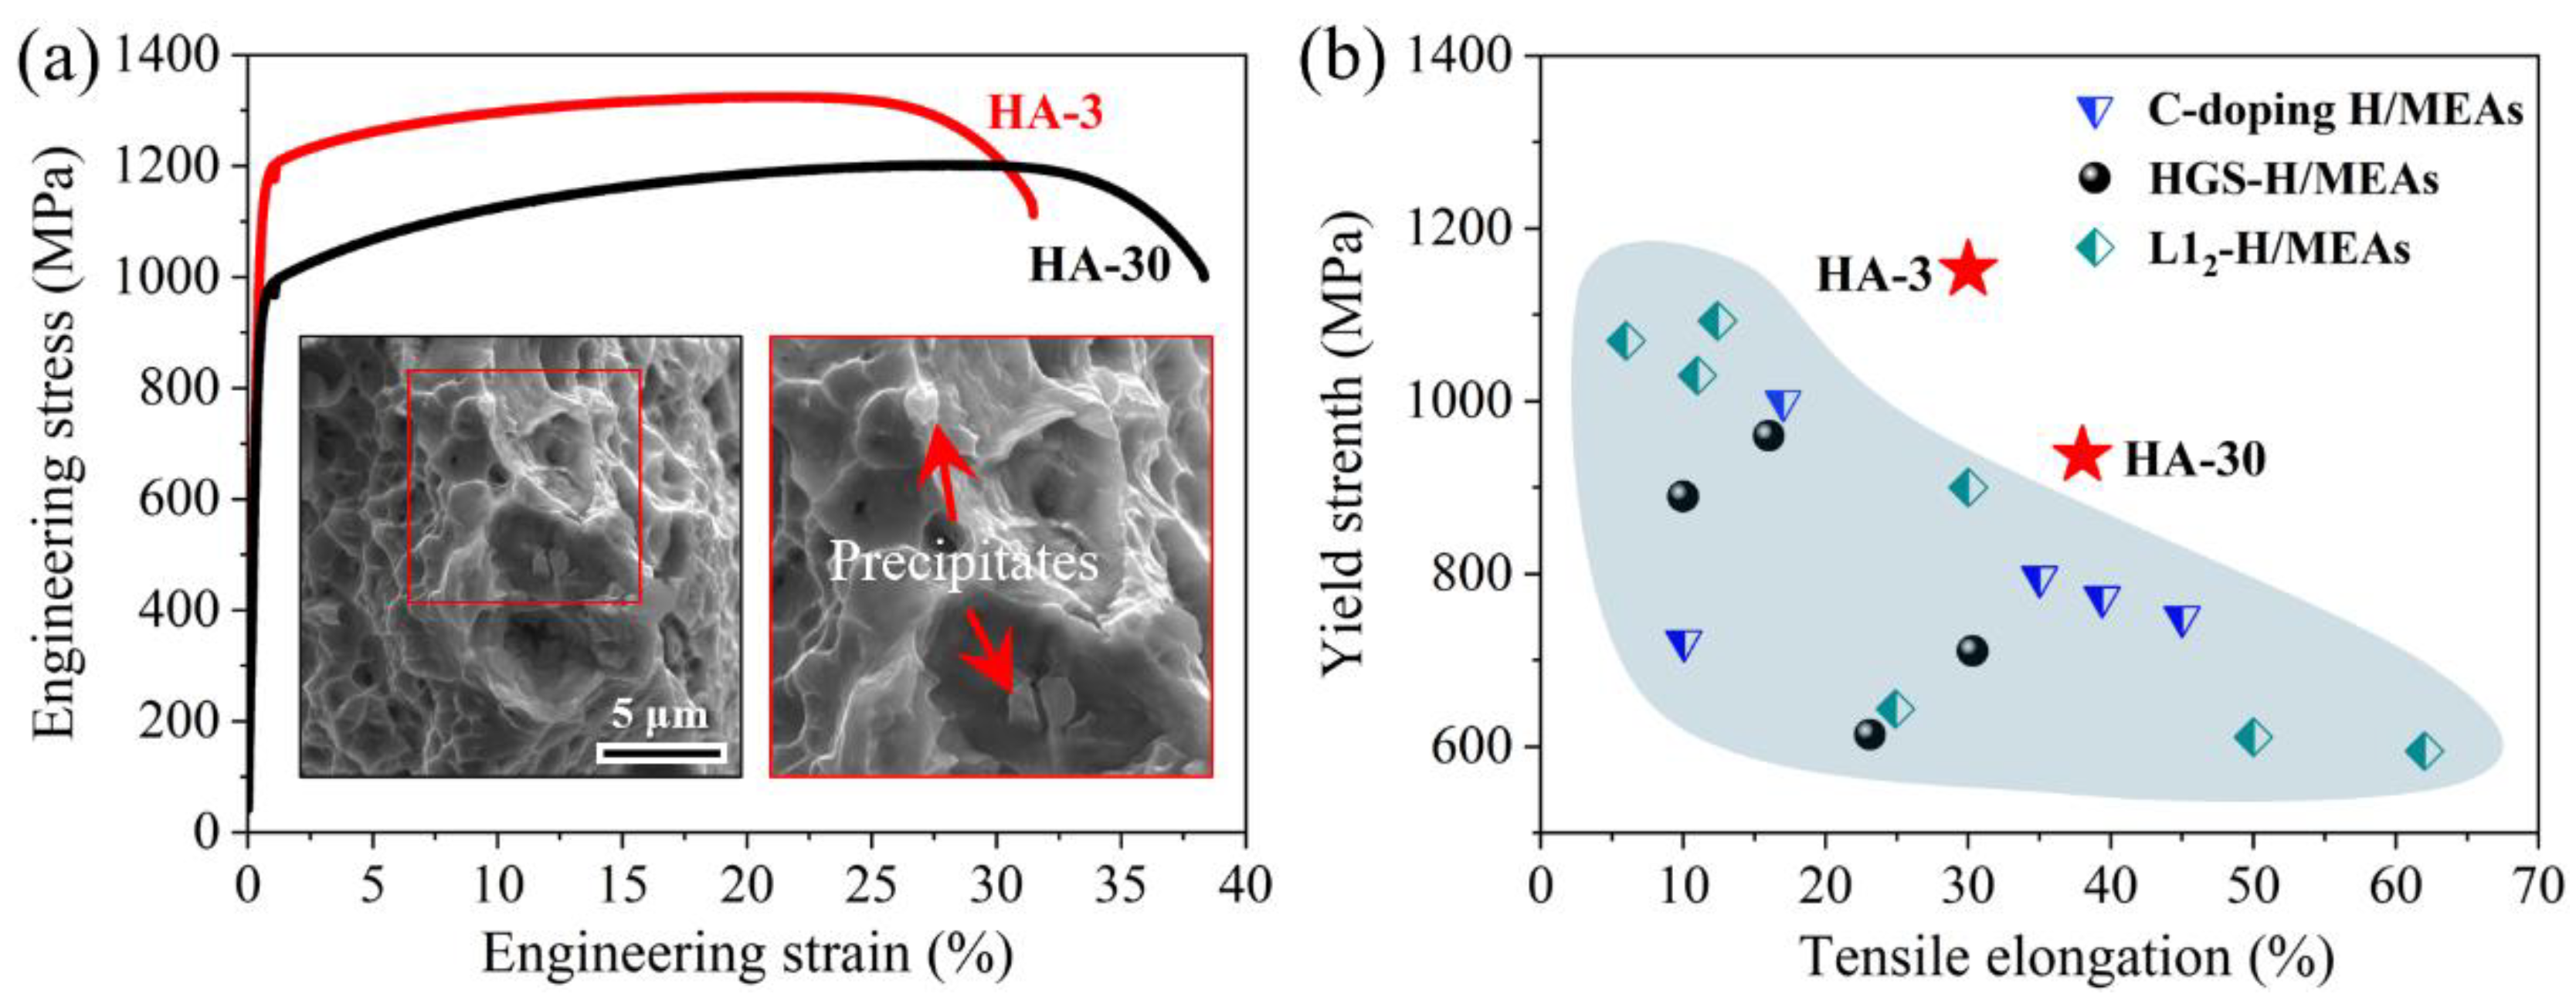
- Exceptional strength-ductility combinations were both shown in the HA-3 and HA-30 samples, with the yield strength of 1152 MPa and 937 MPa, ultimate tensile strength of 1324 MPa and 1202 MPa, and total elongation of 30% and 38%, respectively.
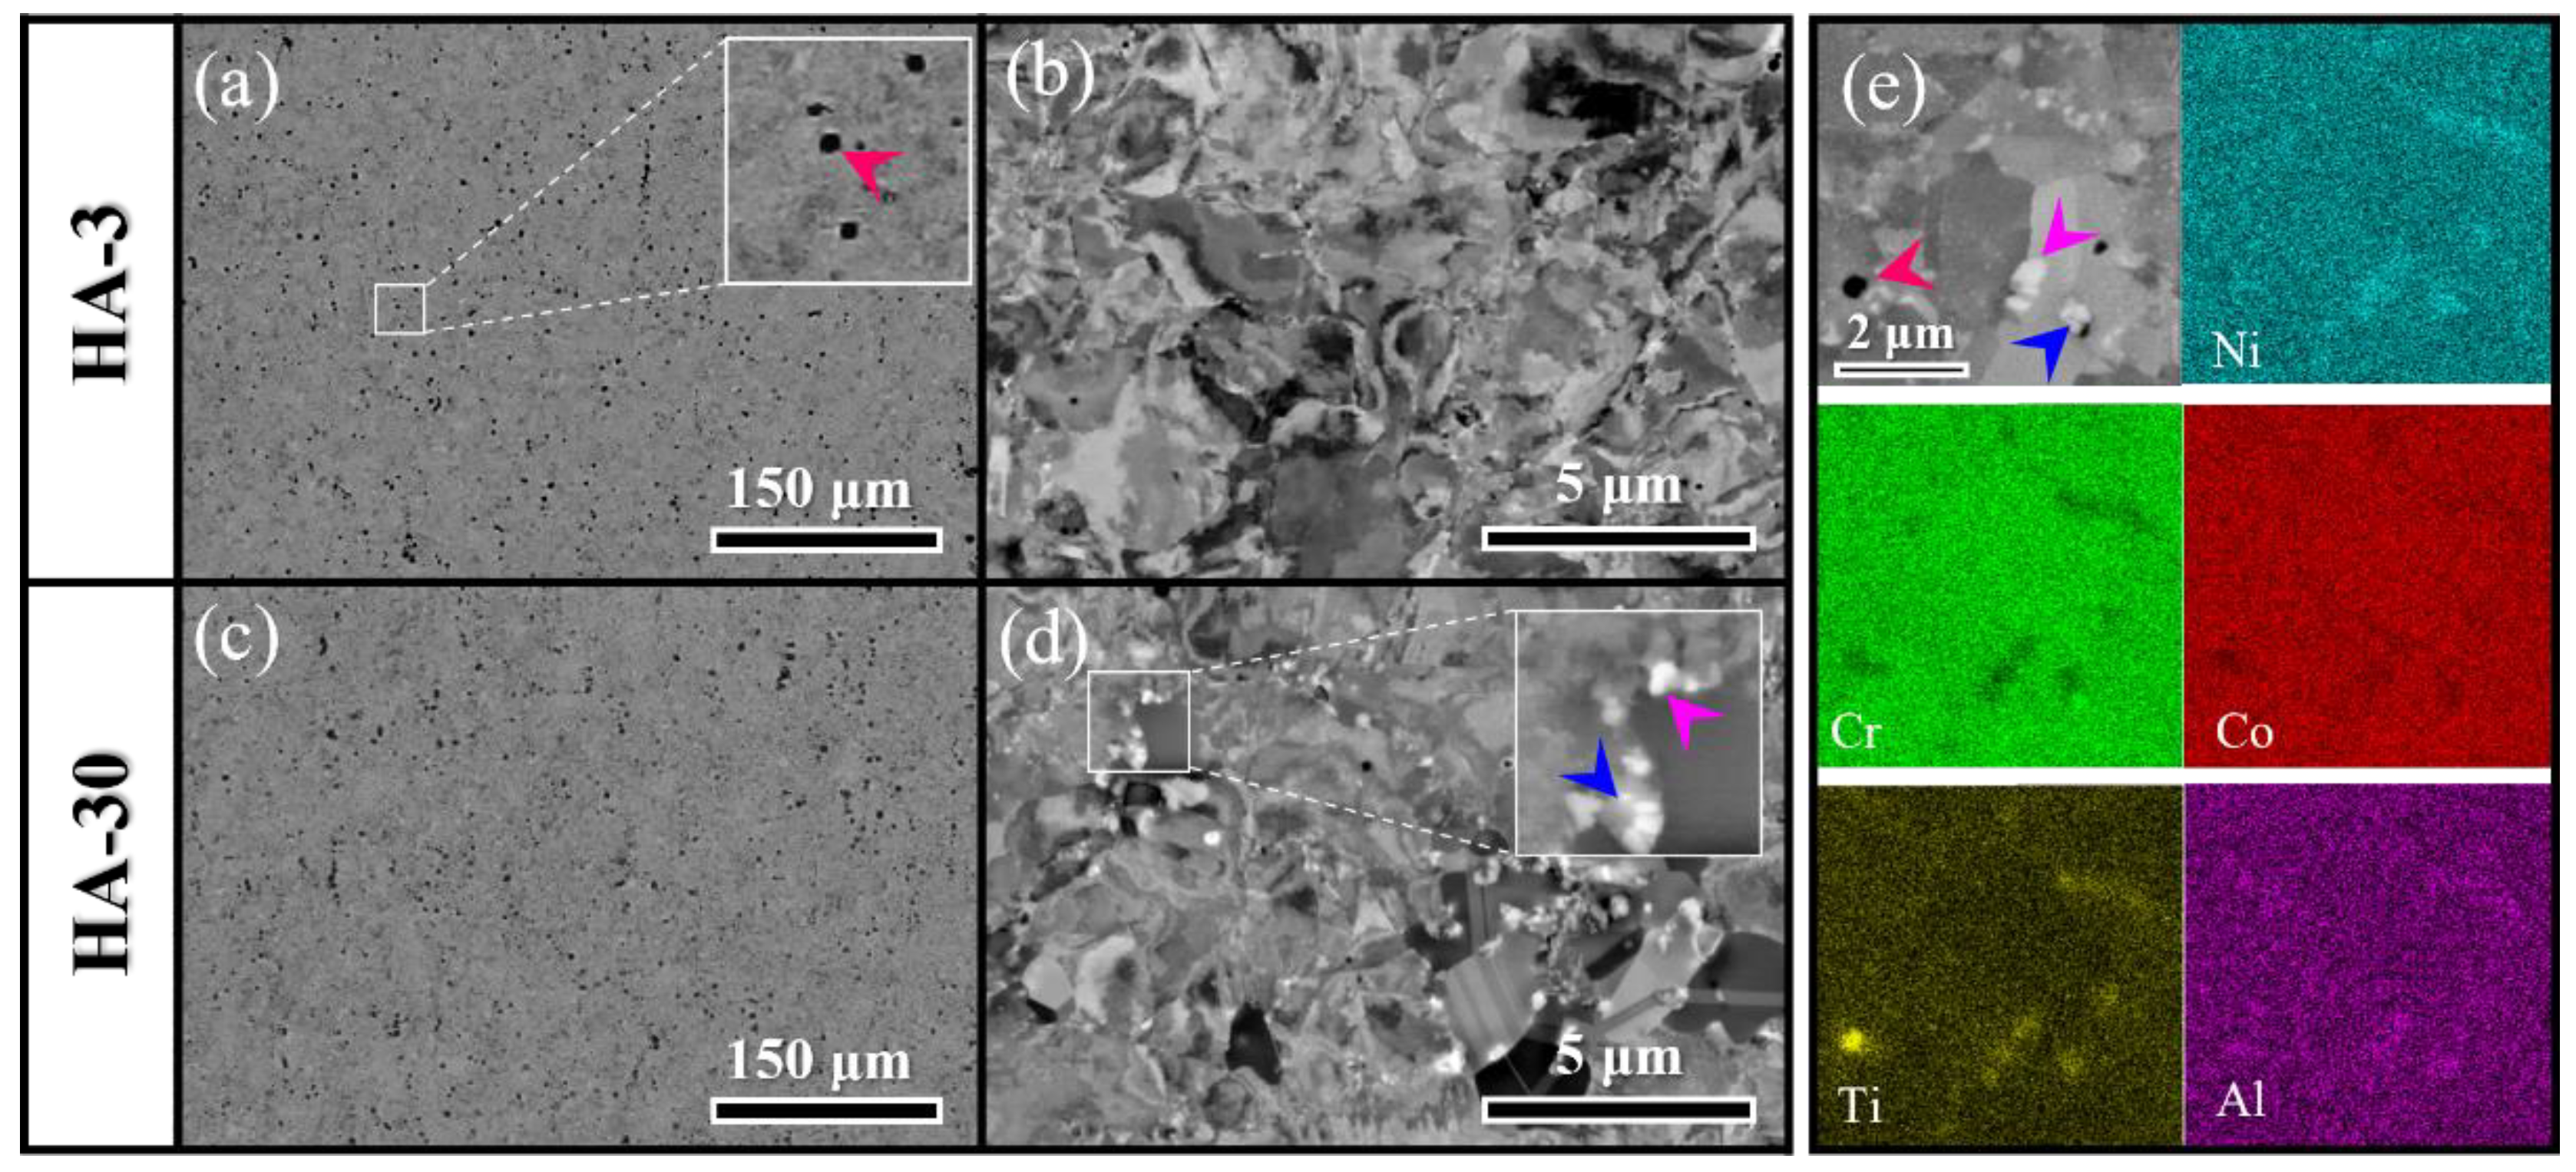
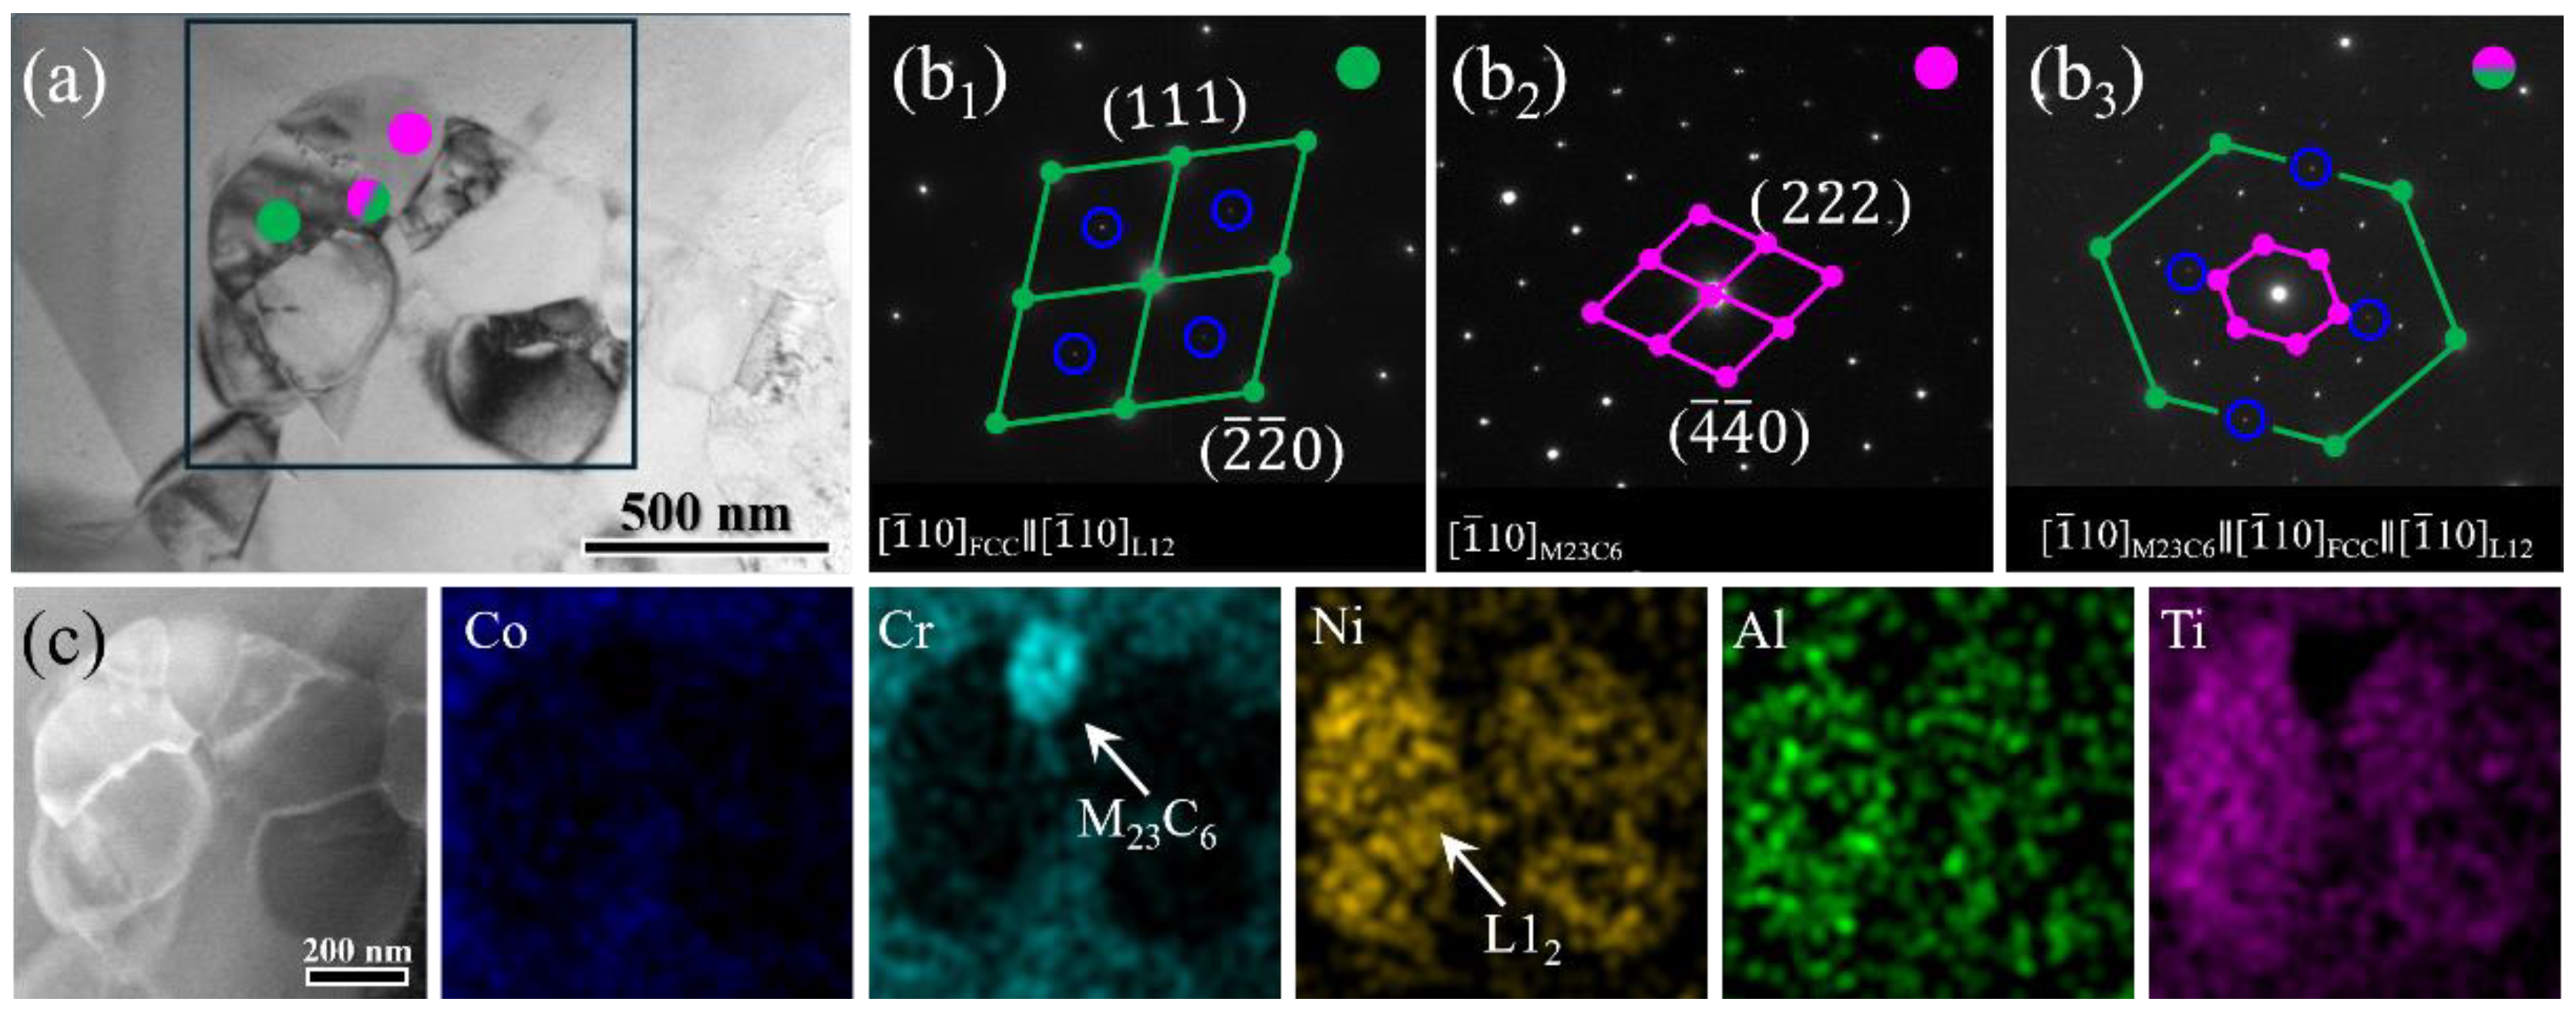
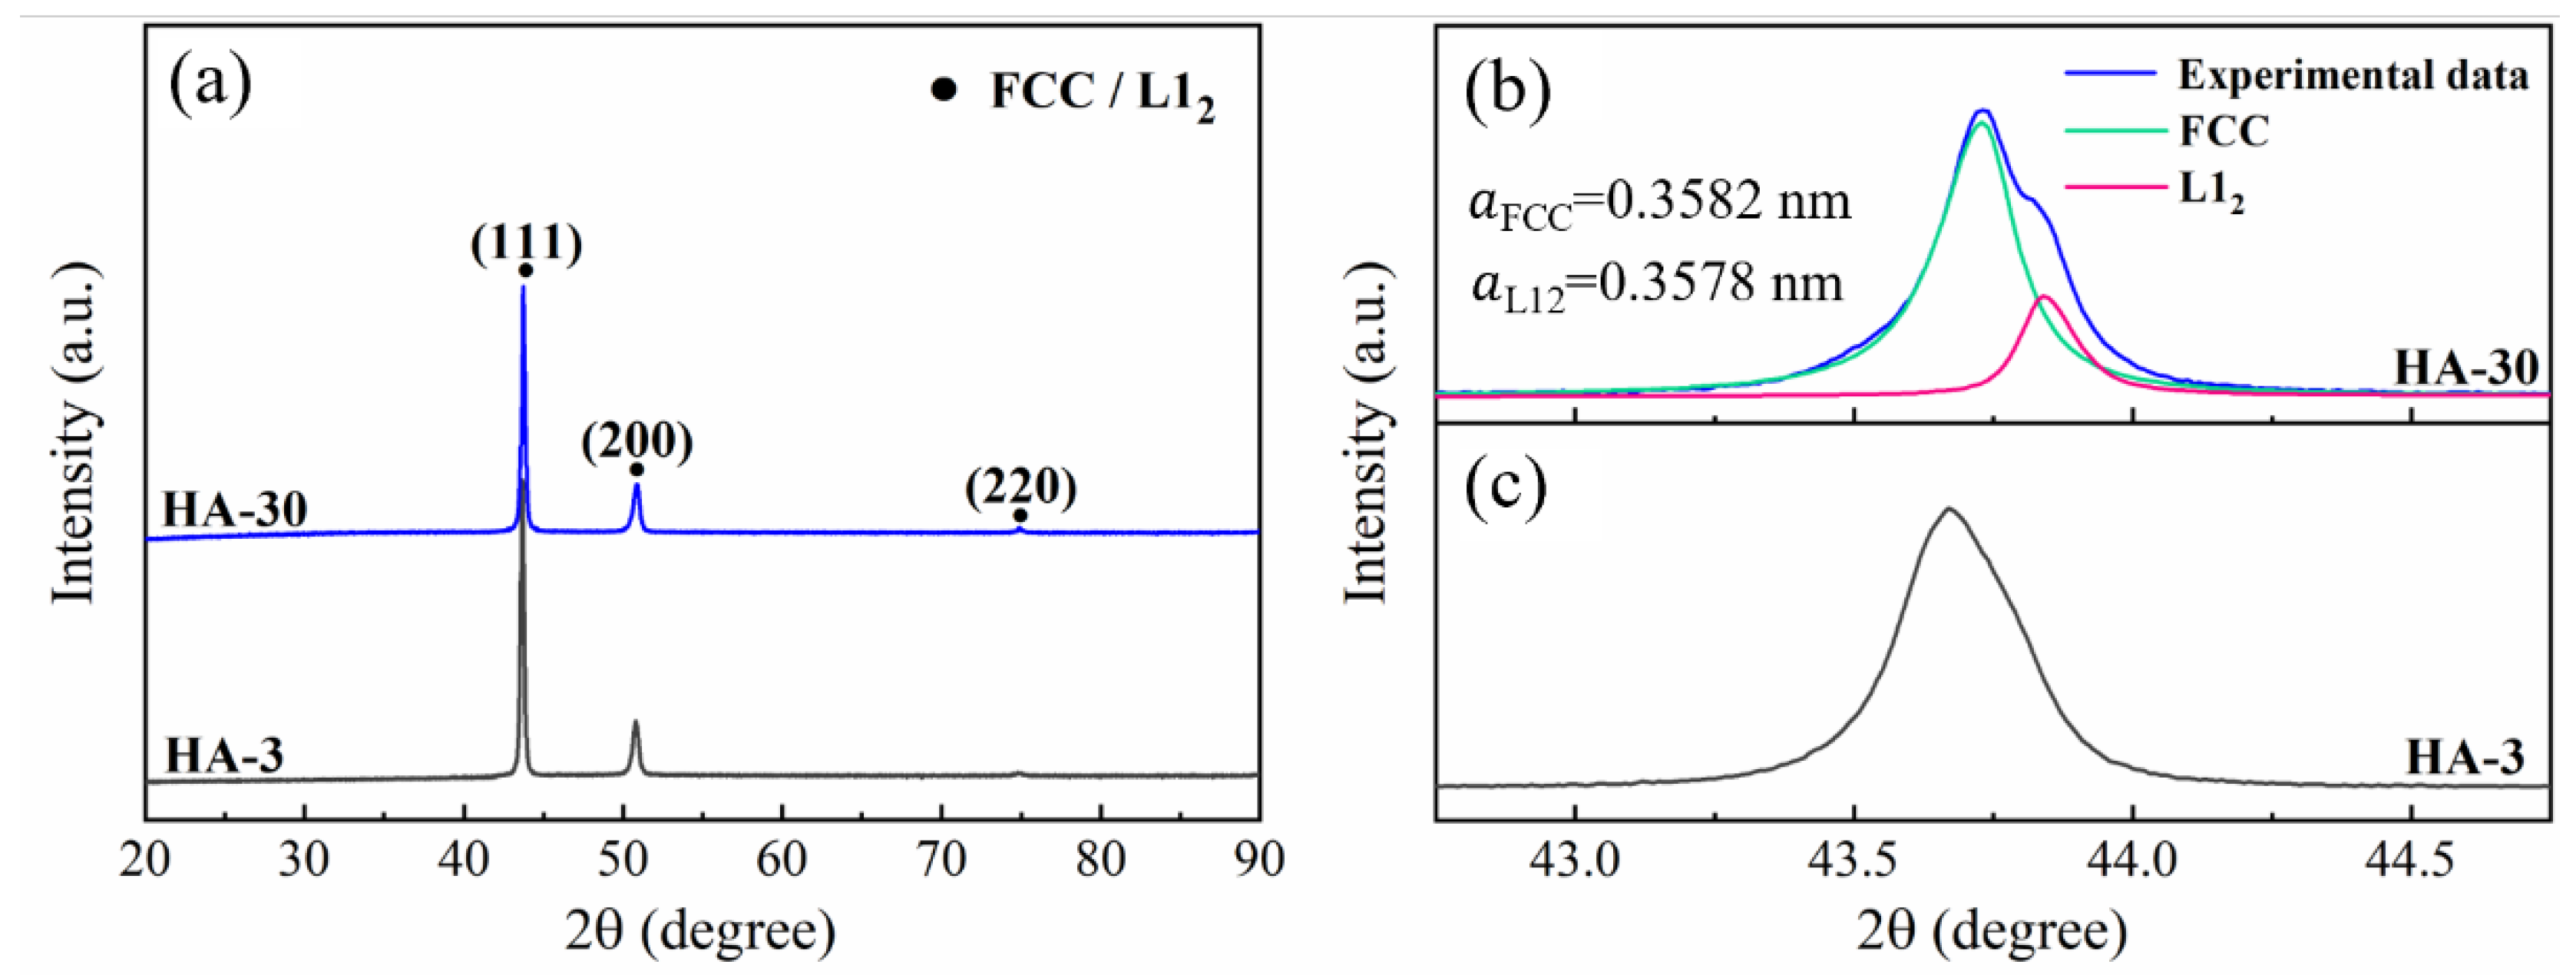
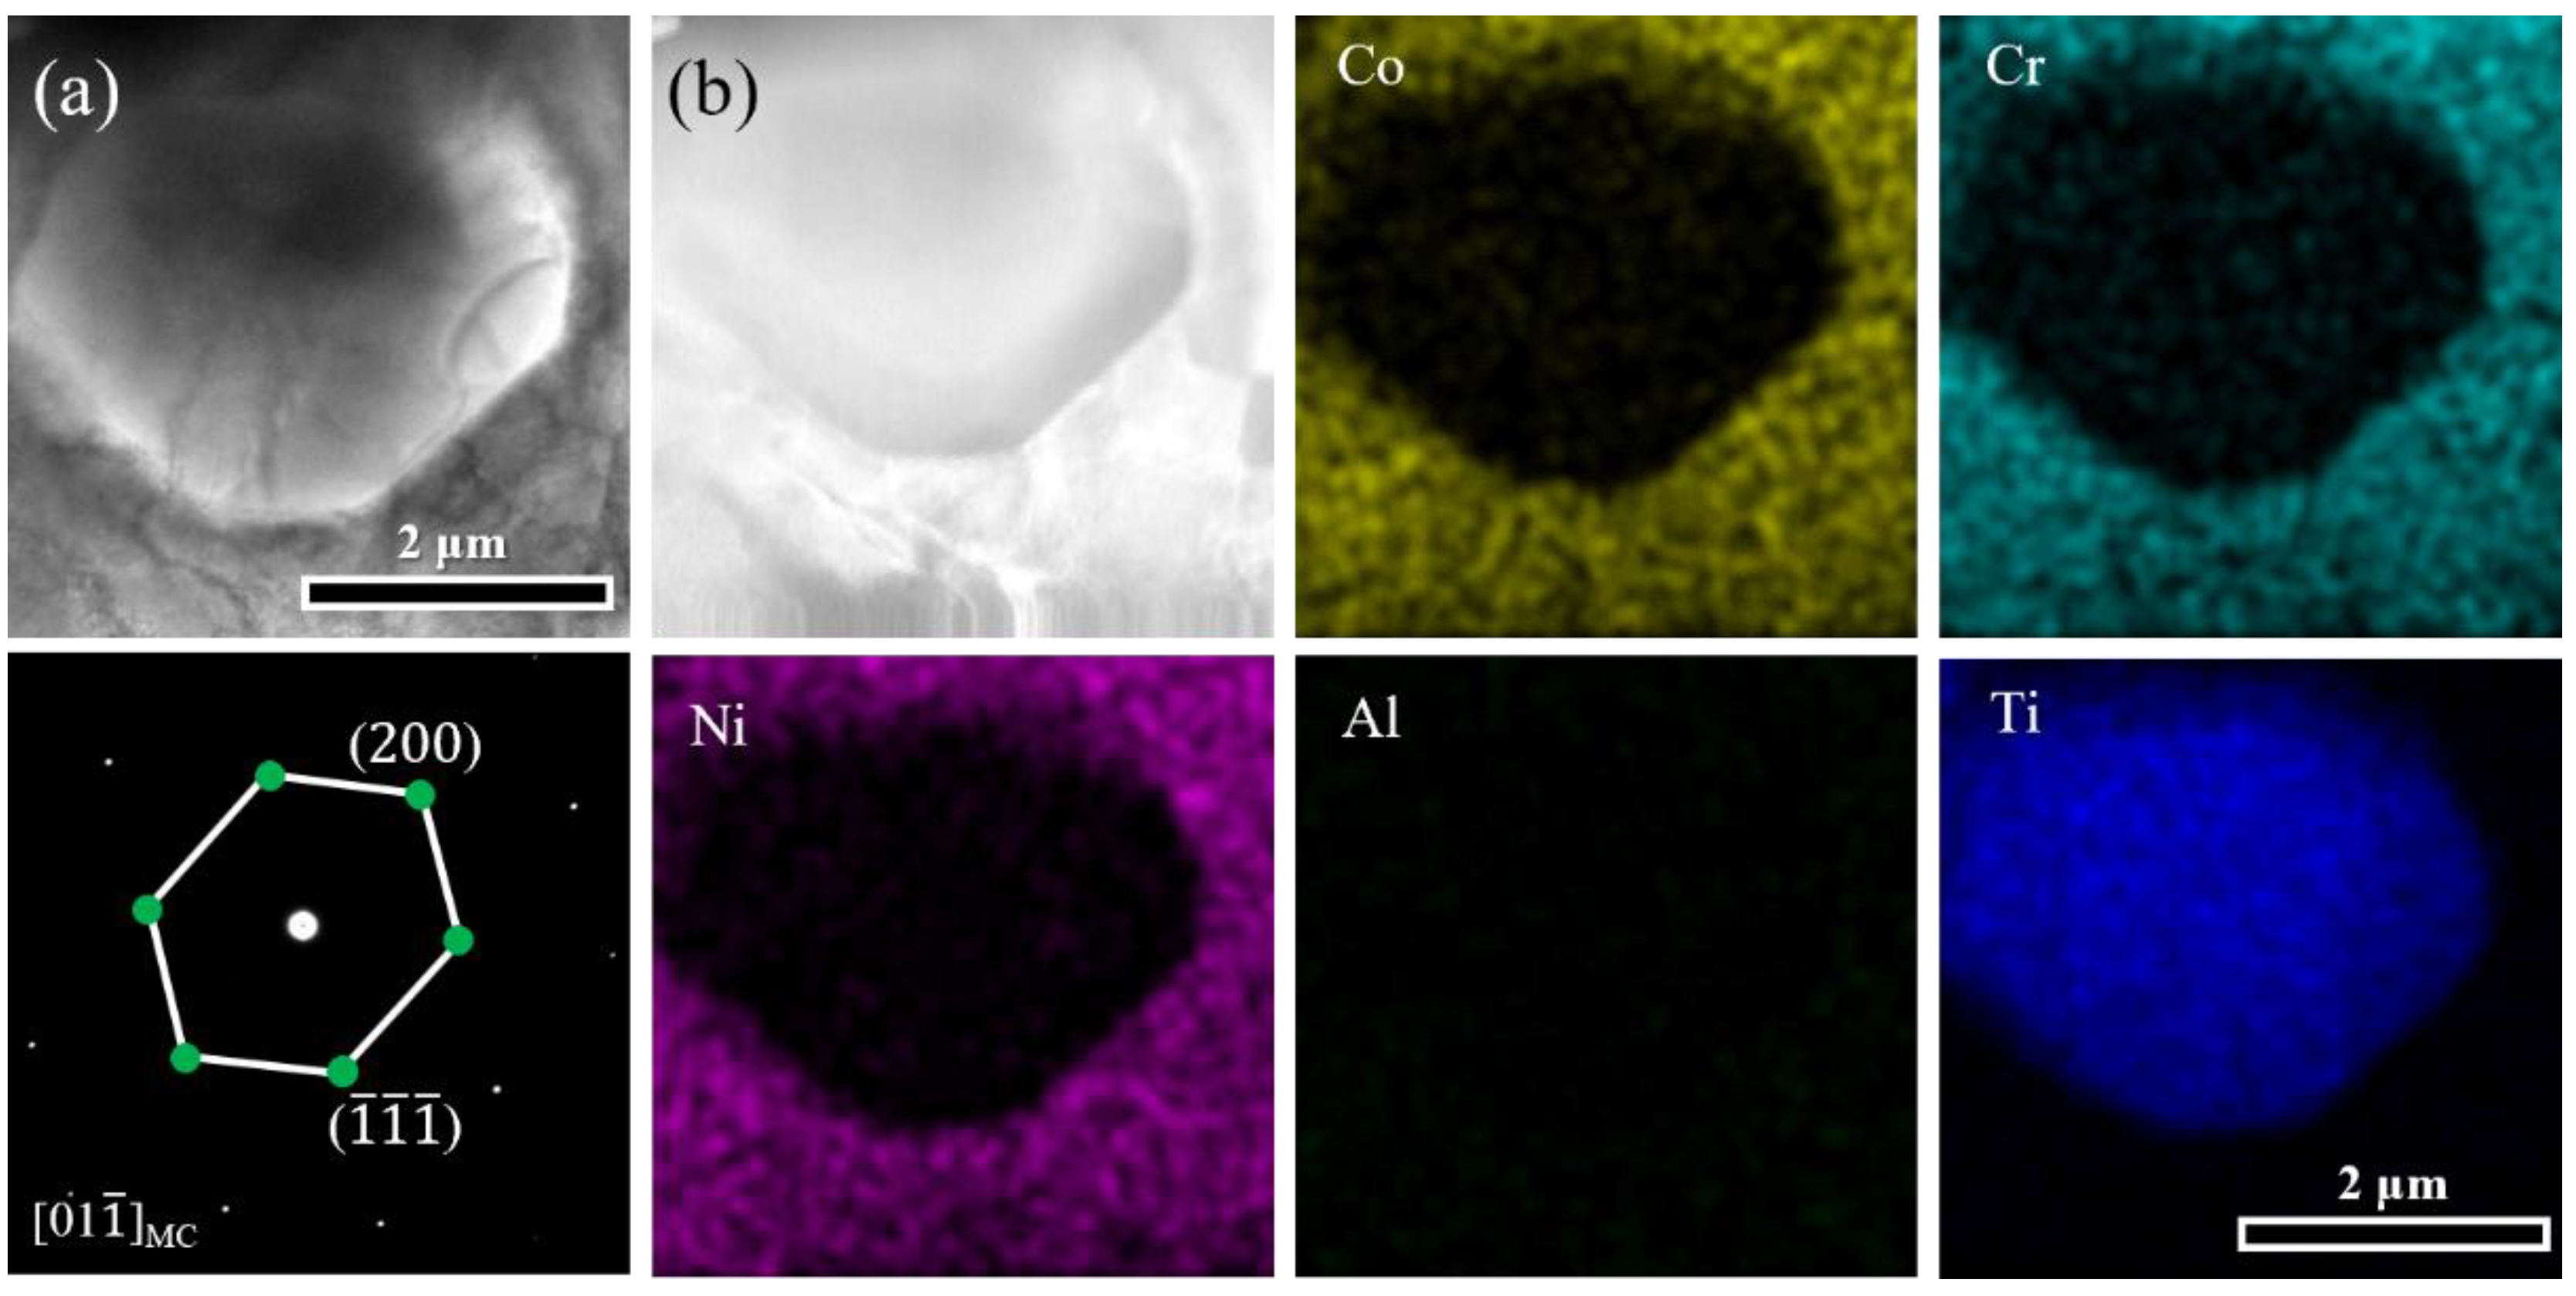
- Three kinds of intergranular precipitates including MC, M23C6 carbides, and L12 phase were detected in both the HA-3 and HA-30 samples. Note that the latter two are always distributed adjacently. It is attributed to that the preferentially formed M23C6 carbides provided favorable nucleation sites and complementary elemental environment for L12 precipitation.
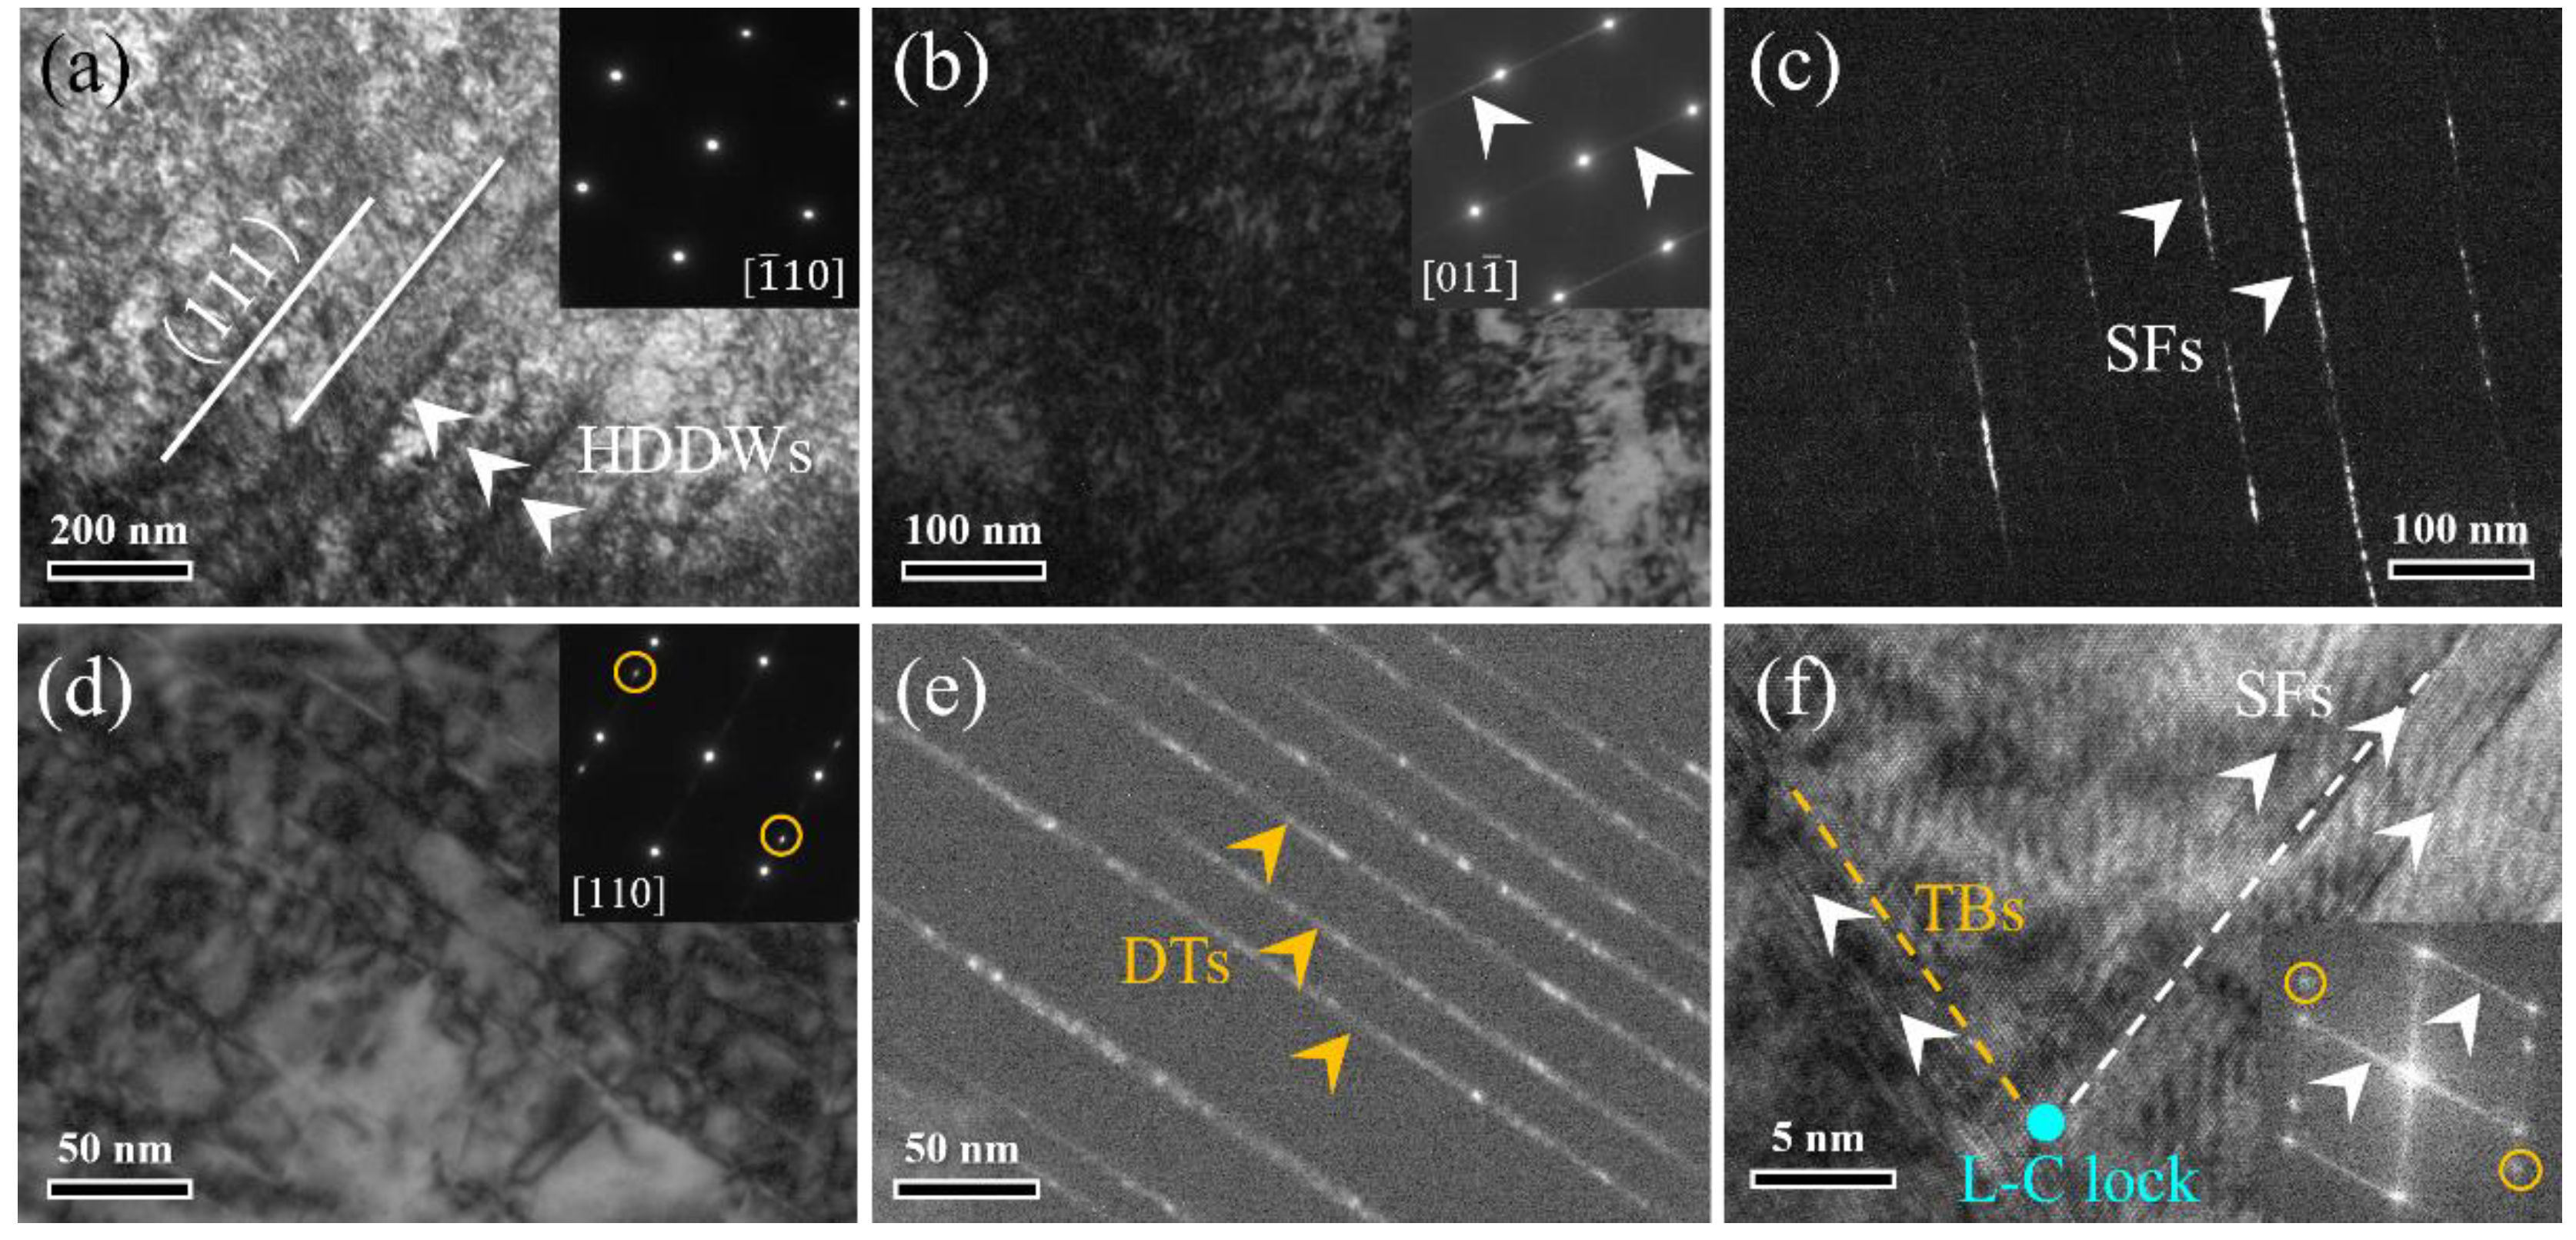
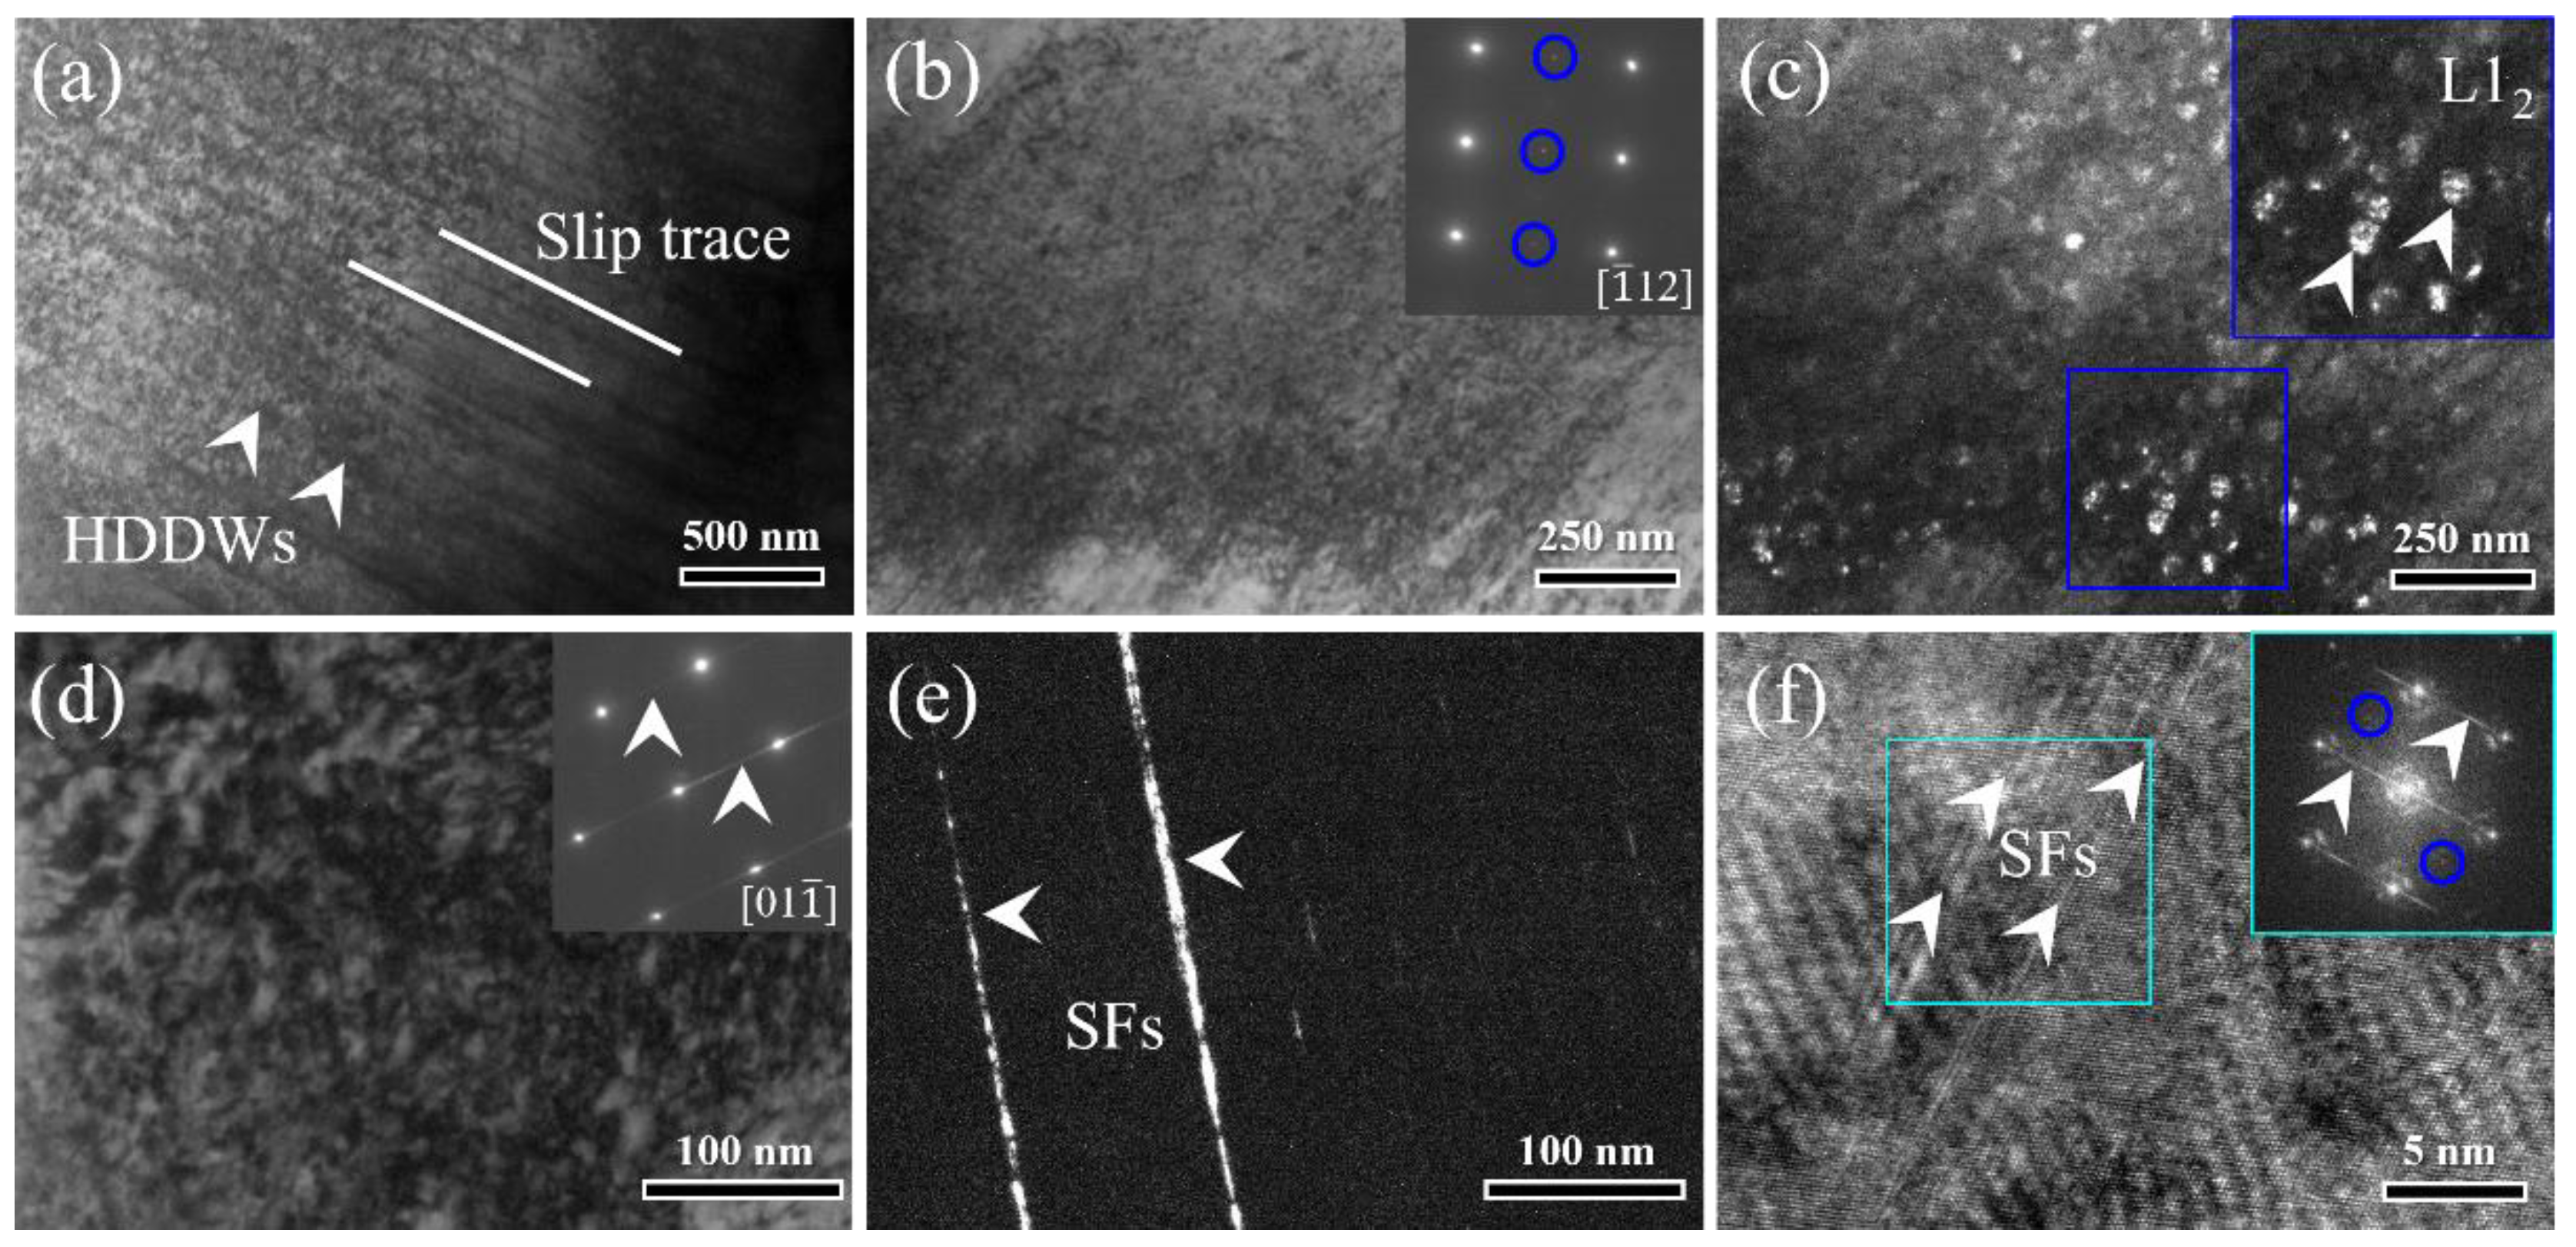
- The deformation of the HA-3 and HA-30 samples were both dominated by the plane slip mechanism, with the former being mediated by SFs and DTs, while the latter by SFs only. The absence of DTs in the HA-30 sample was related to the high-density of intragranular L12 precipitates which were absent in the HA-3 sample.
Author Contributions
Funding
Institutional Review Board Statement
Informed Consent Statement
Data Availability Statement
Conflicts of Interest
References
- Yeh, J.W.; Chen, S.K.; Lin, S.J.; Gan, J.Y.; Chin, T.S.; Shun, T.T.; Tsau, C.H.; Chang, S.Y. Nanostructured high-entropy alloys with multiple principal elements: novel alloy design concepts and outcomes. Adv. Eng. Mater. 2004, 6, 299–303. [Google Scholar] [CrossRef]
- Cantor, B.; Chang, I.T.H.; Knight, P.; Vincent, A.J.B. Microstructural development in equiatomic multicomponent alloys. Mater. Sci. Eng. A 2004, 375–377, 213–218. [Google Scholar] [CrossRef]
- Rackwitz, J.; Yu, Q.; Yang, Y.; Laplanche, G.; George, E.P.; Minor, A.M.; Ritchie, R.O. Effects of cryogenic temperature and grain size on fatigue-crack propagation in the medium-entropy CrCoNi alloy. Acta Mater. 2020, 200, 351–365. [Google Scholar] [CrossRef]
- Laplanche, G.; Kostka, A.; Reinhart, C.; Hunfeld, J.; Eggeler, G.; George, E.P. Reasons for the superior mechanical properties of medium-entropy CrCoNi compared to high-entropy CrMnFeCoNi. Acta Mater. 2017, 128, 292–303. [Google Scholar] [CrossRef]
- Gludovatz, B.; Hohenwarter, A.; Thurston, K.V.; Bei, H.; Wu, Z.; George, E.P.; Ritchie, R.O. Exceptional damage-tolerance of a medium-entropy alloy CrCoNi at cryogenic temperatures. Nat. Commun. 2016, 7, 10602. [Google Scholar] [CrossRef]
- Gludovatz, B.; Hohenwarter, A.; Catoor, D.; Chang, E.H.; George, E.P.; Ritchie, R.O. A fracture-resistant high-entropy alloy for cryogenic applications. Science 2014, 345, 1153–1158. [Google Scholar] [CrossRef]
- Chen, Y.A.; Li, D.Z.; Xie, R.F.; Lu, H.T. Dual precipitates and heterogeneous fine-grain structure induced strength-ductility synergy in a CoCrNi-based medium-entropy alloy. Mat. Sci. Eng. A. 2023, 867, 144504. [Google Scholar] [CrossRef]
- Gwalani, B.; Dasari, S.; Sharma, A.; Soni, V.; Shukla, S.; Jagetia, A.; Agrawal, P.; Mishra, R.S.; Banerjee, R. High density of strong yet deformable intermetallic nanorods leads to an excellent room temperature strength-ductility combination in a high entropy alloy. Acta Mater. 2021, 219, 117234. [Google Scholar] [CrossRef]
- Schuh, B.; Mendez-Martin, F.; Völker, B.; George, E.P.; Clemens, H.; Pippan, R.; Hohenwarter, A. Mechanical properties, microstructure and thermal stability of a nanocrystalline CoCrFeMnNi high-entropy alloy after severe plastic deformation. Acta Mater. 2015, 96, 258–268. [Google Scholar] [CrossRef]
- Zhao, Y.L.; Yang, T.; Tong, Y.; Wang, J.; Luan, J.H.; Jiao, Z.B.; Chen, D.; Yang, Y.; Hu, A.; Liu, C.T.; Kai, J.J. Heterogeneous precipitation behavior and stacking-fault-mediated deformation in a CoCrNi-based medium-entropy alloy. Acta Mater. 2017, 138, 72–82. [Google Scholar] [CrossRef]
- Wang, J.Y.; Zou, J.P.; Yang, H.L.; Dong, X.X.; Cao, P.; Liao, X.Z.; Liu, Z.L.; Ji, S.X. Ultrastrong and ductile (CoCrNi)94Ti3Al3 medium-entropy alloys via introducing multi-scale heterogeneous structures. J. Mater. Sci. Technol. 2023, 135, 241–249. [Google Scholar] [CrossRef]
- Li, Z.M. Interstitial equiatomic CoCrFeMnNi high-entropy alloys: carbon content, microstructure, and compositional homogeneity effects on deformation behavior. Acta Mater. 2019, 164, 400–412. [Google Scholar] [CrossRef]
- Guo, L.; Ou, X.Q.; Ni, S.; Liu, Y.; Song, M. Effects of carbon on the microstructures and mechanical properties of FeCoCrNiMn high entropy alloys. Mat. Sci. Eng. A. 2019, 746, 356–362. [Google Scholar] [CrossRef]
- Wang, Z.W.; Baker, I.; Cai, Z.H.; Chen, S.; Poplawsky, J.D.; Guo, W. The effect of interstitial carbon on the mechanical properties and dislocation substructure evolution in Fe40.4Ni11.3Mn34.8Al7.5Cr6 high entropy alloys. Acta Mater. 2016, 120, 228–239. [Google Scholar] [CrossRef]
- Moravcik, I.; Hornik, V.; Min´arik, P.; Li, L.L.; Dlouhy, I.; Janovska, M.; Raabe, D.; Li, Z.M. Interstitial doping enhances the strength-ductility synergy in a CoCrNi medium entropy alloy. Mater. Sci. Eng. A. 2020, 781, 139242. [Google Scholar] [CrossRef]
- Hu, G.W.; Zeng, L.C.; Du, H.; Wang, Q.; Fan, Z.T.; Liu, X.W. Combined effects of solute drag and Zener pinning on grain growth of a NiCoCr medium-entropy alloy. Intermetallics 2021, 136, 107271. [Google Scholar] [CrossRef]
- Zhang, Z.H.; Jiang, P.; Yuan, F.P.; Wu, X.L. Enhanced tensile properties by heterogeneous grain structures and coherent precipitates in a CoCrNi-based medium entropy alloy. Mater. Sci. Eng. A. 2022, 832, 142440. [Google Scholar] [CrossRef]
- Takeuchi, A.; Inoue, A. Classification of bulk metallic glasses by atomic size difference, heat of mixing and period of constituent elements and its application to characterization of the main alloying element. Mater. Trans. 2005, 46, 2817–2829. [Google Scholar] [CrossRef]
- Liu, L.Y.; Zhang, Y.; Li, J.P.; Fan, M.Y.; Wang, X.Y.; Wu, G.C.; Yang, Z.B.; Luan, J.H.; Jiao, Z.B.; Liu, C.T.; Liaw, P.K.; Zhang, Z.W. Enhanced strength-ductility synergy via novel bifunctional nano-precipitates in a high-entropy alloy. Int. J. Plast. 2022, 153, 103235. [Google Scholar] [CrossRef]
- Yang, T.; Zhao, Y.L.; Luan, J.H.; Han, B.; Wei, J.; Kai, J.J.; Liu, C.T. Nanoparticles-strengthened high-entropy alloys for cryogenic applications showing an exceptional strength-ductility synergy. Scr. Mater. 2019, 164, 30–35. [Google Scholar] [CrossRef]
- Jiang, S.H.; Wang, H.; Wu, Y.; Liu, X.J.; Chen, H.H.; Yao, M.J.; Gault, B.; Ponge, D.; Raabe, D.; Hirata, A.; Chen, M.W.; Wang, Y.W.; Lu, Z.P. Ultrastrong steel via minimal lattice misfit and high-density nanoprecipitation. Nature 2017, 544, 460–464. [Google Scholar] [CrossRef] [PubMed]
- Lukianova, O.A.; Rao, Z.; Kulitckii, V.; Li, Z.; Wilde, G.; Divinski, S.V. Impact of interstitial carbon on self-diffusion in CoCrFeMnNi high entropy alloys. Scr. Mater. 2020, 188, 264–268. [Google Scholar] [CrossRef]
- Peng, H.L.; Ling, H.; Li, L.J.; Zhang, W.P. Ripening of L12 nanoparticles and their effects on mechanical properties of Ni28Co28Fe21Cr15Al4Ti4 high-entropy alloys. Mater. Sci. Eng. A. 2020, 772, 138803. [Google Scholar] [CrossRef]
- Hu, G.W.; Zeng, L.C.; Du, H.; Liu, X.W.; Wu, Y.; Gong, P.; Fan, Z.T.; Hu, Q.; George, E.P. Tailoring grain growth and solid solution strengthening of single-phase CrCoNi medium-entropy alloys by solute selection. J. Mater. Sci. Technol. 2020, 54, 196–205. [Google Scholar] [CrossRef]
- An, N.; Sun, Y.; Wu, Y.; Tian, J.; Li, Z.; Li, Q.; Chen, J.; Hui, X. High temperature strengthening via nanoscale precipitation in wrought CoCrNi-based medium-entropy alloys. Mater. Sci. Eng. A. 2020, 798, 140213. [Google Scholar] [CrossRef]
- He, J.Y.; Wang, H.; Huang, H.L.; Xu, X.D.; Chen, M.W.; Wu, Y.; Liu, X.J.; Nieh, T.G.; An, K.; Lu, Z.P. A precipitation-hardened high-entropy alloy with outstanding tensile properties. Acta Mater. 2016, 102, 187–196. [Google Scholar] [CrossRef]
- Qin, S.; Yang, M.X.; Jiang, P.; Wang, J.; Wu, X.L.; Zhou, H.; Yuan, F.P. Designing structures with combined gradients of grain size and precipitation in high entropy alloys for simultaneous improvement of strength and ductility. Acta Mater. 2022, 230, 117847. [Google Scholar] [CrossRef]
- Wu, S.W.; Wang, G.; Wang, Q.; Jia, Y.D.; Yi, J.; Zhai, Q.J.; Liu, J.B.; Sun, B.A.; Chu, H.J.; Shen, J.; Liaw, P.K.; Liu, C.T.; Zhang, T.Y. Enhancement of strength-ductility trade-off in a high-entropy alloy through a heterogeneous structure. Acta Mater. 2019, 165, 444–458. [Google Scholar] [CrossRef]
- Fu, Z.Q.; MacDonald, B.E.; Li, Z.M.; Jiang, Z.F.; Chen, W.P.; Zhou, Y.Z.; Lavernia, E.J. Engineering heterostructured grains to enhance strength in a single-phase high-entropy alloy with maintained ductility. Mater. Res. Lett. 2018, 11, 634–640. [Google Scholar] [CrossRef]
- Gao, Q.Z.; Jiang, Y.J.; Liu, Z.Y.; Zhang, H.L.; Jiang, C.C.; Zhang, X.; Li, H.J. Effects of alloying elements on microstructure and mechanical properties of Co–Ni–Al–Ti superalloy. Mater. Sci. Eng. A. 2020, 779, 139139. [Google Scholar] [CrossRef]
- Liu, L.Y.; Zhang, Y.; Ma, J.M.; Shang, Y.X.; Han, J.H.; Li, J.P.; Zhang, Z.W. Transition of plastic deformation mechanisms governed by spacing of nano-precipitates in a high entropy alloy. Scr. Mater. 2022, 217, 114771. [Google Scholar] [CrossRef]
- Kim, J.G.; Park, J.M.; Seol, J.B.; Choe, J.; Yu, J.H.; Yang, S.S.; Kim, H.S. Nano-scale solute heterogeneities in the ultrastrong selectively laser melted carbon-doped CoCrFeMnNi alloy. Mater. Sci. Eng. A. 2020, 773, 138726. [Google Scholar] [CrossRef]
- Li, J.B.; Gao, B.; Wang, Y.T.; Chen, X.H.; Xin, Y.C.; Tang, S.; Liu, B.; Liu, Y.; Song, M. Microstructures and mechanical properties of nano carbides reinforced CoCrFeMnNi high entropy alloys. J. Alloys Compd. 2019, 792, 170–179. [Google Scholar] [CrossRef]
- Gerold, V.; Karnthaler, H.P. On the orgin of planar slip of F.C.C. alloys. Acta Metall. 1989, 37, 2177–2183. [Google Scholar] [CrossRef]
- Zhang, R.; Zhao, S.; Ding, J.; Chong, Y.; Jia, T.; Ophus, C.; Asta, M.; Ritchie, R.O.; Minor, A.M. Short-range order and its impact on the CrCoNi medium-entropy alloy. Nature 2020, 581, 283–287. [Google Scholar] [CrossRef]
- Miao, J.; Slone, C.; Dasari, S.; Ghazisaeidi, M.; Banerjee, R.; George, E.P.; Mills, M.J. Ordering effects on deformation substructures and strain hardening behavior of a CrCoNi based medium entropy alloy. Acta Mater. 2021, 210, 116829. [Google Scholar] [CrossRef]
- Tong, Y.; Chen, D.; Han, B.; Wang, J.; Feng, R.; Yang, T.; Zhao, C.; Zhao, Y.T.; Guo, W.; Shimizu, Y.; Liu, C.T.; Liaw, P.K.; Inoue, K.; Nagai, Y.; Hu, A.; Kai, J.J. Outstanding tensile properties of a precipitation-strengthened FeCoNiCrTi0.2 high-entropy alloy at room and cryogenic temperatures. Acta Mater. 2019, 165, 228–240. [Google Scholar] [CrossRef]
- Kovarik, L.; Unocic, R.R.; Li, J.; Sarosi, P.; Shen, C.; Wang, Y.; Mills, M.J. Microtwinning and other shearing mechanisms at intermediate temperatures in Ni-based superalloys. Prog. Mater. Sci. 2009, 54, 839–873. [Google Scholar] [CrossRef]
Disclaimer/Publisher’s Note: The statements, opinions and data contained in all publications are solely those of the individual author(s) and contributor(s) and not of MDPI and/or the editor(s). MDPI and/or the editor(s) disclaim responsibility for any injury to people or property resulting from any ideas, methods, instructions or products referred to in the content. |
© 2024 by the authors. Licensee MDPI, Basel, Switzerland. This article is an open access article distributed under the terms and conditions of the Creative Commons Attribution (CC BY) license (http://creativecommons.org/licenses/by/4.0/).


