Preprint
Article

Identification of Risk Factors Linked to Diabetic Foot Ulcers from Multimodal Electronic Health Records and Transcriptomics Using Machine Learning

Altmetrics

Downloads

128

Views

63

Comments

0

A peer-reviewed article of this preprint also exists.

Submitted:

15 August 2024

Posted:

16 August 2024

You are already at the latest version

Alerts
Abstract
Diabetic Foot Ulcer (DFU) is a severe complication of diabetes mellitus (DM), often leading to hospitalization and non-traumatic amputations in the United States. It is particularly prevalent among individuals of Hispanic descent, with a prevalence rate exceeding 10% [1, 2]. The target of this study is to identify markers of severity of DFU. This work follows a strategy that uses first Electronic Health Records and machine learning to identify risk factors reported as measurements of blood tests, such as cholesterol, blood sugar, and specific proteins in a cohort of thousands of patients. After this RNA risk factors are predicted using samples of bulk and single-cell gene expression across patients with different levels of DFU severity. We found the Albu-min/Creatinine Ratio (ACR) test as a key factor in severe DFUs. We also found a cluster of cells that harbor high expression of Apolipoprotein E protein (APOE) and it is significant in non-healing DFU cases. Overall, the study shows how the use of hundreds of thousands of EHR can reduce and inform the search space of molecules in a few samples of bulk-single cell transcriptomics and identify molecular markers of severity of DFU.
Keywords: 
Subject: Biology and Life Sciences  -   Immunology and Microbiology

1. Introduction

Diabetic Foot Ulcer (DFU) is a severe complication of diabetes mellitus (DM), characterized by high blood glucose levels due to insufficient insulin. DFUs, which manifest as ulcers on the feet, lead to more hospitalizations than other diabetic complications and are the leading cause of non-traumatic amputations in the U.S. In 2023, about 5% of diabetic patients develop DFUs, and around 1% result in amputations[3].
The Meggitt-Wagner system grades DFUs from 0 to 5 based on severity. Grade 0 indicates an intact foot at risk for ulcers, Grade 1 is a superficial ulcer, Grade 2 involves deeper structures, Grade 3 includes abscesses, Grade 4 involves gangrene in the forefoot, and Grade 5 includes gangrene of the entire foot[4]. Treatments range from wound care to amputation.
Risk factors for DFUs include diabetic neuropathy, peripheral vascular disease, previous ulcers, poor glycemic control, long-term diabetes, race, smoking, insulin use, poor vision, age, and sex. Key tests like fasting blood glucose and HbA1c provide health insights. Utilizing Electronic Health Records (EHR) and Machine learning can improve DFU prediction and understanding.
Electronic Health Records (EHRs) contain patient information in all forms and formats. Unstructured EHRs typically contain clinician notes, discharge summaries, and imaging interpretations and lack a predefined format. Structured EHRs, however, store data in predefined formats like tables, making information storage and retrieval systematic. These would include details such as birth and death dates, race, socioeconomic status, sex, and housing situation, providing a comprehensive view of the patient's health.
Structured EHRs also use standardized coding systems to encode medical information. Common codes include the International Classification of Diseases, 10th Edition (ICD-10), for diseases and conditions; Current Procedural Terminology (CPT) for procedures; Healthcare Common Procedure Coding System (HCPCS); Systematized Nomenclature of Medicine—Clinical Terms (SNOMED-CT); and the National Drug Code (NDC). This project uses Logical Observation Identifiers Names and Codes (LOINC) to track and identify laboratory tests conducted during disease management. Using EHR data and key demographic information, we aim to understand factors influencing Diabetic Foot Ulcers (DFU). Translational Science helps translate clinical findings to broader health insights, enabling us to identify critical factors impacting DFU development.
In this work, we applied Translational Science to understand the impact of scientific facts on a molecular level. LOINC codes from the EHR store laboratory tests carried out to diagnose and manage DFU. These laboratory tests measure protein levels and interactions. We culminate this process by using analyzing Bulk RNA and Single-Cell RNA sequencing datasets to validate findings derived from using the EHR. Bulk RNA gives a broad view of gene expression across many cells, while Single-Cell RNA reveals individual cell details and functions within complex tissues. Figure 1 in the Figures section details the steps taken to develop our risk index.
Several efforts have been made to use EHR in developing risk indices, such as the effort by Adelaide M. Arruda-Olson et al [5]; Wang et al apply this towards the early detection of diabetic retinopathy [6]. There have also been efforts to use the collaborative knowledge of Bulk RNA and Single Cell RNA datasets and analysis in the identification of tumor immune microenvironment-related signature[7], and in the construction of a stemness-related signature for predicting prognosis and immunotherapy responses in hepatocellular carcinoma[8]However, to the best of our knowledge, no studies have successfully incorporated clinical data and transcriptomics in developing a risk index, as we have.

2. Results

In this section, we have divided the results to reflect the stages of integration of EHR and Transcriptomics. 2.1 details results using EHR, 2.2 details results using Bulk RNA, and 2.3 details results using Single-cell RNA sequenced data.

2.1. Analysis Using Electronic Health Record

2.1.1. Analysis Using Electronic Health Record

In the use of EHR, our results are in 2-parts listed below:
(1)
Data Preprocessing and Interpretation from EHR
Albumin-Creatinine Ration Test as Basis for Assessing DFU Severity in Hispanics
(2)
Data Preprocessing and Interpretation from EHR
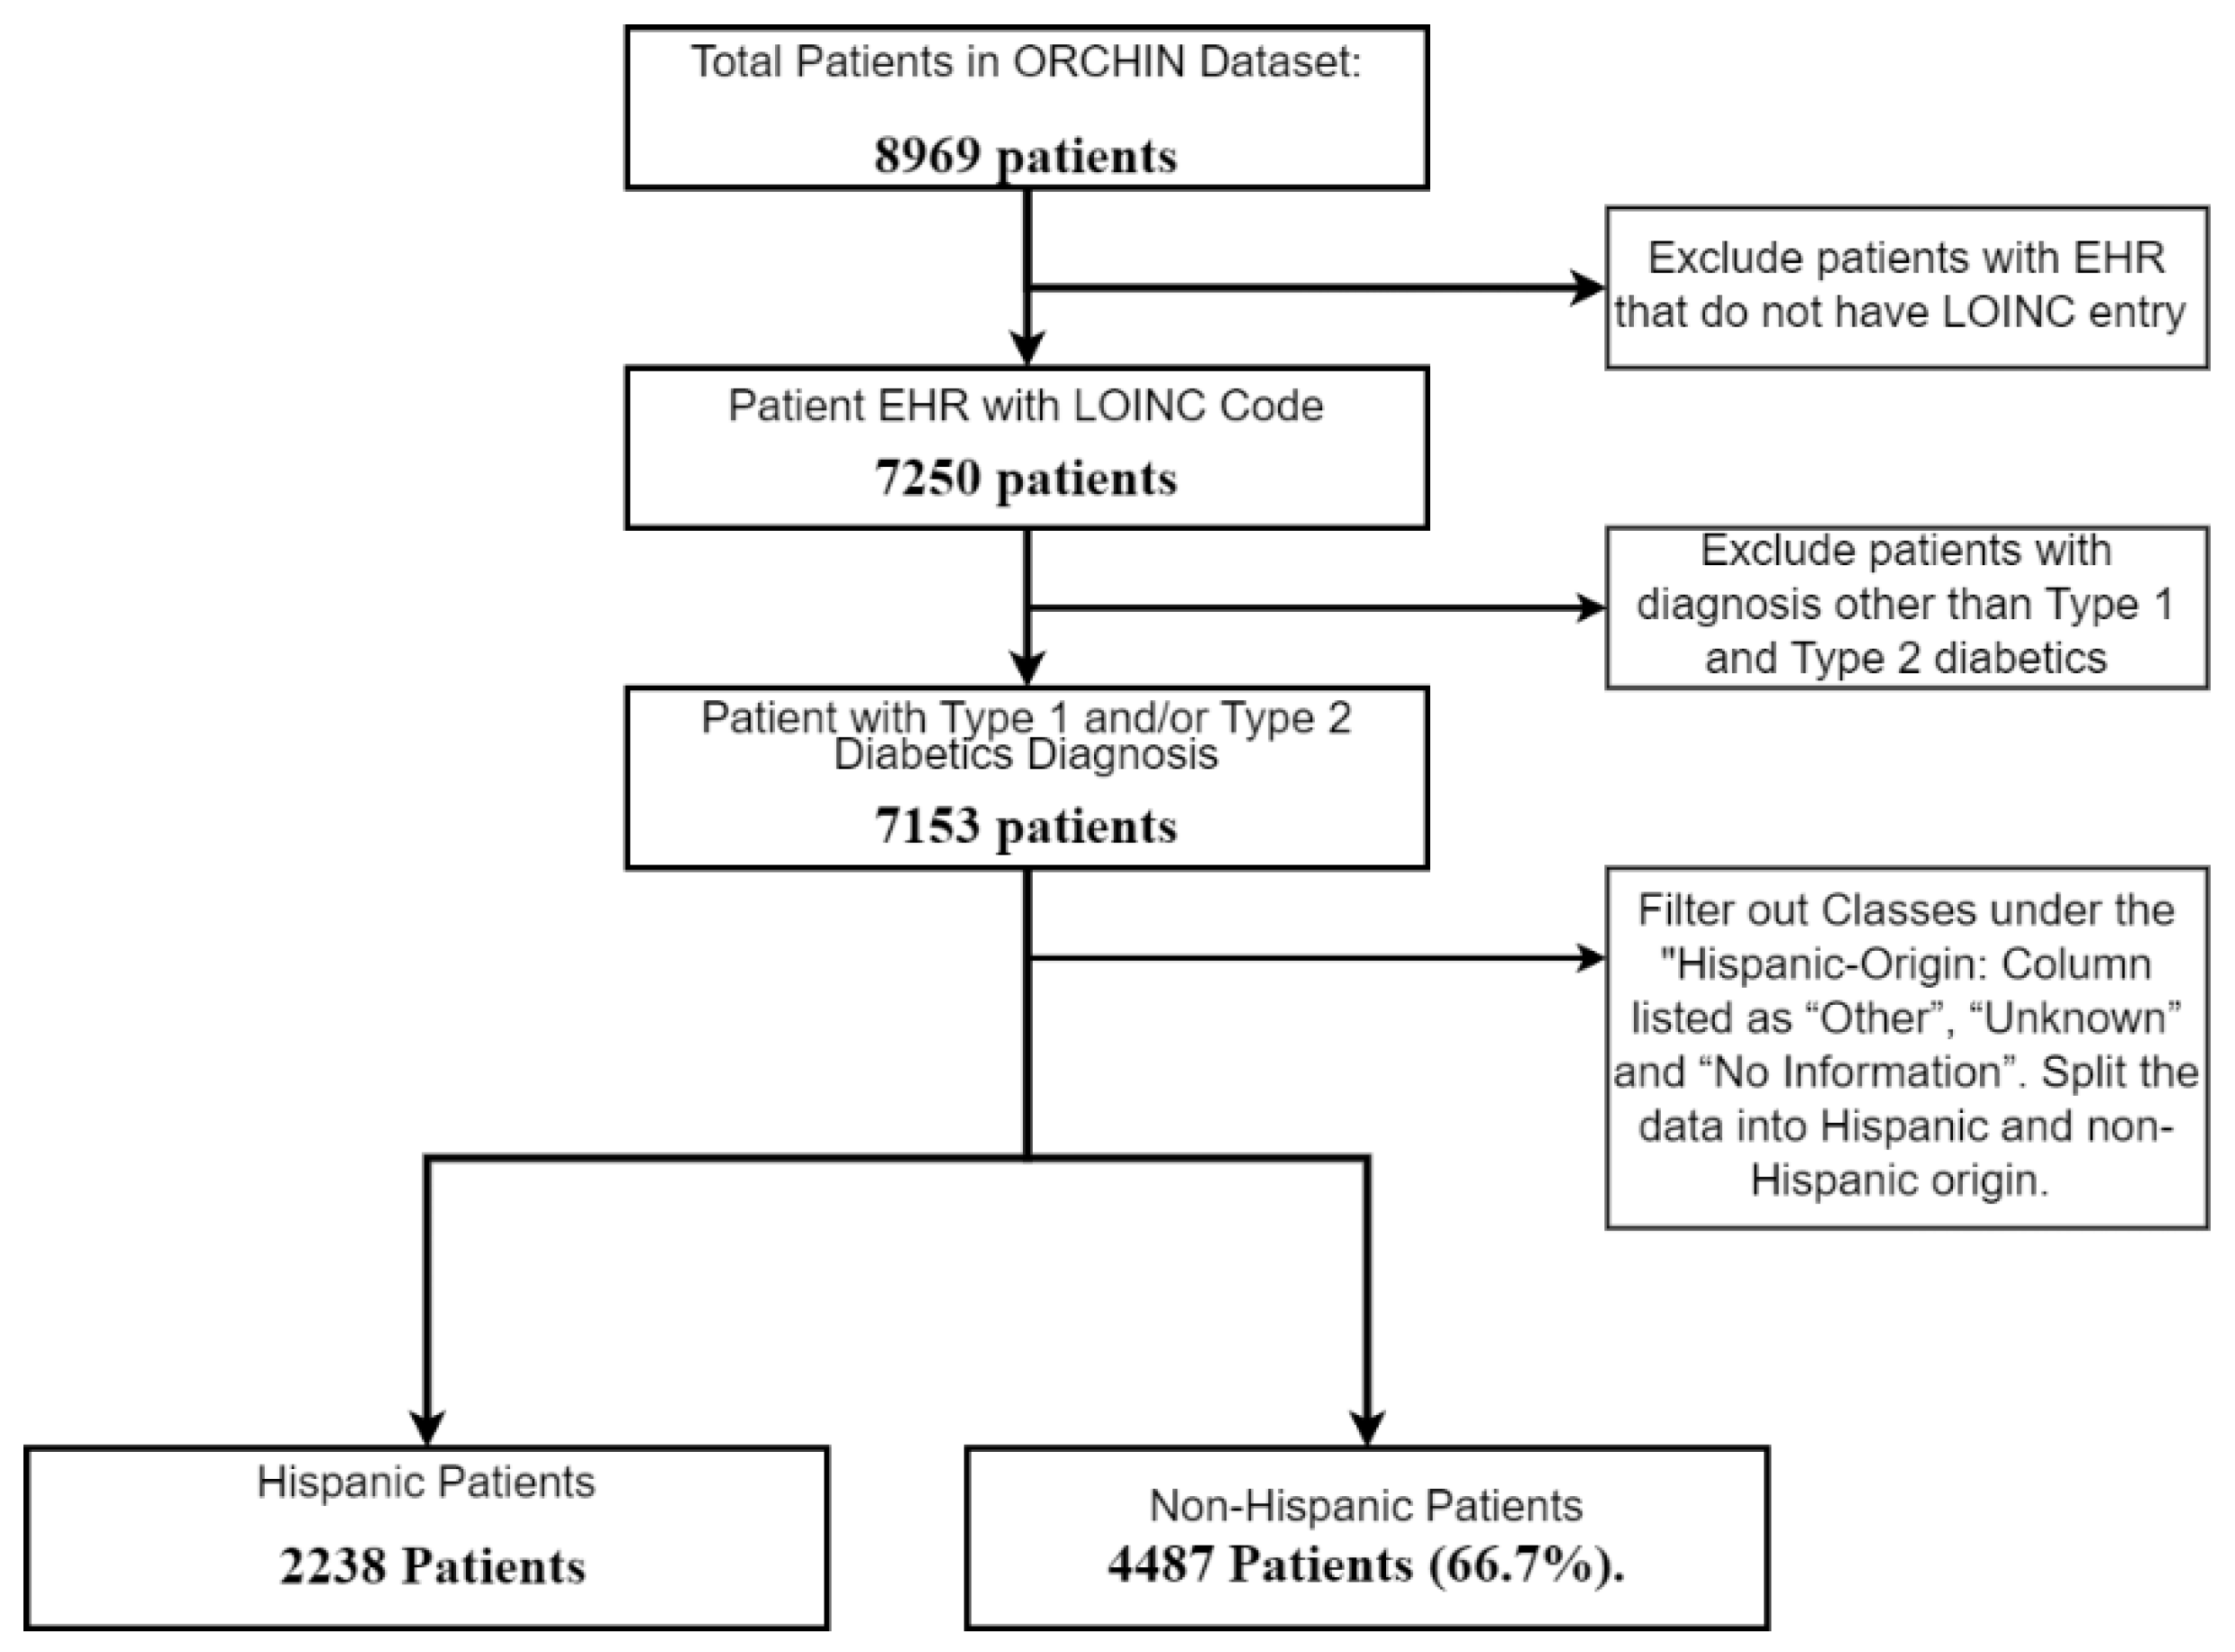
In this study, we processed Electronic Health Record (EHR) data and shed light on notable demographic distinctions. Our analysis started with a thorough analysis of EHR data consisting of 8,969 de-identified patient records. In order to work with only the most relevant dataset, we meticulously filtered the dataset by categorizing patients into Type 1 Diabetes, Type 2 Diabetes, and an 'Other' group, subsequently excluding entries under 'Other' from our analysis.
Our hypothesis is focused on identifying molecular differences across demographic groups within the laboratory test results in the EHR. These differences, influenced by genetics, lifestyle, and socio-economic factors, may have contributed to the varying likelihood of developing Diabetic Foot Ulcer disease. To enhance data quality, entries lacking laboratory data were excluded, leaving us with 7,153 patient records for analysis. As our study placed particular emphasis on the Hispanic demographic, we split the dataset between Hispanic and non-Hispanic groups. Figure 1 below illustrates the initial filtration steps of the dataset.
Figure 2. Flowchart of Patient Selection for Study on Diabetic Patients by Hispanic Origin.
Preprints 115378 g002
The dataset also contained other demographic information that may be used as labels for further feature selection, such as Vital Status, which details whether the patient is alive or deceased; the Biological Sex of the patient; the Current Federal Poverty Line (FPL) which gives us insight into the economic power of the patients; details on if the patient lives in a Rural Community, and finally, whether the patient lives in the northern or southern states of the United States. Analysis of the dataset along with this demographic information may give some insight into the effects of their difference on the likelihood of the development of the disease. In furtherance of this work, we use the Vital Status information to develop our risk index.
The EHR also contains the LOINC codes used to record laboratory tests conducted to diagnose and manage each patient's disease. The dataset contains 63 of these codes, which we use for further analysis. Because we are especially interested in significant differences in the diagnoses of this disease between Hispanic and non-Hispanic people, we shifted our scrutiny to the most important distinguishing features that separate these two classes. To do this, we evaluated the Mean Decreasing Accuracy between the Hispanic and non-Hispanic demographic groups. The concept of feature importance was utilized to gauge the impact of individual features on model accuracy. Mean Decrease in Accuracy was computed, highlighting the degree to which model performance fluctuated when specific feature values were randomized. By sorting and presenting features based on their mean decrease in accuracy, the crucial contributors to model precision were unveiled. This information, visualized through plots, sheds light on the key factors influencing predictions for both classes. Our objective was to substantiate our hypothesis that the results of laboratory tests concerning various demographic factors provide insights into molecular activities that contribute to the occurrence of DFU.
We started by collating the top 10 essential laboratory tests in the Hispanic versus non-Hispanic classification task. We collated the top 10 features for each class; we removed any reoccurring test labels, and we were left with 18 test labels. Next, we considered the mean values across all the patients against each of these labels. We then use the P-value test to check for significant statistical differences between the Hispanic and non-Hispanic classes across each test using the Mann-Whitney U test. We singled out the labels with the most statistical significance and used this as a basis for further comparison. Table 1 below shows all the tests with key statistical variables.
(3)
Albumin-Creatinine Ratio Test as Basis for Assessing DFU Severity in Hispanics
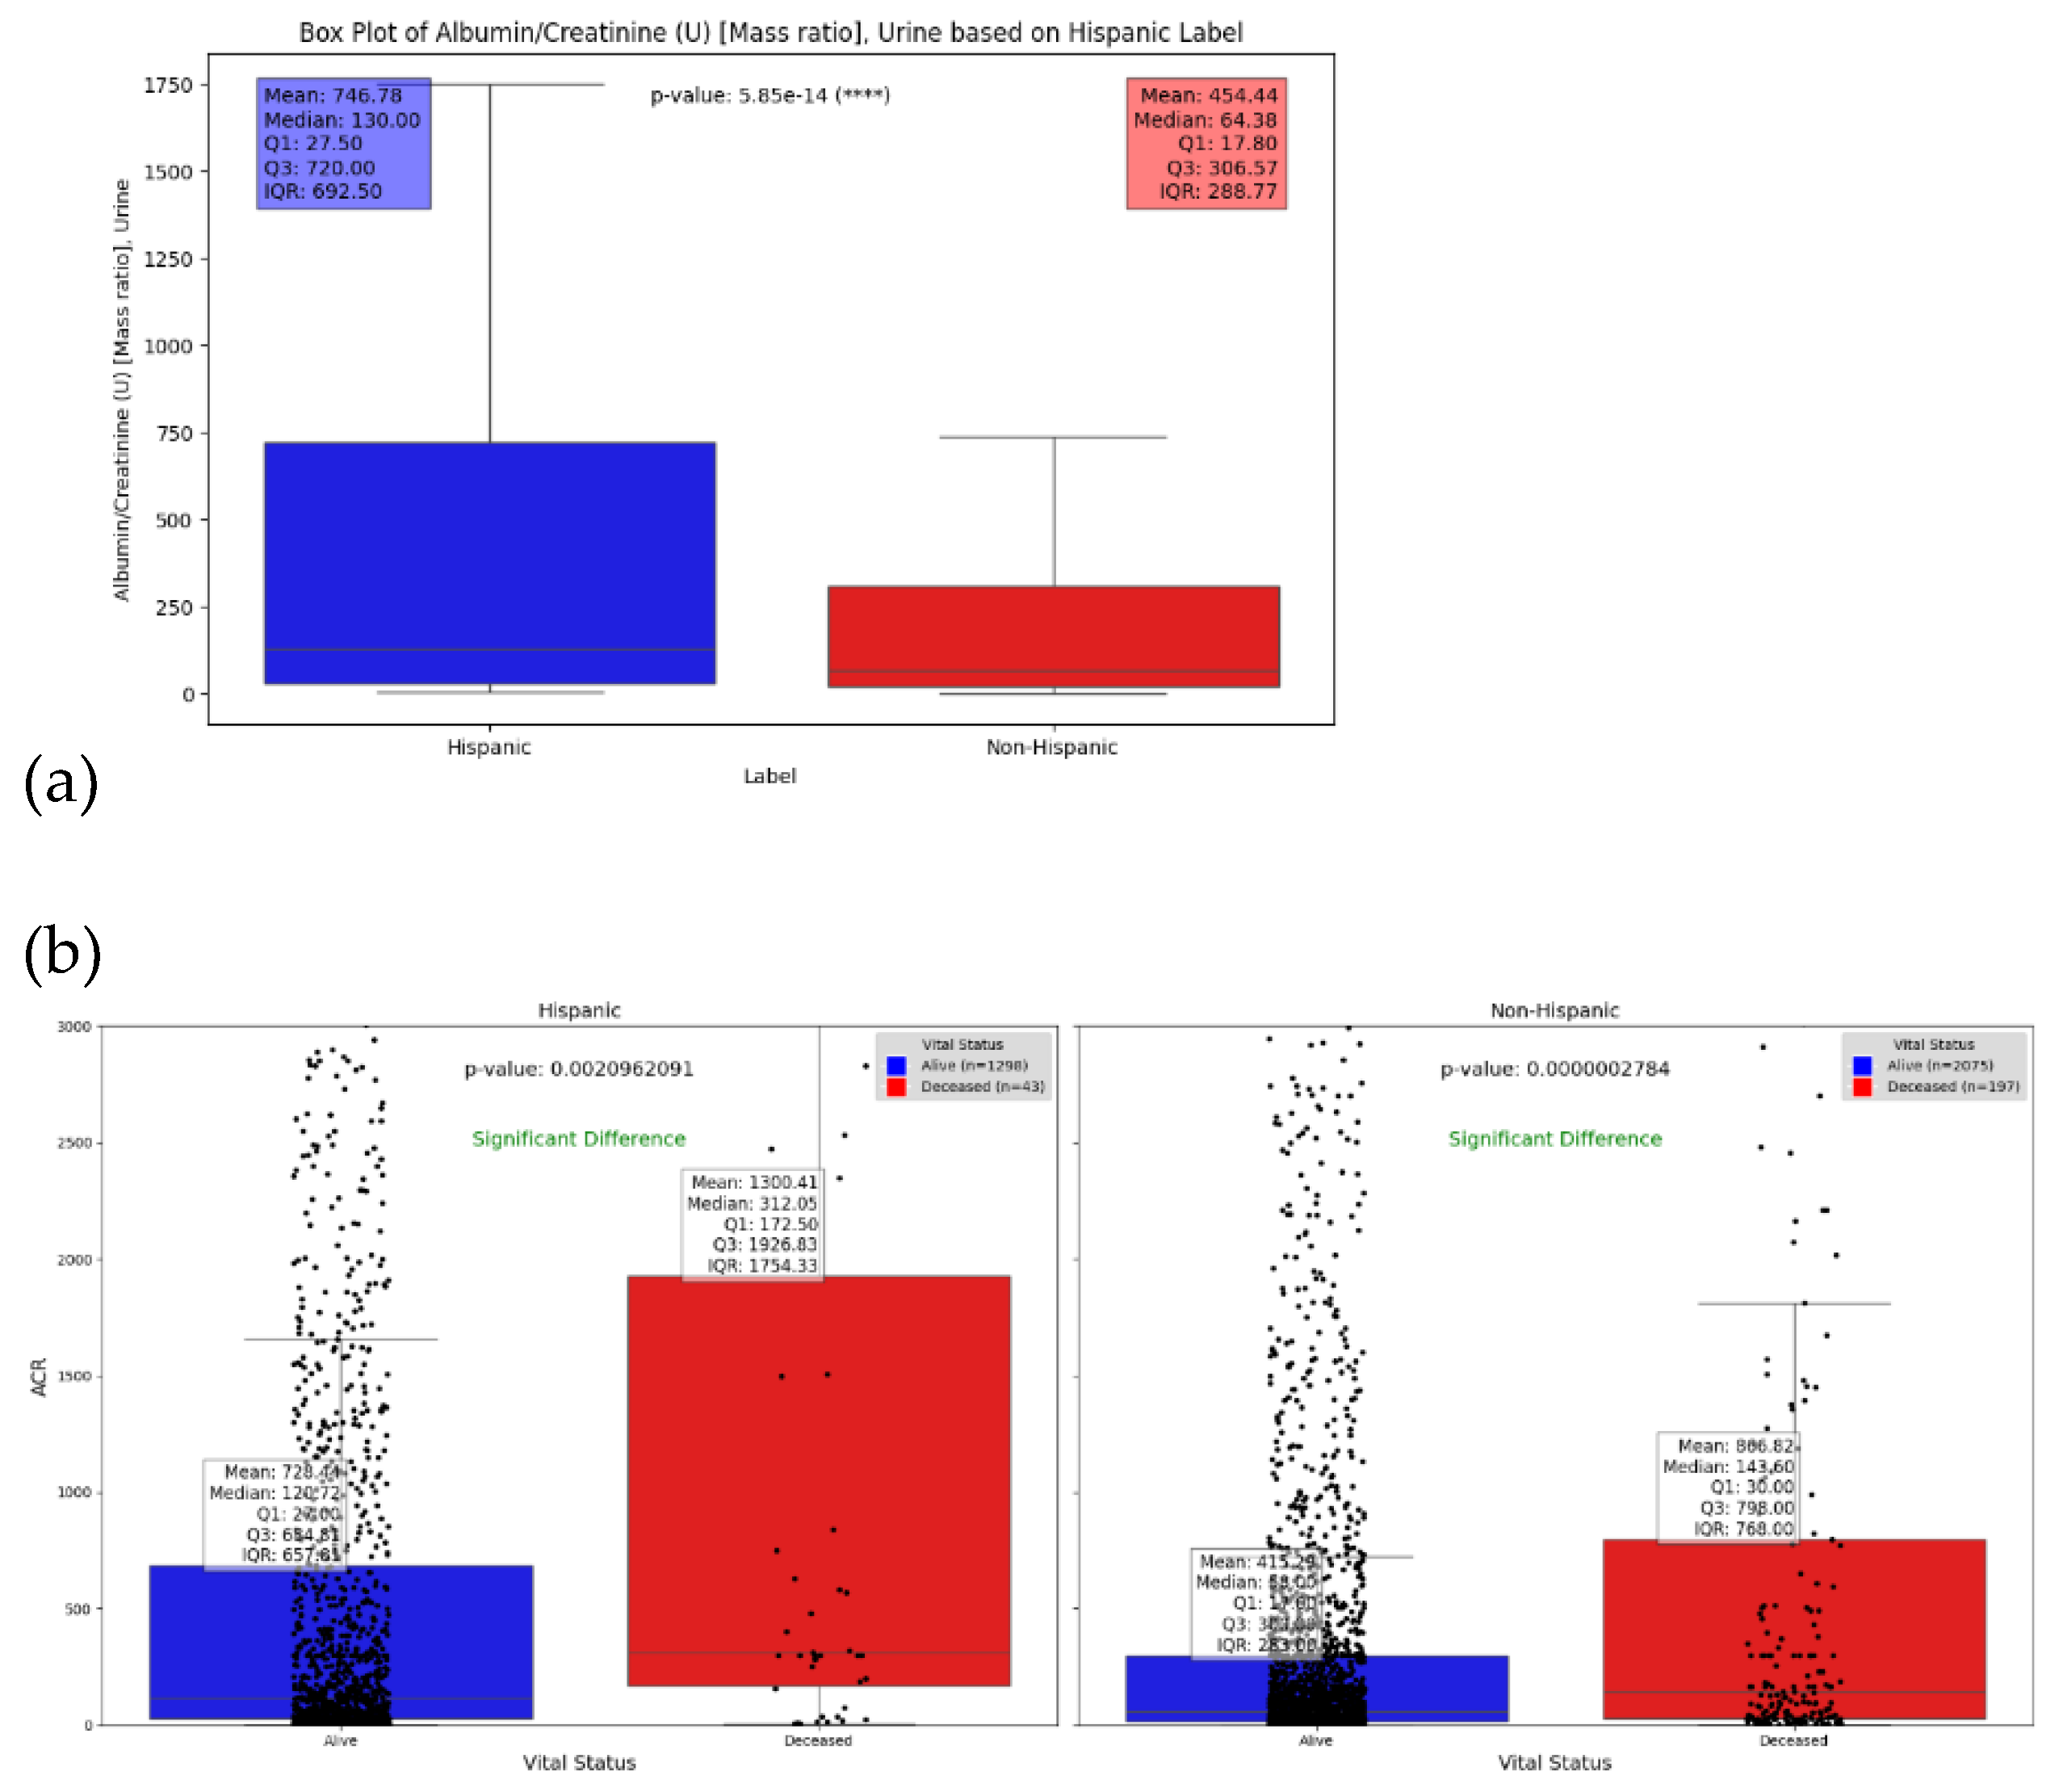
We observed that the Albumin/Creatinine ratio (ACR) test showed a significant statistical difference from the p-value using the Mann-Whitney U test of 5.85e-14 between the Hispanic and non-Hispanic origin. We are able to show further key molecular and protein compositions that may differ between Hispanic and non-Hispanic patients, thereby highlighting any disparities in health outcomes.
The Albumin/Creatinine ratio test is measured using urine, which is a ratio test of albumin and creatinine levels. Doctors assess this to determine early signs of kidney disease. Chronic Kidney Disease (CKD) is also a complication of diabetics, and the development of CKD means that the DFU in patients has progressed [9]. We check for statistically significant differences between Hispanic and non-Hispanic labels using ACR as a risk index. Figure 5 above is a box plot that shows the mean, median, and p-value by the Mann-Whitney U test, indicating a significant statistical difference between both groups.
In this analysis, we focused on identifying the key features that differentiate high and low ACR values based on the median value of all ACR measurements in the Electronic Health Records (EHR). By segmenting the ACR data into values above and below the median, we can pinpoint specific factors that contribute to higher ACR levels, which are indicative of greater health risks. This approach allowed us to utilize advanced machine learning techniques to evaluate feature importance, helping us to identify significant predictors of high ACR values.
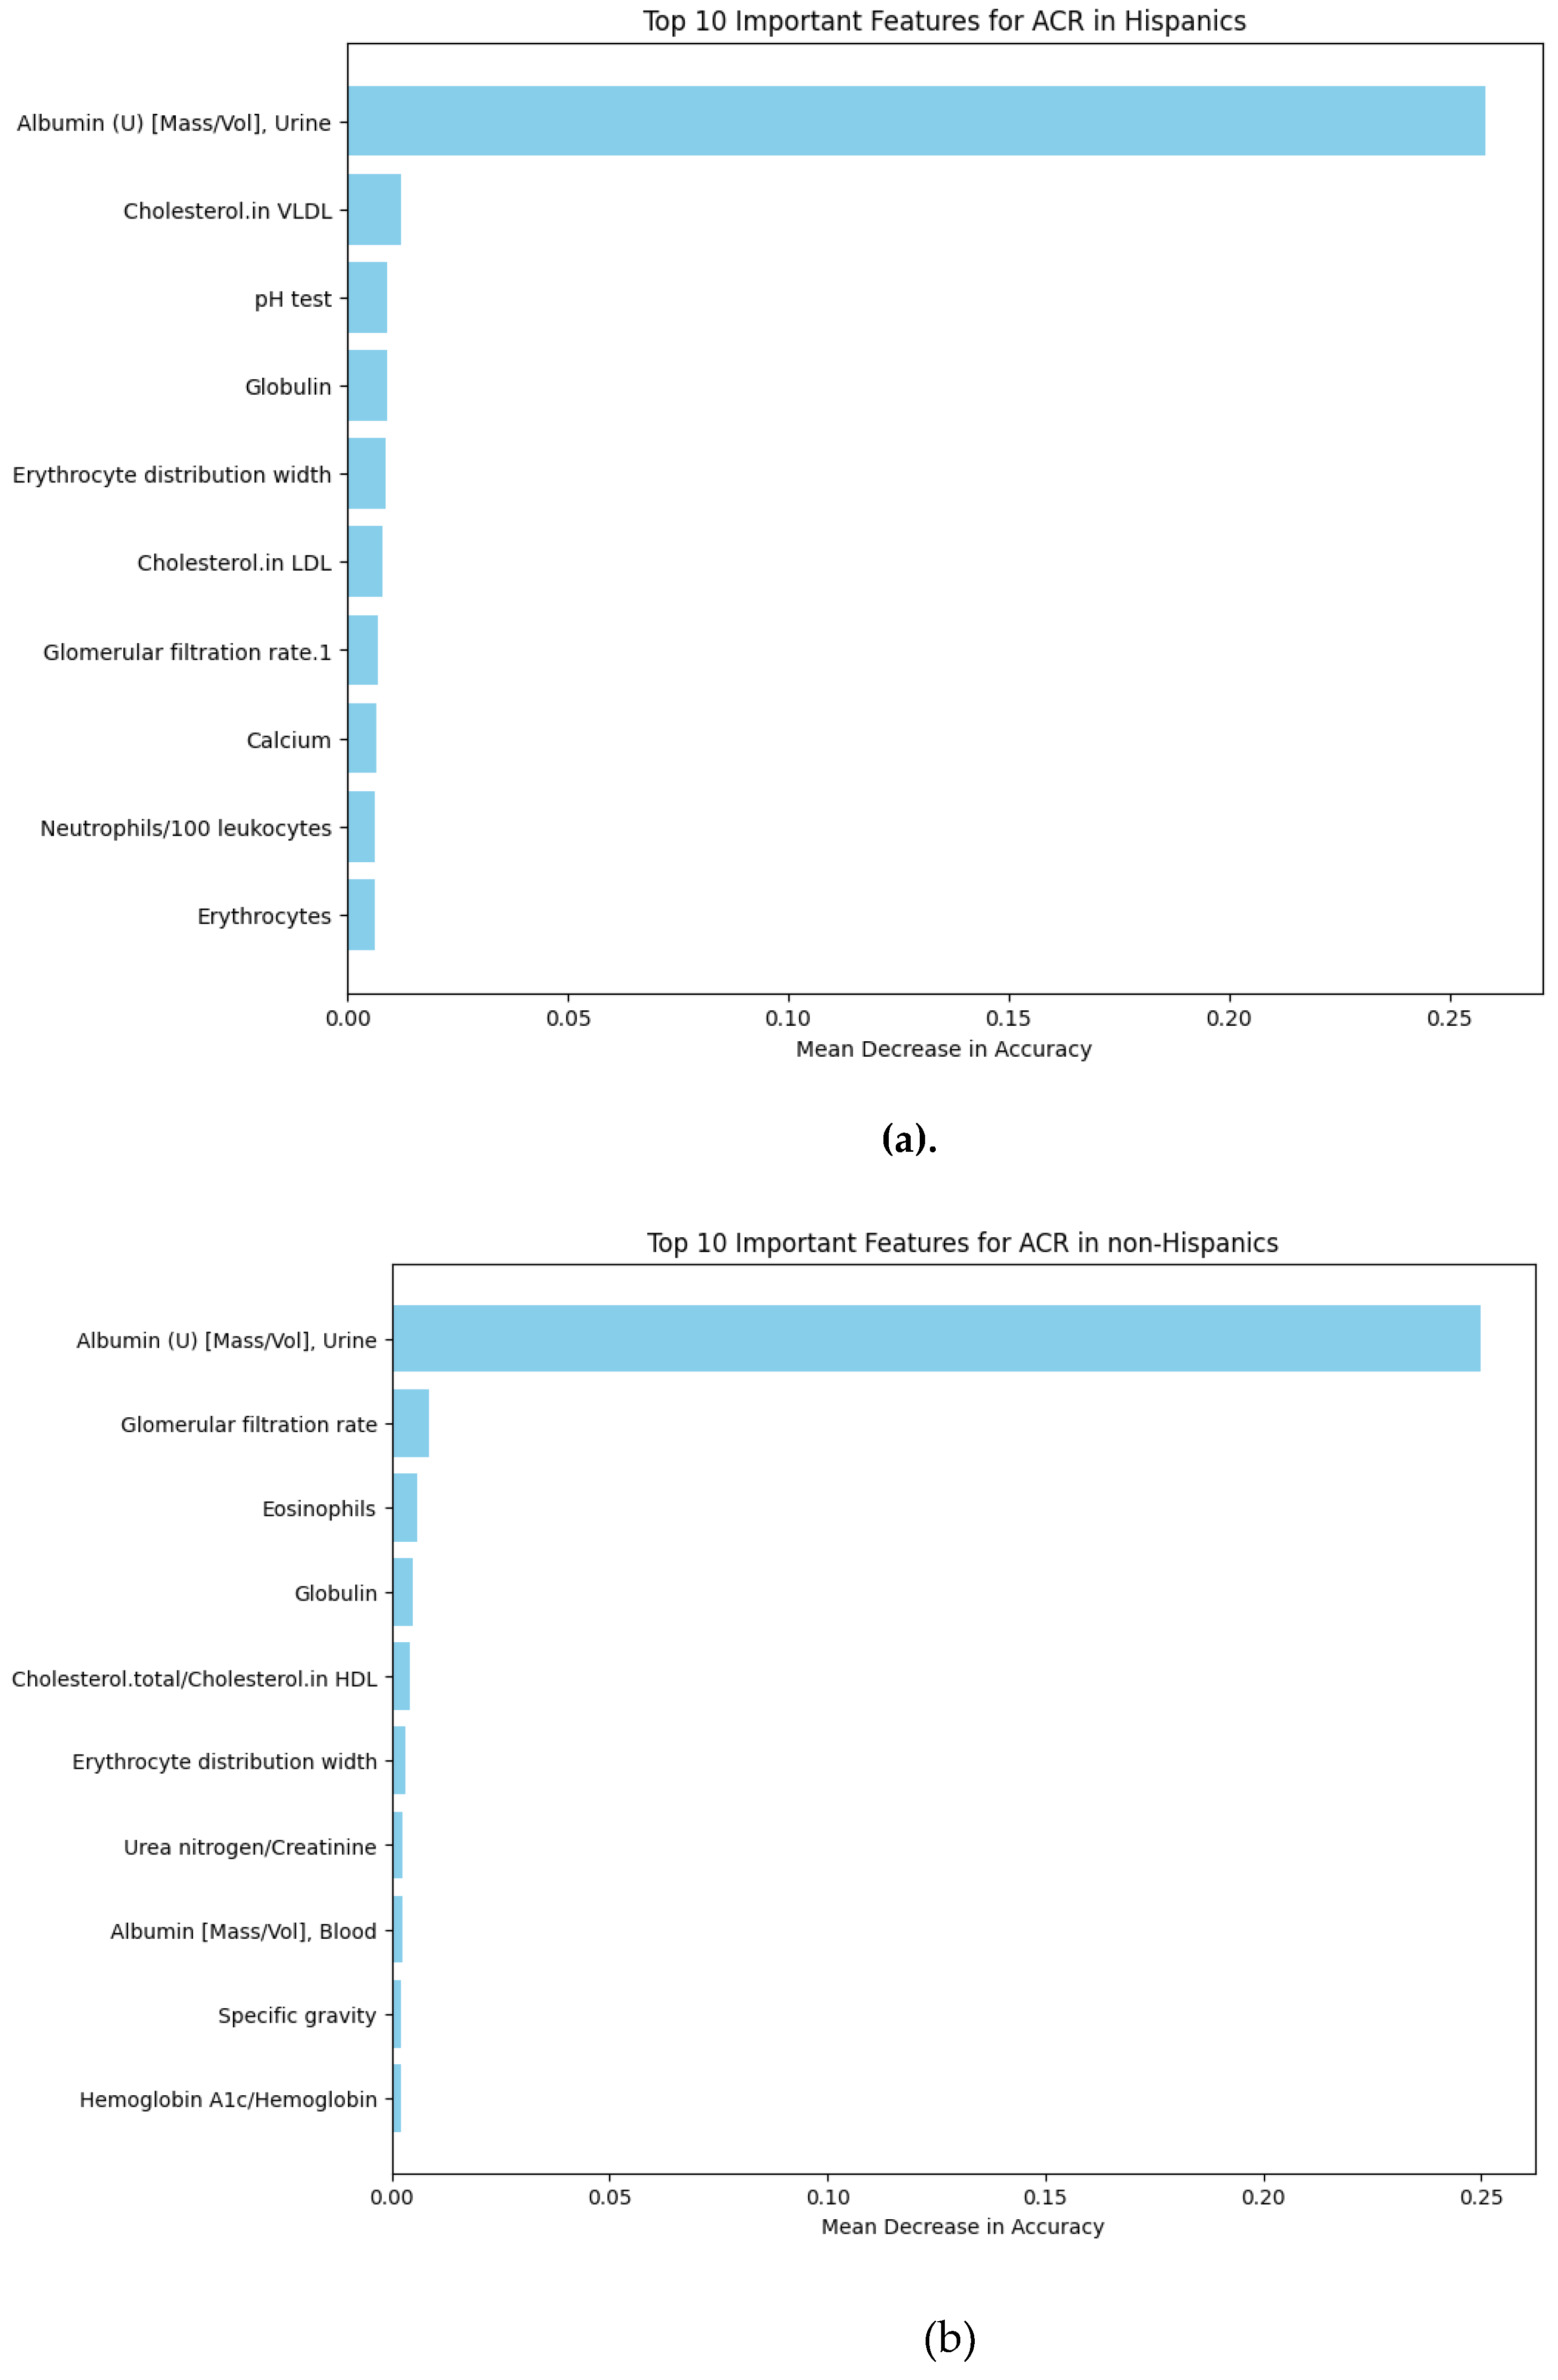
Understanding these predictors aids in developing targeted interventions and improving clinical outcomes for both Hispanic and non-Hispanic populations. Mean Decrease Accuracy is significant because it pinpoints the importance of features within a classification model. Features causing substantial accuracy drops when altered are deemed crucial, while those with minimal impact are considered less significant. Below is the Mean Decreasing Accuracy evaluation for the Hispanic and non-Hispanic populations. Figure 4 shows the most common blood tests unique to Hispanic and non-Hispanic populations.
Figure 3. Box plots illustrating significant differences in Albumin/Creatinine Ratio. (a) Demonstrates statistical variance between Hispanic and non-Hispanic groups. (b) Highlights notable differences between surviving and deceased individuals within the Hispanic.
Preprints 115378 g003
Figure 4. Top 10 Important Features for ACR in Hispanics and non-Hispanic: This chart highlights the most influential factors for Albumin Creatinine Ratio (ACR), (a) for Hispanic origin and (b) for non-Hispanic origin.
Preprints 115378 g004
We observed that the distinguishing tests for the Hispanic group consist of lipid tests (LDL and VLDL Cholesterol), Metabolism and mineral absorption tests (Calcium), White blood cells (Neutrophils/ 100 Leukocytes), and red blood cells (Erythrocytes).

1.1.2. Analysis Using Bulk RNA Dataset

In our analysis of the blood test results stored in the EHR, which primarily measures protein concentrations in each patient, we seek to establish a direct correlation between our initial discoveries and publicly available RNA-sequenced datasets. We identified the APOE gene as a significant distinguishing factor. We were able to examine publicly accessible bulk RNA datasets and saw a significant decrease in the mean gene expression of the APOE from healthy to diseased samples. This exploration delves into identifying key factors that differentiate the various severity levels of Diabetic Foot Ulcers, comprising Control (Healthy tissue), Healing DFU tissue, and non-healing DFU tissue within our dataset. Our analysis methodology aligns closely with the approach outlined by Ran Chen et al. [10], ensuring rigor and consistency in validating the ACR test findings within the EHR. Table 3 below shows the mean gene expression for the gene associated with the Blood test. The APOE gene has been shown to affect ACR levels, suggesting a genetic connection between lipid metabolism and kidney function by Xuan He et al.[11]. They show that Individuals with certain APOE alleles may be more prone to both dyslipidemia and kidney damage, highlighting the importance of considering genetic factors in clinical assessments.
With our findings using the Bulk RNA data, we consider whether there are distinct microenvironmental changes in the structure of non-healing cases compared to healing ones in the different molecules and cell types. To answer these questions sufficiently, we used a single-cell dataset to further probe and identify a cell type in which the APOE gene may be expressed.

2.1.3. Analysis Using Single Cell RNA Sequenced Dataset

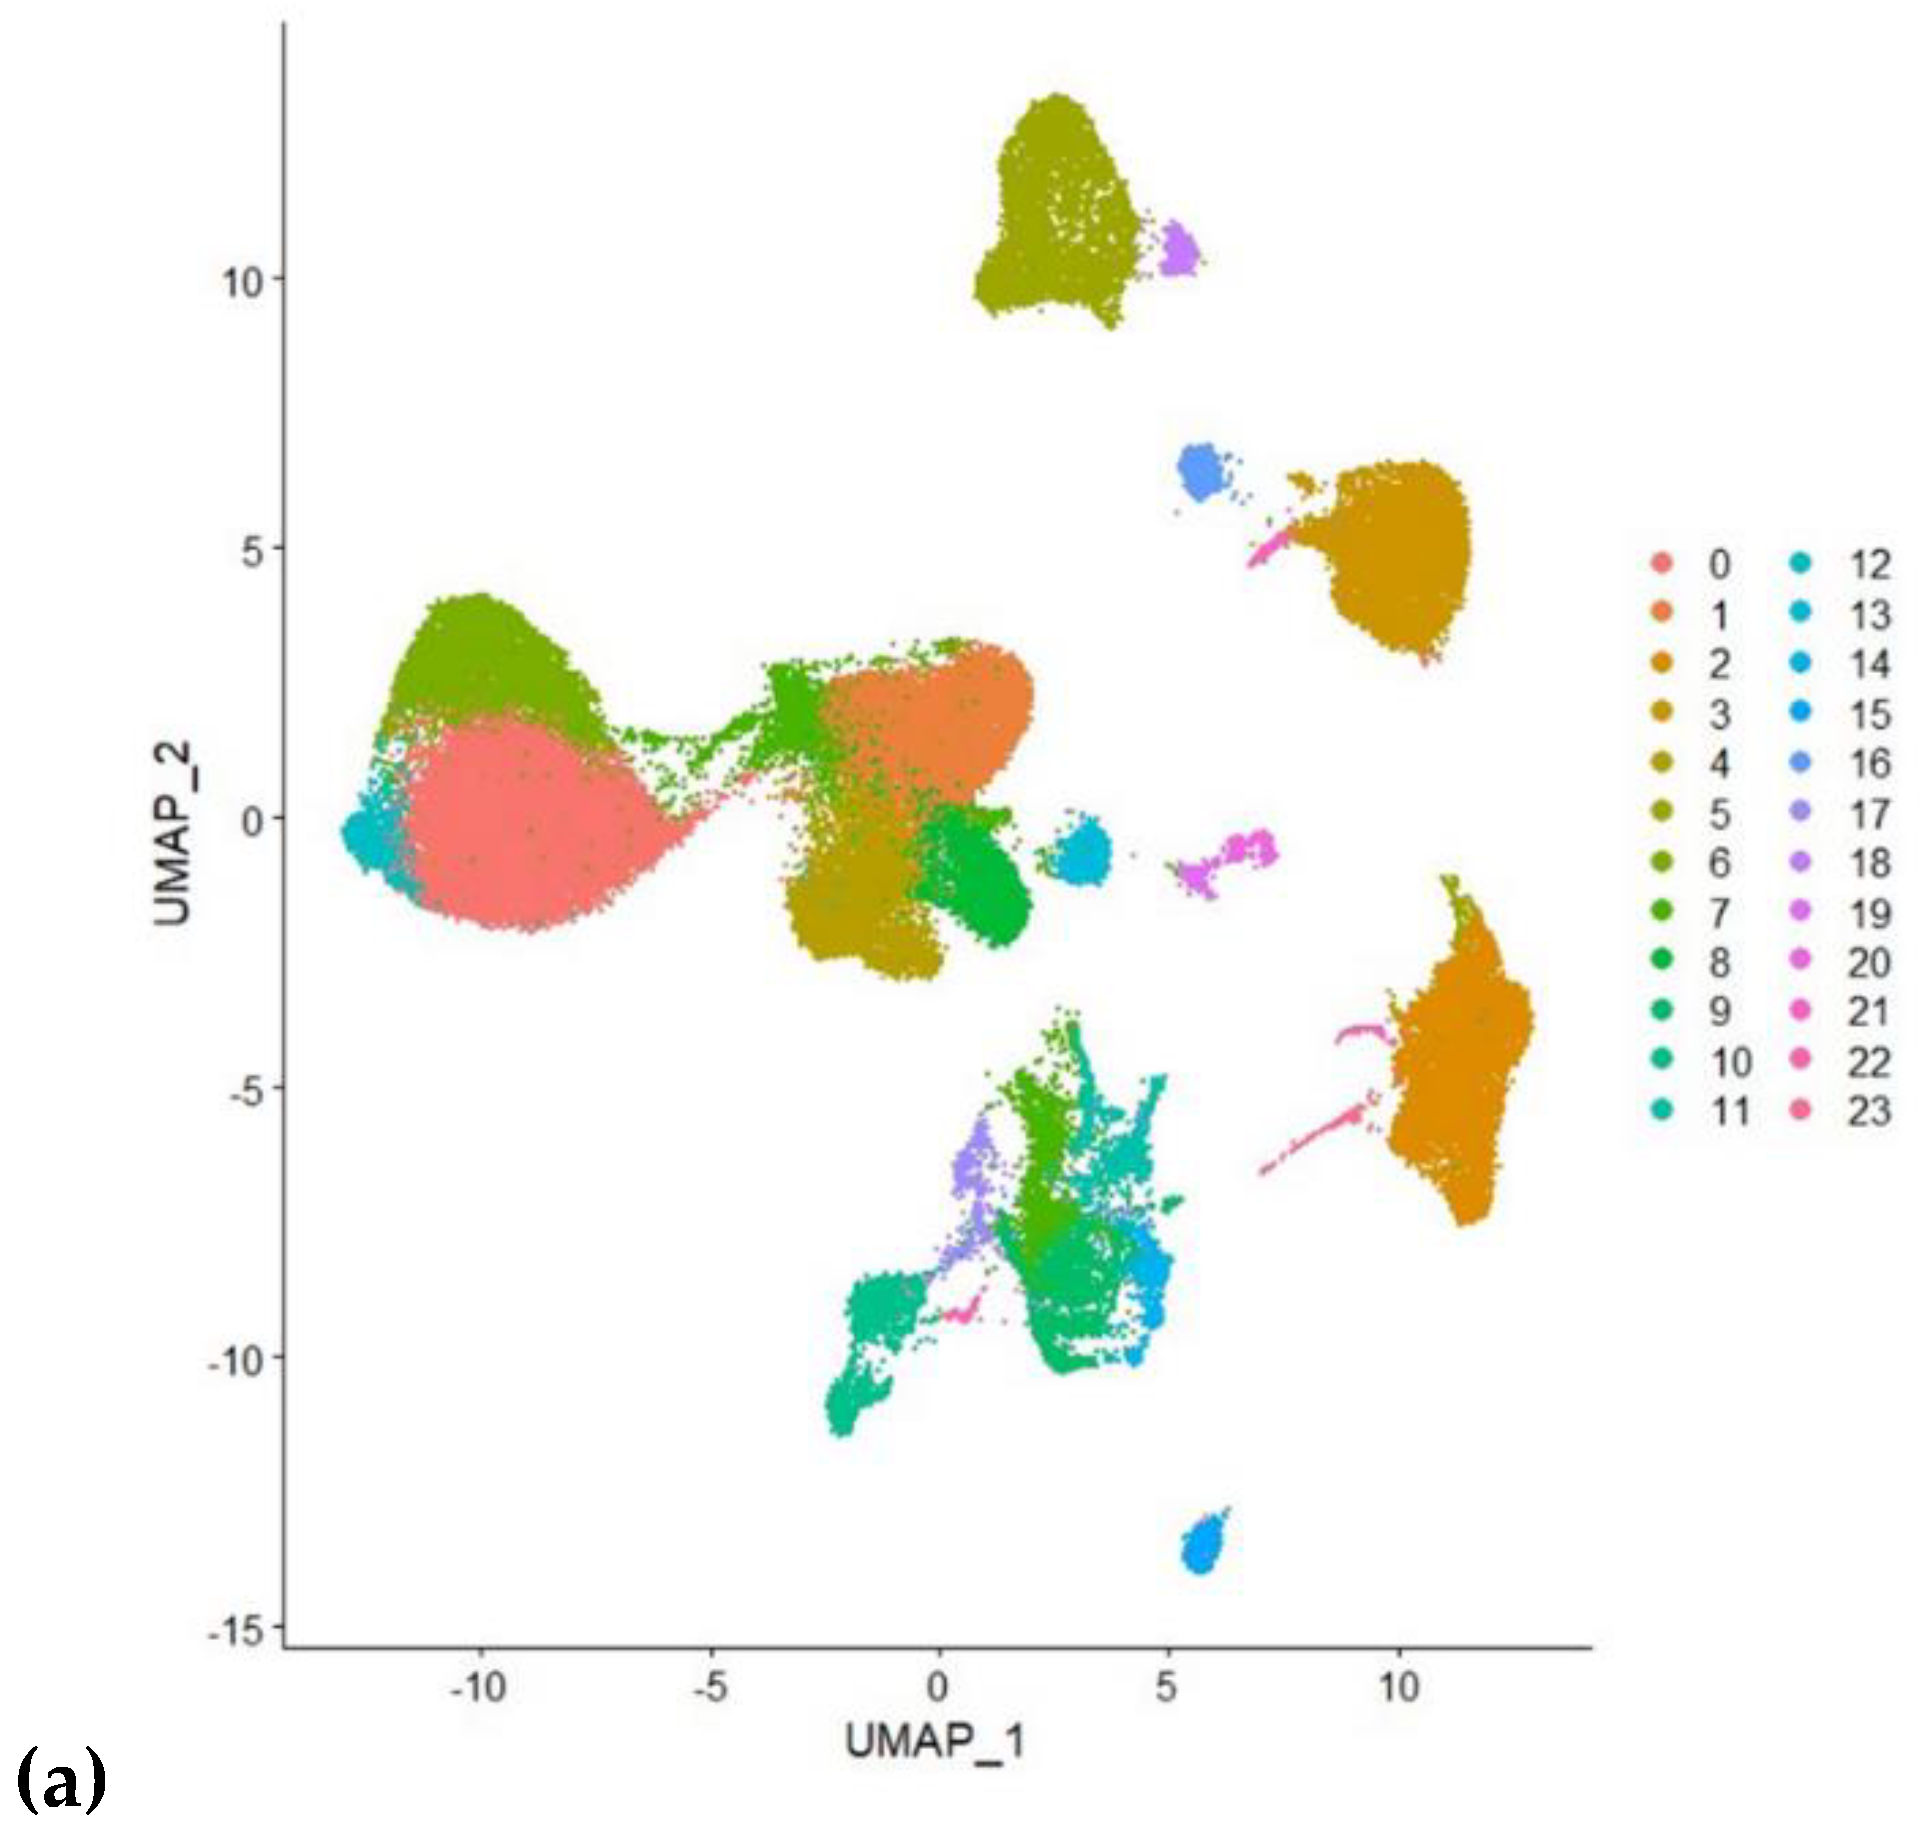
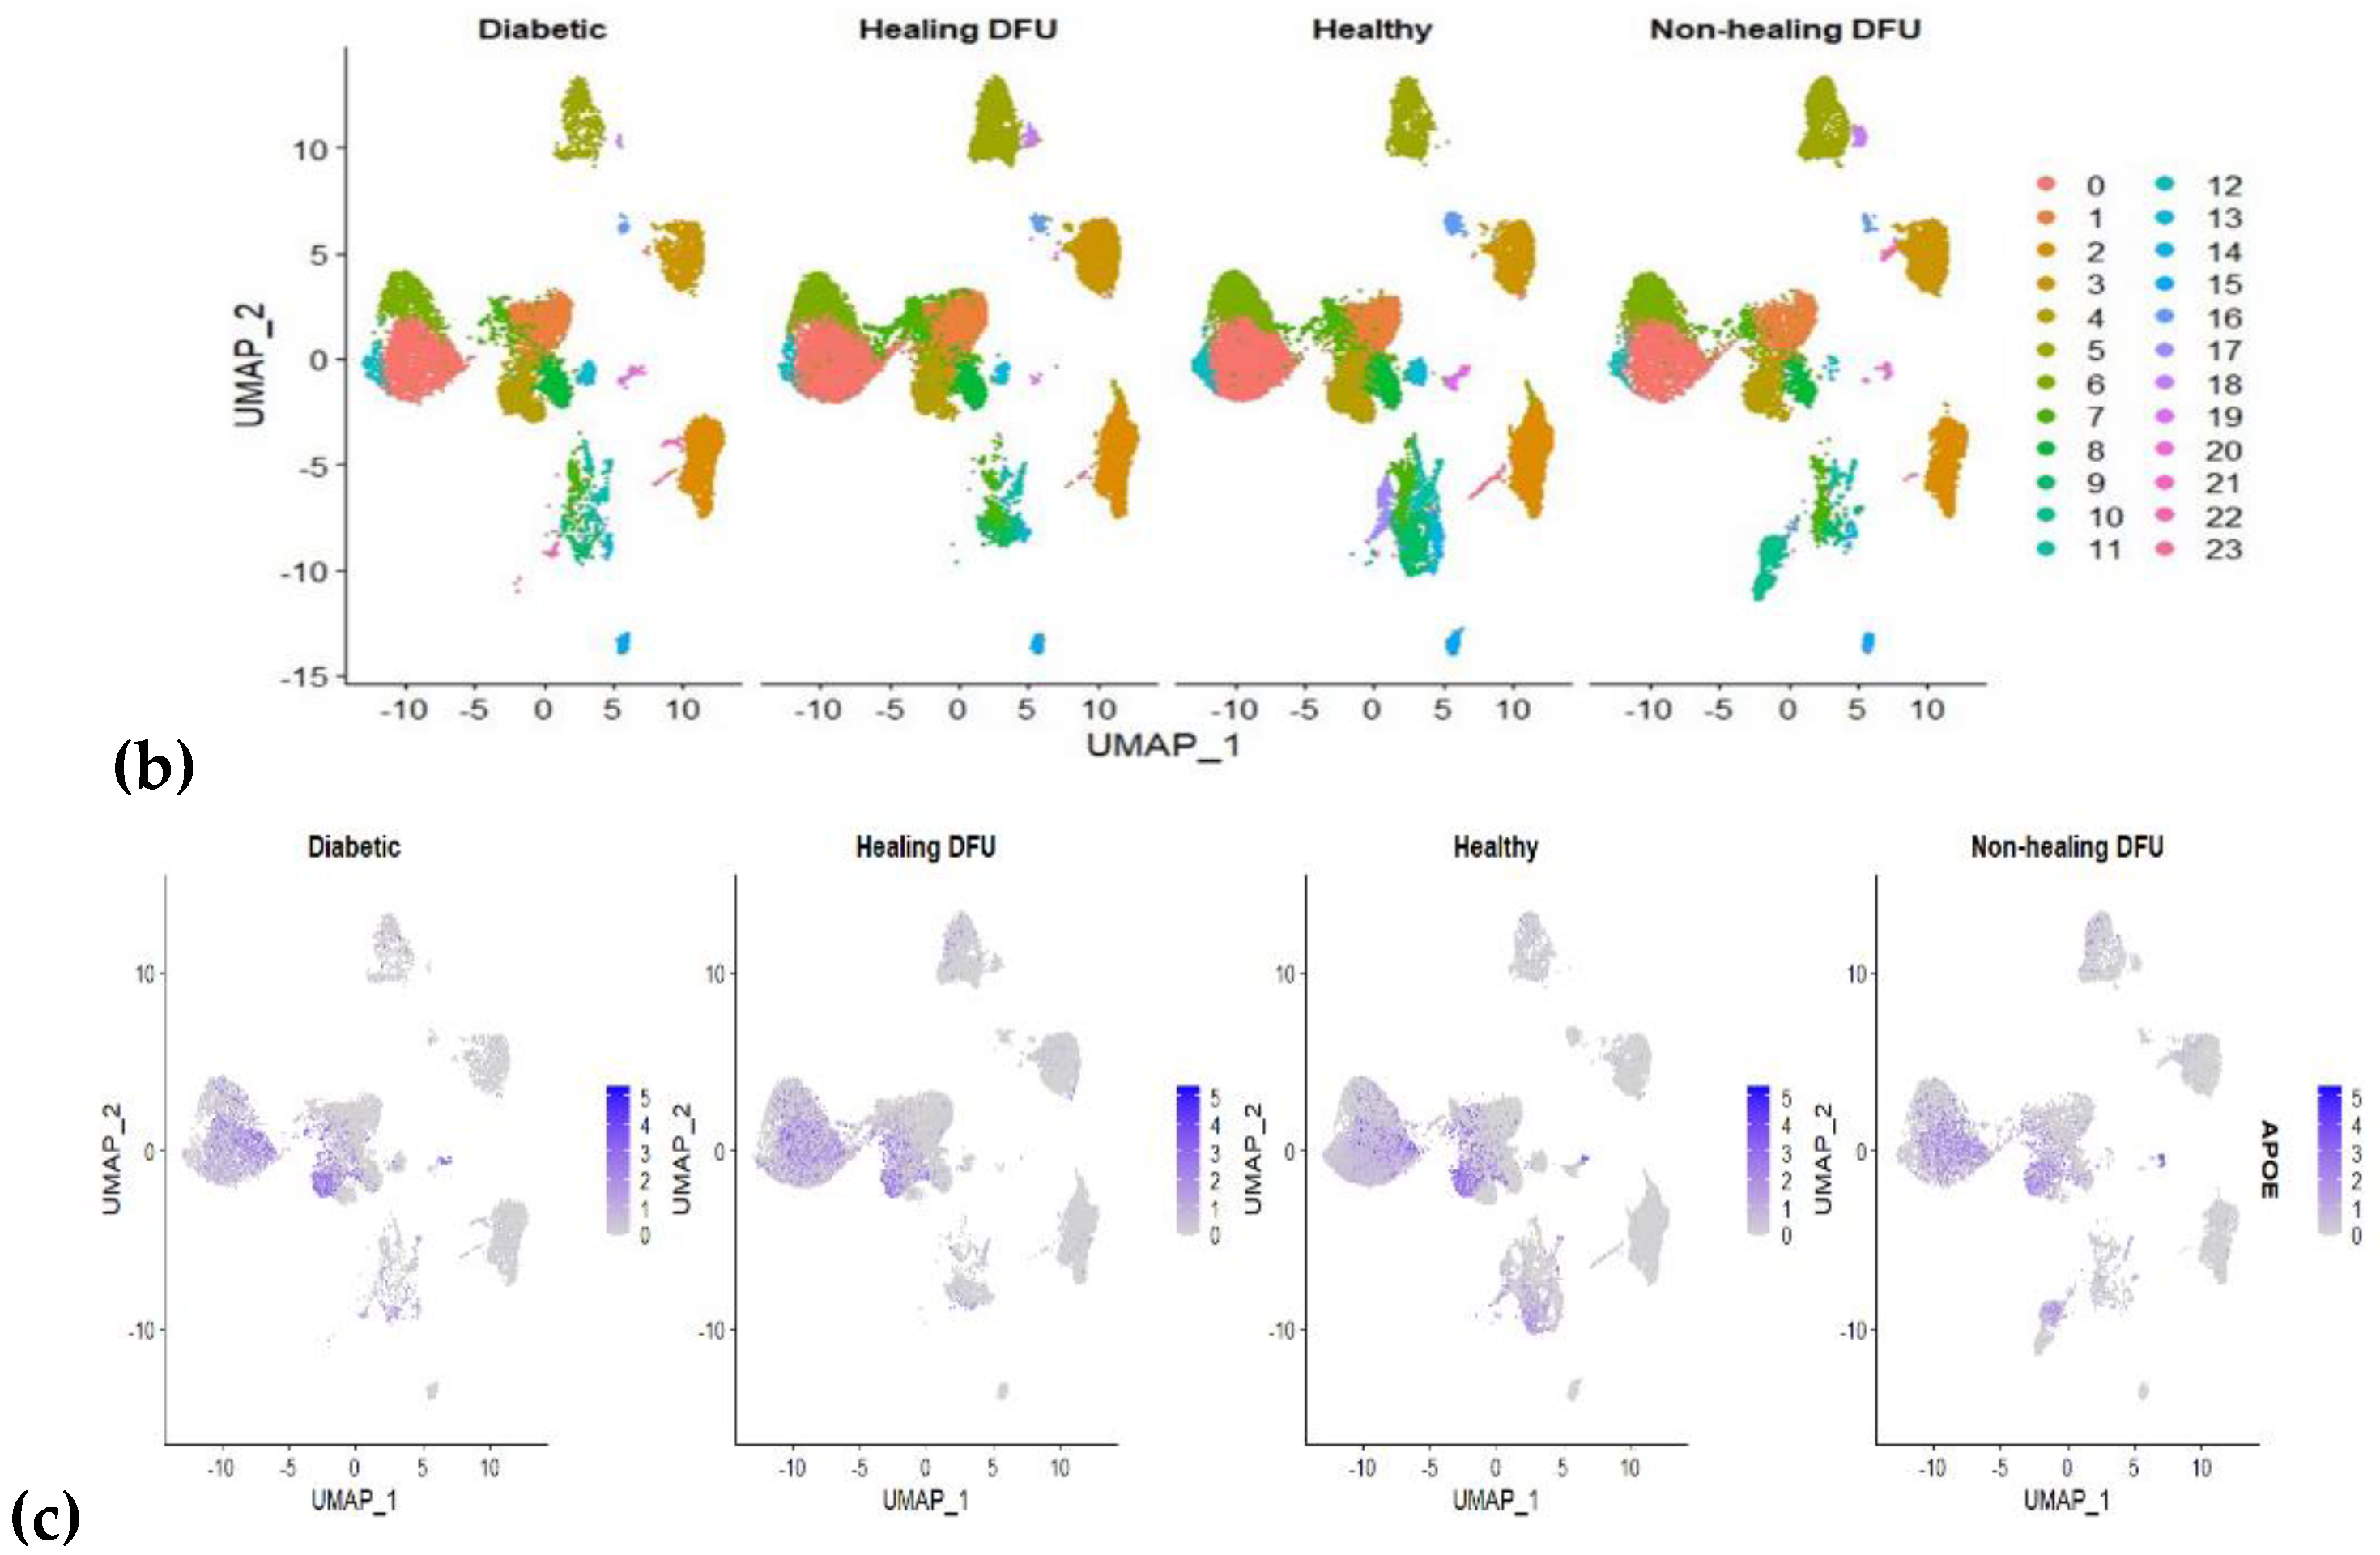
We used the foot dataset from Theocharidis et al. [12], which contained four levels of DFU severity: control (Healthy), Diabetic, Healing, and non-healing. Following the documented data processing methodology, we developed a UMAP plot showing the different clusters. Figure 5 below shows the UMAP cluster in its integrated form and split by severity.
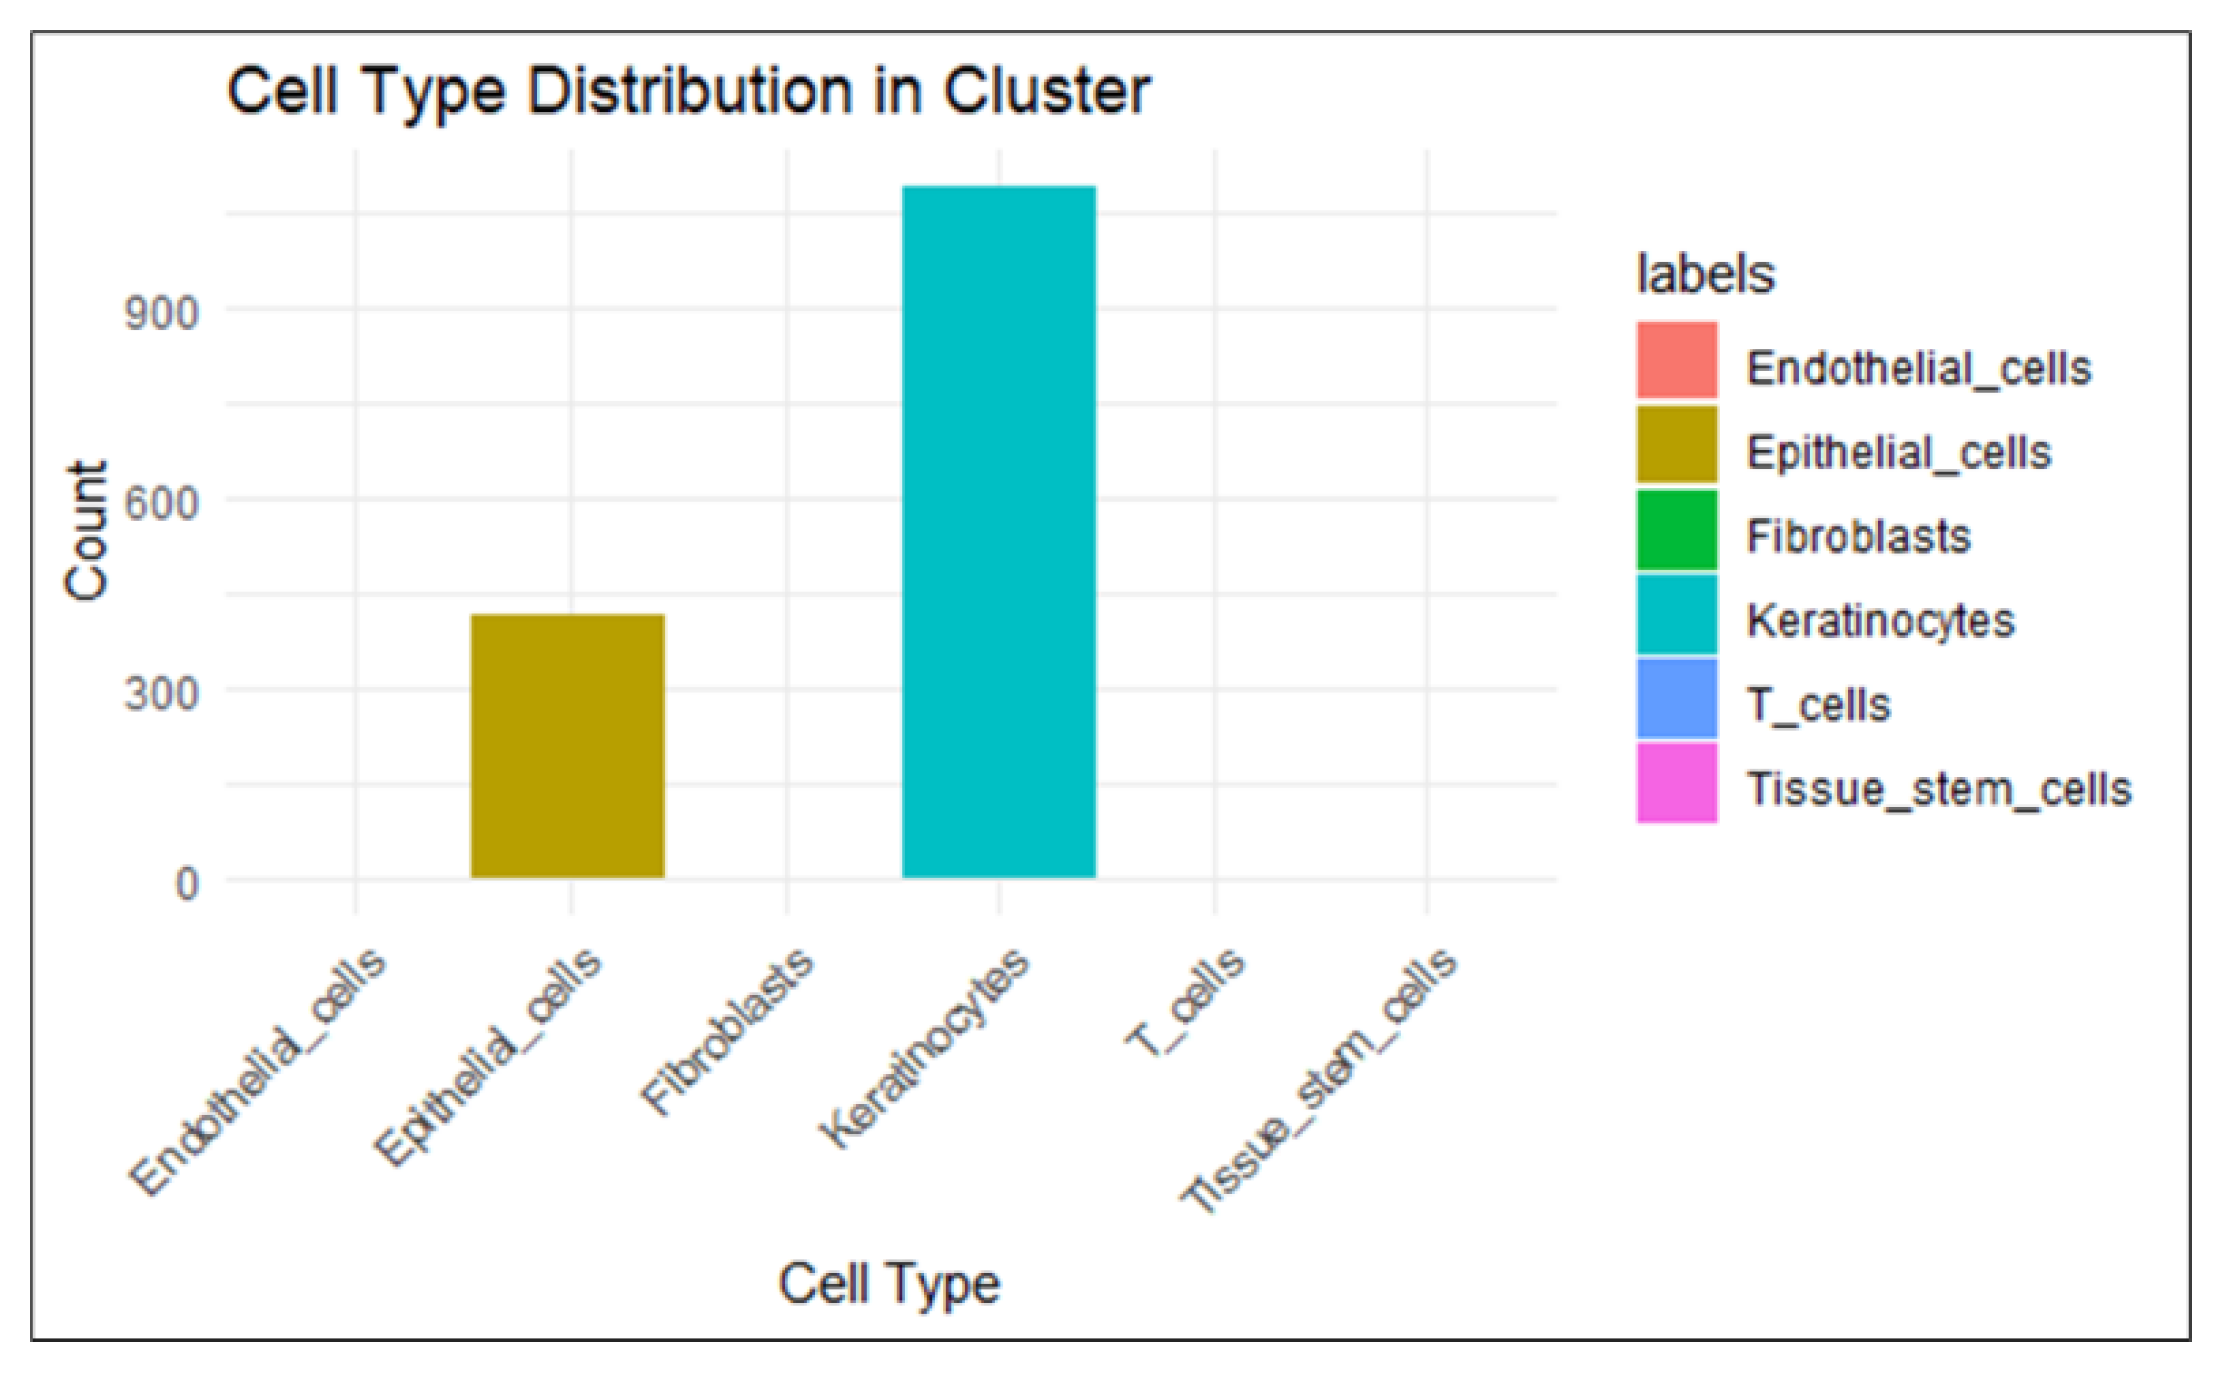
Cluster 10 is uniquely absent from the Control, Diabetic, and Healing DFU datasets and entirely surfaces in the non-healing DFU. We also see that the APOE gene is uniquely expressed in this cluster. Using the Singlr Seurat package[13] to find the cell type the cluster is made of, we identify it as the Keratinocyte cell type and Epithelial cells. Figure 6 below shows a bar plot of the composition of the cells in cluster 10.

3. Discussion

The Albumin test is a standard blood examination that measures the levels of Albumin in the blood[14]. Albumin, a protein manufactured by the liver, is vital for maintaining the oncotic pressure within blood vessels, which helps prevent fluid from leaking out of the bloodstream into the surrounding tissues. This test is commonly employed to evaluate liver function and nutritional well-being. Deviations in Albumin levels can indicate various health issues, including liver or kidney disorders, which may be complications of Diabetic Foot Ulcer
Lu Shi et al.[15] report that albumin levels, as indicated by blood tests, play a significant factor in determining the risk of a person developing DFU. On the other hand, the creatinine test is a laboratory test that measures the level of creatinine in your blood[16]. Creatinine is a waste product produced by the muscles from the breakdown of a compound called creatine. The kidneys filter creatinine from the blood and excrete it into the urine.
Lawrence et al. [1] hhave already done extensive work to show a significant link between Mexican Americans and non-Hispanic whites regarding this disease. We examined the Albumin Creatinine Ratio (ACR) test as a risk indicator between the Hispanic and non-Hispanic populations. The ACR test, a crucial measure in assessing kidney function and potential kidney damage, provides insights into the overall health risks associated with these populations. This analysis is crucial for understanding the broader implications of ethnic differences in chronic disease risk and management, particularly for conditions like diabetes that heavily impact kidney health.
The other blood tests assessed in the Mean Decrease in Accuracy also validate the ACR. They can be generally grouped as lipid tests (LDL and VLDL Cholesterol), Metabolism (Calcium), White blood cells (Neutrophils/ 100 Leukocytes), and red blood cells (Erythrocytes). Recent studies have shown a significant link between ACR and dyslipidemia, characterized by abnormal lipid levels.[11,17,18]. High ACR levels are frequently associated with elevated triglycerides, LDL cholesterol, and reduced HDL cholesterol. These lipid abnormalities contribute to the progression of cardiovascular diseases, underscoring the interconnectedness of kidney and cardiovascular health.
The lipid tests can be linked to several gene names, one of which is the APOE gene. When APOE is assessed along with other genes linked to various other significant tests, APOE shows an unmistakable trend in severity. Erdogan Mehmet et al. attempt to show a link between Type 2 Diabetes and DFUS using statistical methods with the conclusion that a lack of association between APOE and Type 2 DFUs may be sure to ethical differences [19]. Our Bulk RNA and Single-Cell RNA data analysis certainly points to strong ties between APOE and DFU, especially non-healing DFU. This will be one of the focuses of future studies.
Overall, the study shows how the use of hundreds of thousands of EHR can reduce and inform the search space of molecules in a few samples of bulk-single cell transcriptomics and identify molecular markers of severity of DFU.

4. Materials and Methods

4.1:. Data Sourcing
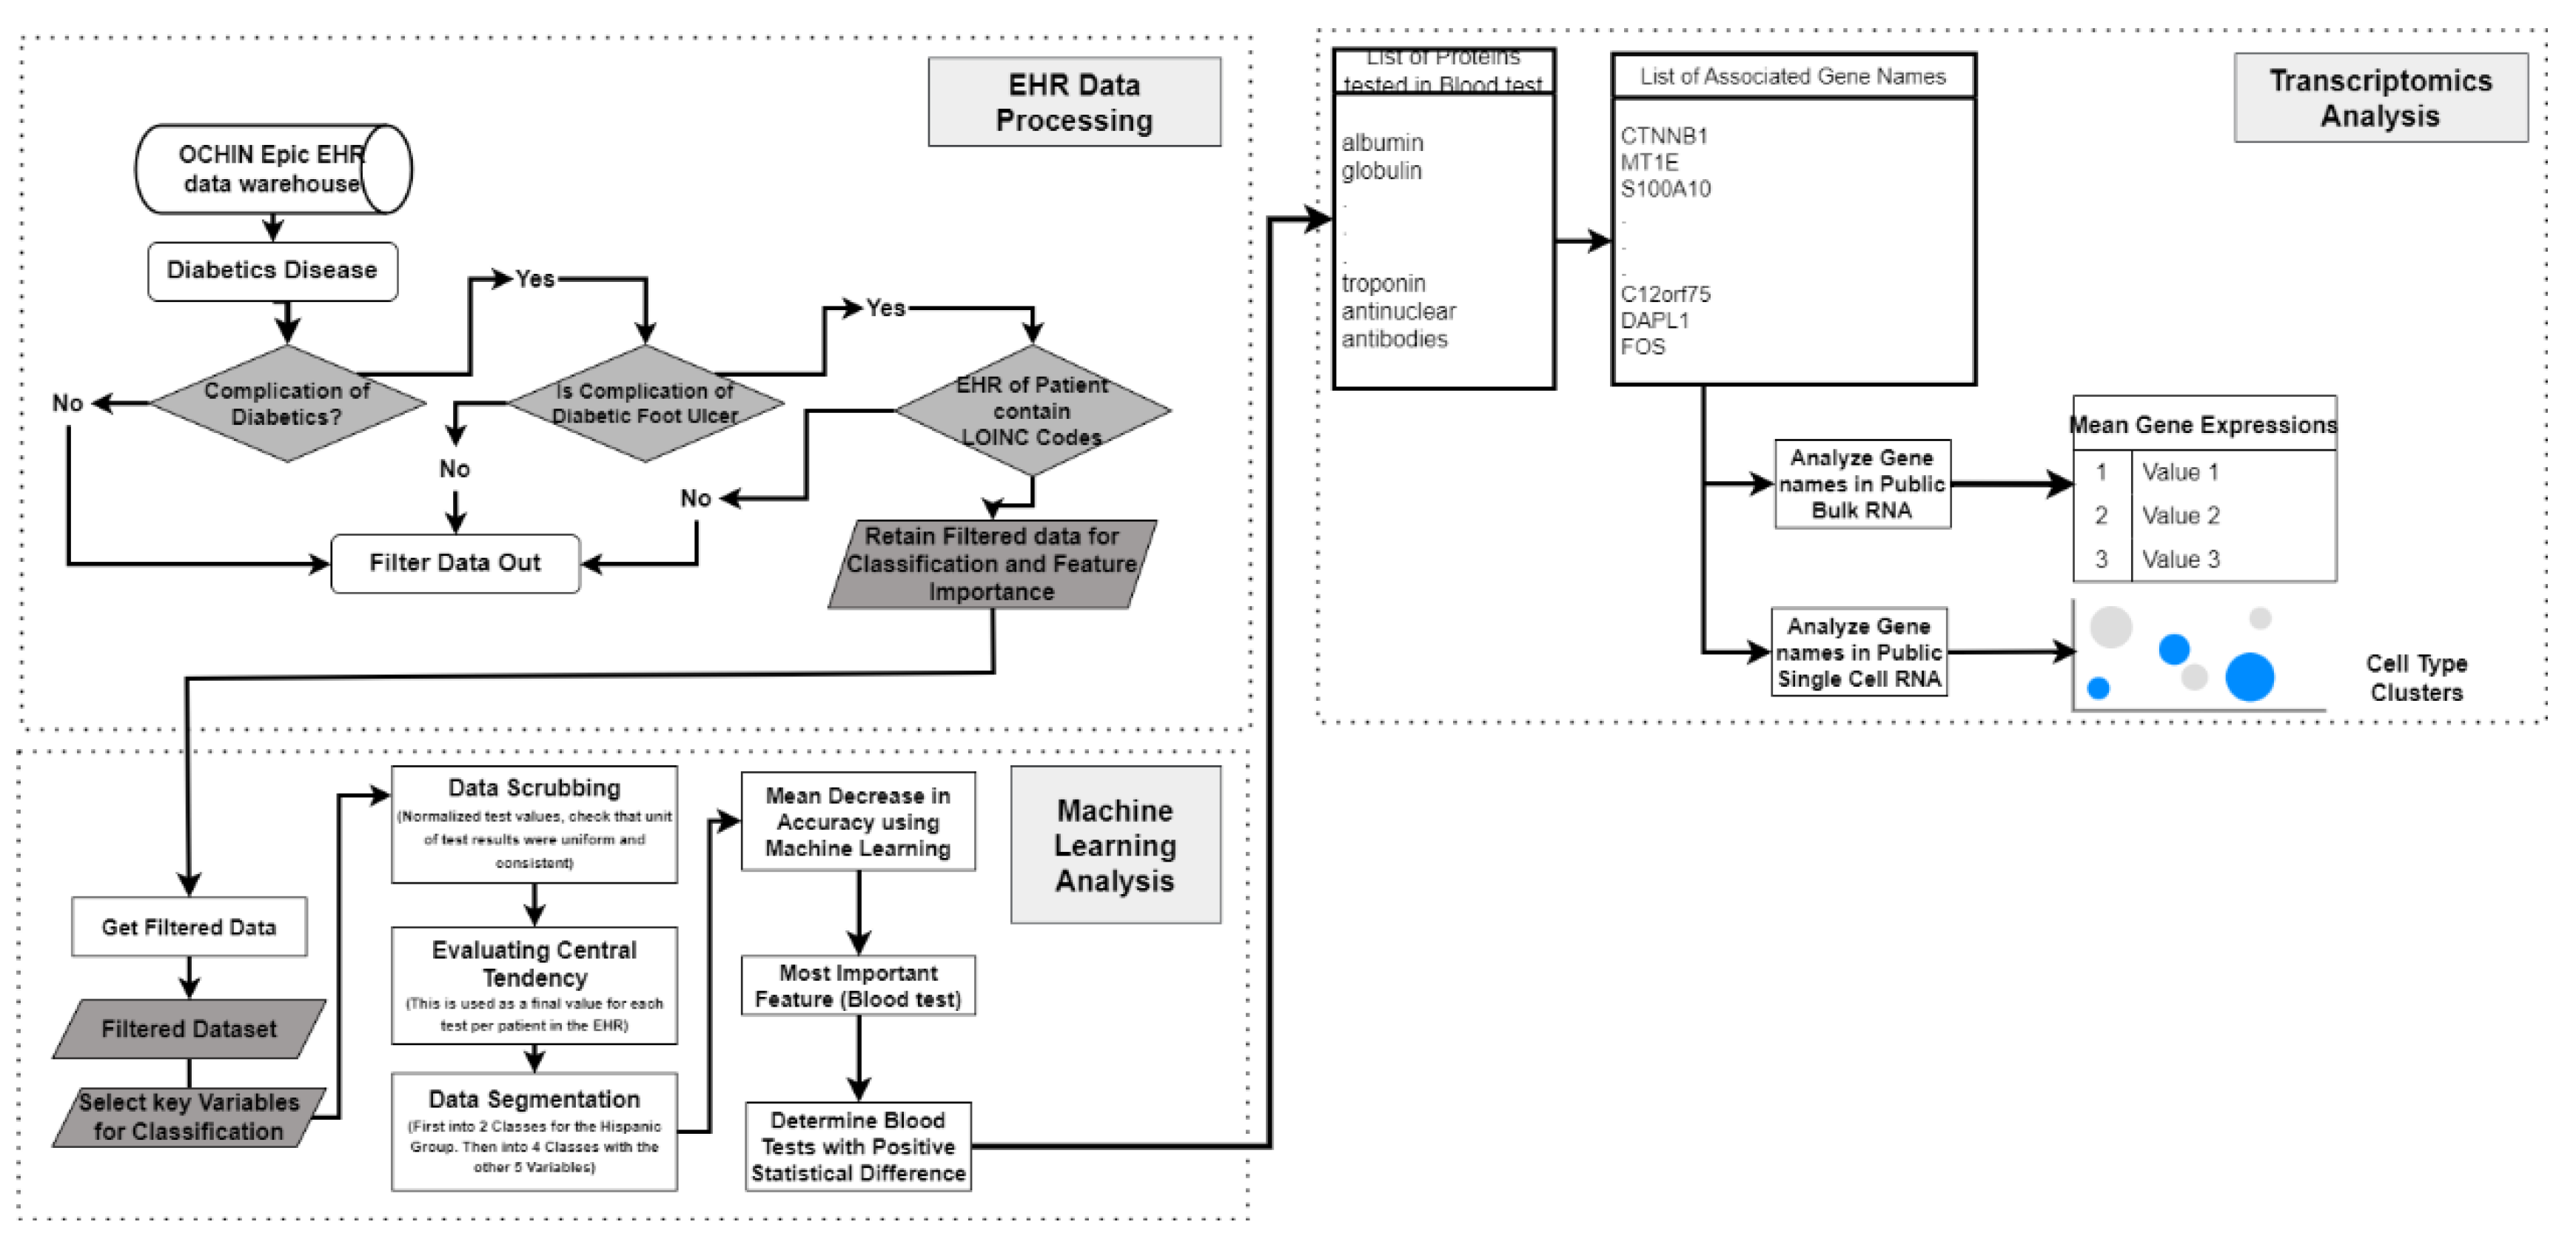
The dataset utilized in this study was sourced from the OCHIN database[20]. The OCHIN database has been utilized and referenced by over 300 research works, dating back to its earliest known application in 2007. Approximately 26 of these studies are specifically focused on diabetes-related research. The contributions of other research teams, such as Chamine et al [21] and Gemelas et al [22] Leveraging the OCHIN database has significantly enhanced our knowledge of healthcare outcomes and patient populations, shedding light on various medical conditions and how quality datasets can advance the field of healthcare research. After data acquisition, we filter data to ensure data integrity in the rest of the studies. The steps taken are detailed in Figure 7 below.

4.2. Data Preprocessing

Because the dataset is pooled from several medical facilities, there is a likelihood of high variance in LOINC code entries due to varying units of measurements or data entry protocols[23]Careful and thorough data scrubbing is carried out to ensure this isn't a challenge. We evaluate the normal range for each text, cross-referencing with recorded lab tests. We evaluate the median value for each of the loins codes for each test and use this value to determine a threshold beyond which test results are considered an error. Tests considered human error are excluded. Overall, about 5% of the test results were excluded.
After this process, we carry out data segmentation to apply machine learning algorithms to the dataset. We especially check for data imbalance within segmentation and significant differences to ensure the validity of our findings. We used the Random Forest machine learning algorithm to determine the Mean Decrease in accuracy.

4.3. Machine Learning

Random Forest is a popular machine-learning algorithm known for its versatility and robustness. It is based on the concept of ensemble learning, where multiple decision trees are combined to make robust predictions. Random Forest offers exceptional performance in various tasks such as classification, regression, and anomaly detection. The Random Forest algorithm operates by constructing a multitude of decision trees during the training phase. Each tree is built using a random subset of the original features and a random subset of the training data, utilizing a technique known as bootstrap aggregation or "bagging." These individual trees collectively form a forest[24]. After the Mean Decrease in Accuracy is evaluated, the lab test labels are cross-referenced in the LOINC code database[25] to ascertain the protein names and associated genes. These are then cross-referenced in the RNA datasets.

4.4. Transcriptomics

In this study, we utilized the Bulk RNA dataset previously published by Ran et al. [10] which consisted of 8 healthy samples, 7 Diabetic healing DFU samples, and 6 Diabetic non-healing samples. Processing steps were as prescribed in the paper. Georgios Theocharidis et al. previously published the single-cell RNA dataset used in this study.[12]. The dataset consists of 8 healthy patients, 6 Diabetic non-DFU patients, 7 Diabetic healing DFU patients, and 4 Diabetic non-healing DFU patients. All processing steps were as prescribed in the paper. After the data integration, we used the SinglR Cell-Type Annotation package to annotate the clusters and perform further downstream analysis.
This research was, in part, funded by the National Institutes of Health (NIH) Agreement NO. 1OT2OD032581-01. The views and conclusions contained in this document are those of the authors and should not be interpreted as representing the official policies, either expressed or implied, of the NIH.

References

  1. Lavery, L.A., et al. , Diabetic foot syndrome: evaluating the prevalence and incidence of foot pathology in Mexican Americans and non-Hispanic whites from a diabetes disease management cohort. Diabetes Care, 2003, 26, 1435–8. [Google Scholar] [CrossRef] [PubMed]
  2. Clayton, E.O. , et al., Racial and Ethnic Disparities in the Management of Diabetic Feet. Curr Rev Musculoskelet Med, 2023, 16, 550–556. [Google Scholar] [CrossRef] [PubMed]
  3. Oliver, T.I. and M. Mutluoglu, StatPearls. Diabetic Foot Ulcer. 2023, Treasure Island (FL): StatPearls Publishing.
  4. Wagner, F.W., Jr. , The dysvascular foot: a system for diagnosis and treatment. Foot Ankle, 1981, 2, 64–122. [Google Scholar] [CrossRef] [PubMed]
  5. Arruda-Olson, A.M. , et al., Leveraging the Electronic Health Record to Create an Automated Real-Time Prognostic Tool for Peripheral Arterial Disease. Journal of the American Heart Association, 2018, 7, e009680. [Google Scholar] [CrossRef] [PubMed]
  6. Wang, R. , et al., Derivation and validation of essential predictors and risk index for early detection of diabetic retinopathy using electronic health records. Journal of Clinical Medicine, 2021, 10, 1473. [Google Scholar] [CrossRef] [PubMed]
  7. Ren, Y. , et al., Single-cell RNA sequencing integrated with bulk RNA sequencing analysis identifies a tumor immune microenvironment-related lncRNA signature in lung adenocarcinoma. BMC Biology, 2024, 22, 69. [Google Scholar] [CrossRef] [PubMed]
  8. Wang, X. , et al., Integration of scRNA-seq and bulk RNA-seq constructs a stemness-related signature for predicting prognosis and immunotherapy responses in hepatocellular carcinoma. Journal of Cancer Research and Clinical Oncology, 2023, 149, 13823–13839. [Google Scholar] [CrossRef] [PubMed]
  9. Bonnet, J.-B. and A. Sultan, Narrative Review of the Relationship Between CKD and Diabetic Foot Ulcer. Kidney International Reports, 2022, 7, 381–388. [Google Scholar] [CrossRef] [PubMed]
  10. Chen, R. Deng, and L. Zou, Analysis of Bulk Transcriptome Sequencing Data and in vitro Experiments Reveal SIN3A as a Potential Target for Diabetic Foot Ulcer. Diabetes Metab Syndr Obes, 2023, 16, 4119–4132. [Google Scholar] [CrossRef] [PubMed]
  11. He, X. , et al., Association of remnant cholesterol with decreased kidney function or albuminuria: a population-based study in the U.S. Lipids in Health and Disease, 2024, 23, 2. [Google Scholar] [CrossRef] [PubMed]
  12. Theocharidis, G. , et al., Single cell transcriptomic landscape of diabetic foot ulcers. Nature Communications, 2022, 13, 181. [Google Scholar] [CrossRef]
  13. Aran, D. , et al., Reference-based analysis of lung single-cell sequencing reveals a transitional profibrotic macrophage. Nature Immunology, 2019, 20, 163–172. [Google Scholar] [CrossRef] [PubMed]
  14. Infusino, I. and M. Panteghini, Serum albumin: Accuracy and clinical use. Clinica Chimica Acta 2013, 419, 15–18. [Google Scholar] [CrossRef] [PubMed]
  15. Shi, L. , et al., A potent weighted risk model for evaluating the occurrence and severity of diabetic foot ulcers. Diabetol Metab Syndr, 2021, 13, 92. [Google Scholar] [CrossRef] [PubMed]
  16. Jain, A., R. Jain, and S. Jain, Determination of Blood Creatinine, in Basic Techniques in Biochemistry, Microbiology and Molecular Biology: Principles and Techniques. 2020, Springer US: New York, NY. 201-203.
  17. Wang, Y.-X. , et al., Elevated triglycerides rather than other lipid parameters are associated with increased urinary albumin to creatinine ratio in the general population of China: a report from the REACTION study. Cardiovascular Diabetology, 2019, 18, 57. [Google Scholar] [CrossRef] [PubMed]
  18. Xue, J. , et al., Triglycerides to high-density lipoprotein cholesterol ratio is superior to triglycerides and other lipid ratios as an indicator of increased urinary albumin-to-creatinine ratio in the general population of China: a cross-fsectional study. Lipids in Health and Disease, 2021, 20, 13. [Google Scholar] [CrossRef] [PubMed]
  19. Mehmet, E. , et al., The relationship of the apolipoprotein E gene polymorphism in Turkish Type 2 Diabetic Patients with and without diabetic foot ulcers. Diabetes & Metabolic Syndrome: Clinical Research & Reviews, 2016, 10 (Supplement 1), S30–S33. [Google Scholar]
  20. OCHIN. [cited 2024 2/1/2024]; Available from: https://ochin.org/research/.
  21. Chamine, I. , et al., Acute and Chronic Diabetes-Related Complications Among Patients With Diabetes Receiving Care in Community Health Centers. Diabetes Care, 2022, 45, e141–e143. [Google Scholar] [CrossRef] [PubMed]
  22. Gemelas, J. , et al., Changes in diabetes prescription patterns following Affordable Care Act Medicaid expansion. BMJ Open Diabetes Research and Care, 2021, 9 (Suppl 1), e002135. [Google Scholar] [CrossRef] [PubMed]
  23. Li, J. , et al., Why is there variation in test ordering practices for patients presenting to the emergency department with undifferentiated chest pain? A qualitative study. Emergency Medicine Journal, 2021, 38, 820. [Google Scholar] [CrossRef]
  24. Breiman, L. , Random Forests. Machine Learning, 2001, 45, 5–32. [Google Scholar] [CrossRef]
  25. Forrey, A.W. , et al., Logical observation identifier names and codes (LOINC) database: a public use set of codes and names for electronic reporting of clinical laboratory test results. Clin Chem, 1996, 42, 81–90. [Google Scholar] [CrossRef] [PubMed]
Figure 1. Workflow illustrating the stages from data sourcing, preprocessing, and classification/feature extraction to feature translational studies, culminating in Bulk RNA and Single Cell RNA analyses.
Preprints 115378 g001
Figure 5. Figure 10: Uniform Manifold Approximation and Projection (UMAP) Plot of Single-Cell RNA Sequenced dataset. (a) shows the UMAP plot of the integrated dataset, and (b) shows the UMAP plot split by sample type. As can be seen, cluster 10 is interestingly unique to the non-healing DFU sample. (c) shows the gene expression across the UMAP and distinctly in Cluster 10 for only the non-healing DFU sample.
Preprints 115378 g005aPreprints 115378 g005b
Figure 6. Cell Type Distribution in Cluster: The bar graph displays the distribution of various cell types within a specific cluster, highlighting the predominance of keratinocytes and Epithelial cells.
Preprints 115378 g006
Figure 7. Workflow of Integrating EHR Data and Transcriptomics Analysis for Diabetic Foot Ulcer Study.
Preprints 115378 g007
Table 1. A table of laboratory tests that are statistically significant differentiates between Hispanic and non-Hispanic groups. The P-value is evaluated using the Mann-Whitney U test.
Feature
Normal Values
Mean (Hispanic) Mean
(non-Hispanic)
Median (Hispanic) Median (non-Hispanic) P-value (Mann Whitney U test)
Alkaline phosphatase 44-147 IU/L 107.74 99.64 96.5 90.5 1.26e-14
Albumin/Creatinine (U) [Mass ratio], Urine 0-30 mg/g 746.78 454.4 130 64.375 5.85e-14
Urea nitrogen/Creatinine 10-20 20.76 18.88 20 18 2.7e-18
Coagulation tissue factor-induced 0.8-1.1 2 2.99 1.2 2.65 0.000986
Albumin/Globulin, [ratio] Blood 1-2 1.34 1.38 1.35 1.375 0.00022
Monocytes 0.02-0.08 0.56 0.62 0.52 0.5845 2e-19
Glomerular filtration rate 90- 120 86.71 81.18 91 82.5 9.9e-13
Erythrocyte mean corpuscular hemoglobin concentration 32-36 32.99 32.79 33.15 32.9 2.57e-9
Erythrocytes 4.2-6.1 4.364 4.48 4.375 4.5 1.16e-11
Platelet mean volume 8-12 10.48 10.32 10.4 10.3 0.000266
Lymphocytes/100 leukocytes 20%-40% 26.80 26.37 26.6 25.875 0.00306
Neutrophils 2500-7000 3294.91 2339.42 3893.5 52 0.000549
Table 2. Mean Gene expression levels in Bulk RNA Dataset for a gene associated with a significant blood test in the diagnosis of DFU. It also reflects the various severity of the DFU. APOE shows a significant difference in mean expression as severity increases.
Associated Gene Names Control Healer Non-Healer Kruskal-Wallis Test - Statistic P-value by Mann Whitney U Test (P>= 0.01)
Albumin ALB 0.205592661 0.008977797 0.029324667 8.92857 0.0115
Creatinine CKM 0.499565985 0.173955302 0.207658008 3.56275 0.168406596
SLC22A12 0.006241889 0 0.077868848 3.1312025 0.208962
SLC22A2 0.010733984 0.004172606 0.006355688
GATM 55.79607655 8.327619645 9.674862405 9.7249536 0.0077313
CKB 93.50450349 52.65157717 54.05675365 3.030303 0.2197748
CKMT1A 46.5820514 50.68992477 43.91039501 0.8126159 0.6661049
CKMT1B 36.42784045 37.23741686 36.16401885 0.3178726 0.853050
CKMT2 4.13219376 0.822784598 0.728522893 11.32522 0.0034734
Cholesterol LDLR 70.72075147 92.85914778 118.6011276 3.725572 0.155239
PCSK9 5.25025018 2.867216518 3.207883812 5.454545 0.0653974
APOE 117.7178759 27.56887668 15.82637224 13.18058 0.0013736
Disclaimer/Publisher’s Note: The statements, opinions and data contained in all publications are solely those of the individual author(s) and contributor(s) and not of MDPI and/or the editor(s). MDPI and/or the editor(s) disclaim responsibility for any injury to people or property resulting from any ideas, methods, instructions or products referred to in the content.
Copyright: This open access article is published under a Creative Commons CC BY 4.0 license, which permit the free download, distribution, and reuse, provided that the author and preprint are cited in any reuse.
Prerpints.org logo

Preprints.org is a free preprint server supported by MDPI in Basel, Switzerland.

Subscribe

© 2024 MDPI (Basel, Switzerland) unless otherwise stated