Preprint
Article

Coupling of Urban-Rural Transformation and Ecological Environment in Mountainous and Hilly Counties in the Middle Reaches of the Yellow River: A Case Study of Lingbao City, Henan Province

Altmetrics

Downloads

87

Views

34

Comments

0

Submitted:

17 August 2024

Posted:

19 August 2024

You are already at the latest version

Alerts
Abstract
To explore the coupling mechanism between urban-rural transformation (URT) and the ecological environment in counties forms the basis for achieving high-quality and sustainable county development. Despite the richness of research on the relationship between urban and rural development and the ecological environment, the county level remains the basic unit of rural revitalization in China, and further research on the coupling mechanism between URT and the ecological environment at this level is needed. Therefore, the study developed an evaluation system for URT, incorporated NDVI data indicators, and employed the coupling coordination degree (CCD) model along with GIS tools to investigate the spatio-temporal pattern of URT and NDVI evolution, and the CCD in each administrative village within Lingbao City. Additionally, a geoDetector model was employed to analyze the influencing factors affecting the CCD of URT and NDVI. Finally, the study explores the coupling mechanism and optimization path. The result shows that: (1) During the study period, the URT level in administrative villages within the study area markedly improved, while NDVI exhibited an increasing-then-decreasing trend; (2) The CCD between URT and NDVI in the northern and central regions of the study area is higher than that in the southern region, with an overall low level; (3) The spatial heterogeneity of CCD is significant, largely influenced by socio-economy, natural environment, policy funds, and geographical location, where the elements comprising CCD mutually influence each other; (4) Drawing upon the coupling and coordination dynamics between URT and the ecological environment within Lingbao City, this research categorizes it into seven types with distinct optimization paths. This study provides a valuable reference for guiding the high-quality and sustainable development strategies for mountainous and hilly counties within the Yellow River basin.
Keywords: 
Subject: Environmental and Earth Sciences  -   Geography

1. Introduction

The Since China’s reform and opening up, rapid industrialization and urbanization have accelerated economic development and bolstered international influence. Concurrently, these processes have significantly impacted the transformation of urban-rural relations [1]. This shift is characterized by trends towards urban-rural integration and equity [2]. These changes have brought about notable transformations in factors such as population density, land use patterns, and industrial structures [3], particularly in ecologically vulnerable regions like mountainous areas and the Yellow River basin. This transformation has led to a range of problems, including reduced vegetation cover, fragmented ecological corridors, increased environmental pressures, and spatial fragmentation [4,5]. At the county level, which serves as the fundamental unit for advancing urban-rural integration, optimizing development models and enhancing developmental capacities are critical for fostering ecological civilization [6]. Therefore, examining the coupled dynamics of urban-rural transformation (URT) and the ecological environment at the county scale, and diagnosing environmental challenges arising from this transformation across different regions, is imperative for achieving sustainable development in counties.
From the perspective of geographical human-land systems science, urban-rural territorial systems emerge from complex interactions among humanities, economics, resources, and environment [7]. Central to these systems are population dynamics, land use patterns, industrial activities, and ecological conditions, which constitute essential elements not only within social, resource, and ecological systems, but also at the core of URT [8]. Population dynamics play a pivotal role during this transformation, impacting food security and exerting ecological pressures, while also influencing other elements through individual behaviors [9,10]. Human needs, fundamental to fostering harmonious human-environmental interactions, significantly shape the ecological environment [11]. Land serves as a spatial framework for rural populations and industrial elements, providing essential support for the development of other components [12]. Industry acts as an internal driving force for rural development, ensuring both rural development and sustainable ecological environments. Furthermore, industrial upgrades influence the efficiency of land utilization [13]. Changes in the ecological environment exert significant economic impacts [14], influenced by shifts in population and land use, alongside investments in green technologies within industries [15,16,17]. In summary, the coordinated development of urban-rural populations, land use, industry, and ecological environments is indispensable for achieving URT and sustainable ecological development. Hence, understanding the mechanisms and driving forces behind their integration remains crucial [18].
From the perspective of the relationship between URT and the ecological environment, the core of URT lies in promoting fundamental changes in industrial, agricultural production, and urban-rural dynamicss [19,20]. Major challenges facing China’s urban-rural development in the new era include exacerbated contradictions in land resource allocation, widening disparities in regional urban-rural development, and increasingly prominent urban-rural environmental issues [21,22,23]. Environmental challenges associated with URT have commenced to affect the daily lives of local inhabitants, including farmers and villagers, and are impeding the healthy progression of industrialization processes, informatization, urbanization, and agricultural modernization, thereby jeopardizing future economic and social sustainability [24,25]. Existing research primarily explores the interactions between population, land, industry, and the ecological environment. Studies on population and environment reveal that population growth drives urban expansion. Analyzing factors influencing urban green spaces, it is found that population development positively affects urban green spaces, while human density has a negative impact. Socio-economic variables also influence the environment [26,27]. In studies on land and environment, observations during urban expansion show rural land transitioning from productive landscapes, cultural hubs, and ecologies into tangible entities supporting commerce and social security [26]. Deforestation and agricultural expansion continue to reduce global forest cover, with the speed and extent of land use change affecting socio-economic development and the ecological environment to varying degrees [28,29]. In terms of optimization paths, managing green infrastructure supports ecological environments, alleviating adverse impacts caused by artificialization of land, ecological fragmentation, and reduced resource availability in urban-rural development [30]. In studies on industry and the environment, it is discovered that changes in environmental climate impact economic production. The existing economic and social challenges posed by the climate today are akin in scale to the projected impacts stemming from human-induced climate change [14]. Both domestic and international subsystems of URT have significant impacts on the ecological environment. Research explores the mutual relationships between various subsystems and the ecological environment from perspectives of environmental and socio-economic impacts, land changes, and climate geography. This lays the foundation for studying the coupling mechanisms between internal elements of URT and the ecological environment. From the perspective of coupling coordination, research focuses primarily on provincial and watershed scales, emphasizing the coupling relationships between development and ecology. This includes the coordination and development relationships between ecological civilization and urbanization [31,32], the resilience and interactive coupling degrees between urbanization systems and ecological systems [12,33,34,35], the coordinated development of economic-ecological environment-tourism industry couplings [36], the coupling relationships between ecological conservation and high-quality development [37], and the coupling analysis of ecological environment and socio-economic system coordinated development [38]. Overall, domestic research has highlighted environmental issues during URT, interpreting the environmental effects triggered by various subsystems such as population, land, and industry. The application of coupling coordination models has matured relatively, addressing the coupling coordination relationships between urban-rural development and ecological environments at a macroscopic scale.
Existing research on theories and evaluation methods of URT and the application of coupling coordination models has matured. However, research into the specific coupling mechanisms linking county-level URT with ecological environments is somewhat limited. The lack of clarity in understanding the internal and external driving forces, as well as the optimization pathways, between URT and ecological environments at the county level has impeded the resolution of sustainable development challenges pertinent to urban-rural development and ecological conservation. The coupling coordination model is crucial for studying the intensity of interactions and coordination relationships among various systems [39]. Utilizing this model can elucidate the coupling coordination relationships between URT and ecological environments. Therefore, this study uses the coupling coordination model to comprehensively analyze the relationship between URT and ecological environment in Lingbao City. Additionally, geographic detectors are utilized to explore the degree of influence of each factor. Ultimately, this study aims to (1) Reveal the spatiotemporal evolution characteristics of county-level URT and ecological environment, (2) Analyze the coupling coordination and influencing factors between county-level URT and ecological environment, (3) Rnvestigate the coupling mechanisms and pathways for high-quality development of county-level URT and ecological environment. The findings will provide insights for the URT and ecological environment protection in mountainous and hilly urban areas.

2. Materials and Methods

2.1. Study Area

Lingbao City is located in the western edge of Henan Province, China (110°21’18 “E111°11 ‘35” E, 34°07’10 “N34°44’21” N), located at the junction of Henan, Shaanxi and Shanxi provinces, the easternmost end of the Qinling Mountains, the bend of the Yellow River, is the “west gate” of Henan Province (Figure 1). The terrain of Lingbao city is high in the south and low in the north,and the landform is divided into four types: mountain, hill, Yellow River terrace and river valley, which are generally “seven mountains, two plains and one river”. Lingbao City is located in hills and mountains, surrounded by mountains on three sides, the forest coverage rate is as high as 49.3%, and the vegetation coverage rate is 87.1%. By 2021, the resident population urbanization rate is 43.43%, and the ratio of the three industrial structures at the end of the year is 13.8:49.7:36.5. In the process of urban-rural transformation (URT) in the past two decades, the average URT index of Lingbao City increased from 0.089423 to 0.155936, at the same time,land transformation(LT), industrial transformation(IT) and population transformation(PT) show an upward trend,and the LT index continued to rise from 0.046506 in 2000 to 0.073379 in 2020, the IT index increased from 0.000889 in 2000 to 0.002063 in 2020, and the PT index increased from 0.016342 in 2000 to 0.023031 in 2020. In general, as a typical hilly county in the middle reaches of the Yellow River, Lingbao City has the following problems in terms of URT and ecological environment: (1) The development of Lingbao City is unbalanced between the north and the south,and the rural-urban differences is prominent. (2) In the process of URT, ecological problems are prominent, and there are major shortcomings in sustainable development. (3) The urban-rural development is not coordinated with the ecological environment, and the influencing factors, type zoning and driving mechanism are not clear. Therefore, it is urgent to clarify the spatio-temporal pattern of Lingbao City and its coupling and coordinated development level from the two-way perspective of URT and ecological environment, deeply analyze its internal influencing factors, and explore the process of URT and its environmental benefits at the county level.

2.2. Data and Index System

The data include village-level administrative boundary vector data, and relevant indicators such as Normalized Difference Vegetation Index (NDVI), population, land and industry are shown in Table 1. Based on the administrative region in 2021, the ArcGIS10.2 software is used to select the boundary vector data of administrative villages in Lingbao City. In terms of ecological environment, this study introduced NDVI to comprehensively reflect the growth status of vegetation, vegetation coverage rate and land nutrition status, as an important index system to describe ecological environment changes [40]. In addition, this study draws on existing studies and divides URT into three dimensions: PT, IT, LT [1]. At the same time, existing studies show that natural factors, human activities, geographical location and other factors will affect NDVI [9]. Therefore, these factors should be considered in the study of the impact of county URT on NDVI. Specific indicators and influencing factors are set as follows:
PT, IT and LT are the core indicators of URT (Table 1 and Table 2). Changes in average population density are used to measure the degree of PT. IT involves the direct or indirect adjustment of all aspects of the existing industrial structure, the industrial changes of each administrative village are measured by the proportion of the output value of secondary and tertiary industries in the total output value. The methodology involves superimposing the proportion of secondary and tertiary industries within Lingbao City’s total GDP with the proportion of average light data from each administrative village in the township. Blank data is interpolated using the ordinary kriging method. LT represents the change in the average construction land for each administrative village. This study extracts the average population density, average construction land, and average light data for each administrative village at the boundary between administrative villages and towns using the ‘Zone Statistics as Table’ grid data function in ArcGIS 10.2 software.
In terms of the selection of influencing factors, the distance from the Yellow River (DYR) can represent the impact of geographical factors on the ecological environment, The administrative villages near the Yellow River have better resources and land, which will affect agricultural growth and industrial construction. Meanwhile, the administrative villages near the Yellow River also face greater pressure on the ecological environment. Average slope (AS) represents topographic and geomorphic factors, and the slope will affect the development of agriculture and industry, and affect the efficiency and sustainability of land use [41], It is represented by the average slope of the administrative village. Digital Elevation Model (DEM) refers to the vertical height of the surface to the sea level. Regions with different elevations have different climate, vegetation and soil characteristics, which will directly affect the development of agriculture and ecosystem. Moreover, high-altitude regions have a greater impact on the new-type urbanization of counties [42]. It is expressed by the average elevation of administrative village. The distance from the county center (TDC) indicates the spatial relation of the administrative village to the county center, signifying the ease of transportation between the village and the county seat and the availability of urban services. This factor influences the development level of the administrative village. The distance from the city center (TCC) denotes the proximity of the administrative village to the city center and impacts the URT, economic activities, and social services within the village.

2.3. Subsection

The research data included socio-economic statistics, land use data and ecological environment data. The socio-economic statistics are mainly obtained from the Henan Statistical Yearbook and the Sanmenxia Statistical Yearbook. In the case of incomplete data, we supplemented it through the China Regional Economic Statistical Yearbook and the data of rural adjustment teams. For the land-use/land-cover (LULC), we used 30-meter resolution Landsat TM data retrieved from the Earth Resources Observation and Science (EROS) Center, part of the U.S. Geological Survey (USGS) (http://glovis.usgs.gov/).

2.4. Research Methods

2.4.1. Index of Urban-Rural Transformation

According to the principle of index system construction, the index system is divided into target layer and rule layer, and the entropy method is used to calculate the weights of indexes (Table 3).
Based on this index system, we establish a comprehensive evaluation model of urban-rural transformation (URT).
URT = PT × 0.33 + IT × 0.42 + LT × 0.25
PT which is used to reflect the spatial displacement and quantity change of population, and its change is based on population density data. IT measures the evolution of industrial structure by examining the changes in the output value of secondary and tertiary industries. LT is used to describe the evolution process of land use pattern with the change of construction land as the index. By taking into account the three indexes of population, land and industry, the model can comprehensively assess the speed and degree of URT.

2.4.2. Coupling Coordination Relationship Assessment

Urban and rural areas are components of the natural environment, and the change of any element in the process of URT will have an impact on the quality of the ecological environment [43]. The quality of ecological environment will also have a positive or negative impact on urban and rural development. Only by giving full play to the synergistic effect of urban and rural areas can the sustainable development of urban and rural areas be enhanced. The coupling coordination degree model can not only reveal the interaction intensity between urban and rural transformation and ecological environment quality, but also show the interaction intensity between them and the coordination degree between them and the development level [44]. Therefore, the model can effectively measure the relationship between URT and ecological environment.
(1)According to the results and weights after various standardized processing, the comprehensive index of URT and NDVI data in 5 years is calculated respectively. The calculation method is as follows:
F i = i = 1 n Z i j W j
T = U i + E i
Where i refers to the administrative village in the study area, where i= 1,2,3... , 439; j is each index, where j= 1,2; Where Zij is the standardized processing result of item j of administrative village i, and Wj is the weight of item j; Fi represents the i administrative village development index, which takes the URT Ui and NDVI value Ei respectively; T represents the comprehensive development index of URT and ecological environment, in which URT and NDVI index range from 0 to 1, the closer it is to 1, the higher the rural development level, and the lower the vice versa.
(2) The coupling coordination degree model includes coupling degree and coordination degree. It is used to describe whether the URT and NDVI are coordinated, so as to ensure sustainable development. Therefore, on the basis of referring to relevant research results [34,44], the calculation method of URT and NDVI coupling degree is as follows:
C = 2 × { U i × E i [ U i + E i ] 2 } 1 2
In the formula, C represents the coupling degree between URT and NDVI, and its value ranges from 0 to 1. Ui and Ei represent the urban-rural transformation of the i administrative village and the development index of NDVI respectively. Although coupling degree is a key indicator of the interaction between URT and ecological environment, it does not express whether the functions are coupled at a high or low level. In order to reflect the coupling coordination degree(CCD) between URT and NDVI more comprehensively, this study introduced the CCD to build the coupling coordination degree model between URT and NDVI:
D = C × T
In this formula, D represents the CCD between URT and NDVI, and its value range is [0~1]. T is URT and NDVI comprehensive development index.

2.4.3. GeoDetector Model

GeoDetector is a methodology designed to assess the spatially layered heterogeneity of a geographic element and the degree of its influence by various factors. It contains the factor detector, interaction detector, ecological detector, and risk detector [45]. The results show that topography and natural factors will affect the urban-rural transition and the coupling coordination degree of NDVI.
In order to explore the influence of various factors on the CCD of each administrative village in Lingbao City, this paper selected 5 factors from the dimension of topography and geographical location based on the actual situation of each administrative village in Lingbao city [11,46]. Topographic and geomorphic factors include average slope (AS) and digital elevation model (DEM). Geographical factors include the distance from the county center (TDC), the distance from the city center(TCC), and the distance from the Yellow River (DYR) [47,48]. AS and DEM reflect the natural conditions of the region and have an important impact on CCD [49]. A factor detector tool was used in this study to calculate the magnitude of each driver’s influence. It is expressed as the following equation:
q = 1 1 N σ 2 H = 1 L N h σ h 2
where h = 1,2...; L is the classification for CCD or five driving factors; Nh and N are the quantity for all variables and the classified variables, respectively. σ 2 h and σ² are the variances for all variables and the classified variables, respectively.

3. Result

3.1. Characteristics of the Spatiotemporal Evolution of the Urban-Rural Transformation

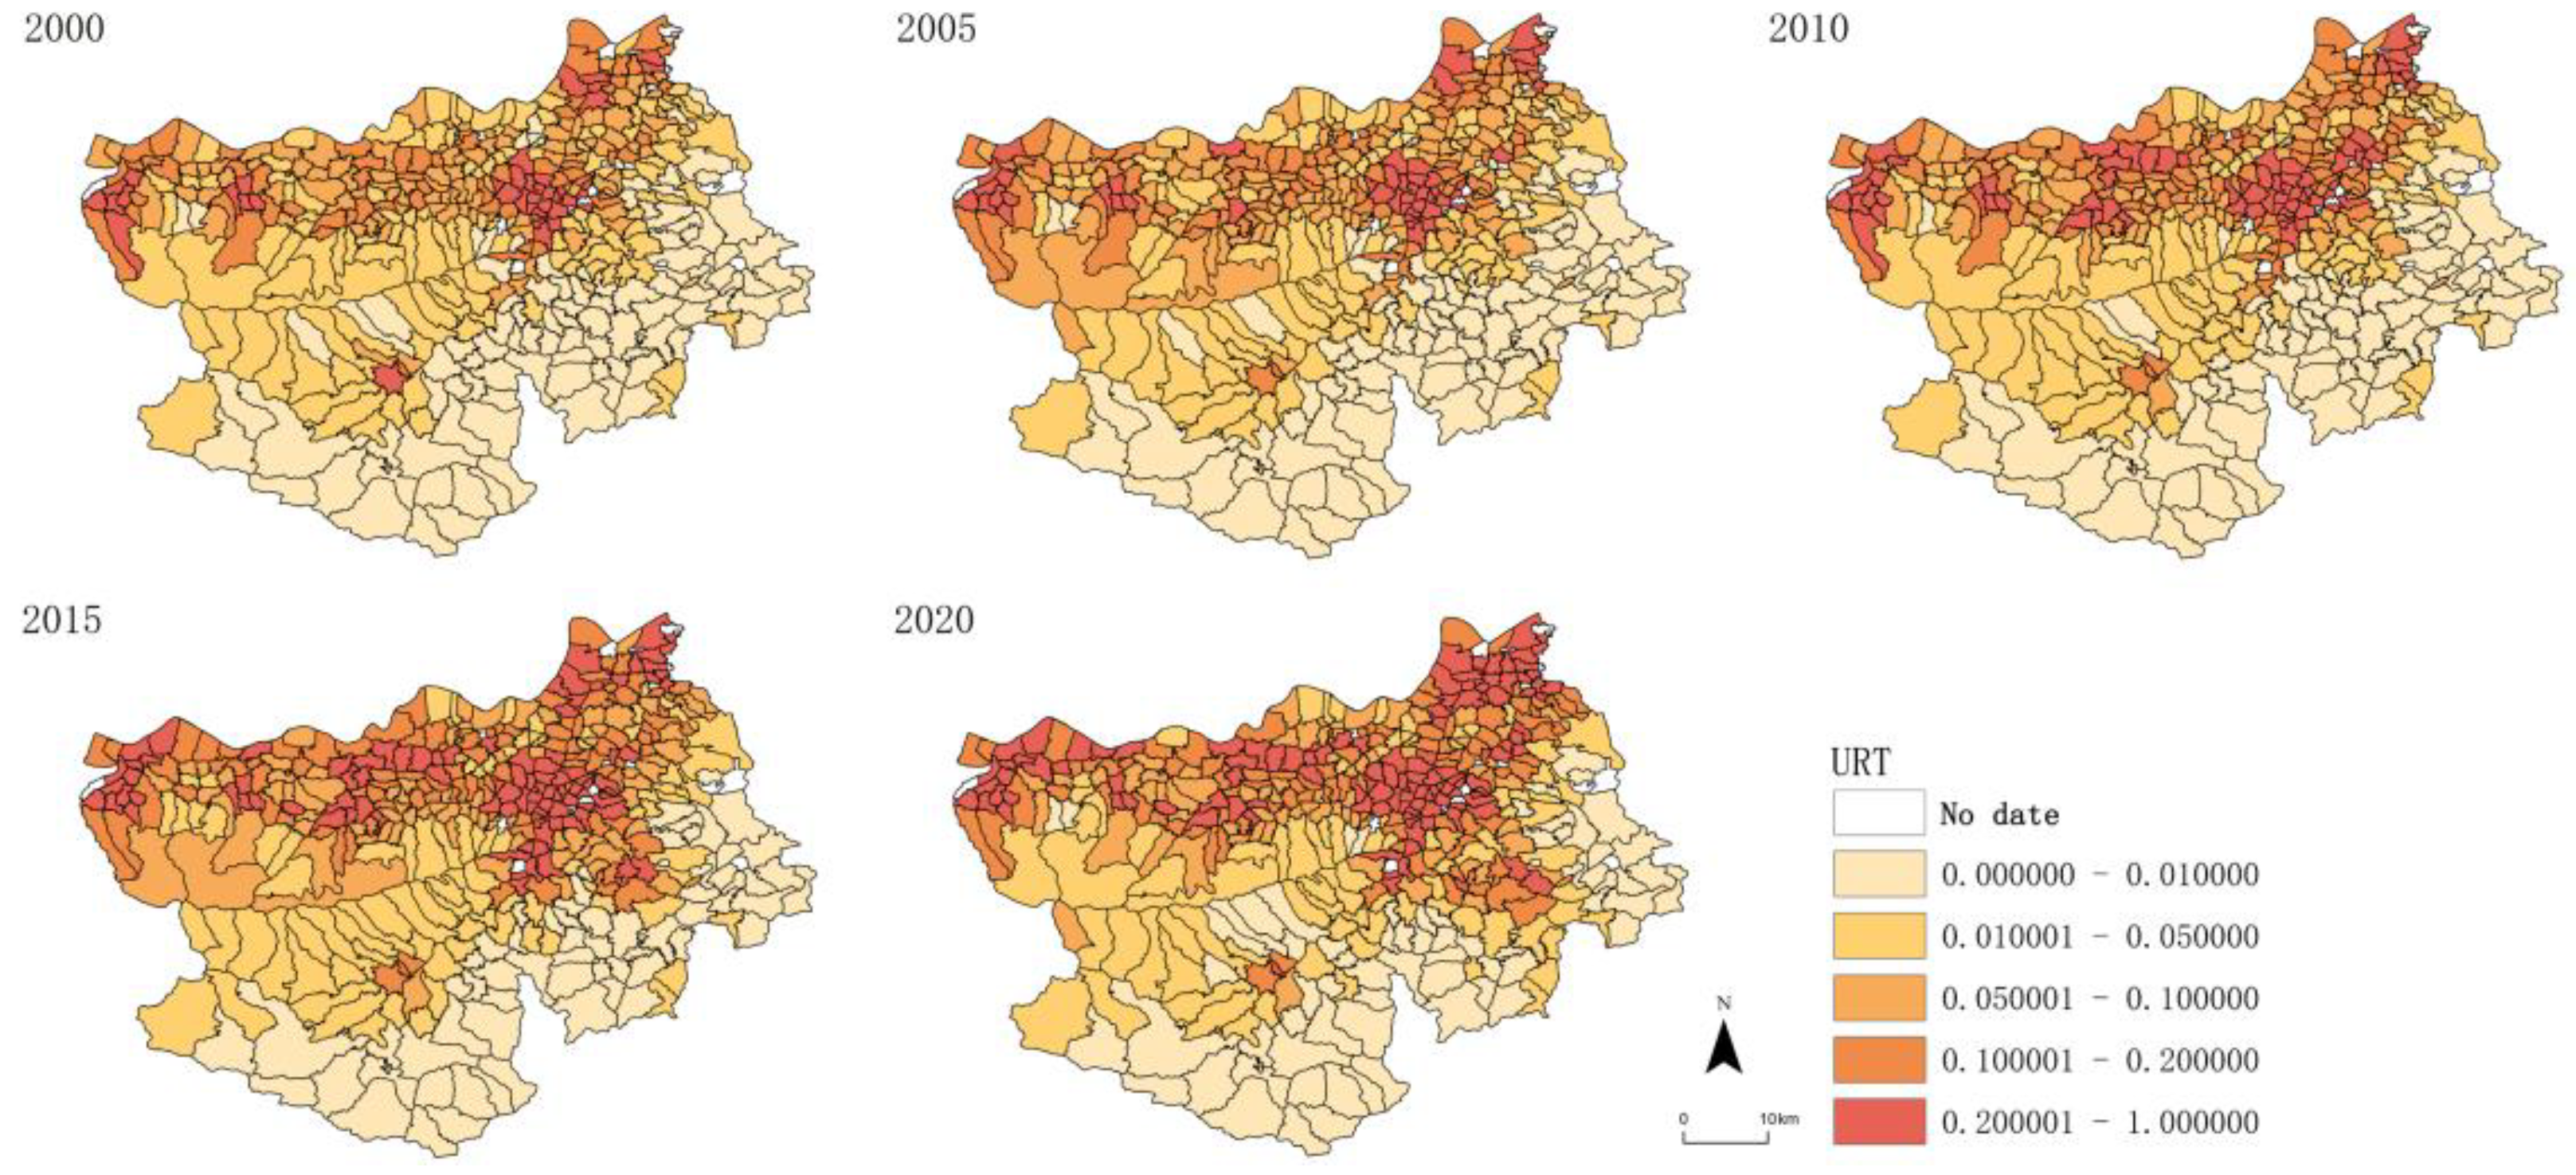
From 2000 to 2020, the level of URT has been greatly improved, Rural-urban transition shows an upward trend on the whole. In 2000, the degree of URT of administrative villages was relatively low. A total of 76.54% belong to the low, relatively low and medium administrative villages, concentrated in the southern area of Lingbao City, there are 106 administrative villages with low index value and 128 administrative villages with relatively low index value. There are 41 administrative villages with high index, accounting for 9.34% of the total. In 2005 and 2010, the number of administrative villages with low, relatively low and medium index values was 72.44% and 63.33%, respectively, showing a decreasing trend. The number of administrative villages with high index values was 49 and 72, respectively, showing a significant increase, and all of them were distributed in the northern and central areas of Lingbao City. In 2015 and 2020, the number of administrative villages with high URT index values increased significantly, the number are 100 and 121, respectively, accounting for 22.78% and 27.56% of the total, while the number of administrative villages with low, relatively low and medium index values decreased significantly, accounting for 54.44% and 51.71%, respectively (Figure 2).
From the perspective of spatial pattern, the URT of Lingbao City has undergone great changes from 2000 to 2020. In 2000, the difference between the URT in Lingbao City was obvious from north to south, and then the high-value area of URT showed a trend of expansion, while the low-value area showed a spatial contraction. In 2000 and 2005, the spatial heterogeneity of URT was obvious, showing a typical north-south differentiation and cluster distribution pattern. Along the Yellow River, a development belt with relatively high URT is formed in the northern part, and form a cluster with a relatively high URT in the central region. In 2010 and 2015, the number of administrative villages with relatively high URT increased significantly, and most of the administrative villages along the Yellow River in the north were above the middle level. The high-value area in the central region showed an obvious outward expansion trend, while the low-value area in the south showed a significant spatial decrease. In 2020, the high-value areas of URT continue to expand, but the formed villages with relatively high and medium indexes show a spatial contraction trend, which is more obvious in the southwest region.

3.2. Characteristics of the Spatiotemporal Evolution of NDVI

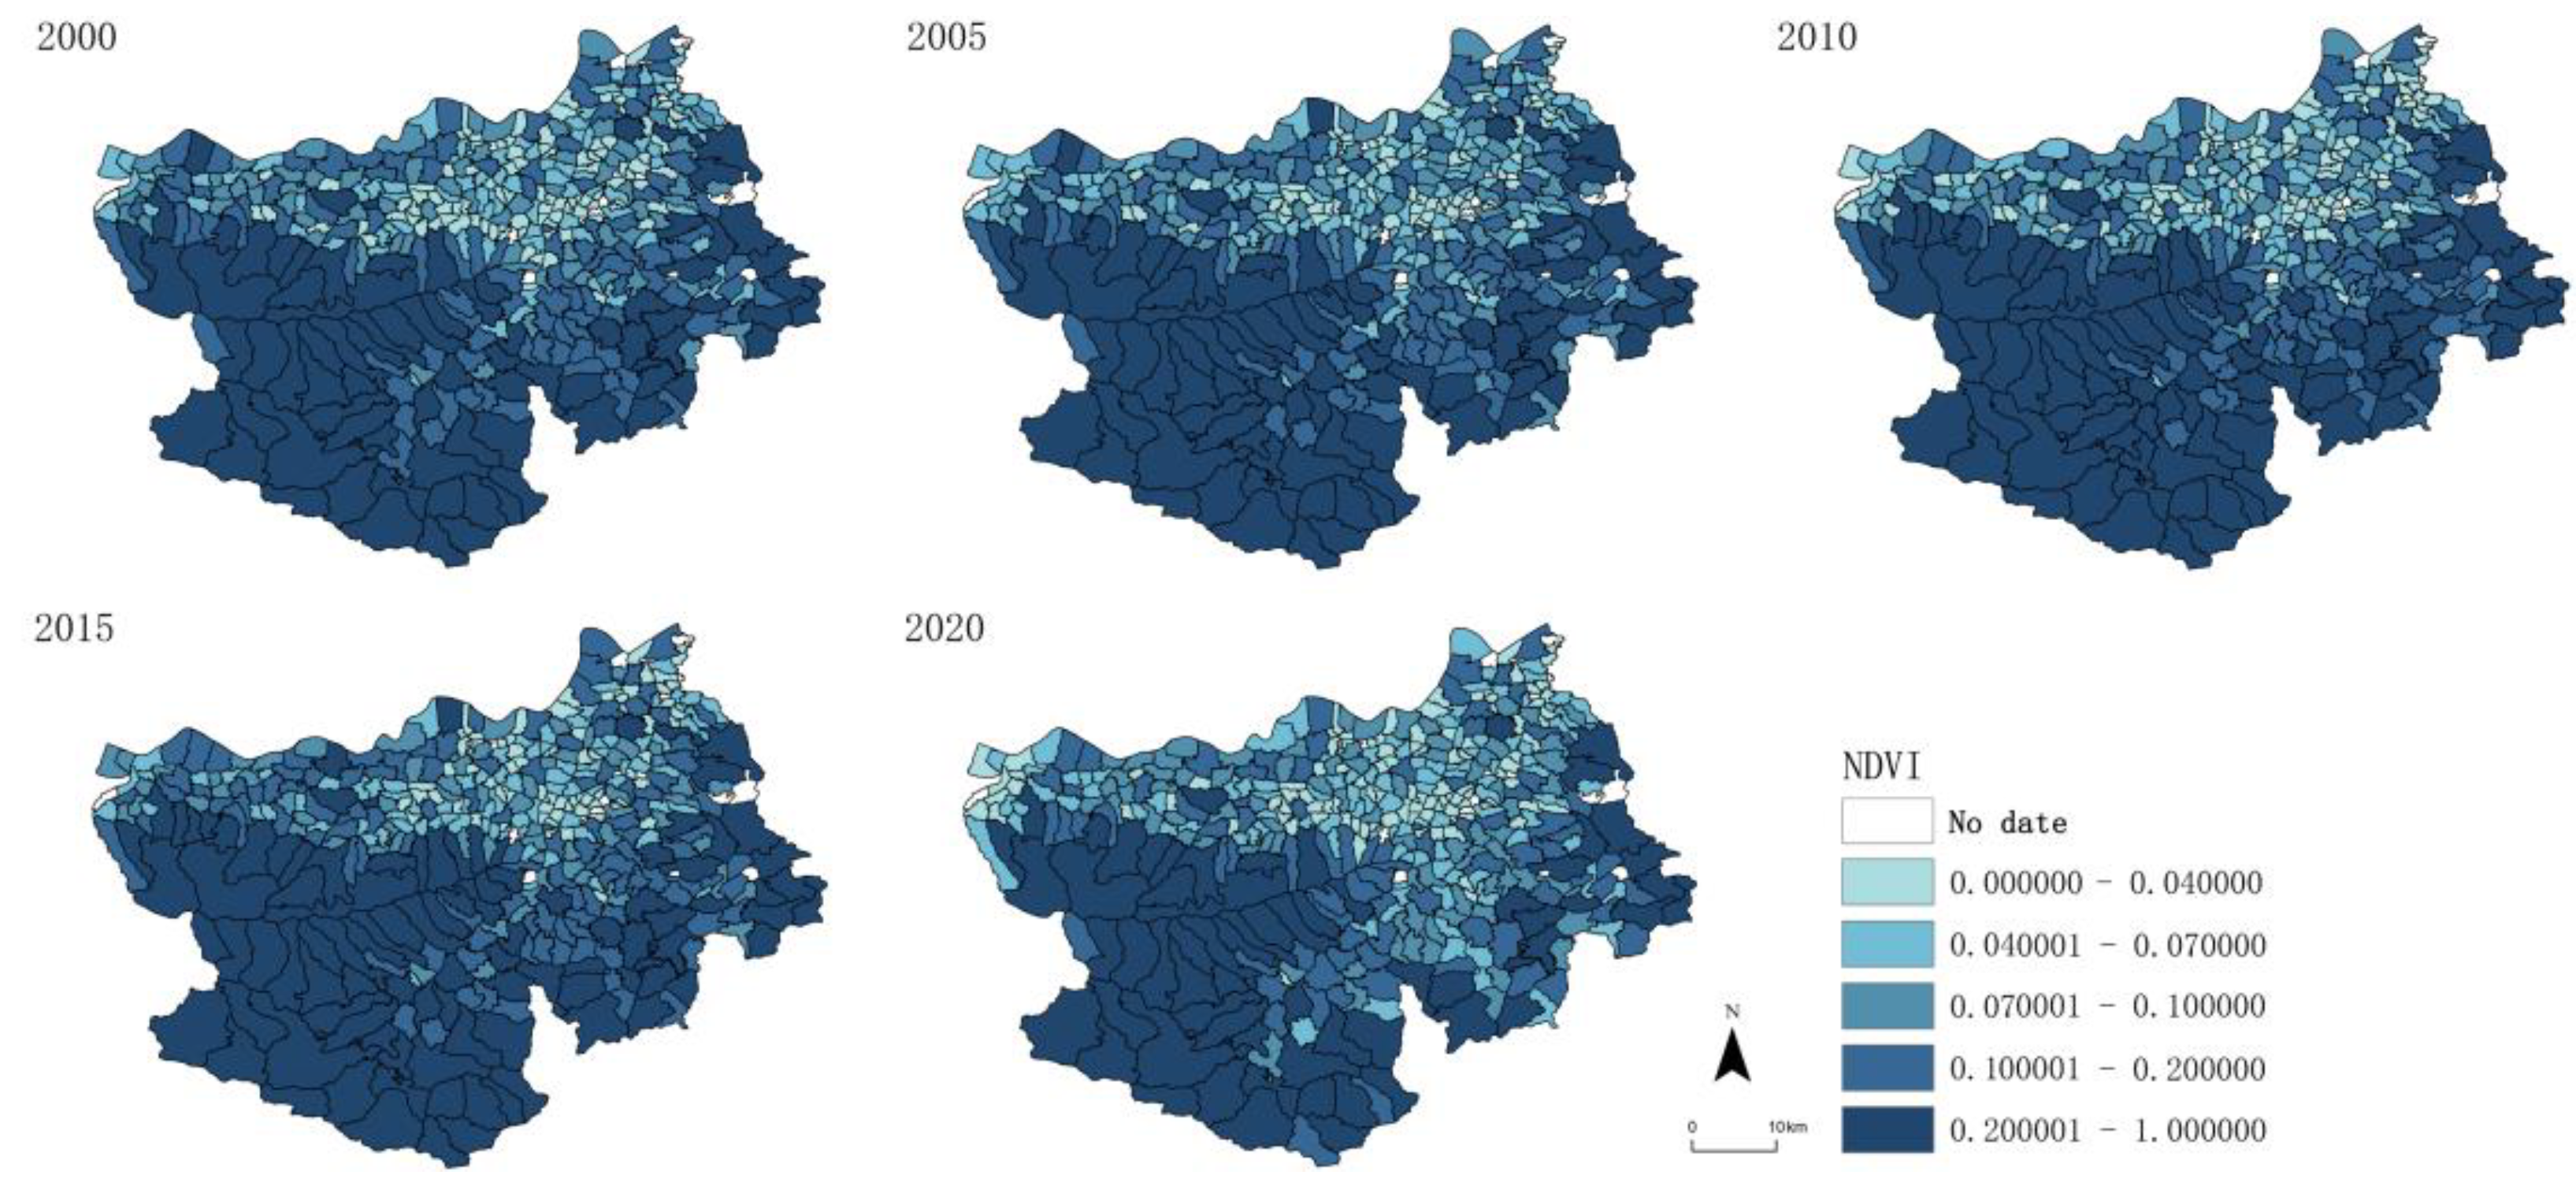
From 2000 to 2015, the NDVI level increased significantly, with the average rising from 0.144486 to 0.172192, but the average decreased to 0.127715 in 2020. In 2000, the overall NDVI level of all administrative villages was low, with 57.63% belonging to low, relatively low and medium administrative villages, concentrated in the central and northern areas of Lingbao City. There were 98 administrative villages with low index value, 84 administrative villages with relatively low index value, accounting for 22.32% and 19.13% of the total, and 81 administrative villages with high index value. It accounts for 18.45% of the total, mainly distributed in the southwest region. The average value of NDVI in 2005, 2010 and 2015 was 0.153191, 0.167655 and 0.172192, respectively. The number of administrative villages with high index increased from 89 in 2005 to 98 in 2010. The increase in administrative villages is mainly concentrated in the southeastern region. Between 2010 and 2015, the number of administrative villages with a low NDVI index decreased from 102 to 70, with the decrease mainly concentrated in the northern region. In 2020, the average NDVI dropped to 0.127715, in which the proportion of administrative villages with low, relatively low and medium NDVI index increased from 50.80% in 2015 to 66.29%, and the number of administrative villages with high and relatively high indices decreased by 35 and 33 respectively (Figure 3).
From the perspective of spatial pattern, the NDVI system of Lingbao City has undergone great changes from 2000 to 2020. In 2000, the difference of NDVI between the north and the south is obvious, and the low-value area of NDVI is mainly concentrated in the northeast and central areas. In 2005, 2010 and 2015, the NDVI low value area showed a spatial contraction phenomenon in the central region, and the low value area continued to decrease. In 2010, there was an east-west NDVI low value zone in the northern part of Lingbao City, and the north-south differentiation phenomenon was more prominent, showing a spatial “high in the south and low in the north”. In 2020, the low-value NDVI area showed spatial expansion in the central and northern regions, and the low-value cluster area appeared in the southwest region, and the southwest still maintained a high value cluster phenomenon. On the whole, the administrative villages with relatively low NDVI value over the years are located in the northern region, while the high NDVI value area is located in the southwest region.

3.3. Characteristics of the Spatiotemporal Evolution of CCD

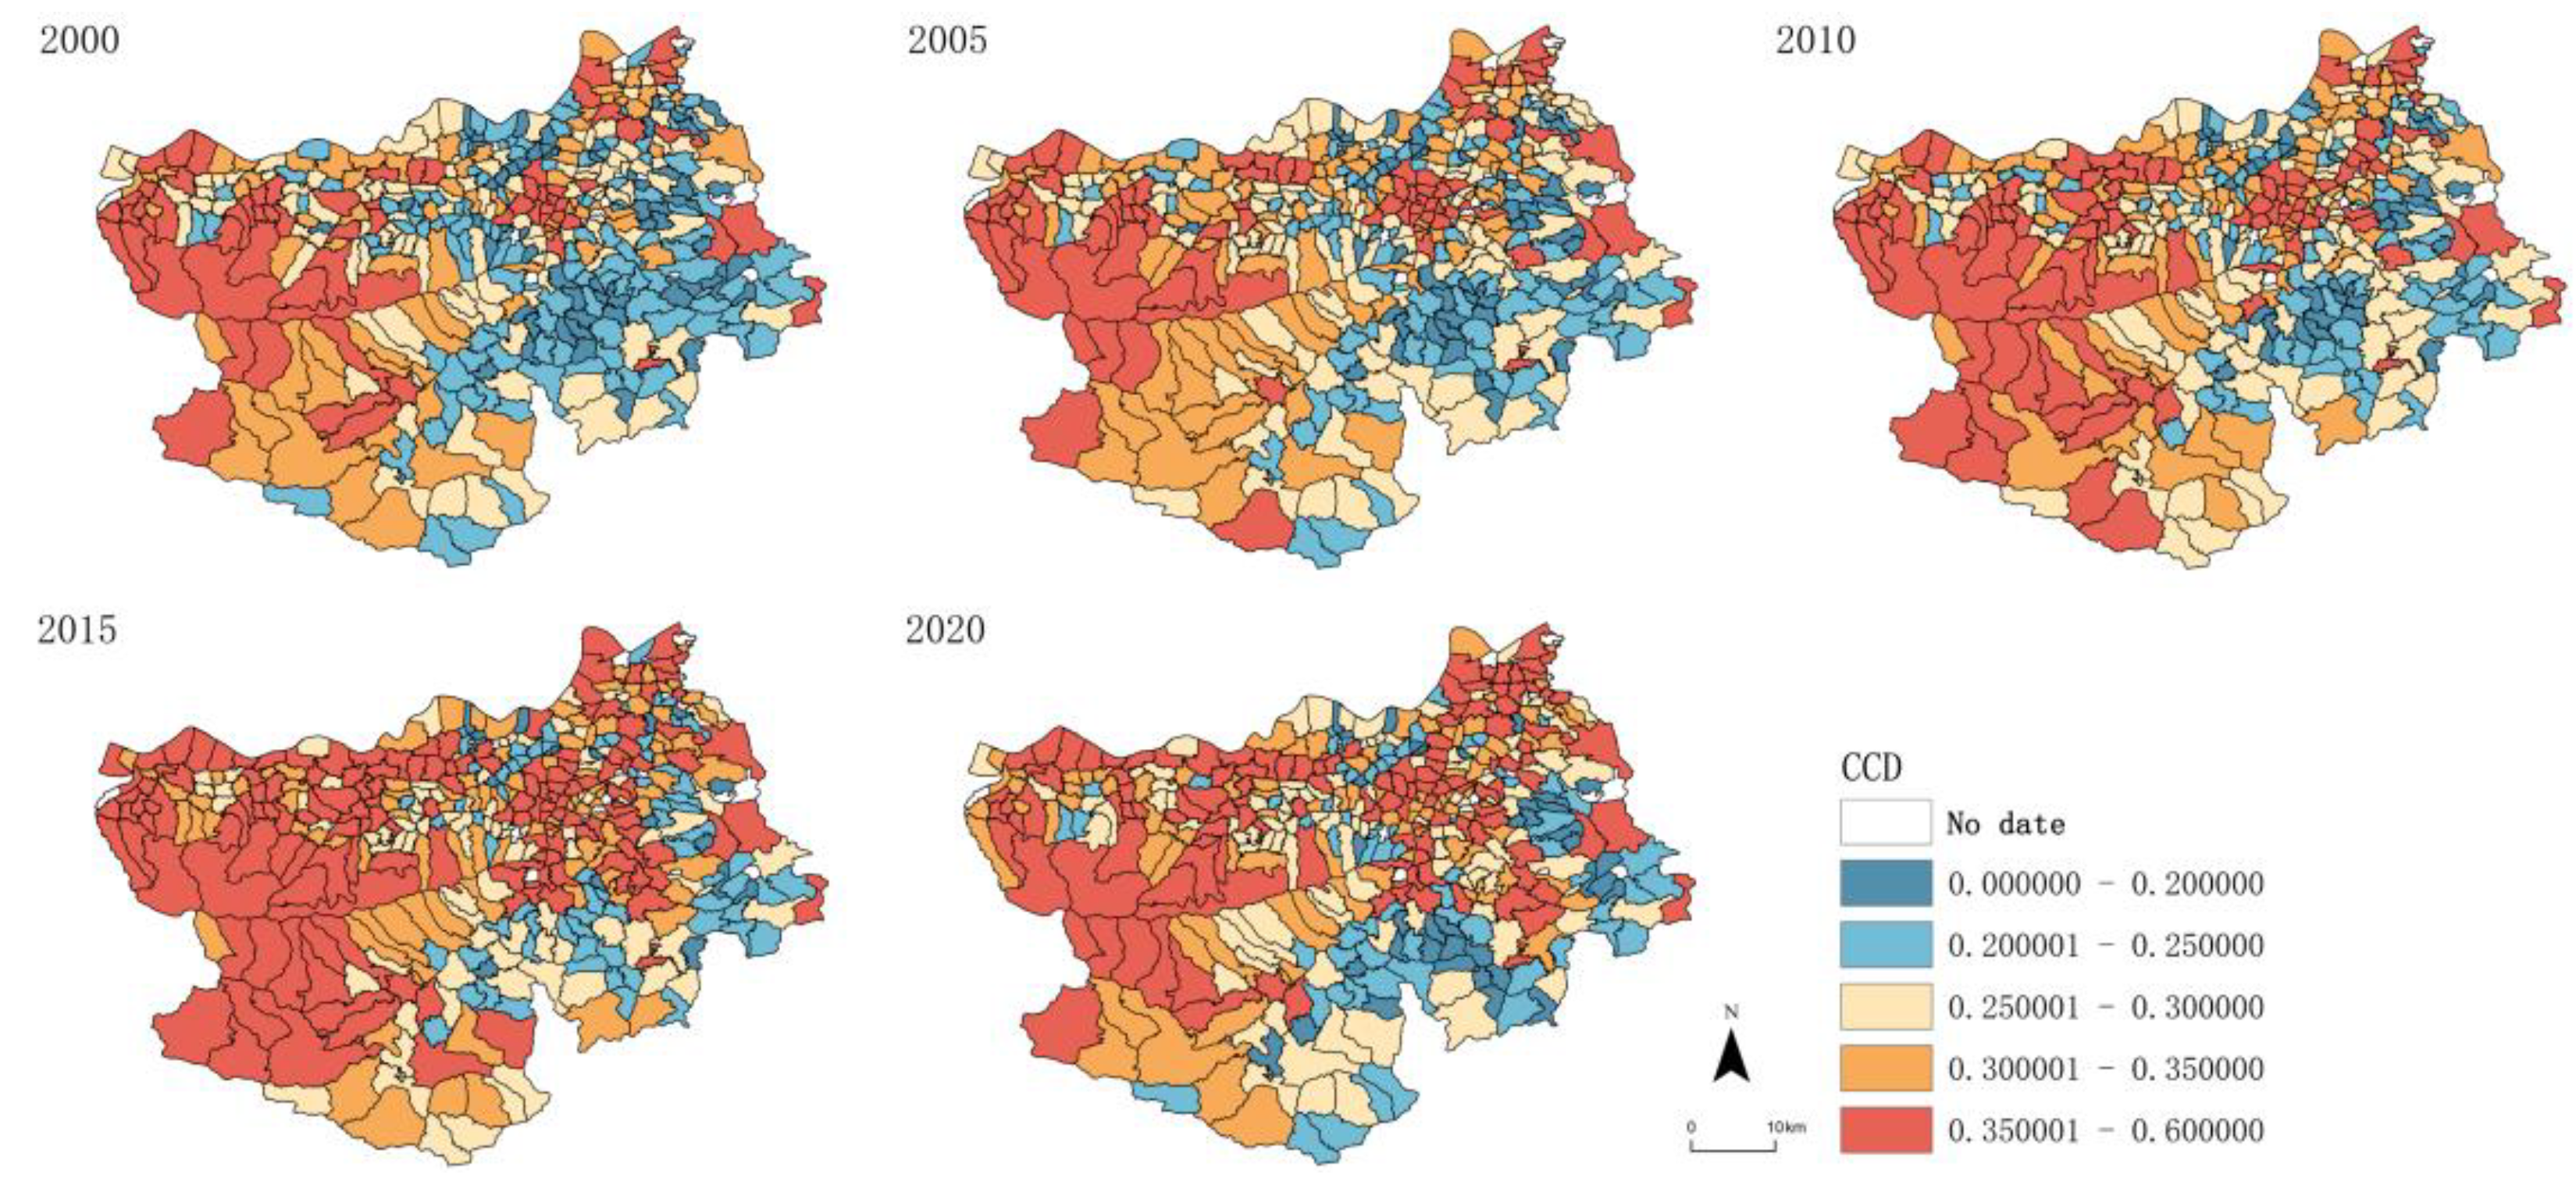
From 2000 to 2020, the mean of URT and NDVI coupling coordination degree (CCD) of each administrative village in Lingbao City first increased and then decreased, from 0.276 in 2000 to 0.322 in 2015, and then to 0.308 in 2020. In 2000, the CCD of each administrative village was at a relatively low level, the low and relatively low CCD values accounted for 13.44% and 28.47% of the total, respectively, concentrated in the southeast of Lingbao City, there are 125 administrative villages with low CCD, 87 administrative villages with relatively low CCD. From 2005 to 2015, the average CCD was on the rise, respectively 0.288, 0.297 and 0.322. The number of low-value administrative villages was 48, 36 and 17, respectively, and gradually decreased over the years. The number of high-value and relatively high-value administrative villages was 80, 102 and 160, and gradually increased over the years. In 2020, the mean CCD decreased to 0.308, in which the low value of administrative villages increased from 3.87% in 2015 to 8.43% in 2020, and the high value and relatively high value of administrative villages decreased from 59.45% to 52.16% (Figure 4).
From the perspective of spatial pattern, the CCD in most administrative villages of Lingbao City is at a disordered level, and the spatial distribution is high in the west and low in the east. In 2000, the area of low CCD is mainly located in the southeastern area of Lingbao City, showing a spatial agglomeration phenomenon, and there is a diagonal belt composed of low CCD and relatively low CCD in the southeastern area of Lingbao City. From 2005 to 2015, the number of administrative villages with high CCD and relatively high CCD increased continuously in the northern and central areas of Lingbao City, while the number of administrative villages with low CCD decreased gradually in the southeastern area of Lingbao City. The spatial differentiation between north and south is significant, and the zonal distribution along the Yellow River is obvious. In 2020, the high-value and relatively high-value administrative villages show a shrinking trend in space, the high-value and relatively high-value spatial agglomeration phenomenon is weakened in the north, and the low-value CCD administrative villages show a spatial agglomeration in the southeast of Lingbao City.

3.4. The Changes in the Proportion of Different CCD Types of Lingbao City

Based on the population, land, industrial development level, and NDVI index of each administrative village, Lingbao City’s administrative villages were divided into 76 coupling coordination types according to CCD, divide the administrative villages in Lingbao City into 76 types of CCD types, and select 12 types of CCD from them (Table 4), which account for more than 10% of the total proportion over the years.
Among these 12 types of coupling, CCD has a relatively high proportion in the high-level coupling stage, accounting for 14.9%, 16.6%, 21.9%, 29.10%, and 24.9% in 2000, 2005, 2010, 2015, and 2020, respectively, showing a trend of first increasing and then decreasing. From the perspective of CCD types at this stage, they are mainly concentrated in HHHL and HHHM. It can be seen that the high CCD is mainly due to the high development level of population, land, and industry. Among the coupling types, the proportion of CCD at the intermediate level coupling stage is relatively low, accounting for 9.8%, 13.2%, 13.5%, 11.6%, and 11.1% in 2000, 2005, 2010, 2015, and 2020, respectively, showing a trend of first increasing and then decreasing. MLLH and HHML are the dominant CCD types in the intermediate level coupling stage, while HMLL and LLLH are also the more abundant types in the intermediate level coupling stage.In the intermediate level coupling stage, there are relatively more administrative villages with high and low development levels in terms of population, NDVI, land, industry. The overall number of administrative villages in the low-level coupling stage among these 12 CCD types in Lingbao City shows a gradually decreasing trend, accounting for 24.8%, 19.4%, 16.5%, 9.2%, and 8.7% in 2000, 2005, 2010, 2015, and 2020, respectively.LLLH and LLLM are the main reasons for the low-level coupling in Lingbao City. In addition, LMLL and MLLH have a larger number of administrative villages in the high-level coupling stage. It can be seen that in the low-level coupling stage, administrative villages with low development levels in population, land, and industry dominate, which is the main reason for Lingbao City’s low-level coupling stage.

3.5. Influencing Factors of County URT and NDVI Coupling Coordination Degree

As can be seen from Table 5, the influence of all factors on the CCD of URT and NDVI over the years has reached a significant level (P < 0.05). Among all the driving factors, AS and TCC have the most significant impact on CCD,and their average effect on CCD is more than 11%. The second is TDC and DEM, both of which have an average influence of more than 10%, indicating that they have a more important influence in the coupling coordination degree. In addition, DYR has less effect on CCD. From the perspective of influencing factors, the order of the average impact on each administrative village over the years was AS> TCC> TDC > DEM > DYR.

4. Discussion

4.1. The Reasons for the Turning Point of CCD in Lingbao City in 2015

China’s urbanization is shifting from a traditional urbanization that focuses on rapid growth to a new type of urbanization that focuses on high-quality development,the focus will shift from metropolitan areas to county seats [50]. It is beneficial to improve the relationship between the coordinated development of URT and ecological environment at the county level, explore the spatio-temporal evolution of coupling and coordination types, and study the key factors of coupling and coordinated transformation, which is conducive to enhancing the sustainability of URT and ecological environment [1]. From the results, it can be seen that the average CCD of URT and NDVI in Lingbao City was 0.276, 0.288, 0.297, 0.322 and 0.308 in 2000, 2005, 2010, 2015 and 2020, respectively, and it can be seen that there was a significant turning point in the CCD from 2015 to 2020.
In 2020, “LLMH”“LLLM”“MLMH”increased more in the number of administrative villages in the low-level coupling stage, increased by 1.4%, 0.7% and 0.5%, respectively,the main reason for the increase is that the population has changed from a medium to a low level of development. In the administrative villages in the middle level coupling stage, the increase of “LLMH” and “LHHL” is more obvious, which increases by 0.9% and 1.8% respectively, which is mainly due to the change of population from high development level and medium development level to low development level,It is mainly caused by the transformation of the high and medium development levels of the population into low development levels. The main decrease is “LLLH”“HMLL”“MLLH”,the decrease was 0.7%, 1.1% and 2% respectively, mainly due to the population turning to a low level of development and the industry rising to a medium level of development. In the administrative villages with a high level of coupling, “MLHH”“MLLH”“MLMH”is the main one with a significant decrease, Decreased by 1.8%, 1.3% and 1.2%, respectively, this is due to the transformation of the population from the middle level of development to the low level of development, and the environment from the high level of development to the level of medium development. Combined with the characteristics of spatial evolution, it can be found that the turning point between 2015 and 2020 is mainly due to the decrease of population density in the south of Lingbao City, the population of a large number of administrative villages in these areas has changed from the middle development level to the low development level, indicating that the population outflow phenomenon was particularly serious from 2015 to 2020, the decrease of population density leads to a lower degree of URT, which in turn leads to changes in the coupling and coordination between urban and rural development and ecological environment. At the same time, the rapid development of secondary and tertiary industries in the central area of Lingbao City, it is also an important reason for the emergence of the turning point, which has a great impact on the CCD in the county [8,51,52]. In general, the main reason for the turning point of the coupling coordination degree in Lingbao City is the comprehensive results of the outflow of population, the rapid development of industry, and the decline of ecological environment quality during the study period.

4.2. External Influencing Factors of CCD at the County Level

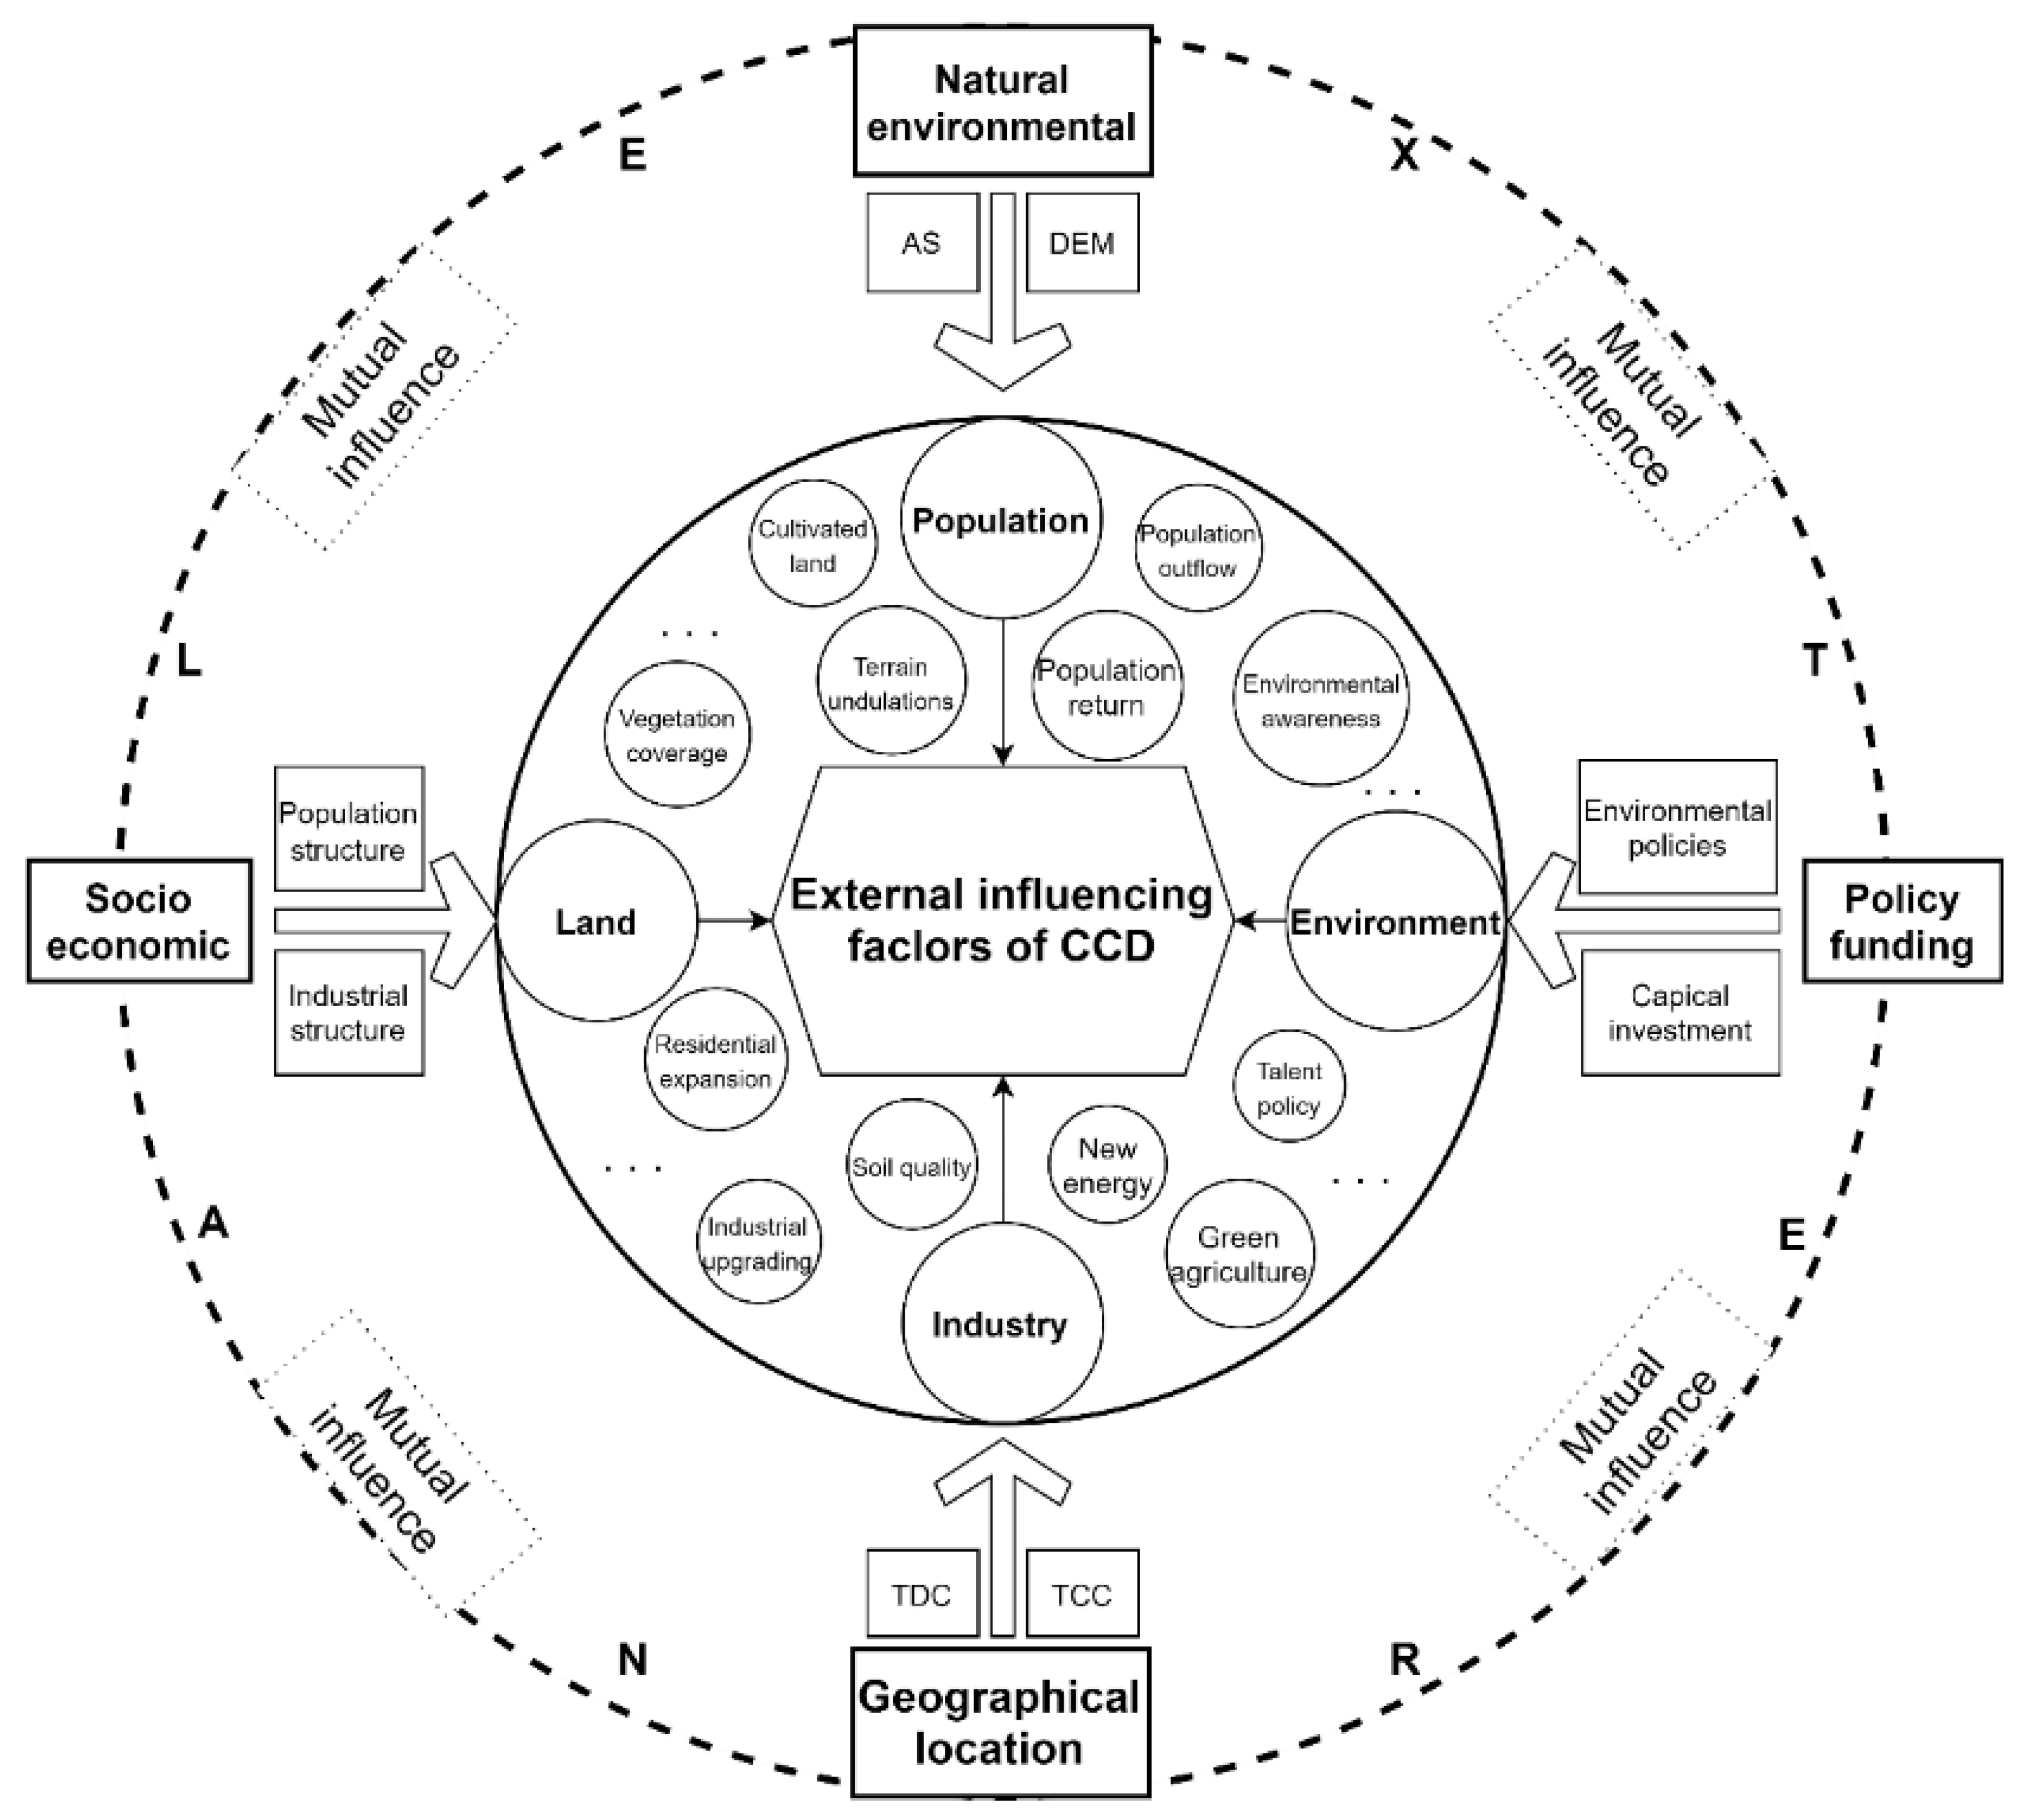
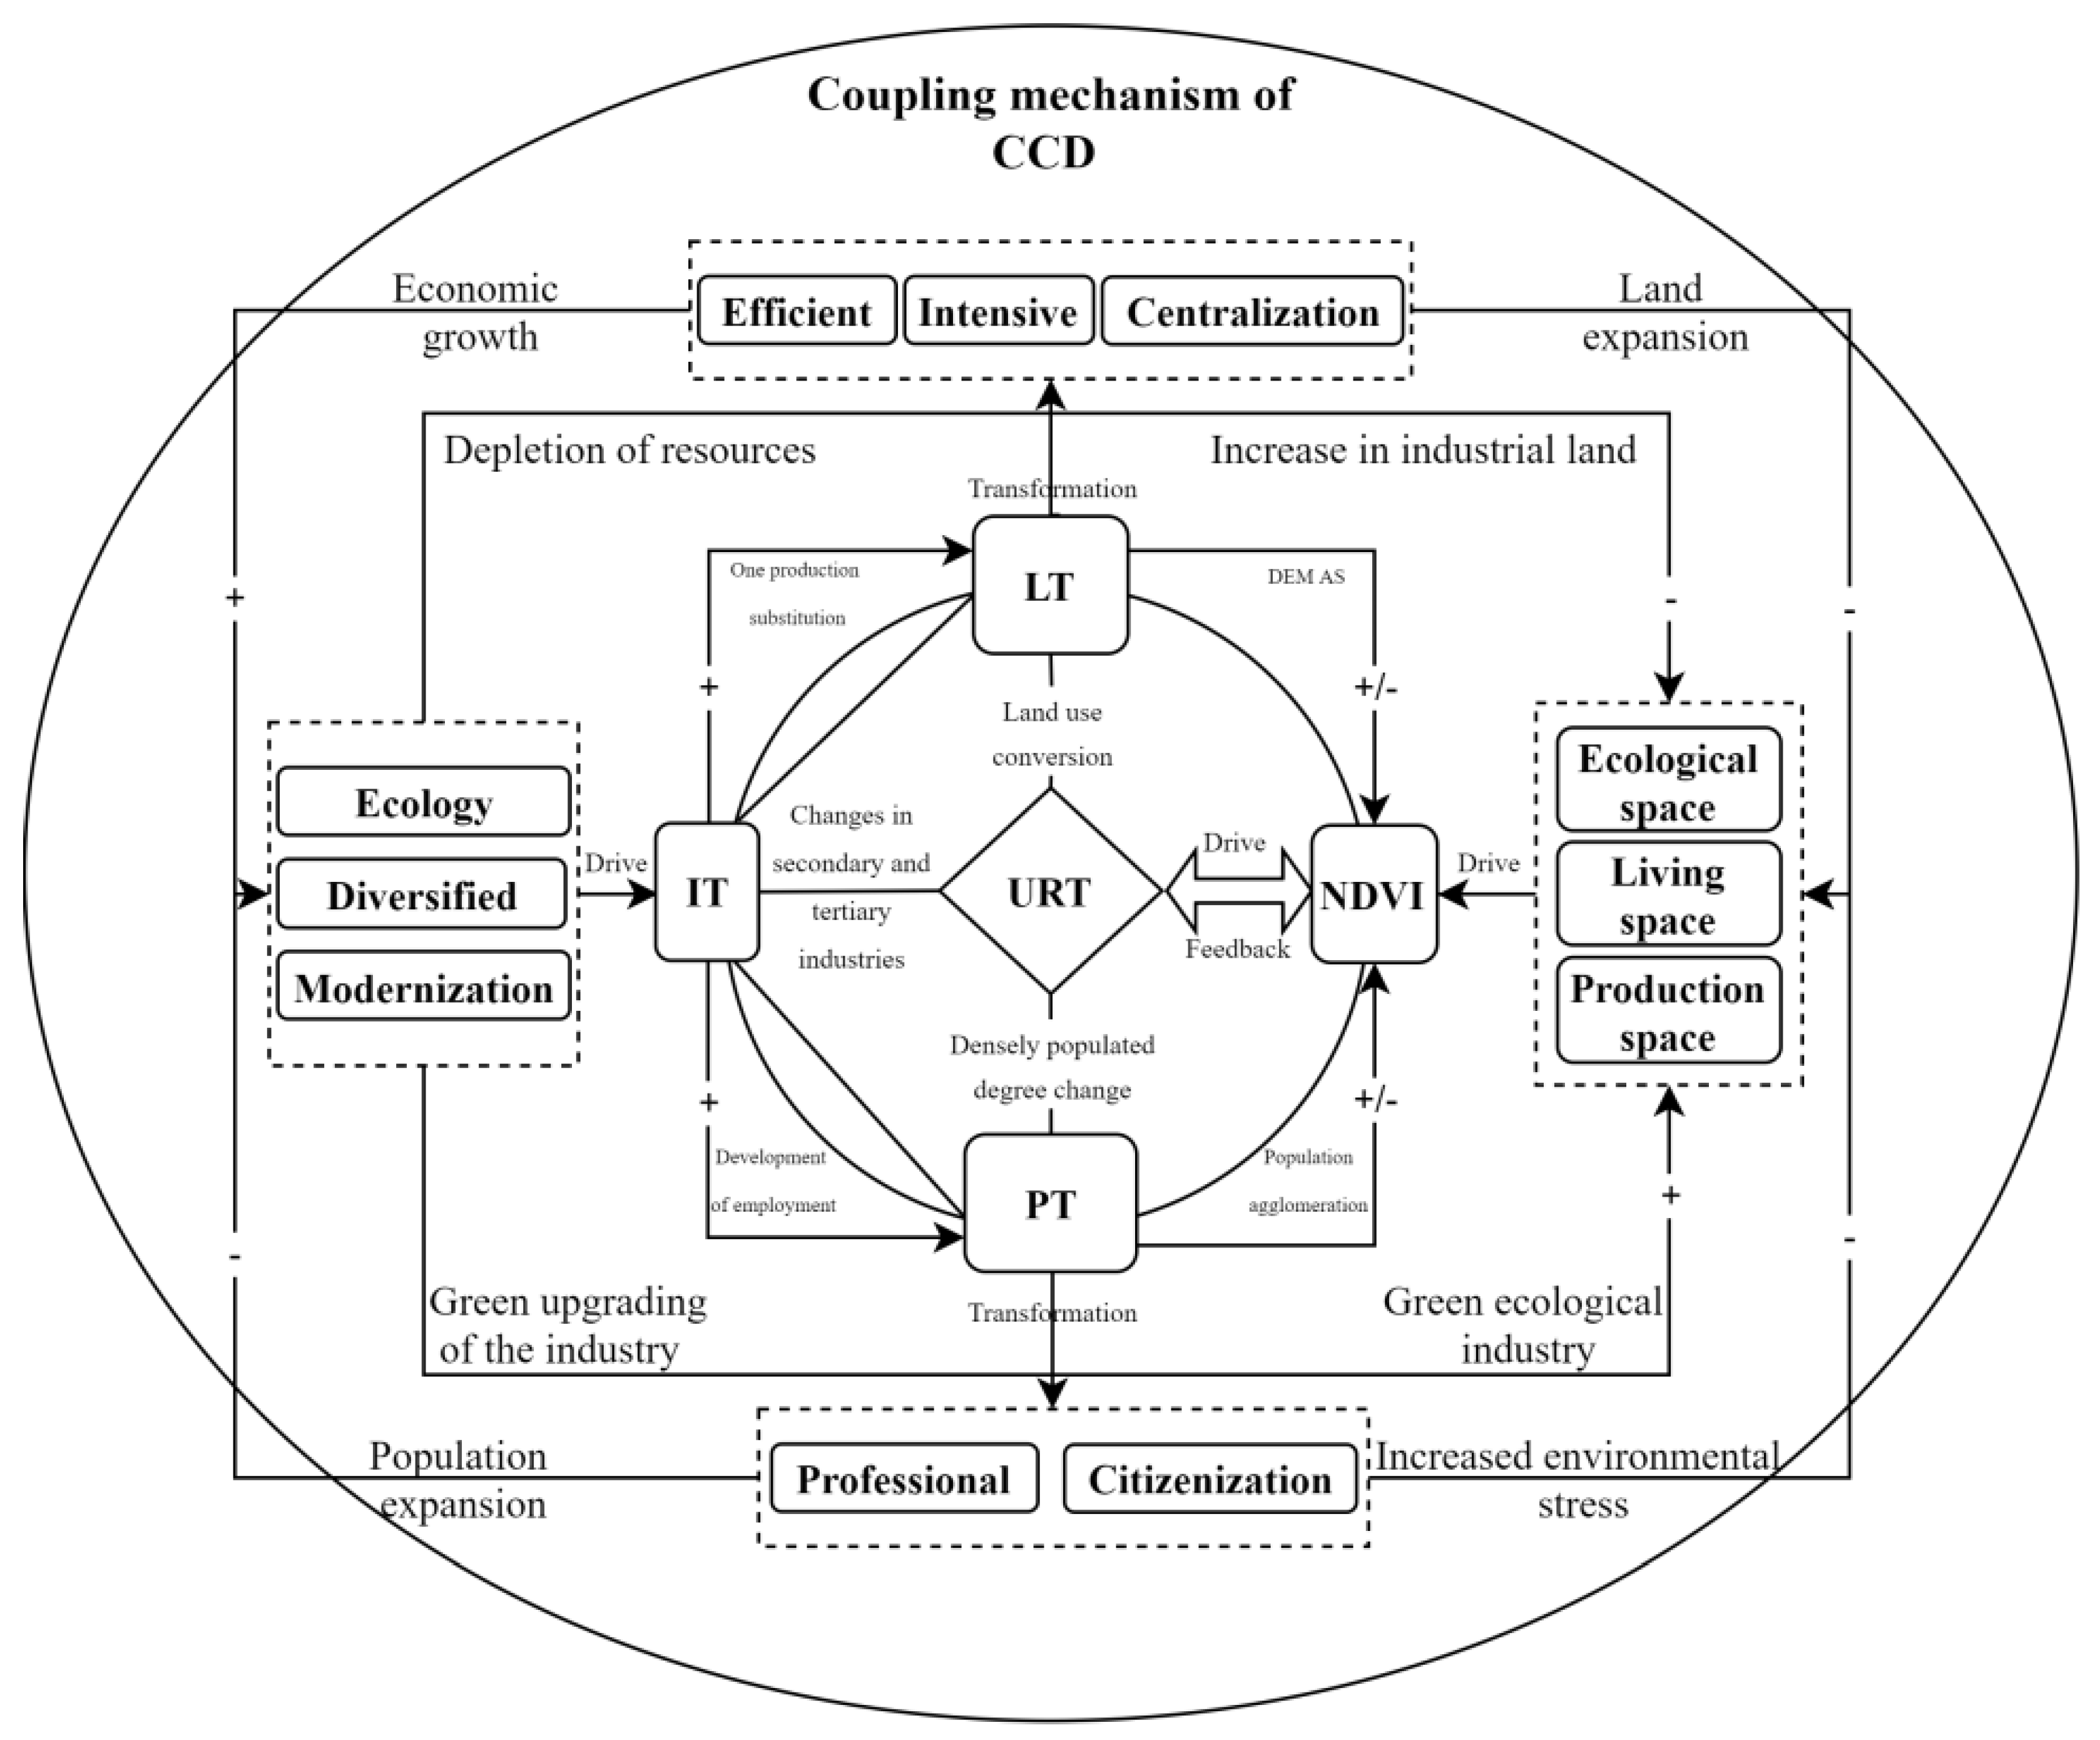
At the same time of rapid economic development at the county level, the degree of URT has increased rapidly, the quality of ecological environment has been rising, and the CCD of URT and NDVI has also shown an upward trend as a whole. The formation of CCD is the result of the comprehensive synergy of population, land, industry and NDVI factors, and is also affected by external factors such as geographical location, natural environment factors, policy and capital factors, socio-economic factors and geographical location factors, As a result, there are differences in the CCD of URT and NDVI within the county, which affects the sustainable development of the county. Based on the results of the geographic detector and the key indicators in the URT and ecological environment, the mechanism of external influencing factors of the CCD in the study area was constructed (Figure 5).
Among them, the natural environment factors will directly affect the location of urban and rural settlements, per capita cultivated land area and traffic conditions have a significant impact on the administrative villages. The topography will affect the development and utilization of land, and the area with relatively high altitude and steep slope will be subject to higher construction costs, which is not conducive to the spatial agglomeration of resource elements and the optimal allocation of infrastructure [21,53]. However, it is beneficial to maintain the vegetation coverage area and reduce environmental damage. Geographic location is a critical determinant in fostering the differentiation and establishment of urban and rural functions at the county scale. Villages strategically positioned geographically tend to thrive, whereas those situated in remote locations are more prone to decline or even disappearance [54]. The distance from the city and county is an important condition for obtaining good infrastructure and transportation, especially in the central plain area of the county, which enhances the ability to attract population agglomeration and promote economic growth, making the area an ideal place for industrial transfer and residential diffusion, promoting the increase of population density, rapid economic development and expansion of construction land. However, the URT has also led to the continuous reduction of vegetation cover, which threatens the ecological space and brings environmental pollution in the process of production and life. At the same time, Geographic location also serves as a crucial condition for varying regions to possess distinct indigenous resources and land productivity, forming the bedrock for both urban and rural development and their inherent environmental conditions [55]. Socio-economic is the basis for coupling coordination optimization, population is the theme of urban and rural production and life, and the change of population density can directly affect the development of agricultural and industrial functions. With the development of social economy, people’s requirements for living environment and ecological environment continue to increase, which is conducive to the increase of environmental awareness. The increase of new energy investment, the proposal of green agriculture and the expansion of urban green space coverage, which is conducive to the formation of a high level of coupling and coordination in the region. National policy is the fundamental driving force for URT and a powerful factor to promote county-level coupling and coordination [54],The government is the main body of capital investment and policy formulation, policy implementation plays an important role in promoting the transformation and upgrading of industrial structure [56]. The government stimulates URT and ecological environmental protection by formulating agricultural policies, talent policies and environmental protection policies, and accelerates the governance and restoration of the ecological environment through returning farmland to forest, land consolidation, environmental restoration, and ecological subsidies. Policy differences will lead to different levels of coupling coordination.

4.3. Research on the Internal Influence Mechanism of CCD at the County Level

URT is an important driver of NDVI, which mainly affects NDVI through PT, LT and IT (Figure 6). From the perspective of the internal influencing factors of CCD, there are mainly the following aspects:(1)From the perspective of population, on the basis of the income gap between urban and rural areas, the difference in the provision of public services, the rural population continues to concentrate in cities, the population is gradually becoming professional, citizen, and part-time. While PT will bring source power to production and living space, it will lead to the increase of residential and industrial land, resulting in a decrease in vegetation coverage, aggravating the carrying capacity of resources and environment [53]. However, with the growth of the economy and the improvement of per capita living standards, people have higher requirements for the living environment, and formulate relevant environmental protection policies, at the same time increase people’s awareness of environmental protection, which will promote the improvement of the quality of the ecological environment.(2)From the perspective of land, land use is more efficient, intensive and centralized in the early stage of LT, due to the low cost of non-agricultural conversion of cultivated land, urban and rural construction will occupy cultivated land through expropriation and other means [57]. Due to the encroachment of non-agricultural land, the ecological space and agricultural land have changed. From the perspective of land itself, the speed of land transition is greatly affected by DEM and AS, so the ecological environment of such areas is less affected by URT [4].(3)From the perspective of industry, the development of non-agricultural economy can drive the income level and consumption demand of residents, at the same time, the industry, capital and technology will spread from urban to rural areas, promote the improvement of land use functions. It may lead to agricultural pollution and resource depletion, and bring pressure to the ecological environment. With the continuous upgrading of the industrial structure and the rapid growth of the economy, the green and pollution-free ecological industries have been gradually replaced, and the environmental quality has been improved.(4)From the perspective of NDVI, forest vegetation cover is an ecological resource in ecological space, in the early stage, due to the imperfect ecological protection policy, the vegetation coverage area was reduced, and the quality of ecological space declined, resulting in aggravated population outflow, land abandonment and waste of natural resources. In the later stage, after the improvement of relevant policies, the ecological space will be protected and can be appropriately developed into tourism resources to promote economy. According to the feedback of NDVI on living space, the quality of ecological environment directly affects the quality of human life, and the size of vegetation coverage area will affect the quality of residential areas. From the feedback of production space, the ecological environment is the basis of development, and the quality of the environment is an important influencing factor for development.

4.4. Typology and Optimization Strategies for Rural-Urban Coordination in Lingbao City

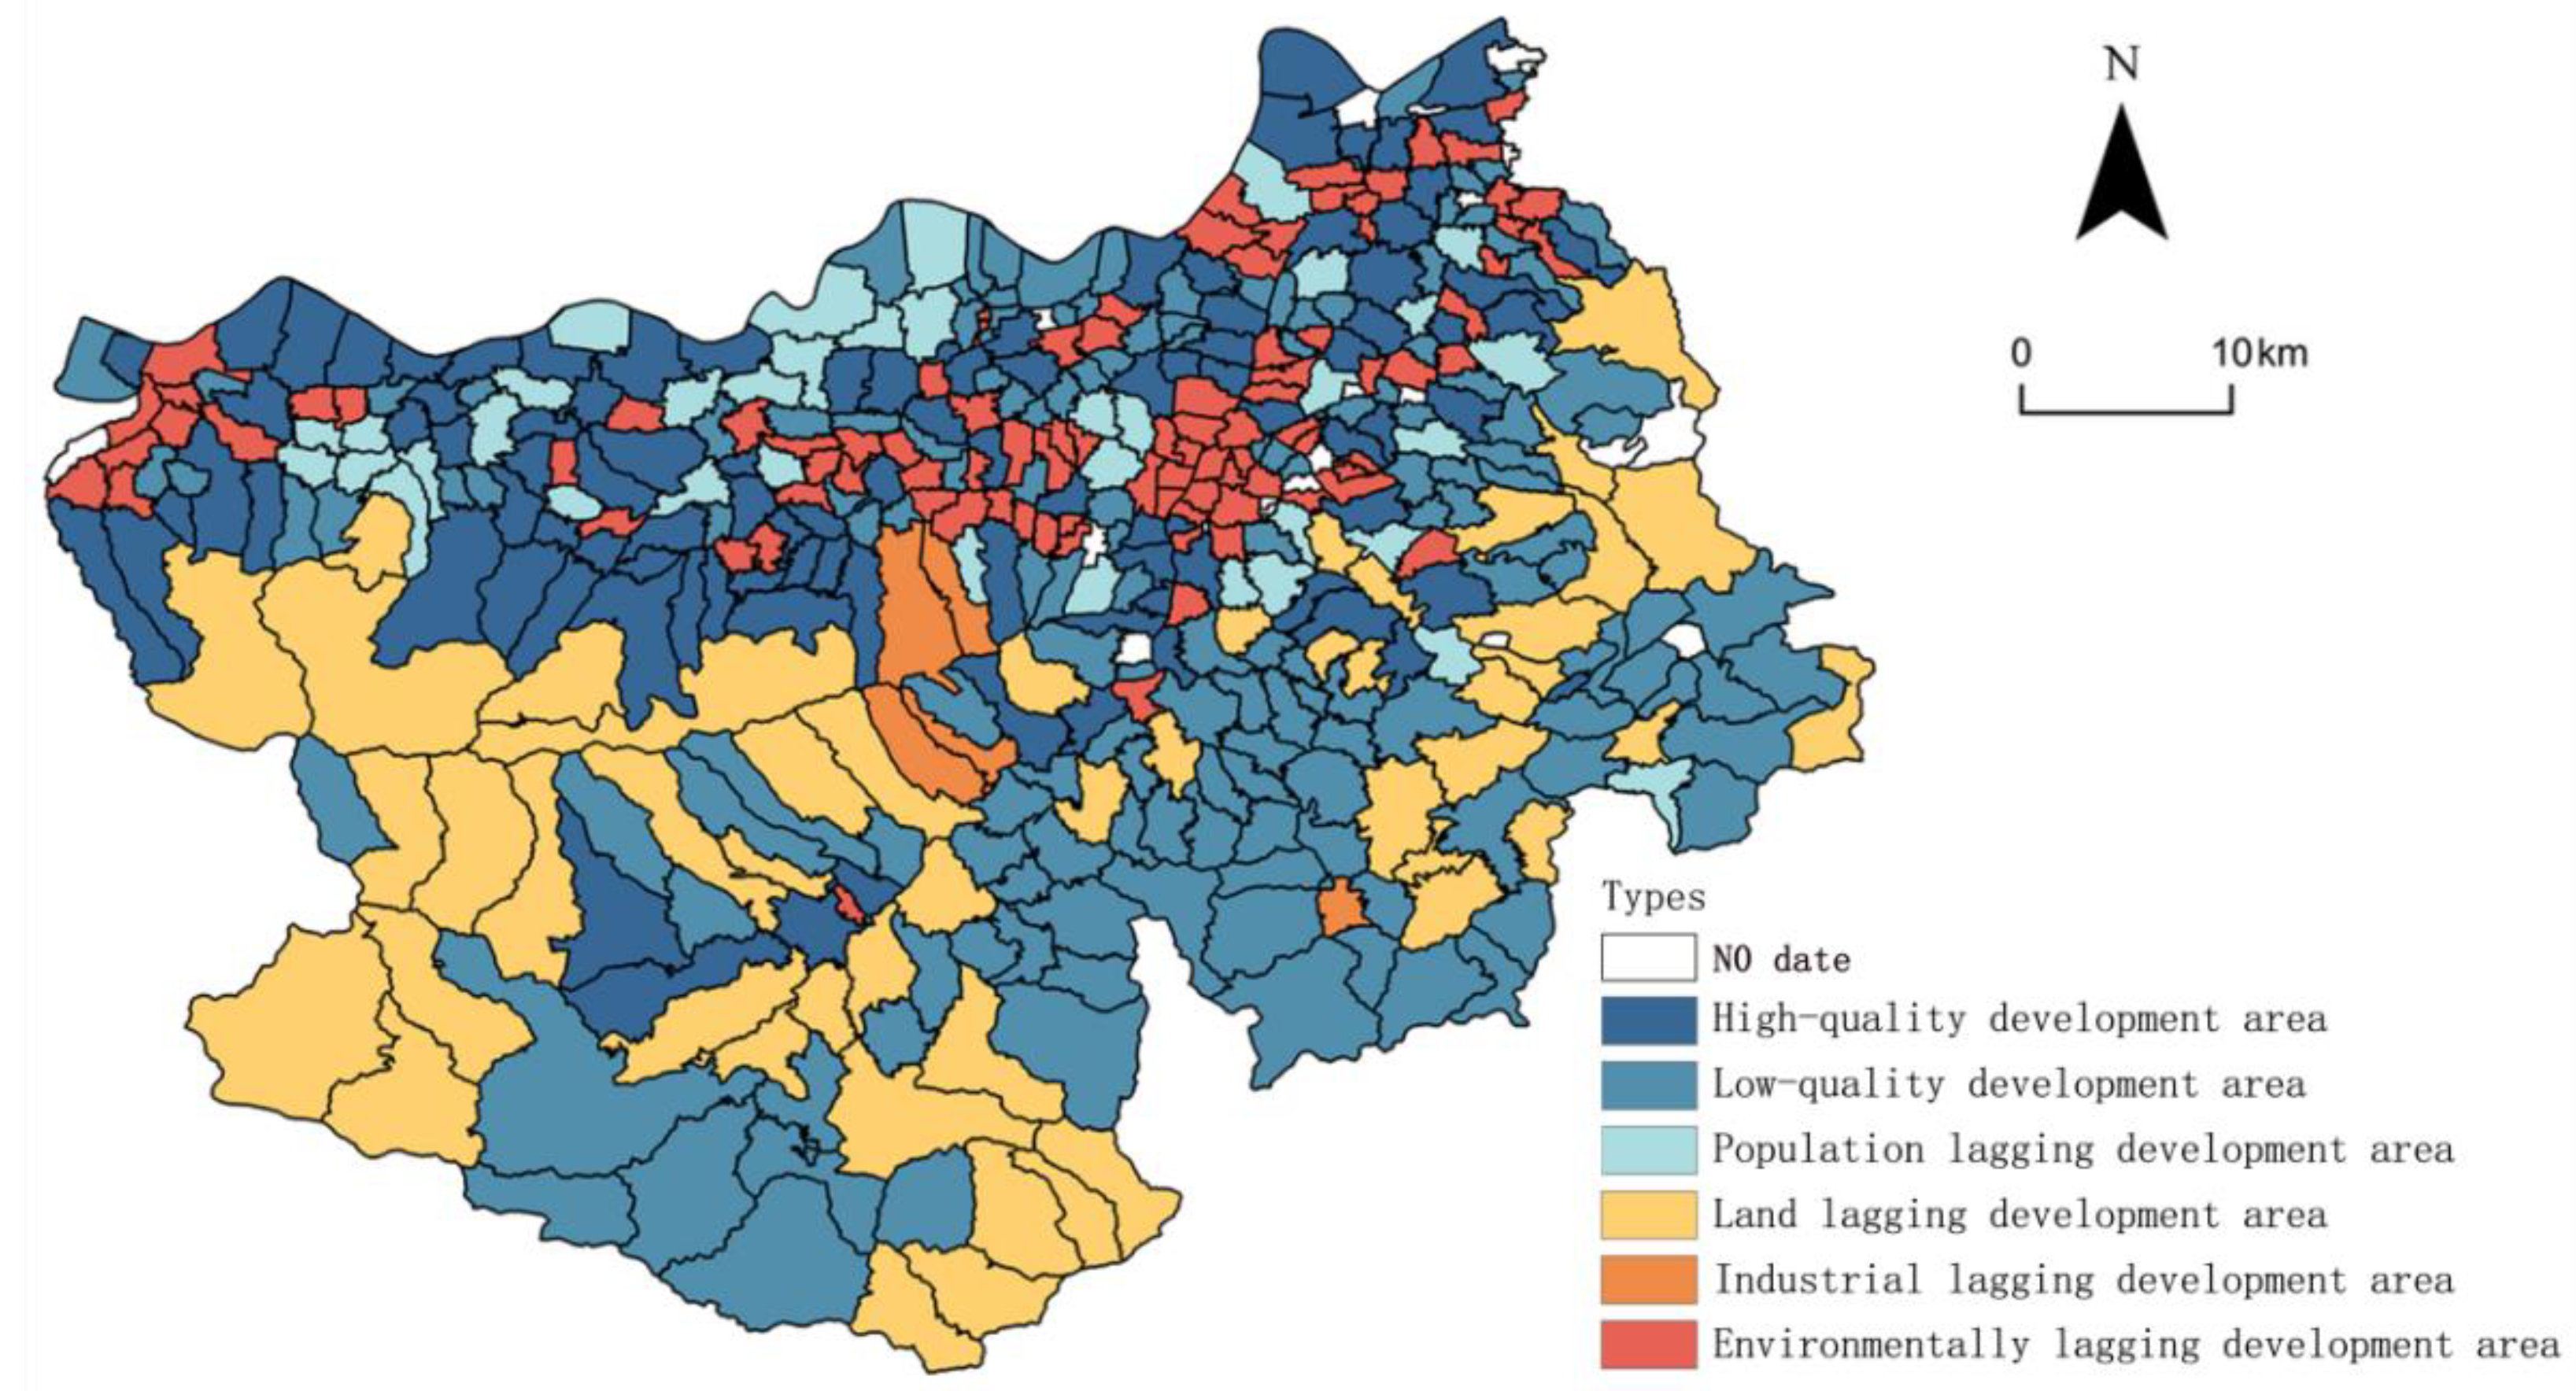
In this study, four factors were selected to reflect the characteristics of the CCD between URT and NDVI, and the changes of each element presented different characteristics.In order to achieve the optimization path by type, according to the coupling and coordination characteristics of each administrative village and the development degree of population, land, industry and environment in 2020, the population, land, industry and environment in each administrative village of Lingbao City are at a low development level,Administrative villages with other elements above the medium development level are classified as population lagging development area,land lagging development area,industrial lagging development area,environmentally lagging development area, administrative villages with population, land, industry, and environment at a medium or high level of development are classified as high-quality development area, and administrative villages with more than two low levels of population, land, industry, and environment are classified as low-quality development area (Figure 7). The high-quality development area is distributed in the northern region, with a total of 100 administrative villages, of which 35 administrative villages are at the medium level of environmental development and other elements are at a high level of development, occupying a dominant position in this type. The low-quality development area is mainly distributed in the southeast region, with a total of 153 administrative villages, of which 28 administrative villages are at a low level of population and environment, and land and industry are at a high level of development, accounting for a relatively large proportion of this type. Population lagging development area is located in the northeastern region with a total of 38 administrative villages, land lagging development area is located in the southern region with a total of 50 administrative villages, industrial and environmentally lagging development area are mainly located in the central area of Lingbao City, with 5 and 93 administrative villages respectively.
It can be seen that the CCD of URT and NDVI in Lingbao City can be divided into the above seven types, according to the change state of its constituent factors, and the optimization path is proposed by classification. The administrative villages in the high-quality development area have obvious advantages as a whole, but there are still some administrative villages with good ecological environment and high degree of land use, the industrial integration is relatively slow. Therefore, for the administrative villages in the high-quality development area, industrial upgrading is needed [58],at the same time, it is necessary to pay attention to improving the efficiency of land use [59],balance the area of various types of land use and improve the coupling degree of land use functions [60],improve the treatment rate of domestic waste and industrial pollution, establish a environmental governance system, coordinate urban and rural development and ecological protection [61]. Administrative villages in low-quality development areas are mainly facing a decline in rural non-agricultural employment,Problems such as low land use efficiency and deteriorating ecological environment of rural homesteads. It can be optimized from the following aspects: first, improve the modernization level of agricultural and rural innovation and development [62];The second is to effectively promote the transformation of hollow villages, demolish long-term idle houses, and convert them into cultivated land;The third is to reduce agricultural pollution, protect vegetation and improve environmental quality. Due to the low population density and serious outflow phenomenon in the population lagging development area, It needs to develop characteristic industries according to its own industrial characteristics [63],at the same time, it is necessary to promote infrastructure construction [30],in order to meet the needs of the administrative village, and take into account environmental protection in development [64]. Most of the land lagging development areas are located in mountainous and hilly areas, which face problems such as less construction land and limited development,it is necessary to develop the rural circulation industry [65],due to the fragile ecological environment, the development of green and environmentally friendly industries should be encouraged [66],it is also possible to compile the input-output table within the administrative village, and further expand it to the flow table of production factors within the county,optimize the allocation level of urban and rural elements in the county, and depict the degree of interconnection [67]. The administrative villages in the industrial lagging development area should vigorously develop the rural circulation industry [65],due to the fragile ecological environment, the development of green and environmentally friendly industries should be encouraged [66,67]. Within the environmentally lagging development area, administrative villages are faced with issues such as the expansion of construction land and a marked degradation of the ecological environment., and the poor awareness of ecological environmental protection,it is necessary to optimize the industrial structure and improve production efficiency; Second, it is necessary to protect cultivated land resources and prevent blind expansion; In addition, the environmental literacy of the public as a whole should be improved, people’s awareness of environmental protection should be enhanced [68].

5. Conclusions

The relationship between URT and NDVI is intricate, necessitating a detailed study of their coupling and coordination to achieve sustainable development. This paper examines the spatiotemporal variation of URT and NDVI in administrative villages of Lingbao City from 2000 to 2020. It investigates the CCD between URT and NDVI, analyzes their influencing factors and coupling mechanism, and ultimately categorizes and suggests an optimization path. Results indicated that:
(1)
Overall, URT in each administrative village of Lingbao City significantly iproved, with a spatial distribution showing higher levels in the north and lower in the south. NDVI initially increased and then decreased, with higher levels in the southwest compared to the central and northern areas of Lingbao City.
(2)
Between 2000 and 2020, the CCD of each administrative village in Lingbao City increased, with higher CCD observed in the northwest and central regions. Different types of administrative villages share common characteristics in various coupling categories; for instance, “MLLH,” “HHHL,” “LLLH,” “HHHM,” and “MLMH” are predominant types.
(3)
Spatial differentiation of URT at the county level primarily results from socio-economic factors, the natural environment, policy funding, and geographical location. AS, TCC, and TDC are identified as the three factors exerting the most significant influence on CCD.
(4)
The subsystems of CCD mutually influence each other, collectively forming the core elements of coupling coordination.
(5)
Based on the coupling and coordination between URT and the ecological environment, seven types can be distinguished: high-quality development area, low-quality development area, population lagging development area, land lagging development area, industrial lagging development area, environmentally lagging development area, each suggesting distinct optimization paths.

Author Contributions

Conceptualization, M.C. and J.Z.; methodology, Y.N.; software, J.Z.; validation, M.C., J.Z. and C.H.; formal analysis, C.H.; resources, M.C.; data curation, J.Z.; writing—original draft preparation, J.Z.; writing—review and editing, J.Z.; visualization, J.Z.; supervision, Y.N.; project administration, M.C.; funding acquisition, C.H. All authors have read and agreed to the published version of the manuscript.

Funding

This research was funded by Major Program of Nature Science Foundation of China, grant number 42293271; Key Science and Technology Program of Henan Province, grant number 242102320240、242102320309.

Data Availability Statement

The data presented in this study are available on request from the corresponding author.

Conflicts of Interest

The authors declare no conflicts of interest.

References

  1. Liu, Y. Introduction to land use and rural sustainability in China. J. Land Use Policy. 2018, 74, 1–4. [Google Scholar] [CrossRef]
  2. Cheng, M.Y. Research Progress of New Urbanization in China from the Perspective of Geography. J. Areal Research and Development. 2022, 41, 46–51. [Google Scholar]
  3. Cheng, Y.; Kang, Q.; Liu, K.; et al. Impact of Urbanization on Ecosystem Service Value from the Perspective of Spatio-Temporal Heterogeneity: A Case Study from the Yellow River Basin. J. Land. 2023, 12, 1301. [Google Scholar] [CrossRef]
  4. Zhang, D.; Shi, Z.; Cheng, M. A Study on the Spatial Pattern of Traditional Villages from the Perspective of Courtyard House Distribution. J. Buildings. 2023, 13, 1913. [Google Scholar] [CrossRef]
  5. Liu, Y.; Ou, C.; Li, Y.; et, al. Regularity of rural settlement changes driven by rapid urbanization in North China over the three decades. J. Science Bulletin. 2023, 68, 2115–2124. [Google Scholar] [CrossRef] [PubMed]
  6. Gao, J.B.; Sun, J.W.; Yu, C.; et al. Theoretical connotation and quantitative measurement of county synergy development capability. J. Geographical Research. 2023, 42, 1465–1479. [Google Scholar]
  7. Liu, Y.S. Research on the urban-rural integration and rural revitalization in the new era in China. J. Acta Geographica Sinica. 2018, 73, 637–650. [Google Scholar]
  8. Cheng, M.; Yan, S.L.; Zhou, Y. Measuring the symbiotic development of rural housing and industry: A case study of Fuping County in the Taihang Mountains in China. J. Land Use Policy. 2019, 82, 307–316. [Google Scholar] [CrossRef]
  9. Fan, X.; Gao, P.; Tian, B.; et al. Spatio-Temporal Patterns of NDVI and Its Influencing Factors Based on the ESTARFM in the Loess Plateau of China. J. Remote Sensing. 2023, 15, 2553. [Google Scholar] [CrossRef]
  10. Sørensen J F, L. The importance of place-based, internal resources for the population development in small rural communities. J. Journal of Rural Studies. 2018, 59, 78–87. [Google Scholar] [CrossRef]
  11. Li, X.M.; Guo, Y.J.; Tian, S.Z.; et al. The Spatio-temporal Pattern Evolution and Driving Force of the Coupling Coordination Degree of Urban Human Settlements System in Liaoning Province. J. Scientia Geographica Sinica. 2019, 39, 1208–1218. [Google Scholar]
  12. Wang, S.J.; Fang, C.L.; Wang, Y. Quantitative investigation of the interactive coupling relationship between urbanization and eco-environment. J. Acta Ecologica Sinica. 2015, 35, 2244–2254. [Google Scholar]
  13. Chang, J.; Wang, W.; Liu, J. Industrial upgrading and its influence on green land use efficiency. J. Scientific Reports. 2023, 13, 2813. [Google Scholar] [PubMed]
  14. Carleton T A; Hsiang S M. Social and economic impacts of climate. J. Science. 2016, 353, aad9837. [Google Scholar] [CrossRef]
  15. Hu, Q.; Zhang, Z.; Niu, L. Identification and evolution of territorial space from the perspective of composite functions. J. Habitat International. 2022, 128, 102662. [Google Scholar] [CrossRef]
  16. Du, L.; Zhou, X.; Yang, R.; et al. Spatial and Temporal Evolution of Multi-Scale Regional Quality Development and the Influencing Factors. J. Sustainability. 2023, 15, 6046. [Google Scholar] [CrossRef]
  17. Hu, Q.; Shen, W.; Zhang, Z. How does urbanisation affect the evolution of territorial space composite function?. J. Applied Geography. 2023, 155, 102976. [Google Scholar] [CrossRef]
  18. Cheng, M.Y.; Liu, Y.S.; Jiang, N. Study on the spatial pattern and mechanism of rural population-land-industry coordinating development in Huang-Huai-Hai Area. J. Acta Geographica Sinica. 2019, 74, 1576–1589. [Google Scholar]
  19. Long, H.L. Land Use Transition and Rural Transformation Development. J. Progress in Geography. 2012, 31, 131–138. [Google Scholar]
  20. Liu, Y.S. Rural Transformation Development and New Countryside Construction in Eastern Coastal Area of China. J. Acta Geographica Sinica. 2007, 563–570. [Google Scholar]
  21. Cheng, M. ; Li, L,; Zhou, Y. Exploring the urban-rural development differences and influencing factors in the Huang-Huai-Hai Plain of China. J. Journal of Geographical Sciences 2020, 30, 1603–1616. [Google Scholar] [CrossRef]
  22. Yang, Y.; Liu, Y.; Li, Y.; et al. Measure of urban-rural transformation in Beijing-Tianjin-Hebei region in the new millennium: Population-land-industry perspective. J. Land Use Policy 2018, 79, 595–608. [Google Scholar]
  23. Liu, Y.S.; Yan, B.; Wang, Y.F. Urban-Rural Development Problems and Transformation Countermeasures in the New Period in China. J. Economic Geography. 2016, 36, 1–8. [Google Scholar]
  24. Wang, Y.S.; Liu, Y.S. Pollution and restructuring strategies of rural ecological environment in China. J. Progress in Geography. 2018, 37, 710–717. [Google Scholar]
  25. Li, Y.H.; Liu, Y.S. Investigation of the Resource&Environment Issues in the Urban-rural Transition in China. J. Economic Geography. 2013, 33, 61–65. [Google Scholar]
  26. Balta, S; Atik, M. Rural planning guidelines for urban-rural transition zones as a tool for the protection of rural landscape characters and retaining urban sprawl: Antalya case from Mediterranean. J. Land Use Policy 2022, 119, 106144. [Google Scholar] [CrossRef]
  27. Bille R A; Jensen K E; Buitenwerf R. Global patterns in urban green space are strongly linked to human development and population density. J. Urban Forestry & Urban Greening 2023, 86, 127980.
  28. Won J; Jung M C. Does compact development mitigate urban thermal environments? Influences of smart growth principles on land surface temperatures in Los Angeles and Portland. J. Sustainable Cities and Society. 2023, 90, 104385. [Google Scholar] [CrossRef]
  29. Winkler K; Fuchs R; Rounsevell M; et al. Global land use changes are four times greater than previously estimated. J. Nature Communications. 2021, 12, 2501. [Google Scholar] [CrossRef] [PubMed]
  30. Jato-Espino D; Capra-Ribeiro F; Moscardó V; et al. A systematic review on the ecosystem services provided by green infrastructure. J. Urban Forestry & Urban Greening 2023, 86, 127998.
  31. Deng, Z.B.; Zong, S.W.; SU, C.W.; et al. Research on Coupling Coordination Development between Ecological Civilization Construction and New Urbanization and Its Driving Forces in the Yangtze River Economic Zone. J. Economic Geography. 2019, 39, 78–86. [Google Scholar]
  32. Bi, G.H.; Yang, Q.Y.; Liu, S. Coupling Coordination Development between Ecological Civilization Construction and Urbanization in China. J. Economic Geography. 2017, 37, 50–58. [Google Scholar]
  33. Sun, H.P.; Huang, Z.F.; Xu, D.D.; et al. The Spatial Characteristics and Drive Mechanism of Coupling Relationship between Urbanization and Eco-Environment in the Pan Yangtze River Delta. J. Economic Geography 2017, 37, 163-170+186. [Google Scholar]
  34. Wang, S.J.; Cui, Z.T.; Lin, J.J. Coupling relationship between urbanization and ecological resilience in the Pearl River Delta. J. Acta Geographica Sinica. 2021, 76, 973–991. [Google Scholar] [CrossRef]
  35. Feng, Y.X.; Li, G.D. Interaction between urbanization and eco-environment in Tibetan Plateau. J. Acta Geographica Sinica. 2020, 75, 1386–1405. [Google Scholar] [CrossRef]
  36. Zhou, C.; Feng, X.G.; Tang, R. Analysis and Forecast of Coupling Coordination Development among the Regional Economy-Ecological Environment-Tourism Industry—A Case Study of Provinces Along the Yangtze Economic Zone. J. Economic Geography. 2016, 36, 186–193. [Google Scholar]
  37. Liu, L.K.; Liang, L.T.; Gao, P. Coupling relationship and interactive response between ecological protection and high-quality development in the Yellow River Basin. J. Journal of Natural Resources. 2021, 36, 176–195. [Google Scholar]
  38. Ren, Q.R.; YU, E.Y. Coupling analysis on coordinated development of ecological environment and social economic system in Gansu Province. J. Acta Ecologica Sinica. 2021, 41, 2944–2953. [Google Scholar]
  39. Zhang, Y.; Yang, Q.Y.; Min, J. An analysis of coupling between the bearing capacity of the ecological environment and the quality of new urbanization in Chongqing. J. Acta Geographica Sinica. 2016, 71, 817–828. [Google Scholar]
  40. Chen, J.; Gao, M.; Cheng, S.; et al. Global 1 km × 1 km gridded revised real gross domestic product and electricity consumption during 1992–2019 based on calibrated nighttime light data. J. Scientific Data. 2022, 9, 202. [Google Scholar] [CrossRef] [PubMed]
  41. Tang, Y.; Li, X.J.; Hu, X.Y. Evolution of Town Size and Its Influencing Factors in Traditional Agricultural Areas During the Rapid Urbanization. J. Economic Geography. 2023, 43, 148–159. [Google Scholar]
  42. Zhang, H.; Chen, M.; Liang, C. Urbanization of county in China: Spatial patterns and influencing factors. J. Journal of Geographical Sciences. 2022, 32, 1241–1260. [Google Scholar] [CrossRef]
  43. Zhang, Z.; Zhao, W.; Liu, Y.; et al. Impacts of urbanisation on vegetation dynamics in Chinese cities. J. Environmental Impact Assessment Review. 2023, 103, 107227. [Google Scholar] [CrossRef]
  44. Cui, M.H. The Relationship of Coupling Coordination between Urbanization and Ecological Environment——A Case of Urban Cluster in the Central Plains. J. Economic Geography. 2015, 35, 72–78. [Google Scholar]
  45. Wang, J.F.; Xu, C.D. Geodetector: Principle and prospective. J. Acta Geographica Sinica. 2017, 72, 116–134. [Google Scholar]
  46. Hu, H.; Lv, T.; Zhang, X.; et al. Spatiotemporal coupling of multidimensional urbanization and resource–environment performance in the Yangtze River Delta urban agglomeration of China. J. Physics and Chemistry of the Earth, Parts A/B/C 2023, 129, 103360. [Google Scholar] [CrossRef]
  47. Cheng, M.; Chen, H. Spatio-temporal Evolution of the Rural Regional System and Its Evolution Mechanism in Huang-Huai-Hai Area of China. J. Chinese Geographical Science. 2023, 33, 51–68. [Google Scholar] [CrossRef]
  48. Li, L.; Wang, L.; Qi, Z. The spatiotemporal variation of farmland use transition and its critical influential factors in coordinated urban-rural regions: A case of Chongqing in western China. J. Sustainable Cities and Society. 2021, 70, 102921. [Google Scholar]
  49. Wang, Y.Z.; Duan, X.J.; Wang, L.Q.; et al. Evolution of rural multifunction and its natural and socioeconomic factors in coastal China. J. Journal of Geographical Sciences. 2023, 33, 1791–1814. [Google Scholar] [CrossRef]
  50. Zhou, J.; Xu, N.; Zhang, W.; et al. Can agricultural low-carbon development benefit from urbanization?-Empirical evidence from China’s new-type urbanization pilot policy. J. Journal of Cleaner Production. 2024, 435, 140388. [Google Scholar] [CrossRef]
  51. Guo, Y.Z.; Zhou, Y.; Liu, Y.S. Spatial-temporal Evolution of Rural Population Outflow and Its Mechanism in China. J. Scientia Geographica Sinica. 2020, 40, 50–59. [Google Scholar]
  52. Chen, T.; Chen, C.B. Analysis on Coupling between County Level Urbanization and Rural Population Hollowing under the Background of Escaping Migration. J. Issues in Agricultural Economy 2017, 38, 58-66+111. [Google Scholar]
  53. Dai, Y.Q.; Zhang, Y.; Ke, X.L. Coupling interaction and driving factors of cultivated land use transition and county urbanization: A case study in Henan province. J. Journal of Natural Resources. 2024, 39, 206–227. [Google Scholar] [CrossRef]
  54. Zang, Y.; Liu, Y.; Yang, Y.; et al. Rural decline or restructuring? Implications for sustainability transitions in rural China. J. Land Use Policy. 2020, 94, 104531. [Google Scholar] [CrossRef]
  55. Cheng, M.Y.; Tian, C.Z.; Zhang, D. Analysis on Spatio-temporal Pattern and Coordination Level of Rural Regional System in Henan Province. J. Areal Research and Development. 2023, 42, 160–166. [Google Scholar]
  56. Ma, X.; Zhao, C.; Song, C.; et al. The impact of regional policy implementation on the decoupling of carbon emissions and economic development. J. Journal of Environmental Management. 2024, 355, 120472. [Google Scholar]
  57. Long, H.L.; Chen, K.Q. Urban-rural integrated development and land use transitions: A perspective of land system science. J. Acta Geographica Sinica. 2021, 76, 295–309. [Google Scholar]
  58. He, X.; Cai, C.; Tang, J.; et al. Analysis of coupling coordination and obstacle factors between tourism development and ecosystem services value: A case study of the Yellow River Basin, China. J. Ecological Indicators. 2023, 157, 111234. [Google Scholar] [CrossRef]
  59. Ge, D.; Wang, Z.; Tu, S.; et al. Coupling analysis of greenhouse-led farmland transition and rural transformation development in China’s traditional farming area: A case of Qingzhou City. J. Land Use Policy. 2019, 86, 113–125. [Google Scholar]
  60. Zhang, R.; Tian, G.; Borowiak, K.; et al. Measuring the evolutionary game process among three functional space types at the county scale in Henan Province, China. J. Cities. 2023, 142, 104560. [Google Scholar]
  61. Yang, Y.; Bao, W.; Wang, Y.; et al. Measurement of urban-rural integration level and its spatial differentiation in China in the new century. J. Habitat International. 2021, 117, 102420. [Google Scholar] [CrossRef]
  62. Yin, J.F.; Shi, P.J.; Huang, W.Z.; et al. Spatiotemporal differentiation characteristics and influencing factors of coupling coordinated development of rural revitalization and new urbanization at the county level in Gansu province. J. Journal of Natural Resources. 2023, 38, 2148–2168. [Google Scholar] [CrossRef]
  63. Lei, D.; Zhang, Y.; Ran, Y.; et al. Assessment of ecosystem health based on landscape pattern in ecologically fragile regions at different spatial scales: A case study of Dianchi Lake basin, China. J. Frontiers in Environmental Science. 2023, 11, 1076344. [Google Scholar] [CrossRef]
  64. Yang, R.; Chen, H.; Chen, S.; et al. Spatiotemporal evolution and prediction of land use/land cover changes and ecosystem service variation in the Yellow River Basin, China. J. Ecological Indicators. 2022, 145, 109579. [Google Scholar] [CrossRef]
  65. Chen, Y.; Xu, Y.; Li, S.; et al. The Evolution and Factors Affecting the Distribution Industry in Poverty-Stricken Counties of Henan Province, China. J. Sustainability. 2023, 15, 6302. [Google Scholar] [CrossRef]
  66. Zheng, L. Impact of off-farm employment on cooking fuel choices: Implications for rural-urban transformation in advancing sustainable energy transformation. J. Energy Economics. 2023, 118, 106497. [Google Scholar] [CrossRef]
  67. Fang, C.L. Theoretical analysis on the mechanism and evolution law of urban-rural integration development. J. Acta Geographica Sinica. 2022, 77, 759–776. [Google Scholar]
  68. Li, Y.; Chen, C.; Wang, Y.; et al. Urban-rural transformation and farmland conversion in China: The application of the environmental Kuznets Curve. J. Journal of Rural Studies. 2014, 36, 311–317. [Google Scholar] [CrossRef]
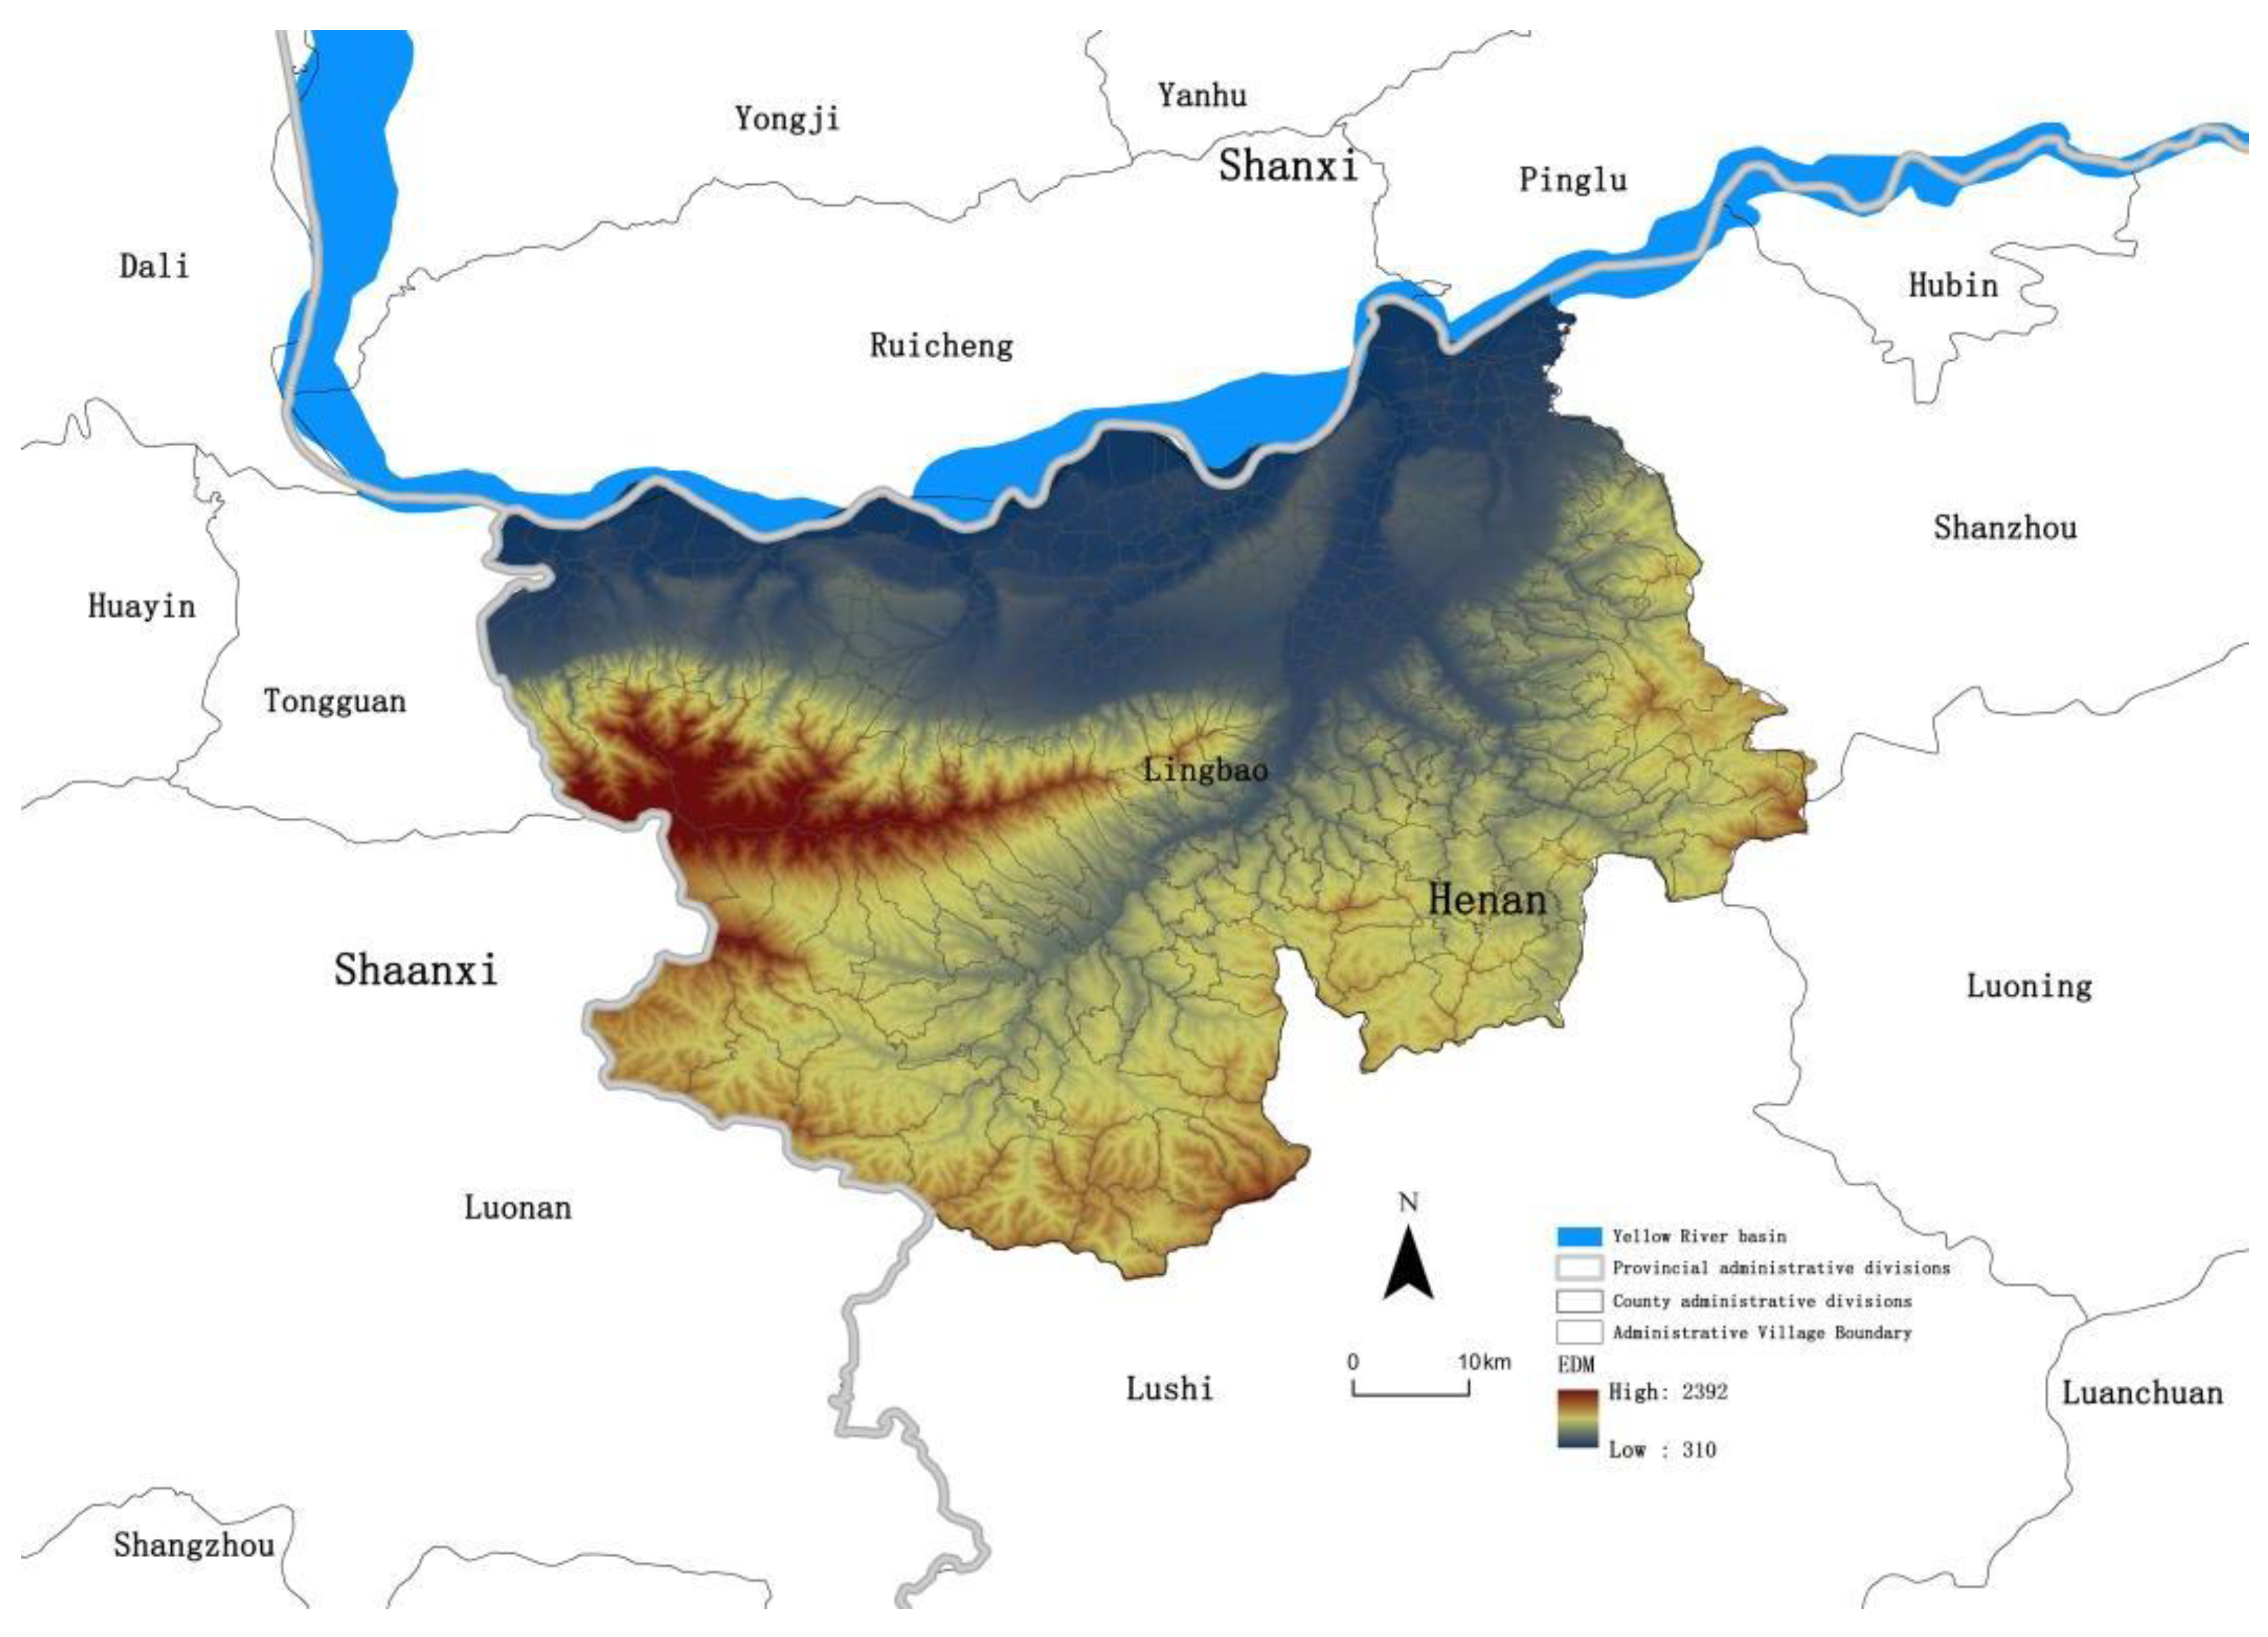
Figure 1. Study area.
Preprints 115506 g001
Figure 2. Spatiotemporal pattern of the urban-rural transformation from 2000 to 2020.
Preprints 115506 g002
Figure 3. Spatiotemporal pattern of NDVI from 2000 to 2020.
Preprints 115506 g003
Figure 4. Spatiotemporal pattern of CCD from 2000 to 2020.
Preprints 115506 g004
Figure 5. The mechanism of dominant factors on the external influencing factors of CCD in Lingbao Country.
Preprints 115506 g005
Figure 6. The coupling internal influence mechanism of URT and NDVI.
Preprints 115506 g006
Figure 7. Classification of coupling mechanism between URT and NDVI.
Preprints 115506 g007
Table 1. Variable selection and definition.
Destination layer Criteria layer Index description
Ecological environment Normalized vegetation index (NDVI) Urban average annual normalized vegetation index
Urban-rural transformation(URT) Population transition (PT) Average population density per administrative village
Industrial transformation (IT) Non-agricultural development of industry
Land transformation (LT) The sprawling expansion of urban and town construction
Table 2. Variable Indicators of the factors influencing CCD.
Facters Index description
The distance from the Yellow River (DYR) The distance of each administrative village from the Yellow River
Average slope(AS) The average slope of each administrative village
Digital Elevation Model(DEM) The average elevation of each administrative village
The distance from the county center(TDC) The distance of each administrative village from the county center of Lingbao City
The distance from the city center(TCC) Distances of each administrative village from the city center of Sanmenxia
Table 3. Core index of urban-rural transformation.
Target layer Rule layer Weight
Urban-rural transformation (URT) Population transformation (PT) 0. 33
Industrial transformation (IT) 0. 42
Land transformation (LT) 0. 25
Table 4. The changes in the proportion of different CCD types in Lingbao City.
CCD types 2000(%) 2005(%) 2010(%) 2015(%) 2020(%)
(0-0.25] (0.25-0.3] (0.3-0.6] (0-0.25] (0.25-0.3] (0.3-0.6] (0-0.25] (0.25-0.3] (0.3-0.6] (0-0.25] (0.25-0.3] (0.3-0.6] (0-0.25] (0.25-0.3] (0.3-0.6]
MLLH 3.00 2.70 2.50 2.10 4.30 2.50 2.10 4.30 2.70 2.30 3.40 1.80 0.70 1.40 0.50
HHHL 0.00 0.20 3.20 0.00 0.00 4.30 0.00 0.50 5.20 0.00 0.90 8.90 0.00 1.10 10.9
LLLH 5.00 0.70 0.20 4.60 1.60 0.20 4.80 2.30 0.00 2.50 0.90 0.20 1.80 0.20 0.00
HHHM 0.00 0.00 1.80 0.00 0.00 2.30 0.00 0.00 4.10 0.00 0.00 8.70 0.00 0.00 8.00
MLMH 0.20 0.90 2.50 0.00 1.40 1.60 0.20 0.90 2.50 0.90 2.70 3.90 1.40 2.70 2.70
HHML 0.20 2.10 1.40 0.50 2.30 1.80 0.70 1.80 2.30 0.50 1.40 1.10 0.20 1.60 0.50
LLLM 4.80 0.00 0.00 4.80 0.00 0.00 3.00 0.00 0.00 1.10 0.00 0.00 1.80 0.00 0.00
LMLL 5.70 0.00 0.00 4.60 0.00 0.00 3.60 0.00 0.00 0.50 0.00 0.00 0.70 0.00 0.00
LLMH 2.30 0.70 0.50 1.40 0.90 0.70 0.70 1.40 0.70 0.70 0.20 1.10 2.10 1.10 0.50
LHHL 0.00 0.50 0.70 0.00 0.90 0.90 0.50 0.90 2.10 0.50 0.50 0.00 0.00 2.30 0.20
HMLL 3.60 1.80 0.00 1.40 1.80 0.20 0.90 1.40 0.00 0.20 1.60 0.00 0.00 0.50 0.00
MLHH 0.00 0.20 2.10 0.00 0.00 2.10 0.00 0.00 2.30 0.00 0.00 3.40 0.00 0.20 1.60
Note: H、M and L generations refer to the development level of population、land、industry NDVI, they are divided using the equal quantile method;The coupling types in the table are sorted according to the order of population, land, industry, and NDVI in terms of their development levels, “LLLL” refers to the low-level development of population、land、industries、and NDVI, and so on.
Table 5. Factor detection results on the coupling coordination degree in Lingbao.
AS TDC DEM TCC DYR
q statistic(2000) 0.096 0.136 0.078 0.156 0.038
P value(2000) 0.000 0.000 0.007 0.000 0.006
q statistic(2005) 0.162 0.126 0.141 0.127 0.085
P value(2005) 0.000 0.000 0.000 0.000 0.000
q statistic(2010) 0.114 0.120 0.084 0.114 0.066
P value(2010) 0.000 0.000 0.006 0.000 0.000
q statistic(2015) 0.072 0.087 0.089 0.096 0.076
P value(2015) 0.000 0.000 0.004 0.000 0.000
q statistic(2020) 0.140 0.076 0.146 0.059 0.117
P value(2020) 0.000 0.011 0.000 0.002 0.000
Disclaimer/Publisher’s Note: The statements, opinions and data contained in all publications are solely those of the individual author(s) and contributor(s) and not of MDPI and/or the editor(s). MDPI and/or the editor(s) disclaim responsibility for any injury to people or property resulting from any ideas, methods, instructions or products referred to in the content.
Copyright: This open access article is published under a Creative Commons CC BY 4.0 license, which permit the free download, distribution, and reuse, provided that the author and preprint are cited in any reuse.
Prerpints.org logo

Preprints.org is a free preprint server supported by MDPI in Basel, Switzerland.

Subscribe

© 2024 MDPI (Basel, Switzerland) unless otherwise stated