Preprint
Article

New Spectrophotometric Visible (VIS) Analysis to determine Sodium Valproate from Tablets

Altmetrics

Downloads

121

Views

52

Comments

0

This version is not peer-reviewed

Submitted:

17 August 2024

Posted:

19 August 2024

You are already at the latest version

Alerts
Abstract
Sodium valproate is a established antiepileptic drug of first choice, primarily used to treat epilepsy, but also bipolar disorder and prevent migraine headaches. Valproate increases concentrations of gamma-aminobutyric acid in the brain, due to inhibition of enzymes responsible for the catabolism of gamma-aminobutyric acid. Main goal of this research consisted in the optimization and development for a new sensitive spectrophotometric quantitative analysis method of sodium valproate from tablets in the Visible field. Following the quantitative color reaction of sodium valproate with diazonium salt of alpha naphthylamine in alkaline medium, a light yellow azo dye was formed and spectrophotometrically analyzed at the wavelength of 386 nanometers. The amount of pure sodium valproate found on pharmaceutical extended-release tablet was 492.578 miligrams compared to the official declared pure amount of 500 miligrams on prolonged-release tablet. Amount found was assigned to a percentage content of 98.5156 percent pure sodium valproate in a pharmaceutical tablet. Mean average percentage error (deviation) from the officially stated value was about 1.4844 percent, which was included within normal limits, below five percent maximum limit allowed by European and Romanian Pharmacopoeias rules. Spectrophotometric method was subjected to the statistical validation procedure and was successfully validated.
Keywords: 
Subject: Chemistry and Materials Science  -   Analytical Chemistry

I. Introduction

Epilepsy is a group of non-communicable neurological disorders, a chronic noncommunicable disease of the brain, characterized by recurrent epileptic seizures [1]. An epileptic seizure is the clinical manifestation of an abnormal, excessive, and synchronized electrical discharge in the neurons [2]. Over time, there has been an ongoing challenge and concern to find new effective classes of antiepileptic drugs to prevent and suppress epileptic seizures [1,2,3].The present work aimed to determine, from spectrophotometric chemical analysis point of view, one of the most effective antiepileptic drugs - sodium valproate as a Valproic acid derivative. Chemically speaking, Valproic acid is a branched short-chain fatty acid and the 2-n-propyl derivative of valeric acid [3,4]. Sodium valproate compound, as salt of Valproic acid, is an antiepileptic drug which is primarily used to effective treat epilepsy but also Bipolar disorder, Manic episode and prevent migraine headaches [4,5,6]. It can be given intravenously or by mouth, and the tablet forms exist in both long- and short-acting formulations [3,4,5,6]. Valproate has a broad spectrum of anticonvulsant activity, although it is primarily used as a first-line treatment for tonic-clonic seizures, absence seizures and myoclonic seizures and as a second-line treatment for partial seizures and infantile spasms [6,7,8,9,10]. It has also been successfully given intravenously to treat status epilepticus [11,12,13]. Sodium valproate anticonvulsant effect has been attributed to the blockade of voltage-gated sodium channels and increased brain levels of the inhibitory synaptic neurotransmitter gamma-aminobutyric acid (GABA) [10,11,12,13,14,15]. The GABAergic effect is also believed to contribute towards the anti-manic properties of valproate.[14,15] . In animals, sodium valproate raises cerebral and cerebellar levels of GABA, possibly by inhibiting GABA degradative enzymes, such as GABA transaminase, succinate-semialdehyde dehydrogenase and by inhibiting the re-uptake of GABA by neuronal cells [16,18]. Sodium valproate has been shown to effectively protect against a seizure-induced reduction in phosphatidylinositol (3,4,5) trisphosphate (PIP3), as a potential therapeutic mechanism [17,18]. This medication has been also successfully tested in the treatment of AIDS and cancer, owing to its effective histone-deacetylase-inhibiting effects. It has cardioprotective and kidney protective effects, good anti-inflammatory and antimicrobial effects [6,7,8,9,10,11]. Valproic acid has been demonstrated to be as effective antagonist of the androgen and progesterone characteristic receptors, a nonsteroidal antiandrogen and antiprogestogen at much lower concentrations than therapeutic serum levels [19]. Following other studies, it has been found sodium valproate to directly stimulate androgen biosynthesis in the gonads via inhibition of histone deacetylases and so has been associated with hyperandrogenism in women and increased 4-androstenedione levels in men [20,21]. A series of spectrophotometric methods for UV-VIS quantitative analysis of sodium valproate and valproic acid have been developed over time [22,23,24,25,26,27]. Most of them require many expensive reagents [22,23,24,25,26,27], long development times, complex analysis and interpretation procedures [22,23,24,25,26,27]. Present paper aimed to develop a new and sensitive method for rapid, precise and accurate spectrophotometric analysis in Visible (VIS) field of sodium valproate from various pharmaceutical tablets. After actual dosing, spectrophotometric analysis of sodium valproate was subjected to the statistical validation procedure [28,29,30,31]. During validation process, the following stages were exactly followed: method linearity, calculation of the detection limit LOD and quantitation limit LOQ , intra-day and inter-day method precision, system precision and method accuracy [28,29,30,31]. The present paper aimed to describe all the new working procedures and calculations used for quatitative analysis of Sodium Valproate in tablets and only the first two stages of statistical validation procedure: complete analysis of the spectrophotometric method linearity and calculation of Detection Limit (LOD) and Quantitation Limit (LOQ). After completing the statistical validation procedure [28,29,30,31], this analysis can be successfully applied in any chemical laboratory designed for quality control of drugs containing Sodium Valproate as active substance and for quantitative analysis of Sodium Valproate from different samples. Main purpose of this work consisted in accurate quantitative analysis by a new, developed spectrophotometric method of Sodium Valproate, as the sodium salt of 2-propyl-pentanoic acid (Valproic acid), from the tablets of a studied pharmaceutical product. Once statistically validated, this new spectrophotometric analysis method in Visible range will be able to be successfully used to accurately quantify sodium valproate from a wide range of unknown samples, including pharmaceutical samples and even biological liquid samples. When studying biological samples in case of acute or chronic valproate poisoning, this proposed dosing method in Visible range could be very effective coupled with High Performance Liquid Chromatography (H.P.L.C.). In the case of biological sample analysis, this quatitative method may be more expensive and may involve many reagents and more complex technologies. Visible spectrophotometric analysis found and proposed to be applied will be able to be used with very good and effective results, for Technical Quality Control of all pharmaceutical products containing sodium valproate as pure active substance. It will be very useful to check whether the pharmaceutical manufacturer has exactly complied with the official amounts of active substance on pharmaceutical tablet listed in the package leaflet. Method proposed is new and involves very low costs, saves time and requires few reagents that are cheap and easy to use, especially for accurate analysis of Sodium Valproate in a wide range of pharmaceutical samples and pharmaceutical marketed products. A first important objective of this work consisted in the design, optimization and practical application of a new spectrophotometric method for sodium valproate dosing in the Visible range (VIS). Another important objective consisted in close comparison of obtained final result with the Official Romanian Pharmacopoeia, 10th Edition Rules and with European Pharmacopoeia Standards regarding the maximum allowed percentage deviations of the amount of pure active substance experimentally found and reported on tablet of pharmaceutical product,, compared to the officially declared content of sodium valproate, stated by the producer company.

II. Materials and Methods

A. Description of the Method Basic Principle and Chemical Reactions Pathway

alpha-naphthylamine from 0.1% alkalized alcoholic solution was completely diazotized with a sodium nitrite NaNO2 4%-5% aqueous solution during cold storage conditions for 30 minutes at 0ºC-7º C in a strong acidic environment (HCl 10%-15%). Obtained diazonium salt of alpha-naphtylmamine completely reacted and coupled with sodium valproate from unknown alcoholic sample solution. Following this color reaction, a bright light yellow monoazo dye was quantitatively obtained. This monoazo yellow was synthesized in a proportion perfectly equal to the concentration of sodium valproate from studied sample and showed an absorption maximum at λ = 386 nm. By spectrophotometric analysis of the bright light yellow monoazo dye synthesized, it was then possible to quantitatively evaluate pure sodium valproate in studied sample. Chemical reaction that took place was described in Figure 1:

B. Visible (VIS) Spectrum Design of Sodium Valproate by Proposed Method. Calculation Procedure of Specific Absorbance (a) and Molar Absorptivity Coefficient. (ε).

B.1. Preparation of a Sodium Valproate pure initial stock solution 0.5 g % (5000 µg/mL) from standard sodium valproate crystalline solid powder provided by Merck®. Stock solution was prepared by accurately weighing 0.5 g of extremely pure Sodium Valproate standard crystalline powder that was quantitatively brought entirely from the watch glass into a volumetric flask of volume V = 100 mL with about 30 mL of acetone. The flask was vigorously shaken until completed dissolution of solid substance and then it was filled right up to the mark with absolute ethyl alcohol p.a. as solvent and blank sample.
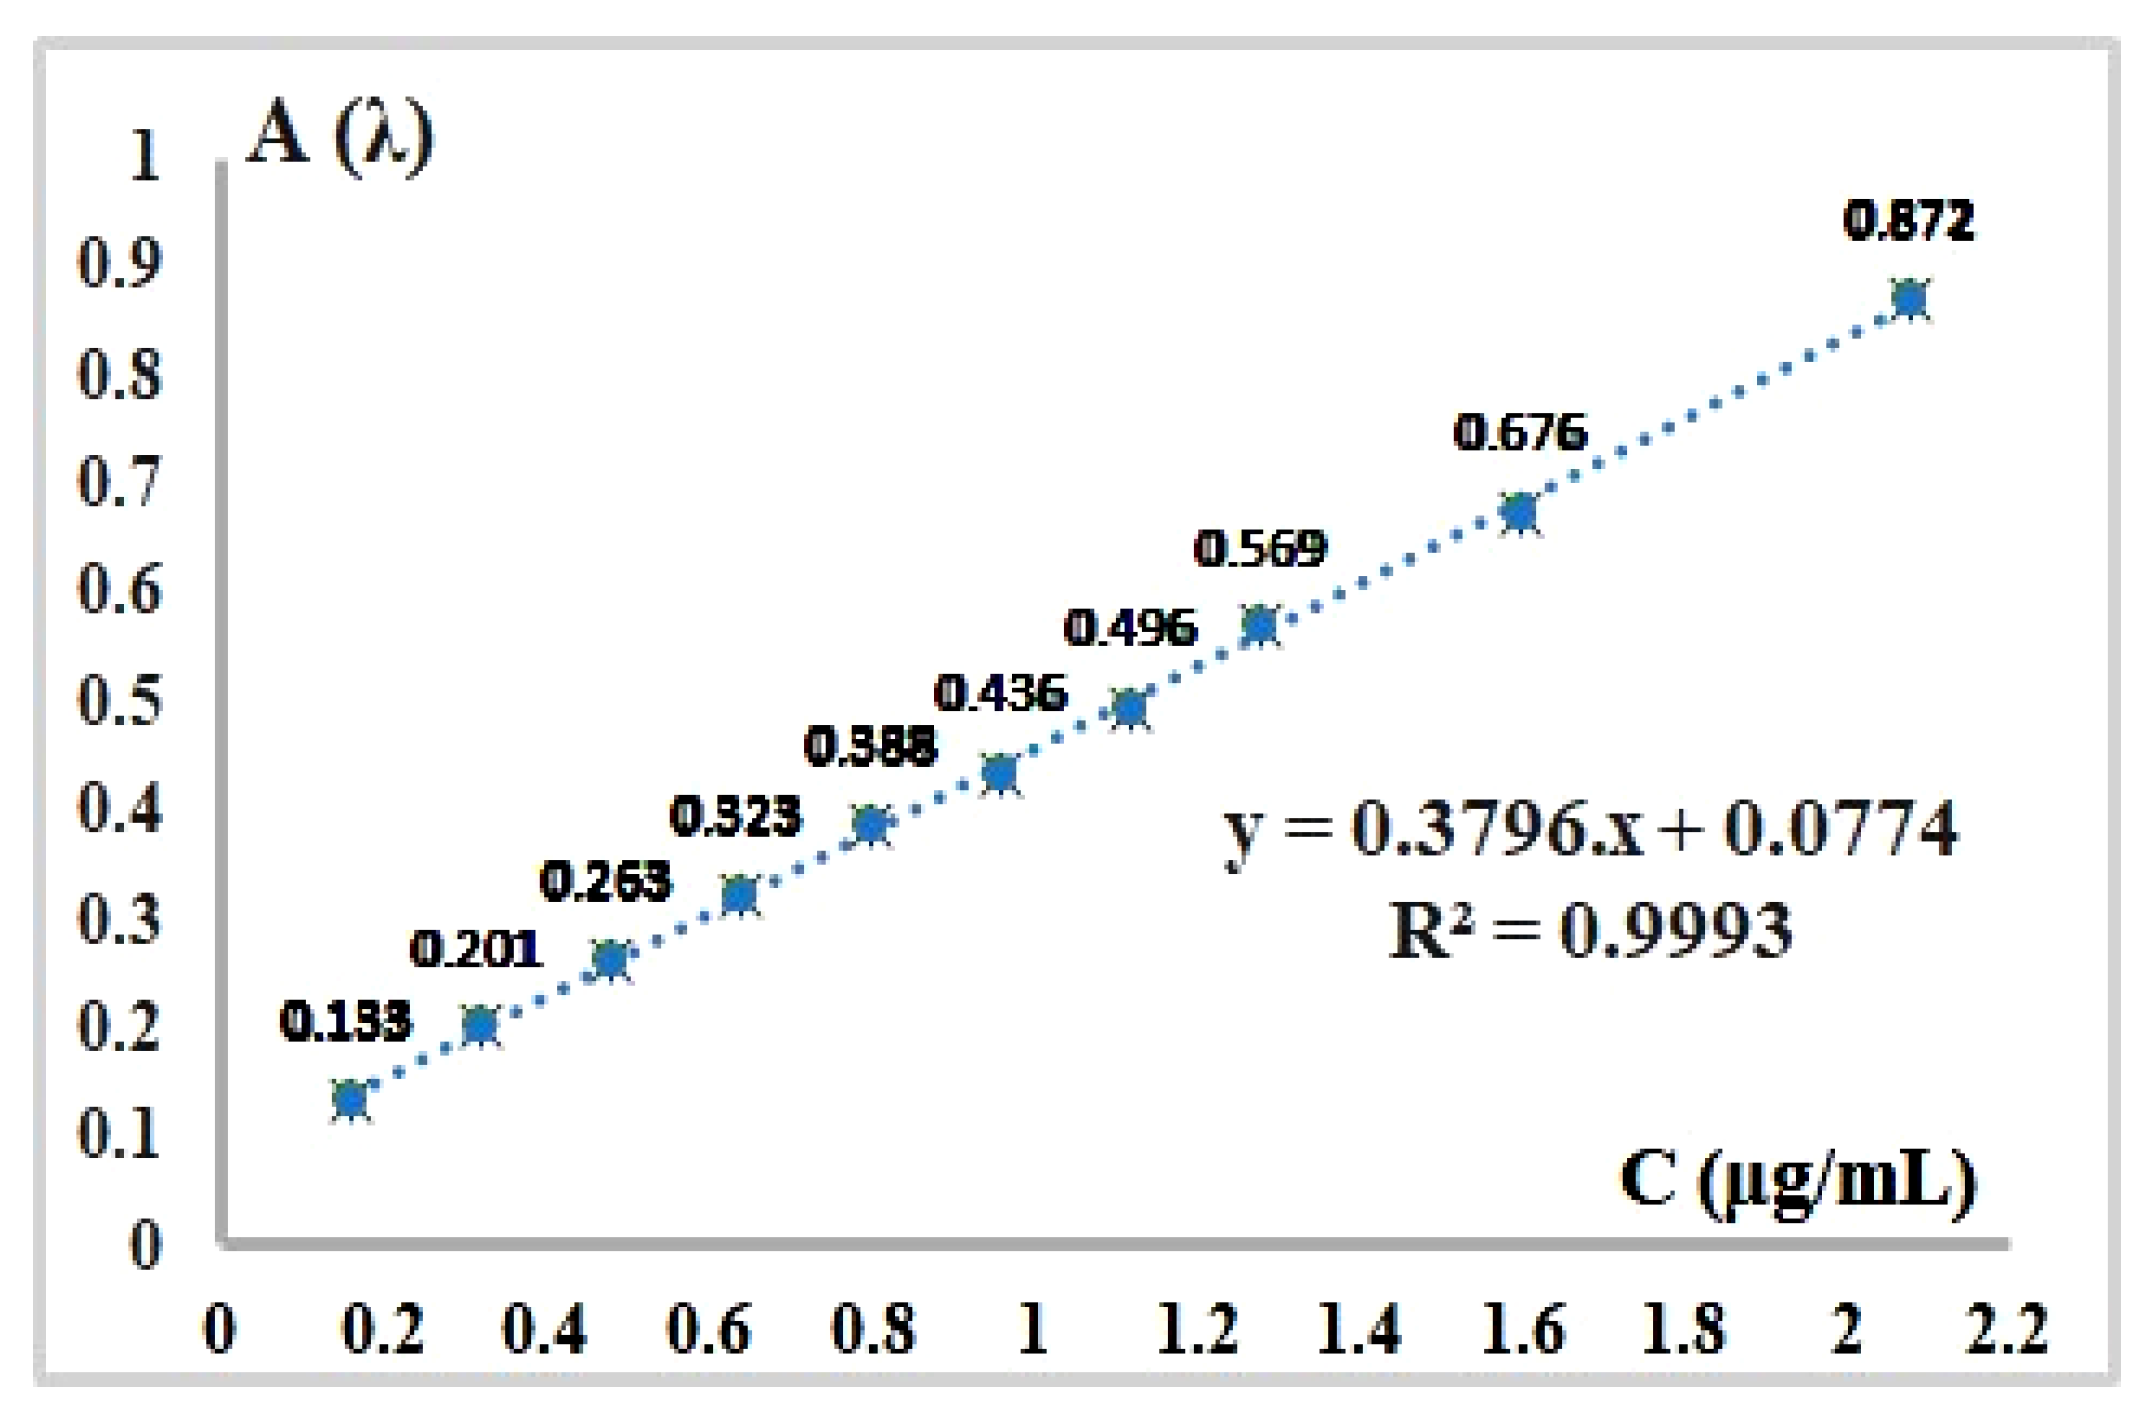
B.2. Synthesis of Sodium Valproate working solution 0.05 g % (500 µg/mL) from pure stock solution 0.5 g % (5000 µg/mL). Through a 1:10 dilution, 10 mL of previously prepared sodium valproate stock solution 0.5 g% (5000 µg/mL) were exactly measured and were quantitatively brought into another volumetric flask of V' = 100 mL. It was then made up to the mark with absolute ethanol p.a. under shaken conditions. The working sodium valproate solution obtained had a concentration of 500 µg/mL (0.05 %). This working sodium valproate solution 500 µg/mL (0.05 %). was used directly to obtain a pure standard solution,1,44 μg/mL (named Solution II) by two consecutive dilutions Standard Sodium Valproate solution 1.44 μg/mL just obtained by two consecutive dilutions (Table 1) was used to plot the absorption spectrum of Sodium Valproate in Visible range. The same working sodium valproate 500 µg/mL (0.05 %). was also used to directly obtain a first initial set of different ten pure standard solutions of sodium valproate (First Set named Set I of standard solutions) with concentrations between 2.0 µg/mL– 26.0 µg/mL, described in Table 2. To obtain the first initial set of ten standard solutions, same quantitative color reaction of Sodium Valproate with alpha-naphtylamine in the presence of sodium nitrite and and hydrochloric acid was made and described in Table 2. From the first initial set of standard solutions (Table 2), a second set of standard solutions of Sodium Valproate (Second Set named Set II of standard solutions) was obtained through a consecutive corresponding dilution. Preparation of the Second set of ten diluted standard solutions was indicated in Table 3. This second set of standard Sodium Valproate solutions with concentration range between 0.16 µg/mL – 2.08 µg/mL, were used directly with the main purpose to calibrate CECIL 3201 S UV-VIS spectrophotometer used, at λ = 386 nm for the bright light yellow dye obtained directly from sodium valproate, in relation to absolute ethyl alcohol as control. Calibration graph, which was drawn for the second set of standard solutions with concentration range between 0.16 µg/mL – 2.08 µg/mL, was described in Figure 3. All standard solutions prepared in identical graduated glass test tubes of 25 mL each, were filled up to the mark with absolute ethyl alcohol as solvent.
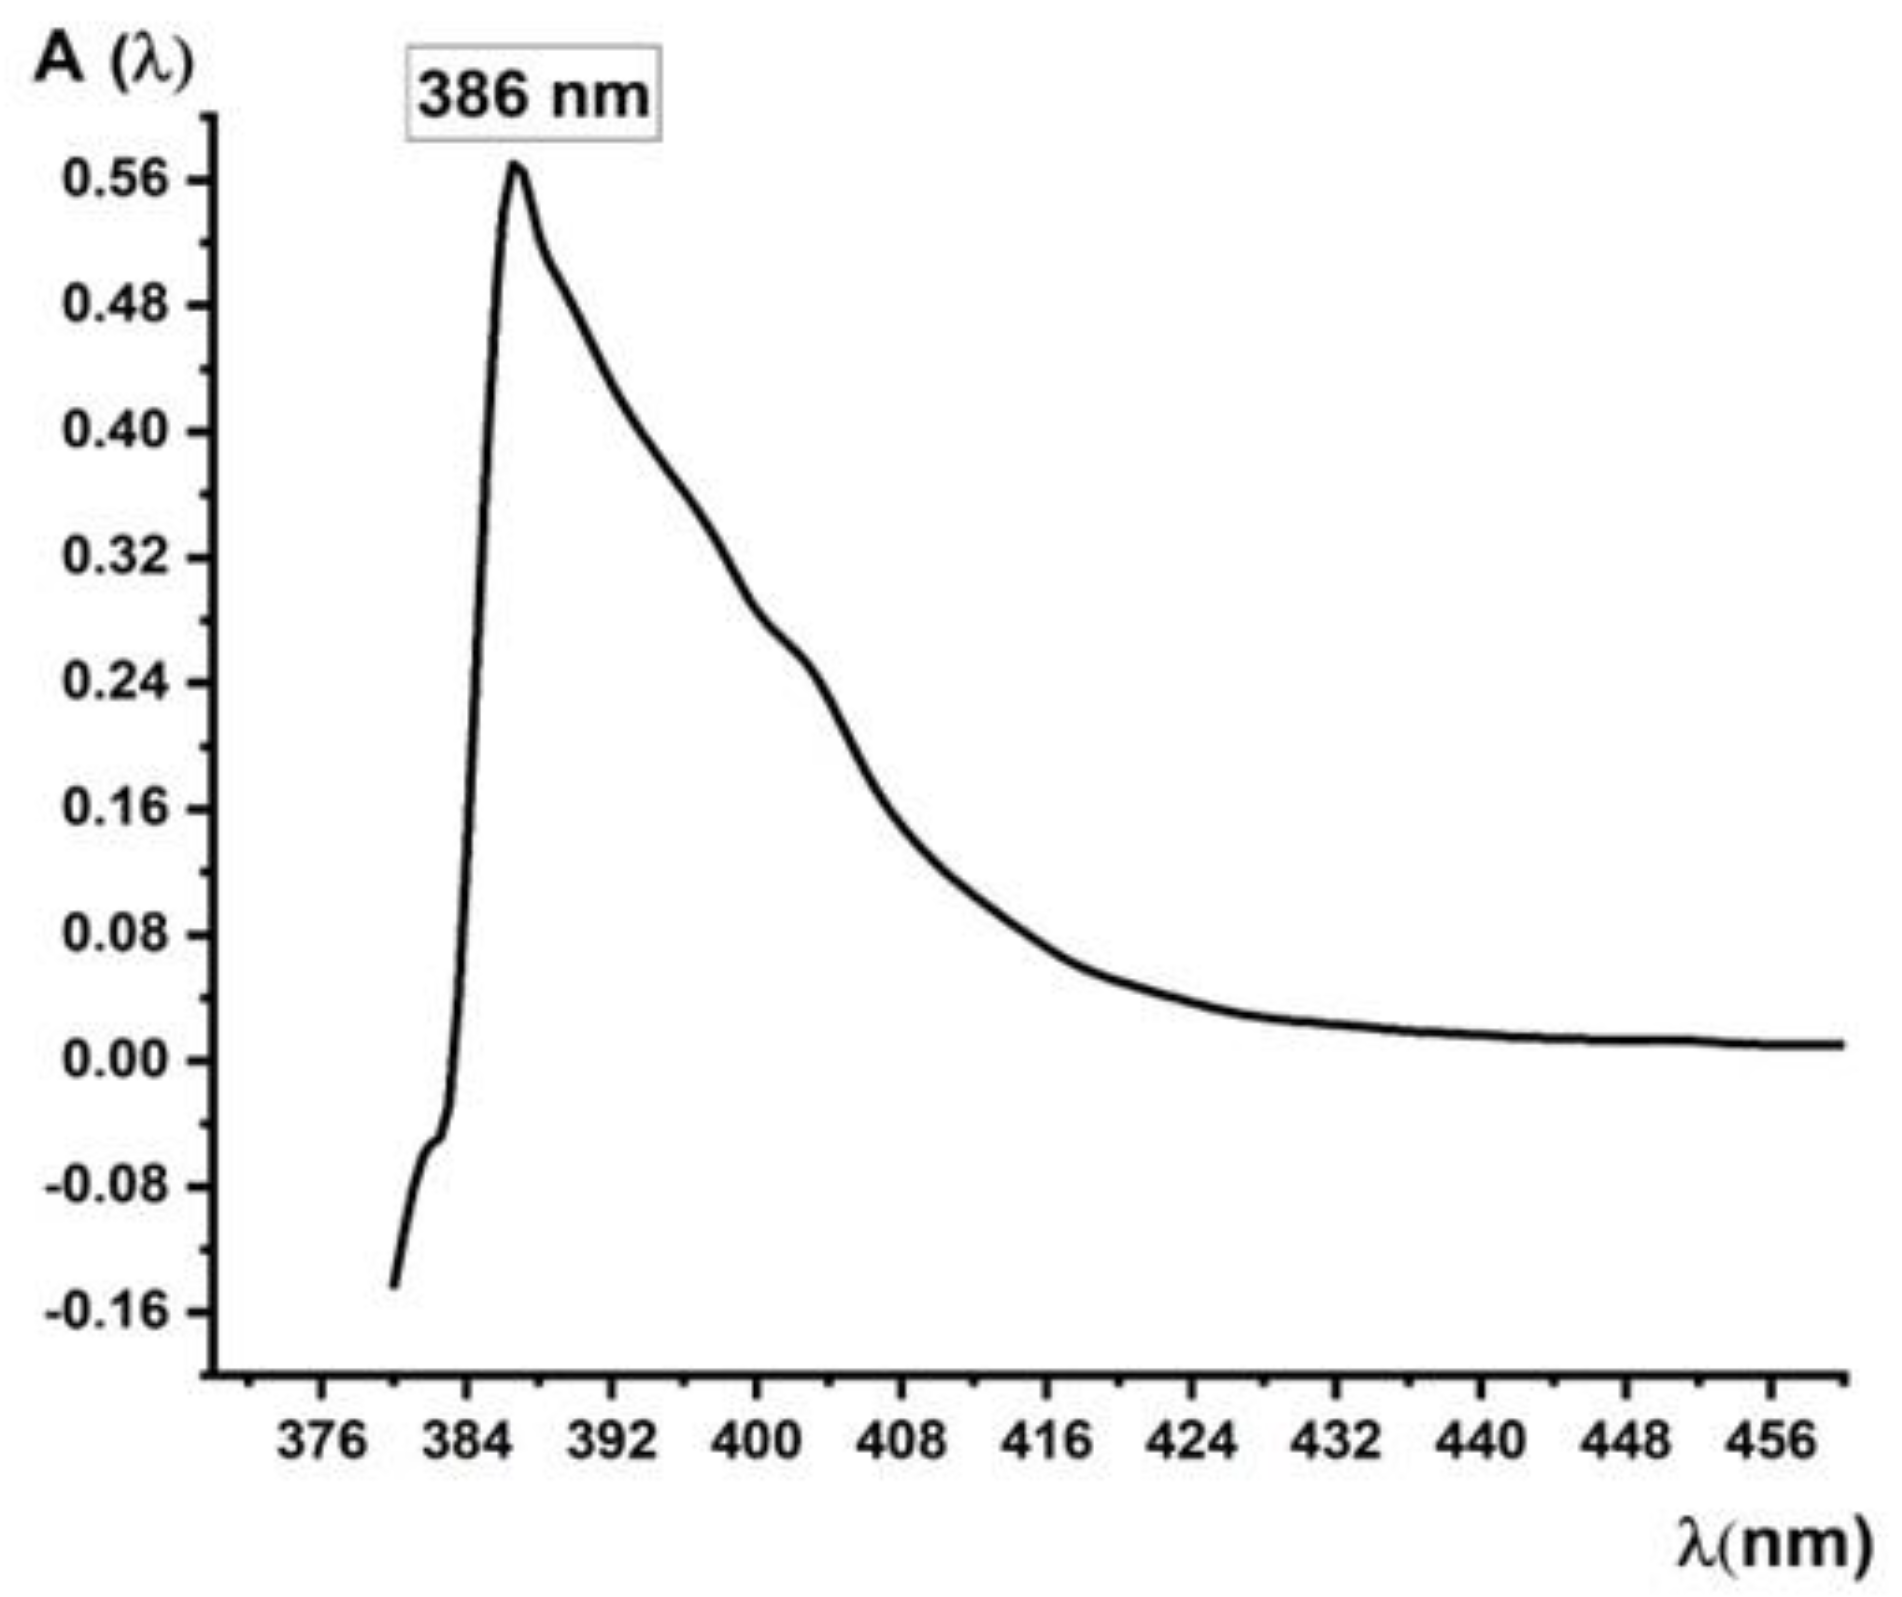
B.3. Visible Spectrum design using Sodium Valproate standard solution 1.44 µg/mL prepared from working solution 0.05 g % (500 µg/mL). Obtained Visible spectrum of Sodium Valproate was described in Figure 2. Chemical synthesis of this standard solution was shown in Table 1. A final standard solution of Sodium Valproate CS = 1.44 μg/mL obtained by two consecutive dilutions from initial working solution 500 µg/mL (0.05 %) described in Table 1 was used directly to draw the absorption spectrum in the Visible (VIS) field. The absorption spectrum was shown in Figure 2.
To plot Visible Spectrum the same quantitative color reaction of sodium valproate with alpha naphthylamine in the presence of sodium nitrite and hydrochloric acid was carried out (Table 1). In a 25 mL glass graduated test tube, 0.9 mL NaNO2, 4%-5% , 0.9 mL HCl 10%-15% and 0.9 mL alkalized alcoholic solution of α-naphthylamine 0.1% were accurately measured. Then the content was vigorously shaken for 5-8 minutes and left to rest in the refrigerator for 30 minutes (0-7 ºC). After 5-6 minutes of resting at laboratory temperature, exactly 0.9 mL of working solution of sodium valproate 500 μg/mL was added under vigorous shaken and then was completed with absolute ethyl alcohol up to 25 mL , up to the mark. Obtained first standard solution of Sodium Valproate → Solution I had the concentration 18 µg/mL (Table 1) and contained bright light yellow monoazo dye quantitatively formed from Sodium Valproate. From this first standard solution of Sodium Valproate 18 µg/mL (Solution I from Table 1) obtained, a second successive dilution was made as follows: exactly 2 mL of first standard solution 18 µg/mL were measured and brought quantitatively into another 25 mL graduated glass test tube and then filled with absolute ethanol (23 mL) to exactly 25 mL, up to the mark. With the help of this second standard solution of Sodium Valproate 1.44 µg/mL (Solution II from Table 1), the absorption spectrum was drawn in the wavelengths range between λ = 380 nm – 630 nm. Absolute ethyl alcohol was used as a control. The measured absorbances corresponding to wavelengths between λ = 380 nm – 630 nm, considered from 3 to 3 nm, were recorded : A = f (λ). Visible absorption spectrum of Sodium valproate was described in Figure 2.
Specific absorbance or specific extinction represented the absorbance of a layer of standard sodium valproate solution with a thickness of 1 cm and a concentration 1 % ( g / 100 mL), as a measure of the absorption of selected electromagnetic radiation with λ = 386 nm [24,25,26,27,28,29,30,31]. Molar extinction coefficient (ε) or molar absorptivity represented the absorbance of a layer of standard sodium valproate solution with a thickness of 1 cm and a concentration 1 Mole/L, as a measure of the absorption of the same selected electromagnetic radiation λ = 386 nm [24,25,26,27,28,29,30,31].

C. Plotting the Calibration Line on the Chosen Concentration Range 0.16 µg/mL – 2.08 µg/mL of Sodium Valproate Standard Solutions from Second Set, after the Second Consecutive Dilution (Final Set II)

Ten prepared standard solutions of Sodium Valproate used were prepared and described in Table 3. In ten 25 mL glass graduated test tube a series of various volumes between 0.1-1.3 mL NaNO2, 4%-5%, 0.1-1.3 mL HCl 10%-15% and 0.1-1.3 mL alkalized alcoholic solution of α-naphthylamine 0.1% were accurately measured (Table 2). Then the content was vigorously shaken for 5-8 minutes and left to rest in the refrigerator for 30 minutes (0°C -7 ºC). Thirty minutes period of resting in refrigerator and 4 minutes in the laboratory temperature it was followed by the measured appropriate volumes of working solution 500 μg/mL which were subsequently added. .Different volumes of Sodium Valproate between 0.1-1.3 mL were added under vigorous shaken then completed with absolute ethyl alcohol up to 25 mL, right up to the mark. Obtained first set of ten standard solution of Sodium Valproate had the concentration range between 2.0 µg/mL– 26.0 µg/mL (Table 2) and all contained bright light yellow monoazo dye quantitatively formed from Sodium Valproate. From this first initial ten standard solution set of Sodium Valproate 2.0 µg/mL– 26.0 µg/mL (indicated as: initial Set I), a second successive dilution was exactly made as follows: 2 ml of each standard solution from the first initial set of ten standard solutions (from Table 2) with concentrations between 2.0 µg/mL – 26.0 µg/mL were accurately measured and brought quantitatively into another ten graduated glass test tube and then filled with absolute ethanol (23 mL) to exactly 25 mL, right up to the mark (Table 3). Second final set of standard solutions with concentrations ranged between 0.16 µg/mL – 2.08 µg/mL (indicated as; final Set II) was thus obtained and was used to plot the regression line and calibrate the spectrophotometer for the bright light yellow dye quantitatively obtained from sodium valproate, at λ = 386 nm against absolute ethyl alcohol as a control. The absorbance values of ten standard solutions from second final set were read out (Table 3) and the calibration curve was plotted against absolute ethyl alcohol as a blank (Figure 3).
Color intensity from each of ten glass test tubes of 25 mL each filled with standard solutions of Sodium Valproate from final Set II (Table 3) varied directly proportional to the concentration in bright light yellow monoazo dye formed and to the absorbance of each solution (Table 3), according to the Bouguer Lambert-Beer law : A = ε.l.c.

D. Preparation and Analysis of the Sample Solution of Sodium Valproate

Sodium valproate sample solution was prepared identically to standard solutions, following the same procedure and chemical color reaction. One solid prolonged-release tablet officially contained 500 mg pure sodium valproate as reference value. Average mass of a solid film-coated tablet of the pharmaceutical product was mC = 500 mg = 0.5 g. About 2-3 solid film-coated tablets of the pharmaceutical product were finely crushed. From the obtained powder, a quantity a = 0.02 g was accurately weighed on the digital analytical balance, which was brought quantitatively from the watch glass with 20 mL of a mixure composed by ethyl alcohol and acetone (2:1) in a volumetric flask of volume VX = 50 mL. The content was well homogenized until completely dissolution of active substance represented by Sodium Valproate and filled up to the mark with absolute ethyl alcohol. In a separate graduated glass test tube 0.3 mL of aqueous NaNO2 solution, 4%-5%, 0.3 mL of 10%-15% HCl solution and 0.3 mL of alkalized alcoholic solution of α-naphthylamine 0.1% were added under vigurous shaken conditions (Table 4). It followed a storage period of graduated glass test tube in the refrigerator at temperature of 0°C-7ºC cold conditions during 30 minutes. Thirty minutes period of resting in refrigerator and 3-4 minutes in the laboratory temperature it was followed by a measured appropriate volume of unknown sample solution which was subsequently added . A volume v1 = 0.3 mL sample was exactly measured from the resulting initial solution and was quantitatively brought into the graduated glass test tube over the other initial existing reagents and inetrmediate compunds formed in the cold conditions (Table 4). The content was vigorously shaken 2-3 minutes and glass graduated test tube was filled up exactly to the volume Vp = 25 mL with absolute ethyl alcohol, up to the mark. This initial sample solution called P1 was subjected to a second successive dilution, identically as for standard solutions, as follows: exactly v2 = 2 mL (Table 5) of sample solution P1 were measured and quantitatively brought with an appropriate volume of absolute ethanol into another graduated test tube V' = 25 mL. It was then completed with absolute ethanol up to exactly 25 mL, right up to the mark. The final sample solution named P2 was thus obtained by the second successive dilution from the previous initial sample solution PI (Table 5).Three determinations were made on final obtained sample solution P2 and the average absorbance Ap of the unknown sample solution of Sodium Valproate containing the bright yellow monoazo dye quantitatively formed was measured at the wavelength λ = 386 nm, against absolute ethyl alcohol as a control. The amount of pure sodium valproate tested and expressed in milligrams of pure active substance reported on solid extended-release tablet of the studied pharmaceutical product was finally calculated.

E. Calculations of the Dosing Method

Ir was known that a solid prolonged-release tablet of pharmaceutical product contained 500 mg of active substance in the form of Sodium Valproate. Calculation procedure that determined the amount of pure sodium valproate on solid tablet of the studied pharmaceutical product took place in several stages, as follows:
E1. Calculation of pure Sodium Valproate concentration Cp (µg/mL) in the sample solution, according to regression (calibration) line represented in Figure 3. From the equation of calibration line obtained with Microsoft Office Excel 2019, y = 0.3796.x + 0.0774 (Figure 3), the concentration in pure sodium valproate of the sample solution was calculated and expressed in µg/mL. By substituting y = Ap and x = Cp into the equation of the line it was obtained: Ap = 0.3796. Cp (µg/mL) + 0.0774. It was then deduced that Cp (µg/mL) = (Ap - 0.0774) / 0.3796 (3).
E2. Evaluation of the quantity X expressed in µg of pure sodium valproate from V' = 25 mL final sample solution named P2: X = Cp (µg/mL). V' (4) represented the quantity expressend in μg of pure sodium valproate existing in V' = 25 mL second final sample solution P2 (from the second graduated glass test tube).
E3. Determination of the amount X1 expressed in µg of pure sodium valproate from VP = 25 mL initial prepared sample solution P1: X1 = VP .X / v2 (5) was the amount expressed in μg of pure sodium valproate from VP = 25 mL first initial sample solution P1 (from the first graduated glass test tube used).
E4. Calculation of the amount Y expressed in µg of pure Sodium Valproate from VX = 50 mL total sample solution initially prepared in the volumetric flask: Y = VX .X1 / v1 (6) was the amount expressed in μg of pure sodium valproate in VX = 50 mL total initial sample solution prepared (from the volumetric flask).
E5. Determination and analysis of the quantities Y' and Y1 expressed in μg and mg respectively, of pure sodium valproate from a = 0.02 g sample analyzed powder, related to the average mass of a phramaceutical tablet mc = 500 mg = 0.5 g:
Y μg sodium valproate............a (a = 0.02 g sample powder)
Y' μg sodium valproate..........mc = 0.5 g
Where Y' = (Y . mc) / a (7) represented the amount of pure sodium valproate expressed in μg abd reported on solid pharmaceutical tablet. Y' it was then converted from μg to mg, as follows: Y1 = Y' . 10-3 (8) mg prepresented the real calculated amount of pure sodium valproate from a = 0.02 g sample powder analyzed, related to the average mass of a prolonged-release tablet that was mc = 500 mg = 0.5 g.
E6. Calculation of the percentage content Z (%) of pure sodium valproate on solid film-coated tablet of pharmaceutical product:
100 %...................500 mg of pure sodium valproate
Z %.....................Y1 mg of pure sodium valproate, where Z = (Y1. 100 / 500) mg % (9). Thus, Z = (Y1. / 5) mg % (9) was the actual percentage content expressed in mg % of pure sodium valproate calculated on tablet of pharmaceutical product.
According to the Official Rules of Romanian Pharmacopoeia 10-th Edition and European Pharmacopoeia, the maximum percentage deviation allowed from the officially declared active substance content must be ± 5%, for pharmaceutical products with an officially stated declared content of 100 mg and over 100 mg of pure active substance / pharmaceutical form (solution, tablet, dragee, capsule, ampoule, suppository, phramaceutical egg, ointment) [30,32].

F. Study of the Method Linearity. Calculation of Dectection Limit (LOD) and Quantitation Limit (LOQ)

Linearity of spectrophotometric method was studied over the entire pre-established concentration range of sodium valproate standard solutions between: 0.16 μg/mL – 2.08 μg/mL. Experimental values of the correlation coefficient (R) and linear regression coefficient (R2) determined and characterized the linearity of analysis method, direct proportionality between the absorbances of sodium valproate standard solutions (Table 3) measured at the wavelength λ = 386 nm and their concentrations, for the chosen concentration range, between 0.16 μg/mL – 2.08 μg/mL. Statistically accepted values for the correlation coefficient were: R ˃ 0.9990, and in the case of the linear regression coefficient R2 ≥ 0.9990, as a direct measure of direct evaluation of the method linearity [28,29,30,31,32]. From equation of the calibration line drawn for valproate standard solutions of sodium (Figure 3), statistical parameters of the regression line were calculated and were determined using the Microsoft Office Excel 2019 software, These experimental values were shown in Table 6. To find out the statistical parameters of the linear regression, a statistical function from Microsoft Office Excel 2019 menu was used: Data → Data Analysis → Regression. A “Regression Stiatistics” table was then obtained in a new separate Excel sheet, which was then retrieved and copied. Regression line obtained from graphical representation Af = f (Cf) (Table 3 values) reflected and pointed out direct proportionality between absorbance values of standard solutions and their concentrations. Regression line was described in Figure 3.
Limit of Detection (LOD) represented the smallest amount of analyte in a sample to be dosed, which could be detected, sensed or identified very easily from a given sample compared to a control (standard), under pre-determined experimental conditions, with a statistically acceptable precision and accuracy. It was expressed in the same units as the concentration of the analyte and was calculated using the following formula: LOD = 3 . SE/ Slope (μg/mL) (10) [28,29,30,31,32].
Limit of Quantitation (LOQ) was given by the lowest concentration of an unknown analyte in a sample, which could be determined, assessed quantitatively or quantified very easily, with a very good, and statistically acceptable precision and accuracy, under the same given experimental conditions . Limit of Quantitation value was expressed in the same units as the concentration of the analyte and was calculated as follows: LOQ =10 . SE / Slope (μg/mL) (11), where SE represented the standard error of the regression line (from Figure 3 and Table 6) [28,29,30,31,32] .

III. Results and Discussions

A. Absorption Spectra Analysis. Specific Absorbance and Molar Extinction Coefficient (ε) or Molar Absorptivity Calculations

Absorption spectrum was plotted in the Visible range (Figure 2) for a Sodium Valproate standard solution with concentration CS = 1.44 μg /mL = 0.000144 g %. It was established that the maximum absorption of the bright light Yellow monoazo dye quatitatively obtained from Sodium Valproate was assigned to the wavelenght λ = 386 nm corresponding to absorbance A = 0.540. According to the relationship (1) a = A / CS = 0.540 / 0.000144 = 3750. Specific absorbance of the pure standard sodium valproate solution, whose absorption spectrum was plotted (Figure 2), had the value a = 3750 = specific absorbance calculated for the concentration of target standard solution CS = 1.44 μg /ml = 0.000144 g % = 1.44.10-4 g %. Molar absorbtivity was calculated according to Bouguer Lambert-Beer law, as follows: ε = A / CM (2), where CM = represented concentration of standard solution of sodium valproate expressed in Moles / L assigmed to CS = 1.44 μg /mL for which was plotted the absorption spectrum, and A = the average absorbance corresponding to the absorption maximum was the same = 0.540. Target standard solution concentration was trandformed into g/L (g/1000 mL): CS = 1.44 μg /mL = 0.000144 g % = 0.00144 g/L = 1.44 .10-3 g/L Wavelength corresponding to the absorption maximum of monoazo dye was ƛ = 386 nm corresponding to A = 0.540. Molecular formula of the bright light Yellow monoazo dye quantitatively formed was: C18H21N2O2Na. Molecular mass of this bright light yellow dye obtained was M = 216 + 21 + 28 + 32 + 23 = 320 g/mol. So, the molecular mass of the light yellow monoazo dye obtained was M = 320 g/mol. Then CS = 1.44 μg /mL = 0.000144 g % = 1.44 .10-4 g % = 0.00144 g/L = 1.44 .10-3 g/L Then, standard solution concentration of Sodium Valproate was converted from g/L to Mole/L: CM = molar concentration directly assigned to CS = 1.44 .10-3 g/L Sodium Valproate standard solution It was known the molar mass of bright light Yellow monoazo dye obtained was M = 320 g/mol. So, CM = (1.44 .10-3 ) / 320 expressed in Moles/L. Thus, CM = 4.5. 10-6 Moles / L was final molar concentration of standard Sodium Valproate solution corresponding to the initial analyzed solution CS = 1.44 .10-3 g/L = 1.44 .10-4 g% = 1,44 μg/mL Sodium Valproate, for which the absorption spectrum was plotted. From formula (2) it was concluded: ε = A / CM = 0.540 / 4.5.10-6 = 0.540 / 0.0000045 = 120000.00. Molar extinction coefficient "ε" (molar absorptivity) had a proper value: ε = 120000.00 corresponding to CM = 4.5. 10-6 Moles / L standard solution . It was registered also a good specific absorbance a = 3750; both molar extinction coefficient and specific absorbance were assigned to the initial studied standard solution CS = 1.44 .10-3 g/L = 1.44 .10-4 g% = 1,44 μg/mL, that has contained the bright light Yellow monoazxo dye quatitatively obtained from Sodium Valproate. This initial standard solution of Sodium Valproate for which the Spectrum has been plotted also had a molar concentration CM = 4.5. 10-6 Moles / L.

B. Design of Calibration Graph through the Use of Standard Concentrations Range Values between 0.16 μg/mL – 2.08 μg/mL

Before analyzing quantitatively the active substance in the pharmaceutical form under study (film-coated tablets with prolonged release), spectrophotometer was calibrated at wavelength corresponding to absorption maximum of the btight light yellow colored compound analyzed at λ = 386 nm , for monoazo dye quantitatively formed by chemical reaction of Sodium Valproate with α-naphthylamine 0.1%, in the presence of NaNO2 4%-5% and HCl 10%-15%. Calibration plot was drawn with the help of standard solutions of sodium valproate 0.16 μg/mL – 2.08 μg/mL (Table 3). Drawn calibration line was illustrated in Figure 3 described below:
From Figure 3 it was noticed that the linear regression coefficient R2 = 0.9993 had a very good value. R2 ≥ 0.9990 and was statistically valid. Almost perfect linearity of the method was found, in the case of standard solutions of Sodium Valproate, over the entire considered range of standard solutions concentrations (0.16 µg/mL- 2.08 µg/mL).

C. Quantitative Analysis of Sodium Valproate in Tablets of a Pharmaceutical Product: Calculation of Pure Amount Expressed in Milligrammes (mg) of Sodium Valproate Relative to Solid Extended-Release Tablet of Pharmaceutical

According to the manufacturer, one extended-release solid film-coated tablet contained 500 mg of pure Sodium Valproate. Weighted average mass of a tablet was mC = 0.5 g = 500 mg. Measured average absorbance value of the sample solution was AP = 0.221.
  • Calculation of pure sodium valproate concentration Cp (µg/mL) present in sample solution, from equation of the regression line (Figure 3):
From equation (3), Cp (µg/mL) = (Ap - 0.0774) / 0.3796, according to Figure 4 deduced that Cp (µg/mL) = (0.221 - 0.0774) / 0.3796. = 0.3783 μg/mL, so Cp = 0.3783 μg/mL.
  • Evaluation of quantity X expressed in µg of pure Sodium Valproate from V' = 25 mL final sample solution named P2
From equation (4), X = Cp (µg/mL). V' = 0.3783 . 25 = 9.4575 μg X = 9.4575 μg Sodium Valproate in V' = 25 mL final sample solution P2.
  • Determination of the quantity X1 expressed in µg of pure Sodium Valproate from VP = 25 mL initial prepared sample solution P1:
From equation (5), X1 = VP .X /v2 = (9.4575 .25) / 2 = 118.21875 μg., X1 = 118.21875 μg Sodium Valproate in VP = 25 mL initial prepared sample solution P1.
  • Calculation of the amount Y expressed in µg of pure Sodium Valproate from VX = 50 mL total sample solution initially prepared in the volumetric flask
From equation (6), Y = VX .X1 / v1 = (118.21875 . 50) / 0.3 = 19703,125 μg. Thus, Y = 19703,125 μg Sodium Valproate in VX = 50 mL total sample solution initially prepared in the volumetric flask.
  • Determination and analysis of the quantities Y' and Y1 expressed in μg and mg respectively, of pure sodium valproate from a = 0.02 g sample analyzed powder, related to the average mass of a phramaceutical tablet mc = 500 mg = 0.5 g.
From equation (7), Y' = (Y . mc) / a = (19703,125 . 0.5) / 0.02 = 492578,125 μg.. Then, Y' = 492578,125 μg pure Sodium Valproate from a = 0.02 g sample analyzed powder, related to average mass of a phramaceutical tablet mc = 500 mg = 0.5 g. So, Y1 = Y' . 10-3 (8) = 492578,125 . 10-3 mg . Thus, Y1 = 492578,125 . 10-3 mg = 492.578 mg represented the real final calculated content of pure Sodium Valproate from a = 0.02 g sample powder analyzed, related to the average mass of a prolonged-release tablet that was mc = 500 mg = 0.5 g
  • Calculation of the percentage content Z (%) of pure Sodium Valproate on solid film-coated tablet of pharmaceutical product:
According to relation (9), Z = (Y1./ 5) mg % = 492.578 / 5 = 98.5156 % . So, Z = 98.5156 mg % was real calculated percentage content of pure Sodium Valproate on solid film-coated tablet of pharmaceutical product:
It was observed that real percentage content Z (%) of pure sodium valproate calculated per film-coated tablet with prolonged release was: Z = 98.5156 % which has corresponded to an amount of Y1 = 492.578 mg of pure active substance found on pharmaceutical tablet. Thus, the average percentage error (deviation) from the official reference value of 500 mg Sodium Valproate on pharmaceutical tablet (which was assigned to a 100 % considered percentage), was only E = 100 % - 98.5156 % = 1.4844 % . So, average percentage error (deviation) calculated E = 1.4844 % was located within the normal limit of values. .The mean calculated percentage error (deviation) was below the maximum allowed average percentage deviation from the officially declared active substance content, imposed by the Romanian Pharmacopoeia 10th Edition. and by the European Pharmacopoeia Rules (± 5 %).

D. Method Linearity Analysis. Calculation of Dectection Limit (LOD) and Quantitation Limit (LOQ)

Statistical parameters of method linearity were determined using Microsoft Office Excel 2019 (Data → Data Analysis → Regression) and were described in Table 6. Standard solutions concentration range chosen was between: 0.16 μg/ mL – 2.08 μg/ mL. Equation of the regression line: y = 0.3796 x- + 0.0774 (Figure 3), or A(λ) = 0.3796. Cp(μg/mL) + 0.0774. Intercept with the ordinate had the value 0.0774, and the slope of the line was 0.3796. The linear regression coefficient R2 = 0.99933024, R2 ≥ 0.9990 and the correlation coefficient R = 0.99966506, R > 0.9990 (Table 6). Both of them were between the normal limits of values, above the minimum allowed value 0.9990, that described the directly proportional variation of measured absorbances of standard solutions with their concentrations. Standard error of the regression line was SE = 0.00621264 (Table 6).
Detection Limit, LOD was calculated according to formula (10) as follows: LOD = 3 . 0.00621264 / 0.3796, LOD = 0.0491 μg/ mL, it fell between the normal values. LOD = 0.0491 μg/mL LOD <<1. Quantitation Limit , LOQ was calculated according to formula (11) as follows: LOQ = 10 . 0.00621264 / 0.3796, LOQ = 0.1636 μg/ mL, it also fell within the normal range of values. LOQ = 0.1636 μg/m, LOQ < 1 . Both, LOD and LOQ had very small values and was within the normal limits.

IV. Conclusions

A new spectrophotometric quantitative analysis method of Sodium Valproate tablets inVisible (VIS) field was developed, optimized and proposed to be applied.. Exact amount of pure Sodium Valproate found on tablet with prolonged release was 492.578 mg of pure active substance / solid film-coated tablet.The amount 492.578 mg found was very close to the official stated content of Sodium Valproate / tablet, which was 500 mg Sodium Valproate. Amount found 492.578 mg was assigned to an percentage content of Z = 98.5156% pure Sodium Valproate / pharmaceutical tablet. Thus, the average percentage error (deviation) (%) from the official reference value (100 % official percentage content of pure sodium valproate / pharmaceutical tablet, corresponding to 500 mg pure active substance of sodium valproate) was only E = 1.4844 % and was found to be under the maximum average percentage deviation allowed (± 5 %), imposed by Romanian Pharmacopoeia, 10th edition. and by European and International Pharmacopoeias. Officially declared amount 500 mg Sodium Valproate was assigned to an considered percentage content of 100 % pure active substance on pharmaceutical tablet. Method applied and proposed for validation had a very good linearity over the entire concentration range chosen of the standard solutions: 0.16 μg/mL – 2.08 μg/mL Linear regression coefficient R2 = 0.99933024, R2 ≥ 0.9990 and the correlation coefficient R = 0.99966506, R > 0.9990 presented very good and effective values and fell perfectly within the normal limits. It was indicated a very good linearity of the method, acceptable from a statistical point of view.Detection Limit LOD and QuantitationLimit LOQ showed very low, statistically acceptable values. For sodium valproate standard solutions, the following values were found: LOD = 0.0491 μg/mL and LOQ = 0.1636 μg/mL, which were perfectly within the range of normal values LD << 1 and LQ < 1.Stabdard Error of the Regression Line was SE = 0.00621264 assigned to a very low and statistically acceptable value,. SE <<1.

References

  1. R.S. Fisher , C. Acevedo, A. Arzimanoglou, A. Bogacz , J.H. Cross, C. E. Elger, J. Engel Jr., L. Forsgren, J.A. French, M. Glynn, D.C. Hesdorffer, B.I. Lee, G.W. Mathern, S.L. Moshé, E. Perucca, I.E. Scheffer, T. Tomson, M. Watanabe and S. Wiebe.,"ILAE official report: a practical clinical definition of epilepsy". Epilepsia, 2014, 55 (4): 475–482.
  2. ***"Epilepsy Fact sheet". WHO. February 2016. Archived from the original on 11 March 2016. Retrieved 4 March 2016.
  3. R.S. Fisher , W. van Emde Boas, W. Blume, C. Elger, P. Genton, P. Lee, and J. Engel Jr., "Epileptic seizures and epilepsy: definitions proposed by the International League Against Epilepsy (ILAE) and the International Bureau for Epilepsy (IBE)". Epilepsia, 2005, 46 (4): 470–472. [CrossRef]
  4. K.J. Martin-McGill, R. Bresnahan, R.G. Levy, P.N. Cooper, "Ketogenic diets for drug-resistant epilepsy", The Cochrane Database of Systematic Reviews, 2020, 6 (6): 1-55.
  5. ***"Valproic Acid". The American Society of Health-System Pharmacists. 24 November 2020. Archived from the original on 31 July 2017.
  6. M.J. Owens, C.B. Nemeroff, "Pharmacology of valproate”, . Psychopharmacology Bulletin, 2003, 37 (Suppl. 2): 17–24.
  7. Y. Ghodke-Puranik, C.F. Thorn, J.K. Lamba, J.S. Leeder, W. Song, A.K. Birnbaum, R.B. Altman and T.E. Klein, "Valproic acid pathway: pharmacokinetics and pharmacodynamics", Pharmacogenetics and Genomics, 2003, 23 (4): 236–241.
  8. R.M.Pinder, R.N. Brogden, T. M.. Speight, G. S. Avery, “Sodium valproate: a review of its pharmacological properties and therapeutic efficacy in epilepsy”, Drugs, 1977 ;13 (2): :81-123.
  9. W. Löscher, "Basic pharmacology of valproate: a review after 35 years of clinical use for the treatment of epilepsy". CNS Drugs,. 2002, 16 (10): 669–694.
  10. M. Romoli, P.Mazzocchetti, R.D’Alonzo, S.Siliquini, V.E. Rinaldi, A. Verrotti, P. Calabresi and C. Costa, “Valproic Acid and Epilepsy: From Molecular Mechanisms to Clinical Evidences”, Current Neuropharmacology.2019, 17 (10): 926–946. [CrossRef]
  11. S.Y. Kwan, "The role of intravenous valproate in convulsive status epilepticus in the future" ,. Acta Neurologica Taiwanica, 2010, 19 (2): 78–81.
  12. K. B. Olsen , E. Taubøll, L. Gjerstad, "Valproate is an effective, well-tolerated drug for treatment of status epilepticus/serial attacks in adults,. Acta Neurologica Scandinavica, 2007, 187: 51-54. [CrossRef]
  13. M. A. Uberall , R. Trollmann, U. Wunsiedler, D. Wenzel, “Intravenous valproate in pediatric epilepsy patients with refractory status epilepticus”, Neurology, 2000, 54 (11): 2188-9.
  14. H. J. Kupferberg, “Sodium valproate”, Advanced Neurology, 1980, 27: 643-54.
  15. G. Tunnicliff, “Actions of sodium valproate on the central nervous system”, Journal of Physiology and Pharmacology, 1999, 50 (3): 347-65.
  16. J.X . Li , Q. Zhang, J.H. Liang, “Valproate prevents the induction, but not the expression of morphine sensitization in mice”, Behavioral Brain Research, 2004, 152 (2): 251-7.
  17. J. Chukwu, N. Delanty, D. Webb, G.L. Cavalleri, "Weight change, genetics and antiepileptic drugs". Expert Review of Clinical Pharmacology, 2014, 7 (1): 43–51.
  18. P. Chang , M. C. Walker , R. S. B. Williams , “Seizure-induced reduction in PIP3 levels contributes to seizure-activity and is rescued by valproic acid”, Neurobiology of Disease, 2014, 62: 296-306. [CrossRef]
  19. A.K. Death, K.C. McGrath, D.J. Handelsman, "Valproate is an anti-androgen and anti-progestin", Steroids, 70 (14): 946–953. [CrossRef]
  20. H. Uchida, T. .Maruyama, T. Arase., M. Ono, T. Nagashima, H. Masuda, H. Asada and Y. Yoshimura, "Histone acetylation in reproductive organs: Significance of histone deacetylase inhibitors in gene transcription", Reproductive Medicine and Biology. 2005, 4 (2): 115–122. [CrossRef]
  21. J.I.T. Isojärvi, E. Taubøll and A.G. Herzog, "Effect of antiepileptic drugs on reproductive endocrine function in individuals with epilepsy". CNS Drugs, 2005, 19 (3): 207–223. [CrossRef]
  22. T. S. Belal , D.S. El-Kafrawy , M. S. Mahrous , M. M. Abdel-Khalek , A. H. Abo-Gharam, “Validated spectrophotometric methods for determination of sodium valproate based on charge transfer complexation reactions”, Spectrochimica Acta A Molecular and Biomolecular Spectroscopy, 2016, 155: 47-53. [CrossRef]
  23. M. N. Abualhasan, N. W. Odeh, G.N. Younis and O. F. Zeidan, , Analytical Method Development for Sodium Valproate through Chemical Derivatization”, Hindawi International Journal of Analytical Chemistry, 2020, 5 , 1-7.
  24. J. Chen, X.D. Wang, H.S. Wang, S.D. Chen,, L.M. Zhou J.L. Li, W.Y. Shu, J.G. Zhou, Z.Y. Fang, Y. Zhang, M. Huang, “Simultaneous determination of valproic acid and 2-propyl-4-pentenoic acid for the prediction of clinical adverse effects in Chinese patients with epilepsy”, Seizure, 2012, 21, 2, 110–117.
  25. K. Lipska, A. Gumieniczek , R. Pietra´s and A. .A. Filip, “HPLC-UV and GC-MS Methods for Determination of Chlorambucil and Valproic Acid in Plasma for Further Exploring a New Combined Therapy of Chronic Lymphocytic Leukemia”, MDPI Molecules, 2021, 26, 2903, 1-17.
  26. S. Kaewpradit, G. Yusakul , P. Rojsitthisak, C. Jantarat, “A simple and rapid HPLC-UV method for the determination of valproic acid in human plasma using microwave-assisted derivatization with phenylhydrazine hydrochloride”, Heliyon, 2024, 10, e27875, 1-13.
  27. W. Czarnecki and B. Haƚczyńska, “Colorimetric Determination of Valproic Acid and Its Salts”, Acta Poloniae Pharmaceutica – Drug Research, 1999, 56, 5, 353-355.
  28. Ermer J..and McB J. H. Miller , Method Validation in Pharmaceutical Analysis, Wiley – VCH Verlag GmbH & Co. KgaA Edit., Wienheim, 1-151, 2005.
  29. McB. Miller, J.H. Validation of Pharmacopoeial Methods. In Methods Validation in Pharmaceutical Analysis. A Guide to Best Practice, Ermer, J., Nethercote, P.W., (Eds.); Wiley-VCH Verlag GmbH & Co. KGaA: Weinheim, Germany, 2005; pp. 301–335.
  30. ***European Pharmacopoeia, 10th ed.; European Directorate for the Quality of Medicine & Healthcare (edQm), Council of Europe: Strasbourg, France, 2019; Volume I, p. 11–56.
  31. Y. Yorozu, M. Hirano, K. Oka, and Y. Tagawa, “Electron spectroscopy studies on magneto-optical media and plastic substrate interface,” IEEE Transl. J. Magn. Japan, vol. 2, pp. 740-741, August 1987 [Digests 9th Annual Conf. Magnetics Japan, p. 301, 1982.
  32. ***Romanian Pharmacopoeia Commission National Medicines Agency. Romanian Pharmacopoeia, 10-th ed.; Medical Publishing House: Bucharest, Romania, 1993; p. 977–1293.
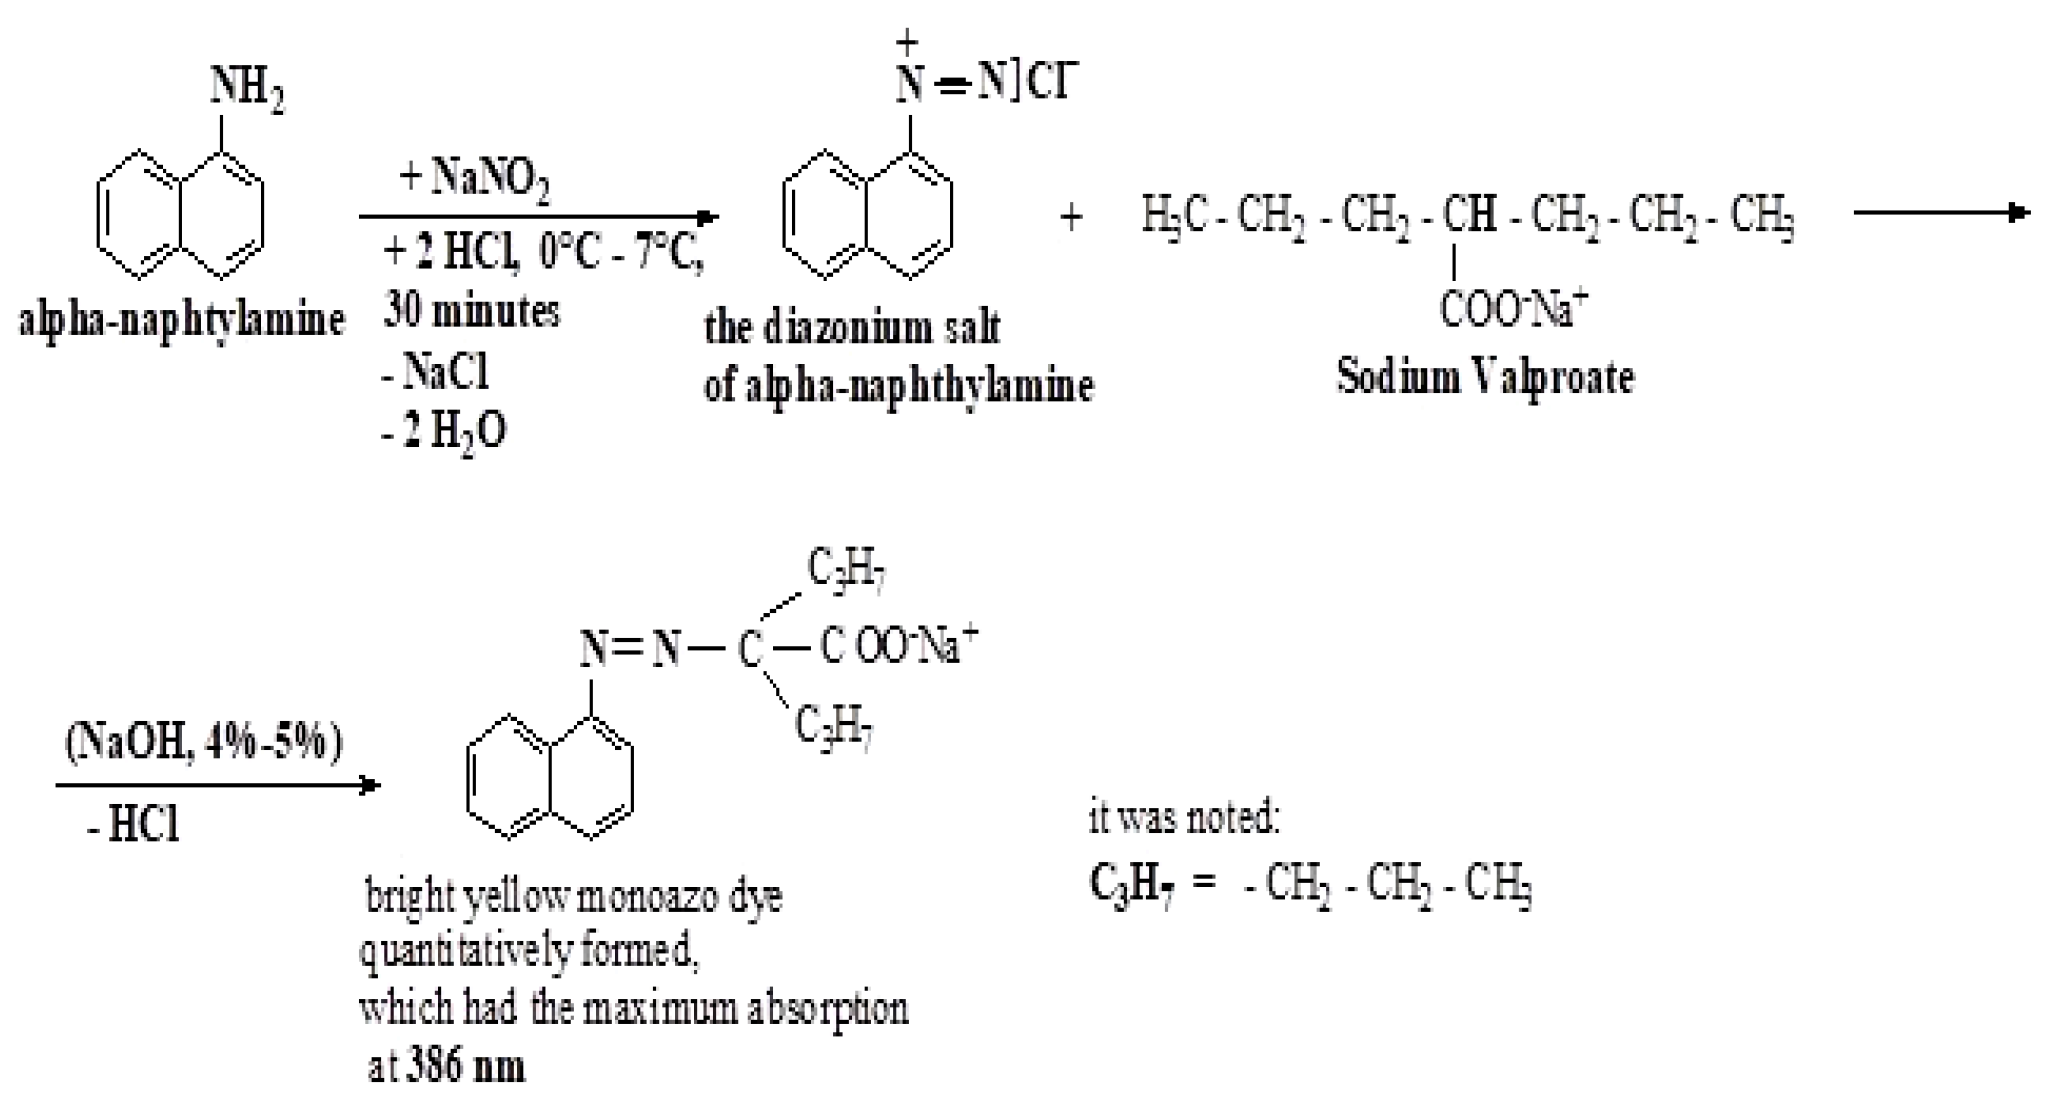
Figure 1. The sequence of reactions that led to the synthesis of quantitatively obtained bright yellow monoazo dye from Sodium Valproate.
Preprints 115522 g001
Figure 2. Visible absorption spectrum (VIS) of Sodium Valproate according to the quantitative color reaction with alpha-naphthylamine.
Preprints 115522 g002
Figure 3. Calibration graph obtained for sodium valproate standard solutions (0.16 µg/mL- 2.08 µg/mL).
Preprints 115522 g003
Table 1.
Solutions Preparation of two standard solution of sodium valproate used to design the Visible absorption spectrum
mL NaNO2 4%-5% mL HCl 10 %-15% mL alpha-naphtylamine 0.1 %
mL working solution 500 µg/mL

CS
μg/mL
Solution I 0.9 0.9 0.9 0.9 18.00
Solution II 2 mL Solution I → to V2 = 25 mL with absolute ethyl alcohol 1.44
Table 2.
Preparation of sodium valproate standard solutions used for spectrophotometer calibration – first dilution → Set I of standard solutions
mL NaNO2 4%-5% mL HCl 10 %-15% mL alpha-naphtylamine 0.1 % mL working solution 500 µg/mL CS(μg/mL)
0.1 0.1 0.1 0.1 2,0
0.2 0.2 0.2 0.2 4,0
0.3 0.3 0.3 0.3 6,0
0.4 0.4 0.4 0.4 8,0
0.5 0.5 0.5 0.5 10,0
0.6 0.6 0.6 0.6 12,0
0.7 0.7 0.7 0.7 14,0
0.8 0.8 0.8 0.8 16,0
1.0 1.0 1.0 1.0 20,0
1.3 1.3 1.3 1.3 26,0
Table 3.
Measured absorbance values (Af) at λ = 386 nm of the second final set of Sodium Valproate standard solutions obtained from the first initial set after second consecutive dilution
Nr det. mL added from initial Set I mL ethyl alcohol add up to VE = 25 mL  
Cf
(μg/mL)
 
Af (λ = 386 nm)
1 2.0 23.0 0.16 0.133
2 2.0 23.0 0.32 0.201
3 2.0 23.0 0.48 0.263
4 2.0 23.0 0.64 0.323
5 2.0 23.0 0.80 0.388
6 2.0 23.0 0.96 0.436
7 2.0 23.0 1.12 0.496
8 2.0 23.0 1.28 0.569
9 2.0 23.0 1.60 0.676
10 2.0 23.0 2.08 0.872
Table 4.
Solutions Preparation of the first initial sample solution (P1) of Sodium Valproate from Tablets (first dilution)
mL NaNO2 4%-5% mL HCl 10 %-15% mL alpha-naphtylamine 0.1 %  
mL sample unknown solution
 
Ethyl alcohol as solvent and control
Initial Sample Solution PI  
0.3
 
0.3
 
0.3
 
0.3
 
→ Vp = 25 mL
Table 5.
Solutions Preparation of the second final sample solution (P2) of Sodium Valproate effectively used for spectrophotometric determination (after the second dilution)
mL Initial Sample Solution P1 Absolute Ethyl alcohol Ap  
CP (µg/mL)
 
mg pure sodium valproate / tablet
Final Sample Solution P2  
2.0
 
23
 
0.221
 
0.3783
 
492.578
Final sample solution volume was V’ = 25 mL (Table 5).
Table 6.
Statistical parameters of the Linear Regression (Regression Statistics)
Correlation coefficient R Regression coefficient R2 Adjusted
R Square
R2
 
Standard error
(SE)
 
Detection Limit LOD and Quatitation Limit LOQ

0.999665
 
0.999330
 
0.999246
 
0.00621264
 
LOD = 0.0491
LOQ = 0.1636
Disclaimer/Publisher’s Note: The statements, opinions and data contained in all publications are solely those of the individual author(s) and contributor(s) and not of MDPI and/or the editor(s). MDPI and/or the editor(s) disclaim responsibility for any injury to people or property resulting from any ideas, methods, instructions or products referred to in the content.
Copyright: This open access article is published under a Creative Commons CC BY 4.0 license, which permit the free download, distribution, and reuse, provided that the author and preprint are cited in any reuse.
Prerpints.org logo

Preprints.org is a free preprint server supported by MDPI in Basel, Switzerland.

Subscribe

© 2024 MDPI (Basel, Switzerland) unless otherwise stated