Preprint
Article

Translational Regulation of Duplicated Gene Expression Evolution in Allopolyploid Cotton

This version is not peer-reviewed.

Submitted:

16 August 2024

Posted:

20 August 2024

You are already at the latest version

A peer-reviewed article of this preprint also exists.

Abstract
Polyploidy, a prevalent event in plant evolution, drives phenotypic diversification and speciation. While transcriptional changes and regulation in polyploids have been extensively studied, the translational level impact remains largely unexplored. To address this gap, we conducted a com-parative transcriptomic and translatomic analysis of cotton leaves from allopolyploid species G. hirsutum (AD1) and G. barbadense (AD2) relative to their model A-genome and D-genome diploid progenitors. Our data revealed that while allopolyploidization significantly affects the transcrip-tional landscape, its impact on translation was relatively modest, evidenced by a narrower ex-pression range and fewer expression changes in ribosome-protected fragments than in mRNA levels. Allopolyploid-specific changes commonly identified in both AD1 and AD2 were observed in 7,393 genes at either transcriptional or translational levels. Interestingly, the majority of translational changes exhibited concordant down-regulation in both ribosome-protected fragments and mRNA, particularly associated with terpenoid synthesis and metabolism. Regarding translational efficiency (TE), at least one-fifth of cotton genes exhibit translational level regulation, with a general trend of more down-regulation than up-regulation of TE. The magnitude of translational regulation was slightly reduced in allopolyploids compared to diploids, and allopolyploidy tends to have a more profound impact on genes and functional associations with ultra-low TE. Moreover, we demonstrated a reduced extent of homeolog expression biases during translation compared to transcription. In conclusion, our study provides insights into the regulatory consequences of allopolyploidy post-transcription, contributing to a comprehensive understanding of regulatory mechanisms of duplicated gene expression evolution.
Keywords: 
Subject: 
Biology and Life Sciences  -   Plant Sciences

1. Introduction

Polyploidy, the whole genome duplication (WGD) event, has been a fundamental and recurrent force in the evolutionary history of angiosperms, profoundly influencing genome structure, function, and organismal complexity [1,2]. By doubling or multiplying genome content, polyploidy provides a reservoir for genetic innovation, leading to phenotypic diversification and adaptation [3,4]. One key realization in the past decade is the profound impact of polyploidy on transcriptomic landscapes [5,6,7]. Studies have reported substantial transcriptomic rewiring in polyploid species, encompassing biased homoeolog expression, condition-specific gene regulation, and transgressive expression levels. These transcriptional changes often underlie phenotypic and adaptive variations upon polyploidy formation. However, despite extensive research on transcriptome and proteome [8], the consequences of polyploidy at the translational level remain largely unexplored.
Ribosome profiling, known as Ribo-seq, is a high-throughput sequencing technique that provides a comprehensive snapshot of active translation within a cell by mapping the positions of ribosomes on mRNA molecules [9]. This approach involves the isolation and deep sequencing of mono-ribosome-protected mRNA fragments, often referred to as ribosome footprints. By analyzing the distribution and abundance of these footprints, researchers can quantitatively assess translation rates, identify translation start sites, and uncover the full repertoire of translated open reading frames (ORFs) [10]. Beyond its utility in identifying translated regions, Ribo-seq enables the study of translational regulation, including the impact of cis-regulatory elements, ribosome pausing, proteins, and environmental cues on protein synthesis [11,12,13]. Moreover, by comparing Ribo-seq data with transcriptomic data, translational efficiency (TE), a metric that reflects the coupling of transcription and translation could be measured [14,15].
The application of Ribo-seq has rapidly expanded across various plants systems. In Arabidopsis, for example, global translatome profiling was performed in conjunction with RNA sequencing, revealing tightly regulated translation with poor correlation with transcriptional changes during immune induction, leading to the discovery of novel regulators of the immune response [16]. Similarly, translational reprogramming was demonstrated a crucial layer of stress responses in crop species including rice (Oryza sativa) [17,18], potato (Solanum tuberosum) [14], citrus (Citrus reticulata) [19], and maize (Zea mays) [15]. Beyond its role in stress responses, Ribo-seq has been instrumental in investigating allele-specific translation in hybrids, revealing the intricate interplay between genetic variation and translational regulation [13,20]. These studies have highlighted the potential of translational regulation to contribute to heterosis, where hybrid offspring exhibit superior traits compared to their parents. While some progress has been made in understanding the impact of polyploidy on translational regulation in plants, as exemplified by studies in soybean (Glycine max) [21], the role of translational control on gene expression evolution accompanying allopolyploidization remains largely underexplored.
Cotton, a globally significant fiber crop, represents a model system for studying allopolyploidization [22]. The allopolyploid cotton genome was formed approximately 1-2 million years ago, through hybridization and subsequent genome doubling of A- and D-genome diploid progenitors. Previous research on cotton gene expression evolution accompanying allopolyploidization have primarily focused on transcriptomics [23,24] and proteomics [25,26], with limited insights from translational regulation. To address this gap and elucidate the impact of allopolyploidization on translational regulation, we conducted a comprehensive analysis of gene expression at both the transcriptional and translational levels in allopolyploid cotton G. hirsutum (AD1), and the representatives of its progenitor diploid species G. arboreum (A2) and G. raimondii (D5). To expand our comparative analysis, we incorporated public RNA-seq and Ribo-seq data from another allopolyploid species G. barbadense (AD2) [27] for comparison. Initially, we compared the correlation and expression variances between transcriptomic and translational datasets, revealing a dominant correlation and larger expression variances in transcriptomes, demonstrating greater differential ranges in transcriptomic data. Subsequently, we compared differential gene expression patterns between transcript and translation levels, finding nearly no genes with completely opposite regulatory trends between these two levels, with only 5.46% showing consistent regulatory trends, primarily enriched in terpene functional genes associated with plant stress resistance. We then compared TE and found that the TE of genes showed a significant negative correlation with transcript levels and that genes with high TE were enriched for specific functions, which was also affected by allopolyploidy. Finally, comparison of expression between homologous A and D subgenomes, allopolyploidy was found to reduce homoeologs expression bias genes at the translational level, and a significant D subgenomic expression dominance at the translational level was detected in AD2. In conclusion, the results of this study provide insights into the effects of allopolyploidy on gene expression and translation in cotton.

2. Materials and Methods

2.1. Plant Materials

Three Gossypium species were used in the present study: one allopolyploid species Gossypium hirsutum cv. TM-1 (AD1) and two diploid species representing the model diploid progenitors, Gossypium arboreum cv. Zhongya 1 (A2) and Gossypium raimondii PI 530899 (D5). Seeds were germinated in a growth chamber in darkness under controlled conditions (28±1°C and 60±5% humidity). After germination, seedlings were cultivated with a 16-hour light/8-hour dark photoperiod cycle under the same controlled condition for six weeks. Leaf tissue from the fourth to fifth true leaves were collected from three biological replicates (5 plants per replicate) of each genotype, immediately frozen in liquid nitrogen, and stored at -80°C.

2.2. Ribosome Profiling (Ribo-Seq)

Ribosome-protected fragments (RPFs) were isolated using a modified protocol [28]. Briefly, 1 gram of leaf tissue was ground in liquid nitrogen with 10% [w/w] polyvinylpolypyrrolidone poly(vinylpolypyrrolidone) in liquid nitrogen and resuspended in to 5ml of lysis buffer (150 mM Tris-HCl pH 8.0, 40 mM KCl, 20 mM MgCl2, 2% [v/v] polyoxyethylene, 0.4% [w/v] sodium deoxycholate, 1.5mM dithiothreitol, 50 μg/ml chloramphenicol, 50 μg/ml cycloheximide, 2% [v/v] polyvinylpyrrolidone). Adding 25 μL DNase I to a final concentration of 10 units/mL, the mixture was incubated on ice for 30 minutes. After centrifugation at 4°C for 10 minutes at 8000×g, the supernatant was transferred to a new centrifuge tube and further centrifuged at 4°C for 10 minutes at 16000×g. The supernatant was layered onto an 8 ml cushion (150 mM Tris-HCl pH 8.0, 40 mM KCl, 20 mM MgCl2, 5 mM EGTA, 1.5 mM dithiothreitol, 50 μg/ml chloramphenicol, 50 μg/ml cycloheximide and 1.75 M sucrose) and subjected to ultracentrifugation at 4°C, 257,000×g for 3 hours in a Beckman ultracentrifuge (Optima XE-100, United States) using a Type 70 Ti Rotor. The pellet was washed twice with pre-cooled ddH2O and resuspended in 300 μl RNase I digestion buffer (10 mM Tris-HCl pH 8.0, 100 mM NaCl, 10 mM EDTA, 5 mM EGTA,1% [w/v] SDS). The resuspended mixture was transferred to a new tube and centrifuge at 1,000×g at 4 °C for 30s. Six units of RNase I was added to the supernatant and incubated at room temperature for 1.5 hours. For rRNA depletion from RPFs, the Ribo-pool rRNA Depletion Kit (siTOOLs p-k024-000031) was used. The obtained RNA fragments were recovered using the RNA Clean & Concentrator-5 kit (Zymo R1014) and purified using the 15% denatured PAGE gel (7M Urea, 0.5×TBE, 15% [v/v] Acrylamide-Bisacrylamide, 0.08% [v/v] Ammonium persulfate substitute, and 0.05% [v/v] TEMED) targeting 27-34 nt in size, according to the protocol [29].
To construct Ribo-seq libraries from purified and size selected RPFs, the phosphate group of RPFs was treated with T4 PNK, followed by 3′ adaptor (5′-rAppGATCGGAAGAGCACACGTCT-NH2) ligation using truncated T4 RNA ligase 2 (NEB). The RNA strand with added adapters was denatured at 65°C along with the designed RNA primers. Subsequently, reverse transcription was carried out using SuperScript II (ThermoFisherScientific, Waltham, MA, USA) and a RT primer (5′-GATCGTCGGACTGTAGAACTCTGAACGTGTAGATCTCGGTGGTCGCCGTATCATT/iSp18/CACTCA/iSp18/CAGACGTGTGCTCTTCCGATCT) at 42°C for 1.5 hours. RPFs were circularized with Circligase ssDNA ligase (Epicentre CL4111K) and amplified by PCR. Finally, PCR amplification to generate a 150 bp cDNA library was performed using E×Taq (14 cycles, 60 °C annealing, and primer sequences are listed in Table S1), Which was sequenced using Illumina NovaSeq 6000 by Pasenno Biotechnology Co. (Shanghai, China).

2.3. RNA Sequencing (RNA-Seq)

Total RNA was extracted using the TIANGEN Total RNA extraction kit (TIANGEN X0817). RNA-seq libraries were prepared using the Illumina TruSeq Stranded mRNA-seq library preparation kit (refer to online protocol accessed on March 26, 2023) for paired-end sequencing (150 bp×2) on an Illumina HiSeq 2500 platform (Novogene Technology Co. Beijing, China).

2.4. Ribo-Seq and RNA-Seq Data Processing

In addition to data generated from A2, D5, and AD1, public cotton leaf RNA-seq and Ribo-seq data for another allopolyploid species, G. barbadense (AD2), were downloaded from the National Center for Biotechnology Information (NCBI) SRA depository (details in Supplemental Table S2) to enable comparisons across different polyploid genotypes. Public cotton ribosomal RNA (rRNA) sequences were retrieved from NCBI and subjected to de-redundancy using CD-HIT (v4.8.1) (https://github.com/weizhongli/cdhit) to generate a reference set for rRNA filtering.
Quality control, adapter trimming, and low-quality read filtering were performed using FASTP (0.23.4) [30]. Bowtie2 (v2.3.5.1) [31] was used to remove rRNA reads, utilizing the non-redundant cotton rRNA sequence set as reference. To facilitate direct comparison between allopolyploid and diploid datasets, the number of reads in the matched cleaned data from A2 and D5 diploids was adjusted to equal amounts and then combined to generate a “Combined Diploid” dataset (A2D5). The processed data from AD1, AD2, and A2D5 were then subjected to further analysis.
Processed reads from RNA-seq were aligned to the G. hirsutum cv. TM-1 UTX (v2.0) reference genome [32]. Similarly, using Hisat2 (v2.2.1) [33] with default parameters (details provided). Read counts and transcripts per million (TPM) values were quantified for each gene using the featureCounts function from the Rsubread package (v2.16.1) [34].
Processed reads from Ribo-seq were aligned to the same reference genome using STAR (v2.7.9a) [35] with parameters ‘--outFilterMismatchNmax 1 --outFilterMultimapNmax 1′ to retain only uniquely mapped reads with at most one mismatch. The R function featureCounts was used to obtain read counts and TPM values. BAM files from STAR alignment were subjected to determine read length distribution, and three-nucleotide (3-nt) periodicity using RiboCode (v1.2.15) [36].

2.5. Analysis of Gene Expression at Transcriptional and Translational Levels

Differential gene expression analysis was performed using the DESeq2 package in R (v1.44.0) [37] to identify genes with significant expression changes between allopolyploids (AD1 and AD2) and the combined diploid dataset (A2D5). Genes with adjusted p-values < 0.05 by Benjamini-Hochberg correction [38] were considered differentially expressed. Pairwise comparisons were conducted between AD1 vs. A2D5 and AD2 vs. A2D5 at both transcriptional and translational levels. To investigate the coordinated regulation of gene expression, genes were categorized into eight groups by cross tabulating their differential expression patterns (i.e., increased, decreased, and unchanged relative to A2D5) between two levels. Except for the category with no change in expression at both levels, functional enrichment analysis of Gene Ontology (GO) terms was performed for genes in each of the other eight groups using R-clusterProfiler (v4.8.3) [39], with p-values adjusted for multiple testing using the Benjamini-Hochberg method. A threshold of adjusted p-value < 0.05 was applied to identify significantly enriched GO terms. Functional protein annotation is performed by Revigo was employed to summarize and visualize significant GO terms (v 3.4.4) [40].

2.6. Calculation of Translational Efficiency

TE was calculated for each gene as the log2 ratio of RPF to mRNA expression levels: TE = log2(RPF / mRNA). To account for potential library size differences, both RPF and mRNA expression data were normalized using the median of ratios normalization method built-in DESeq2. Pairwise comparisons between matched Ribo-seq and RNA-seq samples for each genotype were conducted using DESeq2 to obtain log2FoldChange values as TE estimates. Genes with adjusted p-value < 0.05 were considered to have significantly different TE. A positive TE value indicates higher translation efficiency relative to transcription, while a negative value suggests lower translation efficiency. Genes exhibiting extreme TE changes (|TE| > 6) were subjected to Gene Ontology (GO) enrichment analysis using R-clusterProfiler (v4.8.3) [39]. The R package pheatmap (v1.0.12) was utilized for visualization [41].

2.7. Analysis of Homoeolog Expression Bias (HEB)

HEB was defined as the unequal expression of homoeologous gene copies in the allopolyploid [5]. In allopolyploid cottons (AD genome), the direction of bias was determined by the subgenome (At or Dt) exhibiting higher expression. The At and Dt homoeologous relationships within the allopolyploid G. hirsutum reference genome was previously inferred [42].
To assess HEB at the transcriptional and translational levels, expression levels (mRNA and RPF) were compared between At and Dt homoeologs using DESeq2. Genes with adjusted p-values < 0.05 (Benjamini-Hochberg correction) were considered to exhibit significant HEB. The magnitude of HEB was quantified as the log2fold-change in expression between homoeologs. At the genomic scale, the prevalence of bias towards a specific subgenome was evaluated to assess genome-wide HEB.
To assess HEB at the translational level, TE values were compared between At and Dt homoeologs using Student’s t-test. Significant differences in TE between homoeologs were determined using a Fisher’s combined p-value < 0.05.

3. Results

3.1. Transcriptional and Translational Profiling of Diploid and Allopolyploid Cottons

A total of 183 million, 130 million, and 226 million Ribo-seq reads were generated for G. arboreum (A2), G. raimondii (D5), and G. hirsutum (AD1) seedling leaves, respectively (Table S2). After removal of low-quality reads and rRNA, an average of 18 million clean reads remained per sample, representing 30.8% of the total. The average unique mapping rate ranged from11.2% to 39.6%, tetraploid (AD1) having the lowest rate most likely due to its higher level of sequence homology compared to diploids A2 and D5. To facilitate direct comparisons between parental diploids and allopolyploids, we combined the clean reads of A2 and D5 into a ‘Combined Diploid’ dataset (A2D5) and used it for subsequent analyses, which exhibited 14.5%-16.5% unique mapping rates, comparable to those of AD1.
To validate Ribo-seq data quality, we examined RPF (Ribosome Protected Fragment) sizes, which ranged from 26 to 32 nucleotides (Figure S1), consistent with known cotton Ribo-seq data [27]. The RPFs exhibited a periodicity of 3 nucleotides (Figure 1A), a typical characteristics of ribosome profiling [43]. Pairwise Pearson correlation coefficients were calculated between all samples to examine data reproducibility between replicated experiments, including a previously published dataset from G. barbadense (AD2) leaves [27]. One AD1 sample (AD1-2) with relatively low correlation coefficients (R=0.85-0.86) (Figure 1B) and poor clustering in principal component analysis (PCA) (Figure 1C) with other replicates, was excluded from subsequent analyses.
For RNA-seq, a total of 131 million, 143 million, and 155 million read pairs were obtained from A2, D5, and AD1 cotton leaf samples, respectively (Table S3). The clean read pairs obtained per sample ranged 39 to 57 million, with an average unique mapping read rate of 87.4% (Table S3). Diploid data from A2 and D5 were combined into the A2D5 dataset as for the Ribo-seq data. Pearson correlation coefficients ranging from 0.79 to 0.99 were observed between transcriptome and translatome data (Figure 1B). Notably, expression variances were higher in transcriptomes than in translatomes (Figure 1D; variance of log10(TPM): 0.914 vs 0.686), potentially indicating a wider expression range in mRNA levels than translated proteins.

3.2. Concordantly Decreased Transcription and Translation Accompanying Allopolyploidization

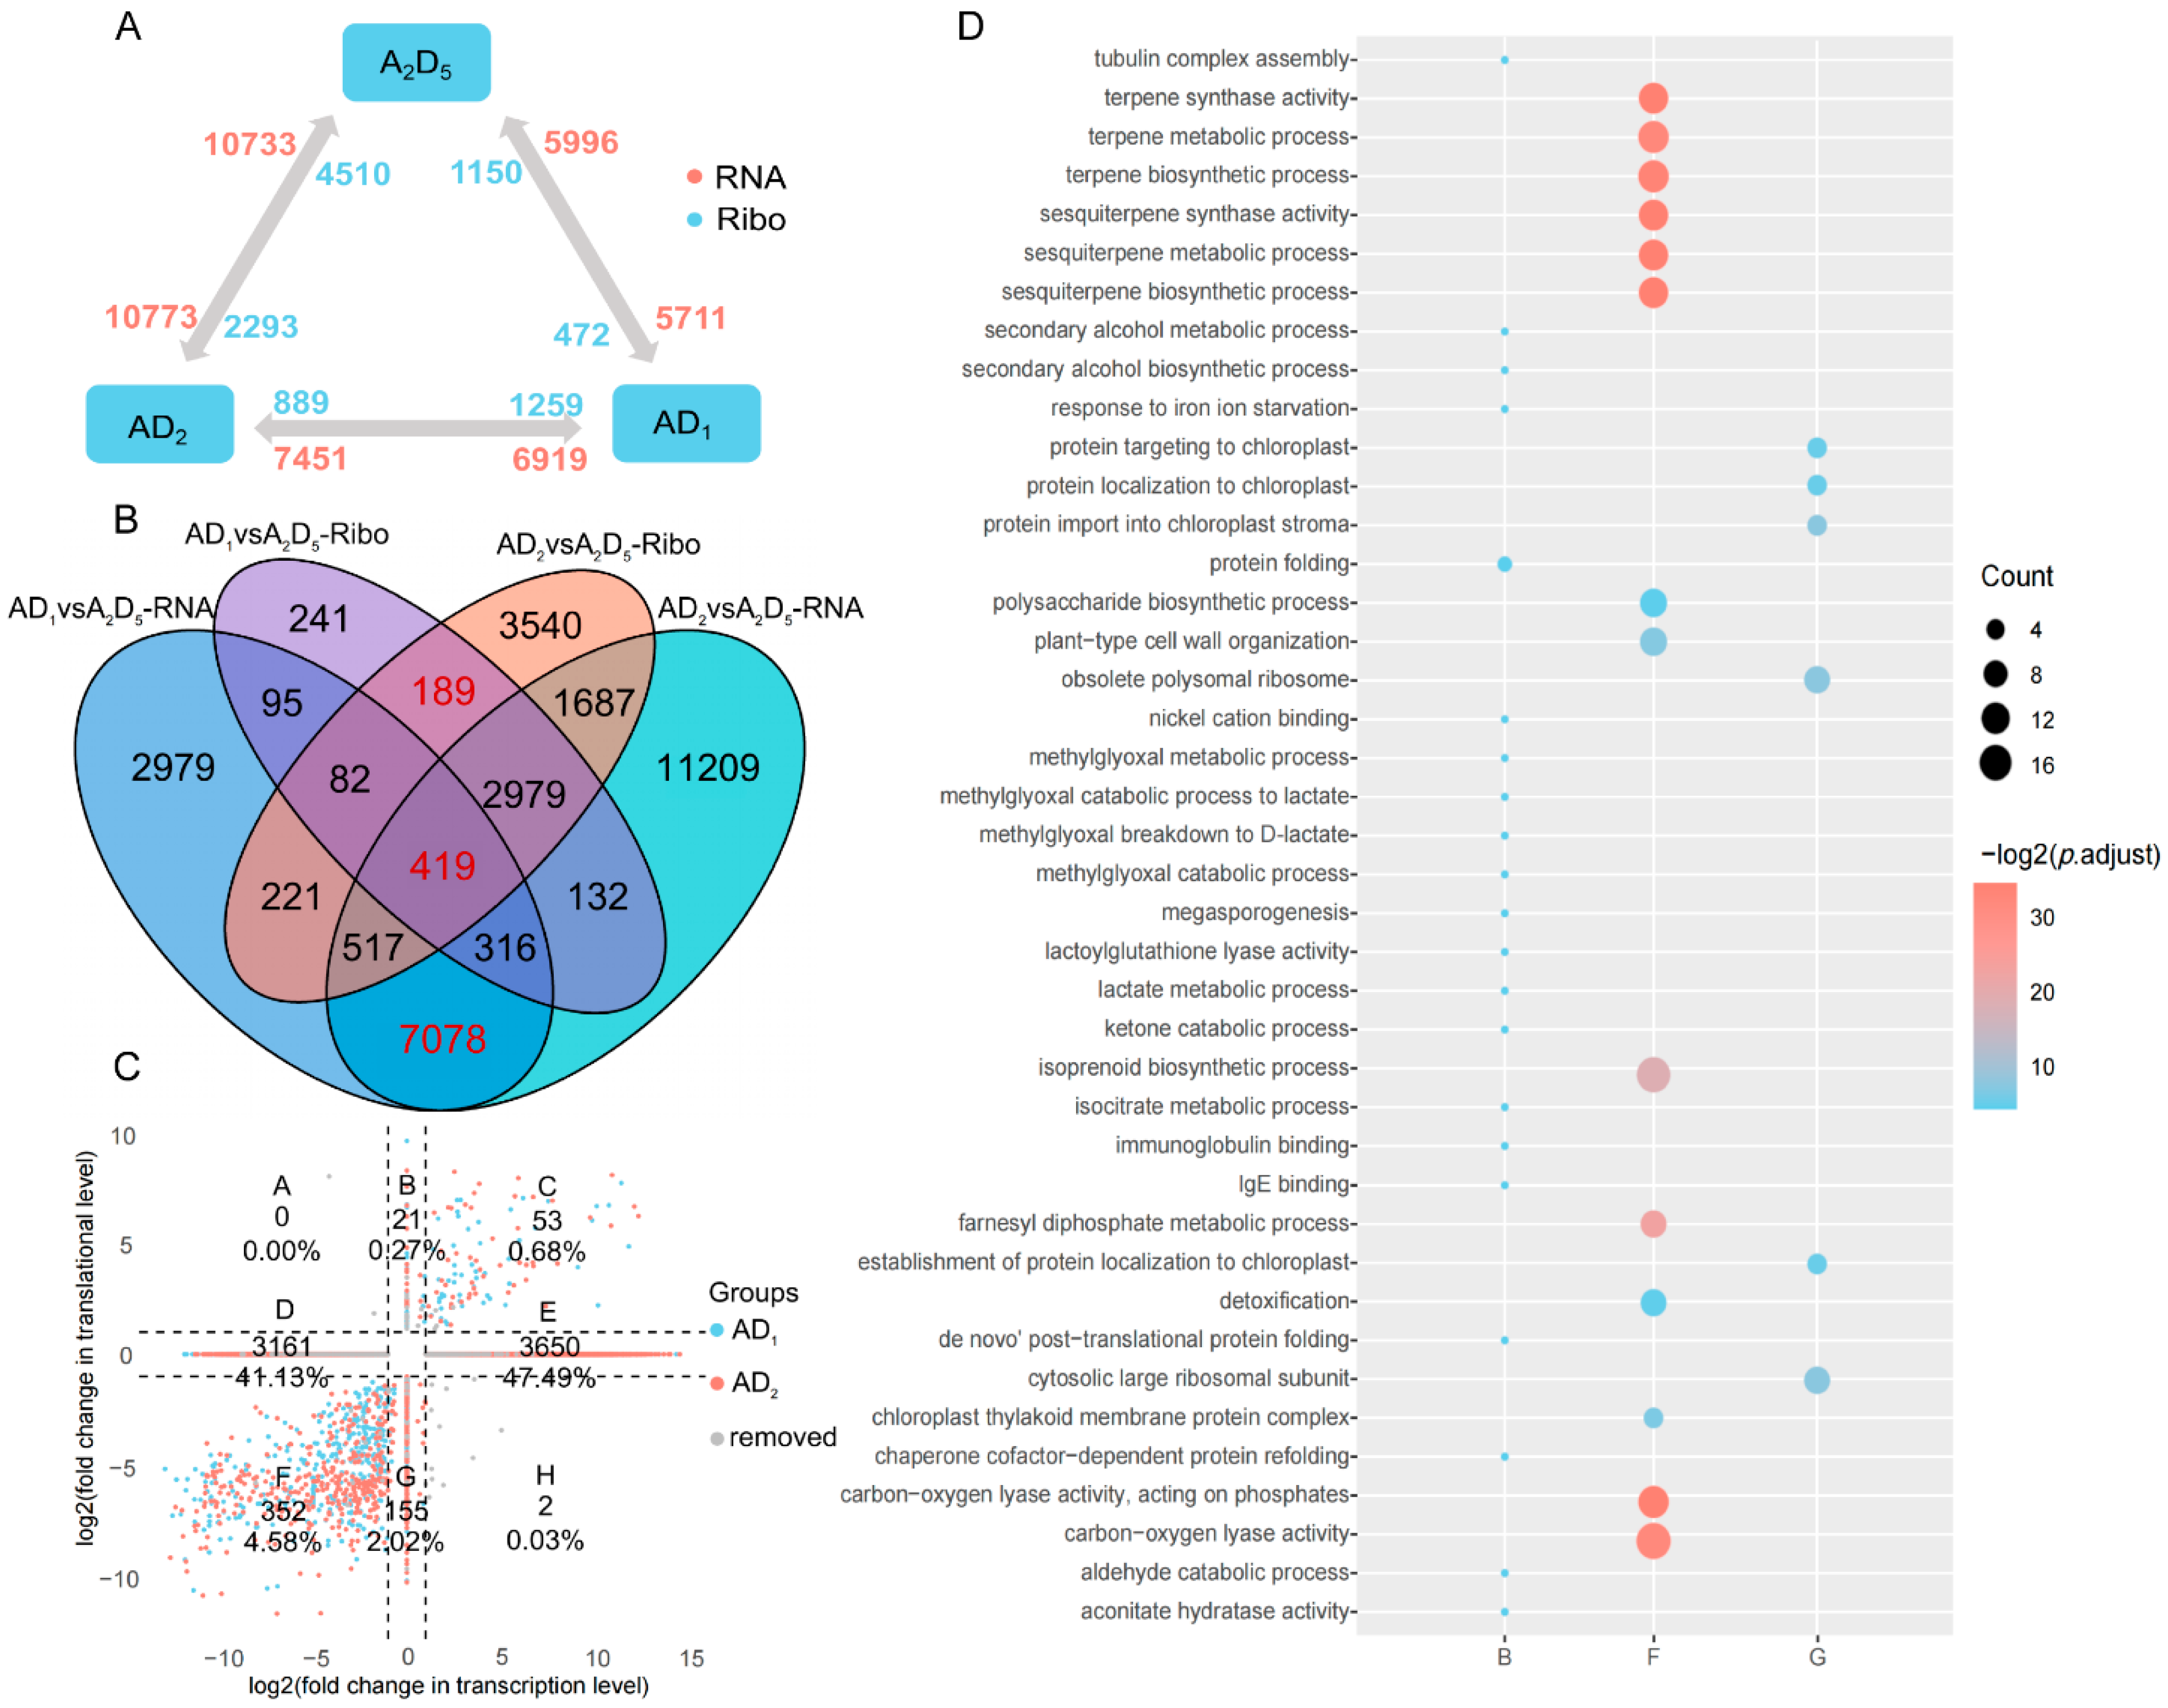
To study gene expression changes during allopolyploidization, we conducted differential gene expression analyses between diploid and tetraploid cotton using RNA-seq and Ribo-seq data (criterion: |log2fold change| ≥ 1 and FDR < 0.05). We identified significant differences as follows (Figure 2A): comparing AD1 to A2D5, 11,707 (15.6%, 5,711 up-regulated and 5,996 down-regulated) transcriptional changes and 1,622 (2.1%, 472 up-regulated and 1150 down-regulated) translational changes were identified. Comparing AD2 to A2D5, more DEGs were identified at both levels, with 21,506 (28.7%, 10,773 up-regulated and 10,733 down-regulated) transcriptional changes and 6,803 (9.1%, 2,293 genes up-regulated and 4510 down-regulated) translational changes. Between AD1 and AD2, 14,370 (19.2%, 6919 up-regulated and 7451 down-regulated) transcriptional changes and 2148 (2.9%, 1259 up-regulated and 889 down-regulated) translational changes were identified. Concordantly, fewer DEGs were identified at the translational level by Ribo-seq. Regarding the four inter-ploidy contrasts (i.e., AD1 vs A2D5 and AD2 vs A2D5 at either transcriptional or translational levels), we identified a total of 7,686 genes exhibiting allopolyploidy changes common to both tetraploids AD1 and AD2 (Figure 2B, numbers in red). Of these, 189 genes showed common changes only at the translational level, 7,078 genes showed changes only at the transcriptional level, and 419 genes showed changes at both levels. Considering only those exhibiting conserved up- or down-regulated changes relative to A2D5, allopolyploid-specific regulation was inferred for 7,393 genes, which were further categorized into eight groups (A-H) based on their expression changes in Ribo-seq and RNA-seq (each being increased, decreased, or no changes) (Figure 2C).
We specifically focus on the categories exhibiting allopolyploid-specific regulation at the translational level, including categories A, B, C, F, G, and H (582 genes, 7.9%). Among these, category C (53, 0.7%) and F (352, 4.6%) exhibited concordant regulatory directions between transcription and translation in allopolyploids relative diploids, with a prominent bias toward decreased expression (more F than C genes). Category F was enriched for GO terms associated with terpenoid synthesis and metabolism, indicating a negative impact of allopolyploidization on terpenoids at both transcriptional and translational levels. Categories C was not enriched for any GO terms.
Few genes were found exhibiting opposite regulatory directions between transcription and translation, as classified to category A (0 genes) or H (2 genes), nor enriched for GO terms.
Category B (21 genes, 0.3%) and G (155 genes, 2%) include genes with unchanged transcription levels but higher or lower translation in allopolyploids, respectively. Only category G was enriched for GO terms related to ribosome function and protein import into chloroplasts.

3.3. Impact of Allopolyploidy on Translational Efficiency

To isolate the effect of translational change independent of transcriptional changes, we calculated the translation efficiency (TE) values for genes, defined as the ratio of translational to transcriptional expression levels (i.e., log2(RPF/mRNA)). A gene with TE = 0 is considered to have consistent transcriptional and translational products; TE ≠ 0 indicates regulation at the translational level, with TE > 0 suggesting higher and TE < 0 suggesting lower translation relative to transcription.
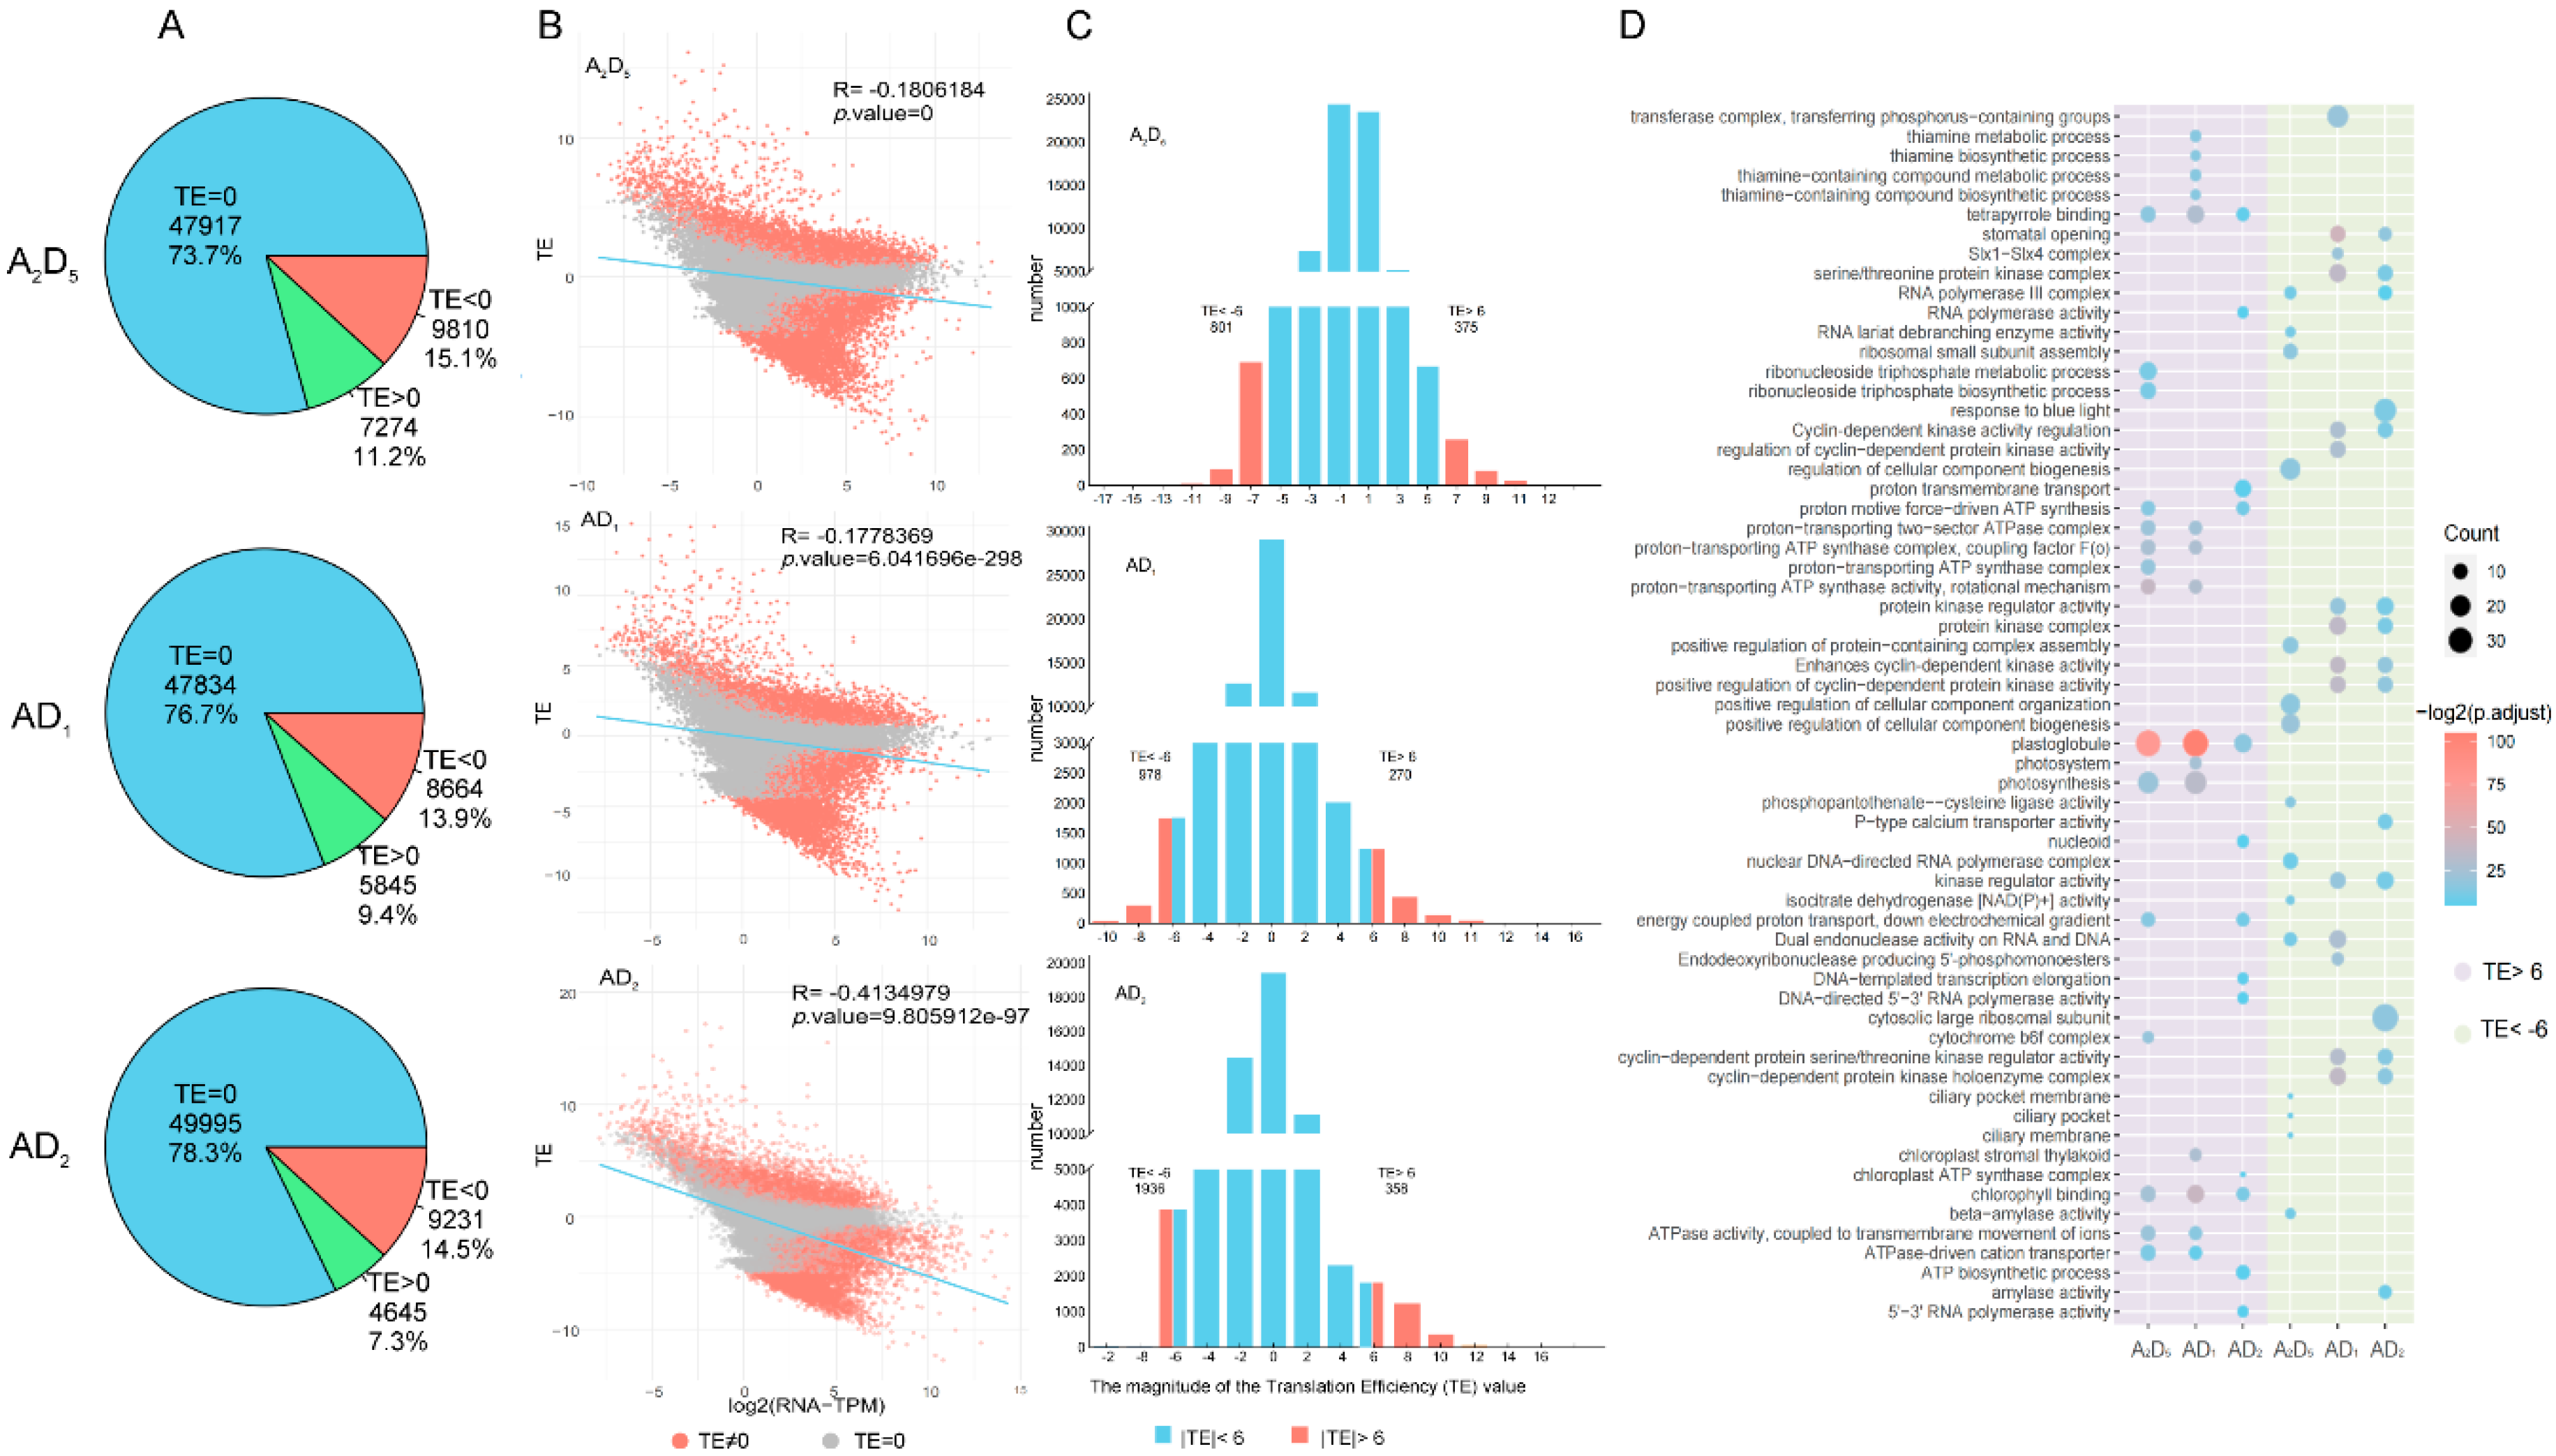
We detected a total of 65,001 transcriptionally expressed genes (RNA-seq read counts above 1 in at least one biological replicate) in A2D5, with 9,810 (15.1%) having TE < 0 and 7,274 (11.2%) having TE > 0. In AD1, there were 62,343 transcriptionally expressed genes, with 8,664 (13.9%) having TE < 0 and 5,845 (9.4%) having TE < 0 and. In AD2, there were 63,871 transcriptionally expressed genes, with 9,231 (14.5%) having TE < 0 and 4,645 (7.3%) having TE > 0 (Figure 3A). These results indicate that at least one-fifth of genes exhibit translational level regulation, with a general trend of more down-regulation than up-regulation of TE. Interestingly, the magnitude of translational level regulation was slightly reduced in allopolyploids compared to diploids.
To explore the relationship between TE and mRNA levels, we analyzed their correlations in each genotype. TE was significantly negatively correlated with transcriptional expression in A2D5, AD1, and AD2, with Pearson’s R of -0.2, -0.2, and -0.4, respectively (Figure 3B). This suggested that, similar to observations in maize and potato [14,15], the mRNA translation efficiency and ultimately protein synthesis capacities are limited when mRNA levels are high.
We further analyzed the genes with the highest TE (> 6) and the lowest TE (< -6) in in A2D5 (1,062 and 801 genes), AD1 (753 and 978) and AD2 (808 and 1,936) (Figure 3C). GO enrichment analysis revealed that genes with TE > 6 in A2D5 were primarily enriched for energy metabolism-related terms, including ATPase activity, proton-transporting ATP synthase complex, ribonucleoside triphosphate metabolic process, and photosynthesis (Figure 3D). Similar GO terms were enriched in AD1 and AD2, with additional enrichment for RNA polymerase activity-related terms in AD2. This suggests that energy metabolism-related genes tend to be translated with high efficiency to increase protein production, a trend consistent before and after allopolyploidy.
For genes with TE < -6 (Figure 3D), A2D5 showed enriched GO terms related to cellular component biogenesis and ciliary were predominantly. In contrast, both AD1 and AD2 were predominantly enriched for stomatal opening, cyclin-dependent protein, and GO terms related to serine/threonine protein kinase. This suggests that allopolyploidy has a profound impact on genes with low TE.

3.4. Reduced Amount of Homoeolog Expression Biases at the Translational Level

To investigate the subgenomic contribution to gene expression, 22,889 ortho-homoeolog groups (OGs) were previously inferred between the At and Dt homoeologs in the AD1 reference genome. At the transcriptional level, we observed 23%-37% of OGs exhibiting homeolog expression bias (HEB): A2D5 had 5,285 (23%, 2,574 A-bias vs 2,711 D-bias), AD1 had 5,237 (22.9%, 2,576 vs 2,661), and AD2 had 8,407 (36.7%, 4,165 vs 4,242), with no significant imbalance towards either the A- or D-subgenome. At the translational level, the number of OGs exhibiting HEB decreased to 3%-9%: A2D5 had 2,224 (9.7%, 1,115 vs 1,109), AD1 had 1,013 (4.4%, 484 vs 529), and AD2 had 562 (2.5%, 244 vs 318), with only AD2 showing significantly more D-biases of translational expression.
When comparing TE, there were 1,076 (4.7%, 391 vs 685), 625 (2.7%, 320 vs 305), and 547 (2.4%, 237 vs 310) significant differences between At and Dt in A2D5, AD1, and AD2 respectively. Both A2D5 and AD2 showed significant D -biased translational level regulation.
These results indicated that allopolyploidization may have reduced the subgenomic differences at the translational level, leading to fewer biases at this level. Additionally, a D-genome dominant translational regulation was observed in AD2, may reflecting species-specific translational regulation with respect to subgenomic contribution.
Table 1. Homoeolog expression bias (HEB) genes on transcriptional and translational levels.
A2D5 AD1 AD2
Number Proportion Number Proportion Number Proportion
RNA Total 5285 23.09% 5237 22.88% 8407 36.73%
A>D 2574 11.25% 2576 11.25% 4165 18.20%
A<D 2711 11.84% 2661 11.63% 4242 18.53%
p-value* 0.0595 0.2402 0.401
Ribo Total 2224 9.72% 1013 4.43% 562 2.46%
A>D 1115 4.87% 484 2.11% 244 1.07%
A<D 1109 4.85% 529 2.31% 318 1.39%
p-value* 0.8988 0.1574 0.001799
TE Total 1076 4.70% 625 2.73% 547 2.39%
A>D 391 1.71% 320 1.40% 237 1.04%
A<D 685 2.99% 305 1.33% 310 1.35%
p-value* 2.20E-16 0.5485 0.001801
*Chi-square test was performed to compare the numbers of A>D and A<D.

4. Discussion

This project primarily conducted transcriptome and translatome sequencing on an allotetraploid upland cotton AD1 and its two diploid progenitors, A2 and D5, aiming to investigate translational changes associated with cotton polyploidization.

4.1. Ribo-Seq Technical Difficulties

Ribo-seq technology involves the degradation of non-ribosome-protected RNA fragments using RNase I, allowing the recovery of ribosome-protected mRNA fragments typically sized between 27 to 34 nucleotides [43]. These fragments, known as ribosome footprints (RFs), are used to infer various aspects of translation such as translation start site identification, codon usage bias, upstream open reading frames, and translation efficiency [44]. However, Ribo-seq has its limitations. The enzymatic cleavage conditions are challenging to control, and constructing libraries can be difficult due to the small size of the target fragments. Moreover, these small fragments may map to multiple locations, leading to potential false positives [45]. Additionally, the presence of polysaccharides and polyphenols in cotton can interfere with nucleic acid extraction. To address these issues, we first used PVPP and PVP-40 to adsorb excess polysaccharides and polyphenols from cotton materials, facilitating nucleic acid extraction. Subsequently, we employed polysome profiling to optimize enzyme digestion conditions for the recovery of single ribosomes, thereby increasing the yield of initial samples to ensure sufficient mRNA fragment libraries. To mitigate false positives in subsequent analyses, we retained only uniquely mapped reads during mapping. Finally, to obtain ample data for analysis, we increased sequencing depth, ensuring adequate coverage for comprehensive translation analysis. In 2023, Ghulam Qanmber similarly utilized ribo-seq technology to analyze the translatome data of the allopolyploid island cotton G. barbadense (AD2) [27]. Given that the diploid ancestors of G. barbadense (AD2) are also G. arboreum (A2) and G. raimondii (D5), we analyzed the transcriptome and translatome data of its leaf samples together (Figure 1B and C).

4.2. Cotton Leaf Gene Express Patterns in Transcriptional and Translational Levels

According to our results, the number of genes expressed at the transcriptional level is more than that at the translational level, which is consistent with the conclusions from other translational studies [43]. This discrepancy arises because RPFs captured by translationomics represent only those mRNA segments occupying ribosomes. The abundance of detected RPFs reflects the biological state at that moment [46]. More than one-fifth of transcriptionally expressed genes show some degree of translational regulation, similar to observations in allopolyploids soybean leaves [21]. Based on this information, it can be hypothesized that the discrepancy between transcriptional and translational gene expression levels highlights a dynamic regulatory process in cellular biology. This suggests that the presence of mRNA does not necessarily equate to active translation, as indicated by the selective detection of RPFs in translationomics. Understanding the extent and mechanisms of translational regulation is crucial for deciphering how cells allocate resources and respond to environmental cues, which warrants further investigation into the temporal and spatial dynamics of protein synthesis in biological systems.

4.3. Expression Bias of Homologous Genes in Cotton

At the transcriptional level, more than 20% of homologous genes exhibiting expression bias in allopolyploid cotton leaves, consistent withthe results in other studies [47,48,49]. While D-biased genes slightly outnumber A-biased genes across three samples, the global genomic expression is unbiased [49]. At the protein level, despite examining protein expression only in cotton seeds compared to root tips, D-biased gene numbers exceed those of A-biased genes among detected proteins [25,26]. Correspondingly, we observed more D-biased genes than A-biased genes at the translational level in AD2. Although the homozygosis transcripts from different subgenome exhibit various TE, the regulation mechanism is elusive. Some well-known translational regulation manners may give a clue to understand translation bias in allopolyploid species, such as codon usage, uORF, and secondary structures in the downstream of translation sites. Polyploidy species could increase protein abundance, however, some crucial biology processes need preciously control in dosage effect. Translational regulation as one of the gene expression control manners shows translational bias in different subgenome transcripts.

4.4. Translational Regulation that May Be Caused by Polyploidy

In studies of translational regulation of homologous genes during polyploid evolution, greater differences were found between diploids than post-polyploidization, where differences in AD1 did not show significant bias. This phenomenon, noted in the limited studies on polyploid translational regulation [21], suggests a tendency for translational regulation to reduce disparities in gene expression between combined allopolyploid transcriptomes and their diploid progenitors. This adaptive response of the genome likely ensures basic expression balance as it adjusts over time to new gene copy numbers. Such expression adjustments may involve various mechanisms like DNA methylation [50], histone modifications [51], and transcription factor activities [52,53]. Therefore, despite significant expression differences between parental diploids, these disparities may diminish post-polyploidization, indicating a re-establishment of expression equilibrium to maintain cellular functionality and homeostasis [54].
In summary, polyploidization influences gene expression far beyond mere changes in gene copy numbers, encompassing intricate regulatory adjustments. These adaptive mechanisms likely provide essential flexibility and stability for organisms to thrive in dynamically changing environments. Future research will continue to explore how these mechanisms interact and contribute to shaping and maintaining species adaptability and survival in diverse ecological niches.

Supplementary Materials

The following supporting information can be downloaded at the website of this paper posted on Preprints.org, Figure S1. Ribosome protected fragment (RPF) length histogram. Table S1. Primers for the construction of Ribo-seq library. Table S2. Ribo-Seq data. Table S3. RNA-Seq data. Table S4. Expressed gene number on Ribo-seq. Table S5. Expressed gene number on RNA-seq.

Author Contributions

G.J.H. and M.M.H. conceived and designed the study. G.L.F., M.M.H. completed the experimental operation of the project. H.T.L. performed database collecting and formatting. G.L.F., H.T.L. and G.J.H. analyzed the data and wrote the manuscript. All authors have read and agreed to the published version of the manuscript.

Funding

Acknowledgement: This project was supported by the National Natural Science Foundation of China (32072111) to GH.

Institutional Review Board Statement

Not applicable.

Informed Consent Statement

Not applicable.

Data Availability Statement

A2, D5 and AD1 data is deposited under PRINA TBD. AD2 data is available on the public database GRAND (Gossypium Resource and Network Database) at https://grand.cricaas.com.cn/page/download/download.

Declaration of interests

The authors declare no competing interests.

References

  1. Alger, E.I.; Edger, P.P. One subgenome to rule them all: underlying mechanisms of subgenome dominance. Current Opinion in Plant Biology 2020, 54, 108–113. [Google Scholar] [CrossRef]
  2. Jiao, Y.; Wickett, N.J.; Ayyampalayam, S.; Chanderbali, A.S.; Landherr, L.; Ralph, P.E.; Tomsho, L.P.; Hu, Y.; Liang, H.; Soltis, P.S.; Soltis, D.E.; Clifton, S.W.; Schlarbaum, S.E.; Schuster, S.C.; Ma, H.; Leebens-Mack, J.; Depamphilis, C.W. Ancestral polyploidy in seed plants and angiosperms. Nature 2011, 473, 97–100. [Google Scholar] [CrossRef]
  3. Liu, Q.; Yuan, H.; Li, M.; Wang, Z.; Cui, D.; Ye, Y.; Sun, Z.; Tan, X.; Schwarzacher, T.; Heslop-Harrison, J.S. Chromosome-scale genome assembly of the diploid oat Avena longiglumis reveals the landscape of repetitive sequences, genes and chromosome evolution in grasses. bioRxiv 2022. [Google Scholar] [CrossRef]
  4. Van De Peer, Y.; Ashman, T.-L.; Soltis, P.S.; Soltis, D.E. Polyploidy: an evolutionary and ecological force in stressful times. The Plant Cell 2021, 33, 11–26. [Google Scholar] [CrossRef] [PubMed]
  5. Grover, C.E.; Gallagher, J.P.; Szadkowski, E.P.; Yoo, M.J.; Flagel, L.E.; Wendel, J.F. Homoeolog expression bias and expression level dominance in allopolyploids. New Phytologist 2012, 196, 966–971. [Google Scholar] [CrossRef] [PubMed]
  6. Hu, G.; Wendel, J.F. Cis–trans controls and regulatory novelty accompanying allopolyploidization. New Phytologist 2018, 221, 1691–1700. [Google Scholar] [CrossRef]
  7. Yoo, M.-J.; Liu, X.; Pires, J.C.; Soltis, P.S.; Soltis, D.E. Nonadditive gene expression in polyploids. Annual Review of Genetics 2014, 48, 485–517. [Google Scholar] [CrossRef]
  8. Soltis, D.E.; Misra, B.B.; Shan, S.; Chen, S.; Soltis, P.S. Polyploidy and the proteome. Biochimica et Biophysica Acta (BBA) - Proteins and Proteomics 2016, 1864, 896–907. [Google Scholar] [CrossRef]
  9. Zhao, J.; Qin, B.; Nikolay, R.; Spahn CM, T.; Zhang, G. Translatomics: the global view of translation. International Journal of Molecular Sciences 2019, 20. [Google Scholar] [CrossRef]
  10. Ingolia, N.T. Ribosome Footprint Profiling of Translation throughout the genome. Cell 2016, 165, 22–33. [Google Scholar] [CrossRef] [PubMed]
  11. Burch-Smith, T.; Chotewutmontri, P.; Barkan, A. Multilevel effects of light on ribosome dynamics in chloroplasts program genome-wide and psbA-specific changes in translation. PLOS Genetics 2018, 14. [Google Scholar] [CrossRef]
  12. Hou, C.Y.; Lee, W.C.; Chou, H.C.; Chen, A.P.; Chou, S.J.; Chen, H.M. Global analysis of truncated RNA ends reveals new insights into ribosome stalling in plants. The Plant Cell 2016, 28, 2398–2416. [Google Scholar] [CrossRef]
  13. Zhu, X.-T.; Zhou, R.; Che, J.; Zheng, Y.-Y.; Tahir Ul Qamar, M.; Feng, J.-W.; Zhang, J.; Gao, J.; Chen, L.-L. Ribosome profiling reveals the translational landscape and allele-specific translational efficiency in rice. Plant Communications 2023, 4. [Google Scholar] [CrossRef]
  14. Jian, H.; Wen, S.; Liu, R.; Zhang, W.; Li, Z.; Chen, W.; Zhou, Y.; Khassanov, V.; Mahmoud AM, A.; Wang, J.; Lyu, D. Dynamic translational landscape revealed by genome-wide ribosome profiling under drought and heat stress in potato. Plants 2023, 12. [Google Scholar] [CrossRef]
  15. Lei, L.; Shi, J.; Chen, J.; Zhang, M.; Sun, S.; Xie, S.; Li, X.; Zeng, B.; Peng, L.; Hauck, A.; Zhao, H.; Song, W.; Fan, Z.; Lai, J. Ribosome profiling reveals dynamic translational landscape in maize seedlings under drought stress. The Plant Journal 2015, 84, 1206–1218. [Google Scholar] [CrossRef] [PubMed]
  16. Xu, G.; Greene, G.H.; Yoo, H.; Liu, L.; Marqués, J.; Motley, J.; Dong, X. Global translational reprogramming is a fundamental layer of immune regulation in plants. Nature 2017, 545, 487–490. [Google Scholar] [CrossRef] [PubMed]
  17. Xiong, Q.Z.L.; Du, J.; Zhu, C.; Peng, X.; He, X.; Fu, J.; Ouyang, L.; Bian, J.; Hu, L.; Sun, X.; Xu, J.; Zhou, D.; Cai, Y.; Fu, H.; He, H.; Chen, X. Ribosome profiling reveals the effects of nitrogen application translational regulation of yield recovery after abrupt drought-flood alternation in rice. Plant Physiol Biochem 2020, 155, 42–58. [Google Scholar] [CrossRef]
  18. Yang, X.; Song, B.; Cui, J.; Wang, L.; Wang, S.; Luo, L.; Gao, L.; Mo, B.; Yu, Y.; Liu, L. Comparative ribosome profiling reveals distinct translational landscapes of salt-sensitive and -tolerant rice. BMC Genomics 2021, 22. [Google Scholar] [CrossRef]
  19. Balfagón, D.; Zandalinas, S.I.; Dos Reis De Oliveira, T.; Santa-Catarina, C.; Gómez-Cadenas, A. Omics analyses in citrus reveal a possible role of RNA translation pathways and unfolded protein response regulators in the tolerance to combined drought, high irradiance, and heat stress. Horticulture Research 2023, 10. [Google Scholar] [CrossRef]
  20. Zhu, W.; Chen, S.; Zhang, T.; Qian, J.; Luo, Z.; Zhao, H.; Zhang, Y.; Li, L. Dynamic patterns of the translatome in a hybrid triplet show translational fractionation of the maize subgenomes. The Crop Journal 2022, 10, 36–46. [Google Scholar] [CrossRef]
  21. Coate, J.E.; Bar, H.; Doyle, J.J. Extensive translational regulation of gene expression in an allopolyploid (Glycine dolichocarpa). The Plant Cell 2014, 26, 136–150. [Google Scholar] [CrossRef]
  22. Wendel, J.F.; Grover, C.E. Taxonomy and evolution of the cotton genus, Gossypium [M]. Cotton. 2015: 25-44.
  23. Flagel, L.E.; Wendel, J.F. Evolutionary rate variation, genomic dominance and duplicate gene expression evolution during allotetraploid cotton speciation. New Phytologist 2010, 186, 184–193. [Google Scholar] [CrossRef] [PubMed]
  24. Zhang, T.; Naoumkina, M.; Thyssen, G.; Fang, D.D.; Hinchliffe, D.J.; Florane, C.; Yeater, K.M.; Page, J.T.; Udall, J.A. The Li2 mutation results in reduced subgenome expression bias in elongating fibers of allotetraploid cotton (Gossypium hirsutum L.). PLoS ONE 2014, 9. [Google Scholar] [CrossRef]
  25. Hu, G.; Houston, N.L.; Pathak, D.; Schmidt, L.; Thelen, J.J.; Wendel, J.F. Genomically biased accumulation of seed storage proteins in allopolyploid cotton. Genetics 2011, 189, 1103–1115. [Google Scholar] [CrossRef] [PubMed]
  26. Zheng, D.; Ye, W.; Song, Q.; Han, F.; Zhang, T.; Chen, Z.J. Histone modifications define expression bias of homoeologous genomes in allotetraploid cotton. Plant Physiology 2016, 172, 1760–1771. [Google Scholar] [CrossRef] [PubMed]
  27. Qanmber, G.; You, Q.; Yang, Z.; Fan, L.; Zhang, Z.; Chai, M.; Gao, B.; Li, F.; Yang, Z. Transcriptional and translational landscape fine-tune genome annotation and explores translation control in cotton. Journal of Advanced Research 2024, 58, 13–30. [Google Scholar] [CrossRef] [PubMed]
  28. Hsu, P.Y.; Calviello, L.; Wu, H.-Y.L.; Li, F.-W.; Rothfels, C.J.; Ohler, U.; Benfey, P.N. Super-resolution ribosome profiling reveals unannotated translation events in Arabidopsis. Proceedings of the National Academy of Sciences 2016, 113. [Google Scholar] [CrossRef]
  29. Ingolia, N.T.; Brar, G.A.; Rouskin, S.; Mcgeachy, A.M.; Weissman, J.S. The ribosome profiling strategy for monitoring translation in vivo by deep sequencing of ribosome-protected mRNA fragments. Nature Protocols 2012, 7, 1534–1550. [Google Scholar] [CrossRef]
  30. Chen, S. Ultrafast one-pass FASTQ data preprocessing, quality control, and deduplication using fastp. iMeta 2023, 2. [Google Scholar] [CrossRef]
  31. Langmead, B.S.S. Fast gapped-read alignment with Bowtie 2. Nature Methods 2012, 9, 357–359. [Google Scholar] [CrossRef]
  32. Saski, C.A.; Scheffler, B.E.; Hulse-Kemp, A.M.; Liu, B.; Song, Q.; Ando, A.; Stelly, D.M.; Scheffler, J.A.; Grimwood, J.; Jones, D.C.; Peterson, D.G.; Schmutz, J.; Chen, Z.J. Sub genome anchored physical frameworks of the allotetraploid Upland cotton (Gossypium hirsutum L.) genome, and an approach toward reference-grade assemblies of polyploids. Scientific Reports 2017, 7. [Google Scholar] [CrossRef]
  33. Kim, D.; Paggi, J.M.; Park, C.; Bennett, C.; Salzberg, S.L. Graph-based genome alignment and genotyping with HISAT2 and HISAT-genotype. Nature Biotechnology 2019, 37, 907–915. [Google Scholar] [CrossRef] [PubMed]
  34. Shi, W. Rsubread: R package for high-throughput sequencing data processing. Computer software, 2021.
  35. Dobin, A. STAR aligner software. [Z]. Cold Spring Harbor Laboratory. 2021. [Google Scholar]
  36. Xiao, Z. RiboCode is a very simple but high-quality computational algorithm to identify genome-wide translated ORFs using ribosome-profiling data. [Z]. 2022. [Google Scholar]
  37. Love, M.I.; Huber, W.; Anders, S. Moderated estimation of fold change and dispersion for RNA-seq data with DESeq2. Genome Biology 2014, 15. [Google Scholar] [CrossRef]
  38. Benjamini, Y.; Hochberg, Y. Controlling the false discovery rate: a practical and powerful approach to multiple testing. Journal of the Royal Statistical Society Series B: Statistical Methodology 1995, 57, 289–300. [Google Scholar] [CrossRef]
  39. Yu, G.; Wang, L.-G.; Han, Y.; He, Q.-Y. ClusterProfiler: an R package for comparing biological themes among gene clusters. OMICS: A Journal of Integrative Biology 2012, 16, 284–287. [Google Scholar] [CrossRef]
  40. Wickham, H. ggplot2: Elegant graphics for data analysis [Z]. Springer-Verlag New York. 2016. [Google Scholar]
  41. Kolde, R. pheatmap: Pretty heatmaps. 2019.
  42. Hu, G.; Grover, C.E.; Vera, D.L.; Lung, P.-Y.; Girimurugan, S.B.; Miller, E.R.; Conover, J.L.; Ou, S.; Xiong, X.; Zhu, D.; Li, D.; Gallagher, J.P.; Udall, J.A.; Sui, X.; Zhang, J.; Bass, H.W.; Wendel, J.F.; Purugganan, M. Evolutionary dynamics of chromatin Structure and duplicate gene expression in diploid and allopolyploid cotton. Molecular Biology and Evolution 2024, 41. [Google Scholar] [CrossRef]
  43. Ingolia, N.T.; Ghaemmaghami, S.; Newman JR, S.; Weissman, J.S. Genome-Wide analysis in vivo of translation with nucleotide resolution using ribosome profiling. Science 2009, 324, 218–223. [Google Scholar] [CrossRef]
  44. Paulet, D.; David, A.; Rivals, E. Ribo-seq enlightens codon usage bias. DNA Research 2017, 24, 303–210. [Google Scholar] [CrossRef]
  45. Guttman, M.; Russell, P.; Ingolia Nicholas, T.; Weissman Jonathan, S.; Lander Eric, S. Ribosome profiling provides evidence that large noncoding RNAs do not encodeproteins. Cell 2013, 154, 240–251. [Google Scholar] [CrossRef] [PubMed]
  46. Juntawong, P.; Girke, T.; Bazin, J.; Bailey-Serres, J. Translational dynamics revealed by genome-wide profiling of ribosome footprints in Arabidopsis. Proceedings of the National Academy of Sciences 2013, 111. [Google Scholar] [CrossRef]
  47. Chaudhary, B.; Flagel, L.; Stupar, R.M.; Udall, J.A.; Verma, N.; Springer, N.M.; Wendel, J.F. Reciprocal silencing, transcriptional bias and functional divergence of homeologs in polyploid cotton (Gossypium). Genetics 2009, 182, 503–517. [Google Scholar] [CrossRef] [PubMed]
  48. Hovav, R.; Faigenboim-Doron, A.; Kadmon, N.; Hu, G.; Zhang, X.; Gallagher, J.P.; Wendel, J.F. A transcriptome profile for developing seed of polyploid cotton. The Plant Genome 2015, 8. [Google Scholar] [CrossRef]
  49. Zhang, T.; Hu, Y.; Jiang, W.; Fang, L.; Guan, X.; Chen, J.; Zhang, J.; Saski, C.A.; Scheffler, B.E.; Stelly, D.M.; Hulse-Kemp, A.M.; Wan, Q.; Liu, B.; Liu, C.; Wang, S.; Pan, M.; Wang, Y.; Wang, D.; Ye, W.; Chang, L.; Zhang, W.; Song, Q.; Kirkbride, R.C.; Chen, X.; Dennis, E.; Llewellyn, D.J.; Peterson, D.G.; Thaxton, P.; Jones, D.C.; Wang, Q.; Xu, X.; Zhang, H.; Wu, H.; Zhou, L.; Mei, G.; Chen, S.; Tian, Y.; Xiang, D.; Li, X.; Ding, J.; Zuo, Q.; Tao, L.; Liu, Y.; Li, J.; Lin, Y.; Hui, Y.; Cao, Z.; Cai, C.; Zhu, X.; Jiang, Z.; Zhou, B.; Guo, W.; Li, R.; Chen, Z.J. Sequencing of allotetraploid cotton (Gossypium hirsutum L. acc. TM-1) provides a resource for fiber improvement. Nature Biotechnology 2015, 33, 531–537. [Google Scholar] [CrossRef]
  50. Kenan-Eichler, M.; Leshkowitz, D.; Tal, L.; Noor, E.; Melamed-Bessudo, C.; Feldman, M.; Levy, A.A. Wheat hybridization and polyploidization results in deregulation of small RNAs. Genetics 2011, 188, 263–272. [Google Scholar] [CrossRef] [PubMed]
  51. Hu, G.; Koh, J.; Yoo, M.J.; Grupp, K.; Chen, S.; Wendel, J.F. Proteomic profiling of developing cotton fibers from wild and domesticated Gossypium barbadense. New Phytologist 2013, 200, 570–582. [Google Scholar] [CrossRef] [PubMed]
  52. Mirouze, M.; Vitte, C. Transposable elements, a treasure trove to decipher epigenetic variation: insights from Arabidopsis and crop epigenomes. Journal of Experimental Botany 2014, 65, 2801–2812. [Google Scholar] [CrossRef]
  53. Vicient, C.M.; Casacuberta, J.M. Impact of transposable elements on polyploid plant genomes. Annals of Botany 2017, 120, 195–207. [Google Scholar] [CrossRef]
  54. Ha, M.; Lu, J.; Tian, L.; Ramachandran, V.; Kasschau, K.D.; Chapman, E.J.; Carrington, J.C.; Chen, X.; Wang, X.-J.; Chen, Z.J. Small RNAs serve as a genetic buffer against genomic shock in Arabidopsis interspecific hybrids and allopolyploids. Proceedings of the National Academy of Sciences 2009, 106, 17835–17840. [Google Scholar] [CrossRef]
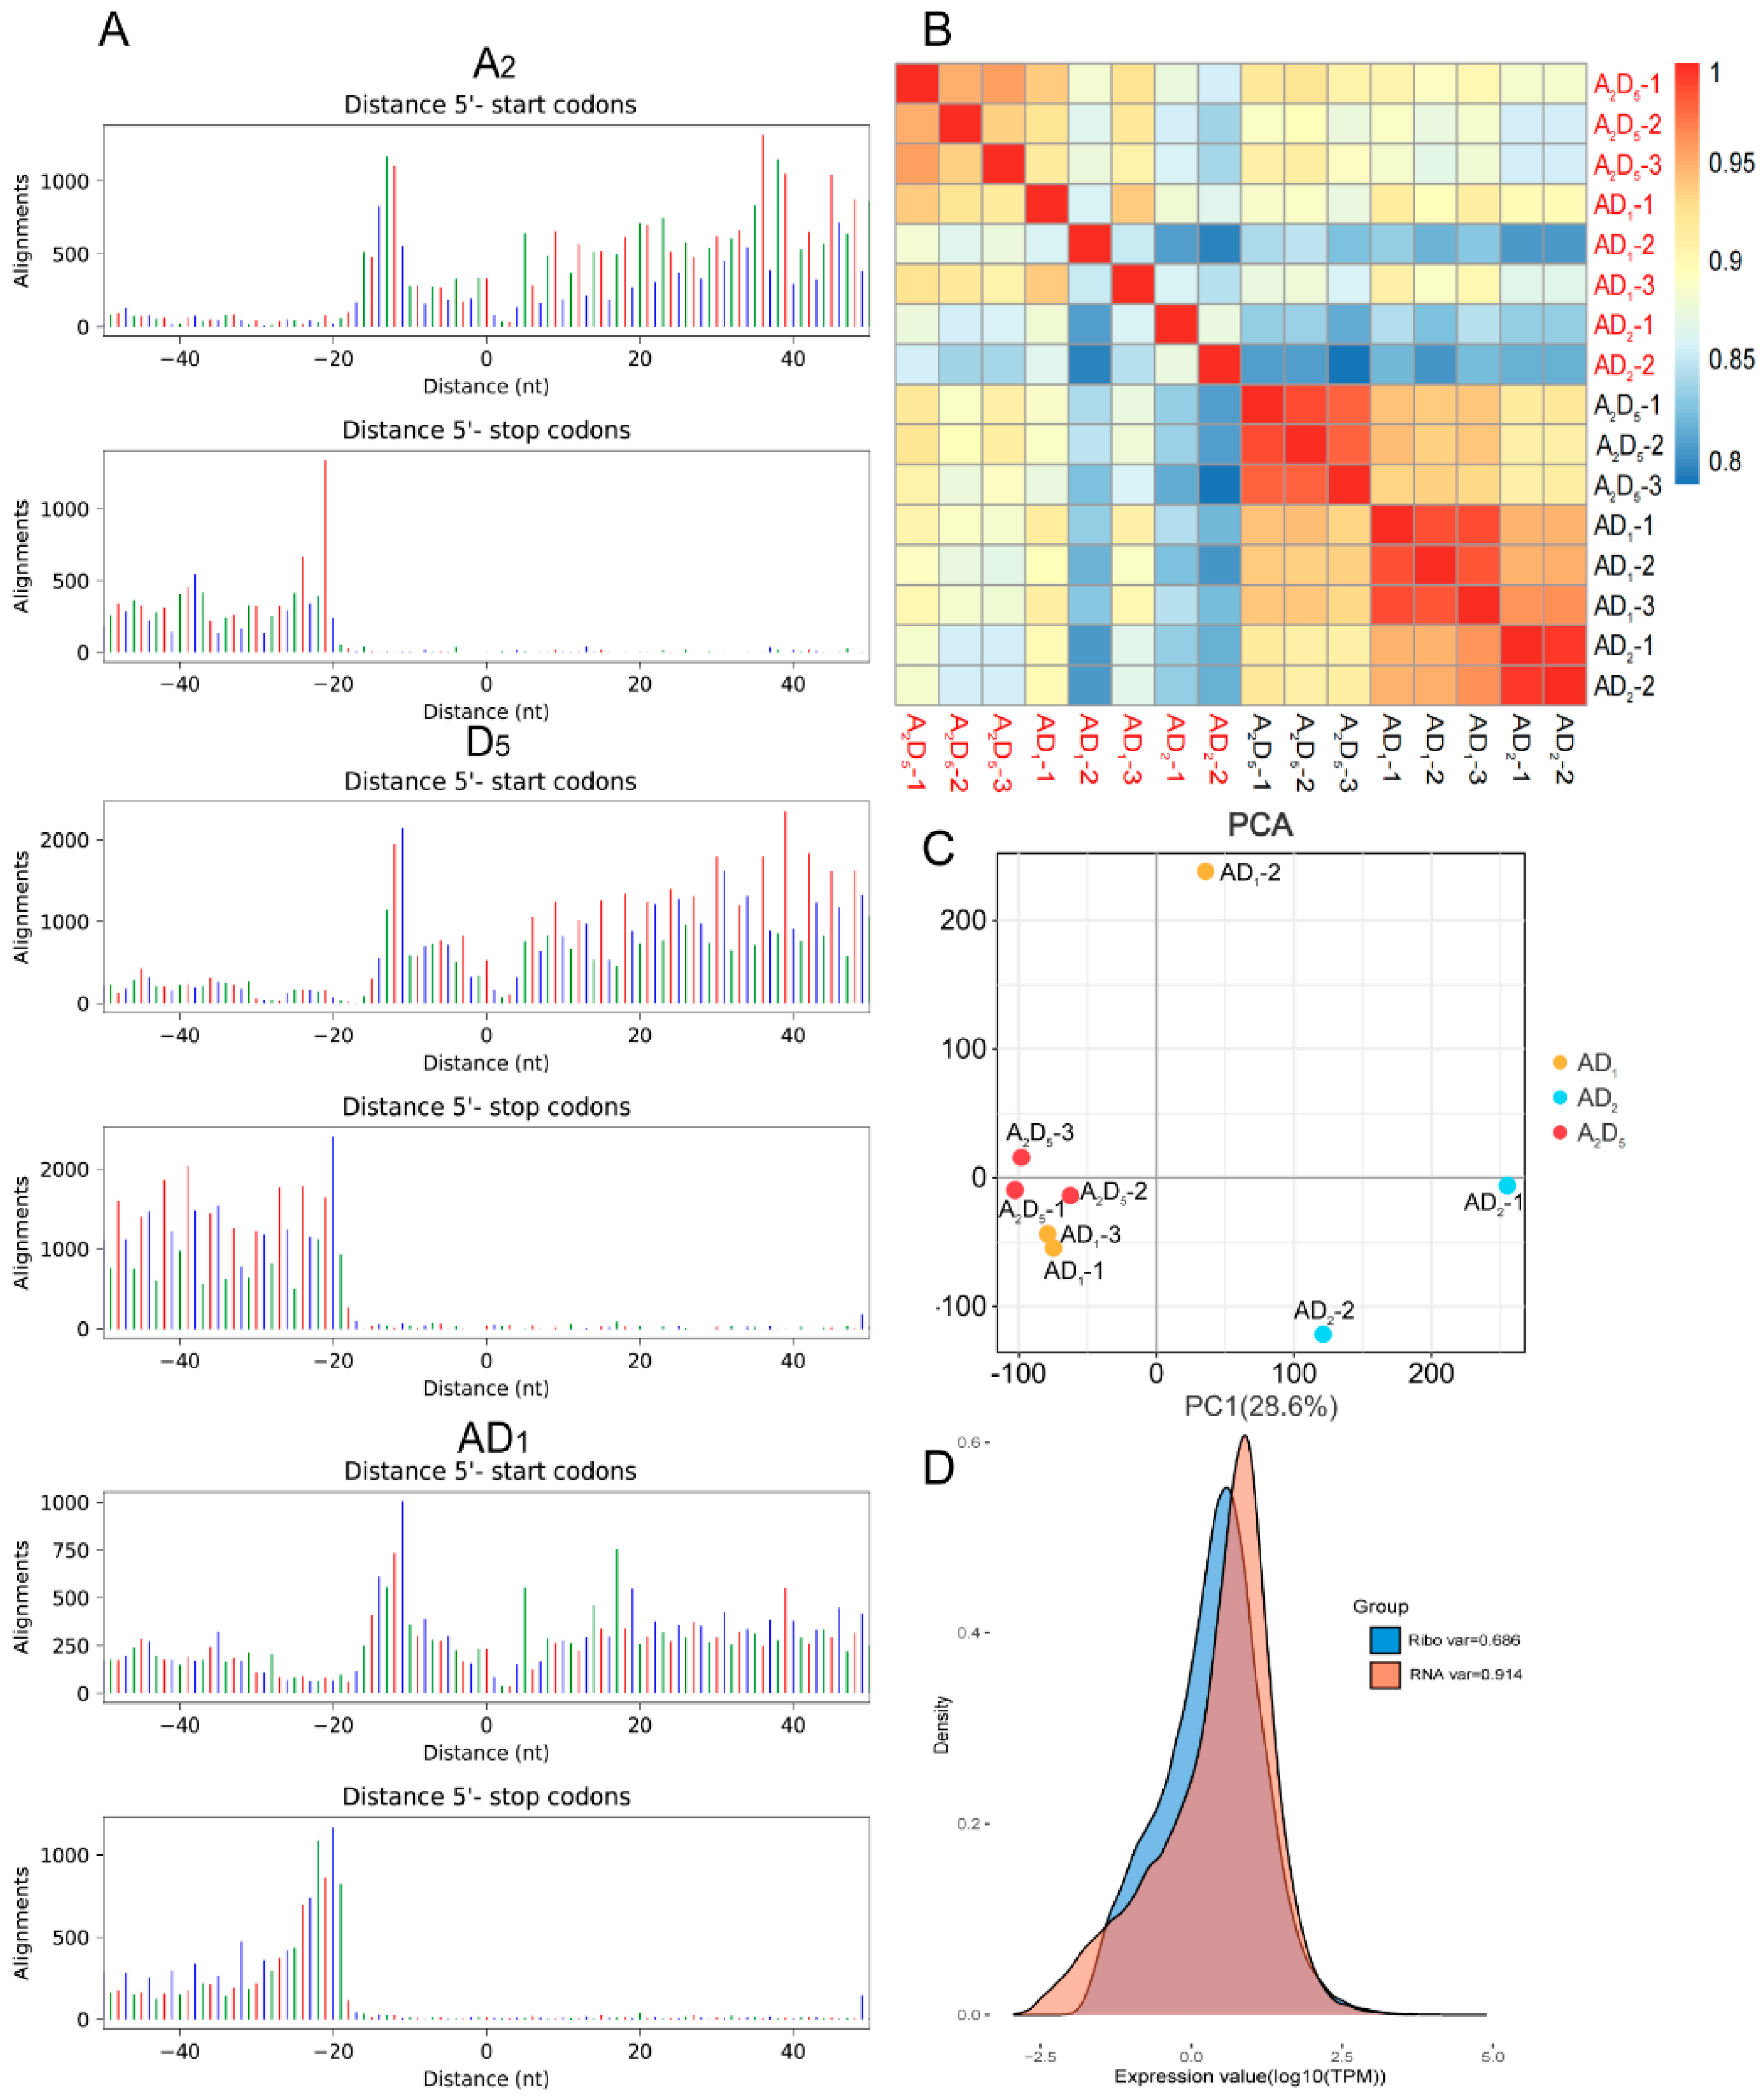
Figure 1. Characteristics of ribosome profiling data in diploid and allopolyploid cottons. A. Three-nucleotide periodicity flanking gene coding regions, of Ribo-seq data from G.arboreum (A2), G.raimondii (D5), and G.hirsutum (AD1). B. Matrix of pairwise Pearson correlation coefficients matrix of Ribo-seq (red) and RNA-seq (black) data from diploids combined (A2D5) and two allopolyploid species G. hirsutum (AD1) and G. Barbadense (AD2); the latter was obtained from a previously published study [27]. C. Principal component analysis (PCA) of normalized read counts in TPM. D. Comparing variances between Ribo-seq and RNA-seq data.
Preprints 115398 g001
Figure 2. Differential expression analysis of, AD1 and AD2 relative to A2D5. A. Differentially expressed genes (DEGs) at the transcriptional (red) and translational (blue) levels among the three materials. Arrows represent contrasts performed, with DEG numbers shown next to the genotype exhibiting higher expression levels relative to its counterpart. B. Venn diagram intersection of four DEG lists between diploid and allopolyploid cottons: AD1 vs A2D5 and AD2 vs A2D5 at either transcriptional or translational levels. C. Classification of allopolyploidy changes commonly identified in AD1 and AD2, by cross-tabulating three expression patterns (increased, decreased, and no changes) between RNA-seq and Ribo-seq. For example, category C of 53 genes exhibits increased transcription and translation in both AD1 and AD2 relative to A2D5. D. Gene Ontology (GO) enrichment analysis for the genes exhibiting allopolyploidy changes at the translational levels (category A-C and F-H). Significant GO terms were identified for categories B, F, and G.
Preprints 115398 g002
Figure 3. Comparing profiles of transcription efficiency between diploid and allopolyploid cottons. A. Proportion of genes with significant translational level regulation indicated by TE ≠ 0. B. Negative correlations between TE and mRNA levels. C. Histogram distribution of TE values examined to choose the cutoff of |TE| > 6 for most significant translational regulated genes. D. GO enrichment for genes with |TE| > 6.
Preprints 115398 g003
Disclaimer/Publisher’s Note: The statements, opinions and data contained in all publications are solely those of the individual author(s) and contributor(s) and not of MDPI and/or the editor(s). MDPI and/or the editor(s) disclaim responsibility for any injury to people or property resulting from any ideas, methods, instructions or products referred to in the content.
Copyright: This open access article is published under a Creative Commons CC BY 4.0 license, which permit the free download, distribution, and reuse, provided that the author and preprint are cited in any reuse.
Alerts
Prerpints.org logo

Preprints.org is a free preprint server supported by MDPI in Basel, Switzerland.

Subscribe

© 2025 MDPI (Basel, Switzerland) unless otherwise stated