Preprint
Article

Effects of Free or Immobilized Pediococcus acidilactici ORE5 on Corinthian Currants on Gut Microbiome of Streptozotocin-Induced Diabetic Rat

Altmetrics

Downloads

129

Views

35

Comments

0

A peer-reviewed article of this preprint also exists.

Submitted:

20 August 2024

Posted:

20 August 2024

You are already at the latest version

Alerts
Abstract
Type-1 Diabetes Mellitus (T1D) onset and development is closely linked with imbalance of gut microbiome, while supplementation with probiotics may result in positive alterations in gut microbiome composition. In the present study, the effect of a dietary intervention including free or immobilized cells of the presumptive probiotic Pediococcus acidilactici ORE5 on Corinthian currants, a food with beneficial impact in the condition of diabetes, was investigated. Male Wistar rats were studied which were divided into 4 groups: healthy animals, which received the free (H_FP) or the immobilized cells (H_IPC), and diabetic animals, which received the free (D_FP) or the immobilized cells (D_IPC), for 4 weeks (109 cfu/day, in all groups). At the end of the dietary intervention, D_IPC group exerted lower concentration of the inflammatory cytokine IL-1b compared to D_FP. Consumption of immobilized on Corinthian currants P. acidilactici ORE5 cells by diabetic animals led to increased loads of fecal lactobacilli and lower levels of Enterobacteriaceae, coliforms, and E. coli, while Actinobacteria phylum, Akkermansia, and Bifidobacterium genera abundances were increased, and fecal lactic acid was elevated. Overall, the results of the present research demonstrated that functional ingredients can ameliorate gut dysbiosis present in T1D and could be used to design dietary patterns aiming at T1D management. However, well-designed clinical trials are necessary, in order to confirm the beneficial effects in humans.
Keywords: 
Subject: Biology and Life Sciences  -   Food Science and Technology

1. Introduction

Nowadays, the elucidation of the causal relationship between the intestinal microbiome and the onset and development of pathological conditions is an area of focused research. Type-1 Diabetes (T1D), characterized by autoimmune destruction of pancreatic beta cells, is a condition influenced by gut microbiota [1,2]. In 2021, it was estimated that around 8.4 million people were facing T1D globally, including the 500,000 new cases reported during that year. According to provisions, the number of people suffering by T1D will range between 13.5 to 17.4 million by 2040 [3].
A variety of factors that have become increasingly common nowadays appear to play a role in the rising incidence of T1D (lack of breastfeeding, method of birth delivery, childhood dietary patterns, antibiotic utilization, exposure to microbes, etc.). The manipulation of the microbiome could influence the impact of these factors on the susceptibility to T1D [4]. Additionally, emerging research suggests that disturbances in the gut microbiota might play a role in the development of T1D, with gut dysbiosis potentially leading to immune dysregulation and increased intestinal permeability as potential mechanisms underlying the onset of T1D [2,5].
Amidst the strategies for managing the disease of T1D, probiotics have emerged as a promising agent for modulating the gut microbiome and potentially impacting disease progression [6]. Findings from both experimental research and clinical trials suggest that probiotics administration could offer a protective effect against T1D through various mechanisms. For example, probiotics have been shown to enhance the expression of junction and adhesion proteins, bolstering the integrity of the gut epithelial barrier [7]. Additionally, they can lower oxidative stress, regulate inflammatory responses, and consequently promote the proliferation of T-regulatory cells and the production of anti-inflammatory cytokines, all of which contribute to their potential protective effects against T1D [8,9]. However, while numerous studies have explored the effects of probiotics on gut health and metabolic disorders, the efficacy of novel wild-type presumptive probiotics particularly in the context of T1D needs to be examined separately.
Cell immobilization on natural food ingredients is proposed as an easy and natural technique to produce food ingredients with enhanced shelf-life and survival during storage and digestion [10,11]. Combining a probiotic culture with a food constituent that owns beneficial properties could lead to the production of a functional food ingredient or a presumptive synbiotic. As natural immobilization agents, fruit pieces, nuts, and cereals, among others, have been previously tested successfully [10,11]. Corinthian currants are dried grapes, rich in polar phenolic compounds [12] which have shown beneficial effects in streptozotocin (STZ)-induced diabetic rats (T1D). Certainly, after a 4-week dietary intervention serum polar phenolic compounds were restored, levels of the inflammatory factor IL-1b were reduced and the intestinal microbiome composition was balanced [13].
Novel wild-type probiotic strains are vastly needed given the increasing trend of the probiotic industry, in recent years. Pediococcus spp. are lactic acid bacteria (LAB) and selected strains have been characterized as probiotics. Pediococcus acidilactici ORE5, isolated from kefir grains, has been evaluated for its potential probiotic capacity in vitro, by our research group [14]. Particularly, the survival of the strain after exposure to low pH, pepsin, pancreatin, and bile salts, along with sensitivity to antibiotics indicated the fitting of the strain as a probiotic candidate. Moreover, the incorporation of the strain in Katiki Domokou-type cheese ameliorated the cheese microbiome [14].
To the best of the authors’ knowledge, there are only few reports in the literature that have investigated the effects of a dietary supplementation with presumptive probiotics on microbiome composition in T1D rats (few of them with synbiotics and none with immobilized cells). Hence, the aim of the present study was to investigate the potential alterations in the microbiome composition of STZ-induced diabetic rats after a 4-week dietary intervention with free or immobilized cells of the presumptive probiotic P. acidilactici ORE5 on Corinthian currants. The effects on blood parameters related to the disease of T1D were also examined.

2. Materials and Methods

2.1. Microbial Strain

Pediococcus acidilactici ORE5, isolated from kefir grains [14], was grown on Man, Rogosa and Sharpe (MRS) broth (Condalab, Madrid, Spain) at 37°C for 24 h. The medium was sterilized at 121°C for 15 min prior to use.

2.2. Immobilization of Cells on Corinthian Currants and Freeze-Drying

Cell immobilization on Corinthian currants (Vitis vinifera L., var. Apyrena, “VOSTIZZA” P.D.O, kindly provided by the Agricultural Cooperatives’ Union of Aeghion, Aeghion, Greece) was carried out as described previously [11]. In brief, 500 mL of the grown cells were centrifuged (8500 x g, 15 min, 4°C), washed with 100 mL of sterile ¼ Ringer’s solution and resuspended in 250 mL Ringer’s solution. 200 g of Corinthian currants, used as immobilization support, were added and the mixture was left undisturbed for 6 h at room temperature (RT). Before the initialization of the immobilization process, Corinthian currants were heated at 120oC for 10 min, as a pretreatment to eliminate indigenous microbes. Immobilized cells were strained and washed with sterile ¼ Ringer’s solution to remove non-immobilized cells.
Immobilized P. acidilactici ORE5 cells were transferred to -80oC for 18 h and then freeze-dried on a BenchTopPro freeze-dryer (Virtis, SP Scientific, Warminster, PA, USA) for 24 h (30–35 Pa vacuum and -101οC condenser temperature). Cells before and after freeze-drying were stored at RT and at 4oC and cell survival was monitored up to 30 days. For comparison purposes, freeze-dried free (non-immobilized) P. acidilactici ORE5 cells were also prepared.

2.3. Scanning Electron Microscopy

To verify cell immobilization of P. acidilactici ORE5 on Corinthian currants, scanning electron microscopy was performed, as described recently [10]. Briefly, gold was used to coat freeze-dried immobilized cells with a coating system (BAL-TEC MED 020 Sputter) for 2 min, following examination using a JSM-6300 scanning electron microscope at 20 kV voltage.

2.4. In Vivo Study Design

2.4.1. STZ-Induced Animal Model

Twenty-four male Wistar (RCCHan:Wistar) rats (Envigo, Italy) bred in the Laboratory Animal Facility of the Biomedical Research Foundation of the Academy of Athens (BRFAA), participated in the study. Power analysis using the software “G*Power” was used to determine the number of animals that were needed to draw significant conclusions [15]. F-test analysis of variance (ANOVA) was performed using data from a pilot study [16], also reported elsewhere [13]. Based on the results, 7 animals per group were entailed. Given the losses observed after streptozotocin (STZ) injection (~25%), each group finally included 6 animals which has been proven to be sufficient number to draw significant differences, as demonstrated in previous studies [13,16].
One week prior to protocol debut, rats were housed individually and had ad libitum access to food (4RF22, Mucedola, Udine, Italy) and tap water (acclimatization period). For the induction of diabetes, 13-week-old rats that weighted 360-380 g were used. Animals in non-fasting state were injected with 60 mg/kg of body weight STZ (Sigma-Aldrich, Germany) solution (STZ in citrate buffer 0.1 M, pH 4.5), intraperitoneally. One week post injection, blood glucose concentration was measured and animals exerting levels ≥250 mg/dL [17] were considered as diabetic and were included in the study. All animal experimentations were conducted according to the European Directive 2010/63 and protocols were reviewed and approved by the Veterinary Directorate of the Athens Prefecture (Ref. Number 272253/07-04-2021). Animal well-being was monitored and supervised by a designated veterinarian of the BRFAA animal facility. The animals were individually housed, in order to reassure that they received the respective dietary regimen daily dosage. Every week, bedding and cages were changed. Body weight of the animals was measured weekly and blood glucose was monitored using a digital glucose meter (OneTouch Verio FlexTM, Lifescan Canada Ltd) to confirm the establishment and maintenance of T1D.

2.4.2. Dietary Intervention with Probiotics

Animals were divided into 4 groups according to their diet (n=6 per group): healthy animals that received the control diet supplemented with 109 cfu freeze-dried immobilized P. acidilactici ORE5 cells on Corinthian currants (H_IPC), or diabetic animals that received the control diet supplemented with 109 cfu freeze-dried immobilized P. acidilactici ORE5 cells on Corinthian currants (D_IPC), healthy animals that received the control diet supplemented with 109 cfu free P. acidilactici ORE5 cells (H_FP) or diabetic animals that received the control diet supplemented with 109 cfu free P. acidilactici ORE5 cells (D_FP). Both diets were isocaloric and Corinthian currants represented 10% (w/w) of the diet [13]. Every day, the animals were provided with fresh food and any remains were removed. The dietary intervention lasted for 4 weeks (30 days).

2.4.3. Sample Collection

At baseline and at the 4th week of the study, blood and stool samples were collected. Blood was obtained from the lateral tail vein of the animals after a six-hour fasting and heparinized plasma was isolated following centrifugation (3000 x g, 10 min, 4°C). At the end of the experimental period, animals were anesthetized by an overdose of isoflurane (ISOVET, Chanelle Pharma, Loughrea, Co. Galway, Ireland), followed by euthanasia by exsanguination after the collection of blood from the anterior vena cava. The intestinal segment of cecum and the cecal content (fluid) were also collected. Cecal tissue was washed twice with normal saline and diluted (1:1) in 25% glycerol-Ringer’s solution. All samples (plasma, stools, cecum tissue and cecal fluid) were stored at -80°C until analysis.

2.5. Sample Analyses

2.5.1. Blood Analyses

Plasma glucose, total cholesterol (TC) and triacylglycerols (TAG) were assessed on an automated biochemical analyzer (Konelab 60i, Thermo Fisher Scientific Inc., Waltham, MA, USA) using commercially available kits (Thermo Fisher Scientific Inc.). Plasma insulin levels were determined by a rat insulin ELISA kit (EZRMI-13K, Merck Millipore, Germany). Inflammatory factors TNF-a, IL-1b, and IL-6 were quantified in samples derived from the cardiac puncture at the end of the dietary intervention using ELISA kits (OriGene, Rockville, MD, USA).

2.5.2. Microbiological Analyses

2.5.2.1. Determination of P. acidilactici ORE5 Levels

Cell levels of P. acidilactici ORE5 (free or immobilized on Corinthian currants, wet or freeze-dried) were determined after microbiological analysis. Prior to analysis, freeze-dried immobilized cells were rehydrated in sterile dH2O for 1 h at RT, followed by filtration. Five g of immobilized cells (wet or rehydrated freeze-dried) were homogenized with 45 mL of sterile ¼ Ringer’s solution, followed by serial decimal dilutions in the same solution and plating on MRS agar (Condalab) at 37°C for 72 h anaerobically [Anaerobic Jar 2.5 L (Merck Millipore), Anaerocult A system (Merck-Millipore)]. Likewise, free cell biomass was rehydrated in sterile dH2O corresponding to the initial volume (before freeze-drying) at RT for 15 min. The % survival rate was calculated as logcfu/g or logcfu/mL at each timepoint, divided by initial logcfu/g or logcfu/, and multiplied by 100, as previously described [11].

2.5.2.2. Stool and Tissue Microbiota Analyses

Fecal samples (1-2 g), cecal intestinal fluid (2-3 g) or intestinal (cecum) tissue (2-3 g) were vigorously blended with 0.1% sterilized buffered peptone water (Lab M, Heywood, UK) to achieve homogenization. After serial decimal dilutions on sterile ¼ Ringer’s solution, pouring/plating on different media was followed to determine: (1) Total Aerobic Counts (TAC) on Plate Count agar (Condalab) at 30°C for 72 h, (2) Enterobacteriaceae on Violet Red Bile Glucose agar (Condalab) at 37°C for 24 h, (3) coliforms on Chromogenic Coliform Agar (Condalab) at 37°C for 24 h, (4) Escherichia coli on Tryptone Bile-X Chromogenic agar (Condalab) at 37°C for 24 h, (5) Staphylococcus spp. on Baird Parker agar (Condalab) supplemented with egg yolk tellurite (Condalab) at 37°C for 48 h, (6) Enterococcus spp. on Kanamycin Aesculin Azide confirmatory agar (Condalab) at 37°C for 48 h, (7) Clostridium spp. on Tryptose Sulfite Cycloserine agar (Condalab) supplemented with egg yolk tellurite (Condalab) at 37°C for 48 h anaerobically (Anaerobic Jar 2.5 L, Anaerocult A system), (8) LAB (Gram positive) on MRS agar (Condalab) at 37°C for 72 h anaerobically (Anaerobic Jar 2.5 L, Anaerocult A system), and (9) Bifidobacterium spp. on TOS Propionate agar (Condalab) supplemented with MUP (Condalab) at 37°C for 48 h anaerobically (Anaerobic Jar 2.5 L, Anaerocult A system). Extended incubations up to 120 h did not result in any additional colonies. The results are expressed as logcfu/g for petri dishes containing 30 - 300 colonies.

2.5.3. DNA Extraction, PCR Amplification and 16S rRNA Gene Sequencing

Duplicate fecal samples of each group (H_IPC, D_IPC, H_FP and D_FP) at the beginning and the end of the experimental period were subjected to DNA isolation using the NucleoSpin Stool Mini Kit (Macherey-Nagel GmbH & Co. KG, Germany) and according to the manufacturer’s guidelines. Then, the samples were processed to Next Generation Sequencing (NGS) and specifically to MiSeq Illumina sequencing, which was conducted by “Mrdnalab” (www.mrdnalab.com, Shallowater, TX, USA). Primers that amplify the V1-V3 locus of the bacterial 16S rRNA gene were used (27F/519R, AGRGTTTGATCMTGGCTCAG/GTNTTACNGCGGCKGCTG). PCR conditions and subsequent DNA library preparation have been presented in our previous work [13,16]. Raw data processing was carried out by the pipelines of “Mrdnalab” and data were assigned to Operational taxonomic units (OTUs) after clustering at 3% divergence (97% similarity and taxonomically classified to databases using BLASTn. Further analysis of OTU-level data along with the calculation of diversity indices was conducted via R platform and Rhea scripts [18].

2.6. Stool SCFAs and Lactic Acid Profile

Stool short-chain fatty acids (SCFAs) and lactic acid extraction, purification, and quantification was carried out according to Prapa et al. [19]. Levels of SCFAs and lactic acid were determined using an HPLC system (Shimadzu Corp., Duisburg, Germany), consisting of a Nucleogel ION 300 OA column (Macherey-Nagel), a DGU-20A5R degassing unit, an LC-20AD pump, a CTO-20AC oven at 85°C, and a RID-10A refractive index detector.
Stool SCFAs and lactic acid concentrations were expressed as mean μmol/g of feces, using the equation [20]:
S C F A s   a n d   l a c t i c   a c i d ( μ m o l / g ) = o r g a n i c   a c i d   i n   f e c a l   c o n t e n t s m m o l m L V d m L 1000 w e i g h t   o f   f e c a l   s a m p l e ( g )
where Vd represents the total volume of dilution of the stool samples.

2.7. Statistical Analysis

The data are expressed as mean value ± standard error of the mean (SEM) or mean value ± standard deviation (STDEV). Statistical analysis was performed with Statistica v.12 software (StatSoft, Inc., Tulsa, USA). One-way ANOVA coupled with the Bonferroni post-hoc test, was applied to assess differences in inflammatory markers, SCFAs, and cecal (fluid and tissue) microbiota. Factorial ANOVA followed by the Bonferroni post-hoc test was applied to assess differences in immobilized and free cell levels, blood markers, body weight, stool microbiota populations, and microbiome abundances. Statistical significance was set at p<0.05.

3. Results and Discussion

Novel wild-type strains that hold potential probiotic properties after in vitro evaluation need to be tested in vivo, as a following step, to confirm promotion of gut homeostasis. P. acidilactici ORE5, previously isolated from kefir grains has exerted presumptive probiotic properties in vitro, whereas immobilized P. acidilactici ORE5 cells on pistachio nuts were successfully incorporated in soft cheese, indicating quality improvement and prolongation of the product’s shelf-life [14]. On the other hand, Corinthian currant supplementation for 4 weeks in STZ-induced diabetic rats served as a functional dietary component; the dietary intervention had a beneficial effect on enterococci counts and enhanced the presence of cecal LAB [13]. Given these preliminary studies of our group, P. acidilactici ORE5 was chosen as a potential probiotic culture and the immobilized cells on Corinthian currants were then assessed as a functional ingredient for the regulation of the gut microbiome in STZ-induced diabetic rats.

3.1. Immobilized P. acidilactici ORE5 Cells on Corinthian Currant

Initially, the optimization of cell immobilization conditions was studied by evaluating the effect of the duration of the process and the ratio of food carrier/cell culture on cell loads. Immersing Corinthian currants at 80% ratio on the immobilization mixture for 6 h was chosen as the optimum condition, considering the higher (p<0.05) cell loads determined and the requirements of the food industry for rapid and cost-effective processes (data not shown). Of note, indicative micrographs of the immobilized P. acidilactici ORE5 on Corinthian currants are presented in Figure 1.
Subsequently, the effect of freeze-drying on cell viability of free or immobilized P. acidilactici ORE5 cells on Corinthian currant was assessed and the results are presented at Table 1. Considering the cell loads of wet free and immobilized cells at day 0, it is estimated that approximately 1 logcfu/g is lost, corresponding to 10% cell loss. Freeze-drying led to a significant (p<0.05) decrease of cell loads of both free and immobilized cells compared to wet cells. However, the survival rates of immobilized cells were higher (p<0.05) than free cells (99.65 and 98.43%, respectively), indicating the protective effect of cell immobilization. The positive effect of cell immobilization on viability of cells during freeze-drying process has also been documented previously [11,21,22].
The production of immobilized P. acidilactici ORE5 cells on Corinthian currants followed by freeze-drying led to cell concentrations over the minimum levels recommended by the International Probiotics Association Europe and The International Scientific Association for Probiotics and Prebiotics (>7 logcfu/g, Table 1) [23]. Specifically, cell concentrations were equal to 3.90*108 cfu/g at day 0 and to 3.20*108 cfu/g at day 15. Thus, daily supplementation with 2.2 g of immobilized cells on Corinthian currants (representing the 10% of the total caloric content) resulted in a dosage equal to ~109 cfu. Of note, fresh immobilized P. acidilactici ORE5 cells on Corinthian currants were prepared each week, to ensure stability of the concentration throughout the experimental period.
To monitor the stability during storage, 4°C temperature resulted in higher cell loads and survival rates (%) compared to storage at RT (p<0.05) and the nature of culture (wet or freeze-dried), as well as the temperature of storage (20°C or 4°C) significantly (p<0.05) affected viability of both free and immobilized cells. During storage at RT, a significant (p<0.05) decrease at cell loads of all of cultures (wet or freeze-dried, free or immobilized) was observed at 15 and 30 days. In specific, they ranged at levels lower than the minimum recommended cell concentration (7 logcfu/g) after 30 days of storage. Of note, wet cultures concentration was lower (p<0.05) compared to freeze-dried cultures, while the higher cell loads were recorded in freeze-dried immobilized cells (6.54±0.02 logcfu/g). Storage at refrigerated temperature for 30 days resulted in higher (p<0.05) cell loads (>7.40 logcfu/g) compared to storage at 20°C in all cases. Immobilized cells on Corinthian currants remained stable after 15 days of storage at 4°C (p>0.05 compared to day 0), but cell loads were significantly decreased after 30 days of storage (p<0.05). Freeze-fried immobilized P. acidilactici ORE5 cells on Corinthian currants exhibited the highest survival rates (96.39%), while the corresponding cell survival of freeze-dried free cells was 86.99% after 30 days of storage. The results are in accordance with a similar study [11], where immobilized cells of other LAB strains on raisins were decreased compared to immobilized cells on other supports, such as pistachio or cereals. This outcome can be attributed to the polyphenols present in Corinthian currants and to the structure and texture of the fruit (soft and chewy), owing to the drying manufacturing process; however, they retained a high moisture content, which made them slightly plump and juicy.
Probiotics are generally consumed as pill-type products; however, their incorporation in food ingredients or food systems could enhance their use [11,24]. Immobilization of probiotic cells on natural food ingredients has been suggested as a method to preserve cell viability during storage [11] and through the passage via the gastrointestinal tract [10]. Therefore, functional cultures can reach their point of action (which is mainly the large intestine) and exert the potential health effects. Similar results were also recently reported by our group [10].

3.2. Body Weight, Biochemical Profile and Inflammatory Factors

Following the production of the functional ingredients, the potential alterations in the gut microbiome composition of STZ-induced diabetic rats after a 4-week dietary intervention were examined. Rats received immobilized cells of P. acidilactici ORE5 on Corinthian currants or free cells in a concentration of ~109 cfu/day. Similar daily dosage of probiotics is reported elsewhere [24,25] and is in accordance with the International Scientific Association for Probiotics and Prebiotics [20].
Body weight and blood measurements revealed significant differences among the groups that could be attributed to the STZ-induced diabetic state and to the dietary intervention with free or immobilized cells on Corinthian currants.
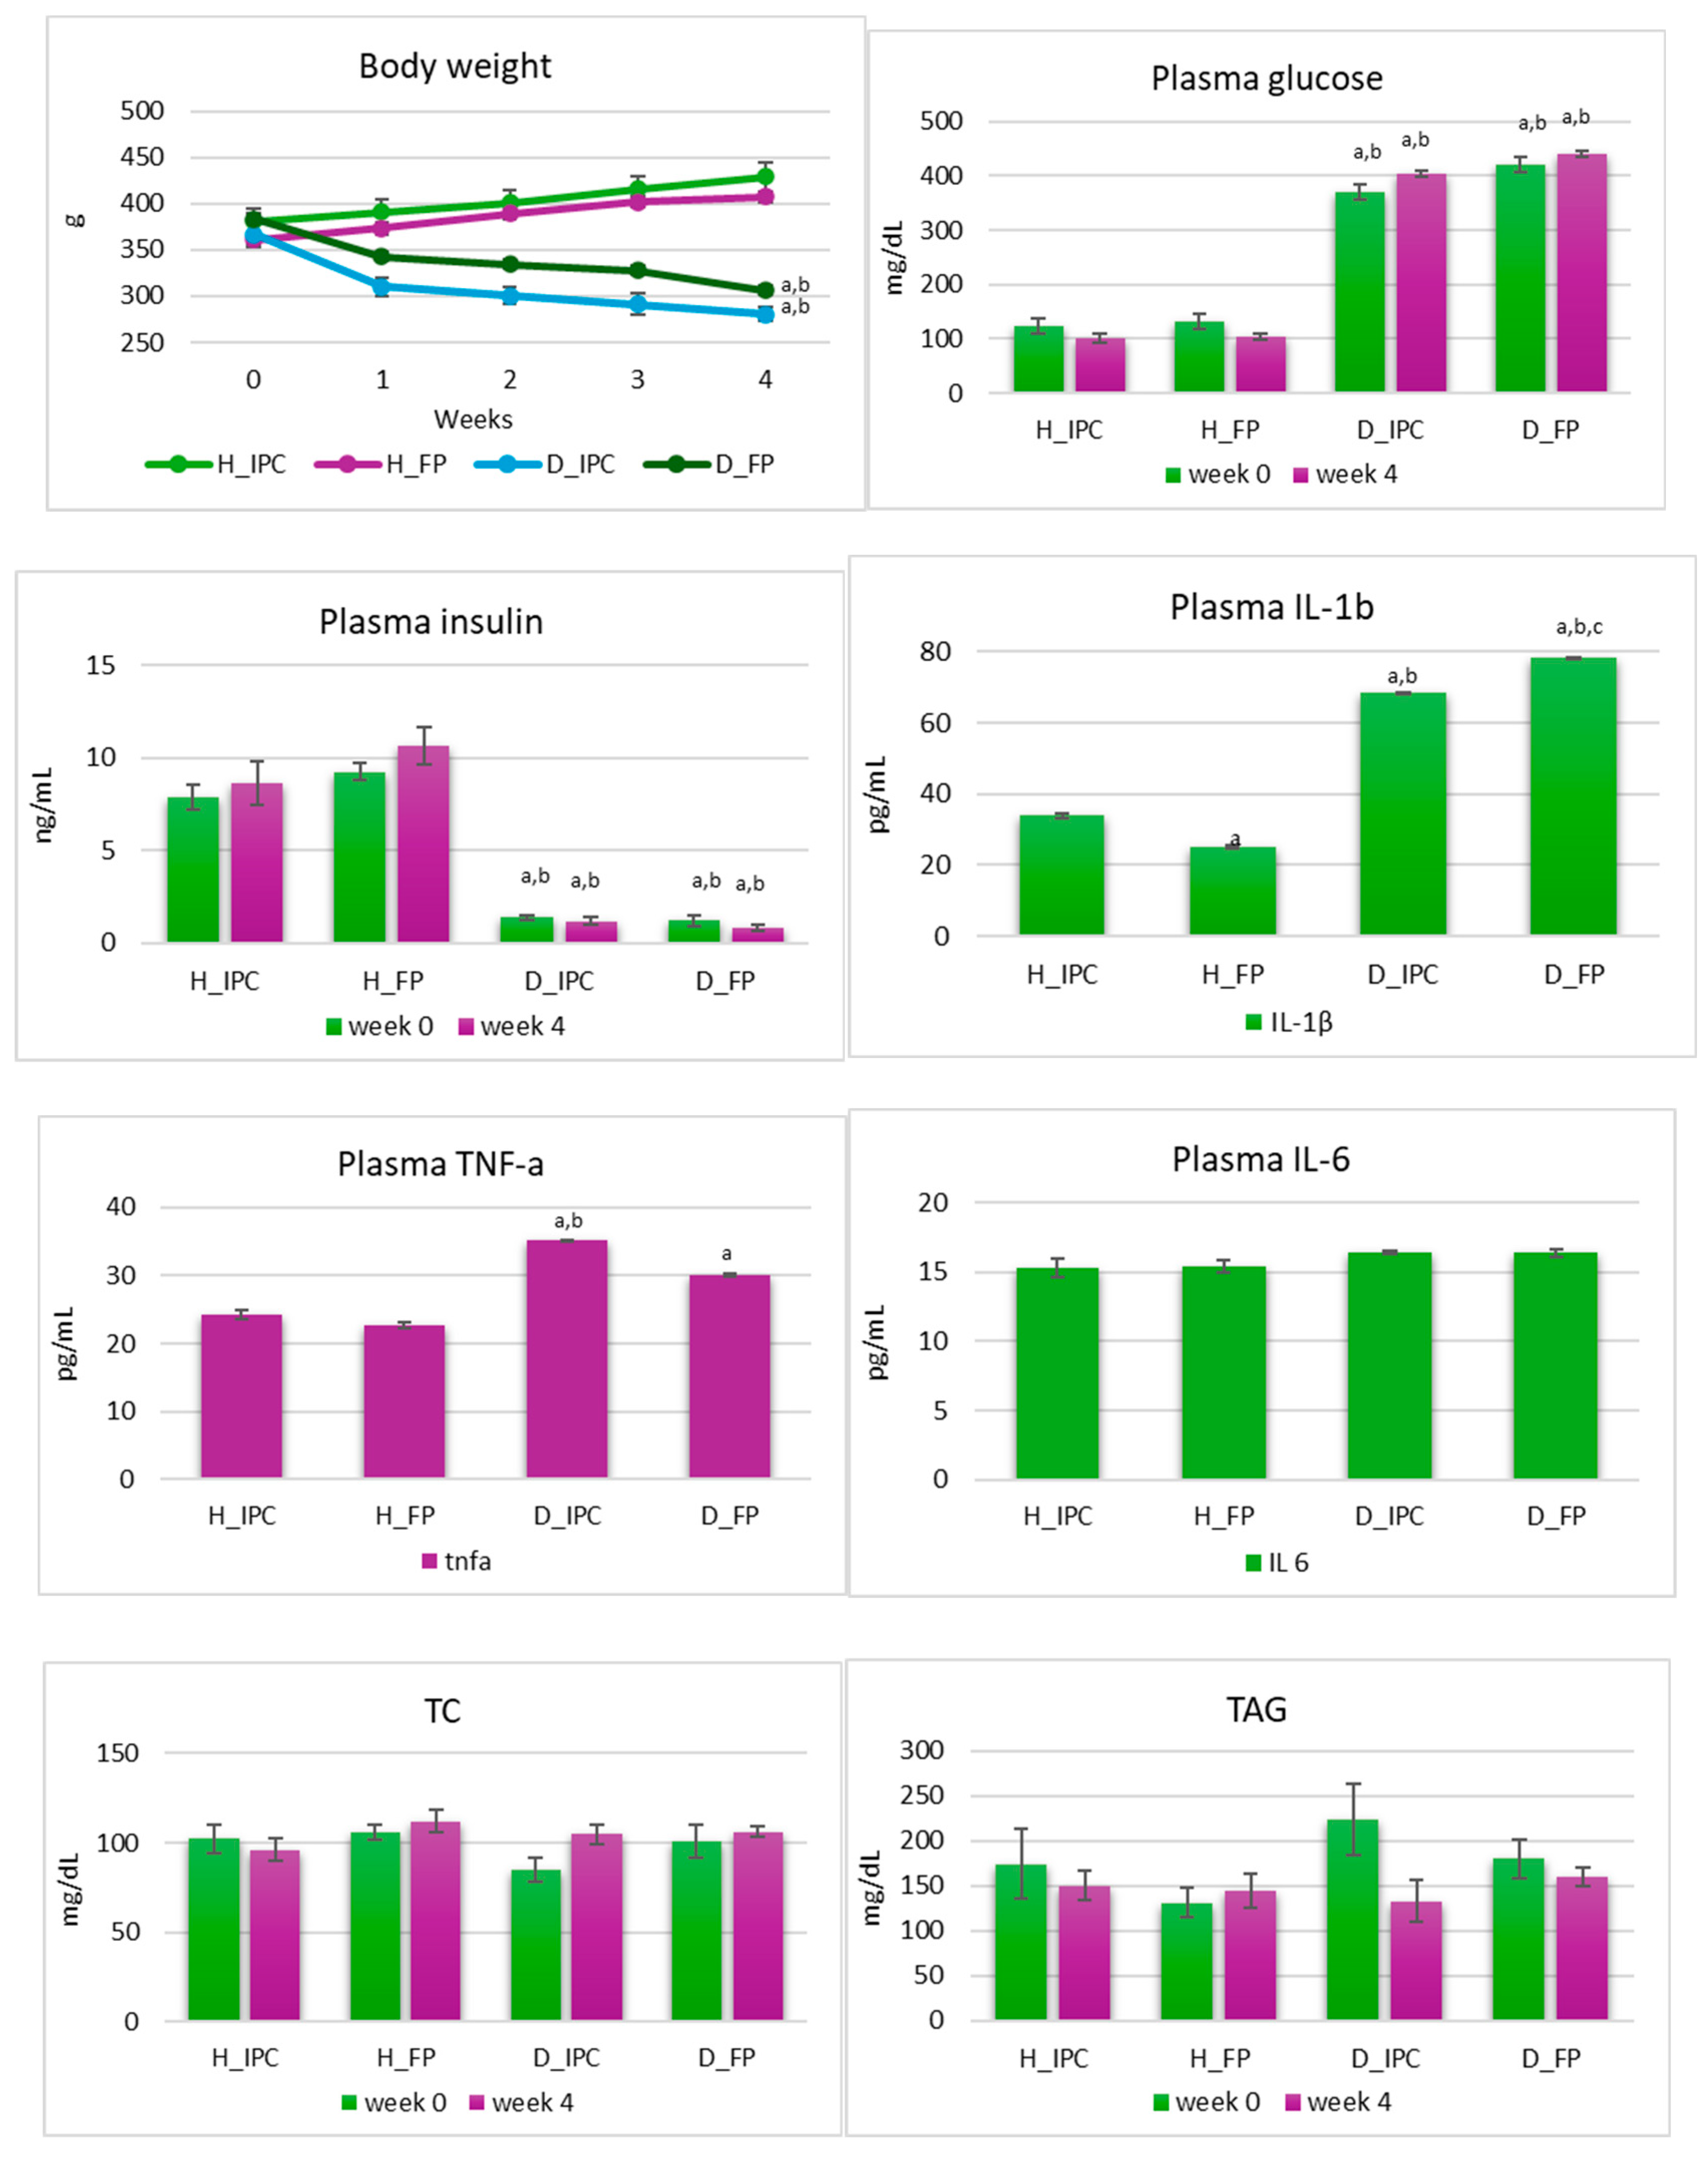
In diabetic groups, progressive weight loss was observed (Figure 2). Specifically, after 4 weeks, in groups D_IPC and D_FP, body weight was lower compared to baseline values (p<0.05) and compared to healthy animals (p<0.05 vs. H_IPC and H_FP). In rats with STZ-induced T1D, progressive loss of body weight is a common observation [27]. STZ selectively destroys the insulin-producing beta cells in the pancreas, mimicking the autoimmune destruction seen in human T1D. With the destruction of beta cells, insulin production is decreased or absent. In the absence of insulin, cells are unable to effectively utilize glucose for energy production, leading to a catabolic state where tissue break down occurs to meet energy demands, including muscle and fat, and thus resulting in weight loss. Dietary interventions can play a significant role in managing the progressive weight loss associated with T1D [28]. While these interventions may not reverse the underlying cause of the disease (insulin deficiency), they can help improve overall health [29], and potentially mitigate some of the complications associated with diabetes. However, in the present study, the dietary intervention with free or immobilized cells on Corinthian currants had no effect on the progressive loss of body weight in STZ-induced diabetic rats. Similar results have been reported in the literature [30], indicating that functional foods or ingredients could contribute to the management of the disease via other ways (e.g., moderating inflammation or causing microbiome alterations) [31,32].
Plasma glucose levels were significantly increased in the diabetic groups compared to the healthy groups (p<0.05) at baseline, as well as in the 4th week of the study and the dietary intervention had no effect (p>0.05, Figure 2). On the other hand, insulin levels were significantly lower in diabetic groups compared to the healthy ones (p<0.05) at both timepoints and were not influenced by the dietary regimen (p>0.05). In T1D, where insulin production is severely impaired due to the destruction of pancreatic beta-cells, dietary interventions are not sufficient to normalize insulin or glucose levels but can play a supportive role in managing and mitigating the complications associated with the disease. While dietary modifications can complement insulin therapy and help optimize blood glucose management in T1D, they are not considered as a substitute for insulin therapy. Hence, insulin administration remains the cornerstone of treatment for T1D in both animals and humans [33].
Inflammation status is of great importance in the emergence, development, and management of T1D. In this vein, levels of inflammatory factors TNF-a, IL-1b, and IL-6 were explored after 4 weeks of dietary intervention. Plasma IL-6 levels were similar in all groups (p>0.05). In diabetic groups that received the immobilized cells, TNF-a levels were higher compared to both healthy groups (p<0.05 vs H_IPC and H_FP). In diabetic groups that received the free cells, TNF-a levels were increased compared to healthy groups that received the same diet (free cells) (p<0.05), while ranged in similar levels between the diabetic groups (p>0.05). Furthermore, levels of IL-1b were higher in both diabetic groups compared to healthy animals (p<0.05). According to Wang-Fischer & Garyantes [34], increased levels of plasma cytokines and specifically TNF-a, IL-4, and IL-6 constitute strong evidence of the inflammatory state in the STZ-induced diabetic model. Of note, levels of IL-1b were significantly lower in diabetic rats that received the immobilized P. acidilactici ORE5 cells on Corinthian currants compared to diabetic rats that received the free cells (p<0.05). In our previous study [13], the dietary intervention with Corinthian currants in STZ-induced diabetic rats resulted in lower levels of IL-1b in diabetic rats compared to groups that received the control diet. Taken together these results, an anti-inflammatory potential of Corinthian currants is suggested, which is also present when, the rich in polyphenols, Corinthian currant was used as a functional food constituent and an immobilization carrier for presumptive probiotic cells. In line with this, a reduction in IL-1b was witnessed due to Lactobacillus rhamnosus EM1107 administration to STZ-induced diabetic rats (109 cfu/day, for 30 days), suggesting an immune-inflammatory efficacy of the strain [35].
At the beginning and at the end of the study, blood biochemical parameters, including TC and TAG were also determined. TC and TAG were neither affected by the condition of the disease nor by the dietary intervention and ranged at similar levels in all groups and at both timepoints (p>0.05). Similar findings are also reported elsewhere [16].

3.3. Fecal and Intestinal Microbiota Analysis

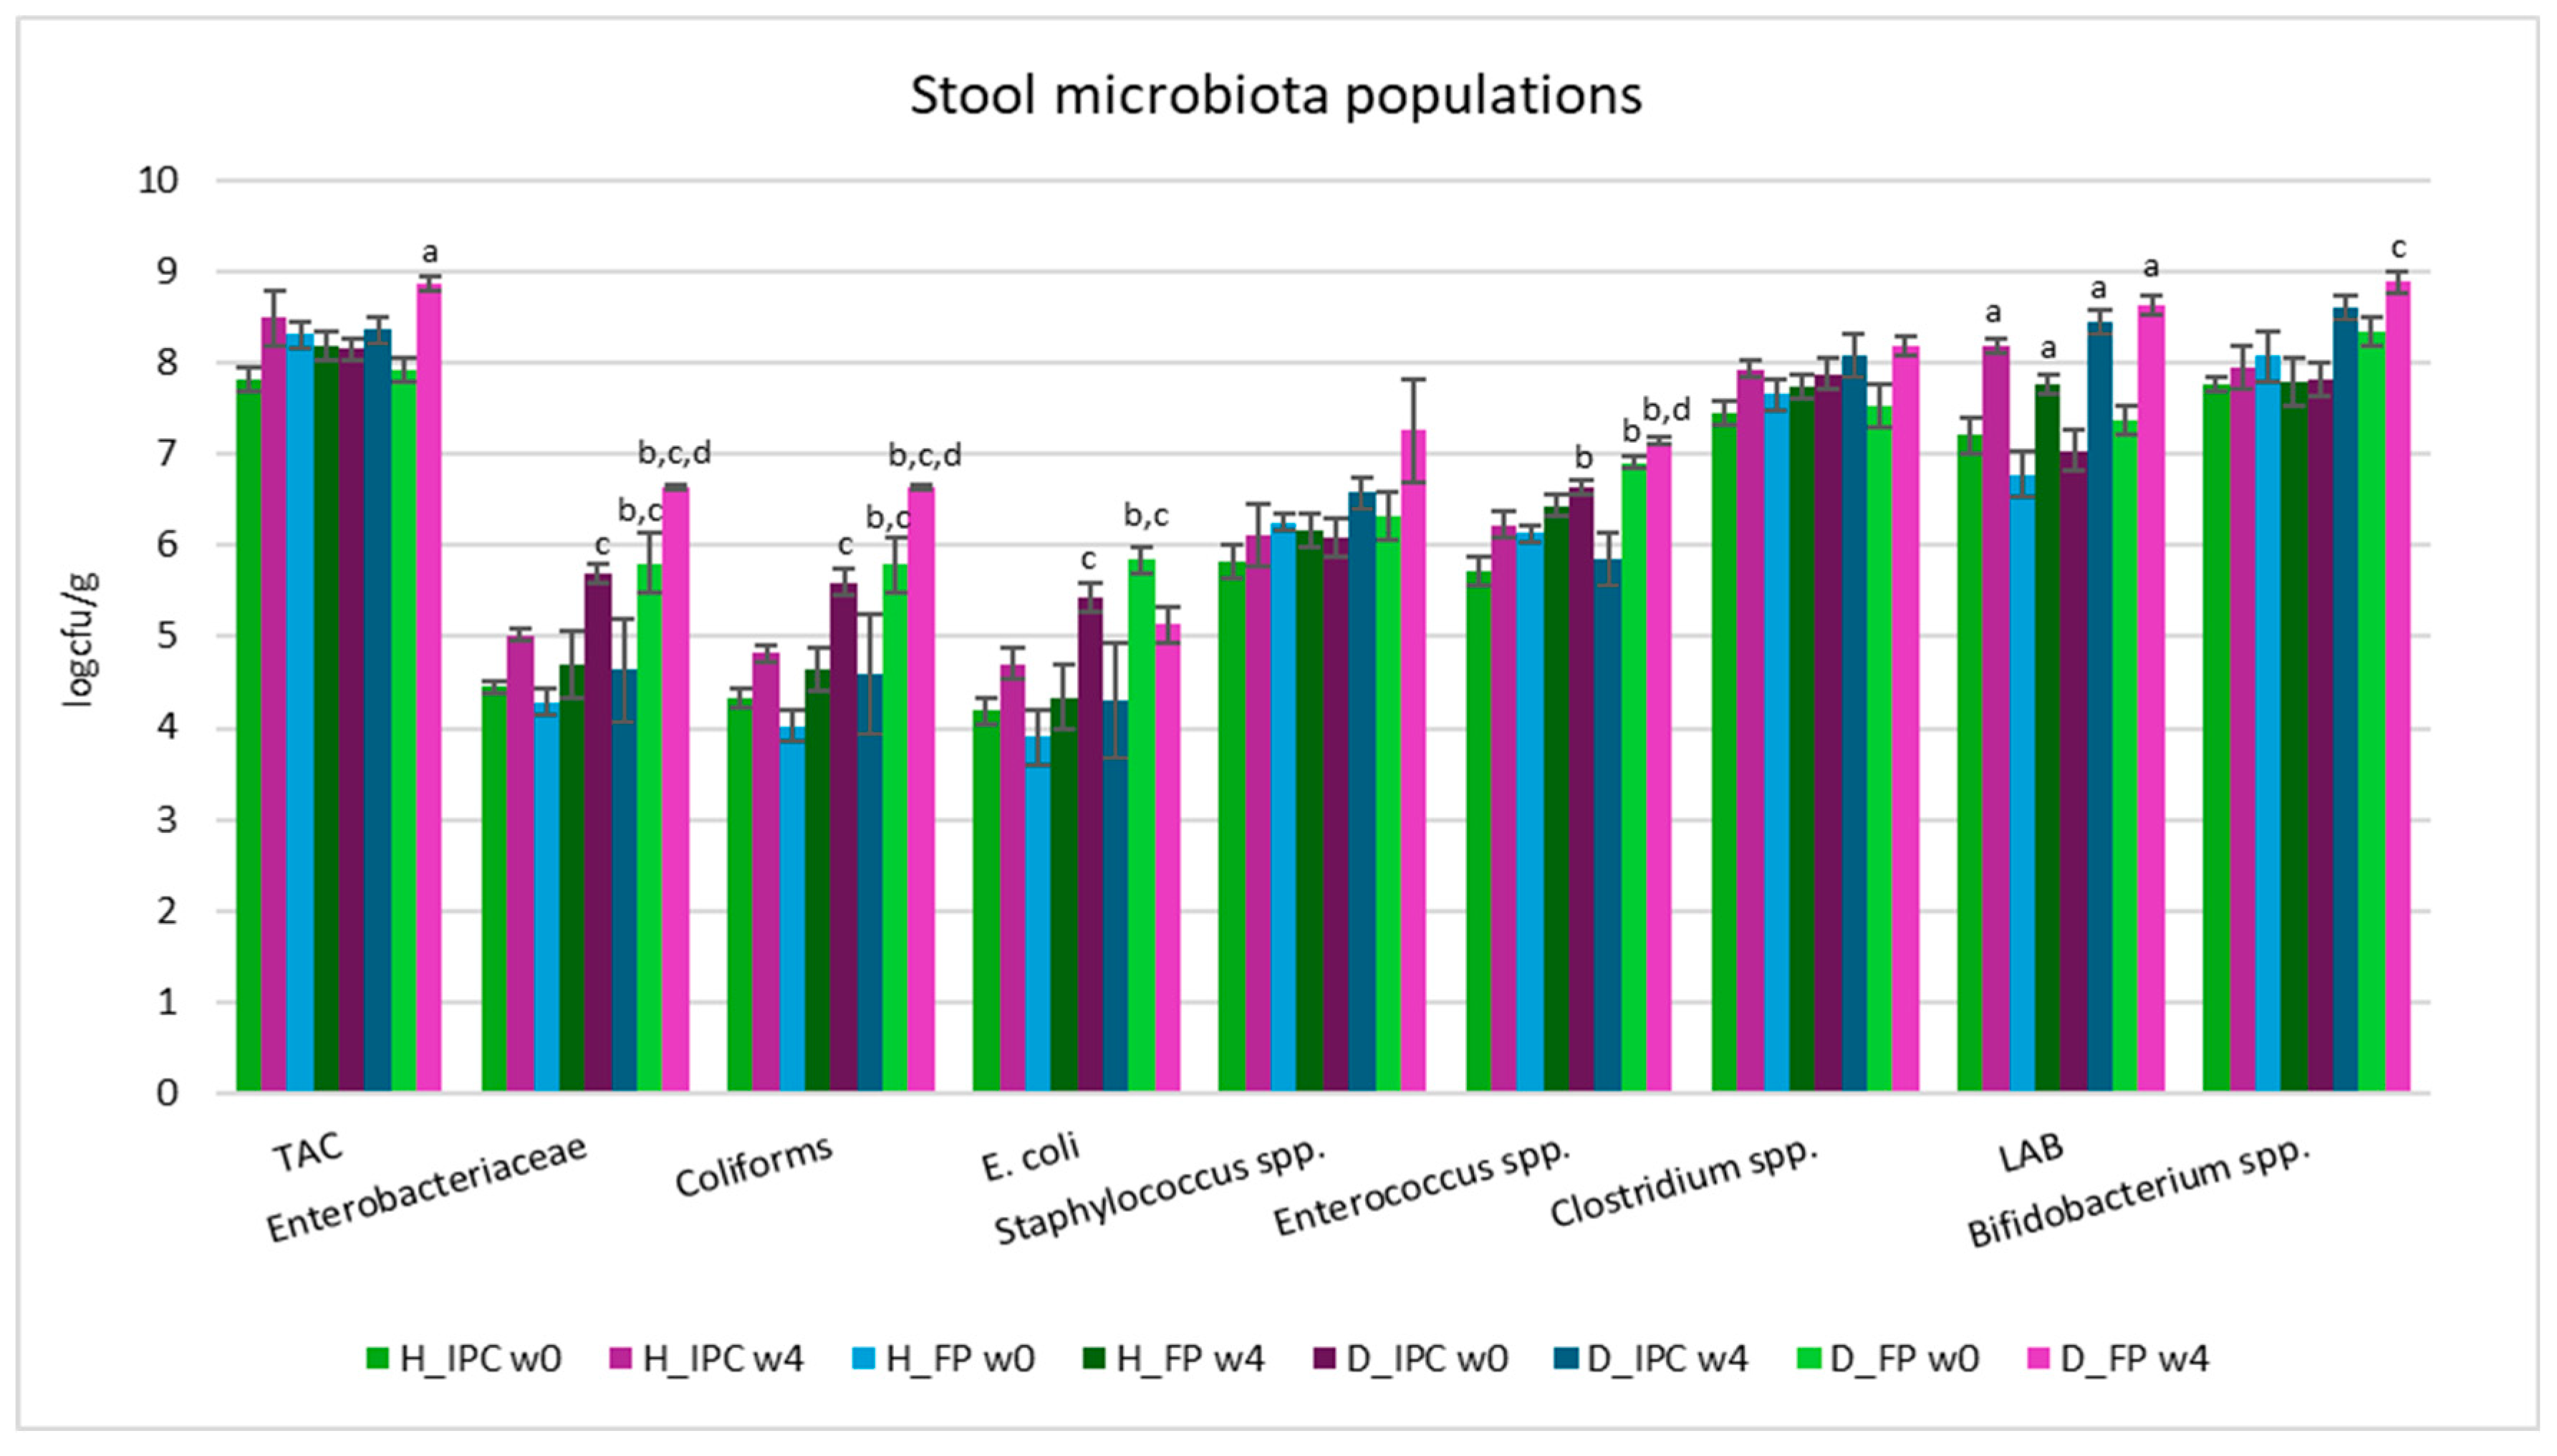
According to the results of the microbiological analyses, at baseline of the dietary intervention, significant differences in fecal microbial populations were observed between healthy and animal T1D models (Figure 3). Increased levels of Enterobacteriaceae, coliforms, E. coli, and Enterococcus spp. were observed in the feces of diabetic rats compared to the healthy animals. More specifically, at baseline, Enterobacteriaceae, coliform, and E. coli loads in H_IPC group were lower compared to D_FP animals (p<0.05) and in H_FP group they were lower than D_FP and D_IPC groups (p<0.05). In group H_IPC, Enterococcus spp. was decreased compared to D_IPC and D_FP animals (p<0.05). The changes in the composition of fecal populations following the injection of STZ could be potentially connected to the onset and progression of T1D, highlighting the interplay between gut dysbiosis (expressed as imbalanced microbiome and increased presence of pathogens) and intestinal inflammation, as also reported previously [36,37,38].
After 4 weeks of the dietary intervention with free P. acidilactici ORE5 cells, TAC levels were increased at D_FP group (p<0.05 compared to baseline values) and significantly increased levels (p<0.05) of Enterobacteriaceae and coliforms were recorded compared to healthy groups and to diabetic animals receiving the immobilized cells, where the corresponding values were similar to the levels of healthy animals (p>0.05). Additionally, in D_FP group, levels of Enterococcus spp. were further elevated after 4 weeks (p<0.05 compared to H_IPC and D_IPC), while in D_IPC group the levels were restored to the values of the healthy groups (p>0.05). Same results were observed in our previous study [13], where the dietary intervention with Corinthian currants in STZ-induced diabetic animals resulted in normalized Enterococcus spp. counts (to the levels of healthy groups), while diabetic groups that received the control diet presented increased loads. This result implies that the action could be ought to the components of Corinthian currants and their action is maintained when they are used as immobilization agent of presumptive probiotic cells.
Counts of Bifidobacterium spp. were significantly elevated in D_FP group compared to the H_FP group (p<0.05) after 4 weeks. LAB counts were elevated in all groups compared to baseline values (p<0.05), indicating the survival of the administrated strain (P. acidilactici ORE5). Of note, in our previous study, where Corinthian currants were administered to STZ-induced diabetic rats no such differences existed [13]. Given the differences in microbiota composition mapped in groups receiving the free or the immobilized cells, a possible synergistic effect of the functional food ingredient comprised of the presumptive probiotic strain and the Corinthian currants could be implied, but further experiments should be designed to validate such hypothesis.
In line with our results, the supplementation with the synbiotic formula “FloraGuard” (containing inulin and probiotics) in healthy rats for 8 weeks led to increased Lactobacillus and Bifidobacteria counts, while coliforms were significantly reduced [39]. In a similar study, significantly increased LAB counts after 30 days of supplementation with L. rhamnosus BSL and L. rhamnosus R23 were reported [40], while the administration of Lactobacillus kefiranofaciens M and Lactobacillus kefiri K (108 cfu/day for 8 weeks) in STZ-induced diabetic mice led to a balanced intestinal microbiota by enhancing the LAB and bifidobacteria presence and downregulating the opportunistic pathogen Clostridium perfringens counts [41].
Similar results were observed in the levels of the microbial populations in cecum tissue and cecal content samples (Table 2), where different microbial concentrations were recorded in all groups depending on the health status (p<0.05) and the dietary regimen (p<0.05).
Regarding the cecum tissue adherent populations, diabetic animals that received free P. acidilactici ORE5 cells exerted higher levels of Enterobacteriaceae, coliforms, E. coli, Staphylococcus spp., and Enterococcus spp. compared to both healthy groups (p<0.05) and to the diabetic animals that received the immobilized cells (p<0.05 for all populations except Staphylococcus spp.). On the other hand, these populations were rendered to normal values in D_IPC group, where less differences were observed compared to the healthy animals. Particularly, in D_IPC group, staphylococci were higher compared to H_IPC and H_FP groups (p<0.05), yet Enterobacteriaceae and E. coli where higher compared to H_FP group (p<0.05), but similar to H_IPC animals (p>0.05). No differences were noticed in coliforms in H_IPC and H_FP groups (p>0.05). Clostridium spp. was increased in D_FP group compared to the H_FP animals (p<0.05); however similar to H_IPC group (p>0.05). The highest levels of Bifidobacterium spp. were recorded in D_IPC group (p<0.05 compared to all groups) and LAB counts were higher in H_IPC group compared to H_FP animals (p<0.05), but similar between D_IPC and D_FP groups.
In the cecal content (portion of the intestinal lumen with the highest microbial populations associated with fecal microbiota), significant differences were observed between the T1D animals and the healthy groups and between groups that received the free or the immobilized cells (Table 2). Lower TAC levels were observed in both diabetic groups compared to the H_IPC group, TAC counts were elevated compared to H_FP group (p<0.05), and TAC of H_IPC animals was increased compared to the H_FP group (p<0.05). In diabetic rats that received the immobilized cells on Corinthian currants (D_IPC), higher levels of Enterobacteriaceae and E. coli were noted compared to the H_FP group (p<0.05), but they ranged in similar levels with the H_IPC and D_FP groups (p>0.05). Also, in D_IPC animals, higher levels of coliforms were encountered compared to both healthy groups (p<0.05), whilst Staphylococcus spp. was lower compared to the H_IPC group and higher than H_FP animals (p<0.05). Enterococcus spp. and LAB (of D_IPC group) were significantly reduced compared to H_IPC animals (p<0.05).
In STZ-induced diabetic rats that received the free cells, levels of Enterobacteriaceae and E. coli were higher compared to the H_FP group (p<0.05) but normalized to counts of the H_IPC group (p>0.05). Coliforms of D_FP animals were significantly elevated compared to the H_FP group and ranged in lower levels compared to D_IPC animals (p<0.05). In the same group (D_FP), staphylococci and enterococci counts were lower than H_IPC animals (p<0.05) and staphylococci levels were also higher than the H_FP group (p<0.05). Bifidobacterium spp. concentration was the lowest in D_FP group compared to all groups (p<0.05 vs. H_IPC, H_FP, and D_IPC) and LAB counts were higher in D_FP than H_FP and D_IPC groups (p<0.05).
In a similar study, the supplementation of Bacillus coagulans spores (109 spores/day for 30 days) either alone and/or with inulin in healthy rats resulted in an increase of LAB counts in feces, cecum tissue and in distal segments of gastrointestinal tract. Higher levels of Lactobacillus spp. were observed throughout the small intestine of the synbiotic and prebiotic fed rats compared to the probiotic fed and control diet groups and significantly decreased Enterobacteriaceae counts in cecum and colon tissue samples of the synbiotic, probiotic, and prebiotic supplemented groups were recorded [42], underlying the different response of the microbial populations in the intestine and the effect of the diet administrated.

3.4. Microbiome Alterations Using NGS of 16S rRNA Gene

Fecal microbiome abundances were determined by NGS based on the 16S rRNA gene sequence and analyzed using appropriate bioinformatic tools. The results of the NGS analysis revealed that different changes occurred in the microbiome composition of STZ-induced diabetic compared to the healthy rats and depending on the form of the cells that the animals received.
Firstly, α-diversity indices Shannon’s and Simpson’s were investigated (Figure 4). Simpson’s index was neither affected by the STZ-induced diabetes nor by the dietary intervention (p>0.05 between groups). At baseline, STZ-induced diabetic rats (D_FP group) showed a significant lower Shannon’s index value compared to both healthy groups (p<0.05 vs. H_IPC and H_FP), but such difference was not observed in D_IPC group (p>0.05 compared to D_FP and to H_IPC and H_FP). After 4 weeks, no significant differences were mapped (p>0.05). In accordance with our results, decreased α-diversity has been observed in STZ-induced diabetic rats (STZ dosage 60 mg/kg) [43] in alloxan-induced T1D rats [44] and in T1D children [45] and has been associated with gut dysbiosis that occurs in the disease [46]. However, in autoimmune T1D in humans, the causal relationship between the intestinal dysbiosis and the onset of the disease remains under investigation.
At phylum level and after 4 weeks of the dietary intervention, in the STZ-induced groups (D_IPC and D_FP), a significant increase of Actinobacteria abundance was observed compared to baseline and to healthy animals (p<0.05, Table 3). A significantly elevated percentage of Verrucomicrobia was also observed in diabetic animals that were administered with the immobilized cells on Corinthian currants (D_IPC) compared to healthy groups (p<0.05).
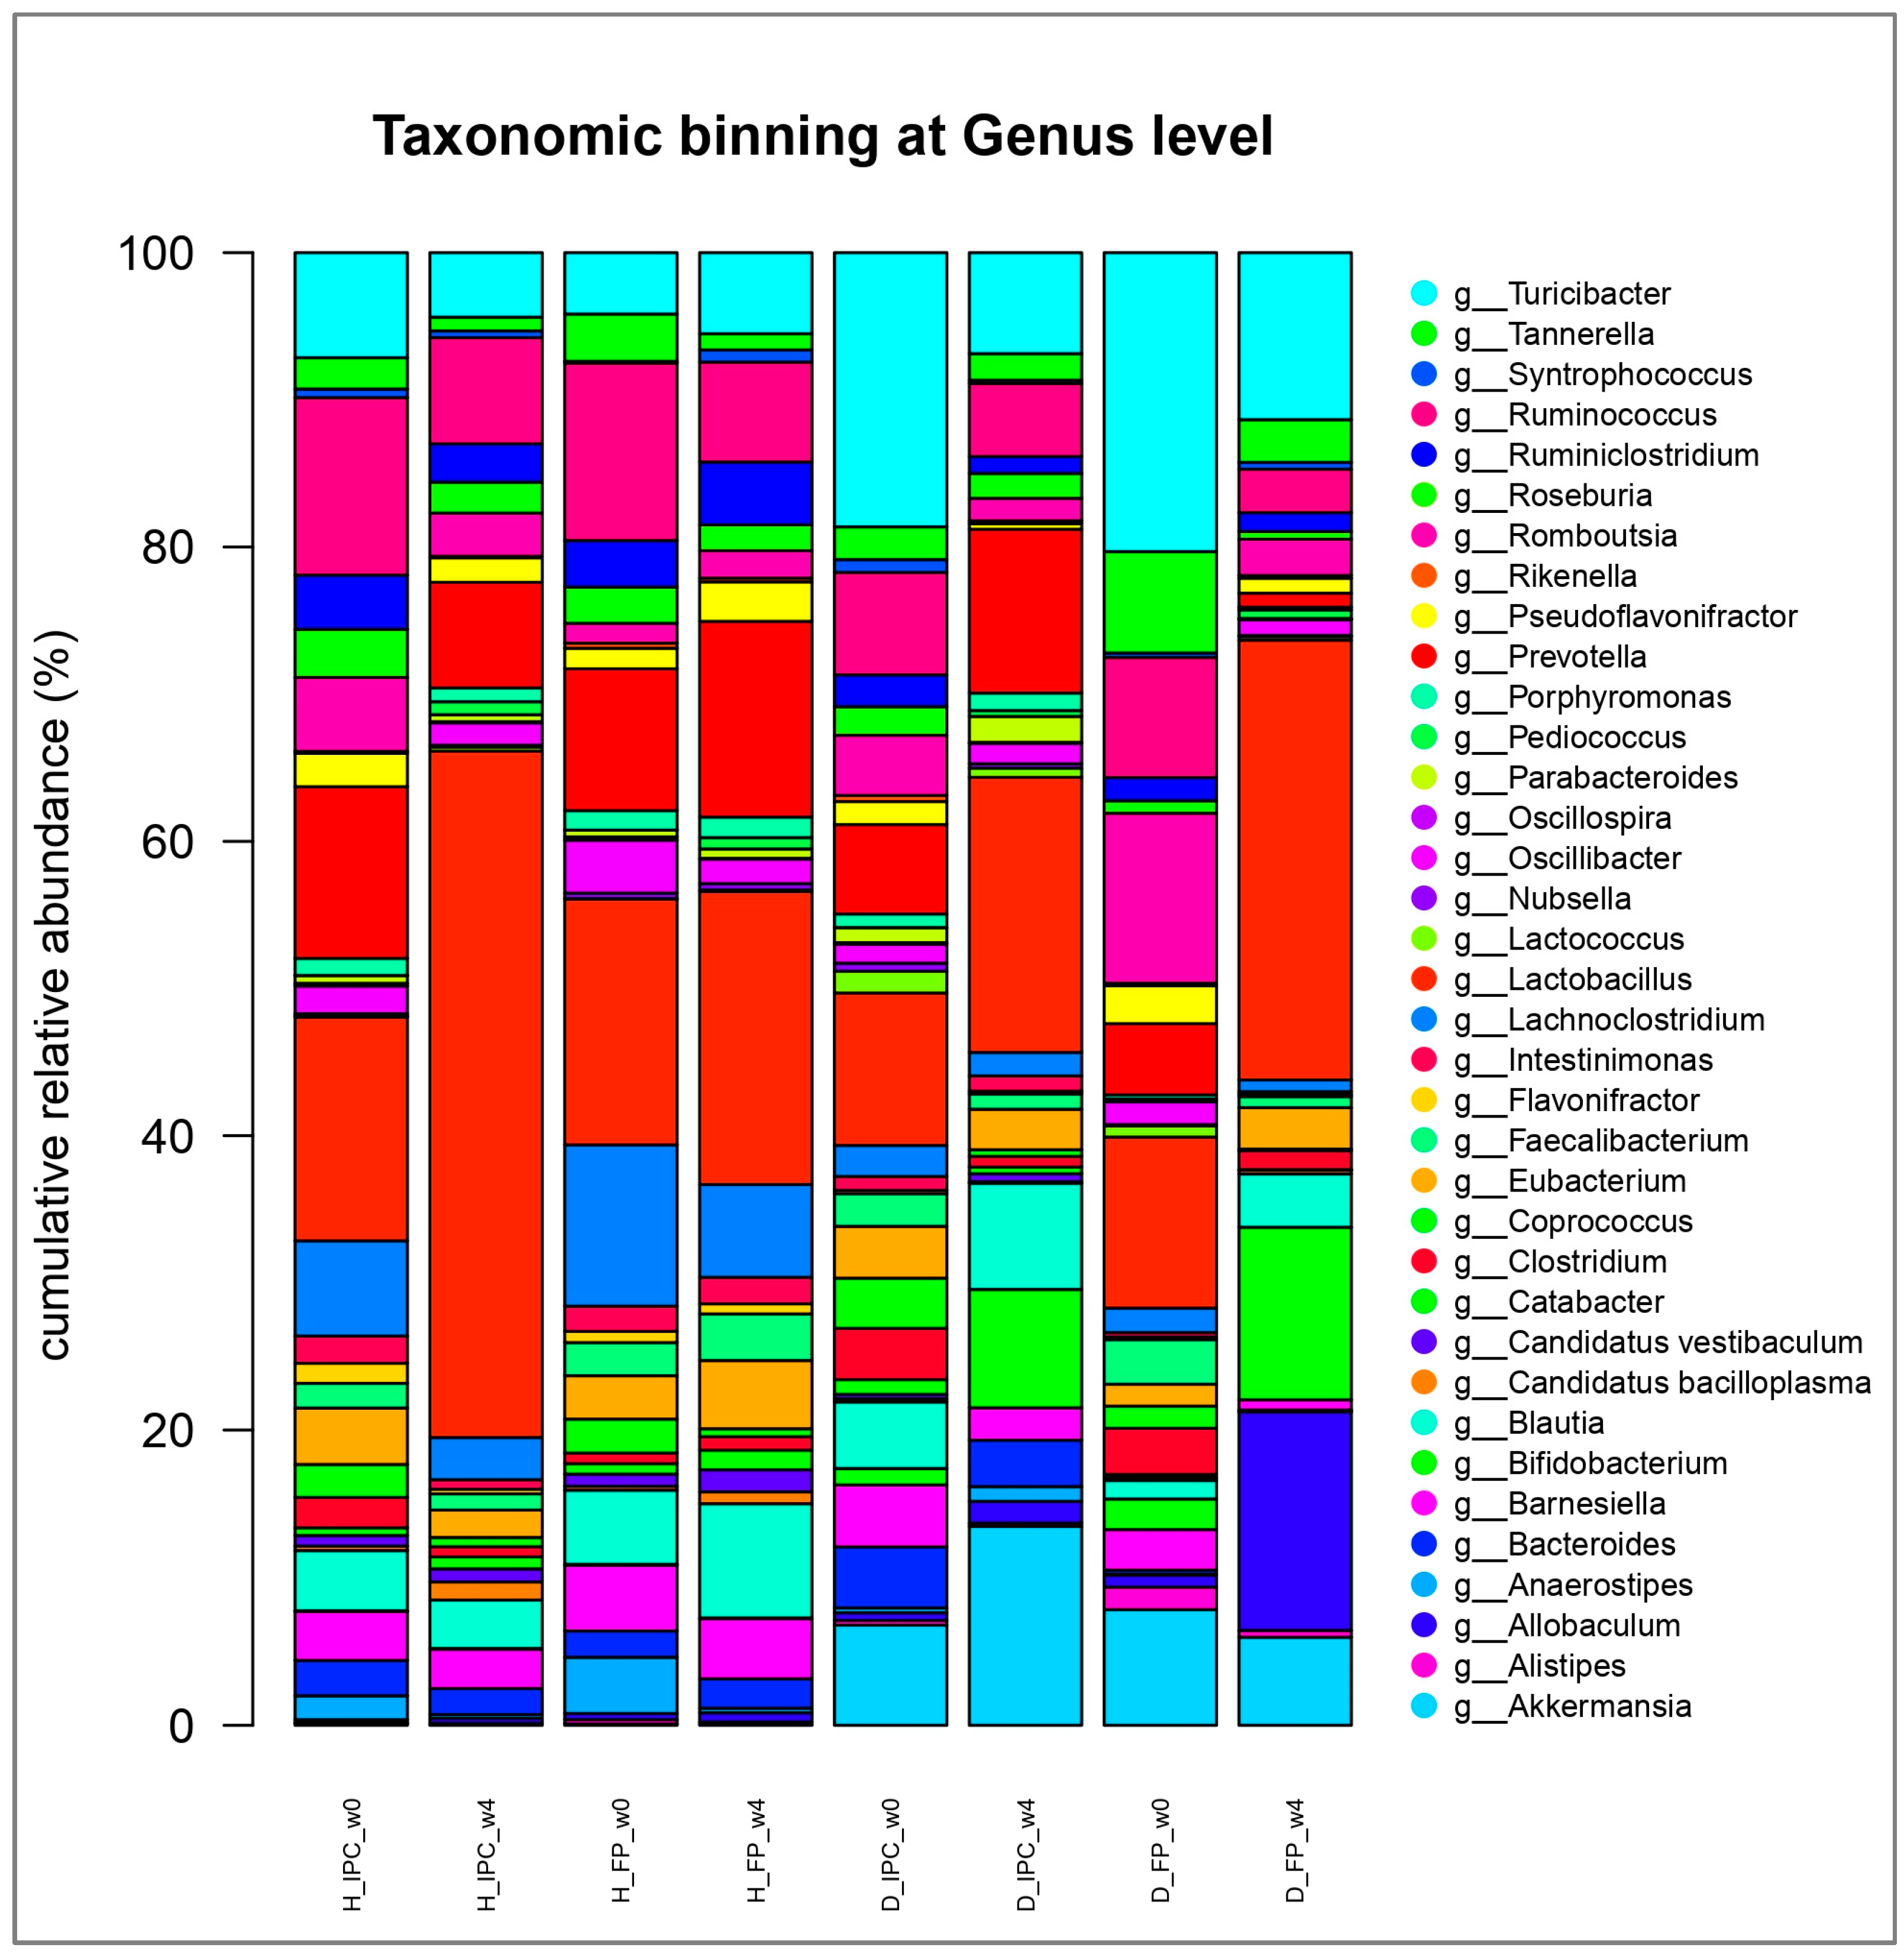
At genus level, several significant shifts were observed between the groups and over time. At baseline, decreased abundance of the genus Flavonifractor was detected in the diabetic groups (D_IPC and D_FP) compared to the healthy animals (H_IPC) (p<0.05, Figure 5). After 4 weeks, increased levels of Akkermansia and Bifidobacterium were noted in animals that received the immobilized P. acidilactici ORE5 cells on Corinthian currants compared to the healthy groups and to baseline values (p<0.05 vs. H_IPC, H_FP and vs. baseline). Likewise, increased abundance of Bifidobacterium (p<0.05 vs. H_IPC, H_FP and vs. baseline) and Allobaculum (p<0.05 vs. H_IPC, H_FP, D_IPC and vs. baseline) were documented in diabetic rats that followed the diet enriched with the free cells of the presumptive probiotic P. acidilactici ORE5 strain. Similarly increased abundance of Lactobacillus genus was noticed in healthy rats receiving the immobilized culture compared to baseline values (p<0.05). Finally, in all groups (diabetic or healthy that received free or immobilized cells), Pediococcus genus was increased (p<0.05) compared to the initial values.
In our previous study [13], the dietary intervention with Corinthian currants led to increased abundance of Candidatus bacilloplasma in healthy groups while no significant changes were reported in diabetic groups that received the Corinthian currants. Yet, this implies that changes mapped in this study are due to the dietary intervention with the functional ingredient or the free presumptive probiotic cells.
Decreased Flavonifractor abundance has been observed in T1D compared to healthy children, according to Liu et al. [47]. It was suggested that Flavonifractor plautii participates in regulating the blood glucose metabolism and it has been associated with attenuation of inflammation in adipose tissue [48], while its abundance in fecal samples could be proposed as a biomarker of health status [46,49]. This genus is mainly (or solely) comprised of F. plautii species member of Ruminococcaceae family, which are described as commensal members of human and animal gut microbiota [50].
Increased Pediococcus abundance in all groups (STZ-induced diabetic and healthy animals) can be attributed to the survival of the strain (in free or immobilized form), in agreement with the results of a dietary intervention to humans with a probiotic yogurt containing P. acidilactici GR-1 cells, where the relative abundance of the species was found significantly increased after 12 weeks [51]. Thus, it is not unreasonable to suggest that the increased abundance of the P. acidilactici species highlights the successful survival and possible colonization of our strain [52], as well as the effectiveness of the supplementation duration.
Allobaculum genus is currently comprising of 3 species (Allobaculum fili, Allobaculum mucilyticum, and Allobaculum stercoricanis) that are butyrate producers of the commensal microbiome [53]. The role of these bacteria in inflammatory processes [53] and aging [55] have been explored, while Allobaculum abundance can be altered after dietary interventions [56,57]. Increased Allobaculum abundance was observed in another study at which L. casei CCFM419 was administrated to STZ-induced high-fat diet-fed diabetic C57BL/6J mice [58]. The specific activity of these bacteria towards gut homeostasis and their potential as beneficial target microorganisms are yet to be clarified.
Akkermansia genus belongs to Verrucomicrobia phylum. In particular, the species Akkermansia muciniphila is characterized as a next-generation probiotic, while pasteurized cells were approved for use by the European Food Safety Authority, in 2021 [59]. The activity of this species has been examined vastly in obesity, Type-2 Diabetes Mellitus (T2D) and related diseases and is suggested that it improves metabolism (glucose homeostasis), alleviates inflammation, enhances intestinal barrier function, and maintains microbiome homeostasis [60]. Positive effects in autoimmunity and delayed diabetes development in non-obese diabetic mice (T1D) were reported after administration of A. muciniphila [61]. Specifically, A. muciniphila orally administered in STZ- induced T2D rats for 4 weeks resulted in significantly increased α-diversity and it was concluded that it improved liver function, reduced gluco-/lipo-toxicity, alleviated oxidative stress, suppressed inflammation, and normalized the gut microbiome, thereby ameliorating T2D [62]. Increased presence (compared to healthy groups) of this commensal and beneficial genus after 4-week of the dietary intervention with immobilized P. acidilactici ORE5 cells on Corinthian currants could be perceived as a positive result of our study.
Genera, such as Lactobacillus and Bifidobacterium, are among the most significant probiotic bacteria. They function by regulating the pH of the gut environment, improving barrier function through increased mucus production, releasing antimicrobial peptides, and altering the composition of the gut microbiota [63]. Probiotic lactobacilli can exert their effects to the host through several ways, including the antagonistic activity against pathogens, the amelioration of intestinal barrier function, immunoregulation and anti-inflammatory actions, anticancer/antiproliferative activity, and metabolic regulation [64], while it has to be noted that these activities are strain specific. The elevated Lactobacillus and Bifidobacterium abundances can be interpreted as a beneficial outcome of the study. Similar results with increased abundances of beneficial genera are reported in other works, as well, employing probiotics administrated in high-fat diet-fed mice [65,66] and in non-obese diabetic mice (T1D) [67].

3.5. Stool SCFAs and Lactate

The concentrations of fecal SCFAs (acetic, propionic, butyric, isobutyric, valeric, and isovaleric acids) and lactic acid were determined in the stool samples in the 4th week of the study (Table 4). According to the results, the concentration of lactic acid was increased (p<0.05) in diabetic animal models that received the immobilized P. acidilactici ORE5 cells, compared to H_IPC group. Moreover, acetic acid was significantly increased in both diabetic groups compared to the healthy animals (p<0.05 vs. H_IPC and H_FP). No significant differences between the different groups (p>0.05) were noted for the rest fatty acids.
Increased concentration of lactic acid could be due to the metabolism of the immobilized P. acidilactici ORE5 cells in the intestine. In a similar study, the consumption of probiotics (by STZ-induced mice for 8 weeks) led to increased fecal butyric acid, but other SCFAs where not affected [41]. Results from our previous work in STZ-induced T1D rats that followed dietary intervention with Corinthian currants revealed increased concentration of acetic acid in diabetic groups and also elevated amounts in diabetic groups that received the Corinthian currants (compared to diabetic groups that received the control diet) [13]. Elevated levels of acetic acid can be associated with the increased presence of Bifidobacterium and Akkermansia [68]. An increase in Bifidobacterium and Lactobacillus genera along with increased cecal and plasma acetate levels and improved glucose tolerance was associated with supplementation of Bifidobacterium animalis subsp. lactis GCL2505 in mice [65]. In a human trial, the consumption of probiotics contributed to glycemic control and led to increased fecal acetic acid [69].

3.6. Limitations, Future Perspectives and Summary of Findings

Several differences arise in our findings when compared with other similar studies; this could be due to the variation of the disease induction (alloxan/STZ models, dosage of the chemical reagent), age of the animals, different dosage of the functional culture (cfu/day), duration of the study, and microbiome/microbiota analysis protocols used (NGS, PCR, plate count, etc.) [44]. According to a recent review [70] concerning a meta-analysis of clinical trials examining the probiotics use in T1D patients, the fasting blood glucose was decreased after a probiotic intake, while no effects on other markers (serum hemoglobin A1c (HbA1c), C-peptide, and insulin) were observed. However, evidence is limited, and more trials have to be conducted to address how probiotic supplementation could be used as a complementary therapeutic strategy in T1D.
According to the authors’ knowledge, this is the first study that evaluates the effects of a dietary intervention with immobilized wild-type presumptive probiotics in T1D animal models. A limitation of the study was that T1D occurs naturally in humans as an autoimmune response and therefore the pathogenicity of the disease is different compared to STZ-induced diabetes in rat animal models. Hence, clinical trials in humans should be considered as a next research step to verify the effectiveness of functional ingredients. This approach will elucidate the underlying mechanisms of action, necessary for developing novel dietary patterns and therapeutic strategies for the prevention and management of diabetes-related complications and for improving metabolic health in T1D. Another limitation was that for the microbiome analysis based on the 16S rRNA gene duplicate samples were used; however significant differences were mapped in accordance with previous studies from our group [13,16]; yet more samples could help shaping more safe conclusions and reveal more alterations owing to the probiotic consumption.
To sum up, the first step of our study was the development of freeze-dried immobilized P. acidilactici ORE5 cells on Corinthian currants and immobilization was confirmed using electron microscopy. The strain exhibited high survival rate (96.39%) after storage at 4oC for 30 days. STZ-induced diabetic rats exhibited high counts of fecal enterococci, Enterobacteriaceae, coliforms and E. coli, decreased Flavonifractor abundance and lower a-diversity compared to healthy groups. After a 4 week- dietary intervention with free or immobilized cells, increased OTUs of Actinobacteria phylum and Bifidobacterium genus were detected in both diabetic groups, while fecal acetic acid was higher compared to healthy animals. The consumption of the functional ingredient (immobilized cells on Corinthian currants) by STZ-induced diabetic animals led to significantly lower levels of plasma IL-1b compared to diabetic groups that received a diet rich in free P. acidilactici ORE5 cells, a finding that suggested a possible anti-inflammatory action. Furthermore, lower or restored fecal and cecal enterococci, Enterobacteriaceae, coliforms, and E. coli were detected, and increased LAB counts along with elevated Verrucomicrobia and Akkermansia OTUs were recorded, while fecal lactic acid was increased in diabetic rats that received the immobilized cells. An increase in Lactobacillus genus was also observed in healthy animals that received the immobilized cells of P. acidilactici ORE5 on Corinthian currants and Pediococcus was increased in all groups, underlying the survival of the administrated strain.

4. Conclusions

The aim of our study was to explore possible microbiome alterations that can occur in a STZ-induced T1D animal model after a 4-week dietary intervention with free or immobilized cells of the presumptive probiotic P. acidilactici ORE5 strain on Corinthian currants. The effects on other parameters (biochemical and inflammatory factors) related to the disease were also examined. STZ-induced diabetes was characterized by gut dysbiosis and lower α-diversity in feces and intestinal microbiome. Administration of free or immobilized P. acidilactici ORE5 on Corinthian currants was associated with positive effects on the fecal, cecal tissue-adherent, and cecal microbiota, as well as in the microbiome abundances of selected genera and in fecal lactic acid concentration. Furthermore, lower levels of IL-1b in diabetic rats that received the functional food ingredients compared to groups that received the free cells were recorded, indicating a possible anti-inflammatory action. Overall, the results of the present research demonstrated that functional ingredients can ameliorate gut dysbiosis present in T1D and could be used to design dietary patterns, aiming at T1D management. However, well-designed clinical trials are necessary, in order to confirm the beneficial effects in humans. In this vein, possible synergistic effects of personalized dietary interventions with an anti-diabetic treatment should be also explored.

Author Contributions

Conceptualization, Vaios Karathanos, Amalia Yanni and Yiannis Kourkoutas; Data curation, Ioanna Prapa, Vasiliki Kompoura, Chrysa Pavlatou, Grigorios Nelios, Gregoria Mitropoulou, Nikolaos Kostomitsopoulos, Stavros Plessas, Eugenia Bezirtzoglou, Vaios Karathanos, Amalia Yanni and Yiannis Kourkoutas; Formal analysis, Ioanna Prapa, Vasiliki Kompoura, Chrysa Pavlatou, Grigorios Nelios, Gregoria Mitropoulou, Nikolaos Kostomitsopoulos, Stavros Plessas, Eugenia Bezirtzoglou, Vaios Karathanos, Amalia Yanni and Yiannis Kourkoutas; Funding acquisition, Yiannis Kourkoutas; Investigation, Ioanna Prapa, Vasiliki Kompoura, Chrysa Pavlatou, Grigorios Nelios and Gregoria Mitropoulou; Methodology, Ioanna Prapa, Grigorios Nelios, Gregoria Mitropoulou, Nikolaos Kostomitsopoulos, Stavros Plessas, Eugenia Bezirtzoglou, Vaios Karathanos, Amalia Yanni and Yiannis Kourkoutas; Project administration, Yiannis Kourkoutas; Resources, Nikolaos Kostomitsopoulos, Stavros Plessas, Eugenia Bezirtzoglou, Vaios Karathanos, Amalia Yanni and Yiannis Kourkoutas; Supervision, Amalia Yanni and Yiannis Kourkoutas; Validation, Gregoria Mitropoulou, Nikolaos Kostomitsopoulos, Stavros Plessas, Eugenia Bezirtzoglou, Vaios Karathanos, Amalia Yanni and Yiannis Kourkoutas; Visualization, Yiannis Kourkoutas; Writing – original draft, Ioanna Prapa; Writing – review & editing, Amalia Yanni and Yiannis Kourkoutas.

Funding

We acknowledge support of this work by the project “Infrastructure of Microbiome Applications in Food Systems-FOODBIOMES” (MIS 5047291), which is implemented under the Action “Regional Excellence in R&D Infrastructures,” funded by the Operational Programme “Competitiveness, Entrepreneurship and Innovation” (NSRF 2014– 2020) and co-financed by Greece and the EU (European Regional Development Fund).

Institutional Review Board Statement

Animal experimentation was reviewed and approved by the Veterinary Directorate of the Athens Prefecture (Ref. Number 272253/07-04-2021) and conducted in compliance with the European Directive 2010/63.

Data Availability Statement

The data presented in this study are available in the main article.

Acknowledgments

Authors would like to thank Katerina Govatsi (Laboratory of Electron Microscopy and Microanalysis, School of Natural Sciences, University of Patras) for the SEM images.

Conflicts of Interest

The authors declare no conflicts of interest.

References

  1. Toren, E.; Burnette, K. S.; Banerjee, R. R.; Hunter, C. S.; Tse, H. M. Partners in Crime: Beta-Cells and Autoimmune Responses Complicit in Type 1 Diabetes Pathogenesis. Frontiers in immunology. 2021, 12, 756548. [Google Scholar] [CrossRef]
  2. Del Chierico, F.; Rapini, N.; Deodati, A.; Matteoli, M.C.; Cianfarani, S.; Putignani, L. Pathophysiology of Type 1 Diabetes and Gut Microbiota Role. Int. J. Mol. Sci. 2022, 23, 14650. [Google Scholar] [CrossRef]
  3. Gregory, G.A.; Robinson, T.I.G.; Linklater, S.E.; Wang, F.; Colagiuri, S.; de Beaufort, C.; Donaghue, K.C.; Magliano, D.J.; Maniam, J.; Orchard, T.J.; et al. Global Incidence, Prevalence, and Mortality of Type 1 Diabetes in 2021 with Projection to 2040: A Modelling Study. Lancet Diabetes Endocrinol. 2022, 10, 741–760. [Google Scholar] [CrossRef]
  4. Ogrotis, I.; Koufakis, T.; Kotsa, K. Changes in the Global Epidemiology of Type 1 Diabetes in an Evolving Landscape of Environmental Factors: Causes, Challenges, and Opportunities. Medicina (Kaunas) 2023, 59, 668. [Google Scholar] [CrossRef]
  5. Zhou, H.; Sun, L.; Zhang, S.; Zhao, X.; Gang, X.; Wang, G. Evaluating the Causal Role of Gut Microbiota in Type 1 Diabetes and Its Possible Pathogenic Mechanisms. Front. Endocrinol. (Lausanne) 2020, 11. [Google Scholar] [CrossRef]
  6. Mishra, S.; Wang, S.; Nagpal, R.; Miller, B.; Singh, R.; Taraphder, S.; Yadav, H. Probiotics and Prebiotics for the Amelioration of Type 1 Diabetes: Present and Future Perspectives. Microorganisms 2019, 7, 67. [Google Scholar] [CrossRef]
  7. Gradisteanu Pircalabioru, G.; Corcionivoschi, N.; Gundogdu, O.; Chifiriuc, M.-C.; Marutescu, L.G.; Ispas, B.; Savu, O. Dysbiosis in the Development of Type I Diabetes and Associated Complications: From Mechanisms to Targeted Gut Microbes Manipulation Therapies. Int. J. Mol. Sci. 2021, 22, 2763. [Google Scholar] [CrossRef]
  8. Gomes, A.C.; Bueno, A.A.; de Souza, R.G.M.; Mota, J.F. Gut Microbiota, Probiotics and Diabetes. Nutr. J. 2014, 13. [Google Scholar] [CrossRef]
  9. Verduci, E.; Mameli, C.; Amatruda, M.; Petitti, A.; Vizzuso, S.; El Assadi, F.; Zuccotti, G.; Alabduljabbar, S.; Terranegra, A. Early Nutrition and Risk of Type 1 Diabetes: The Role of Gut Microbiota. Front. Nutr. 2020, 7. [Google Scholar] [CrossRef]
  10. Nelios, G.; Prapa, I.; Nikolaou, A.; Mitropoulou, G.; Yanni, A.E.; Kostomitsopoulos, N.; Kourkoutas, Y. Cereals and Fruits as Effective Delivery Vehicles of Lacticaseibacillus Rhamnosus through Gastrointestinal Transit. Appl. Sci. (Basel) 2023, 13, 8643. [Google Scholar] [CrossRef]
  11. Prapa, I.; Nikolaou, A.; Panas, P.; Tassou, C.; Kourkoutas, Y. Developing Stable Freeze-Dried Functional Ingredients Containing Wild-Type Presumptive Probiotic Strains for Food Systems. Appl. Sci. 2023, 13, 630. [Google Scholar] [CrossRef]
  12. Panagopoulou, E.A.; Chiou, A.; Nikolidaki, E.K.; Christea, M.; Karathanos, V.T. Corinthian Raisins (Vitis Vinifera L. , Var. Apyrena) Antioxidant and Sugar Content as Affected by the Drying Process: A 3-year Study. J. Sci. Food Agric. 2019, 99, 915–922. [Google Scholar] [CrossRef]
  13. Kompoura, V.; Prapa, I.; Vasilakopoulou, P.B.; Mitropoulou, G.; Nelios, G.; Balafas, E.; Kostomitsopoulos, N.; Chiou, A.; Karathanos, V.T.; Bezirtzoglou, E.; et al. Corinthian Currants Supplementation Restores Serum Polar Phenolic Compounds, Reduces IL-1beta, and Exerts Beneficial Effects on Gut Microbiota in the Streptozotocin-Induced Type-1 Diabetic Rat. Metabolites 2023, 13, 415. [Google Scholar] [CrossRef]
  14. Pavlatou, C.; Nikolaou, A.; Prapa, I.; Tegopoulos, K.; Plesssas, S.; Grigoriou, M.E.; Bezirtzoglou, E.; Kourkoutas, Y. Effect of Immobilized Pediococcus Acidilactici ORE5 Cells on Pistachio Nuts on the Functional Regulation of the Novel Katiki Domokou-Type Cheese Microbiome. Appl. Sci. (Basel) 2023, 13, 8047. [Google Scholar] [CrossRef]
  15. Faul, F.; Erdfelder, E.; Lang, A.-G.; Buchner, A. G*Power 3: A Flexible Statistical Power Analysis Program for the Social, Behavioral, and Biomedical Sciences. Behav. Res. Methods 2007, 39, 175–191. [Google Scholar] [CrossRef]
  16. Yanni, A.E.; Mitropoulou, G.; Prapa, I.; Agrogiannis, G.; Kostomitsopoulos, N.; Bezirtzoglou, E.; Kourkoutas, Y.; Karathanos, V.T. Functional Modulation of Gut Microbiota in Diabetic Rats Following Dietary Intervention with Pistachio Nuts (Pistacia Vera L.). Metabol. Open 2020, 7, 100040. [Google Scholar] [CrossRef]
  17. Yayla, M.; Department of Pharmacology, Kafkas University Faculty of Medicine, Kars, Turkey; Binnetoglu, D. ; Department of Pharmacology, Kafkas University Faculty of Medicine, Kars, Turkey Experimental Approaches to Diabetes Mellitus. Eurasian J. Med. 2023, 54, S145–S153. [Google Scholar] [CrossRef]
  18. Lagkouvardos, I.; Fischer, S.; Kumar, N.; Clavel, T. Rhea: A Transparent and Modular R Pipeline for Microbial Profiling Based on 16S rRNA Gene Amplicons. PeerJ 2017, 5, e2836. [Google Scholar] [CrossRef]
  19. Prapa, I.; Yanni, A.E.; Nikolaou, A.; Kostomitsopoulos, N.; Kalogeropoulos, N.; Bezirtzoglou, E.; Karathanos, V.T.; Kourkoutas, Y. Dietary Pistachio (Pistacia vera L.) Beneficially Alters Fatty Acid Profiles in Streptozotocin-Induced Diabetic Rat. Appl. Sci. 2022, 12, 4606. [Google Scholar] [CrossRef]
  20. Huda-Faujan, N.; Abdulamir, A.S.; Fatimah, A.B.; Anas, O.M.; Shuhaimi, M.; Yazid, A.M.; Loong, Y.Y. The Impact of the Level of the Intestinal Short Chain Fatty Acids in Inflammatory Bowel Disease Patients versus Healthy Subjects. Open Biochem. J. 2010, 4, 53–58. [Google Scholar] [CrossRef]
  21. Dimitrellou, D.; Kandylis, P.; Kourkoutas, Y. Effect of Cooling Rate, Freeze-Drying, and Storage on Survival of Free and Immobilized Lactobacillus Casei ATCC 393. Lebenson. Wiss. Technol. 2016, 69, 468–473. [Google Scholar] [CrossRef]
  22. Nikolaou, A.; Sgouros, G.; Mitropoulou, G.; Santarmaki, V.; Kourkoutas, Y. Freeze-Dried Immobilized Kefir Culture in Low Alcohol Winemaking. Foods 2020, 9, 115. [Google Scholar] [CrossRef] [PubMed]
  23. Hill, C.; Guarner, F.; Reid, G.; Gibson, G.R.; Merenstein, D.J.; Pot, B.; Morelli, L.; Canani, R.B.; Flint, H.J.; Salminen, S.; et al. Expert Consensus Document. The International Scientific Association for Probiotics and Prebiotics Consensus Statement on the Scope and Appropriate Use of the Term Probiotic: Expert Consensus Document. Nat. Rev. Gastroenterol. Hepatol. 2014, 11, 506–514. [Google Scholar] [CrossRef]
  24. Wang, G.; Li, X.; Zhao, J.; Zhang, H.; Chen, W. Lactobacillus casei CCFM419 attenuates type 2 diabetes via a gut microbiota dependent mechanism. Food Funct. 2017, 18, 3814. [Google Scholar] [CrossRef]
  25. Zhang, Q.; Guo, W. L.; Chen, G. M.; Qian, M.; Han, J. Z.; Lv, X. C.; Chen, L. J.; Rao, P. F.; Ai, L. Z.; Ni, L. Pediococcus acidilactici FZU106 alleviates high-fat diet-induced lipid metabolism disorder in association with the modulation of intestinal microbiota in hyperlipidemic rats. Curr Res Food Sci. 2022, 5, 775–788. [Google Scholar] [CrossRef]
  26. Mitropoulou, G.; Nedovic, V.; Goyal, A.; Kourkoutas, Y. Immobilization Technologies in Probiotic Food Production. J. Nutr. Metab. 2013, 2013, 716861. [Google Scholar] [CrossRef]
  27. Mathias Akinlade, O.; Victor Owoyele, B.; Olufemi Soladoye, A. Streptozotocin-Induced Type 1 and 2 Diabetes in Rodents: A Model for Studying Diabetic Cardiac Autonomic Neuropathy. Afr. Health Sci. 2021, 21, 719–727. [Google Scholar] [CrossRef]
  28. Singer, J.; Allen, J.; Morris, J.; Gold, A. Management of Eating Disorders in Patients with Type 1 (Insulin Dependent) Diabetes. In: Morris, J., McKinlay, A. (eds) Multidisciplinary Management of Eating Disorders. Springer, Cham. 2018, 1-256. [CrossRef]
  29. Pongrac Barlovic, D.; Harjutsalo, V.; Groop, PH. Exercise and nutrition in type 1 diabetes: Insights from the FinnDiane cohort. Front Endocrinol (Lausanne). 2022, 13, 1064185. [Google Scholar] [CrossRef] [PubMed]
  30. Albuquerque, R.C.M.F.; Brandão, A.B.P.; De Abreu, I.C.M.E.; Ferreira, F.G.; Santos, L.B.; Moreira, L.N.; Taddei, C.R.; Aimbire, F.; Cunha, T.S. Saccharomyces Boulardii Tht 500101 Changes Gut Microbiota and Ameliorates Hyperglycaemia, Dyslipidaemia, and Liver Inflammation in Streptozotocin-Diabetic Mice. Benef. Microbes 2019, 10, 901–912. [Google Scholar] [CrossRef]
  31. Henschel, A.M.; Cabrera, S.M.; Kaldunski, M.L.; Jia, S.; Geoffrey, R.; Roethle, M.F.; Lam, V.; Chen, Y.-G.; Wang, X.; Salzman, N.H.; et al. Modulation of the Diet and Gastrointestinal Microbiota Normalizes Systemic Inflammation and β-Cell Chemokine Expression Associated with Autoimmune Diabetes Susceptibility. PLoS One 2018, 13, e0190351. [Google Scholar] [CrossRef]
  32. Calabrese, C.M.; Valentini, A.; Calabrese, G. Gut Microbiota and Type 1 Diabetes Mellitus: The Effect of Mediterranean Diet. Front. Nutr. 2021, 7. [Google Scholar] [CrossRef]
  33. Holt, R.I.G.; DeVries, J.H.; Hess-Fischl, A.; Hirsch, I.B.; Kirkman, M.S.; Klupa, T.; Ludwig, B.; Nørgaard, K.; Pettus, J.; Renard, E.; et al. The Management of Type 1 Diabetes in Adults. A Consensus Report by the American Diabetes Association (ADA) and the European Association for the Study of Diabetes (EASD). Diabetologia 2021, 64, 2609–2652. [Google Scholar] [CrossRef]
  34. Wang-Fischer, Y.; Garyantes, T. Improving the Reliability and Utility of Streptozotocin-Induced Rat Diabetic Model. J. Diabetes Res. 2018, 2018, 1–14. [Google Scholar] [CrossRef]
  35. Silva, D.N.A.; Cruz, N.T.S.; Martins, A.A.; Silva, R.C.M.; Almeida, H.C.; Costa, H.E.S.; Santos, K.M.O.; Vieira, B.R.; Sousa, F.B.; Junior, F.S.; et al. Probiotic Lactobacillus Rhamnosus EM1107 Prevents Hyperglycemia, Alveolar Bone Loss, and Inflammation in a Rat Model of Diabetes and Periodontitis. J. Periodontol. 2023, 94, 376–388. [Google Scholar] [CrossRef]
  36. Bibbò, S.; Dore, M.P.; Pes, G.M.; Delitala, G.; Delitala, A.P. Is There a Role for Gut Microbiota in Type 1 Diabetes Pathogenesis? Ann. Med. 2017, 49, 11–22. [Google Scholar] [CrossRef] [PubMed]
  37. Siljander, H.; Honkanen, J.; Knip, M. Microbiome and Type 1 Diabetes. EBioMedicine 2019, 46, 512–521. [Google Scholar] [CrossRef]
  38. Bielka, W.; Przezak, A.; Pawlik, A. The Role of the Gut Microbiota in the Pathogenesis of Diabetes. Int. J. Mol. Sci. 2022, 23, 480. [Google Scholar] [CrossRef]
  39. Yang, S.-C. Effect of Synbiotics on Intestinal Microflora and Digestive Enzyme Activities in Rats. World J. Gastroenterol. 2005, 11, 7413. [Google Scholar] [CrossRef]
  40. Farida, E.; Nuraida, L.; Giriwono, P.E.; Jenie, B.S.L. Lactobacillus Rhamnosus Reduces Blood Glucose Level through Downregulation of Gluconeogenesis Gene Expression in Streptozotocin-Induced Diabetic Rats. Int. J. Food Sci. 2020, 2020, 1–12. [Google Scholar] [CrossRef]
  41. Wei, S.-H.; Chen, Y.-P.; Chen, M.-J. Selecting Probiotics with the Abilities of Enhancing GLP-1 to Mitigate the Progression of Type 1 Diabetes in Vitro and in Vivo. J. Funct. Foods 2015, 18, 473–486. [Google Scholar] [CrossRef]
  42. Abhari, K.; Shekarforoush, S.S.; Sajedianfard, J.; Hosseinzadeh, S.; Nazifi, S. The Effects of Probiotic, Prebiotic and Synbiotic Diets Containing Bacillus Coagulans and Inulin on Rat Intestinal Microbiota. Iran. J. Vet. Res. 2015, 16, 267–273. [Google Scholar] [PubMed]
  43. Patterson, E.; Marques, T.M.; O’Sullivan, O.; Fitzgerald, P.; Fitzgerald, G.F.; Cotter, P.D.; Dinan, T.G.; Cryan, J.F.; Stanton, C.; Ross, R.P. Streptozotocin-Induced Type-1-Diabetes Disease Onset in Sprague–Dawley Rats Is Associated with an Altered Intestinal Microbiota Composition and Decreased Diversity. Microbiology 2015, 161, 182–193. [Google Scholar] [CrossRef]
  44. Sohail, M.U.; Shabbir, M.Z.; Steiner, J.M.; Ahmad, S.; Kamran, Z.; Anwar, H.; Hussain, G.; Shaukat, A.; Ullah, M.I.; Suchodolski, J.S. Molecular Analysis of the Gut Microbiome of Diabetic Rats Supplemented with Prebiotic, Probiotic, and Synbiotic Foods. Int. J. Diabetes Dev. Ctries 2017, 37, 419–425. [Google Scholar] [CrossRef]
  45. Leiva-Gea, I.; Sánchez-Alcoholado, L.; Martín-Tejedor, B.; Castellano-Castillo, D.; Moreno-Indias, I.; Urda-Cardona, A.; Tinahones, F.J.; Fernández-García, J.C.; Queipo-Ortuño, M.I. Gut Microbiota Differs in Composition and Functionality between Children with Type 1 Diabetes and MODY2 and Healthy Control Subjects: A Case-Control Study. Diabetes Care 2018, 41, 2385–2395. [Google Scholar] [CrossRef] [PubMed]
  46. Mokhtari, P.; Metos, J.; Anandh Babu, P.V. Impact of Type 1 Diabetes on the Composition and Functional Potential of Gut Microbiome in Children and Adolescents: Possible Mechanisms, Current Knowledge, and Challenges. Gut Microbes 2021, 13. [Google Scholar] [CrossRef]
  47. Liu, X.; Cheng, Y.-W.; Shao, L.; Sun, S.-H.; Wu, J.; Song, Q.-H.; Zou, H.-S.; Ling, Z.-X. Gut Microbiota Dysbiosis in Chinese Children with Type 1 Diabetes Mellitus: An Observational Study. World J. Gastroenterol. 2021, 27, 2394–2414. [Google Scholar] [CrossRef]
  48. Mikami, A.; Ogita, T.; Namai, F.; Shigemori, S.; Sato, T.; Shimosato, T. Oral Administration of Flavonifractor Plautii Attenuates Inflammatory Responses in Obese Adipose Tissue. Mol. Biol. Rep. 2020, 47, 6717–6725. [Google Scholar] [CrossRef]
  49. Borgo, F.; Garbossa, S.; Riva, A.; Severgnini, M.; Luigiano, C.; Benetti, A.; Pontiroli, A.E.; Morace, G.; Borghi, E. Body Mass Index and Sex Affect Diverse Microbial Niches within the Gut. Front. Microbiol. 2018, 9. [Google Scholar] [CrossRef]
  50. Alauzet, C.; Lozniewski, A.; Cailliez-Grimal, C. Flavonifractor. Bergey’s Manual of Systematics of Archaea and Bacteria, 2023; 1–11.
  51. Feng, P.; Yang, J.; Zhao, S.; Ling, Z.; Han, R.; Wu, Y.; Salama, E.-S.; Kakade, A.; Khan, A.; Jin, W.; et al. Human Supplementation with Pediococcus Acidilactici GR-1 Decreases Heavy Metals Levels through Modifying the Gut Microbiota and Metabolome. NPJ Biofilms Microbiomes 2022, 8. [Google Scholar] [CrossRef]
  52. Ding, F.; Zhou, N.; Luo, Y.; Wang, T.; Li, W.; Qiao, F.; Du, Z.; Zhang, M. Probiotic Pediococcus Pentosaceus Restored Gossypol-Induced Intestinal Barrier Injury by Increasing Propionate Content in Nile Tilapia. J. Anim. Sci. Biotechnol. 2024, 15. [Google Scholar] [CrossRef]
  53. van Muijlwijk, G.H.; Rice, T.A.; Flavell, R.A.; Palm, N.W.; de Zoete, M.R. Allobaculum Mucilyticum Sp. Nov. and Allobaculum Fili Sp. Nov., Isolated from the Human Intestinal Tract. Int. J. Syst. Evol. Microbiol. [CrossRef]
  54. Cox, L.M.; Yamanishi, S.; Sohn, J.; Alekseyenko, A.V.; Leung, J.M.; Cho, I.; Kim, S.G.; Li, H.; Gao, Z.; Mahana, D.; et al. Altering the Intestinal Microbiota during a Critical Developmental Window Has Lasting Metabolic Consequences. Cell 2014, 158, 705–721. [Google Scholar] [CrossRef] [PubMed]
  55. Thevaranjan, N.; Puchta, A.; Schulz, C.; Naidoo, A.; Szamosi, J.C.; Verschoor, C.P.; Loukov, D.; Schenck, L.P.; Jury, J.; Foley, K.P.; et al. Age-Associated Microbial Dysbiosis Promotes Intestinal Permeability, Systemic Inflammation, and Macrophage Dysfunction. Cell Host Microbe 2017, 21, 455–466. [Google Scholar] [CrossRef] [PubMed]
  56. Liu, S.; Qin, P.; Wang, J. High-Fat Diet Alters the Intestinal Microbiota in Streptozotocin-Induced Type 2 Diabetic Mice. Microorganisms 2019, 7, 176. [Google Scholar] [CrossRef] [PubMed]
  57. Thomaz, F.S.; Altemani, F.; Panchal, S.K.; Worrall, S.; Dekker Nitert, M. The Influence of Wasabi on the Gut Microbiota of High-Carbohydrate, High-Fat Diet-Induced Hypertensive Wistar Rats. J. Hum. Hypertens. 2021, 35, 170–180. [Google Scholar] [CrossRef] [PubMed]
  58. Li, X.; Wang, E.; Yin, B.; Fang, D.; Chen, P.; Wang, G.; Zhao, J.; Zhang, H.; Chen, W. Effects of Lactobacillus Casei CCFM419 on Insulin Resistance and Gut Microbiota in Type 2 Diabetic Mice. Benef. Microbes 2017, 8, 421–432. [Google Scholar] [CrossRef] [PubMed]
  59. EFSA Panel on Nutrition, Novel Foods and Food Allergens (NDA); Turck, D. ; Bohn, T.; Castenmiller, J.; De Henauw, S.; Hirsch-Ernst, K.I.; Maciuk, A.; Mangelsdorf, I.; McArdle, H.J.; Naska, A.; et al. Safety of Pasteurised Akkermansia Muciniphila as a Novel Food Pursuant to Regulation (EU) 2015/2283. EFSA J. 2021, 19. [Google Scholar] [CrossRef]
  60. Li, J.; Yang, G.; Zhang, Q.; Liu, Z.; Jiang, X.; Xin, Y. Function of Akkermansia Muciniphila in Type 2 Diabetes and Related Diseases. Front. Microbiol. 2023, 14. [Google Scholar] [CrossRef]
  61. Hänninen, A.; Toivonen, R.; Pöysti, S.; Belzer, C.; Plovier, H.; Ouwerkerk, J.P.; Emani, R.; Cani, P.D.; De Vos, W.M. Akkermansia Muciniphila Induces Gut Microbiota Remodelling and Controls Islet Autoimmunity in NOD Mice. Gut 2018, 67, 1445–1453. [Google Scholar] [CrossRef]
  62. Zhang, L.; Qin, Q.; Liu, M.; Zhang, X.; He, F.; Wang, G. Akkermansia Muciniphila Can Reduce the Damage of Gluco/Lipotoxicity, Oxidative Stress and Inflammation, and Normalize Intestine Microbiota in Streptozotocin-Induced Diabetic Rats. Pathog. Dis. 2018, 76. [Google Scholar] [CrossRef]
  63. Dempsey, E.; Corr, S.C. Lactobacillus Spp. for Gastrointestinal Health: Current and Future Perspectives. Front. Immunol. 2022, 13. [Google Scholar] [CrossRef]
  64. Huang, R.; Wu, F.; Zhou, Q.; Wei, W.; Yue, J.; Xiao, B.; Luo, Z. Lactobacillus and Intestinal Diseases: Mechanisms of Action and Clinical Applications. Microbiol. Res. 2022, 260, 127019. [Google Scholar] [CrossRef] [PubMed]
  65. Aoki, R.; Kamikado, K.; Suda, W.; Takii, H.; Mikami, Y.; Suganuma, N.; Hattori, M.; Koga, Y. A Proliferative Probiotic Bifidobacterium Strain in the Gut Ameliorates Progression of Metabolic Disorders via Microbiota Modulation and Acetate Elevation. Sci. Rep. 2017, 7. [Google Scholar] [CrossRef]
  66. Li, H.; Liu, F.; Lu, J.; Shi, J.; Guan, J.; Yan, F.; Li, B.; Huo, G. Probiotic Mixture of Lactobacillus Plantarum Strains Improves Lipid Metabolism and Gut Microbiota Structure in High Fat Diet-Fed Mice. Front. Microbiol. 2020, 11. [Google Scholar] [CrossRef]
  67. Dolpady, J.; Sorini, C.; Di Pietro, C.; Cosorich, I.; Ferrarese, R.; Saita, D.; Clementi, M.; Canducci, F.; Falcone, M. Oral Probiotic VSL#3 Prevents Autoimmune Diabetes by Modulating Microbiota and Promoting Indoleamine 2,3-Dioxygenase-Enriched Tolerogenic Intestinal Environment. J. Diabetes Res. 2016, 2016, 1–12. [Google Scholar] [CrossRef]
  68. Markowiak-Kopeć, P.; Śliżewska, K. The Effect of Probiotics on the Production of Short-Chain Fatty Acids by Human Intestinal Microbiome. Nutrients 2020, 12, 1107. [Google Scholar] [CrossRef] [PubMed]
  69. Tonucci, L.B.; Olbrich dos Santos, K.M.; Licursi de Oliveira, L.; Rocha Ribeiro, S.M.; Duarte Martino, H.S. Clinical Application of Probiotics in Type 2 Diabetes Mellitus: A Randomized, Double-Blind, Placebo-Controlled Study. Clin. Nutr. 2017, 36, 85–92. [Google Scholar] [CrossRef]
  70. Moravejolahkami, A.R.; Shakibaei, M.; Fairley, A.M.; Sharma, M. Probiotics, Prebiotics, and Synbiotics in Type 1 Diabetes Mellitus: A Systematic Review and Meta-analysis of Clinical Trials. Diabetes. Metab. Res. Rev. 2024, 40. [Google Scholar] [CrossRef]
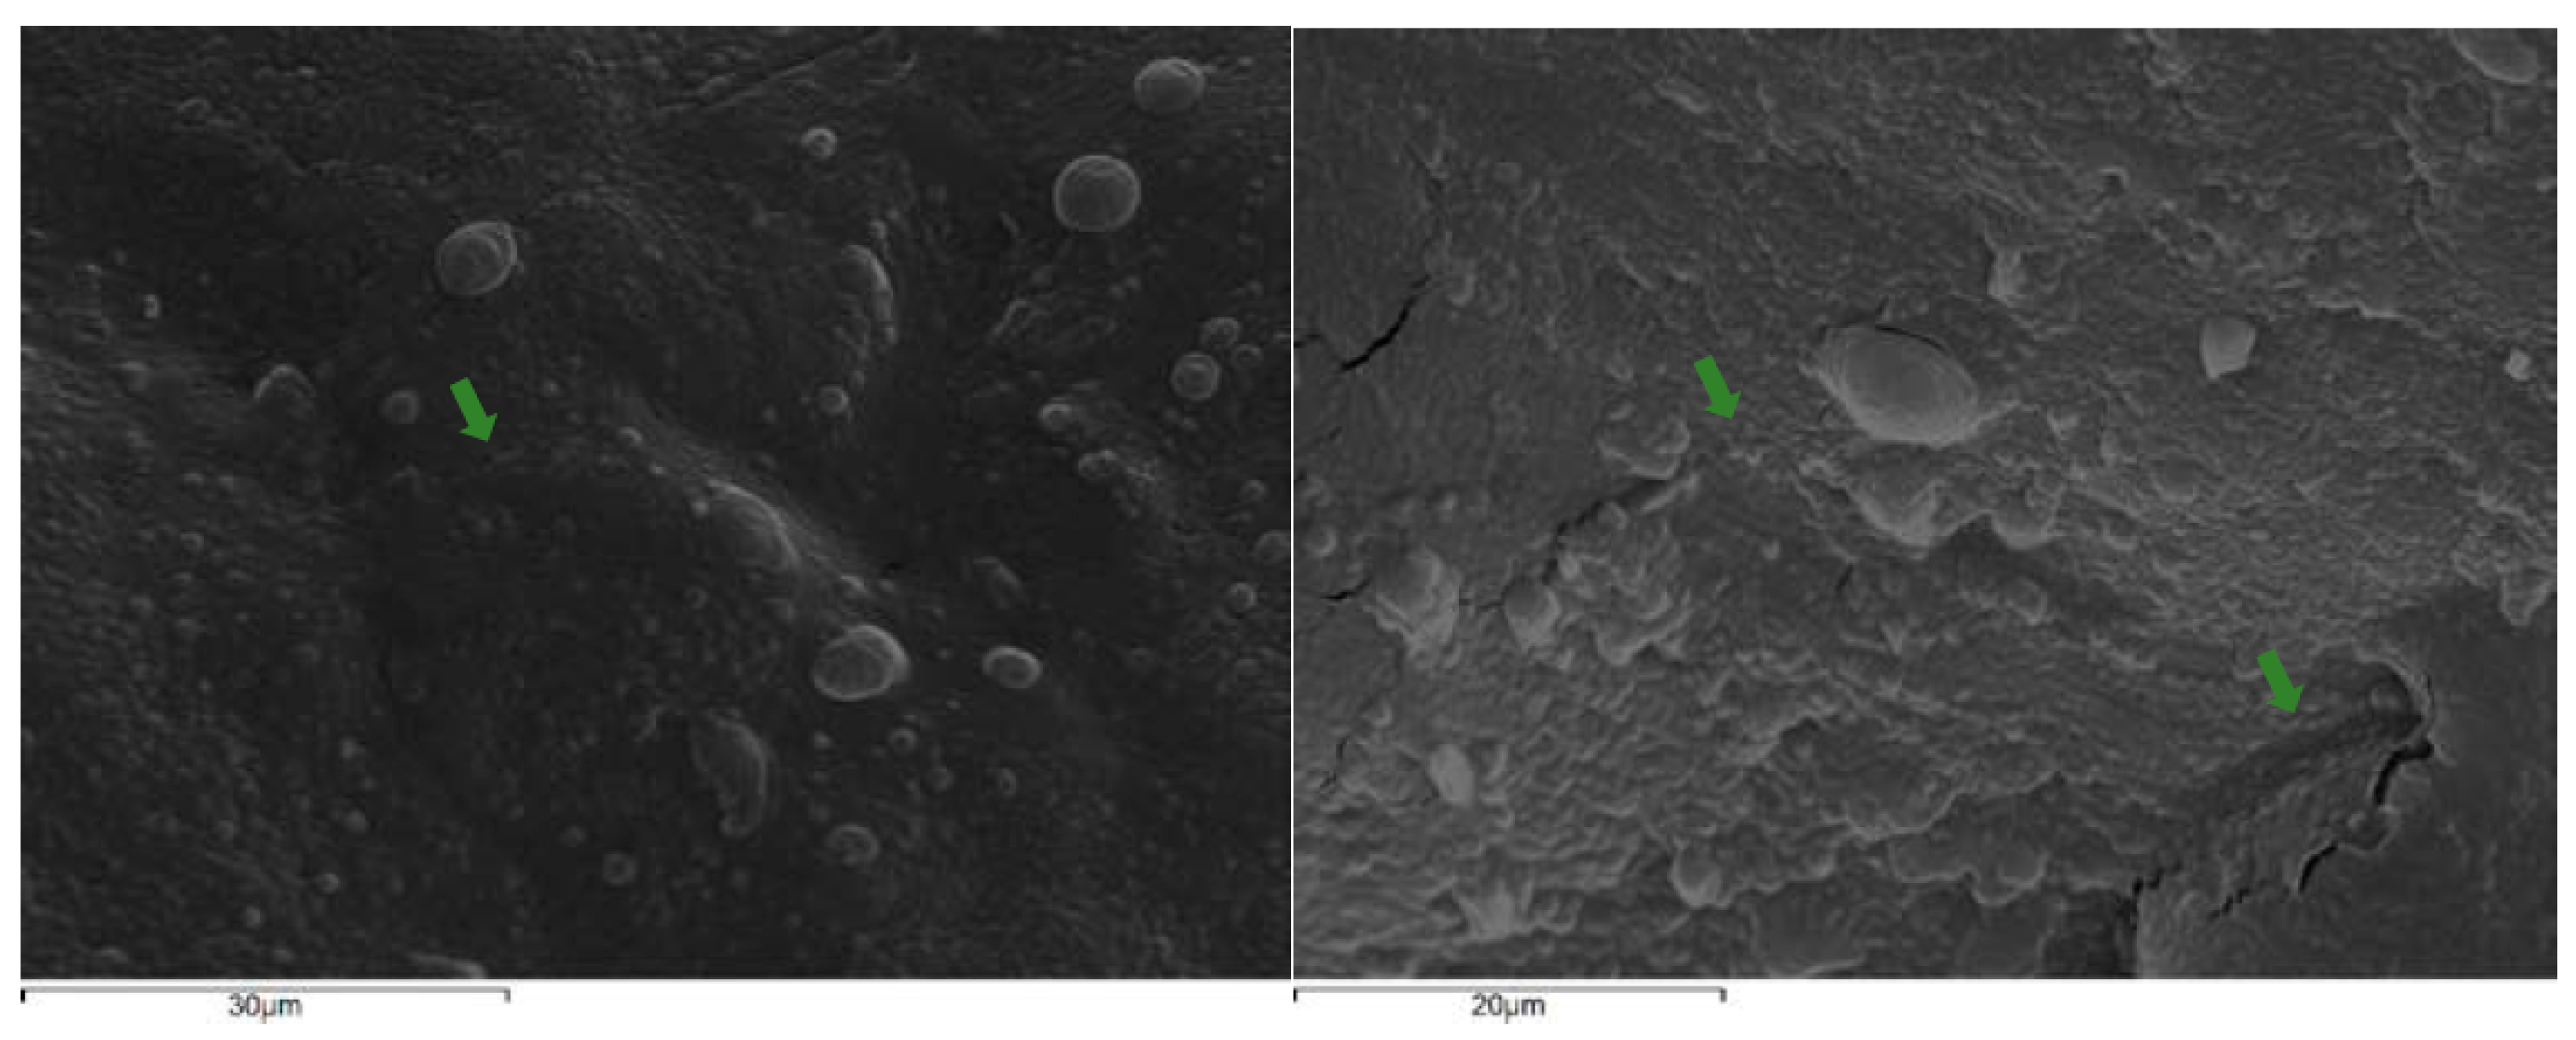
Figure 1. Electron micrographs of immobilized P. acidilactici ORE5 cells on Corinthian currants on 30 μm (a) and 20 μm (b) scale. Cells are shown with arrows.
Preprints 115730 g001
Figure 2. Body weight and plasma glucose, insulin, TNF-a, IL-1b, IL-6, Total Cholesterol (TC), and Triacylglycerols (TAG) levels in healthy and STZ-induced diabetic rats during the dietary intervention with free or immobilized P. acidilactici ORE5 cells on Corinthian currants. Data are expressed as mean values ± SEM (n=6 per group). Statistically significant differences are highlighted with different letters: ap<0.05 vs. group H_IPC, bp<0.05 vs. group H_FP and cp<0.05 vs. group D_IPC. H_IPC: healthy animals that received the control diet supplemented with freeze-dried immobilized P. acidilactici ORE5 cells on Corinthian currants, D_IPC: diabetic animals that received the control diet supplemented with freeze-dried immobilized P. acidilactici ORE5 cells on Corinthian currants, H_FP: healthy animals that received the control diet supplemented with free P. acidilactici ORE5 cells, D_FP: diabetic animals that received the control diet supplemented with free P. acidilactici ORE5 cells.
Preprints 115730 g002
Figure 3. Stool microbiota populations in healthy and STZ-induced diabetic rats during the dietary intervention with free or immobilized P. acidilactici ORE5 cells on Corinthian currants. Data are expressed as mean values ± SEM (n=6 per group). Statistically significant differences are highlighted with different letters: ap<0.05 vs baseline values of the same group, bp<0.05 vs. group H_IPC, cp<0.05 vs. group H_FP and dp<0.05 vs. group D_IPC. H_IPC: healthy animals that received the control diet supplemented with freeze-dried immobilized P. acidilactici ORE5 cells on Corinthian currants, D_IPC: diabetic animals that received the control diet supplemented with freeze-dried immobilized P. acidilactici ORE5 cells on Corinthian currants, H_FP: healthy animals that received the control diet supplemented with free P. acidilactici ORE5 cells, D_FP: diabetic animals that received the control diet supplemented with free P. acidilactici ORE5 cells, w0: week 0, w4: week 4, TAC: Total Aerobic Counts, LAB: Lactic Acid Bacteria.
Preprints 115730 g003
Figure 4. A-diversity indices Simpson’s and Shannon’s level after the dietary intervention with free or immobilized P. acidilactici ORE5 cells on Corinthian currants at fecal samples in healthy and STZ-induced diabetic rats, as determined by 16S rRNA gene NGS. Data expressed as mean ± SEM (n=2 per group). Statistically significant differences are highlighted with different letters: ap<0.05 vs. group H_IPC and bp<0.05 vs. group H_FP. H_IPC: healthy animals that received the control diet supplemented with freeze-dried immobilized P. acidilactici ORE5 cells on Corinthian currants, D_IPC: diabetic animals that received the control diet supplemented with freeze-dried immobilized P. acidilactici ORE5 cells on Corinthian currants, H_FP: healthy animals that received the control diet supplemented with free P. acidilactici ORE5 cells, D_FP: diabetic animals that received the control diet supplemented with free P. acidilactici ORE5 cells.
Preprints 115730 g004
Figure 5. Normalized relative abundances (%) at genus taxonomic level after the dietary intervention with free or immobilized P. acidilactici ORE5 cells on Corinthian currants at fecal samples in healthy and STZ-induced diabetic rats, as determined by 16S rRNA gene NGS. Data are expressed as mean values (n=2 per group). H_IPC: healthy animals that received the control diet supplemented with freeze-dried immobilized P. acidilactici ORE5 cells on Corinthian currants, D_IPC: diabetic animals that received the control diet supplemented with freeze-dried immobilized P. acidilactici ORE5 cells on Corinthian currants, H_FP: healthy animals that received the control diet supplemented with free P. acidilactici ORE5 cells, D_FP: diabetic animals that received the control diet supplemented with free P. acidilactici ORE5 cells, w0: week 0, w4: week 4.
Preprints 115730 g005
Table 1. Effect of immobilization and storage at RT and 4oC on cell levels and survival rates of free and immobilized P. acidilactici ORE5 cells on Corinthian currants.
Storage temperature Form Nature logcfu % Survival
d0 d15 d30 d15 d30
RT Immobilized W 8.62 ± 0.05 6.74 ± 0.08 2.30 ± 0.01 78.19 ± 1.80 26.68 ± 0.35
FD 8.59 ± 0.05 7.75 ± 0.02 6.38 ± 0.01 90.22 ± 0.85 74.27 ± 0.62
Free W 9.61 ± 0.05 7.43 ± 0.02 5.09 ± 0.01 77.31 ± 2.02 52.96 ± 0.39
FD 9.46 ± 0.03 7.62 ± 0.01 6.54 ± 0.02 80.54 ± 0.61 69.13 ± 0.84
4°C Immobilized W 8.62 ± 0.05 8.41 ± 0.02 7.55 ± 0.02 97.56 ± 0.99 87.58 ± 0.88
FD 8.59 ± 0.05 8.51 ± 0.01 8.28 ± 0.01 99.06 ± 1.01 96.39 ± 0.65
Free W 9.61 ± 0.05 8.97 ± 0.01 7.41 ± 0.01 93.34 ± 0.81 77.10 ± 0.55
FD 9.46 ± 0.03 9.08 ± 0.03 8.23 ± 0.01 95.98 ± 0.64 86.99 ± 0.71
Data are expressed as mean values ± standard deviation (STDEV) (n=3 per sample). Wet and freeze-dried free cells were used as control samples. W: Wet cultures, FD: freeze-dried cultures after rehydration, d0: day 0, d15: day 15, d30: day 30.
Table 2. Cecal tissue adherent and cecal content microbiota populations in healthy and STZ-induced diabetic rats after the dietary intervention with free or immobilized P. acidilactici ORE5 cells on Corinthian currants.
Cecum (tissue adherent) Cecal content
group H_IPC H_FP D_IPC D_FP H_IPC H_FP D_IPC D_FP
TAC 5.70±.0.06 5.42±0.14 6.30±0.26b 5.88±0.16 8.52±0.11 6.75±0.03a 7.70±0.25a,b 7.50±0.03a,b
Enterobacteriaceae 3.15±0.16 2.43±0.17 3.86±0.48b 5.31±0.10a,b,c 5.58±0.28 3.43±0.31 6.02±0.01b 5.29±0.08b
Coliforms 3.13±0.13 2.40±0.17 3.53±0.56 5.20±0.06a,b,c 5.57±0.28 3.35±0.15a 6.28±0.09a,b 5.29±0.08b,c
E. coli 3.01±0.16 2.33±0.03 3.69±0.51b 5.25±0.10a,b,c 5.41±0.32 3.47±0.15 5.74±0.05b 5.12±0.02b
Staphylococcus spp. 3.02±0.10 2.90±0.07 4.86±0.12a,b 4.68±0.21a,b 5.55±0.13 4.52±0.08a 4.94±0.09a,b 5.16±0.01a,b
Εnterococcus spp. 3.84±0.05 3.93±0.29 3.87±0.15 4.86±0.19a,b,c 6.12±0.20 4.85±0.11a 5.31±0.04a 4.64±0.04a,c
Clostridium spp. 5.26±0.09 5.00±0.12 5.39±0.12 5.61±0.11b 6.93±0.30 6.53±0.06 6.55±0.01 6.54±0.01
LAB 5.78±0.07 5.12±0.03a 6.21±0.28b 5.34±0.09a 8.23±0.07 6.28±0.10a 6.90±0.28a 7.87±0.15b,c
Bifidobacterium spp. 5.30±0.05 5.53±0.14 6.22±0.05a,b 5.67±0.19c 7.61±0.18 7.48±0.02 7.88±0.05 6.71±0.13a,b,c
Data are expressed as mean values ± SEM (n=6 per group). Statistically significant differences are highlighted with different letters: ap<0.05 vs. group H_IPC, bp<0.05 vs. group H_FP and cp<0.05 vs. group D_IPC. H_IPC: healthy animals that received the control diet supplemented with freeze-dried immobilized P. acidilactici ORE5 cells on Corinthian currants, D_IPC: diabetic animals that received the control diet supplemented with freeze-dried immobilized P. acidilactici ORE5 cells on Corinthian currants, H_FP: healthy animals that received the control diet supplemented with free P. acidilactici ORE5 cells, D_FP: diabetic animals that received the control diet supplemented with free P. acidilactici ORE5 cells, TAC: Total Aerobic Counts, LAB: Lactic Acid Bacteria.
Table 3. Normalized relative abundances (%) at phylum taxonomic level after the dietary intervention with free or immobilized P. acidilactici ORE5 cells on Corinthian currants at fecal samples in healthy and STZ-induced diabetic rats, as determined by 16S rRNA gene NGS.
H_IPC H_FP D_IPC D_FP
Weeks 0 4 0 4 0 4 0 4
Actinobacteria 0.06±0.00 0.0±0.02 0.06±0.02 0.05±0.00 1.12±0.95 8.04±2.02a,b,c 2.08±0.79 11.73±0.11a,b,c
Bacteroidetes 22.24±2.64 15.14±4.72 22.71±0.59 24.86±8.61 20.12±3.99 22.49±1.95 16.97±14.47 5.61±0.59
Firmicutes 77.29±2.38 83.51±5.87 76.86±0.59 74.23±7.96 71.75±4.23 55.90±2.38 72.94±9.69 76.42±2.62
Tenericutes 0.30±0.24 1.22±1.18 0.27±0.04 0.80±0.62 0.21±0.01 0.10±0.02 0.16±0.11 0.26±0.09
Verrucomicrobia 0.11±0.02 0.06±0.01 0.10±0.03 0.06±0.02 6.80±0.72 13.46±2.42b,c 7.85±3.88 5.98±2.01
Data are expressed as mean values ± SEM (n=2 per group). Statistically significant differences are highlighted with different letters: ap<0.05 vs. baseline bp<0.05 vs. group H_IPC and cp<0.05 vs. group H_FP. H_IPC: healthy animals that received the control diet supplemented with freeze-dried immobilized P. acidilactici ORE5 cells on Corinthian currants, D_IPC: diabetic animals that received the control diet supplemented with freeze-dried immobilized P. acidilactici ORE5 cells on Corinthian currants, H_FP: healthy animals that received the control diet supplemented with free P. acidilactici ORE5 cells, D_FP: diabetic animals that received the control diet supplemented with free P. acidilactici ORE5 cells.
Table 4. Lactic acid and SCFA concentrations (μmol/g) in the stool samples of healthy and STZ-induced diabetic rats after the dietary intervention with free or immobilized P. acidilactici ORE5 cells on Corinthian currants.
Lactic Acetic Propionic Isobutyric Butyric Isovaleric Valeric
H_IPC 2.796±0.170 18.481±0.502 1.382±0.047 0.059±0.006 0.657±0.099 0.058±0.007 0.106±0.012
H_FP 4.014±0.438 26.552±2.610 1.890±0.105 0.559±0.381 1.654±0.522 0.332±0.197 0.160±0.022
D_IPC 6.121±0.783a 37.280±2.680a,b 1.899±0.148 0.147±0.101 1.166±0.315 0.046±0.018 0.131±0.016
D_FP 4.307±0.688 38.094±2.712a,b 1.904±0.188 0.219±0.130 1.005±0.258 0.062±0.024 0.092±0.019
Data are expressed as mean values ± SEM (n=6 per group). Statistically significant differences are highlighted with different letters: ap<0.05 vs. group H_IPC and bp<0.05 vs. group H_FP. H_IPC: healthy animals that received the control diet supplemented with freeze-dried immobilized P. acidilactici ORE5 cells on Corinthian currants, D_IPC: diabetic animals that received the control diet supplemented with freeze-dried immobilized P. acidilactici ORE5 cells on Corinthian currants, H_FP: healthy animals that received the control diet supplemented with free P. acidilactici ORE5 cells, D_FP: diabetic animals that received the control diet supplemented with free P. acidilactici ORE5 cells.
Disclaimer/Publisher’s Note: The statements, opinions and data contained in all publications are solely those of the individual author(s) and contributor(s) and not of MDPI and/or the editor(s). MDPI and/or the editor(s) disclaim responsibility for any injury to people or property resulting from any ideas, methods, instructions or products referred to in the content.
Copyright: This open access article is published under a Creative Commons CC BY 4.0 license, which permit the free download, distribution, and reuse, provided that the author and preprint are cited in any reuse.
Prerpints.org logo

Preprints.org is a free preprint server supported by MDPI in Basel, Switzerland.

Subscribe

© 2024 MDPI (Basel, Switzerland) unless otherwise stated