1. Introduction
Marine energy has notable benefits compared to other existing renewable energy supplies. The predictability of marine tidal energy makes it highly reliable, and its development may be achieved without causing harm to the natural infrastructure. Tidal energy is an environmentally friendly source that harnesses the kinetic energy present in ocean currents. Tidal turbine blades can create power through the rotational motion caused by tidal currents [
1]. Additionally, because of its greater density, which reaches up to 800 times that of air, seawater allows a tidal turbine to generate significantly more power compared to a wind turbine of the same size running at identical velocities of impact [
2]. On the other hand, before such technologies are launched worldwide, tidal power in the manufacturing sector still faces several challenges. The difficulties may be categorized as operation, design, expense, reliability, materials, technical, and maintenance[
3].
Composite materials, especially glass fibre-reinforced polymer, are considered appropriate for manufacturing tidal turbine blades due to their mechanical properties, resistance to corrosion, and effective cost. However, the challenging marine environment and the increase in the diameter of the turbine rotor led to difficulties in identifying a reliable composite material and raised additional tribological challenges such as erosion or wear wear[
4].
2. Methodology
2.1. Slurry Erosion Impingement Rig
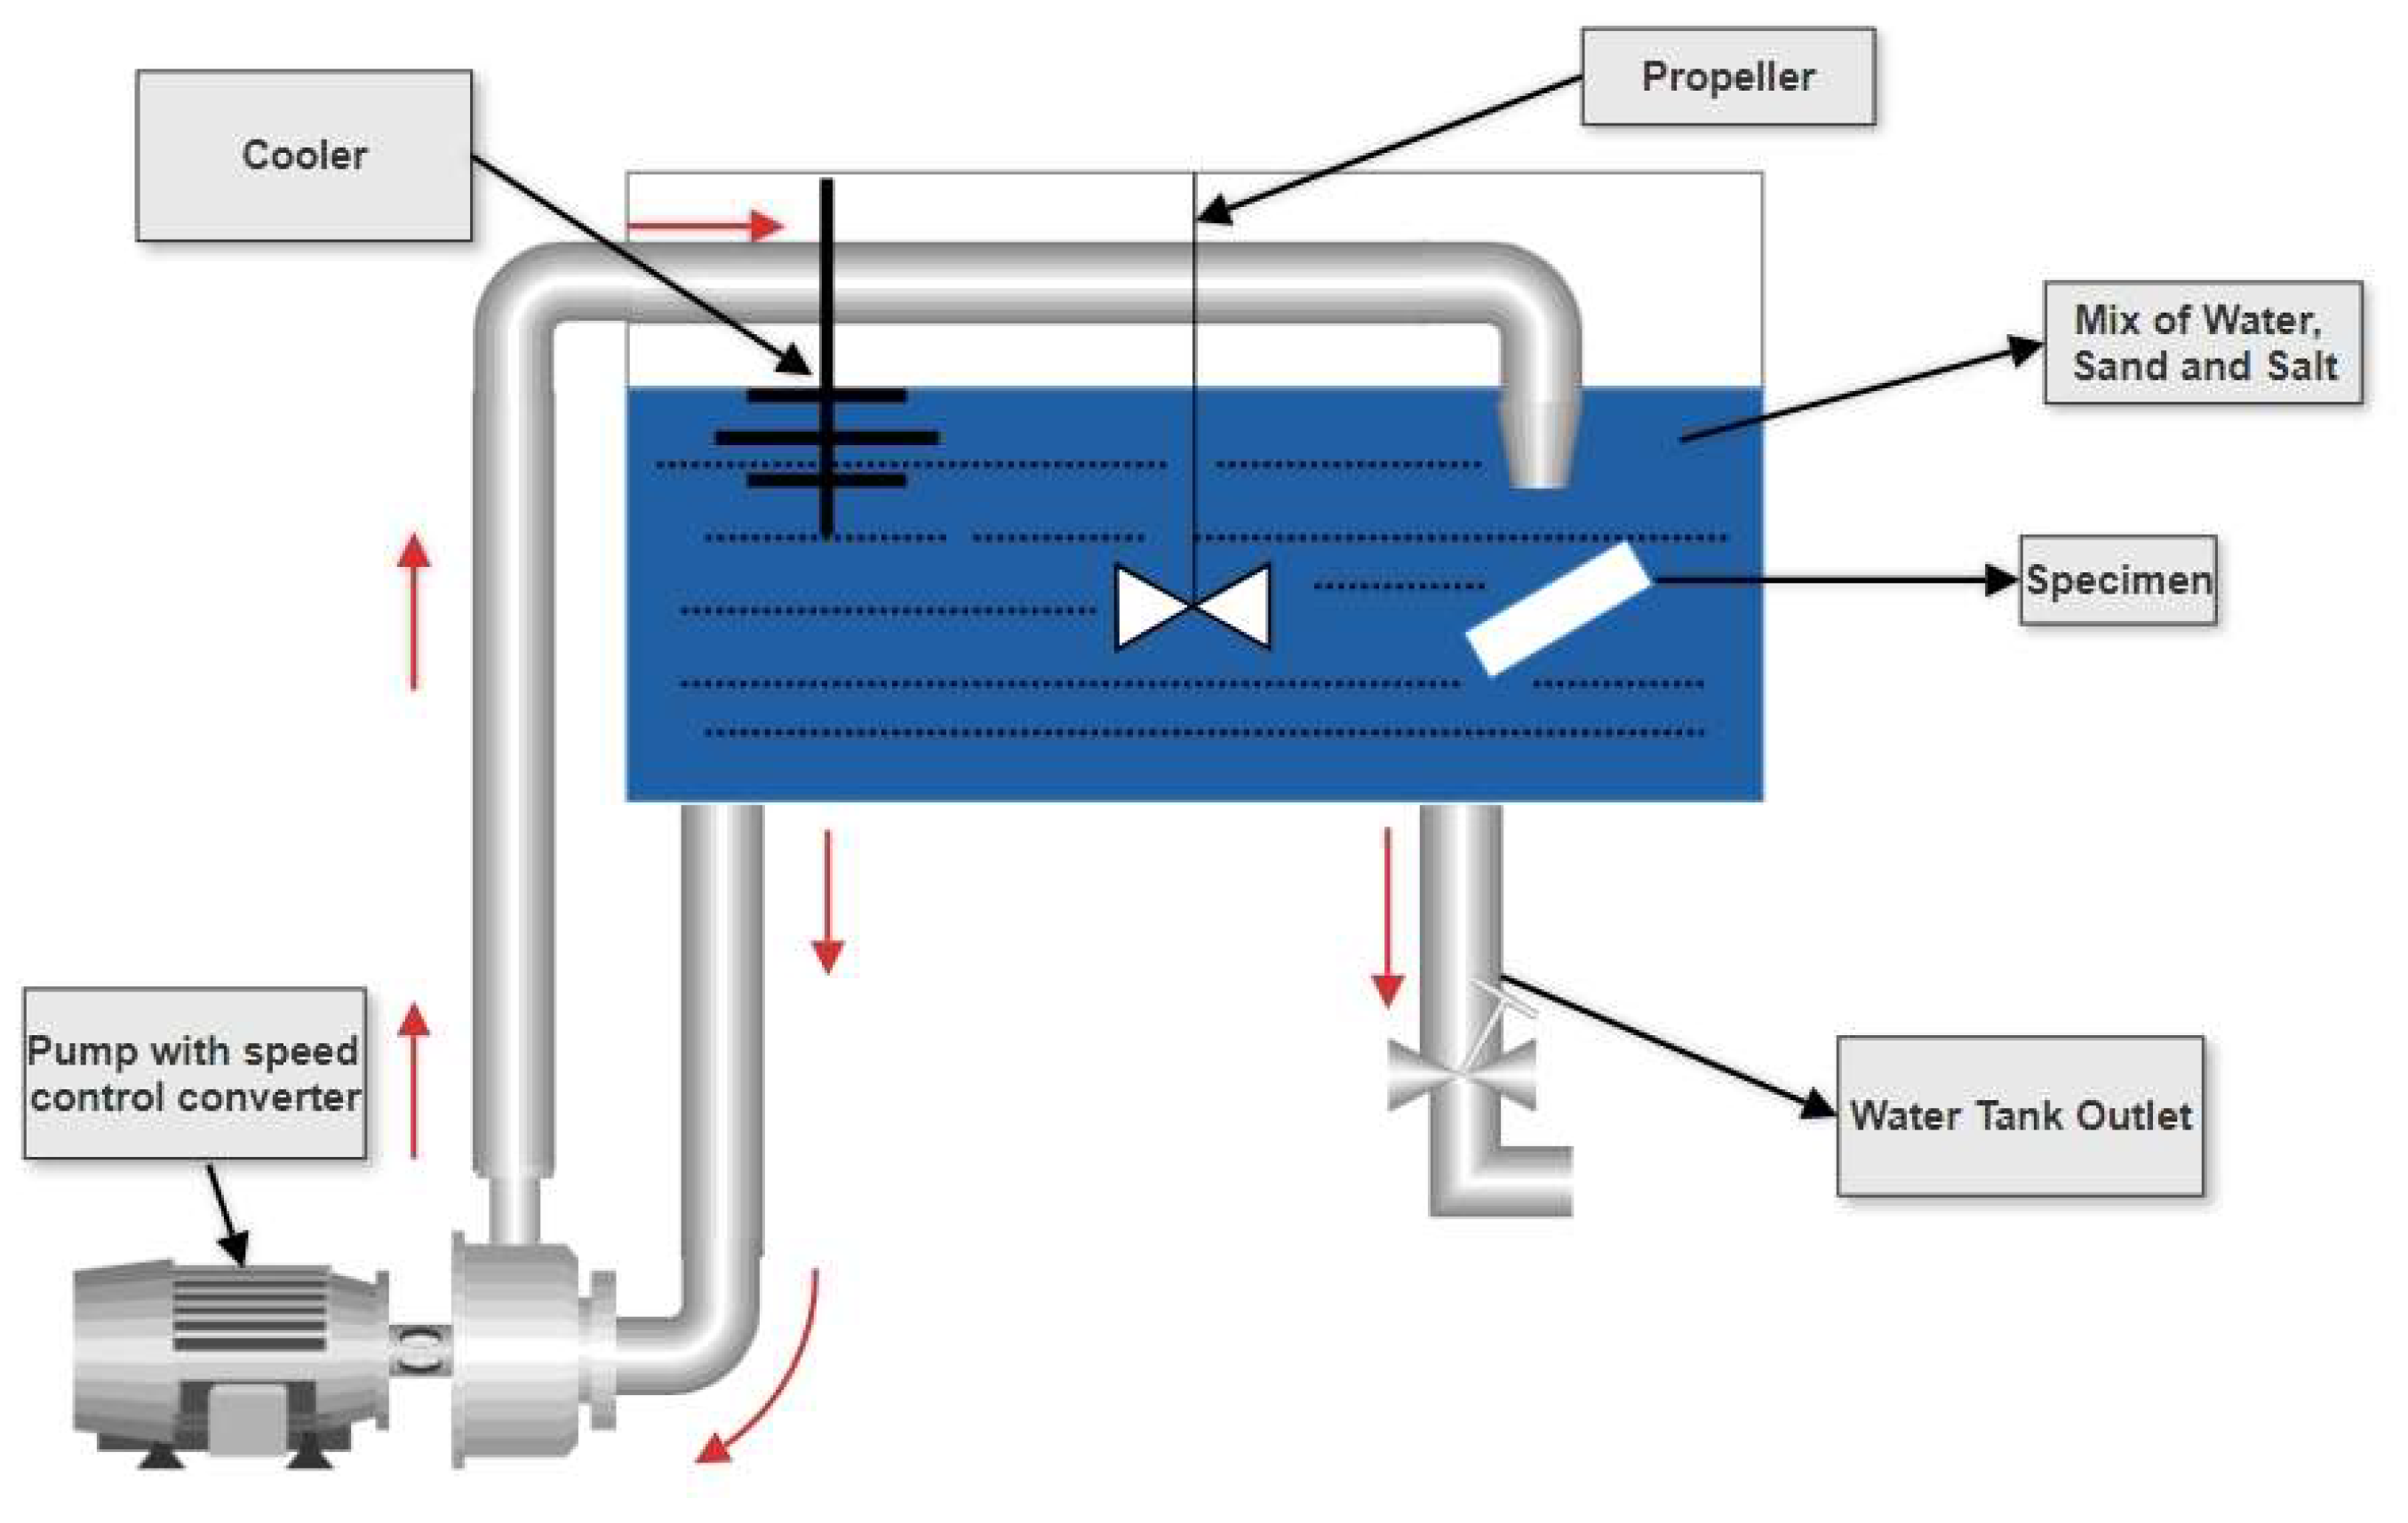
In this study, a slurry erosion rig was developed at the University of Strathclyde in the tribology laboratory to artificially reproduce tidal turbine blades to examine composite materials and meet the experiment’s aim of investigating erosion in the harsh marine environment. The main elements of the rig are as follows: water tank container with two outlets on the bottom, one for the pump to forward the solution to the specimen and the other for cleaning the container after finishing the test. The rig was modified with a velocity control converter. Additionally, the rig was attached at the top with a dual impeller system to mix the sand and salt with the water during the test duration. Also, to keep the temperature on the container stable, an immersion cooler was added with a sensor; hence, the container’s temperature was 10°C ±1°C.
Figure 1 shows the slurry erosion impingement rig.
The variables for this study are the effects of velocity with the change in impact angle from the range 0° to 90° to investigate erosion mechanism. In addition, this study applies and considers the ageing methods of material where the material was exposed to the aqueous environment for 14 days (336 hours) and 91 days (2,184 hours), respectively, to observe the erosion from an ageing perspective. The specimen dimensions were also 26 mm × 36 mm, and thickness was 5 mm.
Table 1 below shows the experiment parameters used in this study.
2.2. Material Selection
The FR4 material selected in the experiment as a specimen is constructed from a woven glass fabric combined with a high-strength epoxy resin. When choosing a material for a specific use, its characteristics must meet the requirements of the purpose of the components, the conditions in which it will be used, or the intended structure. Several variables influence the choice of material for tidal current turbines and such as component shape, dimensional tolerance required; mechanical properties such as strength, stiffness, hardness, and fatigue strength; chemical properties i.e., variables influencing corrosion resistance; physical properties such as density; life cycle costs such as ease of manufacture, materials costs, maintenance and ease of installation and removal[
1].
Glass fibre-reinforced polymer (GFRP) is frequently used in constructing turbine blades due to its ability to combine the necessary structural stiffness for big constructions with the lightweight properties required for complicated geometries[
5]. Hence, according to the datasheet[
6], the material is formulated to have favourable mechanical strength and excellent electrical properties combined with a high impact and humidity resistance at continuous operating temperatures of up to 130°C.
Table 2 below shows the mechanical properties of GFRP.
2.3. Experiment Approach
The test specimens were cut to 26 mm × 36 mm and 5 mm in thickness from FR4 epoxy glass laminate sheet using a waterjet. Then, specimens were cleaned and weighed before and after the test using BM252 micro-analytical balances, with a repeatability (standard deviation) of about 0.03 mg (for 100 g). The impingement velocity of the specimen was calibrated using the following equation.
where:
: refers to the liquid flow rate measured as or ; : refers to the area of the pipe or channels in ; : refers to the velocity of the liquid in .
At the finale of the test, each sample was washed out in pure water, and the mass loss was calculated directly after the test.
3. Results
3.1. Mass Loss Measurement for Two-Week Submersion
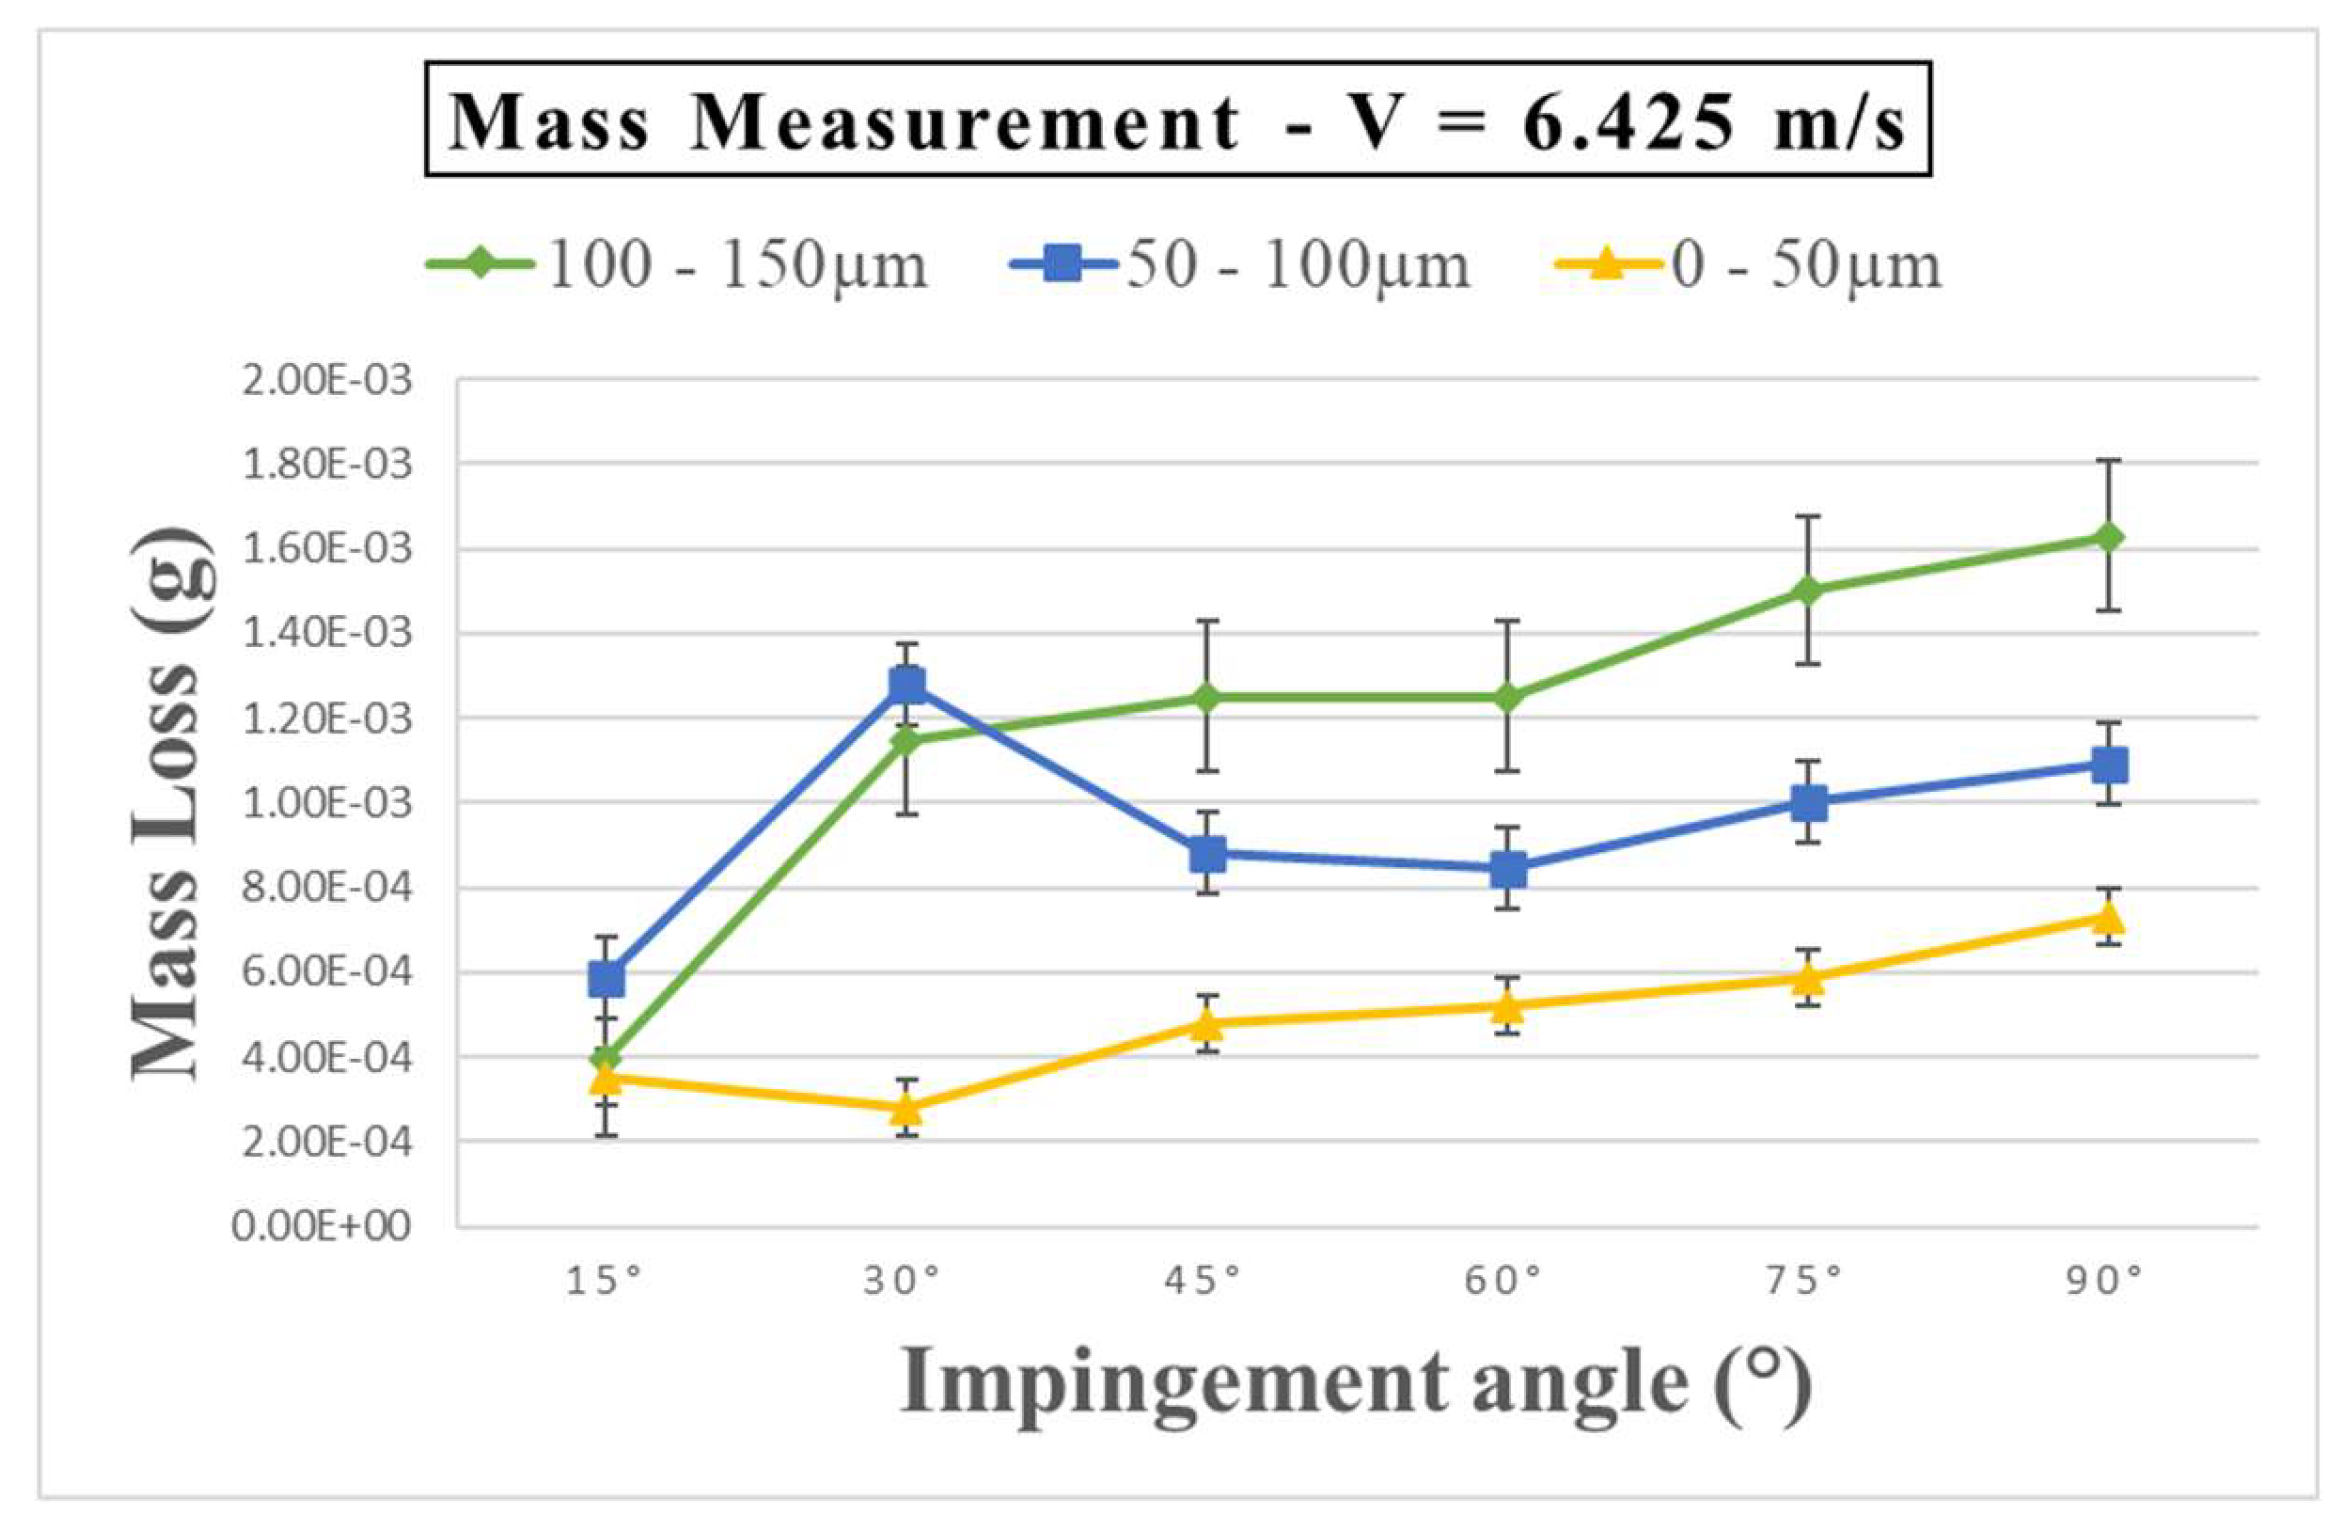
Figure 2 illustrates the mass loss per gram of abrasive particle for Glass-Fibre-Reinforced Polymer (GFRP) specimens after a 14 days (336 hours) exposure period. The pattern of erosion with impact angle is depicted in
Figure 2-. Specifically, within the sand particle size range of 100 – 150 µm and a velocity of 6.425 ms
-1, the maximum erosion rate occurred at a 90° angle of attack, with the lowest erosion observed at 15°. Meanwhile, in the 50 – 100µm sand particle size range at the same velocity, the highest erosion rate was recorded at a 30° angle of attack. Notably, for the 0 – 50µm range, a higher erosion rate was evident at 90°, contrasting with a lower erosion rate at 30°.
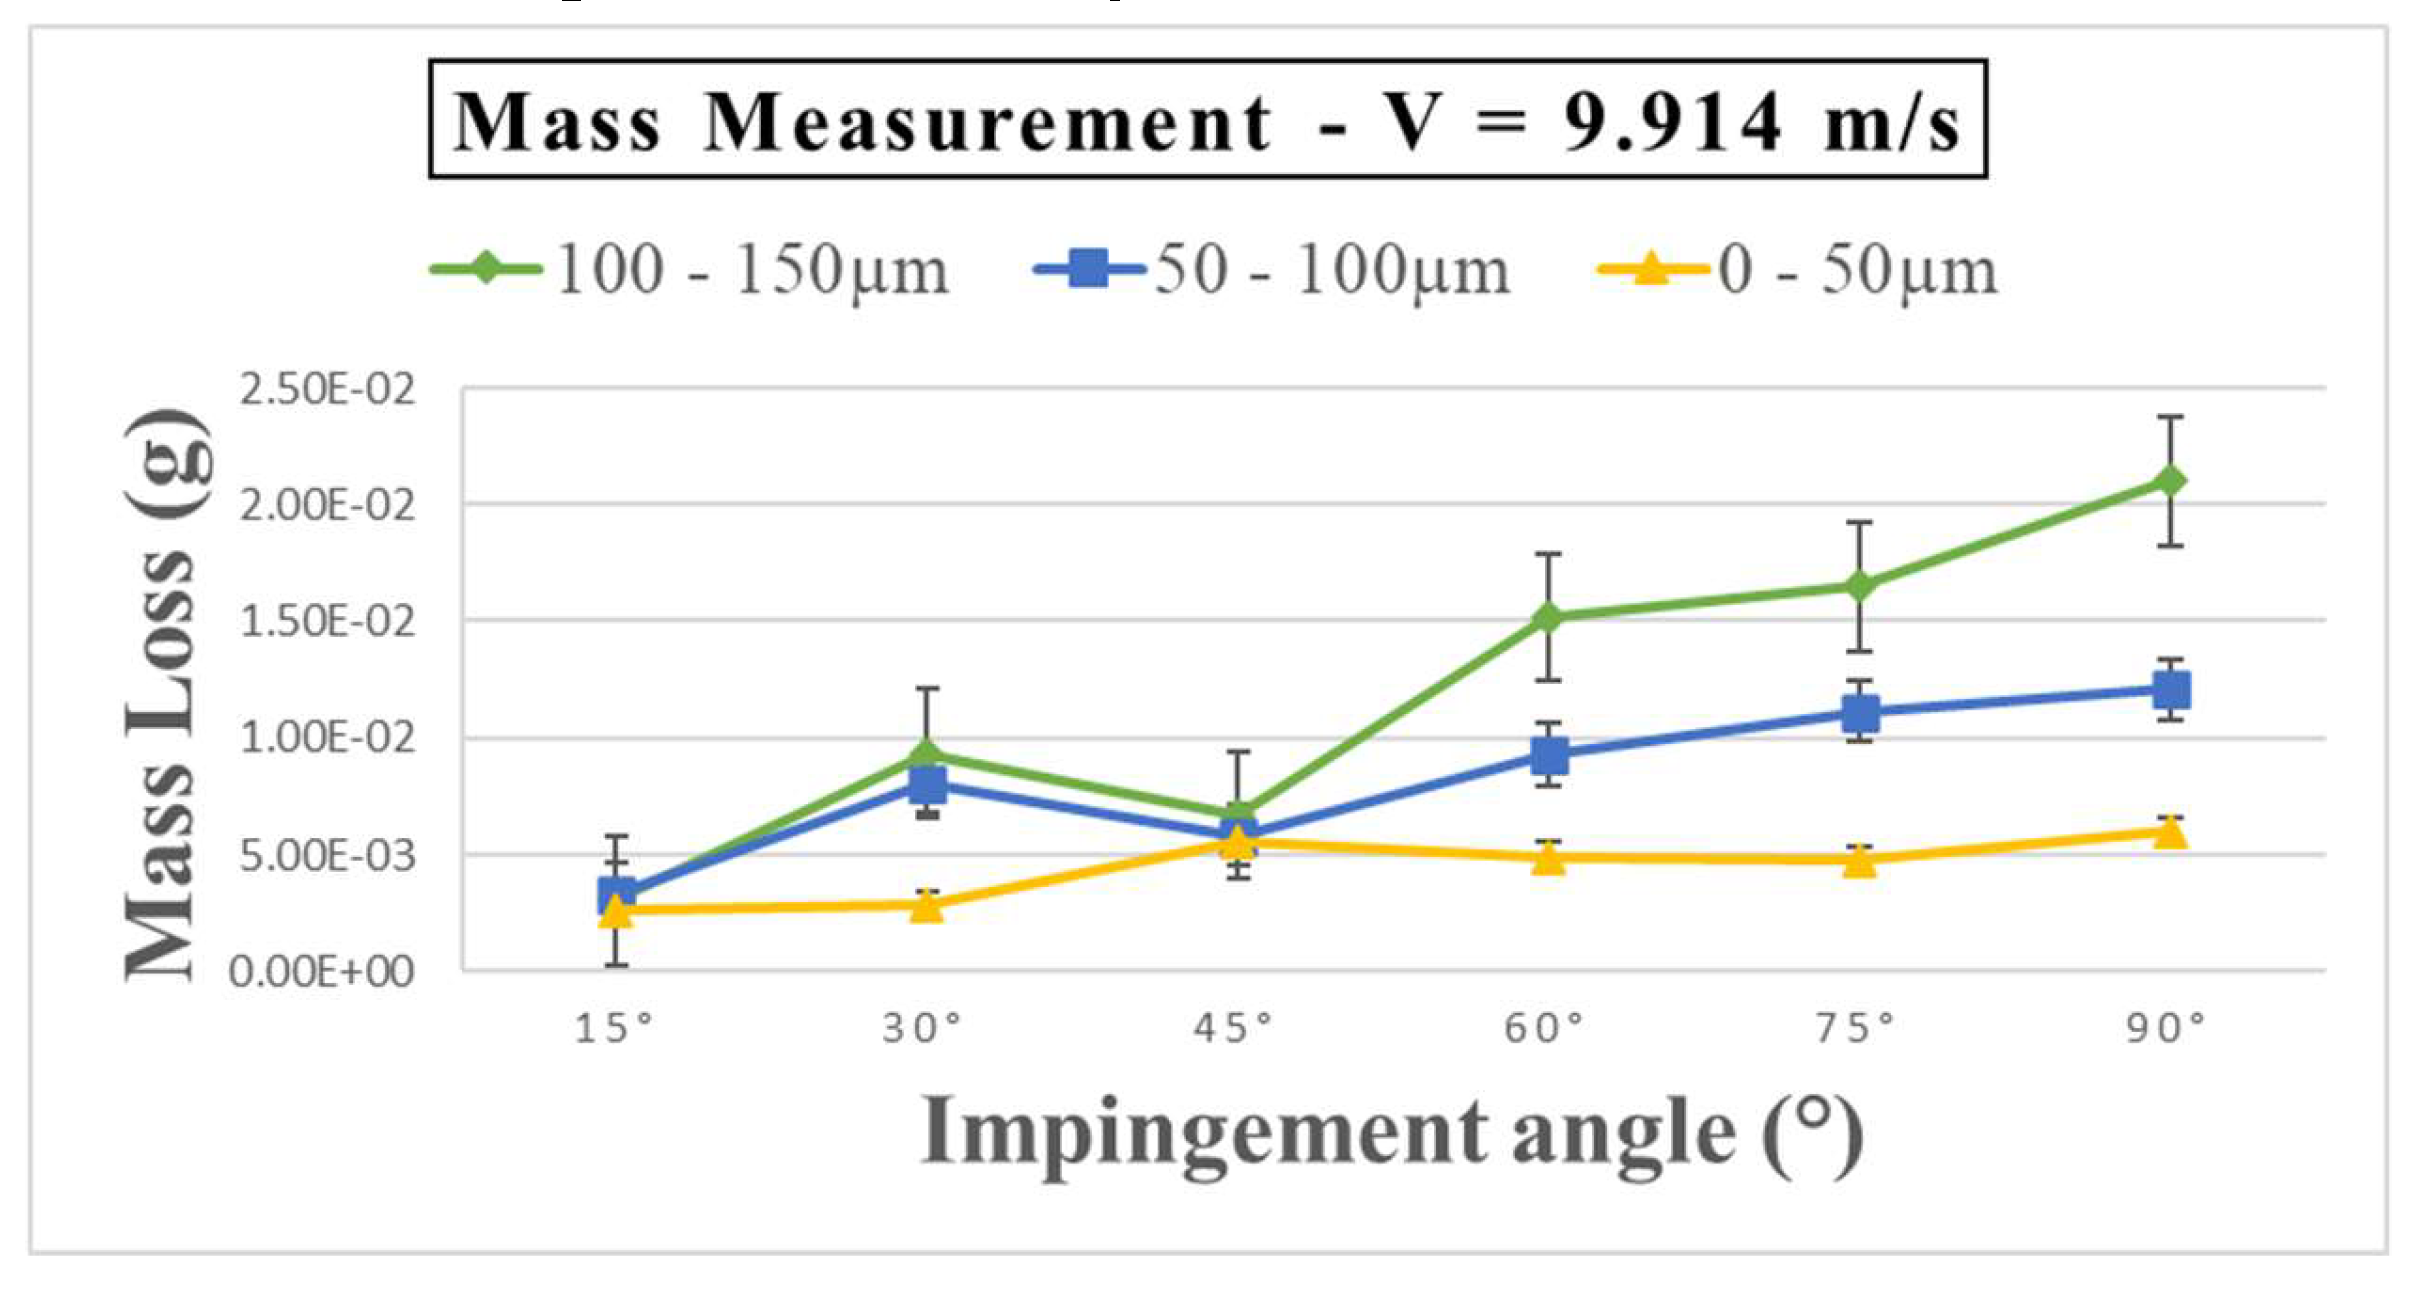
Figure 3 shows a distinct shift in the erosion mechanism compared to
Figure 1. It is evident that within the sand particle size ranges of 100 – 150µm, 50 - 100µm, and 0 - 50µm with a velocity of 9.914 ms
-1, the peak erosion occurs at a 90° angle of attack. Conversely, the lowest erosion rates are observed at 30°, 15°, and 15° for these respective size ranges.
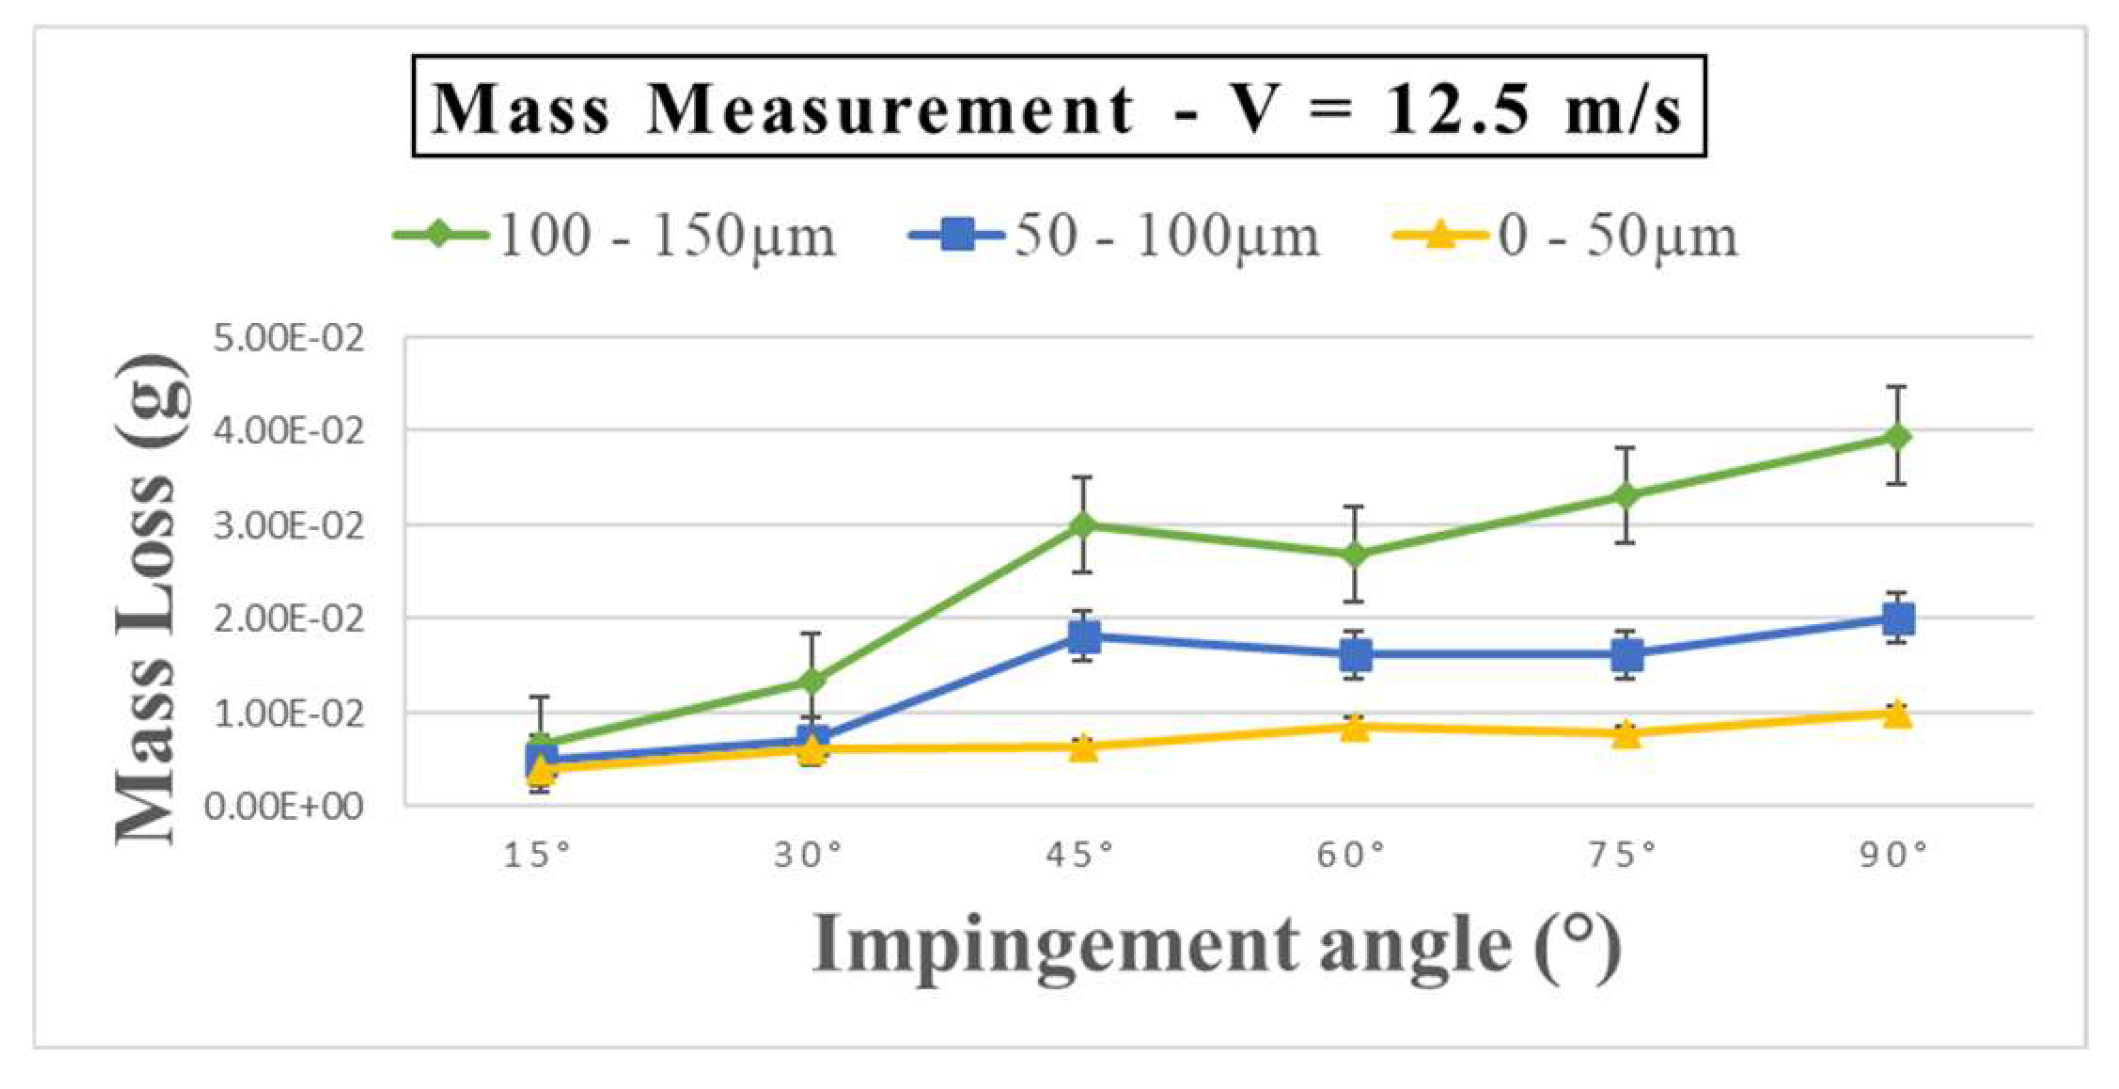
In
Figure 4, a velocity of 12.5 ms
-1 is presented alongside varying sand particle sizes within the ranges of 100 – 150µm, 50 – 100µm, and 0 – 50µm. When comparing
Figure 3 to
Figure 2, there is a consistent highest erosion rate at a 90° angle of attack, indicating no significant alteration. However, notable differences arise in the lowest erosion rates, where, for all sand particle size ranges, the angles associated with the lowest erosion are uniformly recorded at 15°.
3.2. Mass Loss Measurement for Three Months Submersion
During the second stage, the GFRP specimens were evaluated after being immersed in water for a period of 91 days (2,184 hours). The settings employed in the 14 days (336-hours) immersion phase were repeated, with the exception of reducing the number of sand particle sizes and velocities. The test utilised sand particles ranging from 50-100 µm and 100-150 µm, with velocities of 6.425 ms
-1 and 9.914 ms
-1.
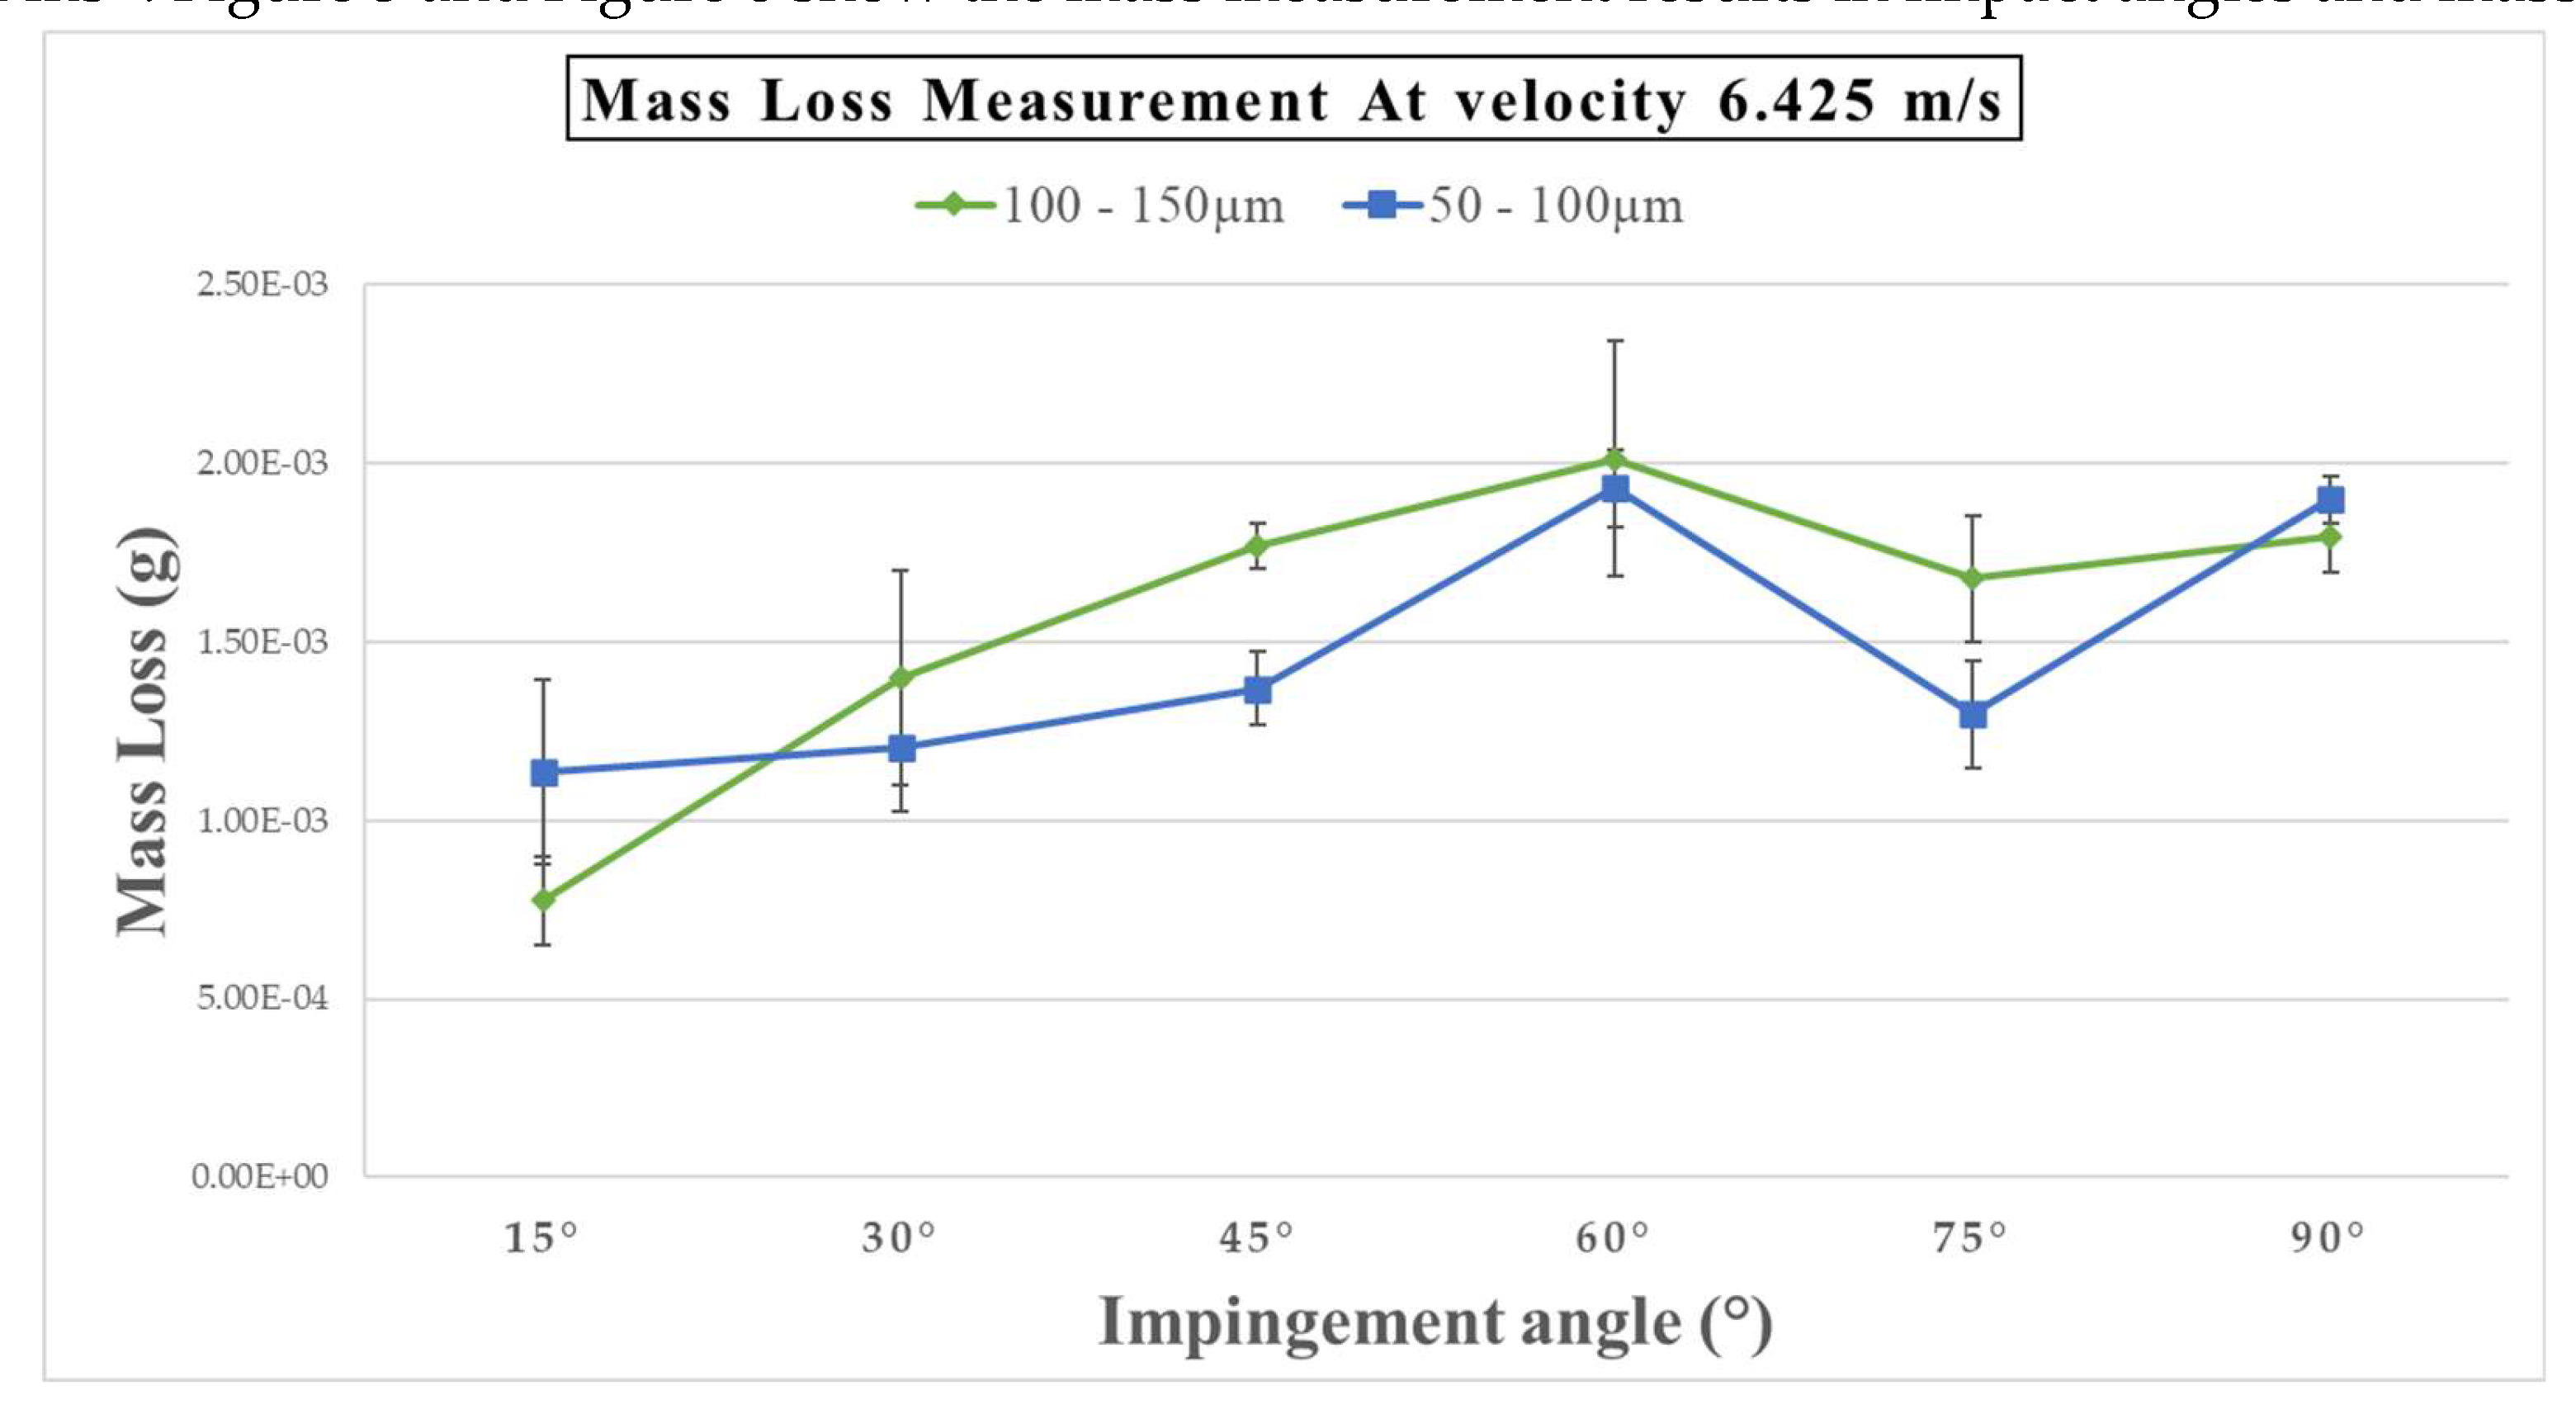
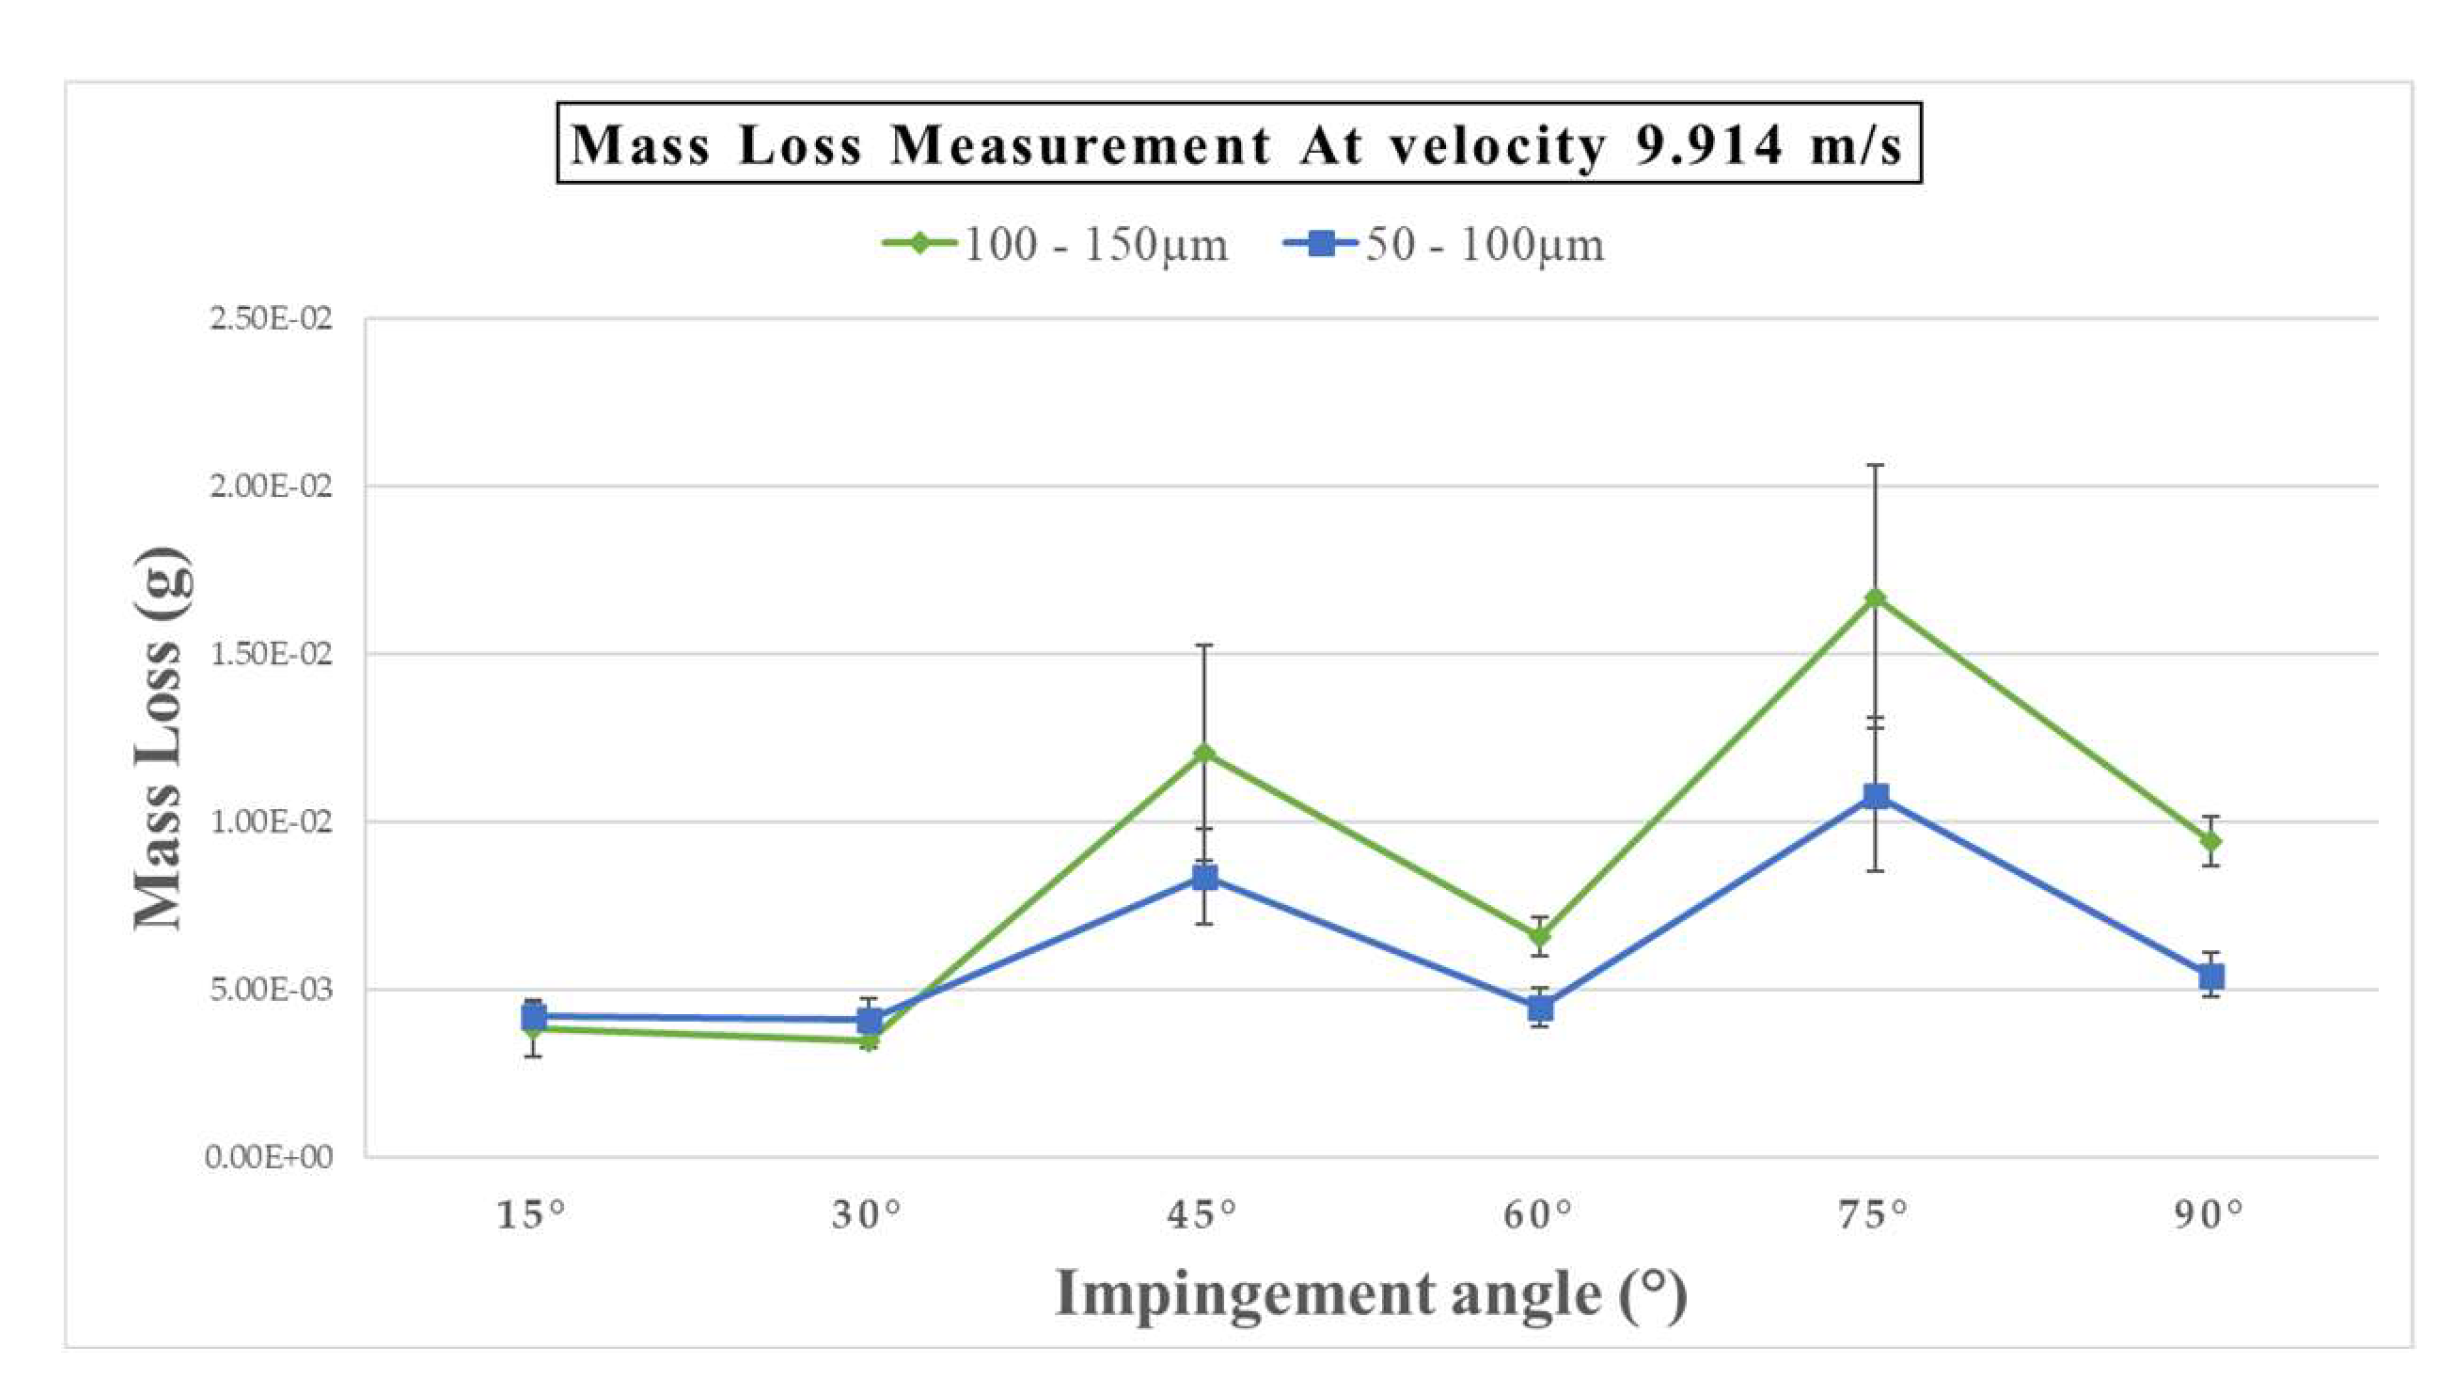
Figure 5 and
Figure 6 show the mass measurement results in impact angles and mass loss.
Figure 5 displays an atypical pattern in mass loss at a velocity of 6.425 ms
-1: the largest point of mass loss occurred for sand particles measuring 100-150 µm at an angle of 60°. Nevertheless, when the impact angle was at 15°, the reduction in mass was at its minimum and was lower than that observed for sand particles measuring 50-100 µm. Moreover, there is a drop in the mass lost as the impact angle changes from 60° to 75°.
Figure 6 illustrates the reduction in mass when moving at a velocity of 9.914 ms
-1, using sand particles ranging in size from 50-100 µm and 100-150 µm. Despite the sand particle size of 100-150 µm being bigger than the sand particle size range of 50-100 µm, there is a lower mass loss when the impact angles range from 15° to 30°. Furthermore, when the impact angle reaches 75°, the mass loss is considered at its peak at both sand sizes.
3.3. Scanning Electron Microscope (SEM) and Depth Profiling Analysis
Mass loss measures can be used to estimate the extent of erosion. The specimens were examined further to understand better the observations made throughout the experiment. A Scanning Electron Microscope (Hitachi S-3700) is used for optical surface analysis, while Keyence VHX7000 is used for depth profiling.
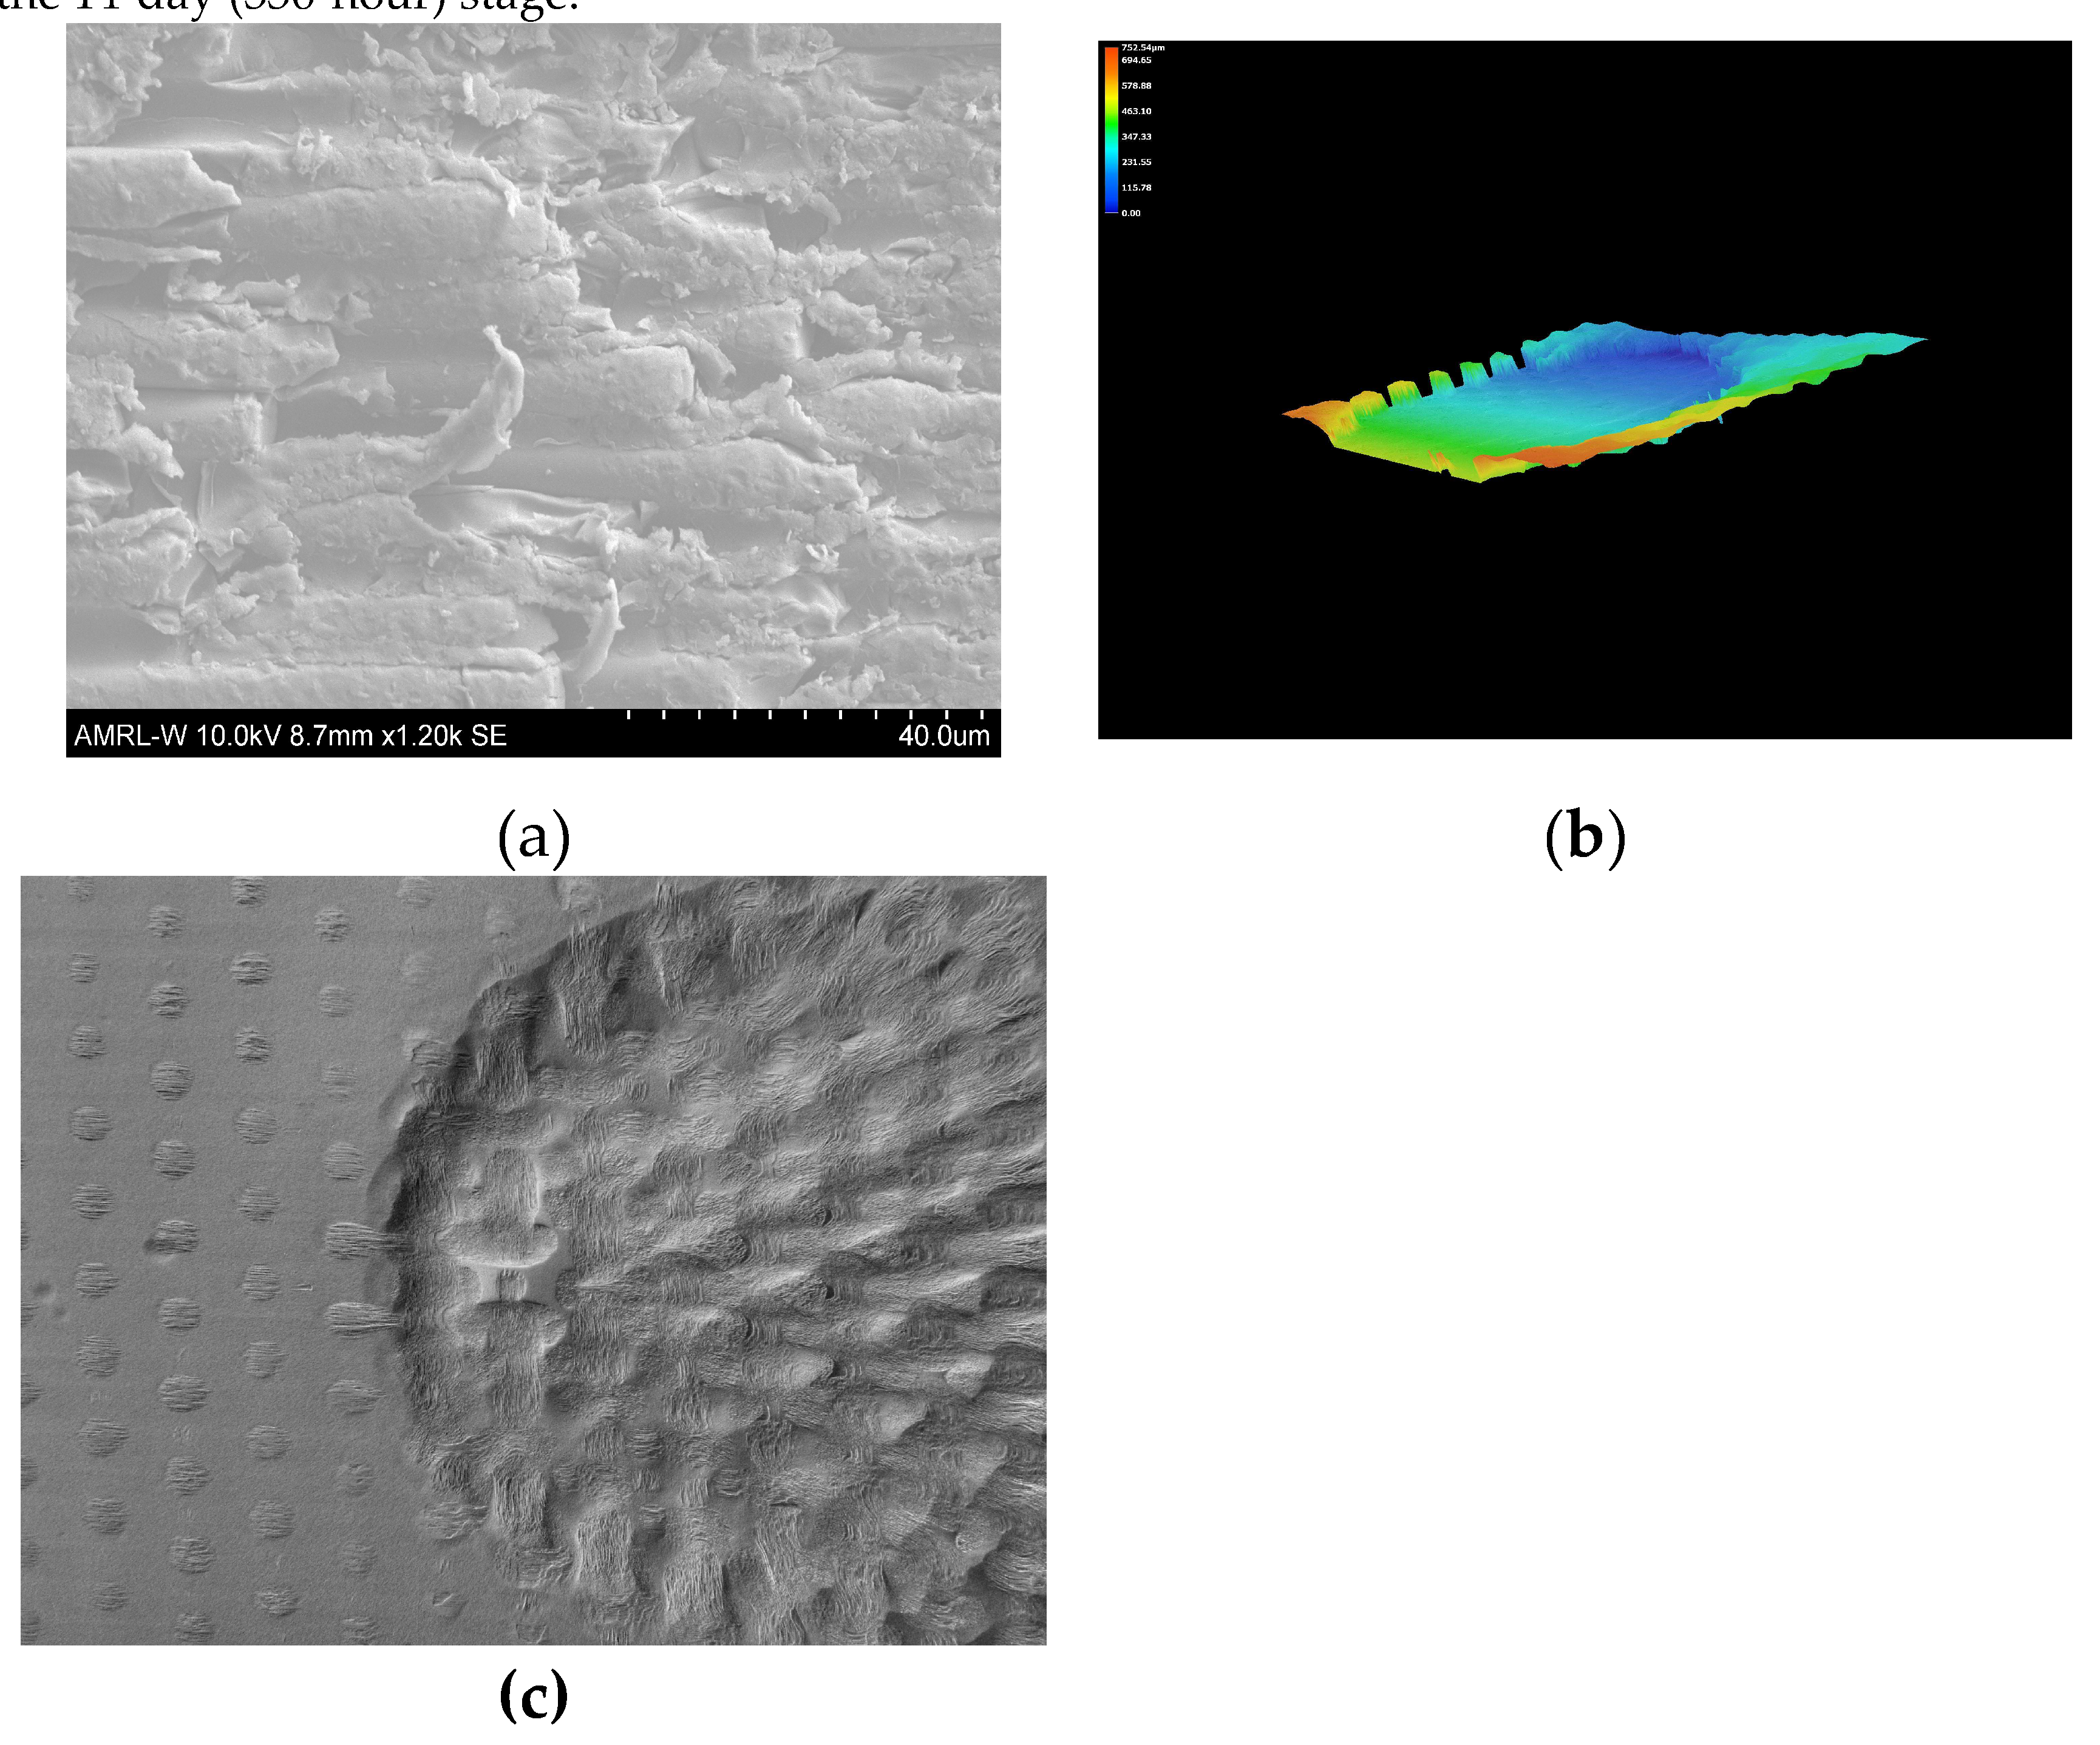
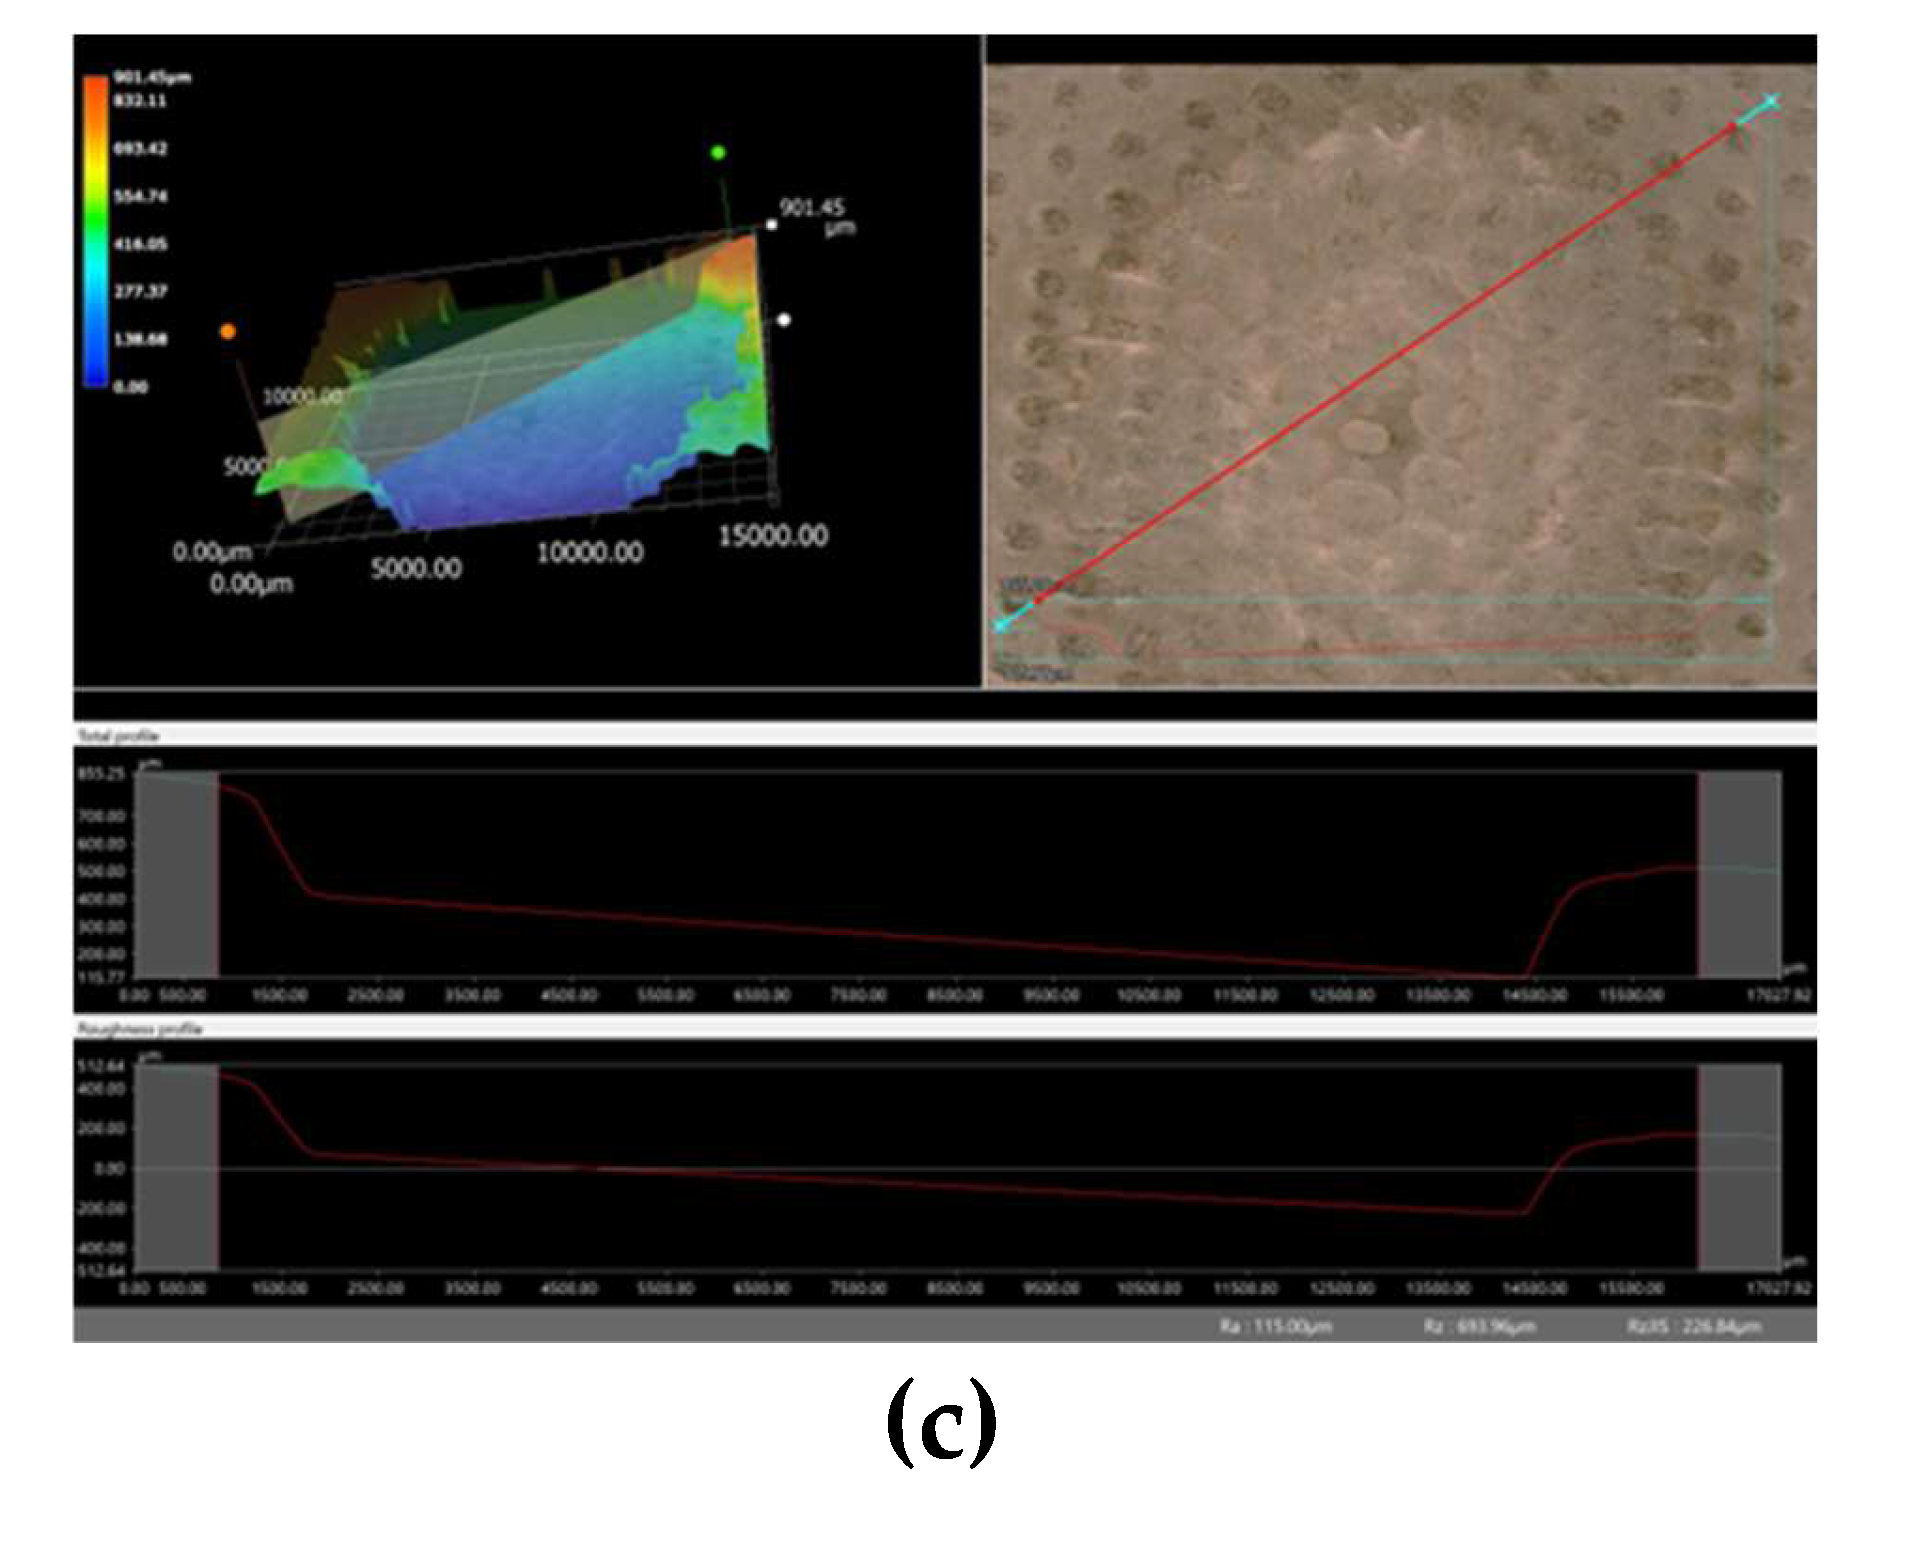
Figure 7 and
Figure 8 show some images of SEM and depth profiling analysis results after the 14-day (336-hour) stage.
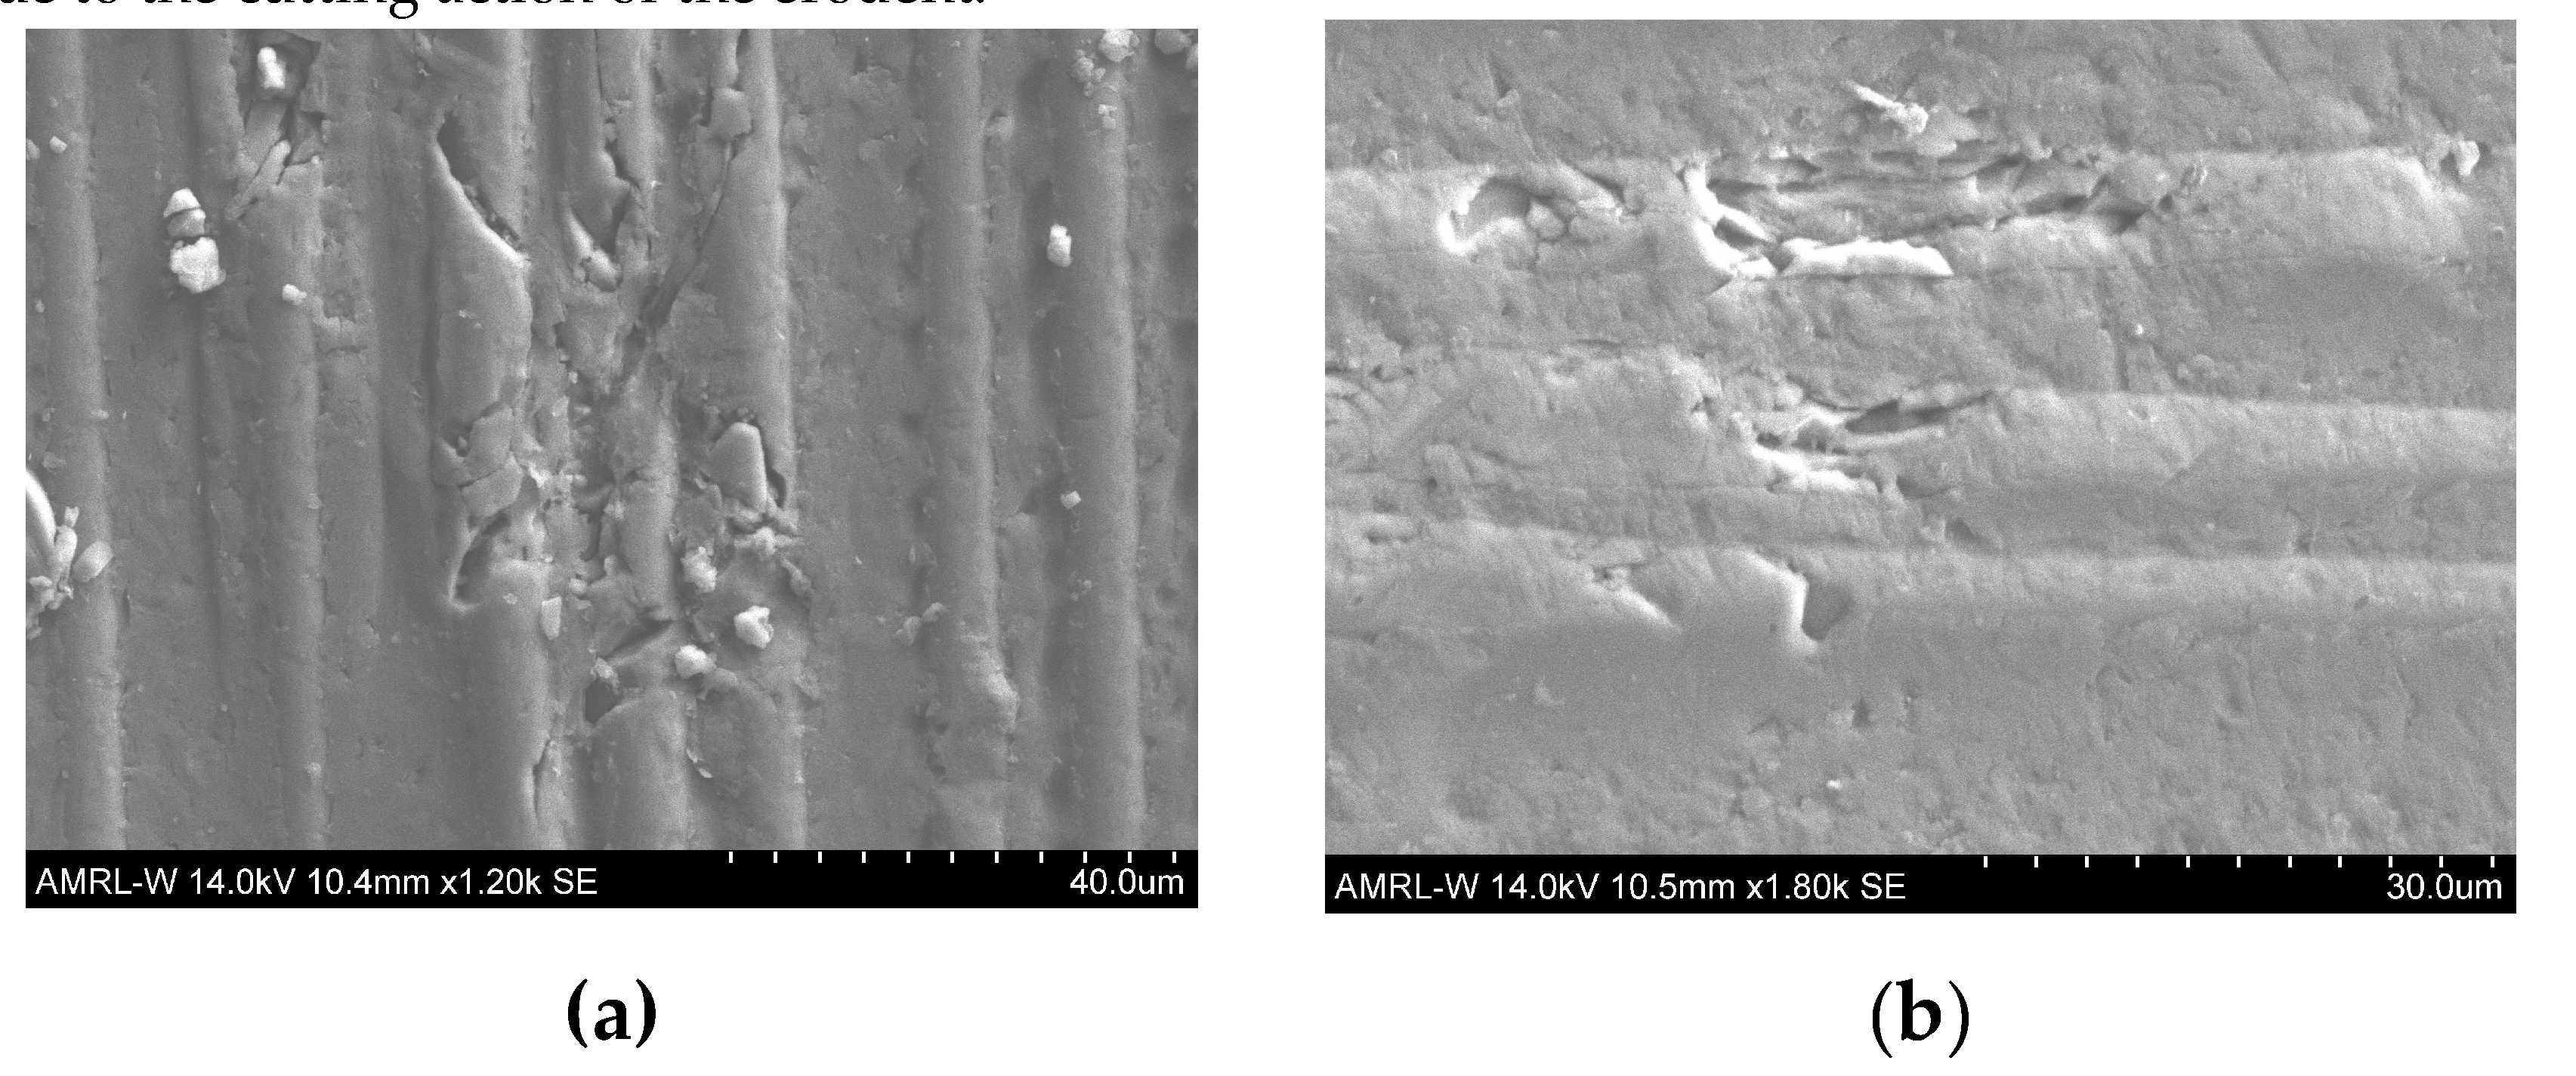
Figure 9 illustrates the harsh cutting action of erodent. In addition, severe brittle fractions are due to the cutting action of the erodent.
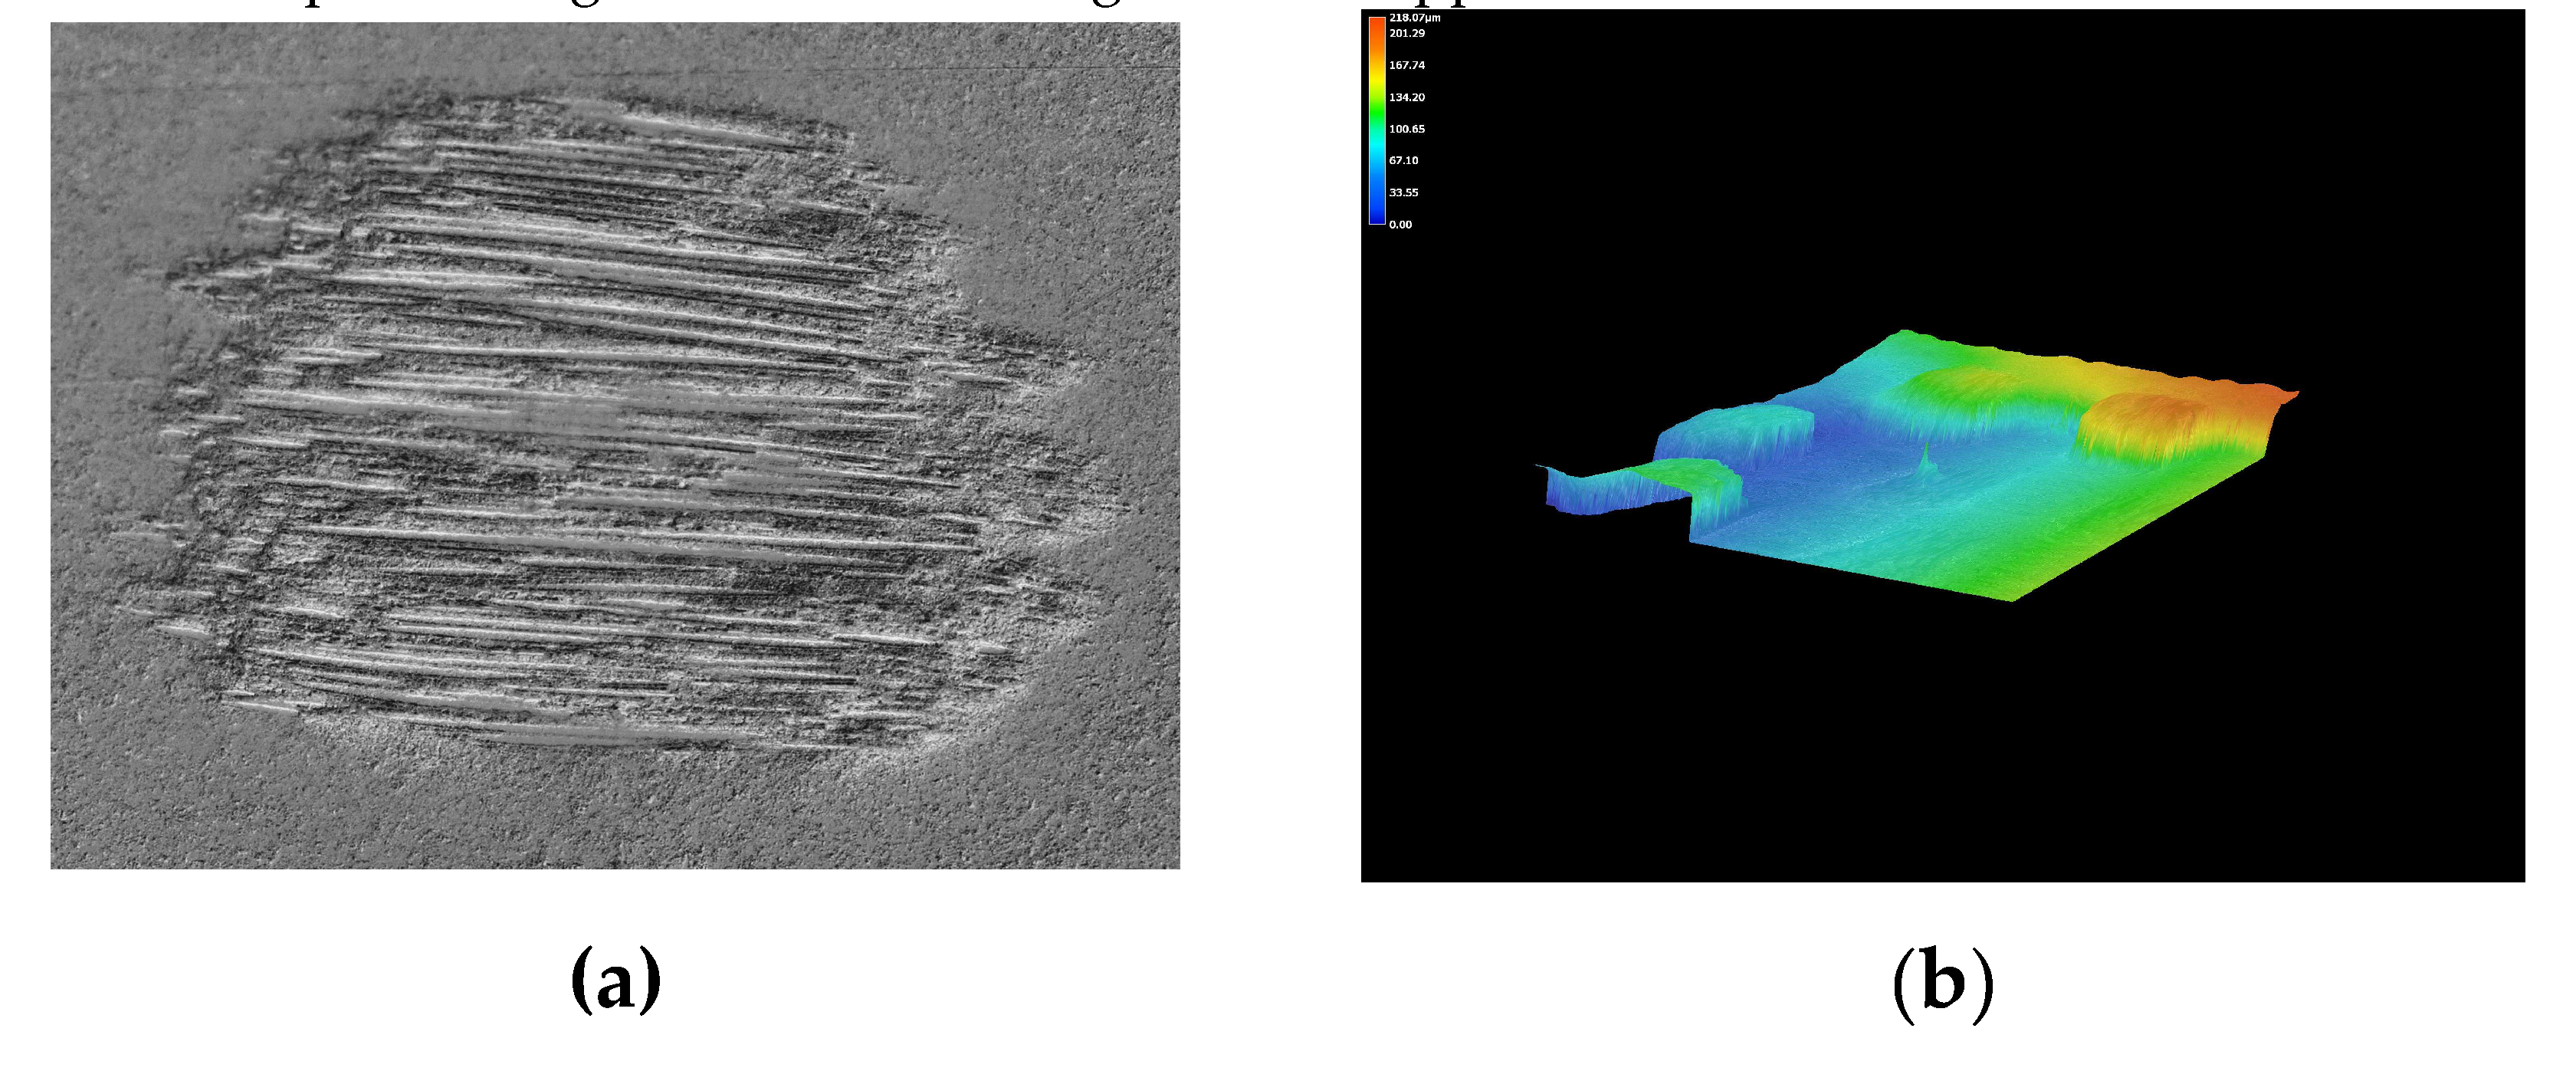
Figure 10 shows some views of the specimen after testing for depth profiling using Keyence VHX7000. The aggressive marine environmental effect on GFRP at an angle of 75° altered the specimen shape, causing the erodent cutting action to appear.
3.4. Erosion Wastage Maps
Wear maps demonstrate the mechanistic transformation occurring on the deteriorated surfaces of the exam specimens under several operation situations[
7].The authors Rasool et al. [
8]. Outline the construction of these maps and the procedures followed in the study. This visualisation technique enables operators to forecast the safety level during tidal turbine blade operation.
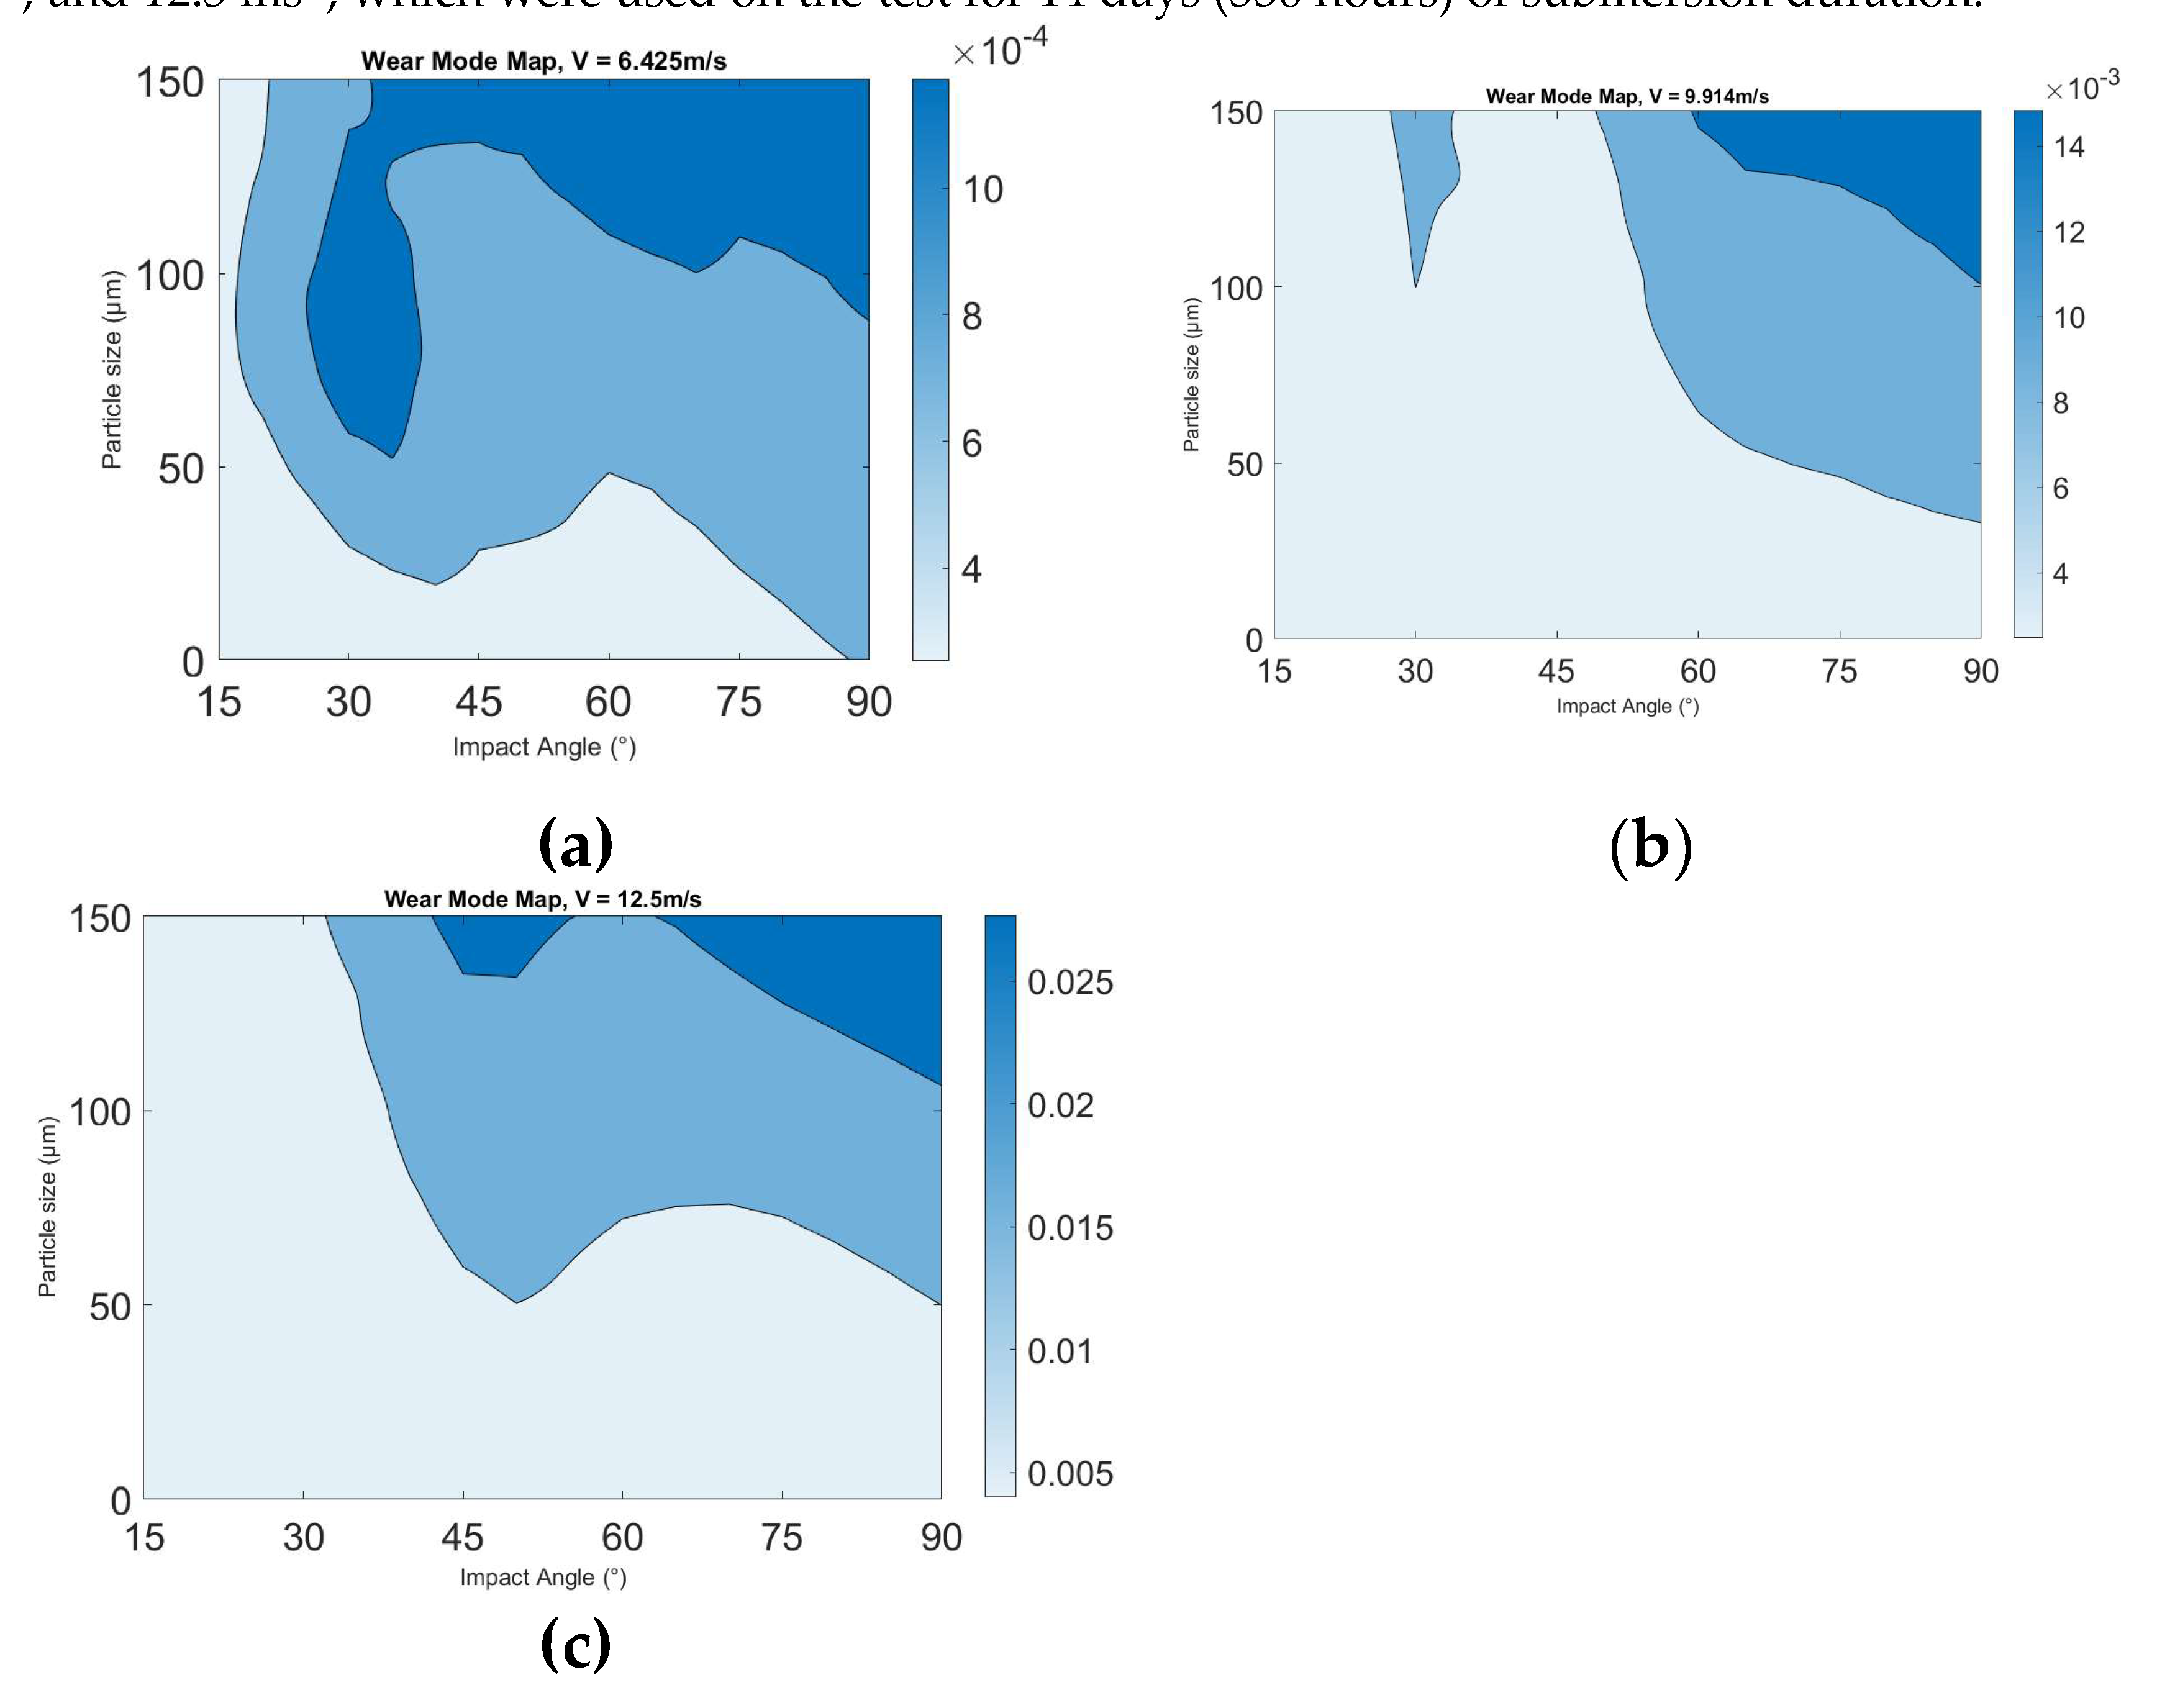
Figure 11 below shows the erosion maps of impact angels from the range 0° - 90° and sand practical sizes of 0 – 50µm, 50 – 100µm and 100 – 150µm. In addition, each map shows the impact velocity of 6.425ms
-1, 9.914 ms
-1, and 12.5 ms
-1, which were used on the test for 14 days (336 hours) of submersion duration.
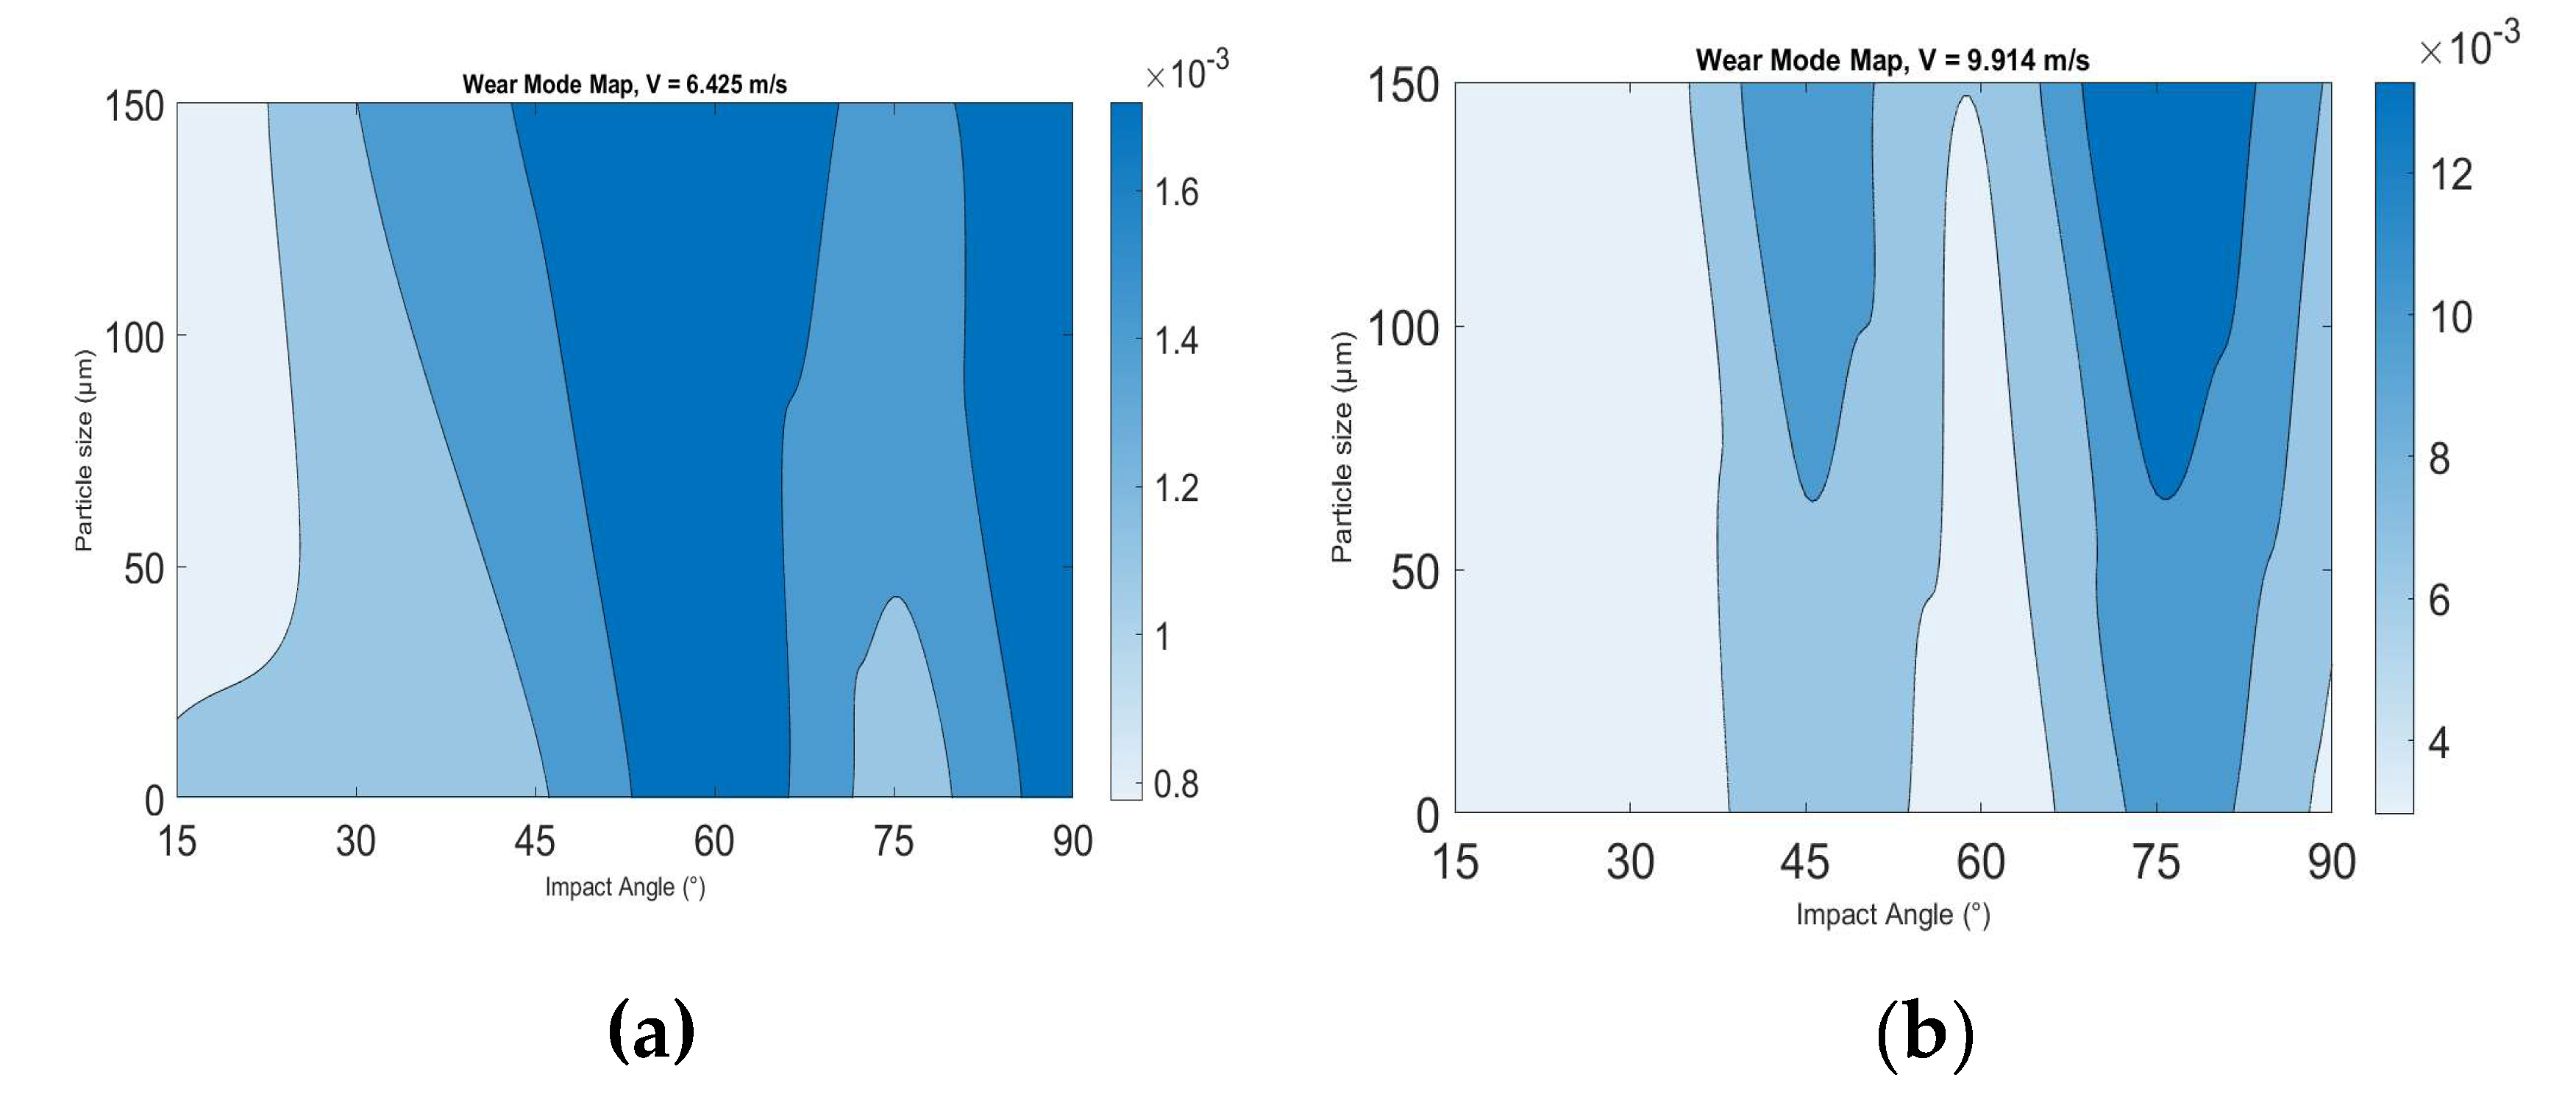
Moreover, the 91 days (2,184 hours) erosion wastage maps were found at velocities of 6.425ms
-1 and 9.914ms
-1 for sand practical sizes of 50 – 100µm and 100 – 150µm, as shown in
Figure 12 (a) and (b).
4. Discussion
4.1. Trends on the Effect of Particle Size, Velocity, Impact Angle and Exposure Time
Erosive wear is the term used to describe the removal of materials from a surface caused by the impact of particles. Multiple parameters influence impact erosion and involve various wear mechanisms[
9]. Many studies have investigated and quantified the impact of various parameters on solid particle slurry erosion. These parameters can be categorized into slurry characteristics, Target material properties, solid particle properties and impingement conditions[
10]. The size, shape, and hardness of the eroding particles, as well as the impact velocity and impact angle of the erodent particles, are the main variables influencing the rate of material erosion [11-14]. While considering these parameters, this paper additionally considered specimen exposure time, as Rasool et al. recommended. [
4].
Figure 2, 3, and 4 show mass loss as a function of impact angle for three different velocities under three conditions of sand particle size, with an exposure time of two weeks. The data indicates that all the specimens lost weight after the test on all impact angles from 15° to 90°.In
Figure 2, the mass loss increases with particle size from 45° to 90°; the relationship at this range is more likely to be a liner. Otherwise, at 30°, the mass loss sand particle size 50 – 100µm had higher mass loss than the 100 – 150µm range. Previous studies indicate that environmental change has a substantial influence; variables such as erodent particle, impact velocity, and impact angle result in a maximum mass loss at intermediate impact angles [
15,
16]. On the other hand, the mass loss was at a higher impact angle see
Figure 3 and
Figure 4.
However,
Figure 5 and 6 show the mass loss after 91 days (2,184 hours) of exposure using the same 14 days (336 hours) exposure time parameters with changed erosion transactions. For example, in
Figure 6, the peak of mass loss was at a 75° impact angle, while in
Figure 3, it was higher at a 90° impact angle. Perhaps the change in erosion transaction is because the glass fibre material normally comprises various highly slight glass fibres. Water absorption may occur between these small threads, possibly leading to an increase in weight. Water infiltrates the composite materials by capillary transport in the gaps and imperfections at the interface between the fibre and the matrix due to the hydrophilic properties of the fibre/matrix or through a small vacuum in the matrix region. This leads to the process of water absorption[
17].
4.2. Microscopy Analysis of Erosion Mechanism
As commonly found in the literature, solid particle erosion of materials distinguishes between brittle and ductile erosion [
18]. Ductile erosion refers to material removal caused by cutting and ploughing, whereas brittle erosion occurs when material is removed due to crack formation. In polymer composite materials, it is commonly observed that their behaviour falls between two extremes: ductile matrix and brittle Reinforcement. The specific behaviour of the material depends on factors such as the manufacturing process, the properties of the composite, and the level of erosion caused by impacting particles[
19],[
20].
The surface morphology of eroded surfaces shows the specific types of erosive wear on the test specimens. Therefore, this study uses two types of analysis, depth profiling and SEM, to determine the wear mechanism impingement angles from 15° to 90°.
Figure 7(a) shows the surface morphology of the specimen using the Scanning Electron Microscope (SEM) (Hitachi S-3700) for exposure time for two weeks at a fixed 60° with a slurry velocity of 12.5m/s. The figure demonstrates that the specimen gradually deteriorated over time. The depth profiling analysis VHX7000 was used to understand the specimen better, as shown in
Figure 7(b,c). The depth profiling establishes that the material removal in the composite, which is approximately in the range of 752µՠ in-depth, is dominated by forming a sizeable crater-shaped cavity. and other indentations correlated with linear scrapes. A similar analysis was conducted at 90°, as shown in
Figure 8(a, b, c). This indicates proof of fibre crumbling throughout the eroded surfaces of the specimen. In addition, the depth proofing appears to be bigger at 90° when recorded at value 776µՠ.
4.3. Erosion Maps and Potential Applications
Wear and erosion maps illustrate the mechanistic alterations occurring on the worn surfaces of the test samples under various operation situations[7,21-24]. Constructing wear mode maps aids in comprehending and clear-sighted the mechanisms implicated in material deterioration and the chemical impacts on the surface. Wear mode maps clearly represent the rates at which materials are wasted and also indicate the optimal operating parameters for the chosen material[
25]. The results,
Figure 11 and
Figure 12 indicate that these maps can ease interpretation of the multi-variable interactions involved in the process. Such maps are an important tool in optimizing tidal energy material degradation due to erosion parameters.
5. Conclusions
(i) Glass fibre reinforcement polymeric materials were evaluated over a range of particle size, velocity, and impact angle.
(ii) The results have indicated significant changes in the materials as a function of these variables.
(iii) As the exposure time changed, the trends on the effects of the above variables were modified, demonstrating the important effect of exposure time in the degradation mechanism.
(iv) The crack initiation and propagation through the composite material were enhanced with increasing exposure time.
(v) Erosion maps were generated to demonstrate the changes in erosion mechanisms.
(vi) Such tools may be used to optimize such materials in tidal turbine conditions.
Funding
The authors would like to acknowledge the support of the Interreg (Northern Ireland—Ireland—Scotland) Special EU Programmes Grant No SPIRE2_INT–VA–049 “Storage Platform for the Integration of Renewable Energy (SPIRE 2)”.In addition, Libyan Academic Attache, London, UK.
Conflicts of Interest
The authors declare no conflict of interest.
References
- Shiekh Elsouk, M.; Santa Cruz, A.; Guillou, S. Review on the characterization and selection of the advanced materials for tidal turbine blades. In Proceedings of Proceedings of the 7th International Conference on Ocean Energy; pp. 12–14.
- Grogan, D.M.; Leen, S.B.; Kennedy, C.R.; Brádaigh, C.Ó. Design of composite tidal turbine blades. Renewable Energy 2013, 57, 151–162. [Google Scholar] [CrossRef]
- McEwen, L.; Evans, R.; Meunier, M. Cost-effective tidal turbine blades. In Proceedings of 4th International Conference on Ocean Energy.
- Rasool, G.; Johnstone, C.; Stack, M.M. Tribology of tidal turbine blades: impact angle effects on erosion of polymeric coatings in sea water conditions.
- Groucott, S.; Pugh, K.; Zekos, I.; M Stack, M. A study of raindrop impacts on a wind turbine material: Velocity and impact angle effects on erosion maps at various exposure times. Lubricants 2021, 9, 60. [Google Scholar] [CrossRef]
- https://www.holbourne.co.uk/. Availabe online: Holbourne Industrial Plastics, “Industrial Laminates & Industrial Engineering Plastics | Holbourne,” Holbourne Industrial Plastics | Suppliers of Engineering Plastics to the UK, Europe, USA and Asia, Mar. 06, 2012. https://www.holbourne.co.uk/ (accessed on.
- Lim, S. Recent developments in wear-mechanism maps. Tribology International 1998, 31, 87–97. [Google Scholar] [CrossRef]
- Rasool, G.; Stack, M.M. Some views on the mapping of erosion of coated composites in tidal turbine simulated conditions. Tribology Transactions 2019. [Google Scholar] [CrossRef]
- Ediriweera, M.; Chladek, J.; Ratnayake, C. Effect of impact angle, exposure time, and particle size on impact erosion. Particulate Science and Technology 2021, 39, 10–18. [Google Scholar] [CrossRef]
- Javaheri, V.; Porter, D.; Kuokkala, V.-T. Slurry erosion of steel–Review of tests, mechanisms and materials. Wear 2018, 408, 248–273. [Google Scholar] [CrossRef]
- Tsai, W.; Humphrey, J.; Cornet, I.; Levy, A. Experimental measurement of accelerated erosion in a slurry pot tester. Wear 1981, 68, 289–303. [Google Scholar] [CrossRef]
- Lindgren, M.; Perolainen, J. Slurry pot investigation of the influence of erodent characteristics on the erosion resistance of austenitic and duplex stainless steel grades. Wear 2014, 319, 38–48. [Google Scholar] [CrossRef]
- Bhushan, B. Principles and applications of tribology; John wiley & sons: 2013.
- Salik, J.; Buckley, D.H. Effects of erodant particle shape and various heat treatments on erosion resistance of plain carbon steel; 1981.
- Wensink, H.; Elwenspoek, M.C. A closer look at the ductile–brittle transition in solid particle erosion. Wear 2002, 253, 1035–1043. [Google Scholar] [CrossRef]
- Sparks, A.; Hutchings, I. Transitions in the erosive wear behaviour of a glass ceramic. Wear 1991, 149, 99–110. [Google Scholar] [CrossRef]
- Kumar, M.; Jena, H. Water absorption behaviour of glass fibre-reinforced polymer composite with clamshell and cenosphere fillers. Proceedings of the Institution of Mechanical Engineers, Part E: Journal of Process Mechanical Engineering 2022, 09544089221132433.
- Hutchings, I. Friction and wear of ceramics. Elsevier: 1995.
- Arjula, S.; Harsha, A. Study of erosion efficiency of polymers and polymer composites. Polymer testing 2006, 25, 188–196. [Google Scholar] [CrossRef]
- Patnaik, A.; Biswas, S.; Kaundal, R.; Satapathy, A. Damage assessment of short glass fiber reinforced polyester composites: a comparative study. In Nanocomposites with Unique Properties and Applications in Medicine and Industry, IntechOpen: 2011.
- Hassan, E.; Zekos, I.; Jansson, P.; Pečur, T.; Floreani, C.; Robert, C.; O'Bradaigh, C.; Stack, M. Erosion Mapping of Through-Thickness Toughened Powder Epoxy Gradient Glass-Fiber-Reinforced Polymer (GFRP) Plates for Tidal Turbine Blades. Lubricants 2021, 9. [Google Scholar] [CrossRef]
- Macdonald, J.; Stack, M.M. Generating composite material maps from numerical simulation of hailstone impact. Journal of Bio-and Tribo-Corrosion 2024, 10, 1–8. [Google Scholar] [CrossRef]
- Ritchie, F.; Jana, B.; Zekos, I.; Stack, M. On the construction methodology of microabrasion-corrosion maps using theoretical approaches. Journal of Bio-and Tribo-Corrosion 2024, 10, 18. [Google Scholar] [CrossRef]
- Macdonald, J.; Stack, M. Some thoughts on modelling hail impact on surfaces. Journal of Bio-and Tribo-Corrosion 2021, 7, 1–7. [Google Scholar] [CrossRef]
- Stack, M. Bridging the gap between tribology and corrosion: from wear maps to Pourbaix diagrams. International Materials Reviews 2005, 50, 1–17. [Google Scholar] [CrossRef]
Figure 1.
Schematic Diagram of Slurry Erosion Impingement Rig.
Figure 1.
Schematic Diagram of Slurry Erosion Impingement Rig.
Figure 2.
Mass loss (g) of GFRP after 14 days (336 hours) pre-exposure at a velocity of 6.425ms-1 & Sand size 0 – 50µm, 50 – 100µm, 100 - 150µm.
Figure 2.
Mass loss (g) of GFRP after 14 days (336 hours) pre-exposure at a velocity of 6.425ms-1 & Sand size 0 – 50µm, 50 – 100µm, 100 - 150µm.
Figure 3.
Mass loss (g) of GFRP after 14 days (336 hours) pre-exposure at a velocity of 9.914ms & Sand size 0 – 50µm, 50 – 100µm, 100 - 150µm.
Figure 3.
Mass loss (g) of GFRP after 14 days (336 hours) pre-exposure at a velocity of 9.914ms & Sand size 0 – 50µm, 50 – 100µm, 100 - 150µm.
Figure 4.
Mass loss (g) of GFRP after 14 days (336 hours) pre-exposure at a velocity of 12.5ms-1 & sand size 0 – 50µm, 50 – 100µm, 100 - 150µm.
Figure 4.
Mass loss (g) of GFRP after 14 days (336 hours) pre-exposure at a velocity of 12.5ms-1 & sand size 0 – 50µm, 50 – 100µm, 100 - 150µm.
Figure 5.
Mass loss (g) of GFRP after 91 days (2,184 hours) pre-exposure at a velocity of 6.425 ms-1 & sand size 50 – 100µm, 100 - 150µm.
Figure 5.
Mass loss (g) of GFRP after 91 days (2,184 hours) pre-exposure at a velocity of 6.425 ms-1 & sand size 50 – 100µm, 100 - 150µm.
Figure 6.
Mass loss (g) of GFRP after 91 days (2,184 hours) pre-exposure at a velocity of 9.914 m/s & sand size 50 – 100µm, 100 - 150µm.
Figure 6.
Mass loss (g) of GFRP after 91 days (2,184 hours) pre-exposure at a velocity of 9.914 m/s & sand size 50 – 100µm, 100 - 150µm.
Figure 7.
(a) SEM microphotograph of GFRP specimen surface for 14-day (336-hour) duration at sand practical size 100 – 150µm, velocity 12.5ms-1 and impact angle 60°. (b) (c) views of depth profiling analysis using VHX7000.
Figure 7.
(a) SEM microphotograph of GFRP specimen surface for 14-day (336-hour) duration at sand practical size 100 – 150µm, velocity 12.5ms-1 and impact angle 60°. (b) (c) views of depth profiling analysis using VHX7000.
Figure 8.
(a) SEM microphotograph of GFRP specimen surface for 14-day (336-hour) duration at sand practical size 100 – 150µm, velocity 12.5ms-1 and impact angle 90°. (b) (c) views of depth profiling analysis using VHX7000 showing the depth of GFRP for 60 minutes teat.
Figure 8.
(a) SEM microphotograph of GFRP specimen surface for 14-day (336-hour) duration at sand practical size 100 – 150µm, velocity 12.5ms-1 and impact angle 90°. (b) (c) views of depth profiling analysis using VHX7000 showing the depth of GFRP for 60 minutes teat.
Figure 9.
(a) SEM microphotograph of GFRP specimen surface for 91 days (2,184 hours) duration at sand practical size 100 – 150µm, velocity 6.425 ms-1 and impact angle 60°. (b) SEM for sand particle size 50 – 100µm, velocity 6.425 ms-1 and impact angle 60°.
Figure 9.
(a) SEM microphotograph of GFRP specimen surface for 91 days (2,184 hours) duration at sand practical size 100 – 150µm, velocity 6.425 ms-1 and impact angle 60°. (b) SEM for sand particle size 50 – 100µm, velocity 6.425 ms-1 and impact angle 60°.
Figure 10.
(a) (b) Depth profiling of the specimen surface for 91 days (2,184 hours) at sand practical size 100 – 150µm, velocity 9.914ms-1, and impact angle 75°.
Figure 10.
(a) (b) Depth profiling of the specimen surface for 91 days (2,184 hours) at sand practical size 100 – 150µm, velocity 9.914ms-1, and impact angle 75°.
Figure 11.
Erosion wastage maps of GFRP specimens for 14 days (336 hours) pre-exposure in aqueous media (a) 6.425ms-1 (b) 9.914ms-1 (c) 12.5ms-1.
Figure 11.
Erosion wastage maps of GFRP specimens for 14 days (336 hours) pre-exposure in aqueous media (a) 6.425ms-1 (b) 9.914ms-1 (c) 12.5ms-1.
Figure 12.
Erosion wastage maps of GFRP specimens for 91 days (2,184 hours) pre-exposure in aqueous media (a) 6.425ms-1 (b) 9.914ms-1.
Figure 12.
Erosion wastage maps of GFRP specimens for 91 days (2,184 hours) pre-exposure in aqueous media (a) 6.425ms-1 (b) 9.914ms-1.
Table 1.
Erosion test parameters.
Table 1.
Erosion test parameters.
| Parameter |
Value |
| Impingement angle |
15°, 30°, 45°, 60°, 75°, 90° |
| Solution |
Water, Salt, and Sand |
| Water tank capacity (Liter) |
13 liters |
| Salinity (wt %) |
3.5% |
| Sand concentration (wt%) |
3% |
| Test duration (min) |
60 min |
| Ageing duration |
Two weeks, three months |
| Temperature |
10℃ ±1℃ |
| Sand Particle Size (µm) |
0-50µm, 50-100µm, 100-150µm |
| Impact velocity (ms-1) |
6.425 ms-1, 9.914 ms-1, 12.5 ms-1
|
Table 2.
Technical Data, Mechanical and Electrical Properties of GFRP-FR4.
Table 2.
Technical Data, Mechanical and Electrical Properties of GFRP-FR4.
| Technical Data |
Units |
Test Method |
Values |
| Colour |
- |
- |
Light Green |
| Specific Gravity |
g/cm3; |
ISO 1183 |
1.95 |
| Water Absorption |
mg |
ISO 62 |
5.5 |
| Temperature Index |
- |
IEC 60216 |
130°C |
| Mechanical Properties |
|
|
|
| Flexural Strength |
MPa |
ISO 178 |
500 |
| Compressive Strength |
MPa |
ISO 604 |
- |
| Impact Strength Charpy |
kJ/M 2; |
ISO 179 |
60 |
| Tensile Strength |
MPa |
ISO 527 |
450 |
| Electrical Properties |
|
|
|
| Insulation Resistance |
MΩ |
IEC 60893 |
1.0 x 10⁹ |
| Breakdown Voltage |
kV |
IEC 60243 |
42 |
| Dielectric Strength |
kV/mm |
IEC 60243 |
24 |
|
Disclaimer/Publisher’s Note: The statements, opinions and data contained in all publications are solely those of the individual author(s) and contributor(s) and not of MDPI and/or the editor(s). MDPI and/or the editor(s) disclaim responsibility for any injury to people or property resulting from any ideas, methods, instructions or products referred to in the content. |
© 2024 by the authors. Licensee MDPI, Basel, Switzerland. This article is an open access article distributed under the terms and conditions of the Creative Commons Attribution (CC BY) license (http://creativecommons.org/licenses/by/4.0/).

