Preprint
Article

µCT Imaging of Wheat Spikes Reveals Effect of Chronic Ozone on Individual Grains

Altmetrics

Downloads

102

Views

32

Comments

0

Submitted:

09 August 2024

Posted:

21 August 2024

You are already at the latest version

Alerts
Abstract
Ground level ozone is an abiotic stress estimated to reduce mean global annual wheat yields by nearly 10%. This study in solardomes exposed an elite cultivar, and multiple lines of synthetic wheat (primary and F2) to four levels of ozone (30 ppb, 55 ppb, 80 ppb, 110 ppb) for three months, with two lines (cv Paragon and an F2 line, BC1) selected for X-ray microcomputed tomography. The uCT imaging revealed ozone’s effect on individual grain formation, both spatially within the spike and on grain shape. Reductions in grain number occurred primarily across the middle of the spike. Grain volume reductions were driven more by reduced width and depth than reduced length. Based on yield data, both lines demonstrated relative tolerance to ozone. Links between ozone’s effects on grain morphology and grain quality are also explored. These data provide information that could be utilised in wheat breeding programmes to increase tolerance to ozone of this staple food crop.
Keywords: 
Subject: Biology and Life Sciences  -   Plant Sciences

1. Introduction

1.1. Ground Level Ozone and Wheat Yields

Ground level ozone continues to occur at phytotoxic levels in many wheat-growing areas of the world as a result of increasing emissions of anthropogenic-derived precursor gases (Royal Society 2008; Fleming et al. 2018) with annual average concentrations (2010 – 2014) ranging from ambient (20-30 ppb) to highly phytotoxic (80 – 100+ ppb) (Fleming et al. 2018; E. A. Ainsworth, Lemonnier, and Wedow 2020). Wheat is ozone sensitive and ozone is estimated to suppress annual wheat yields in the northern hemisphere by an average of 9.9% (Mills et al. 2018; Håkan Pleijel et al. 2018).
The damage occurs when ozone enters the plant through stomata, where it reacts inside the leaf cells, increasing levels of Reactive Oxygen Species (ROS) which, if left unchecked by antioxidants, cause a chain of reactions that can ultimately lead to earlier senescence, reduced rates of photosynthesis, and subsequently reduced assimilation and storage of carbon (Elizabeth A. Ainsworth et al. 2012; Emberson et al. 2018; Grulke and Heath 2020).
These effects can result in reductions in grain number (due to effects on floret fertility before and up to anthesis) and individual grain size (due to effects on the grain fill period largely after anthesis). Meta-analyses of the effects of ozone on wheat (Z. Z. Feng et al. 2009; Z. Feng and Kobayashi 2009; Broberg et al. 2015; Håkan Pleijel et al. 2018) show reductions in grain number, grain weight, and overall total yields, with the effect increasing as ozone concentrations increase. Grain number reductions ranged from 1% - 2% at 30-35 ppb (Broberg et al. 2015; Håkan Pleijel et al. 2018) to 11% at 77 ppb (Z. Z. Feng et al. 2009); grain weight reductions from 3.6% at 36 ppb (Håkan Pleijel et al. 2018) to 18% at 77 ppb (Z. Z. Feng et al. 2009), whilst total average yield reductions ranged from 8.4% at 36 ppb (Håkan Pleijel et al. 2018) to 26% at 77 ppb (Z. Z. Feng et al. 2009).
These yield losses are widely understood to result primarily from reductions in assimilates and earlier senescence (Elizabeth A. Ainsworth et al. 2012; Emberson et al. 2018) which can bring forward anthesis and the timing of grain maturity, thereby shortening the grain fill period and, therefore, the size of grains (Gelang et al. 2000) although the exact mechanism is unclear (H Pleijel et al. 1998; Soja et al. 2000; Z. Z. Feng et al. 2009). These effects on grain filling are also associated with a reduction in the proportion of starch and increase in the concentration of protein in the grain, thereby affecting grain quality and total yields of starch and protein (Broberg et al. 2015).
The negative effect of ozone on wheat yields are similar to those reported from research into the effects of other forms of abiotic stress such as heat and drought which have been widely studied and reviewed (Barnabás, Jäger, and Fehér 2008; Ullah et al. 2021). The creation of excess ROS is a common factor, with effects on grain size linked to reductions in photosynthetic activity and assimilate production, especially in the post anthesis period (Ullah et al. 2021).

1.2. Wheat Breeding for Improved Yields

Global wheat yield productivity has dramatically increased over the past 60 years, from an average yield of 1.15 tons ha-1 in 1960 to an average of 3.49 tons ha-1 in 2021 (United States Department of Agriculture - Economic Research Service 2022), generated in large part by an improved harvest index, and resulting primarily in additional grains within each spikelet (Calderini and Ortiz-Monasterio 2003; Zhou et al. 2021) across the whole of the spike (Philipp et al. 2018) though with reduced average grain size (Flintham et al. 1997; F. Feng et al. 2018). Increasing grain numbers, and the size of grains, is now the target for wheat breeders in order to meet a productivity target of 5.9 t ha-1 by 2050 (Hawkesford et al. 2013; M. P. Reynolds et al. 2021). But achieving this will be challenging, not least in the face of increasing abiotic stress imposed on crops by both climate change and air pollution, including ozone (M. Reynolds et al. 2011; Knox et al. 2016; Bailey-Serres et al. 2019; Mills et al. 2018). Wheat lines that have genetic traits for abiotic tolerance and for larger grain size are therefore of interest to wheat breeders. Although ozone has been found to have a similar effect on both spring and winter wheat (Z. Z. Feng et al. 2009), genetic variation in sensitivity to ozone between wheat cultivars has often been noted, with older cultivars sometimes found to be more tolerant than recent ones (Barnes et al. 1990; H. Pleijel et al. 2006; Sarkar and Agrawal 2010; Brewster, Hayes, and Fenner 2019), and some attempts have been made to systematically identify tolerant lines (Singh et al. 2018).
In genetic analysis undertaken in combination with µCT image analysis of both conventional and synthetic cultivars, most marker trait associations for grain shape and size were found within the D genome (Ali et al. 2020). Synthetic wheat, which carries a higher percentage of the D genome than conventional bread wheat, is therefore a valuable resource for improving grain weight (Rasheed et al. 2018; Ali et al. 2020), whilst one primary synthetic line has also previously been found with high ozone tolerance (Brewster, Hayes, and Fenner 2019).

1.3. Use of µCT Imaging

X-ray micro-computed tomography (µCT), a form of digital imaging, is being used increasingly within plant science as it enables non-destructive analysis of plant organs, the creation of three-dimensional (3D) images of plant structures, and the possibility of rapid automated phenotyping of desirable traits which would previously have been impossible or too time consuming (Strange et al. 2015; Rasheed et al. 2014).
Within wheat grain research µCT digital imaging has revealed the effects of abiotic stress on wheat spikes, including reduced grain numbers per spikelet across the middle region of the spike induced by drought (Hughes et al. 2017) and reduced grain volume in the upper and lower spike regions in response to heat and drought (Schmidt et al. 2020). However, it is unclear whether ozone affects grain formation across the spike in the same way, and the authors are not aware that µCT imaging has ever been applied to ozone-affected wheat before.

1.4. Aims of the Study

This study, utilising µCT digital imaging, aimed to identify the impact of ozone on both wheat grain formation across the spike and on individual grain morphology on a selection of lines to provide a detailed picture of the effects within each spike. It aimed also to investigate the relationship between grain morphology, and grain quality. An additional aim was to assess the relative ozone sensitivities of the elite cultivar, cv. Paragon, a line of primary synthetic wheat (SHW) and a synthetic wheat line (BC1) derived from these two parents.
The µCT digital imaging of in situ grains revealed that elevated ozone causes reductions in grain numbers particularly across the middle region of the spike, with grain size reductions driven more by reduced grain width and depth, than by reduced length. Yield data suggested that both Paragon and BC1 demonstrated some degree of tolerance to ozone, with yield characteristics which could be exploited in future wheat breeding for yield improvements in the face of abiotic stress.

2. Materials and Methods

2.1. Plant Establishment

The study was conducted in 2019 at the UK Centre for Ecology & Hydrology’s air pollution facility, Abergwyngregyn, North Wales (53.2oN, 4.0oW) using one line of primary synthetic hexaploid spring wheat (NIAB – SHW – 027), one line of the elite spring cultivar Paragon (T. aestivum L, cv. Paragon), and nine lines of F2 hybrids derived from them, each with the pedigree Paragon x (Paragon x NIAB SHW 027) (Table 1). The seed for all synthetic lines was obtained from the National Institute of Agricultural Botany (NIAB).
Seeds were germinated (29 – 31 March) in petri dishes at room temperature, and germinated seedlings transplanted into modular plug trays of John Innes No.1 (Levington) low nutrient seed compost. Plants were vernalised for 30 days (2 April – 2 May, 16 h day length, 1.2 k lux light intensity, 5oC), then transplanted, two plants per pot, into 6L round, black, plastic pots (25 cm deep, 20 cm diameter at the rim) of sieved and mixed sandy-loam farm soil (Henfaes Research Station, Abergwyngregyn, North Wales).
Plants were grown on in a glasshouse for 3 weeks, with pots randomly rotated each 4 - 6 days. Each line had three replicate pots (each with two yield-bearing plants) per treatment. To maintain soil moisture levels, all pots were manually watered, daily or as required, for the duration of the study. Before the start of treatments there was 81.5 kg N ha-1 of available nitrogen in the soil. 100 kg N ha-1 of ammonium nitrate was applied to all lines, in split doses (Table S1). Fungicide and insecticide treatments were applied as necessary to maintain plant health and applied to all plants in all treatments on each occasion (Table S2). An assessment which rated any greenfly and/or powdery mildew infection using a simple index score was carried out on all plants on 9 July (Figure S1).

2.2. Ozone Treatment

At ‘stem elongation’ growth stages (GS33 – 37)(Zadoks, Chang, and Konzak 1974) replicates were randomly selected for each treatment and positioned in one of four identical hemispherical glasshouses (solardomes, 2.1 m high, 3 m diameter), on 28 May. During treatments, plants were also randomly re-distributed within the domes every 7 - 10 days. Ozone treatments, starting 30 May, were achieved using Pulse Width Modulation (PWM)1, with peak concentrations of low (30 ppb / control), medium (55 ppb), high (80 ppb) and very high (110 ppb),(Figure 1), which were maintained for 11.5 weeks until all plants ripened and were harvested (19 Aug).
To mimic natural ozone exposure episodes these concentrations were all reduced to ~20 ppb at night-time and for two days per week. The mean temperature inside the solardomes during the trial was 23.9oC. The environmental conditions of light, temperature and relative humidity are the same within each solardome (Hewitt et al. 2016; Harmens et al. 2019).
The solardomes were ventilated, with air changes occurring approximately twice per minute. Ozone was added to charcoal filtered air via PTFE tubing from a controlled injection system (ozone supplied by a G11 ozone generator, Ozone Industries, Andover, UK using oxygen from an oxygen concentrator Sequel 10, Pure O2, Urmston, UK), with computer-controlled concentrations (Lab VIEW version 2012, National Instruments, Austin, TX, USA). Two calibrated automatic ozone analysers (400a, Enviro Technology Services, Stroud, UK, and Thermo Scientific Model 49i Electron O3 Analyser, Fischer Scientific, Waltham, MA, USA) monitored the ozone concentrations every 30 minutes in each solardome.

2.3. Chlorophyll Index

Non-destructive measurements of relative chlorophyll concentrations (SPAD units) were made (CCM 200, ADC Biosciences, UK), taking a measurement from the upper surface in the middle section of one flag leaf, one 2nd leaf, and a randomly selected lower leaf of one of the plants in each replicate pot at pre-anthesis, anthesis, and post-anthesis growth stages. Chlorophyll data was collected on all lines but is presented for Paragon, SHW, and BC1 only.

2.4. Biomass and Yield Measurements

At harvest, fully ripened ears were cut at the base of the spike, and shoots cut just above the substrate. Roots were kept in situ in soil for 1 – 3 days before being wet sieved. Roots and shoots were dried in drying cabinets at 65oC for 14+ days then weighed. All ears from each replicate were weighed to obtain total seedhead biomass, and all ears threshed using a hand thresher (Minibatt+, Reichhardt Electronic Innovations, Hungen, Germany) for total grain weight. 1000 grain weight (TGW) was based on the weight of 100 randomly selected grains. Total grain weight and TGW data is presented for Paragon, SHW, and BC1, only.

2.5. Grain Protein and Starch

An assessment of grain protein and starch content was made with non-invasive near-infrared (NIR) spectroscopy (W. Wang and Paliwal 2007; Caporaso, Whitworth, and Fisk 2018). 10 – 100+ grains per replicate were processed at the John Innes Centre (JIC, Norwich, UK) on a Perten DA 7250 NIR analyser (Perten Instruments AB, Hägersten, Sweden), calibrated by the manufacturer, with additional use of industry standard wheat material from the recommended list varieties to calibrate protein levels for the protein tests. Data is presented for Paragon, SHW, and BC1 only.

2.6. X-ray Microcomputed Tomography (µCT) Imaging

Four lines were selected for µCT imaging: Paragon, BC1, BC5 and BC7, with data from Paragon and BC1 presented here. (See Supp. Section A, Figures S2–S4) for the reasoning behind line selection. For each line, the three heaviest fully dried spikes from each of the three replicates in each treatment were selected for imaging. Scanning conditions were as described in Hughes et al. (2017). Each spike was imaged by being placed in an individual plastic holder and scanned using a µCT 100 scanner (Scanco Medical, Switzerland) at the National Plant Phenomics Centre (Aberystwyth, UK). The resulting images were produced at a 0.2 megapixel (512 x512) resolution (68.8 µm/pixel) in a proprietary ISQ file type format (Scanco Medical, Switzerland).
Previously developed MATLAB software (Hughes et al. 2017), freely available at https://github.com/NPPC-UK/microCT_grain_analyser, was used to extract data on grain morphology using the ISQ images. Grain length (major axis of whole grain), grain width and depth (major and minor axis of a cross-section at mid-point of the grain), grain volume (a count of the complete connected pixels per grain), and surface area (single pixel perimeter calculation mapped in three dimensions) were calculated. Data on grain positions along the spike were also extracted from the 3D images by MATLAB software using XYZ co-ordinates. 3D images for visualisation were created using Fiji 3D viewing plugin (https://imagej.net/Fiji) (Jiang et al. 2016) and ‘TomViz’ (https://tomviz.org/). Numbers of spikelets and grains per spikelet on each spike were also counted manually using these 3D images.
In order to minimise any false positive counts of rachis or fused grains, a size threshold was set for the segmentation software, and any outliers in the extracted data were identified, using the 0.025 upper and lower percentiles, and removed. In addition, data and grain cross-sections were visually checked for outliers. A comparison with the manually counted grain numbers per spike (using the 3D images) with the µCT extracted grain number revealed some grains were excluded from the extracted µCT grain morphology data (Table S3). The cause was either that the grains were under the size threshold settings or that some spikes were slightly taller than the plastic holder and one or two top-most grains were therefore omitted from the µCT scan data. The greatest differences were seen in the very high (110 ppb) treatment: Paragon 21.5%, BC1 12.8%. Although in most treatments the difference between extracted data and manual counts was less than 5%, the manually counted grain numbers per spike were used in figures and statistics.

2.7. Statistical Tests

Statistical significance tests to assess the effect of ozone on each individual line (not between lines) were undertaken in R (version 4.0.2) (R Core Team 2020)(Tables S4 and S5). All model residuals and plots were examined, and data transformed if necessary. Log transformations were applied to the following data sets: BC1 total grain weight, BC1 TGW, BC1 grain length, Paragon grain width and grain depth. Linear models (package ‘stats’ version 4.0.2) were used for all parameters apart from those with repeated measures. A linear mixed model (package ‘nlme’) (Pinheiro et al. 2017) was used for the chlorophyll index data, with growth stage included as a factor. Assessments of plots and model fit determined the inclusion of an autoregressive (AR) correlation term, with model fit tested using AIC comparisons. An ANOVA ‘type 3′ (package ‘car’) (Fox and Weisberg 2011) was used to summarise model outputs. Where necessary Tukey HSD post-hoc tests were applied (package ‘multcomp) (Hothorn, Bretz, and Westfall 2008). Simple linear regression analysis was conducted in Excel (Microsoft Corporation 2016).

3. Results

3.1. Ozone Reduces Spike Number, Total Grain Number and TGW

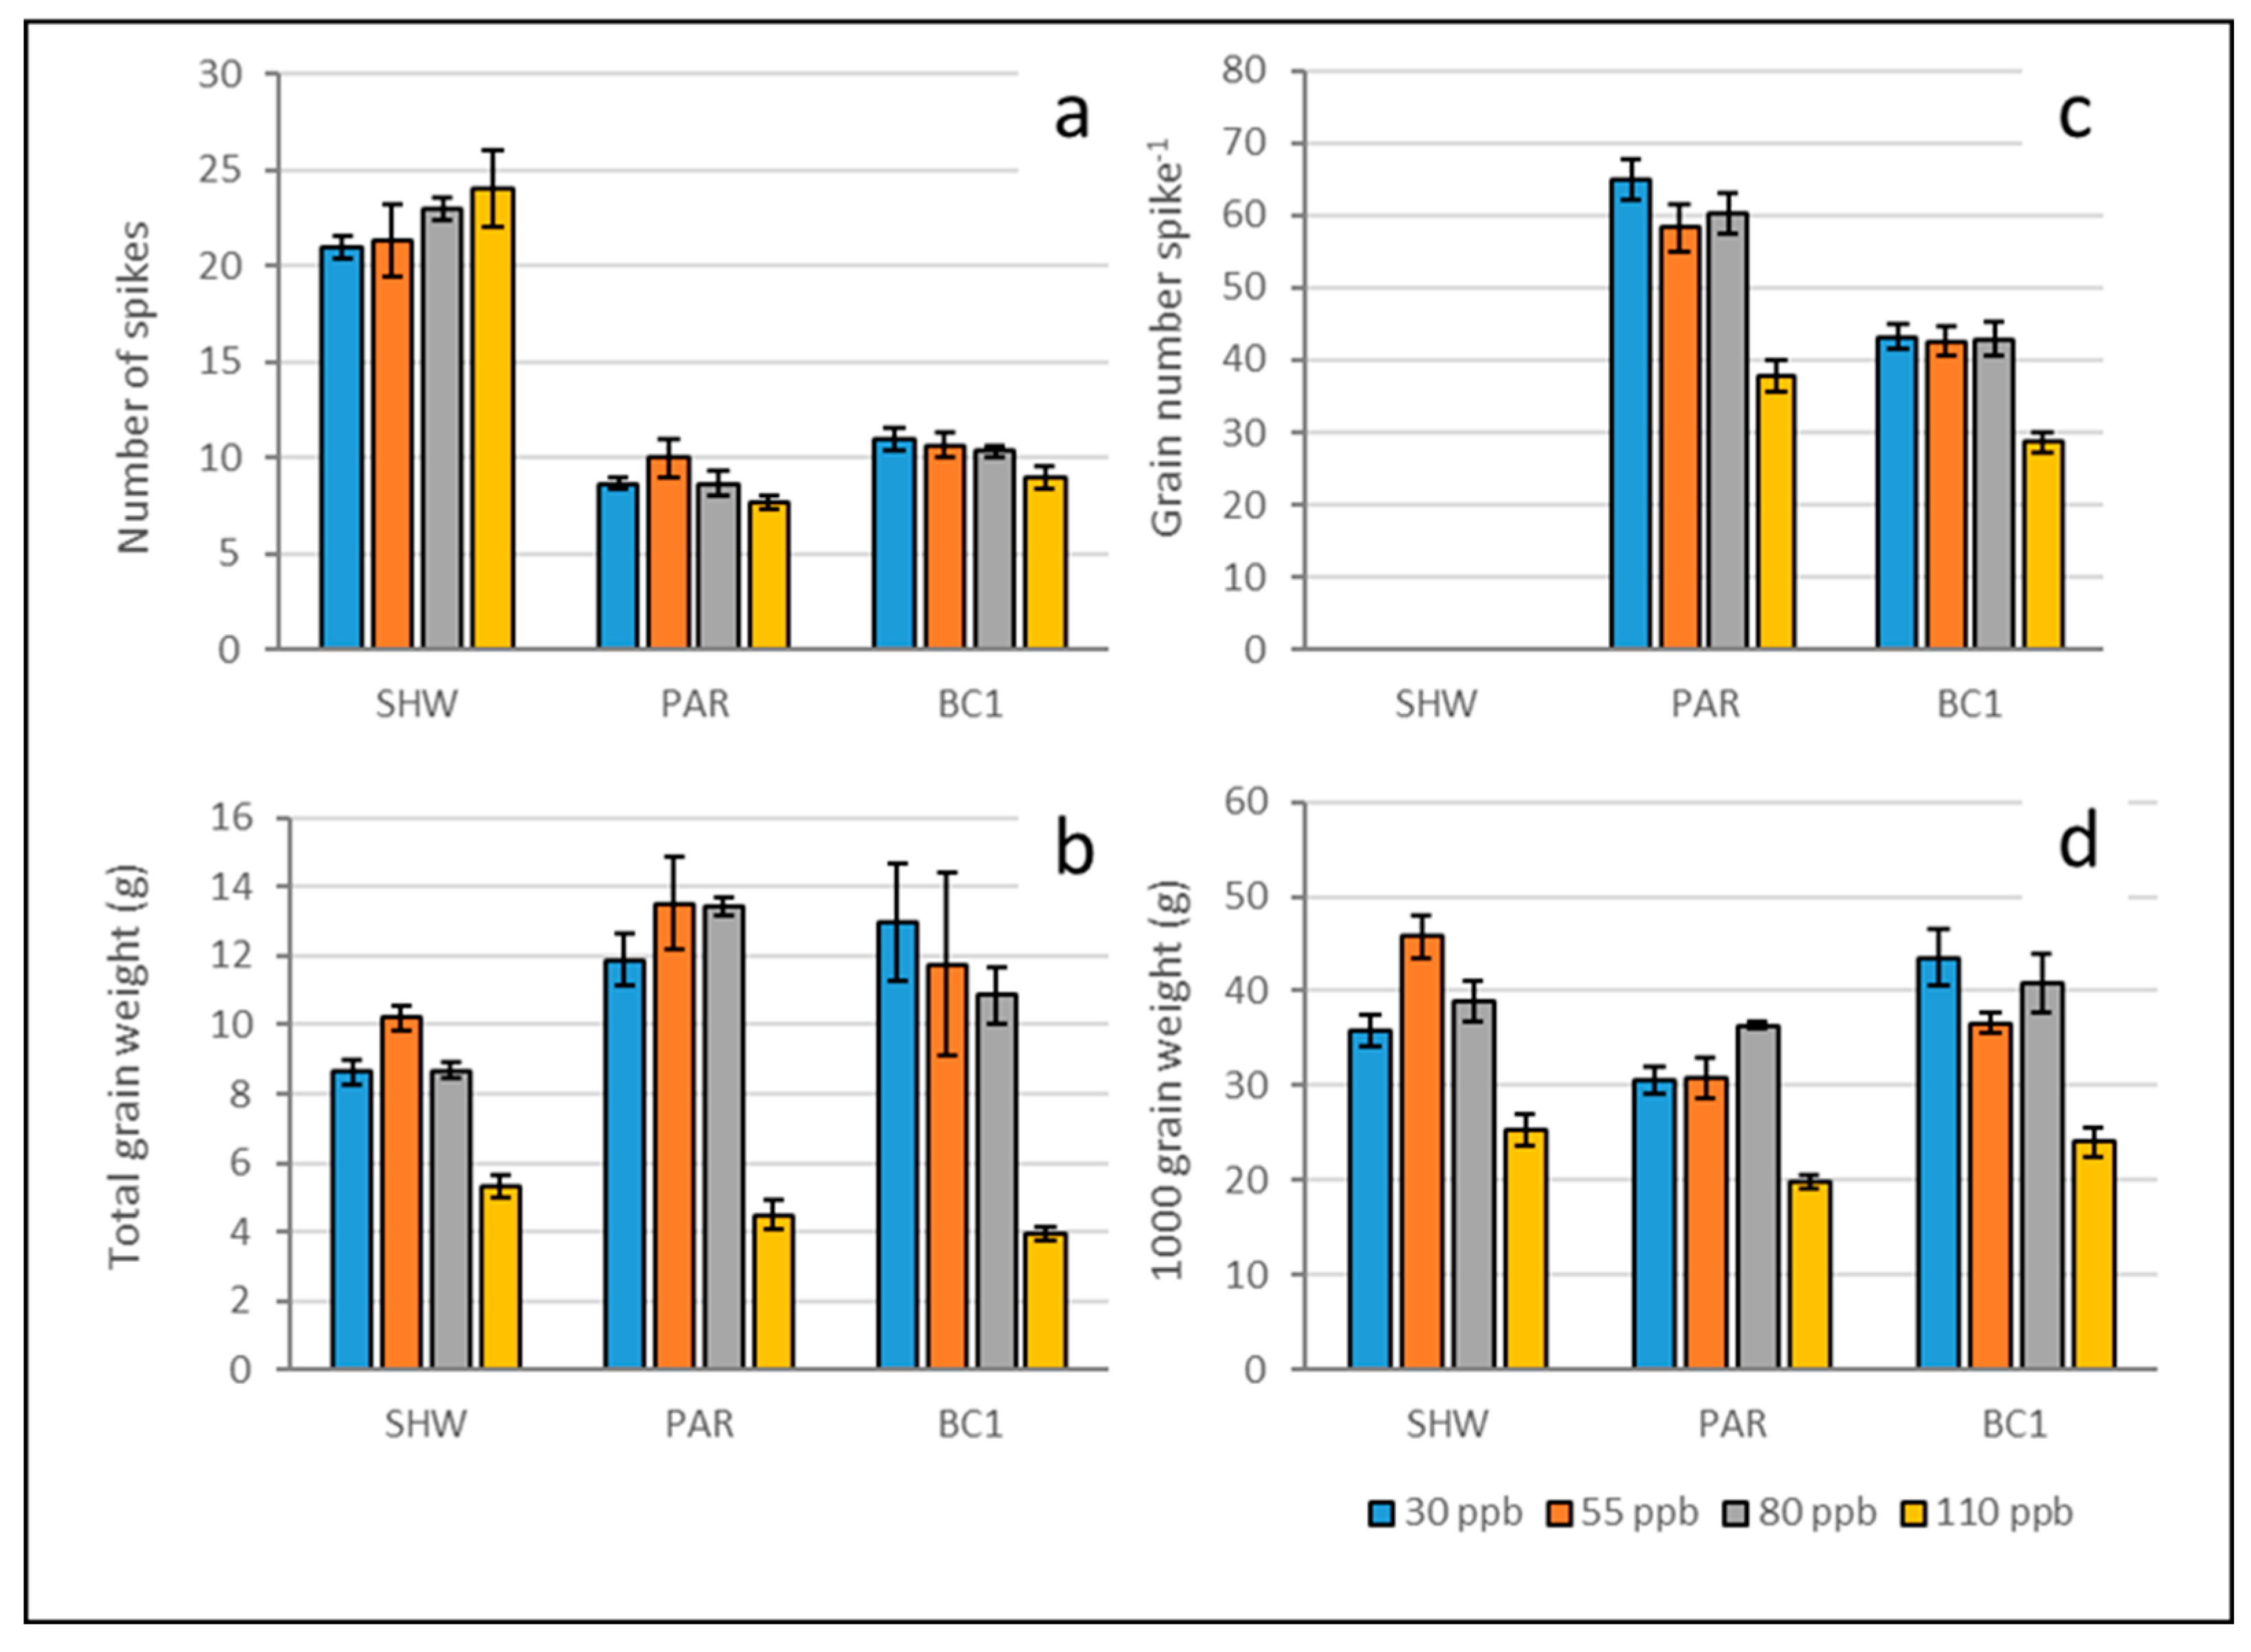
The primary synthetic hexaploid spring wheat (SHW) had more than double the number of spikes compared to the other lines (Figure 2a) and a trend towards spike numbers increasing with higher ozone concentrations. Whilst the thousand grain weight (TGW) of SHW was similar to the other synthetic lines, the total grain weight was low, suggesting lower grain number per spike (which was not measured in SHW). In the other lines there was a trend towards reduced spike numbers with increasing ozone but no significant differences between treatments.
Whilst the elite cultivar Paragon had the lowest spike number per pot, it had the highest total grain weight compared to SHW and BC1 (Figure 2b) as a result of having a much higher grain number per spike (Figure 2c), and despite having the lowest TGW (Figure 2d). However, under very high ozone Paragon had a significant 42% reduction in grain number (p = 0.0031) compared to the 30 ppb control. Although the synthetic line BC1 had fewer grains per spike than Paragon, its TGW was greater and it had a similar total grain weight. Whilst BC1 also had a significant 34% reduction in grain number under very high ozone (p = 0.036) the reductions in grain number were less than 2% under the medium and high ozone treatments (Table S6) indicating some ozone tolerance.
Under the very high (110 ppb) ozone treatment all lines had fewer grains per spike, reduced TGW, and reduced total grain weights. There was a significant negative effect of ozone on TGW in SHW, Paragon and BC1 under the very high (110 ppb) treatment level compared to all other treatment levels (all p values < 0.05), but there were no significant differences between the other treatment levels in any line The total grain weight reduction under very high ozone was statistically significant for SHW (p < 0.001), Paragon (p = 0.001) and BC1 (p = 0.003).

3.2. Ozone Reduces the Number of Grains per Spikelet

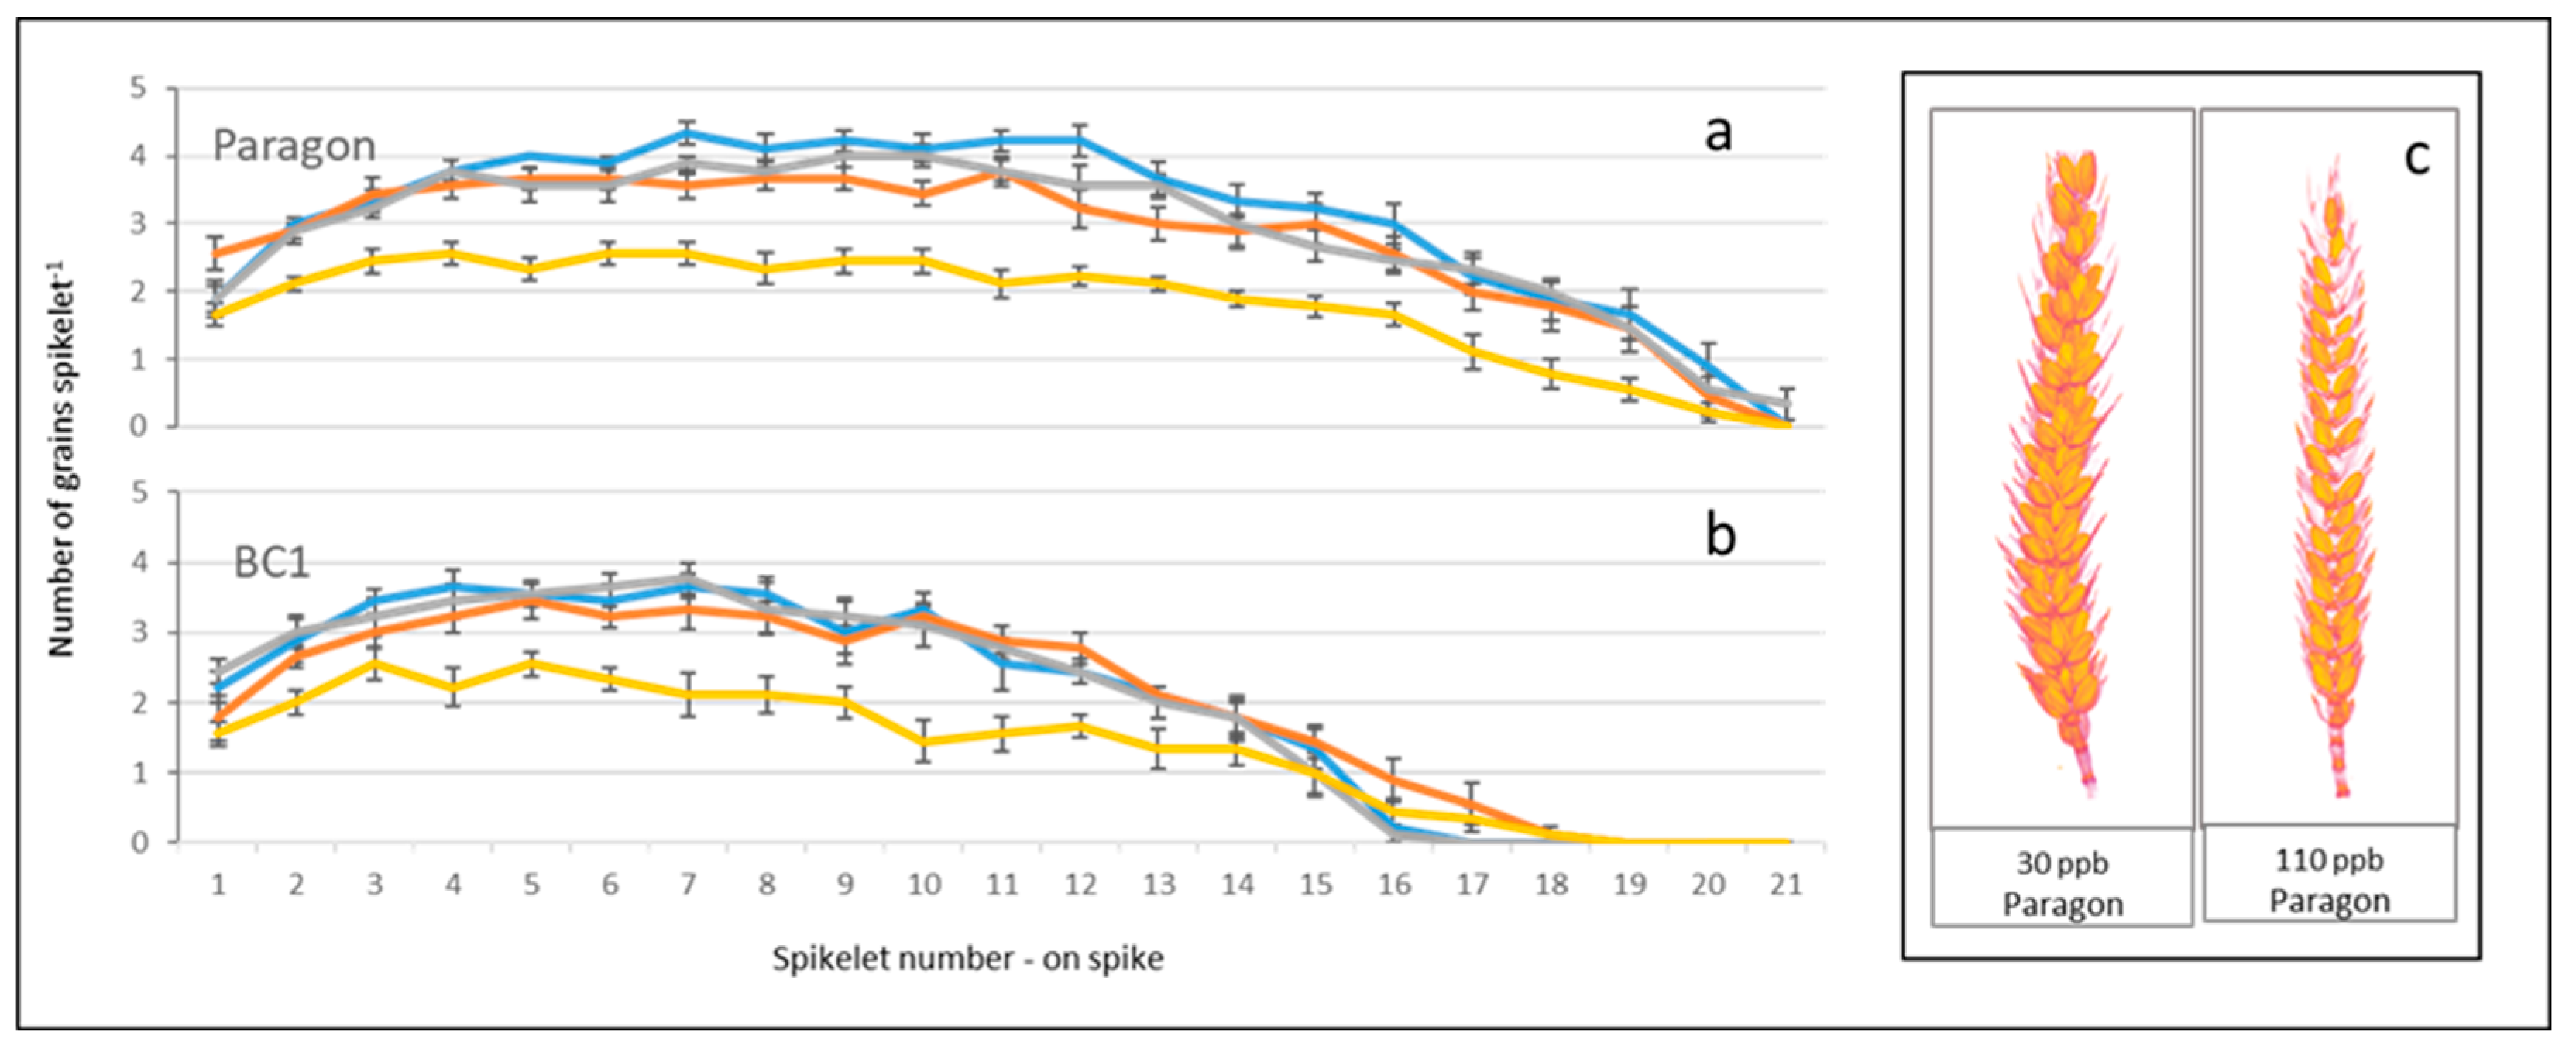
The µCT imaging enabled counts of spikelets and grains per spikelet (Figure 3). These data revealed that Paragon had both the highest number of spikelets per spike and number of grains per spikelet, whilst BC1 had fewer spikelets and grain numbers per spike compared to Paragon. Both Paragon and BC1 maintained higher numbers of grains per spikelet in the low, medium and high ozone treatments, but had greatly reduced numbers of grains per spikelet under the very high (110 ppb) ozone treatment, with the largest loss of grains from spikelets apparent across the middle region of the spike. Across all treatment levels both Paragon (0.3%) and BC1 (2%) had very few spikelets which had no grains at all.
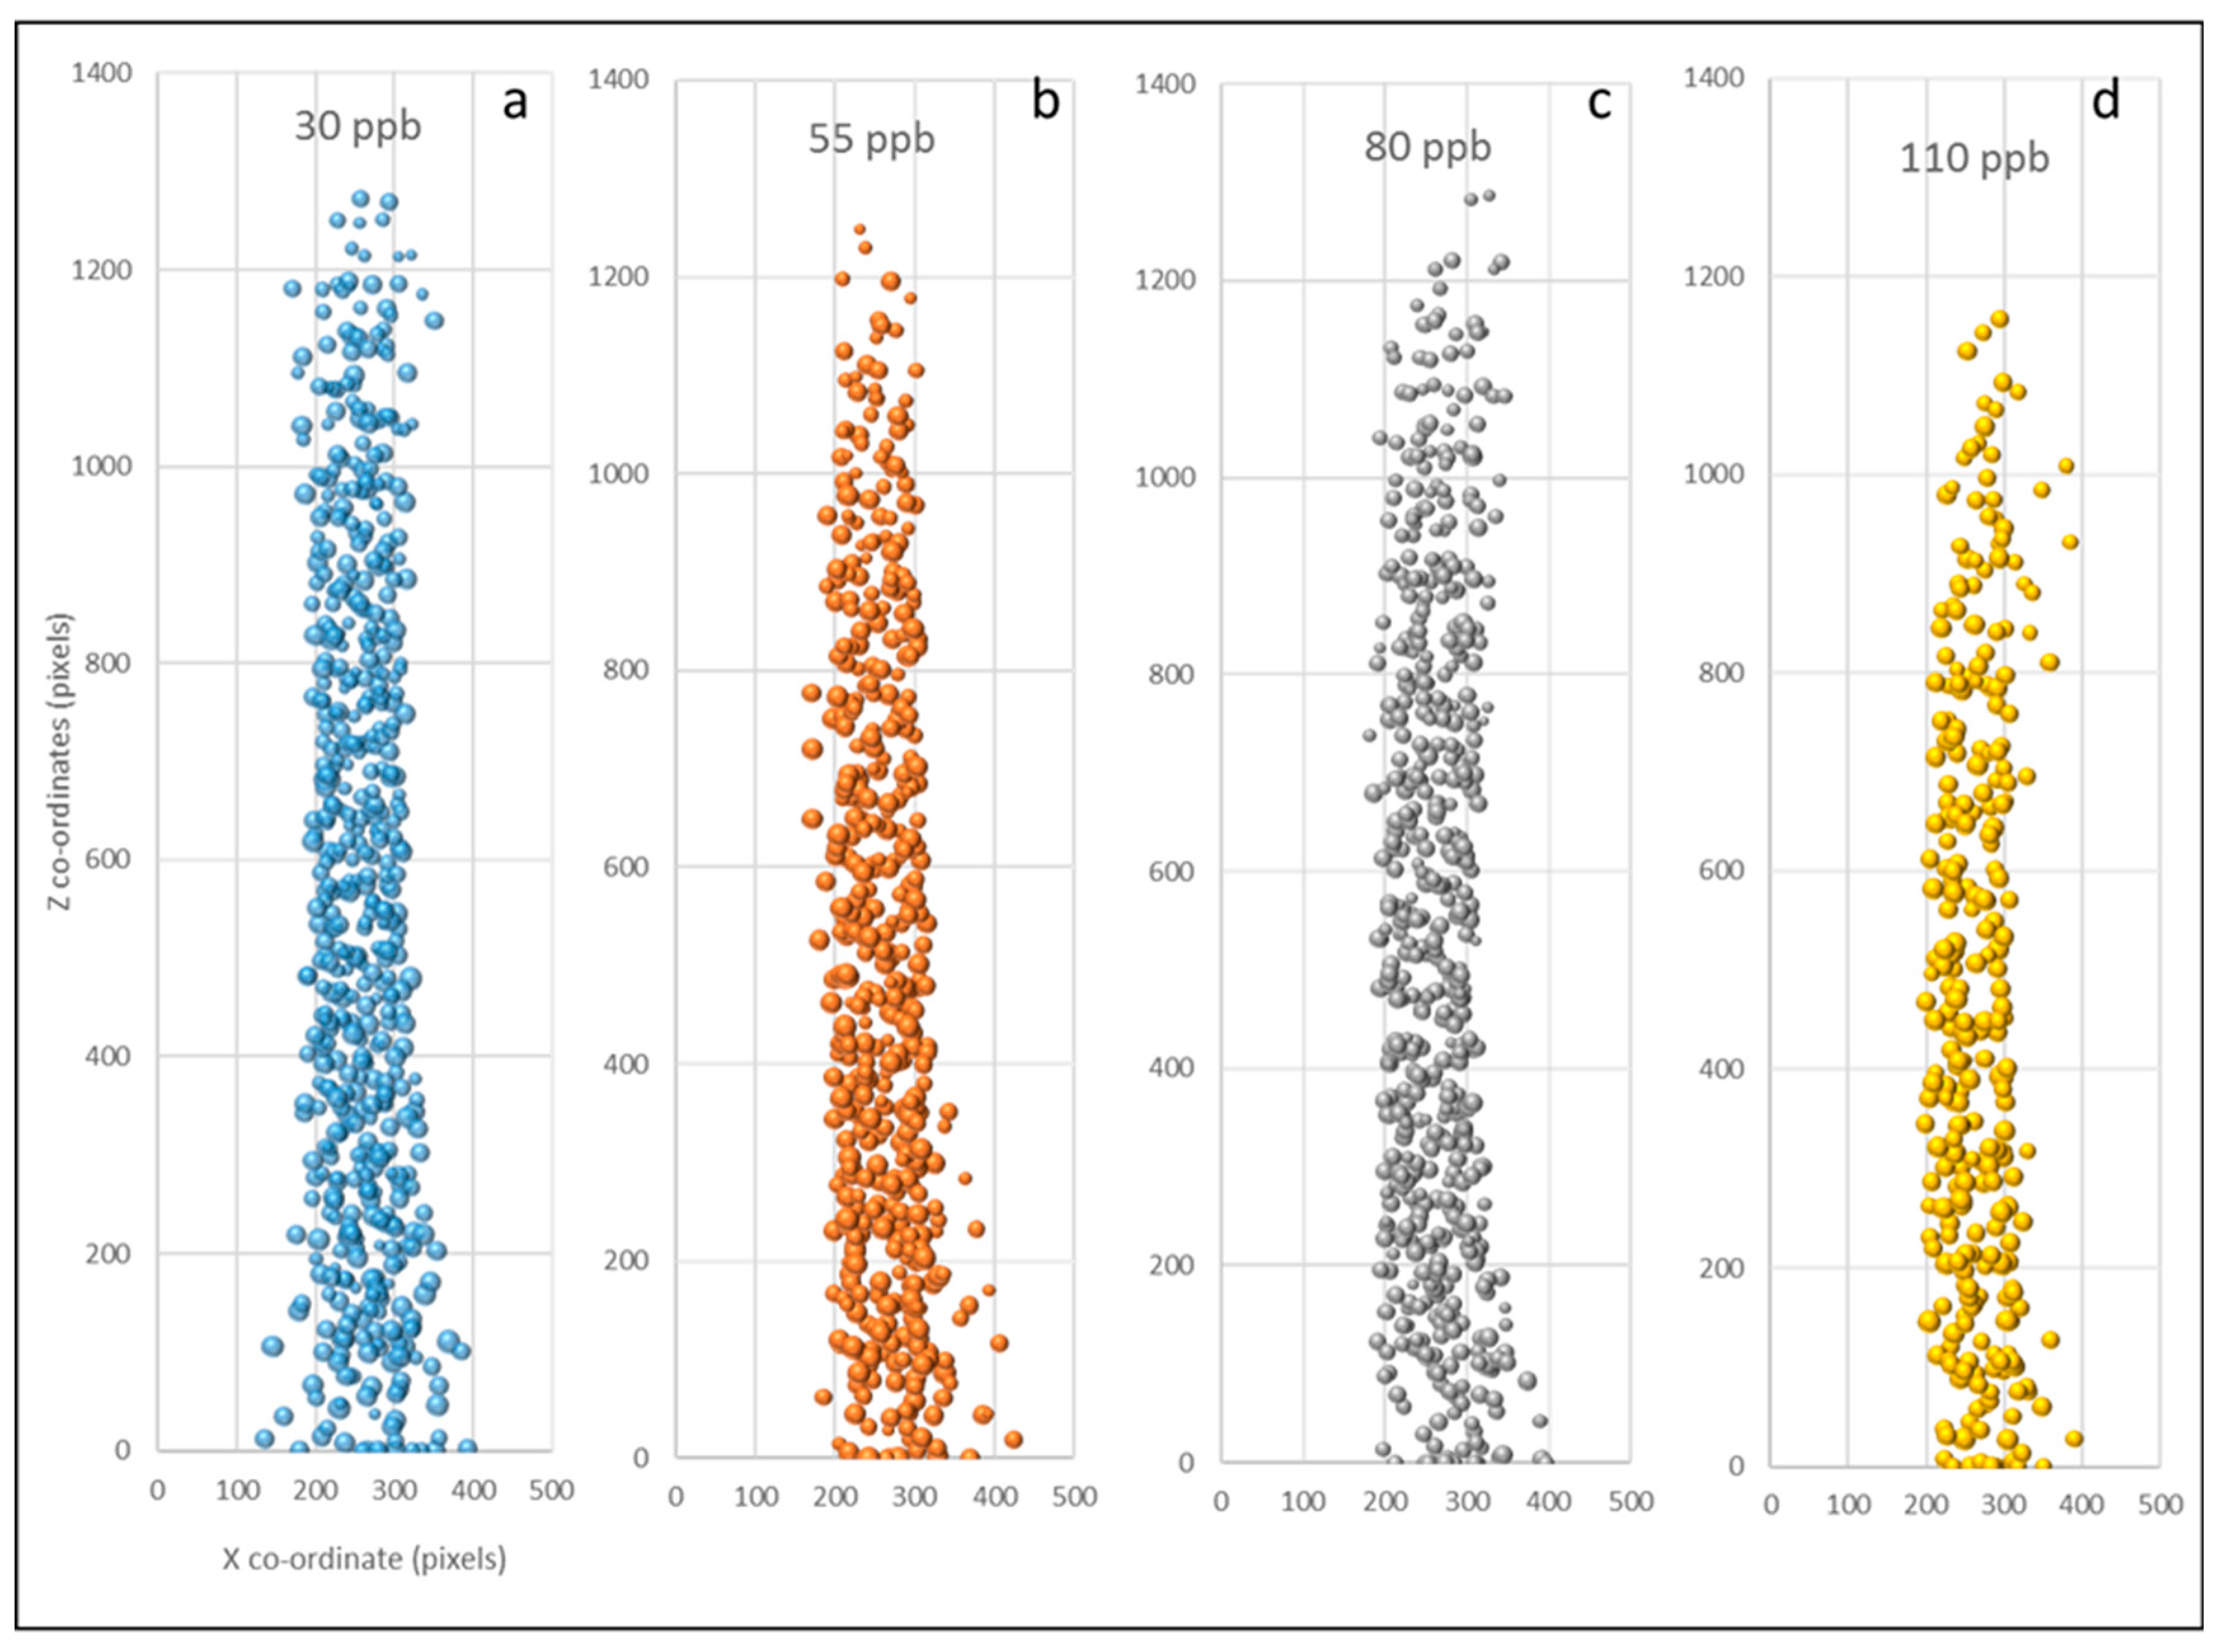
Plots marking the XZ locations of all grains in Paragon’s replicates in each treatment (Figure 4) show the reduced density of grains both in the middle and at the top of the spike as the ozone concentrations increased. A visual assessment of the 3D images of spikes of Paragon also showed that, under lower ozone concentrations, the middle region of the spike usually carried larger grains and higher grain numbers in both the inner and outer florets of each spikelet, whilst under higher ozone levels it carried smaller central grains with either no, or tiny aborted, grains in the outer florets.

3.3. Ozone Changes Grain Morphology

The data extracted from 3D µCT grain images of Paragon and BC1 show that abiotic stress induced by elevated ozone can also change individual grain morphology (Figure 5). Whilst there were no significant effects of ozone under the lower ozone concentrations, indicating some degree of ozone tolerance in both Paragon and BC1, both grain volume and grain surface area were significantly reduced under the very high (110 ppb) ozone treatment compared to the control in Paragon (p = 0.02, p = 0.02 respectively) and BC1 (p = 0.001, p = 0.006 respectively), with this grain volume reduction greater in BC1 (49%) than in Paragon (33%) (Table S6). There was a significant reduction in grain length under the very high (110 ppb) ozone treatment only in Paragon (p = 0.002), though with a negative trend also for BC1 (p = 0.05). Grain width was significantly reduced in the very high (110 ppb) ozone treatment in both Paragon and BC1 (p = 0.04 and 0.0002 respectively), as well as a significant negative effect on grain depth in Paragon and BC1 under very high (110 ppb) ozone compared to both the control (p values < 0.05) and the medium treatment level (p values < 0.05).
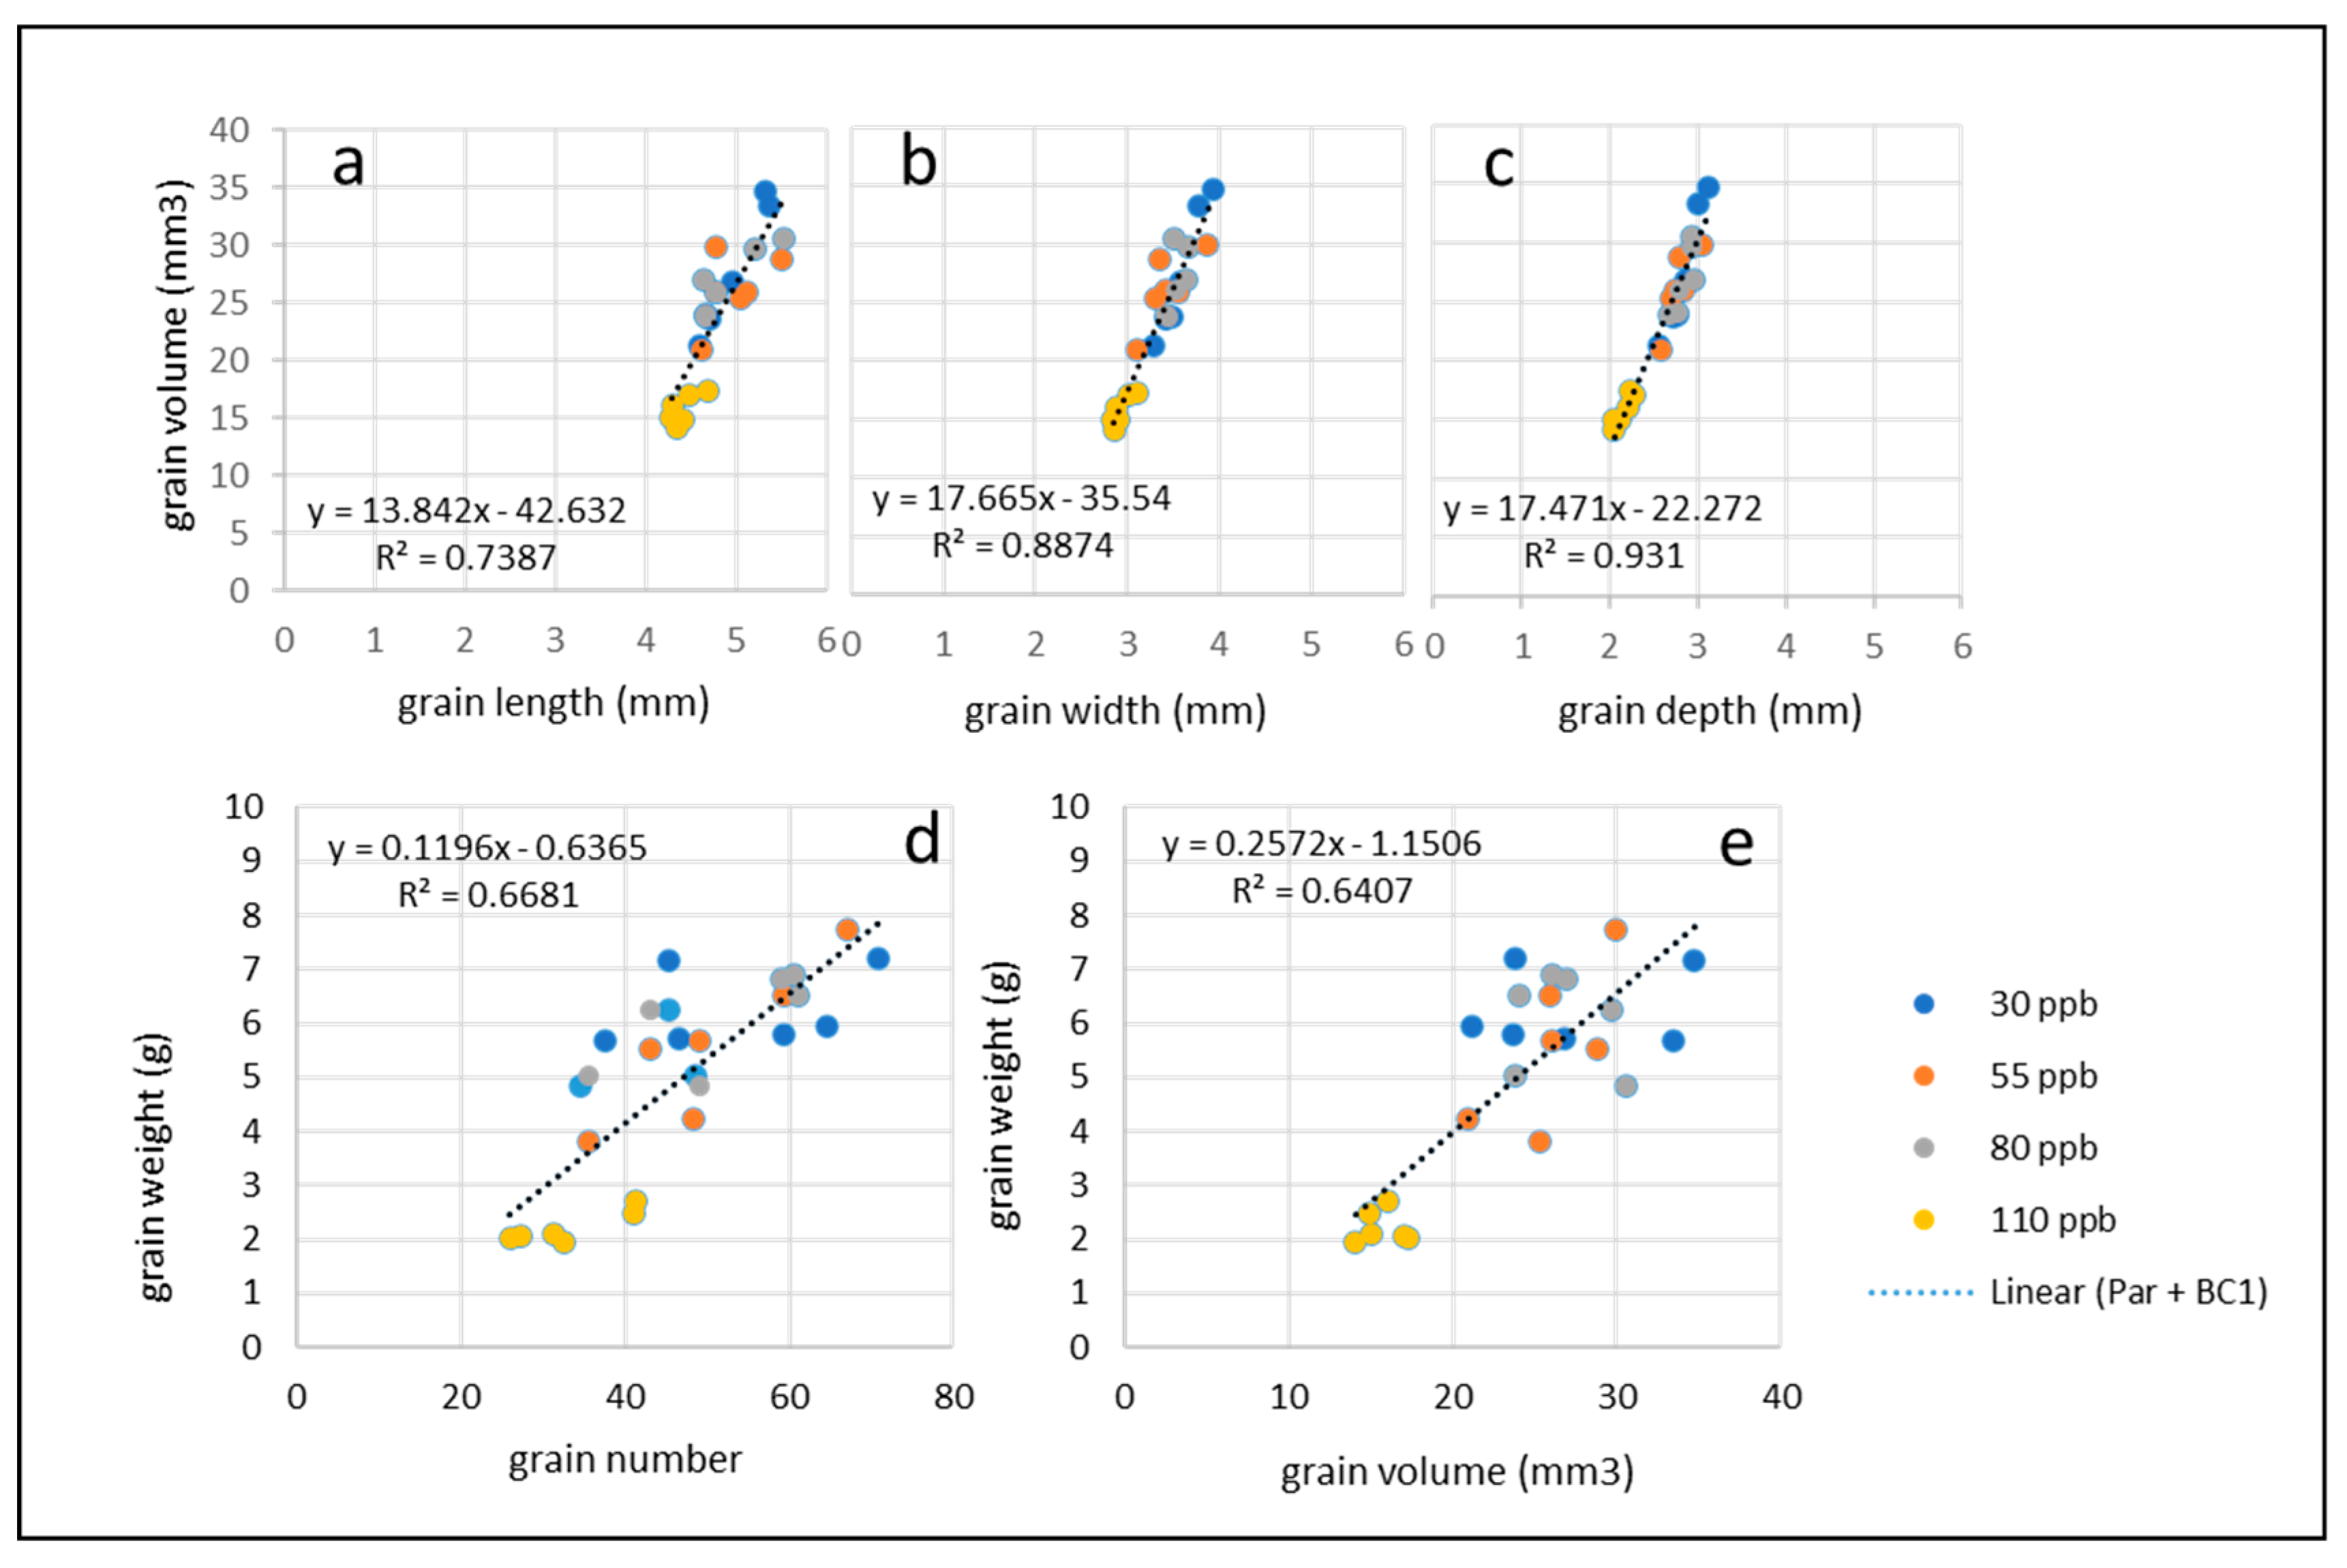
Positive correlations between grain volume and other grain dimension parameters from both Paragon and BC1 suggest that the reductions in grain volume are driven more by reductions in grain width (R2 = 0.88, p < 0.0001) and depth (R2 = 0.93, p < 0.0001) than grain length (R2 = 0.74, p < 0.0001) (Figure 6a–c). Correlations between grain number and grain weight (R2 = 0.67, p <0.0001) and between grain volume and grain weight (R2 = 0.64, p < 0.0001) were similar, suggesting that in this study grain yield reductions were driven equally by reduced grain number and grain size (Figure 6d-e).

3.4. Correlations between Ozone, Grain Morphology and Grain Quality

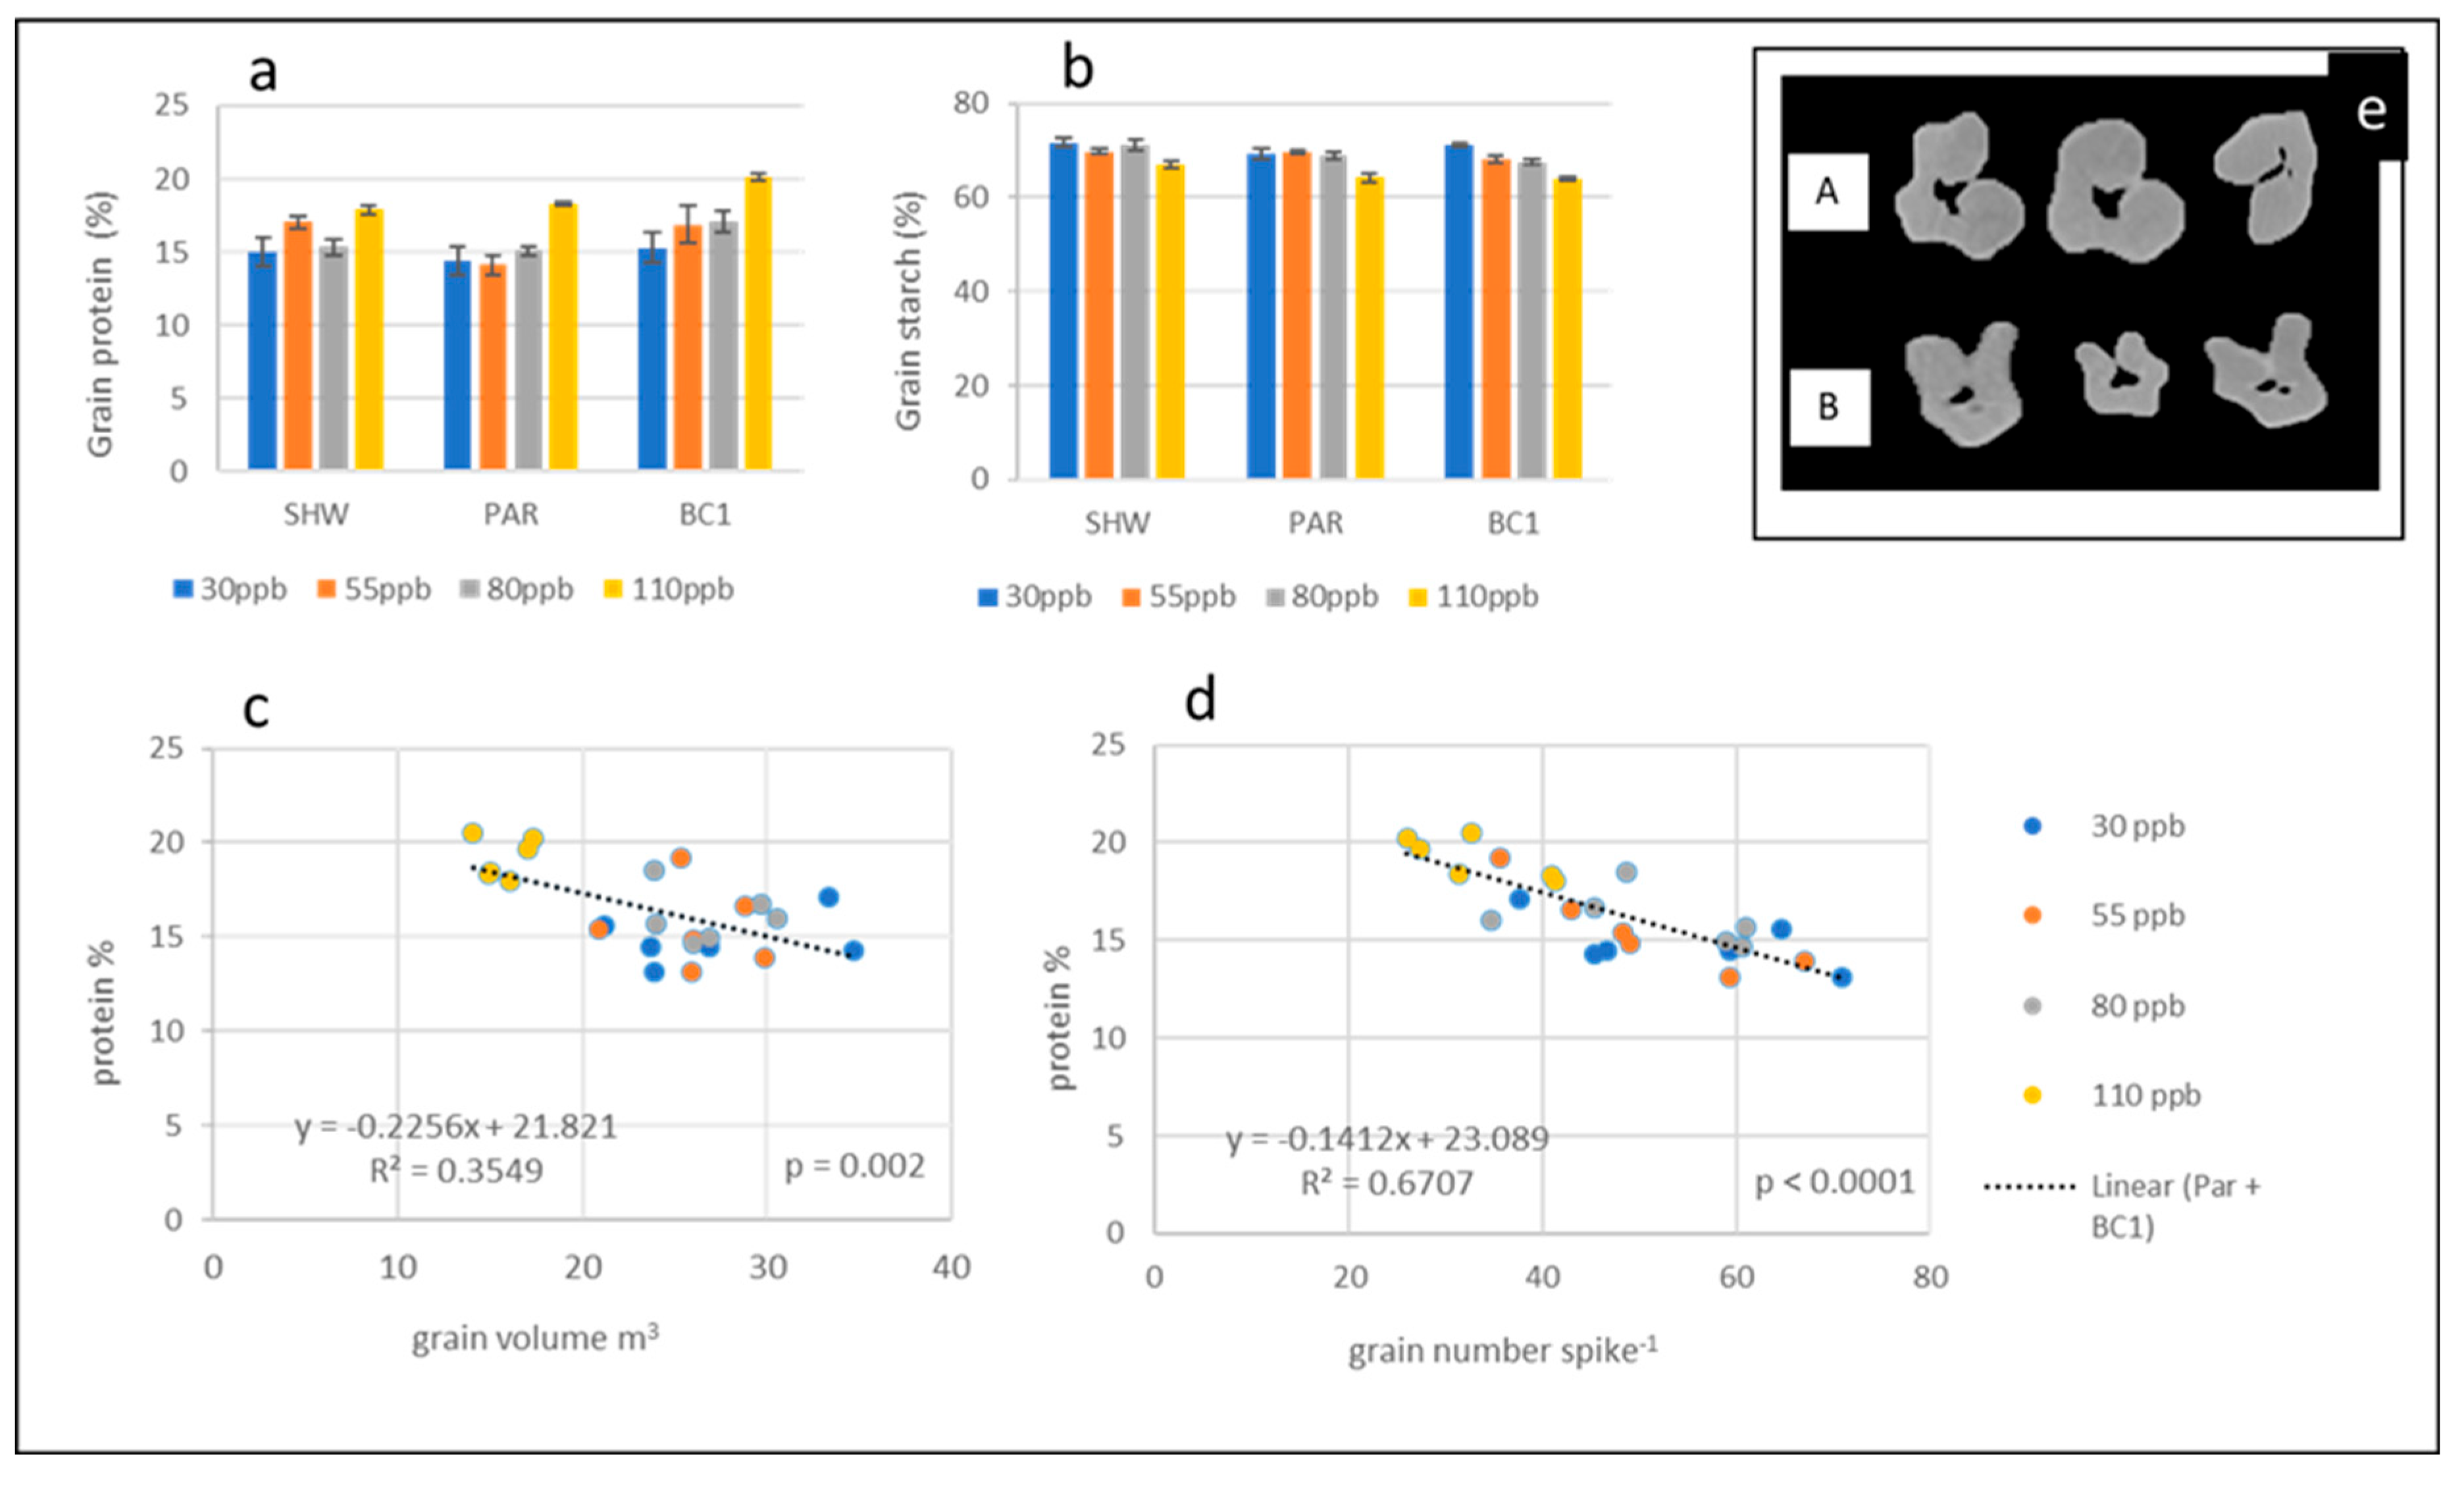
There was a positive effect of ozone on grain protein concentration and a negative effect on grain starch concentration in all three lines as the ozone concentrations increased (Figure 7a & 7b), with effects statistically significant under the very high ozone concentration (110 ppb) compared to the control in SHW (p = 0.007 and p = 0.03 respectively), Paragon (p = 0.003, p = 0.01) and BC1 (p = 0.01, p = 0.0001) (Table S4). Overall, there were slightly lower protein concentrations in Paragon compared to the synthetic lines.
Using µCT scan grain morphology data for Paragon and BC1, there was no correlation found between grain volume and the percentage of grain protein (R2 = 0.36, p = 0.002, Figure 7c) but there was a negative correlation between grain number and grain protein (R2 = 0.67, p < 0.0001, Figure 7d) suggesting a higher concentration of protein in a reduced grain yield. In contrast, there was positive correlation between grain volume and grain starch (R2 = 0.66, p < 0.0001, and note also Figure 7e) but no correlation between grain number and grain starch (R2 = 0.36, p = 0.002) (Figure S5).

3.5. Ozone Reduces Chlorophyll Levels

Overall, in all three lines, the highest chlorophyll levels were found in the flag leaves, and the lowest in the lower leaves at pre-anthesis, anthesis and post-anthesis growth stages (Figure S6). Chlorophyll levels in the fully expanded pre-anthesis flag leaves of all three lines showed no effect of ozone across all four treatment levels (Table S5). At anthesis, the flag leaves of Paragon and SHW (but not BC1 under high ozone) maintained their chlorophyll levels in the low, medium and high ozone concentrations. However, all three lines (SHW (p = 0.01), Paragon (p = 0.006) and BC1 (p = 0.001)) had significant reductions compared to the control under the very high (110 ppb) treatment. At anthesis both the second and lower leaves were also significantly reduced under the highest ozone concentration (110 ppb), compared to the control, in Paragon (p = 0.02 and 0.007 respectively) and BC1 (p = 0.01 and 0.03 respectively). Chlorophyll levels in post-anthesis flag leaves were substantially reduced in all three lines and in all treatments, with no effect of ozone.

4. Discussion

In this study elevated ozone led to yield reductions and changes to grain quality, as has been found in many similar studies previously. However, the µCT scans provided novel spatial information concerning the exact locations where grain numbers were reduced, both within each spikelet and on the spike, how the volume and shape of grains changed with elevated ozone, and the possible links between changes to grain morphology and grain quality. As discussed in more detail below, by exposing plants to chronic ozone over a three-month period across both pre-anthesis and post-anthesis growth stages the effect of elevated ozone on grain yield was visible in both reduced grain numbers per spike (determined before anthesis) and smaller grain size (determined after anthesis).

4.1. Effects on Grain Number

Final grain numbers are determined by multiple factors: number of spikes, number of spikelets, and the number of surviving fertilised florets which form grains within each spikelet.
Data from this study support previous findings on ozone’s effects on spike numbers, where ozone reduced spike numbers per plant by 5% (Z. Z. Feng et al. 2009). Nutrient levels during the early vegetative stages of wheat growth determine how many fertile spikes survive from the initial tillers, and the loss of these initial tillers can occur at any time, though usually before anthesis between GS31 – GS59 (Agriculture and Horticulture Development Board 2021). Tiller removal has also been found to lead to higher levels of fertile florets in the remaining spikes in a compensatory mechanism (Guo and Schnurbusch 2015), and this study provides some evidence to support this as, in both Paragon and BC1, grain yields were maintained under high ozone despite reduced spike number, although ozone did not affect the numbers of spikelets per spike.
Each spike’s eventual grain number is largely determined during the spike elongation growth stages before anthesis, with floret development and fertilisation as well as floret death rates thought to be controlled in large part by assimilate and nitrogen status and C:N partitioning (Sreenivasulu and Schnurbusch 2012; Fischer 2011; González, Miralles, and Slafer 2011). Although the supply of sugars across all regions of a wheat spike has been found not to vary, the stage of floret development at the time of floret abortion (which takes place across the whole spike approximately 20 days pre-anthesis), was found to be critical to floret survival (Backhaus et al. 2023). In this study, the pre-anthesis chlorophyll measurements showed that elevated ozone reduced chlorophyll levels particularly in the second and lower leaves, indicating a reduction in nitrogen status which could reduce assimilate levels, with the potential therefore for delayed floret development, increased floret abortion, and a reduction in final grain number.
Grain number can also be reduced as a result of damage to reproductive organs and processes, with research on multiple plant species finding that ozone can affect pollen and ovule development (Black et al. 2000; Leisner and Ainsworth 2012). Previous research into cold and drought stress in wheat found that the critical factor for floret survival was the plants ability to maintain the supply of sugars to the tapetum which surrounds the microspores (Ji et al. 2010), a structure particularly sensitive to abiotic stress (Parish et al. 2012), especially in self-fertilising crops such as rice, wheat, barley, oil seed rape, and sorghum (Parish et al. 2012; Ji et al. 2011), all of which are known as ozone-sensitive crops. As higher antioxidant levels are associated with tolerance of the tapetum to abiotic stress (Dolferus, Ji, and Richards 2011), and ozone tolerance is also thought to be related to antioxidant levels (Z. Feng et al. 2016), further research focused on ozone’s effect on the tapetum would be beneficial. This issue also has implications for modelling the effects of ozone on wheat, and emphasises the need to take into account the timing of ozone episodes in relation to the sensitive reproductive growth stages, including meiosis as well as anthesis.
The number of grains which successfully form in each spike has a major effect on total grain yield (Griffiths et al. 2015). The µCT scans revealed that whilst the middle region of the spike carried the most grains per spikelet, as has been found previously (Hughes et al. 2017; Zhou et al. 2021), this region also saw the greatest reductions in grains per spikelet under very high ozone, in both Paragon and BC1. Research on Chinese cultivars (F. Feng et al. 2018) has found that the higher yields found in cultivars released in the 2010s, compared to those from the 1950s and 1990s, were achieved partly through an increase in grain number per spikelet particularly in the middle regions of the spike. As the µCT scans revealed, it is these additional grains which are being lost in response to high ozone. This is likely to be one of the key mechanisms suppressing wheat yields in ozone-affected wheat growing areas.
It is important to note that although many modern elite cultivars have been found to be more ozone sensitive than older ones (Barnes et al. 1990; H. Pleijel et al. 2006; Sarkar and Agrawal 2010) the elite cultivars – as Paragon showed here - may still be more productive under abiotic stress due to their enhanced total grain number (Johnston and Poulton 2018; Zhou et al. 2021). Paragon demonstrated its superior breeding by having both more spikelets per spike, and higher grain numbers per spikelet, than the synthetic wheat line, as well as the ability to generate the same quantities of grain at 80 ppb as the synthetic line was producing at lower ozone levels. Like other modern cultivars Paragon benefits from the Rht reduced height gene, with an improved harvest index and increased floret fertility and grain number, as the shorter stem reduces the competition for assimilate between stem growth and reproduction (Fischer 2011; F. Feng et al. 2018).

4.2. Effects on Grain Size and Quality

Grain size is largely determined during the grain fill growth stages after anthesis. Although both Paragon and BC1 exhibited tolerance to ozone by maintaining their grain volume under high ozone, both TGW and individual grain volume were reduced under very high ozone treatment in both Paragon and BC1, with correlations between TGW and grain size having been found in previous research (Millet and Pinthus 1984; Ali et al. 2020). The very high ozone treatment led to reductions in length, width, and depth in both Paragon and BC1, but the correlations between grain volume and each of these parameters indicated that the reductions in grain width and depth were the main drivers behind the reductions in grain volume. Whilst grain length develops early in grain formation, width and depth gradually increase as the inner part of the grain is filled during the mid-phase of grain development (Le et al. 2019), so this suggests it is this mid grain fill phase that is particularly affected by ozone. Examples of the µCT cross sections of grains of Paragon showed the effect of the highest ozone levels both in the shrunken size of grains and in the internal voids within the grain, although these effects were not quantified. These internal voids form within the endosperm during normal grain development, then fill later with sucrose and fructans (Ho and Gifford 1984; Le et al. 2019). Broberg et al (2015) suggest that reduced TGW in ozone affected wheat is likely to be linked to reduced starch formation, and these shrunken grains and internal void spaces under high ozone would support this. An increase in void spaces has also been found in wheat exposed to both heat and drought (Schmidt et al. 2020).
In this study, the higher ozone levels led to a typical reduction in grain starch and an increase in grain protein concentration. The increase in the proportion of protein in ozone-affected grain (Y. Wang and Frei 2011; Håkan Pleijel and Uddling 2012; Broberg et al. 2015; Broberg, Daun, and Pleijel 2020) is thought to be due to ozone having less effect on protein synthesis compared to carbon synthesis with a resulting concentration effect (H. Pleijel et al. 1999; Emberson et al. 2018). The increased proportion of protein may also be linked to ozone causing a reduction in both the size and number of grains per floret, as was found in this study. The concentration of both macro and micro nutrients found in grains varies with their position on the spike and within the spikelet (Calderini and Ortiz-Monasterio 2003), so a loss of the smaller, outlier grains which normally have reduced levels of nutrients compared to other grains, both within each spikelet and in the less productive lower and upper regions of the spike, could lead to a higher concentration of protein in the remaining larger more central grains.
Research on other abiotic stress effects on wheat grain size and quality suggest the effects are similar to ozone (Sehgal et al. 2018; Schmidt et al. 2020). Wheat grains develop and fill in stages: early (cell division), mid (cell expansion), and late (desiccation) (Altenbach 2012). High temperatures or drought have been found to accelerate and shorten these stages, leading to reduced starch content and smaller, lighter grains with a higher proportion of protein (Altenbach 2012; Tomás et al. 2020; Cohen et al. 2021; Schmidt et al. 2020). As with ozone (H Pleijel et al. 1998) the effect of drought on yields has been found to be most noticeable in the first 14 days after anthesis, in the early stage of grain fill (Gooding et al. 2003), and greater tolerance shown in the later stages (Altenbach 2012; Cohen et al. 2021), with any abiotic tolerance at meiosis not necessarily maintained at anthesis or during grain fill (Ji et al. 2010) as these later growth stages have been found to be particularly vulnerable to abiotic stress (Dolferus, Ji, and Richards 2011).
Whilst the reduced starch formation in ozone-affected wheat is thought to be linked to this shortened grain fill period, induced by earlier senescence (Gelang et al. 2000), under optimal conditions Borrill et al. (2015) found final grain weight to be more closely linked to starch synthase activity in later grain fill stages, and not to the timing or length of senescence. Although it was noted that in stress environments the earlier senescence still affects yield (Borrill et al. 2015), reductions in starch synthase activity and the size of starch granules have been found in response to other abiotic stress (Ullah et al. 2021). This finding suggests the underlying mechanisms affecting the protein and starch components of grain fill in wheat may be separate. The correlations between protein and starch levels and grain morphology data in this study support this, with correlations between protein and grain number but not grain volume, whilst conversely there were correlations between starch and grain volume but not grain number. Further research to identify the underlying mechanisms, especially the effects of ozone on starch synthase activity, would be beneficial.

4.3. Potential Use of Synthetic Wheat and µCT Digital Imaging for Plant Breeding

Increasing grain size, and maintaining it in stress environments, are key to improving future wheat yields (M. Reynolds et al. 2011). In this study, the F2 synthetic line, BC1, demonstrated a similar ozone tolerance to Paragon, whilst also carrying the larger grain size shown by many synthetic lines, although it carried fewer grains per spike than Paragon. Further research to widen the search for both ozone tolerance and larger grain size in synthetic wheat lines would be beneficial.
The increasing availability of µCT digital imaging now enables in vivo non-destructive analysis of grain formation and retention of grain/spikelet positional information. This, in combination with histological analysis on reproductive structures (Tracy et al. 2017), and genetic mapping of target traits (Rasheed et al. 2014; Schmidt et al. 2020) could provide a route to screening for ozone tolerant lines. The use of µCT imaging on ozone-affected field-grown wheat would also enable further assessment of ozone’s effects on grain and demonstrate whether the tolerance exhibited by Paragon and BC1 in this study also occurs in the field.

5. Conclusions

The effects of ozone on wheat yields, grain formation, and grain quality were demonstrated by this study. µCT digital imaging revealed that the middle section of the spike is the region where the largest reductions in grain number per spikelet occur, with reductions in width and depth also driving the additional reductions in grain volume. Correlations between yield parameters and grain number/size suggest that in this study the reductions in grain number and grain size drove yield reductions equally. The elite cultivar Paragon demonstrated some degree of ozone tolerance by maintaining both high grain number and also grain volume under the high ozone treatment, whilst BC1, with its larger grain size typical of synthetic wheat, had also acquired the ozone tolerance of Paragon and therefore offers potential for abiotic tolerance in combination with larger grain size. This study also demonstrated that the use of µCT image analysis makes it more feasible to achieve automated screening of large populations to assess lines for improved grain yield components and abiotic tolerance.

Supplementary Materials

[SEE ATTACHED FILE AT SUBMISSION]. All supporting information can be downloaded at: Preprints.org.

Funding

This work was supported by the Natural Environment Research Council (NERC), grant number 500491042 NERC Envision DTP Studentship (UKCEH).

Data Availability Statement

The data presented in this study can be made available upon request.

Acknowledgements

The authors wish to thank the National Institute of Agricultural Botany (NIAB) for the synthetic wheat seed used in this trial; staff at Henfaes Research Station (Bangor University) for supplying farm soil and glasshouse facilities; Aled Williams (Aled Williams Mechatronics) for technical support for the ozone exposure facility; and the National Plant Phenomics Centre, Aberystwyth for use of vernalisation facilities.

Declaration of interests

The authors report there are no competing interests to declare.

Note

1
Pulse Width Modulation involves an ozone delivery solenoid valve being opened and closed once per second. It may be opened all that period to deliver 100% or maximum dosage, or 0% to give zero delivery. Regulation is achieved by adjusting the 'on' period within each one second time interval, so a 50% dosage represents a square control waveform ('on' for 500 milliseconds and 'off' for 500 milliseconds).

References

  1. Agriculture and Horticulture Development Board. 2021. “Wheat Growth Guide AHDB.” Agriculture and Horticulture Development Board. 2021. https://ahdb.org.uk/wheatgg.
  2. Ainsworth, E. A., P. Lemonnier, and J. M. Wedow. 2020. “The Influence of Rising Tropospheric Carbon Dioxide and Ozone on Plant Productivity.” Plant Biology 22 (S1): 5–11. [CrossRef]
  3. Ainsworth, Elizabeth A., Craig R. Yendrek, Stephen Sitch, William J. Collins, and Lisa D. Emberson. 2012. “The Effects of Tropospheric Ozone on Net Primary Productivity and Implications for Climate Change.” Annual Review of Plant Biology 63 (1): 637–61. [CrossRef]
  4. Ali, Ahmad, Zahid Ullah, Naveed Alam, S. M.Saqlan Naqvi, Muhammad Jamil, Hadi Bux, and Hassan Sher. 2020. “Genetic Analysis of Wheat Grains Using Digital Imaging and Their Relationship to Enhance Grain Weight.” Scientia Agricola 77 (6): 1–10. [CrossRef]
  5. Altenbach, Susan B. 2012. “New Insights into the Effects of High Temperature, Drought and Post-Anthesis Fertilizer on Wheat Grain Development.” Journal of Cereal Science 56 (1): 39–50. [CrossRef]
  6. Backhaus, Anna Elisabeth, Cara Griffiths, Angel Vergara-Cruces, James Simmonds, Rebecca Lee, Richard J. Morris, and Cristobal Uauy. 2023. “Delayed Development of Basal Spikelets in Wheat Explains Their Increased Floret Abortion and Rudimentary Nature.” Journal of Experimental Botany 74 (17): 5088–5103. [CrossRef]
  7. Bailey-Serres, Julia, Jane E. Parker, Elizabeth A. Ainsworth, Giles E.D. Oldroyd, and Julian I. Schroeder. 2019. “Genetic Strategies for Improving Crop Yields.” Nature 575 (7781): 109–18. [CrossRef]
  8. Barnabás, Beáta, Katalin Jäger, and Attila Fehér. 2008. “The Effect of Drought and Heat Stress on Reproductive Processes in Cereals.” Plant, Cell and Environment 31 (1): 11–38. [CrossRef]
  9. Barnes, J. D., D. Velissariou, A. W. Davison, and C. D. Holevas. 1990. “Comparative Ozone Sensitivity of Old and Modern Greek Cultivars of Spring Wheat.” New Phytologist 116 (4): 707–14. [CrossRef]
  10. Black, V. J., C. R. Black, J. A. Roberts, and C. A. Stewart. 2000. “Impact of Ozone on the Reproductive Development of Plants.” New Phytologist 147 (3): 421–47. [CrossRef]
  11. Borrill, Philippa, Brendan Fahy, Alison M. Smith, and Cristobal Uauy. 2015. “Wheat Grain Filling Is Limited by Grain Filling Capacity Rather than the Duration of Flag Leaf Photosynthesis: A Case Study Using NAM RNAi Plants.” PLoS ONE 10 (8): 1–14. [CrossRef]
  12. Brewster, Clare, Felicity Hayes, and Nathalie Fenner. 2019. “Ozone Tolerance Found in Aegilops Tauschii and Synthetic Hexaploid Wheat.” Plants 8 (195): 1–12.
  13. Broberg, Malin C., Sara Daun, and Håkan Pleijel. 2020. “Ozone Induced Loss of Seed Protein Accumulation Is Larger in Soybean than in Wheat and Rice.” Agronomy 10 (3): 1–13. [CrossRef]
  14. Broberg, Malin C., Zhaozhong Feng, Yue Xin, and Håkan Pleijel. 2015. “Ozone Effects on Wheat Grain Quality - A Summary.” Environmental Pollution 197:203–13. [CrossRef]
  15. Calderini, Daniel F., and Ivan Ortiz-Monasterio. 2003. “Crop Physiology & Metabolism: Grain Position Affects Grain Macronutrient and Micronutrient Concentrations in Wheat.” Crop Science 43 (1): 141–51.
  16. Caporaso, Nicola, Martin B. Whitworth, and Ian D. Fisk. 2018. “Near-Infrared Spectroscopy and Hyperspectral Imaging for Non-Destructive Quality Assessment of Cereal Grains.” Applied Spectroscopy Reviews 53 (8): 667–87. [CrossRef]
  17. Cohen, Itay, Sara I. Zandalinas, Clayton Huck, Felix B. Fritschi, and Ron Mittler. 2021. “Meta-Analysis of Drought and Heat Stress Combination Impact on Crop Yield and Yield Components.” Physiologia Plantarum 171 (1): 66–76. [CrossRef]
  18. Dolferus, Rudy, Xuemei Ji, and Richard A. Richards. 2011. “Abiotic Stress and Control of Grain Number in Cereals.” Plant Science 181 (4): 331–41. [CrossRef]
  19. Emberson, Lisa D., Håkan Pleijel, Elizabeth A. Ainsworth, Maurits van den Berg, Wei Ren, Stephanie Osborne, Gina Mills, et al. 2018. “Ozone Effects on Crops and Consideration in Crop Models.” European Journal of Agronomy 100:19–34. [CrossRef]
  20. Feng, Fan, Yunliang Han, Shengnan Wang, Shaojing Yin, Zhenyu Peng, Min Zhou, Wenqi Gao, Xiaoxia Wen, Xiaoliang Qin, and Kadambot H.M. Siddique. 2018. “The Effect of Grain Position on Genetic Improvement of Grain Number and Thousand Grain Weight in Winter Wheat in North China.” Frontiers in Plant Science 9 (February): 1–9. [CrossRef]
  21. Feng, Zhao Zhong, Kazuhiko Kobayashi, Xiao Ke Wang, and Zong Wei Feng. 2009. “A Meta-Analysis of Responses of Wheat Yield Formation to Elevated Ozone Concentration.” Chinese Science Bulletin 54 (2): 249–55. [CrossRef]
  22. Feng, Zhaozhong, and Kazuhiko Kobayashi. 2009. “Assessing the Impacts of Current and Future Concentrations of Surface Ozone on Crop Yield with Meta-Analysis.” Atmospheric Environment 43 (8): 1510–19. [CrossRef]
  23. Feng, Zhaozhong, Liang Wang, Håkan Pleijel, Jianguo Zhu, and Kazuhiko Kobayashi. 2016. “Differential Effects of Ozone on Photosynthesis of Winter Wheat among Cultivars Depend on Antioxidative Enzymes Rather than Stomatal Conductance.” Science of the Total Environment 572:404–11. [CrossRef]
  24. Fischer, R. A. 2011. “Wheat Physiology: A Review of Recent Developments.” Crop and Pasture Science 62 (2): 95–114. [CrossRef]
  25. Fleming, Zoë L., Ruth M. Doherty, Erika Von Schneidemesser, Christopher S. Malley, Owen R. Cooper, Joseph P. Pinto, Augustin Colette, et al. 2018. “Tropospheric Ozone Assessment Report: Present-Day Ozone Distribution and Trends Relevant to Human Health.” Elem Sci Anth 6:1–41. [CrossRef]
  26. Flintham, J. E., A. Börner, A. J. Worland, and M. D. Gale. 1997. “Optimizing Wheat Grain Yield: Effects of Rht (Gibberellin-Insensitive) Dwarfing Genes.” Journal of Agricultural Science 128 (1): 11–25. [CrossRef]
  27. Fox, J, and S Weisberg. 2011. An R Companion to Applied Regression. 2nd ed. Sage Publications.
  28. Gelang, Johanna, Håkan Pleijel, Ebe Sild, Helena Danielsson, Suhaila Younis, and Gun Selldén. 2000. “Rate and Duration of Grain Filling in Relation to Flag Leaf Senescence and Grain Yield in Spring Wheat (Triticum Aestivum) Exposed to Different Concentrations of Ozone.” Physiologia Plantarum 110 (3): 366–75. [CrossRef]
  29. González, Fernanda G., Daniel J. Miralles, and Gustavo A. Slafer. 2011. “Wheat Floret Survival as Related to Pre-Anthesis Spike Growth.” Journal of Experimental Botany 62 (14): 4889–4901. [CrossRef]
  30. Gooding, Mike J., R. H. Ellis, P. R. Shewry, and J. D. Schofield. 2003. “Effects of Restricted Water Availability and Increased Temperature on the Grain Filling, Drying and Quality of Winter Wheat.” Journal of Cereal Science 37 (3): 295–309. [CrossRef]
  31. Griffiths, Simon, Luzie Wingen, Julian Pietragalla, Guillermo Garcia, Ahmed Hasan, Daniel Miralles, Daniel F. Calderini, et al. 2015. “Genetic Dissection of Grain Size and Grain Number Trade-Offs in CIMMYT Wheat Germplasm.” PLoS ONE 10 (3): 1–18. [CrossRef]
  32. Grulke, N. E., and R. L. Heath. 2020. “Ozone Effects on Plants in Natural Ecosystems.” Plant Biology 22 (S1): 12–37. [CrossRef]
  33. Guo, Zifeng, and Thorsten Schnurbusch. 2015. “Variation of Floret Fertility in Hexaploid Wheat Revealed by Tiller Removal.” Journal of Experimental Botany 66 (19): 5945–58. [CrossRef]
  34. Harmens, Harry, Felicity Hayes, Katrina Sharps, Alan Radbourne, and Gina Mills. 2019. “Can Reduced Irrigation Mitigate Ozone Impacts on an Ozone-Sensitive African Wheat Variety?” Plants 8 (7): 1–17. [CrossRef]
  35. Hawkesford, Malcolm J., Jose Luis Araus, Robert Park, Daniel Calderini, Daniel Miralles, Tianmin Shen, Jianping Zhang, and Martin A.J. Parry. 2013. “Prospects of Doubling Global Wheat Yields.” Food and Energy Security 2 (1): 34–48. [CrossRef]
  36. Hewitt, D. K.L., G. Mills, F. Hayes, and W. Davies. 2016. “The Climate Benefits of High-Sugar Grassland May Be Compromised by Ozone Pollution.” Science of the Total Environment 565:95–104. [CrossRef]
  37. Ho, Lim C., and Roger M. Gifford. 1984. “Accumulation and Conversion of Sugars by Developing Wheat Grains: V. The Endosperm Apoplast and Apoplastic Transport.” Journal of Experimental Botany 35 (1): 58–73. [CrossRef]
  38. Hothorn, Torsten, Frank Bretz, and Peter Westfall. 2008. “Simultaneous Inference in General Parametric Models.” Biometrical Journal 50 (3): 346–63. [CrossRef]
  39. Hughes, Nathan, Karen Askew, Callum P. Scotson, Kevin Williams, Colin Sauze, Fiona Corke, John H. Doonan, and Candida Nibau. 2017. “Non-Destructive, High-Content Analysis of Wheat Grain Traits Using X-Ray Micro Computed Tomography.” Plant Methods 13 (1): 1–16. [CrossRef]
  40. Ji, Xuemei, Baodi Dong, Behrouz Shiran, Mark J. Talbot, Jane E. Edlington, Trijntje Hughes, Rosemary G. White, Frank Gubler, and Rudy Dolferus. 2011. “Control of Abscisic Acid Catabolism and Abscisic Acid Homeostasis Is Important for Reproductive Stage Stress Tolerance in Cereals.” Plant Physiology 156 (2): 647–62. [CrossRef]
  41. Ji, Xuemei, Behrouz Shiran, Jianlin Wan, David C. Lewis, Colin L.D. Jenkins, Anthony G. Condon, Richard A. Richards, and Rudy Dolferus. 2010. “Importance of Pre-Anthesis Anther Sink Strength for Maintenance of Grain Number during Reproductive Stage Water Stress in Wheat.” Plant, Cell and Environment 33 (6): 926–42. [CrossRef]
  42. Jiang, Yi, Marcus D. Hanwell, Elliot Padgett, Shawn Waldon, David A. Muller, and Robert Hovden. 2016. “Advanced Platform for 3D Visualization, Reconstruction, and Segmentation with Electron Tomography.” Microscopy and Microanalysis 22 (S3): 2070–71. [CrossRef]
  43. Johnston, A.E., and P.R. Poulton. 2018. “The Importance of Long-term Experiments in Agriculture: Their Management to Ensure Continued Crop Production and Soil Fertility; the Rothamsted Experience.” European Journal of Soil Science 69:113–25.
  44. Knox, Jerry, Andre Daccache, Tim Hess, and David Haro. 2016. “Meta-Analysis of Climate Impacts and Uncertainty on Crop Yields in Europe.” Environmental Research Letters 11 (11): 1–10. [CrossRef]
  45. Le, Thang Duong Quoc, Camille Alvarado, Christine Girousse, David Legland, and Anne-Laure Chateigner-Boutin. 2019. “Use of X-Ray Micro Computed Tomography Imaging to Analyze the Morphology of Wheat Grain through Its Development.” Plant Methods 15 (1): 1–19. [CrossRef]
  46. Leisner, Courtney P., and Elizabeth A. Ainsworth. 2012. “Quantifying the Effects of Ozone on Plant Reproductive Growth and Development.” Global Change Biology 18 (2): 606–16. [CrossRef]
  47. Microsoft Corporation. 2016. “Microsoft Excel 2016.”.
  48. Millet, E., and M. J. Pinthus. 1984. “The Association between Grain Volume and Grain Weight in Wheat.” Journal of Cereal Science 2 (1): 31–35. [CrossRef]
  49. Mills, Gina, Katrina Sharps, David Simpson, William J Davies, Malin Broberg, Johan Uddling, Fernando Jaramillo, et al. 2018. “Ozone Pollution Will Compromise Efforts to Increase Global Wheat Production.” Global Change Biology 24 (8): 3560–74. [CrossRef]
  50. Parish, Roger W., Huy A. Phan, Sylvana Iacuone, and Song F. Li. 2012. “Tapetal Development and Abiotic Stress: A Centre of Vulnerability.” Functional Plant Biology 39 (7): 553–59. [CrossRef]
  51. Philipp, Norman, Heiko Weichert, Utkarsh Bohra, Winfriede Weschke, Albert Wilhelm Schulthess, and Hans Weber. 2018. “Grain Number and Grain Yield Distribution along the Spike Remain Stable despite Breeding for High Yield in Winter Wheat.” PLoS ONE 13 (10): 1–17. [CrossRef]
  52. Pinheiro, J, D Bates, S DebRoy, D Sarkar, and & R Core Team. 2017. “Nlme: Linear and Non Linear Mixed Effect Models. R Package Version 3.1-131.”.
  53. Pleijel, H, H Danielsson, J Gelang, E Sild, and G Selldén. 1998. “Growth Stage Dependence of the Grain Yield Response to Ozone in Spring Wheat (Triticum Aestivum L.).” Agriculture, Ecosystems & Environment 70 (1): 61–68. [CrossRef]
  54. Pleijel, H., A. Berglen Eriksen, H. Danielsson, N. Bondesson, and G. Selldén. 2006. “Differential Ozone Sensitivity in an Old and a Modern Swedish Wheat Cultivar - Grain Yield and Quality, Leaf Chlorophyll and Stomatal Conductance.” Environmental and Experimental Botany 56:63–71. [CrossRef]
  55. Pleijel, H., L. Mortensen, J. Fuhrer, K. Ojanperä, and H. Danielsson. 1999. “Grain Protein Accumulation in Relation to Grain Yield of Spring Wheat (Triticum Aestivum L.) Grown in Open-Top Chambers with Different Concentrations of Ozone, Carbon Dioxide and Water Availability.” Agriculture, Ecosystems and Environment 72 (3): 265–70. [CrossRef]
  56. Pleijel, Håkan, Malin C. Broberg, Johan Uddling, and Gina Mills. 2018. “Current Surface Ozone Concentrations Significantly Decrease Wheat Growth, Yield and Quality.” Science of the Total Environment 613–614:687–92. [CrossRef]
  57. Pleijel, Håkan, and Johan Uddling. 2012. “Yield vs. Quality Trade-Offs for Wheat in Response to Carbon Dioxide and Ozone.” Global Change Biology 18 (2): 596–605. [CrossRef]
  58. R Core Team. 2020. “R: A Language and Environment for Statistical Computing.” R Foundation for Statistical Computing, Vienna, Austria. 2020. http://www.r-project.org.
  59. Rasheed, Awais, Francis C. Ogbonnaya, Evans Lagudah, Rudi Appels, and Zhonghu He. 2018. “The Goat Grass Genome’s Role in Wheat Improvement.” Nature Plants 4:56–58. [CrossRef]
  60. Rasheed, Awais, Xianchun Xia, Francis Ogbonnaya, Tariq Mahmood, Zongwen Zhang, Abdul Mujeeb-Kazi, and Zhonghu He. 2014. “Genome-Wide Association for Grain Morphology in Synthetic Hexaploid Wheats Using Digital Imaging Analysis.” BMC Plant Biology 14 (1): 1–21. [CrossRef]
  61. Reynolds, Matthew, David Bonnett, Scott C. Chapman, Robert T. Furbank, Yann Manés, Diane E. Mather, and Martin A.J. Parry. 2011. “Raising Yield Potential of Wheat. I. Overview of a Consortium Approach and Breeding Strategies.” Journal of Experimental Botany 62 (2): 439–52. [CrossRef]
  62. Reynolds, Matthew P., Janet M. Lewis, Karim Ammar, Bhoja R. Basnet, Leonardo Crespo-Herrera, José Crossa, Kanwarpal S. Dhugga, et al. 2021. “Harnessing Translational Research in Wheat for Climate Resilience.” Journal of Experimental Botany 72 (14): 5134–57. [CrossRef]
  63. Royal Society. 2008. Ground-Level Ozone in the 21st Century: Future Trends, Impacts and Policy Implications. Science Policy Report - The Royal Society. London: The Royal Society.
  64. Sarkar, Abhijit, and S. B. Agrawal. 2010. “Elevated Ozone and Two Modern Wheat Cultivars: An Assessment of Dose Dependent Sensitivity with Respect to Growth, Reproductive and Yield Parameters.” Environmental and Experimental Botany 69 (3): 328–37. [CrossRef]
  65. Schmidt, Jessica, Joelle Claussen, Norbert Wörlein, Anja Eggert, Delphine Fleury, Trevor Garnett, and Stefan Gerth. 2020. “Drought and Heat Stress Tolerance Screening in Wheat Using Computed Tomography.” Plant Methods 16 (1): 1–12. [CrossRef]
  66. Sehgal, Akanksha, Kumari Sita, Kadambot H.M. Siddique, Rakesh Kumar, Sailaja Bhogireddy, Rajeev K. Varshney, Bindumadhava HanumanthaRao, Ramakrishnan M. Nair, P. V.Vara Prasad, and Harsh Nayyar. 2018. “Drought or/and Heat-Stress Effects on Seed Filling in Food Crops: Impacts on Functional Biochemistry, Seed Yields, and Nutritional Quality.” Frontiers in Plant Science 871 (November): 1–19. [CrossRef]
  67. Singh, Aditya Abha, Adeeb Fatima, Amit Kumar Mishra, Nivedita Chaudhary, Arideep Mukherjee, Madhoolika Agrawal, and Shashi Bhushan Agrawal. 2018. “Assessment of Ozone Toxicity among 14 Indian Wheat Cultivars under Field Conditions: Growth and Productivity.” Environmental Monitoring and Assessment 190:1–14. [CrossRef]
  68. Soja, G., J. D. Barnes, M. Posch, K. Vandermeiren, H. Pleijel, and G. Mills. 2000. “Phenological Weighting of Ozone Exposures in the Calculation of Critical Levels for Wheat, Bean and Plantain.” Environmental Pollution 109 (3): 517–24. [CrossRef]
  69. Sreenivasulu, Nese, and Thorsten Schnurbusch. 2012. “A Genetic Playground for Enhancing Grain Number in Cereals.” Trends in Plant Science 17 (2): 91–101. [CrossRef]
  70. Strange, Harry, Reyer Zwiggelaar, Craig Sturrock, Sacha J. Mooney, and John H. Doonan. 2015. “Automatic Estimation of Wheat Grain Morphometry from Computed Tomography Data.” Functional Plant Biology 42 (5): 452–59. [CrossRef]
  71. Tomás, Diana, José Carlos Rodrigues, Wanda Viegas, and Manuela Silva. 2020. “Assessment of High Temperature Effects on Grain Yield and Composition in Bread Wheat Commercial Varieties.” Agronomy 10 (4): 1–12. [CrossRef]
  72. Tracy, Saoirse R., José Fernández Gómez, Craig J. Sturrock, Zoe A. Wilson, and Alison C. Ferguson. 2017. “Non-Destructive Determination of Floral Staging in Cereals Using X-Ray Micro Computed Tomography (ΜCT).” Plant Methods 13 (1): 1–12. [CrossRef]
  73. Ullah, Aman, Faisal Nadeem, Ahmad Nawaz, Kadambot H.M. Siddique, and Muhammad Farooq. 2021. “Heat Stress Effects on the Reproductive Physiology and Yield of Wheat.” Journal of Agronomy and Crop Science 00 (January): 1–17. [CrossRef]
  74. United States Department of Agriculture - Economic Research Service. 2022. “Wheat Data.” 2022. https://www.ers.usda.gov/data-products/wheat-data/.
  75. Wang, Wenbo, and Jitendra Paliwal. 2007. “Near-Infrared Spectroscopy and Imaging in Food Quality and Safety.” Sensing and Instrumentation for Food Quality and Safety 1 (4): 193–207. [CrossRef]
  76. Wang, Yunxia, and Michael Frei. 2011. “Stressed Food - The Impact of Abiotic Environmental Stresses on Crop Quality.” Agriculture, Ecosystems and Environment 141 (3–4): 271–86. [CrossRef]
  77. Zadoks, J.C., T.T. Chang, and C.F. Konzak. 1974. “A Decimal Code for the Growth Stages of Cereals.” Weed Research 14:415–21.
  78. Zhou, Hu, Andrew B. Riche, Malcolm J. Hawkesford, William R. Whalley, Brian S. Atkinson, Craig J. Sturrock, and Sacha J. Mooney. 2021. “Determination of Wheat Spike and Spikelet Architecture and Grain Traits Using X-Ray Computed Tomography Imaging.” Plant Methods 17 (1): 1–9. [CrossRef]
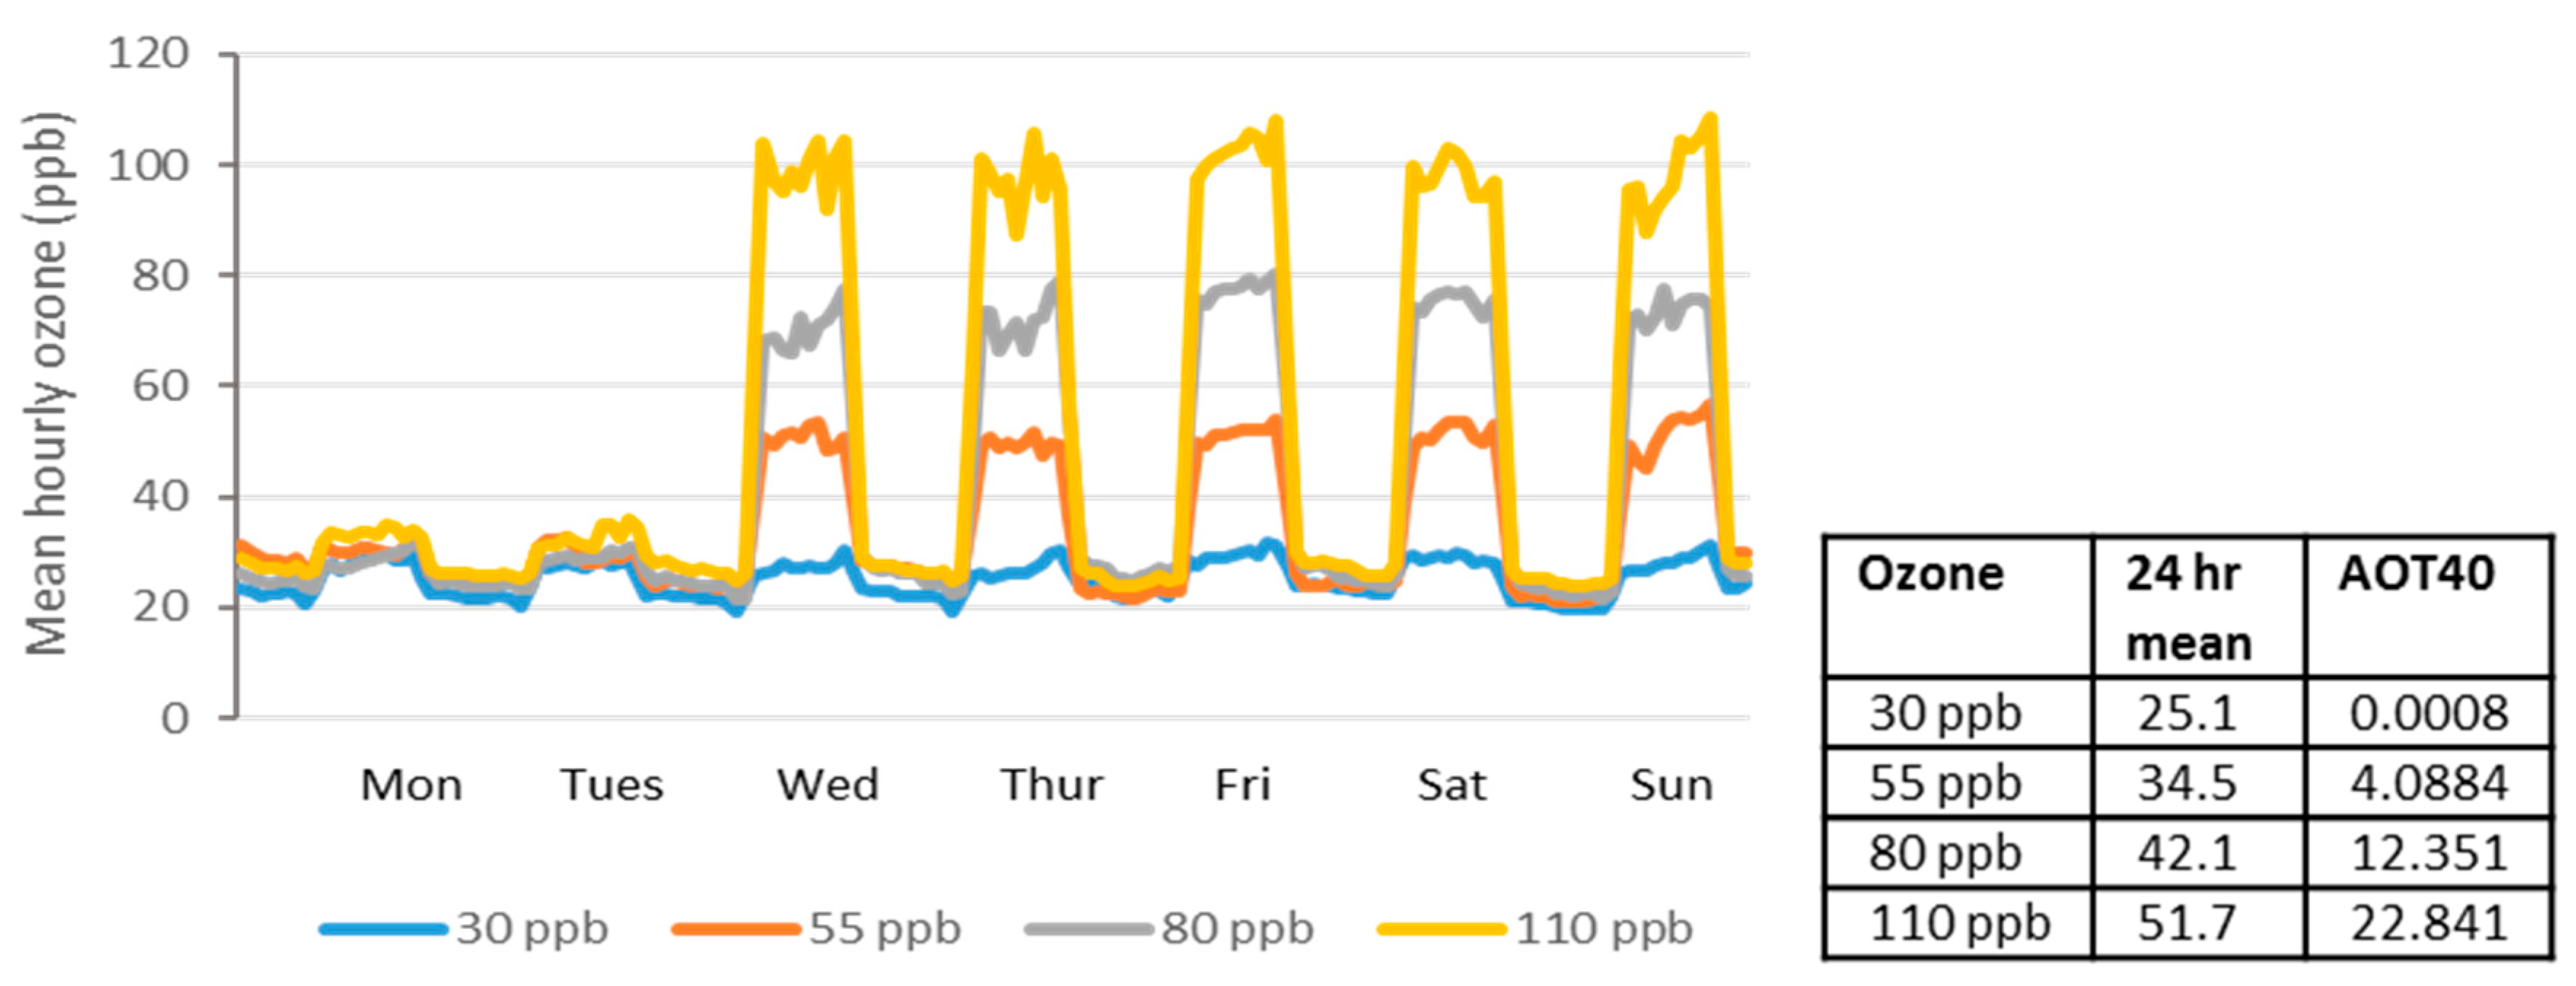
Figure 1. Mean hourly ozone profiles (replicated each week) over the course of ozone treatment (30 May – 19 Aug 2019), along with 24 hour mean and AOT40 values, where 24 hour mean represents the mean ozone concentration across the whole treatment period, and the AOT40 value represents the extent of exposure of plants to ozone concentrations above 40ppb during daylight hours.
Preprints 114849 g001
Figure 2. Number of spikes (a), total grain weight (b), grain number per spike of µCT scanned lines only (c), and 1000 grain weight (d) of SHW, Paragon, and BC1, under low (30 ppb), medium (55 ppb), high (80 ppb), and very high (110 ppb) ozone treatments. Error bars show standard error of the mean. For statistical P values see Table S4.
Preprints 114849 g002
Figure 3. Number of grains per spikelet of Paragon (a) and BC1 (b), under low (30 ppb), medium (55 ppb), high (80 ppb), and very high (110 ppb) ozone treatments. The x axis represents spikelet position from stalk (1) to tip (21). Error bars show standard error of the mean (n = 9). Inset 3c: 2D screenshots of 3D images of representative spikes of Paragon wheat spikes illustrating the µCT scanned images.
Preprints 114849 g003
Figure 4. Location (ZX co-ordinates) of every grain on the nine spikes of Paragon replicates in each treatment, 30 ppb (a), 55 ppb (b), 80 ppb (c), and 110 ppb (d). Y axis shows ‘Z’ co-ordinates (pixels), from stalk (0) to tip of spike. Point size is indicative of grain size.
Preprints 114849 g004
Figure 5. µCT extracted data showing grain volume (a), grain surface area (b), grain length (c), grain width (d), and grain depth (e), for Paragon and BC1 under low (30 ppb), medium (55 ppb), high (80 ppb), and very high (110 ppb) ozone treatments. Error bars show standard error of the mean. For statistical P values see Table S4.
Preprints 114849 g005
Figure 6. Simple linear regression analysis assessing relationships between grain volume and grain length (a), grain width (b), and grain depth (c); also between grain weight (µCT spikes) and grain number (d) and grain volume (e), using data for Paragon and BC1 under low (30 ppb), medium (55 ppb), high (80 ppb), and very high (110 ppb) ozone treatments. Linear regression trend lines represents data from both lines. In all regression analyses p < 0.0001.
Preprints 114849 g006
Figure 7. 7a-7b: Percentage of grain protein (a) and grain starch (b) found in the grain of SHW, Paragon and BC1 under low (30 ppb), medium (55 ppb), high (80 ppb), and very high (110 ppb) ozone treatments. Error bars show standard error of the mean. Figure 7c-7d: Simple linear regression analysis assessing relationship between protein percentage and grain volume (c); protein percentage and grain number (d), showing data for Paragon and BC1, under low (30 ppb), medium (55 ppb), high (80 ppb), and very high (110 ppb) ozone treatments. Linear regression trend lines represents data from both Paragon and BC1. Inset: Figure 7e. Examples of mid –grain µCT slices of Paragon grains, at 30 ppb (A) and 110 ppb (B).
Preprints 114849 g007
Table 1. Wheat lines, with details of the original 11 lines, origin of the seed, and the datasets for Paragon, SHW, and BC1 presented here.
Line Name used in text Source Datasets presented
T. aestivum L., cv. Paragon (spring); released 1999 Paragon (Par) RAGT Seeds Yield data, grain number per spikelet, grain morphology, grain quality, leaf chlorophyll
NIAB – SHW – BC- 181 – 1 BC1 NIAB
NIAB – SHW – 027 Primary synthetic hexaploid wheat (SHW) NIAB Yield data, grain quality,
leaf chlorophyll
NIAB – SHW – BC- 181 - 5 BC5 NIAB
Shoot/Root and seedhead biomass only
(See supplementary files)
NIAB – SHW – BC- 181 - 7 BC7 NIAB
NIAB – SHW – BC- 181 - 3 BC3 NIAB
NIAB – SHW – BC- 181 - 4 BC4 NIAB
NIAB – SHW – BC- 181 - 6 BC6 NIAB
NIAB – SHW – BC- 181 - 8 BC8 NIAB
NIAB – SHW – BC- 181 - 9 BC9 NIAB
NIAB – SHW – BC- 181 - 10 BC10 NIAB
Disclaimer/Publisher’s Note: The statements, opinions and data contained in all publications are solely those of the individual author(s) and contributor(s) and not of MDPI and/or the editor(s). MDPI and/or the editor(s) disclaim responsibility for any injury to people or property resulting from any ideas, methods, instructions or products referred to in the content.
Copyright: This open access article is published under a Creative Commons CC BY 4.0 license, which permit the free download, distribution, and reuse, provided that the author and preprint are cited in any reuse.
Prerpints.org logo

Preprints.org is a free preprint server supported by MDPI in Basel, Switzerland.

Subscribe

© 2024 MDPI (Basel, Switzerland) unless otherwise stated