1. Introduction
Complex product design requires accurate modeling of the material fracture process. The goal of modeling is to maximize the final product’s design based on actual loads, hence enhancing the structure’s dependability.
Different iterations of the mesh method [
1] and the finite volume approach [
2] provide the mathematical foundation (numerical methods) for engineering computations, while continuum mechanics [
3] provides the physical foundation. The fracture of samples created using FDM printing technique from ABS plastic and composite materials is well-exemplified by this application of elasticity theory [
4,
5,
6]. Analogous instances are available for simulating the selective laser melting procedure [
7] and determining strength [
8,
9]. However, the mechanical properties of most materials, particularly composite materials, are heterogeneous [
10,
11,
12,
13,
14,
15,
16,
17,
18], necessitating the use of a probabilistic approach to evaluate the reliability of nearly all structural materials [
19].
The two-parameter Weibull distribution is the most utilized distribution for probabilistic modeling of structural material reliability [
20,
21]. Like how the Weibull distribution is used in the research of other materials, including composite materials [
6,
22], it was employed in [
22] to estimate the size distribution of fiber inclusions. Weibull did point out in his writings that, in addition to other distribution functions, the Weibull distribution should be regarded as an empirical distribution [
20,
21].
Thus, an innovative methodology for assessing the type of distribution of mechanical characteristics was suggested [
24], based on the Akaike information criterion [
23]. This shown that for some materials (silicon oxide), the closest type of stress distribution is the normal distribution. It was shown that the logistic distribution is the closest form of distribution for the mechanical characteristics of pipe steels using the Akaike and Bayes criterion [
18]. The Weibull distribution is the closest, according to an analysis of the mechanical characteristics in tension of samples made from AlSi10Mg employing selective laser melting technique, utilizing Akaike and Bayes information criterion [
25].
The closest distribution to the Weibull distribution for the particle size distribution of Al2O3 inclusions in PLA is the Cauchy distribution, as demonstrated in [
26]. Additionally, it was demonstrated there that the distribution of ceramic inclusions in plastic might follow distinct distribution rules in various regions of the same FDM printed sample as well as in various regions of the same filament with Al2O3 inclusions.
Using a single sort of distribution to lead the analysis of intricate multistage processes, such material fracture under tension, is a contentious practice. As a result, probabilistic modeling of complex systems frequently makes use of Bayesian statistics and the theory of Markov chains [
26,
27], and the idea of mixtures is frequently relevant [
28].
The fracture probabilities analysis of pre-cycled samples and the analysis of engineering stress-strain diagrams of filament samples and samples made with FDM printing technology from ABS, PLA, and Ceramic with polyamide (60Al2O3/40PLA) were presented in [
29,
30]. This work presents an extension of the theory [
30] based on the analysis of the behavior of the fracture probability densities with respect to stresses in samples created by selective laser melting.
2. Materials and Methods
2.1. Physical and Mechanical Properties
A Phenom ProX scanning electron microscope (Holland) with an adapter for elemental analysis by energy dispersive spectroscopy was used to analyze the microstructure and chemical composition of the materials under study. A HOMMEL-ETAMIC T8000 profilo-graph (JENOPTIK (Hommel-Etamic), Jena, Germany) was used to measure the samples’ surface roughness, and an INSTRON 5989 electromechanical testing machine (Instron, Norwood, MA, USA) was used to perform mechanical tensile tests at a speed of 2 mm/min. Software (Rstudio 2023.06.1 Posit Software, PBC, GNU license) was used to statistically analyze the experimental data.
2.2. Production of Samples
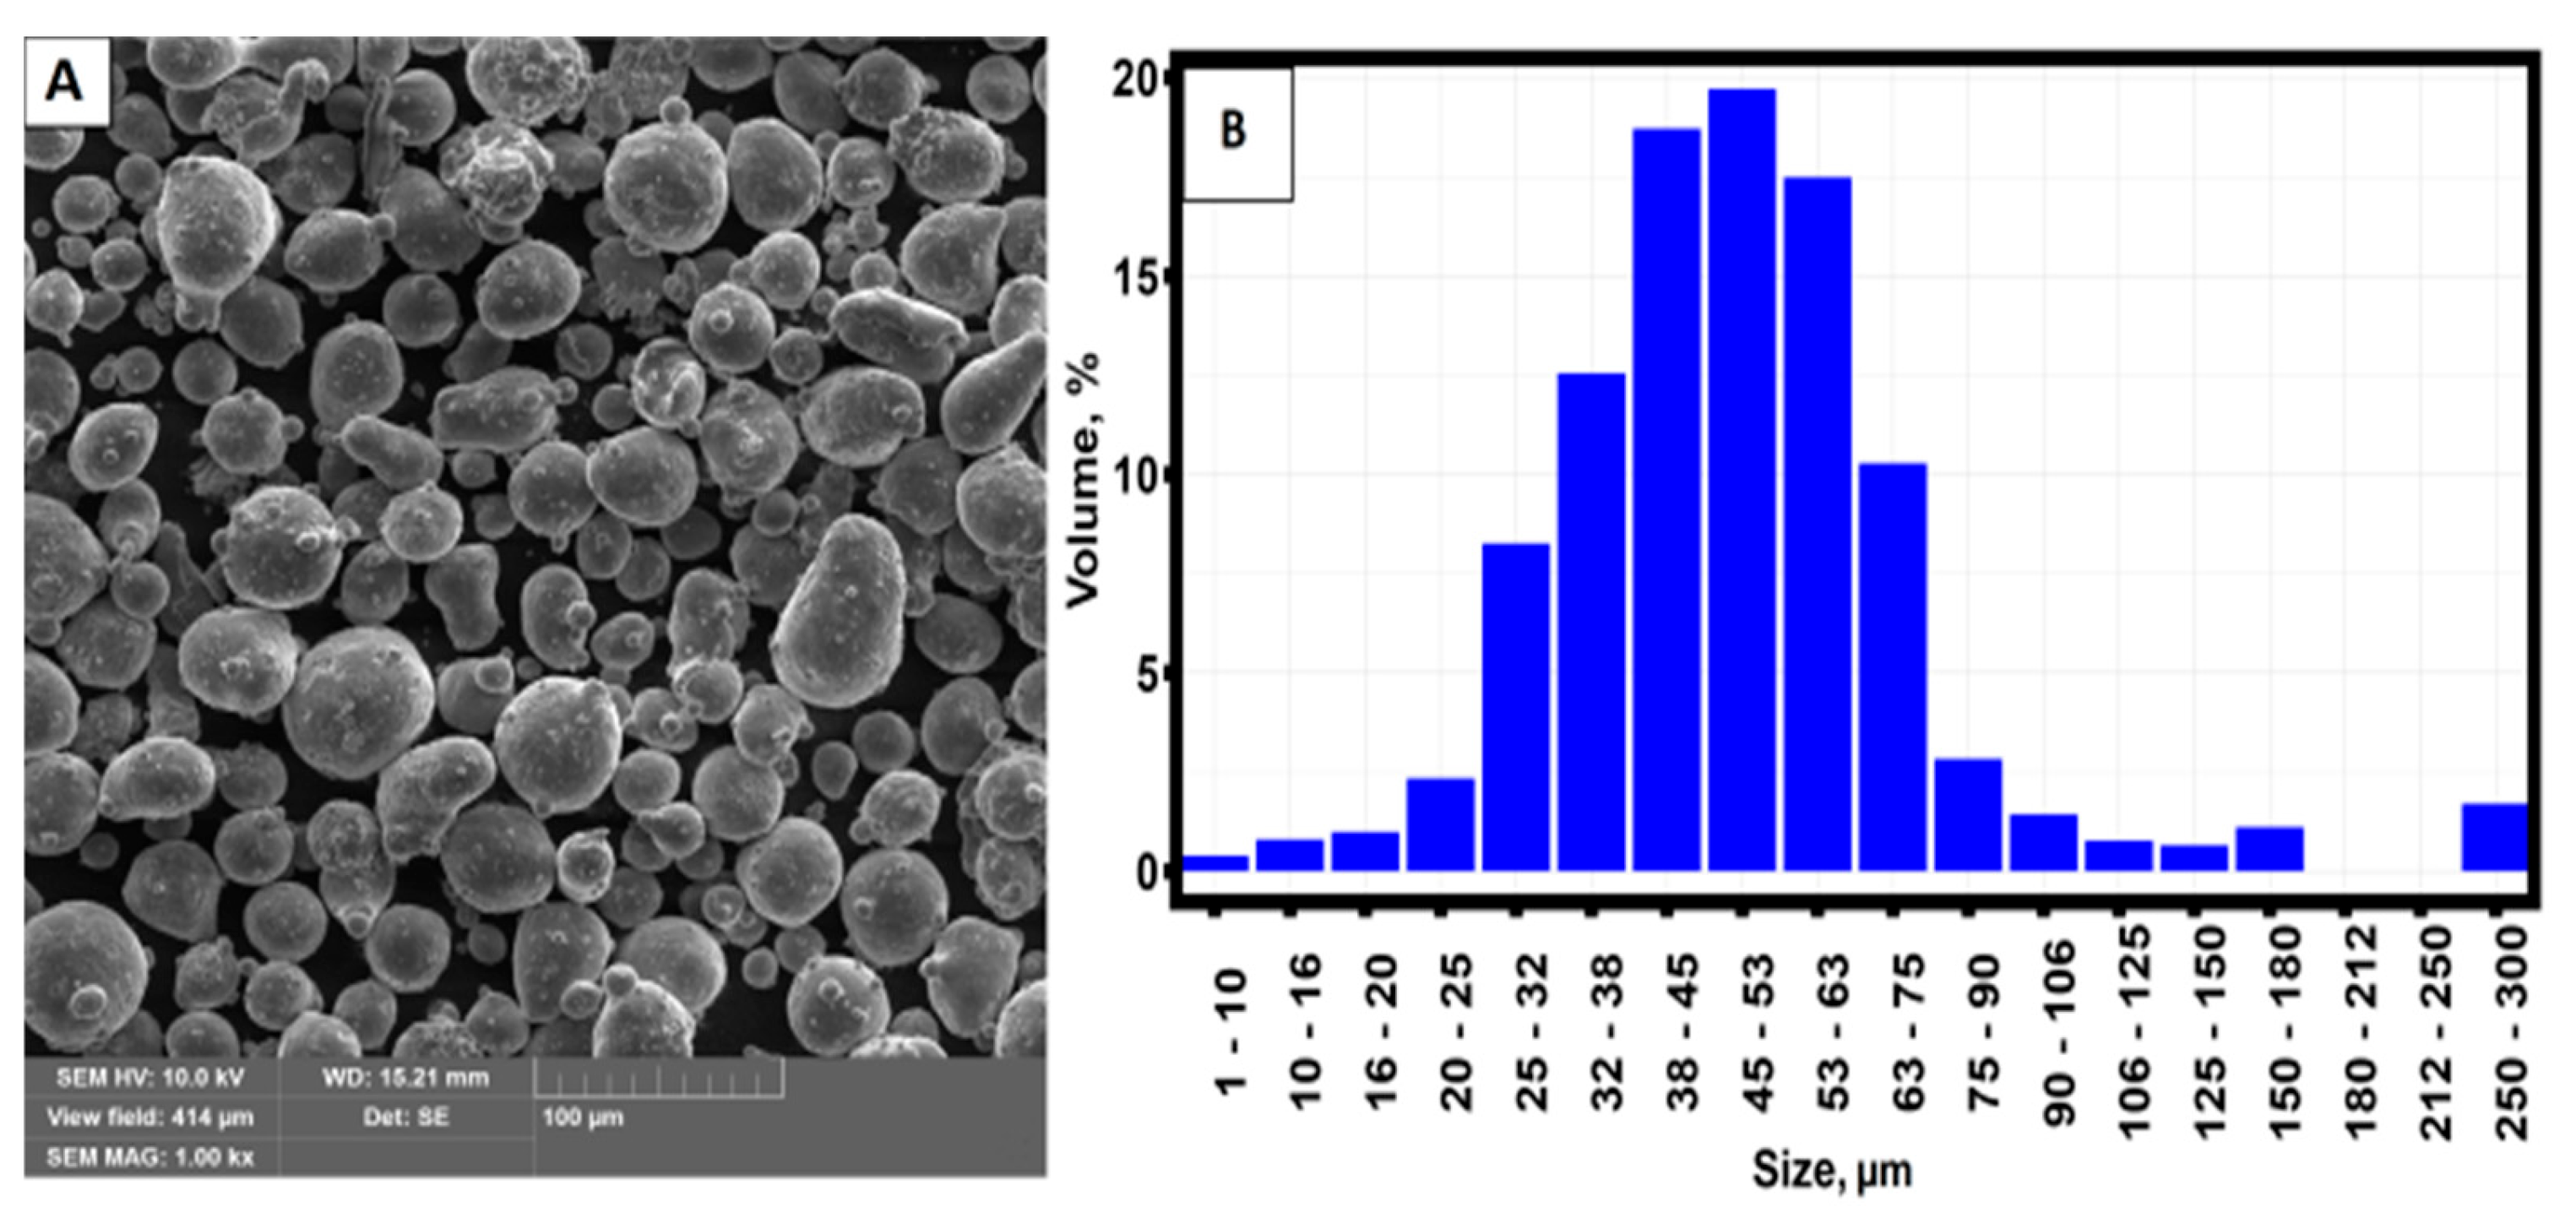
The first material used to create the samples using selective laser melting was AlSi10Mg powder. The powders varied in size from 30 µm to 75 µm. A micrograph of the starting material and the powder particle size distribution is displayed in
Figure 1 [
31].
Table 1 displays the average chemical composition of the original AlSi10Mg powder.
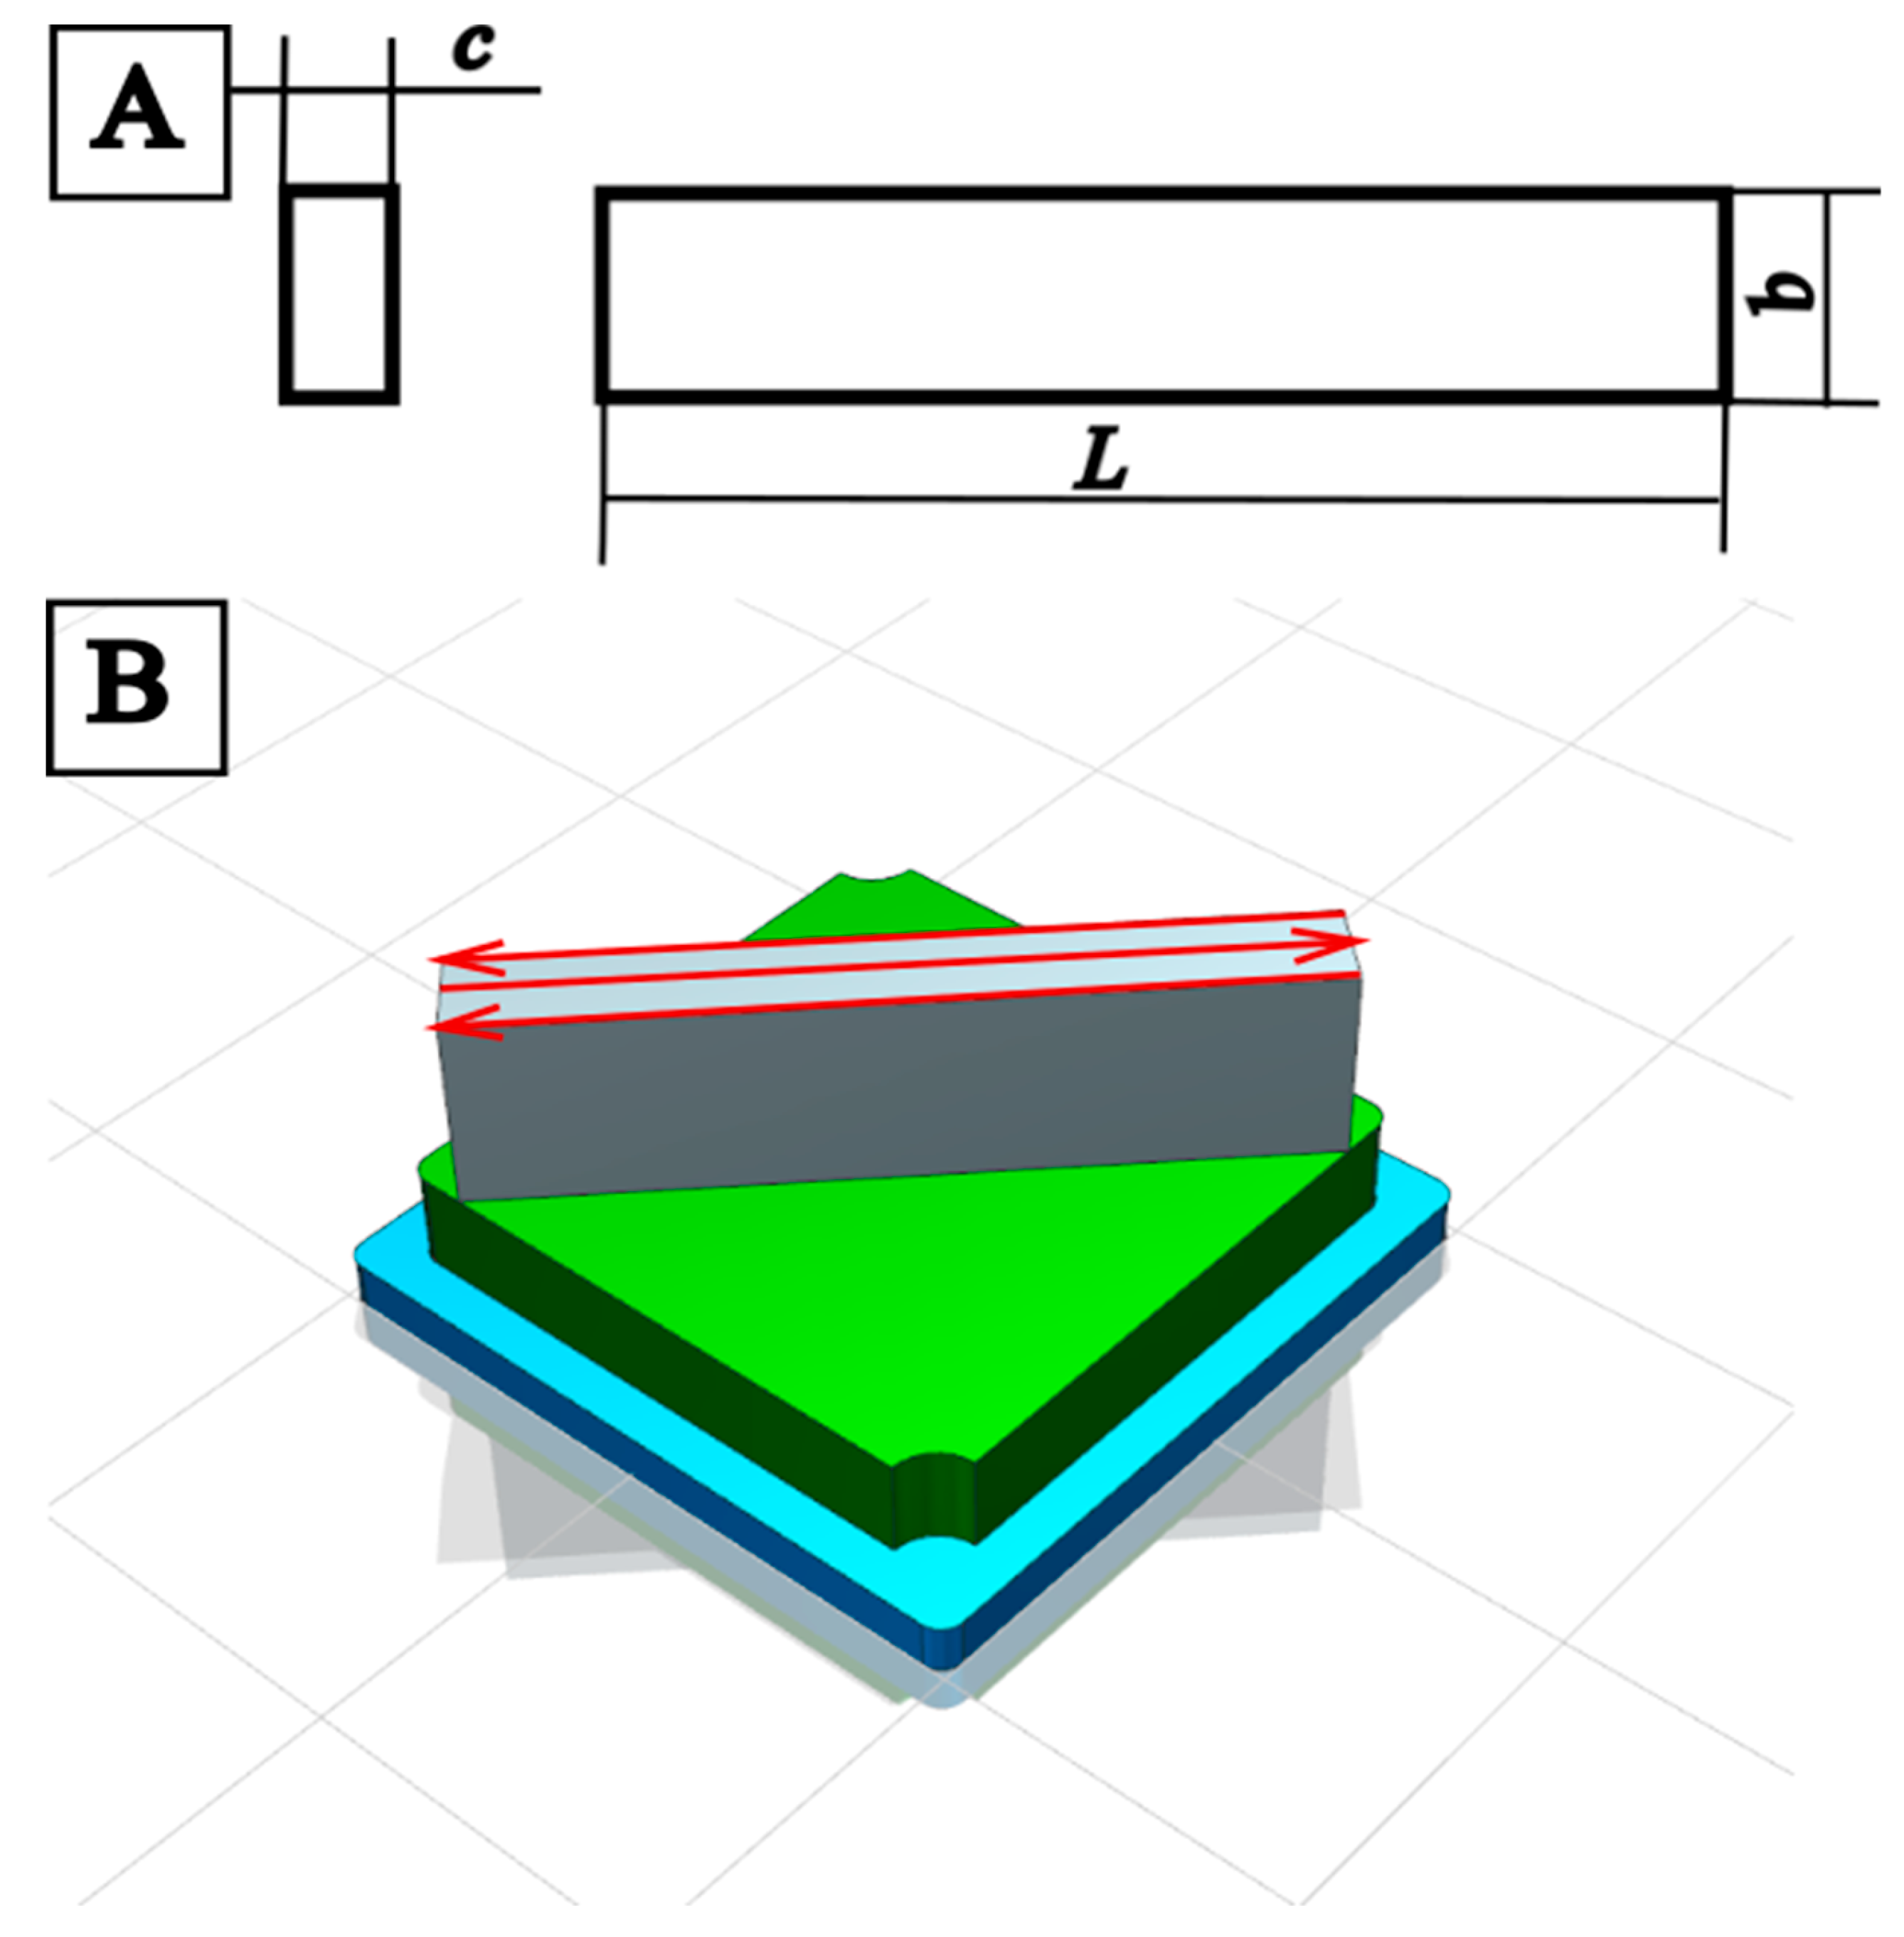
A pre-installed laser with a maximum power of 500 W was used for printing on a Farsoon FS121M SLM selective laser melting machine (Farsoon Technologies, Hunan, China). Layer thickness of 30 µm, laser power P = 340 W, hatching distance of 0.15 mm, and laser travel speed of 1500 mm/sec were the primary printing modes. A schematic representation of the sample and its placement on the table during selective laser melting manufacturing is shown in
Figure 2.
Figure 2a displays the geometry of the specimens that were put through tensile testing. The SLM technique from AlSi10Mg is used to fabricate samples, and
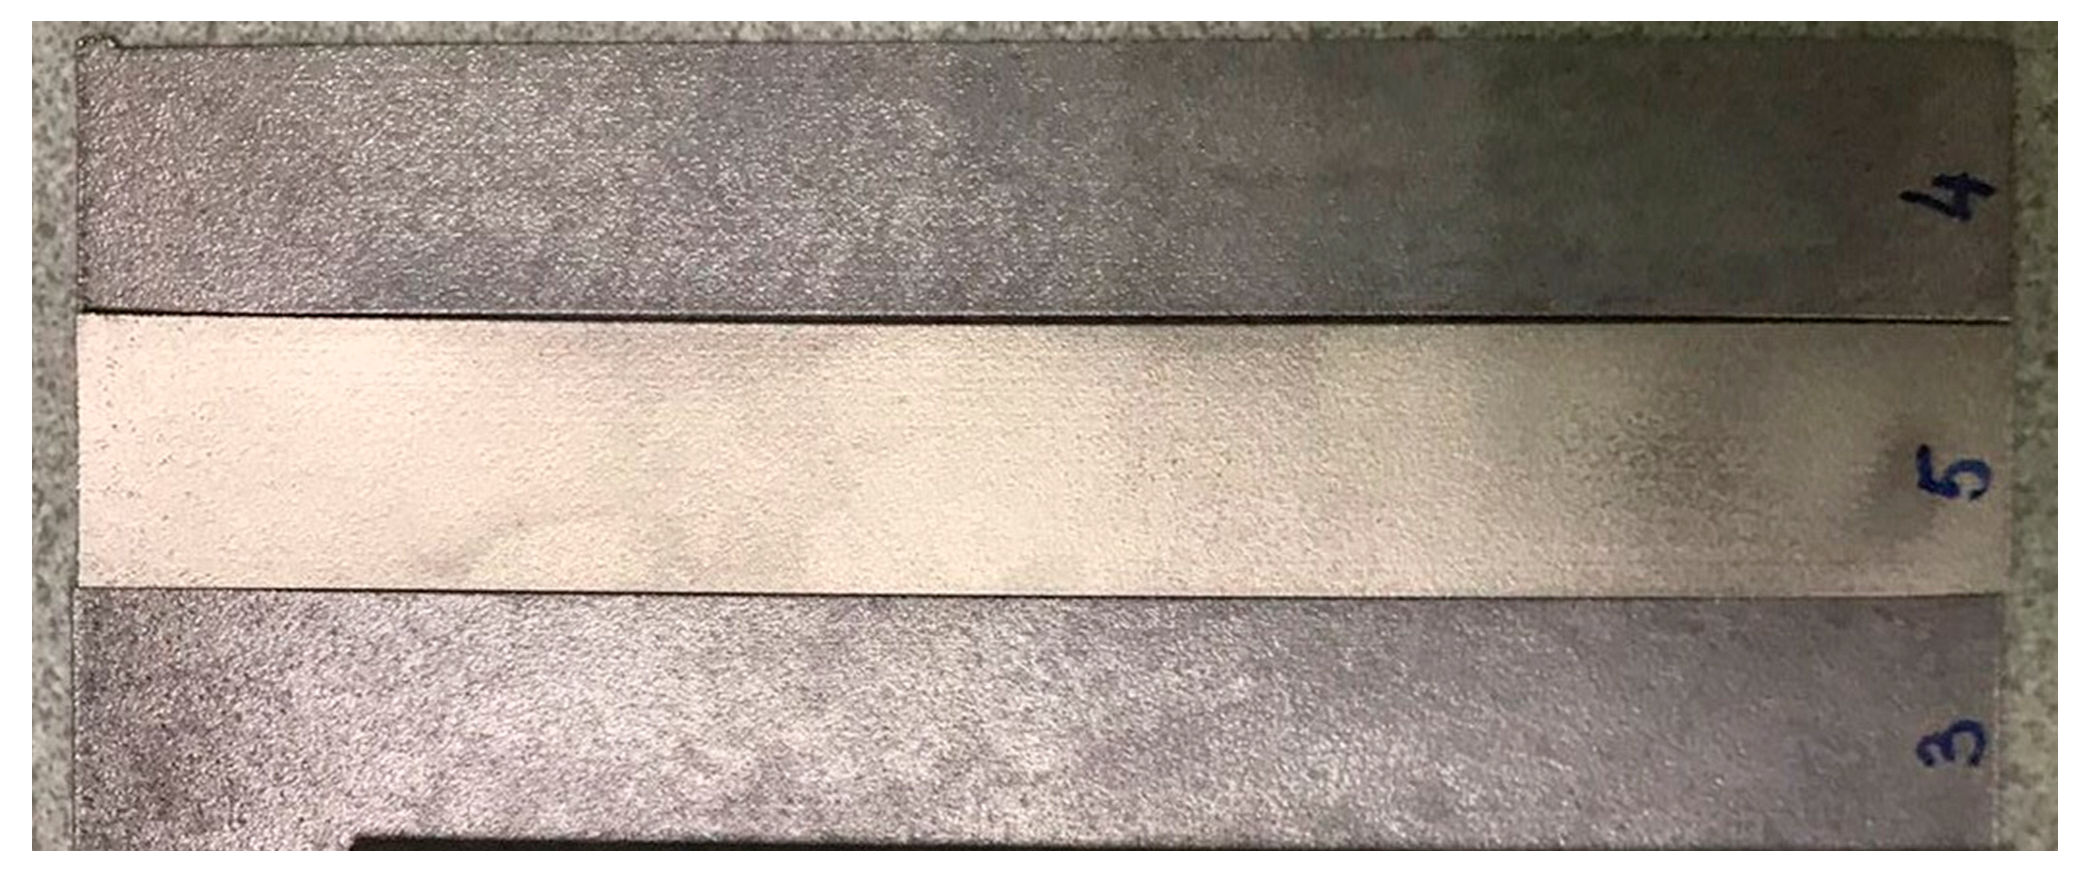
Figure 2b illustrates the scanning approach and sample location on the table during printing. In a natural atmosphere, the samples were heat-treated in a muffle furnace at temperatures ranging from 260 °C to 440 °C in steps of 30 °C. The samples were heated to the holding temperature using the furnace’s natural heating rate, held there for an hour, and then cooled using the furnace’s natural cooling rate. Mechanical testing and surface roughness analysis were performed on the specimens that had undergone heat treatment. Samples produced by selective laser melting of AlSi10Mg are shown in
Figure 3.
Microstructure and technical “stress-strain” diagrams are provided in [
25], derived from the test findings of the specimens depicted in
Figure 3.
2.3. Theoretical Analysis
The theoretical analysis of fracture probability and analysis of the processes occurring during tensile fracture is based on the analysis of the behavior of fracture probability densities [
21]. In this work, we applied the methodology first presented in [
31] but applied to the fracture probability of specimens manufactured by SLM technology from AlSi10Mg. The whole analysis was performed using software written in R language in IDE RStudio.
The empirical fracture probability density function was calculated from experimental data obtained [
25] and based on the theory presented in [
32,
33,
34,
35].
where n is the number of points in the stretching diagram; K is the “kernel” function; k is an arbitrary positive number; dik is the distance from σi to the k nearest point in the stretching diagram data consisting of n-1 other points; h is the smoothing parameter; t is the local point at which the state density function is defined.
Based on equation (1), the fracture probability density function of the specimens obtained by SLM technology is continuous and defined at all stresses from 0 to σF (where σF is the fracture stress). Based on the continuity condition of the function
– the fracture probability density function of the specimens obtained by SLM technology can be decomposed in Fourier series. In the presented work, the fast Fourier transform was applied:
where ρ(γ) is the spectral density of tensile stress distribution of specimens obtained by SLM technology;
is the probability density of failure of specimens obtained by SLM technology.
It follows from equation (2) that all values of the spectral density of the stress distribution belong to the space of complex numbers and, according to Euler’s equation, the behavior of the spectral function is determined by the argument, given
and
:
where γ is the argument of the spectral probability density function; Re(ρ(γ)) - real part of the spectral probability density function of fracture probability; Im(ρ(γ)) - is the imaginary part of the spectral probability density function of fracture probability.
The behavior of the spectral density argument was examined for the presence of symmetry using the following algorithm:
where
is the value of the argument of the spectral function corresponding to the maximum or minimum of the spectral function;
is the voltage value at which the spectral probability density function exhibits symmetry properties.
For the analysis of the empirical fracture probability density function, the main interest is in the behavior of the theoretical probability density function to the left and right of the stress
corresponding to equation (5), symmetry breaking in the vicinity of
and changes in the type of the theoretical distribution to the left and right of
[
30].
The determination of the closest theoretical type of simple distribution to the empirical distribution was carried out by the minimum value of Akaike’s criterion and Bayes’ criterion. And the simple theoretical distributions were:
where sd is the mean square deviation of the stresses; μ is the mathematical expectation of the stress distribution; σ is the stresses.
- 2.
Logarithmically normal:
where s is the scale factor; x
0 is the shift factor.
where a is the shape factor of the Weibull distribution; b is the scale factor of the Weibull distribution.
where k is the number of events (studies).
where λ= 1/μ is the inverse of the mathematical expectation.
The parameters of the distributions were calculated using the maximum likelihood method [
37,
38].
The determination of the total fracture probability density for the bound state of specimens fabricated by SLM technology from AlSi10Mg was calculated using equation [
39]:
where
is the fracture probability density of the i-th specimen; N is the number of tested specimens;
is the total probability density of fracture for the bound state of specimens manufactured by SLM technology.
The calculation of the sample fracture probability density based on the identified theoretical probability densities was performed using Eq:
where
) is the probability density of failure of the i-th specimen; k is the number of the stress distribution;
is the weight of the k-th probability density in the probability density of failure of the specimen;
is the probability density of the distribution at the k-th site of the stress distribution.
Each obtained general probability density distribution function of fracture probability was matched with a theoretical probability density function, and the discrepancy (“non-convexity”) of the general probability densities was found by the equation:
where
is the average theoretical probability density of stress distribution at static failure;
is the actual average probability density of stress distribution at static failure; n is the number of points in the state density function.
Anisotropy of mechanical properties can be manifested both within a single sample obtained by selective laser melting [
40] and from sample to sample [
20]. In this paper we consider the anisotropy of mechanical properties of the material, manifested from sample to sample in tensile tests of thin-walled AlSi10Mg samples produced by selective laser melting technology.
3. Results and Discussion
Stress-strain tensile diagrams of specimens fabricated by SLM technology from AlSi10Mg [
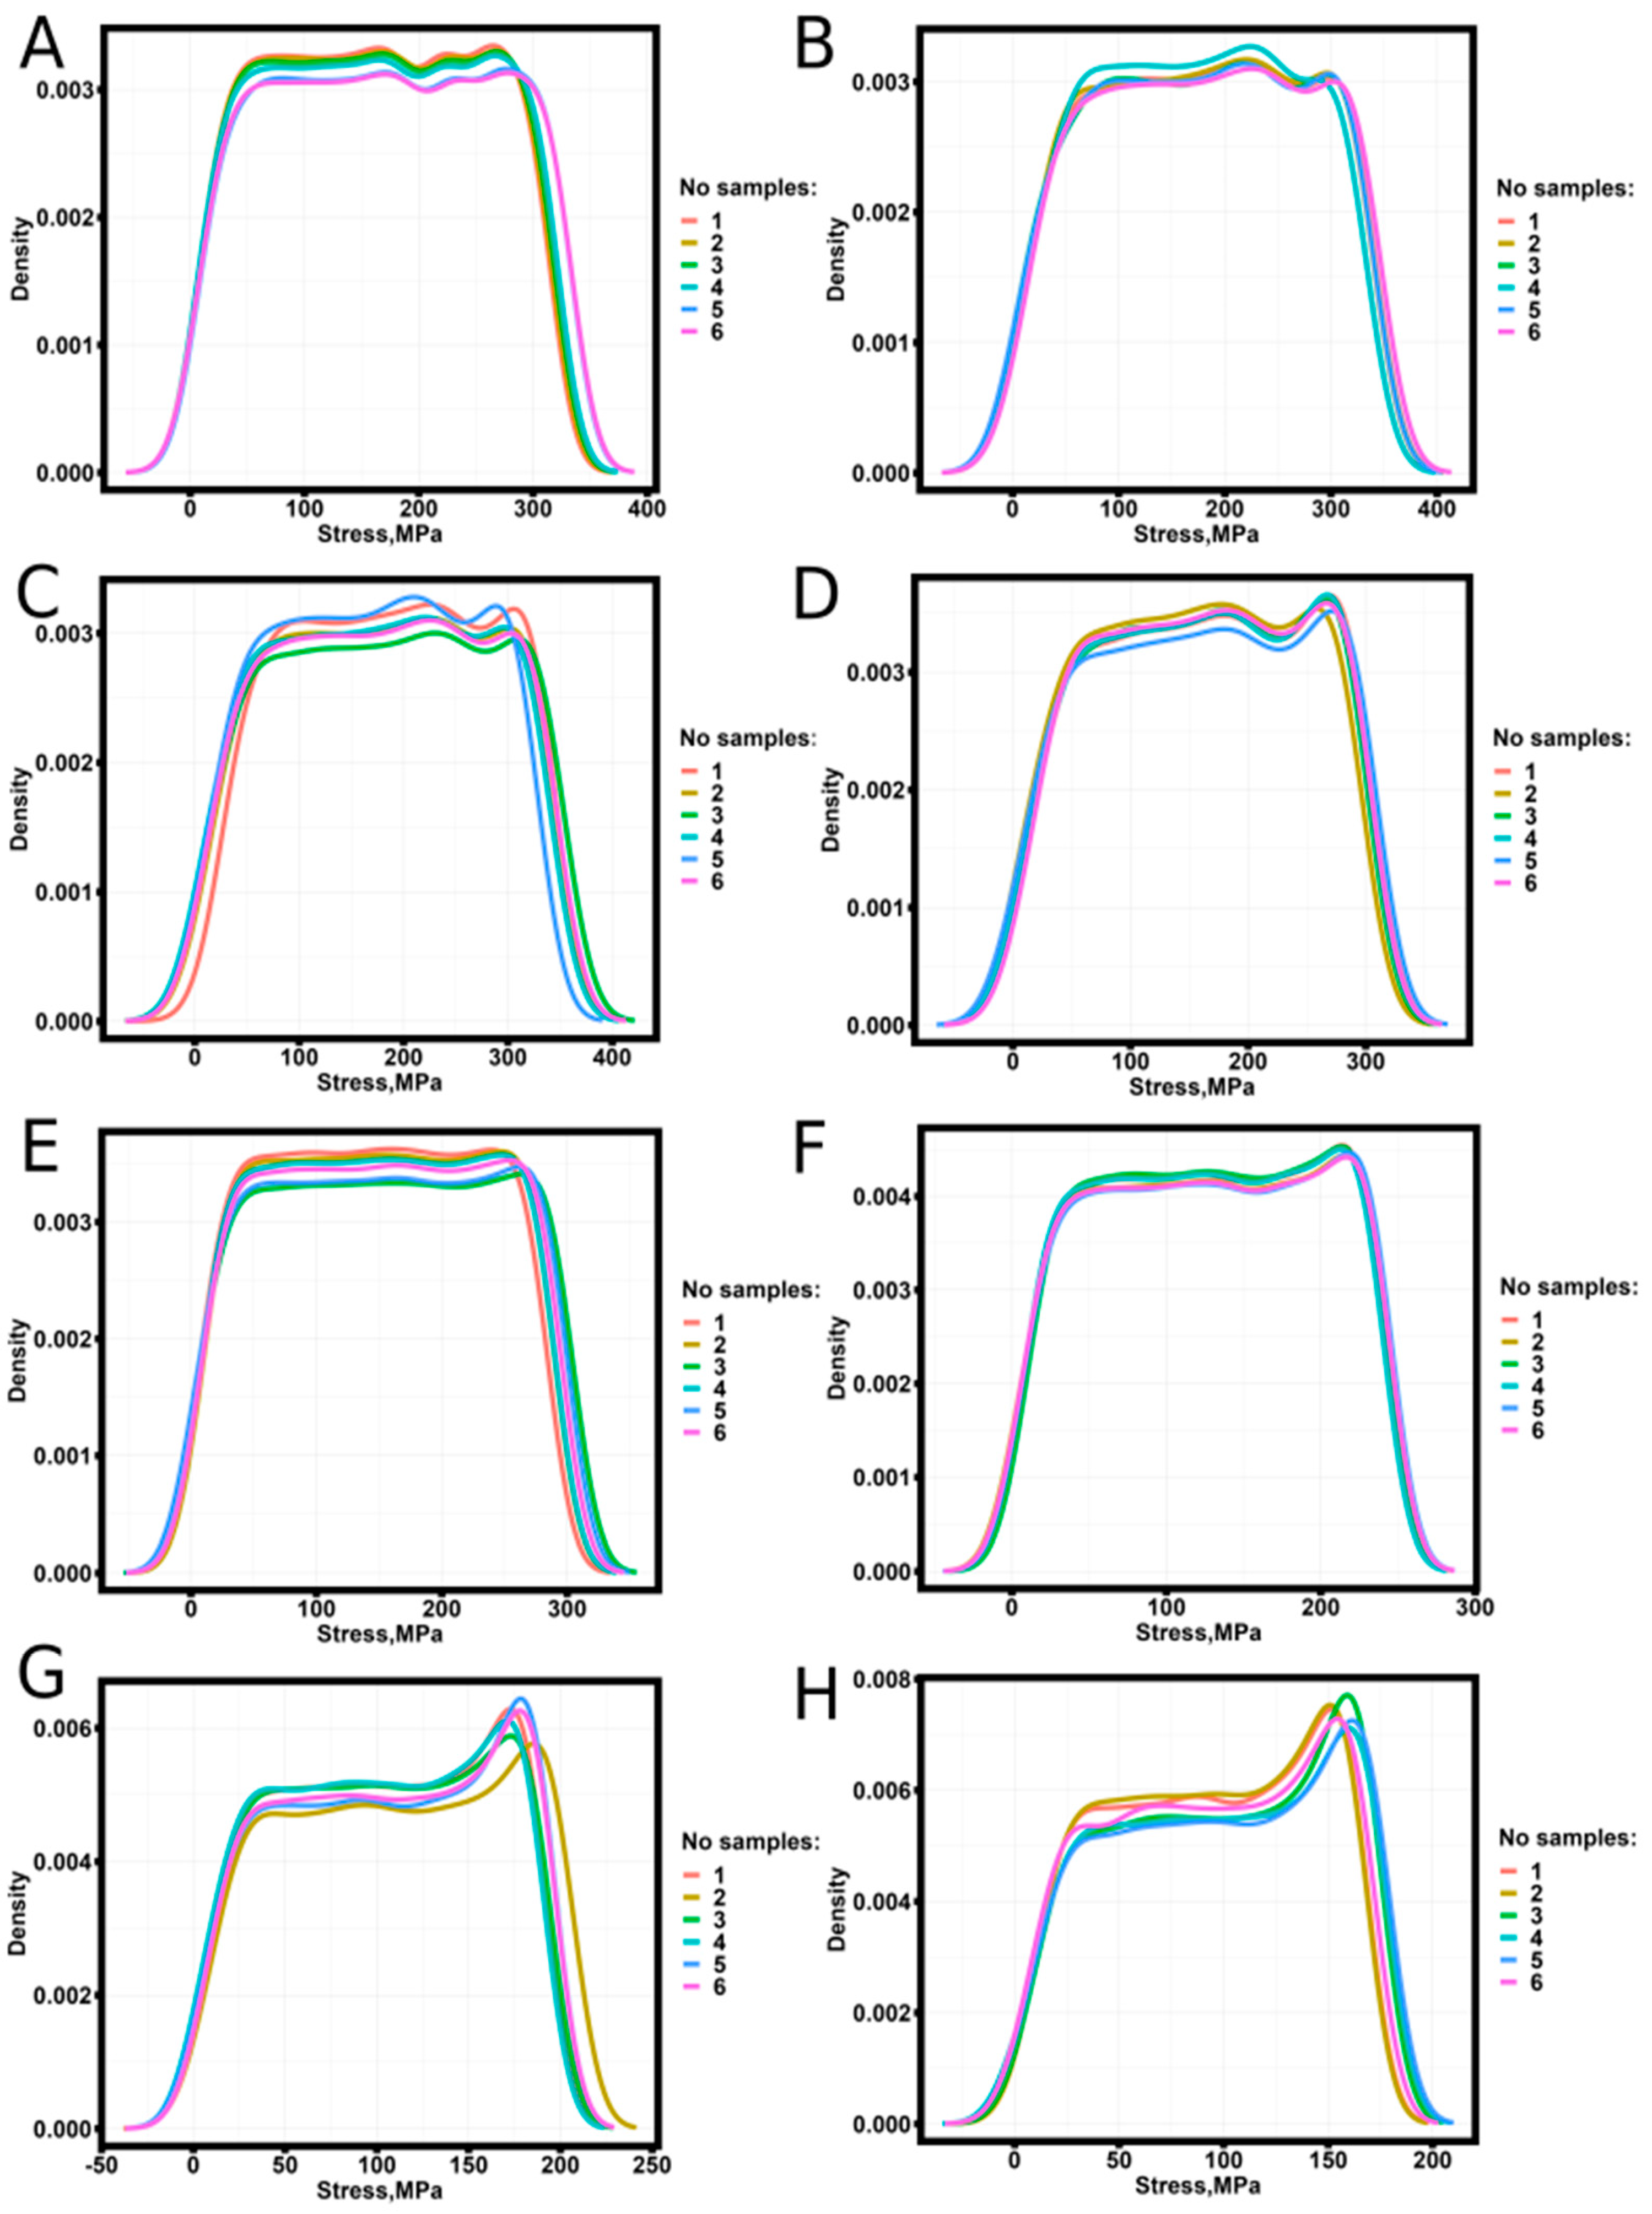
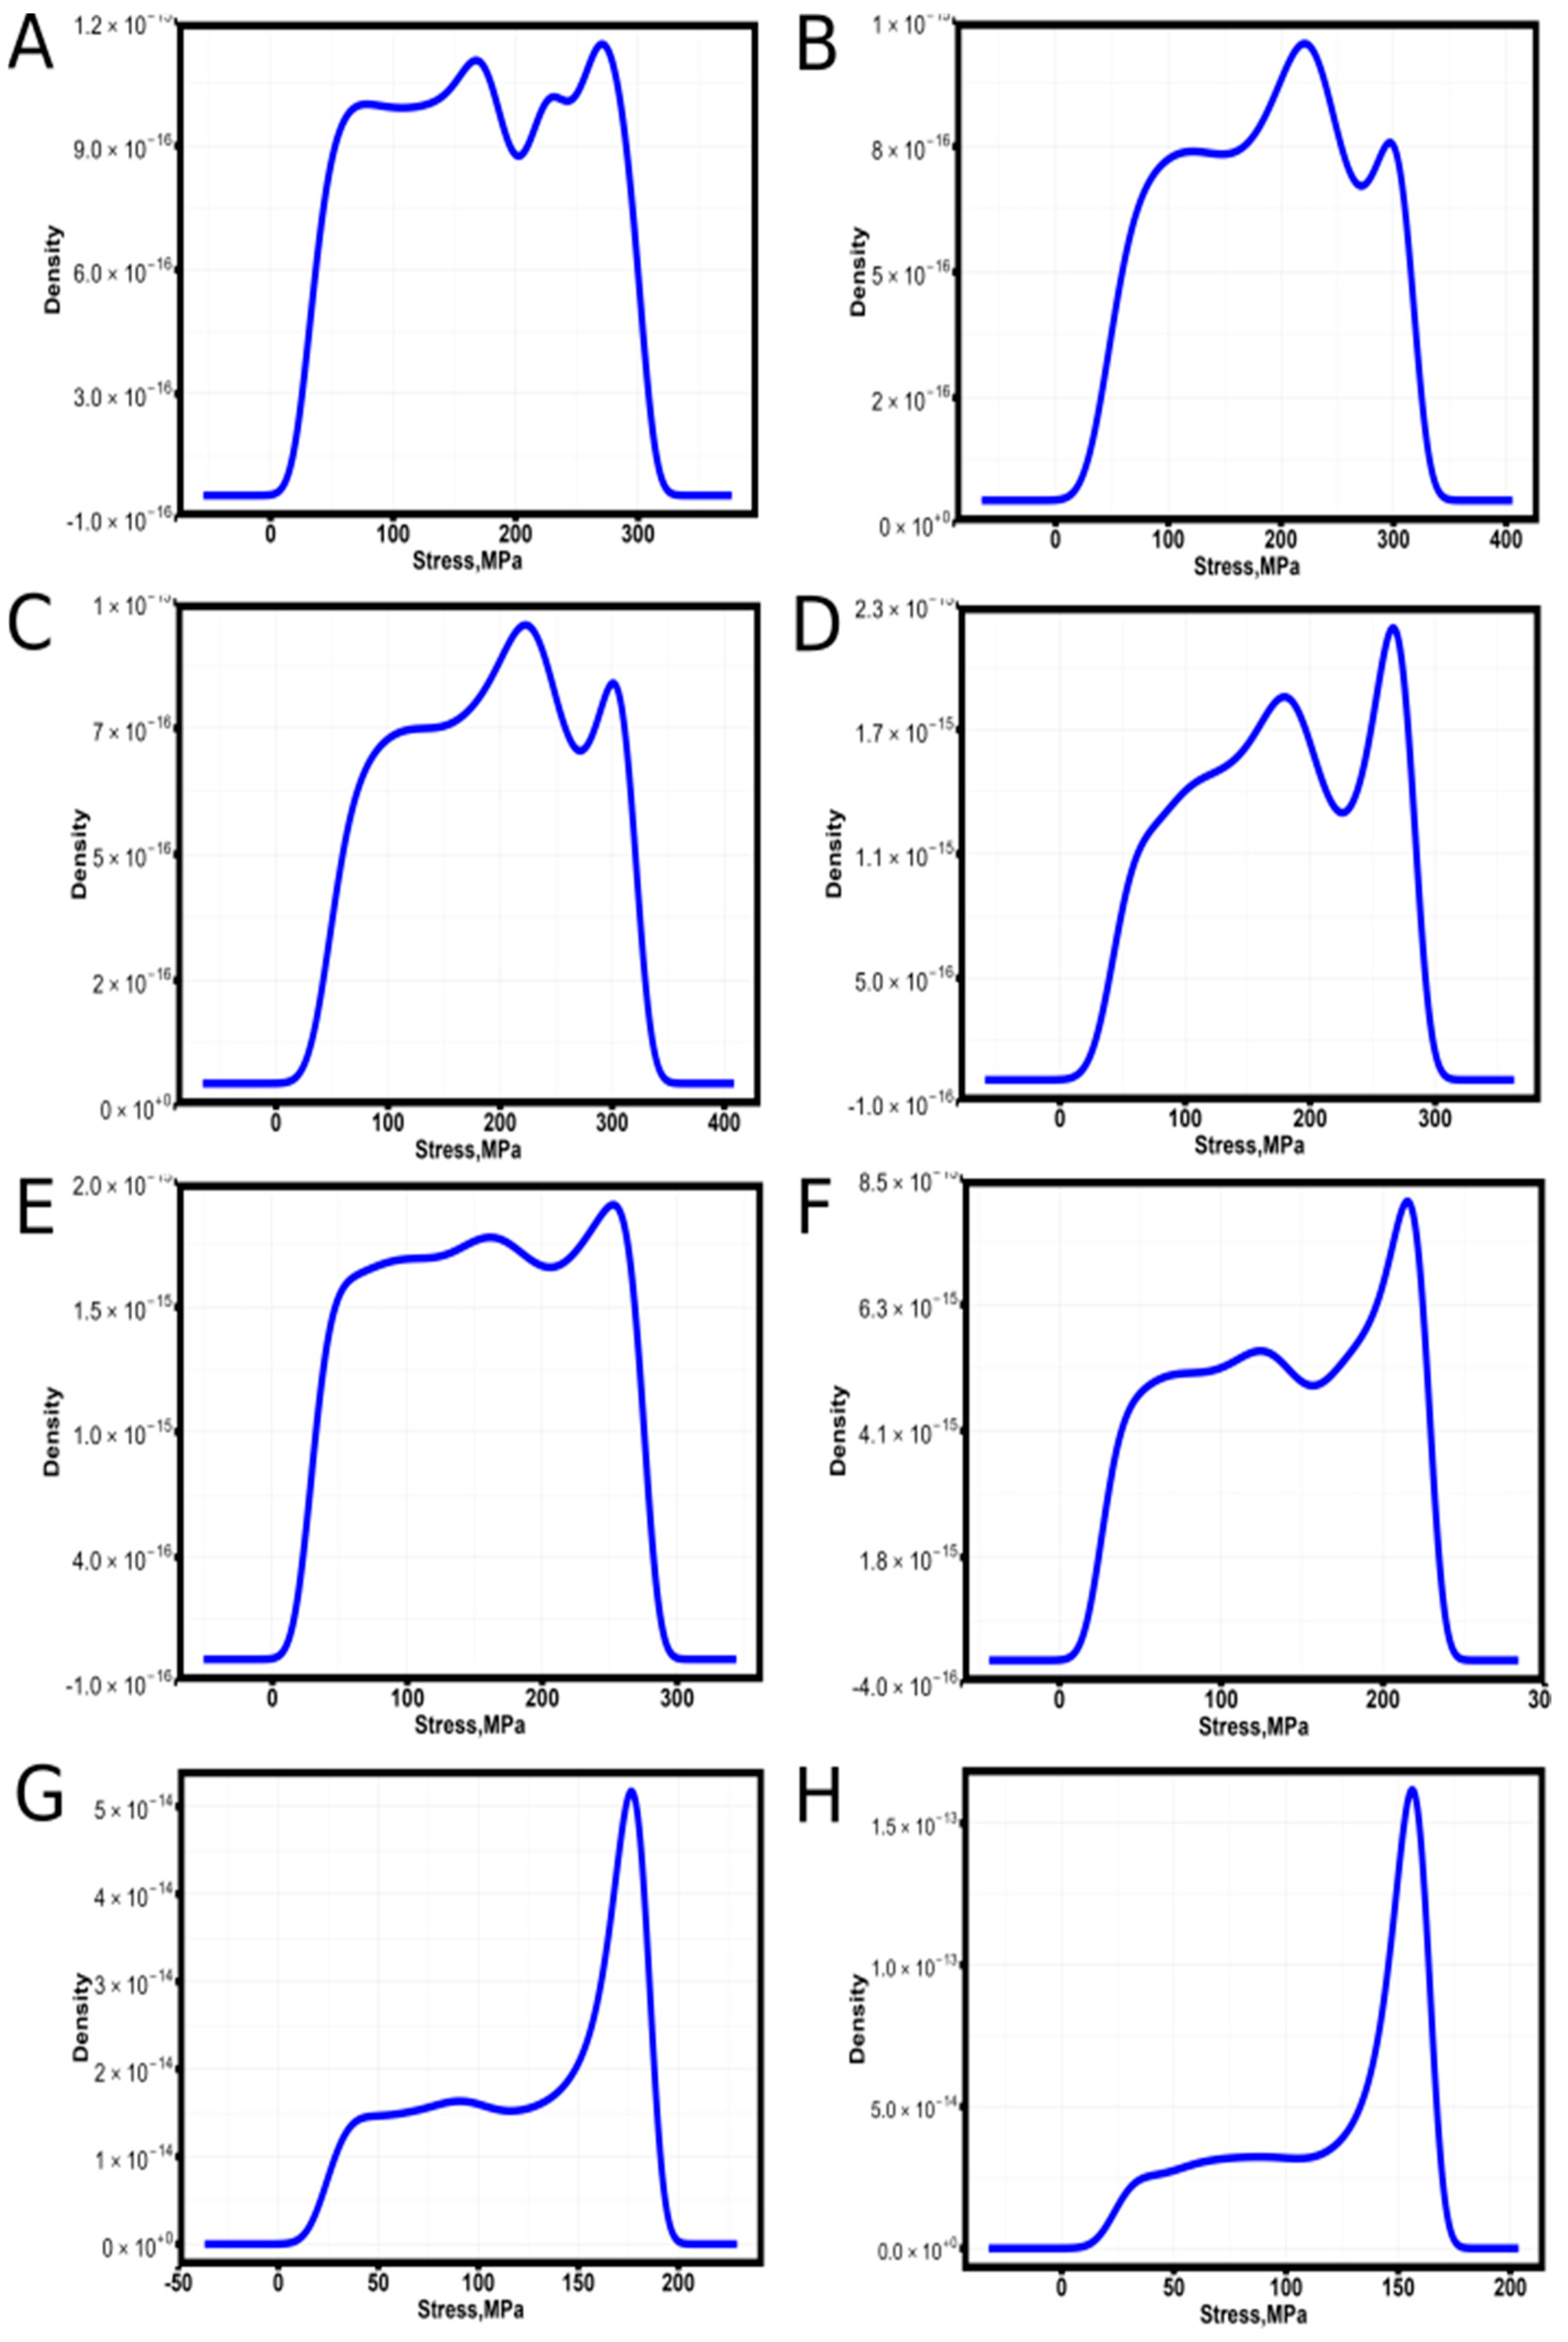
25] were obtained for a series of static tensile tests. The empirical fracture probability densities calculated by equation (1) are presented in
Figure 4.
The analysis of the behavior of the empirical probability density of fracture of samples obtained by SLM technology from AlSi10Mg shows that the empirical probability density of samples before heat treatment at 350 °C inclusive (
Figure 4A - 4E) does not have one clearly expressed extremum, in contrast to the behavior of the empirical probability density of filament samples and samples obtained by FDM printing technology from ABS, PLA and Ceramic with polyamide (60Al2O3/40PLA) [
31]. For the samples produced by SLM technology from AlSi10Mg and heat-treated at temperatures above 350 °C (
Figure 4F - 4H), the empirical probability density has one pronounced maximum with an increasing contribution to the overall fracture probability density depending on the annealing temperature.
Figure 5 shows the results of calculating the argument (3) of the spectral density (2) of states for the samples obtained by SLM technique from AlSi10Mg.
The character of the behavior of the argument of the spectral density function of states from stresses repeats the character of the behavior presented in [
31] and has a break at the point of symmetry of maxima and minima of the argument of the spectral density function of states.
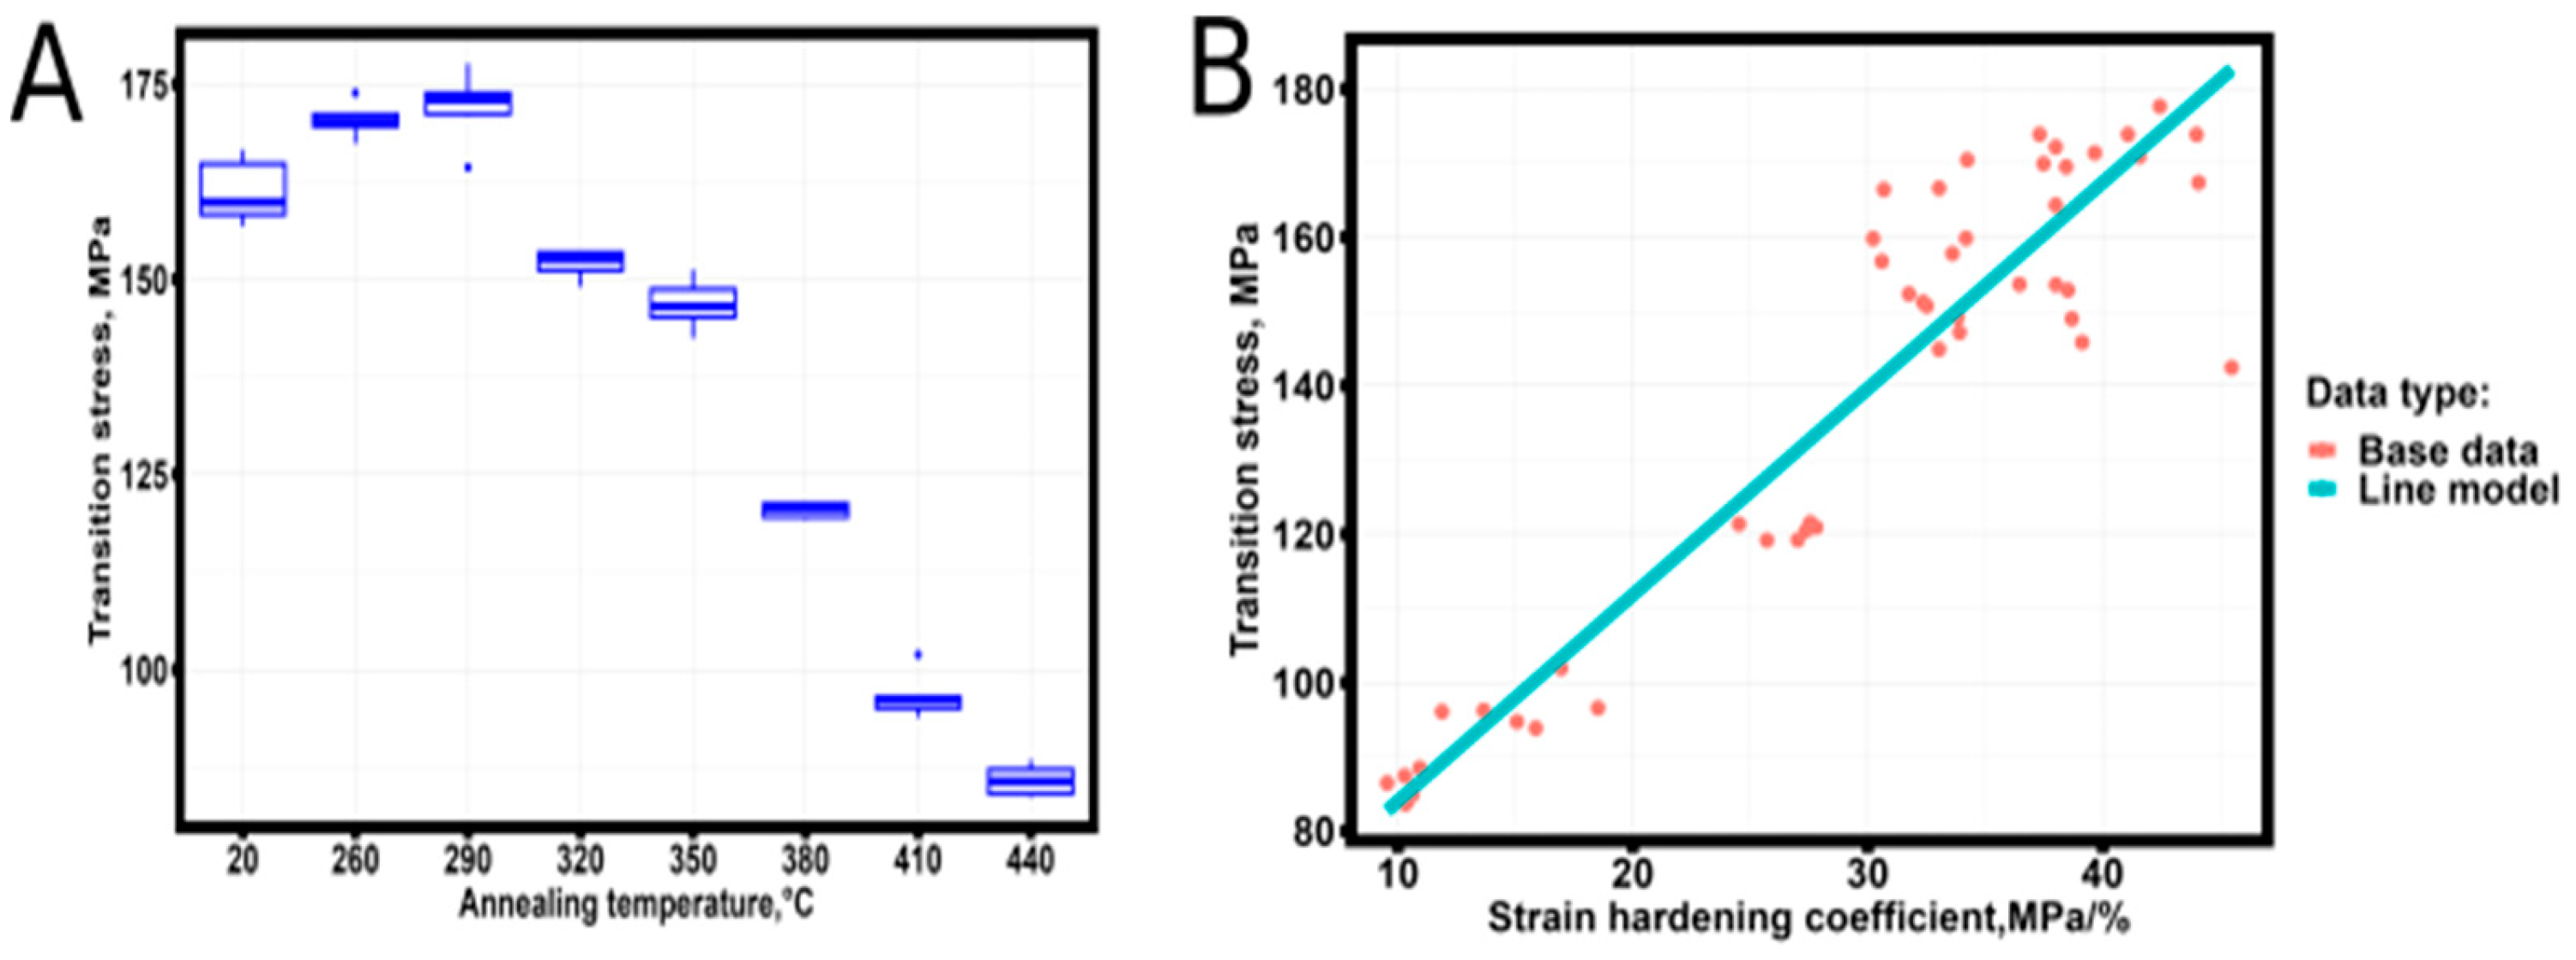
Verification of the presence of Spearman correlation between the values corresponding to the transition point and the strain hardening coefficient [
25] showed a correlation coefficient value of 0.83 at the level of statistical significance p-value = 3.023˟10-13 (Pearson 0.93 with the level of statistical significance p-value < 2.2˟10-16). Thus, these values have a strong statistically significant correlation.
Figure 6 shows the dependence of transition points as a function of heat treatment temperature and transition points as a function of strain hardening coefficient obtained in [
25].
The high value of the correlation coefficient indicates a linear relationship between σT and θ (the robotic regression algorithm [
41] was used to build a linear model):
The mean square deviation of the linear model from the data is 9.876 MPa. Analysis of the dimensionality [
42] of the values included in equation (17) shows that the free term of the equation has the dimension of stress, and the multiplier before the strain hardening coefficient has the dimension of strain, thus a more general representation of equation (17) will have the form:
where σ
0 is the stress corresponding to the beginning of transition from elastic to plastic region of the strain diagram; ε0 is the strain change at the section of transition from elastic to fracture region of the engineering stress-strain diagram.
The closest type of stress distribution to the left and right of σT was analyzed using the Akaike and Bayes criteria. From the eight types of distributions of equation (6)-(13), the one possessing the minimum value of Akaike’s criterion and Bayes’ criterion was selected. The parameters of the distribution functions were calculated by the maximum likelihood method [
43]. The results of the analysis are presented in
Table 2.
The analysis of the behavior of the Weibull distribution parameters to the left and right of the transition point shows that up to the heat treatment temperature of 290 °C, the Weibull distribution scale parameter (b in equation (10)) and the mathematical expectation (in the case of a normal distribution) increase in absolute value, and after 290 °C decrease. For the shape parameter of the Weibull distribution (a in equation (10)), no such dependence is observed, except for cases where the closest type of distribution turns out to be a normal distribution. The mean square deviation of normally distributed stresses also decreases with increasing heat treatment temperature. As the heat treatment temperature increases, the character of the stress distribution changes to the left of the transition stress point corresponding to the elastic region of the strain diagram. To evaluate the correlation between the change in the distribution type and annealing temperature at the section to the left of the transition point, the V criterion of Cramer [
44] was used, which showed a value of 0.4733, indicating a moderate relationship (approaching strong) between the annealing temperature and the closest type of simple transition stress distribution to the left of the transition point. The change in the prevailing type of transition stress distribution to the left of the transition point can be attributed to changes in the structural phase composition of the heat-treated samples. No changes in the closest type of distribution according to the Akaike and Bayes information criterion to the right of the transition point were detected.
Spearman correlation analysis was performed to establish the statistical relationship between the distribution coefficients and mechanical properties; the analysis considered the general correlation and was not specific to the heat treatment temperature.
Table 3 shows the results of the analysis.
From the results of correlation analysis, it follows that the coefficient b (mathematical expectation in the case of normal distribution) of the Weibull distribution to the left of the transition point is strongly correlated with the basic mechanical properties of the specimens, while the coefficient a (mean square deviation in the case of normal distribution) is weakly statistically significantly correlated with the deformation corresponding to the ultimate strength.
Correlation analysis of the Weibull distribution coefficients to the right of the transition point shows a strong correlation with the basic mechanical properties of samples obtained by selective laser melting technology from AlSi10Mg, while the coefficient a has a medium statistically significant correlation with the basic mechanical properties of AlSi10Mg samples.
Table 4 presents the main regression equations describing the identified statistically significant dependencies (the robust regression algorithm [
41] was used to calculate the equation parameters).
Analysis of the obtained regression equations shows that there is a possible relationship between the coefficients of the distributions (
Table 2) with the relative values determined from tensile diagrams (hardening coefficient corresponding to different stages of dislocation motion), the search for confirmation or refutation of this statement is the subject of further research.
The analysis of bound states according to equation (14) shows that the contribution of the Cauchy distribution [
31] with a maximum close to σD (fracture stress) increases with increasing heat treatment temperature. The fracture probability densities of the bound states for 6 samples are presented in
Figure 7.
With increasing number of bound states of samples heat-treated at 410 °C and at 440 °C, the probability density of failure of the bound state described by a complex distribution degenerate into the Cauchy distribution. Considering the above and applying equation (15) and the results of the analysis of stresses to the left and right of the transition point (
Table 2), the fracture probability density of the samples obtained by selective laser melting of AlSi10Mg has been reconstructed.
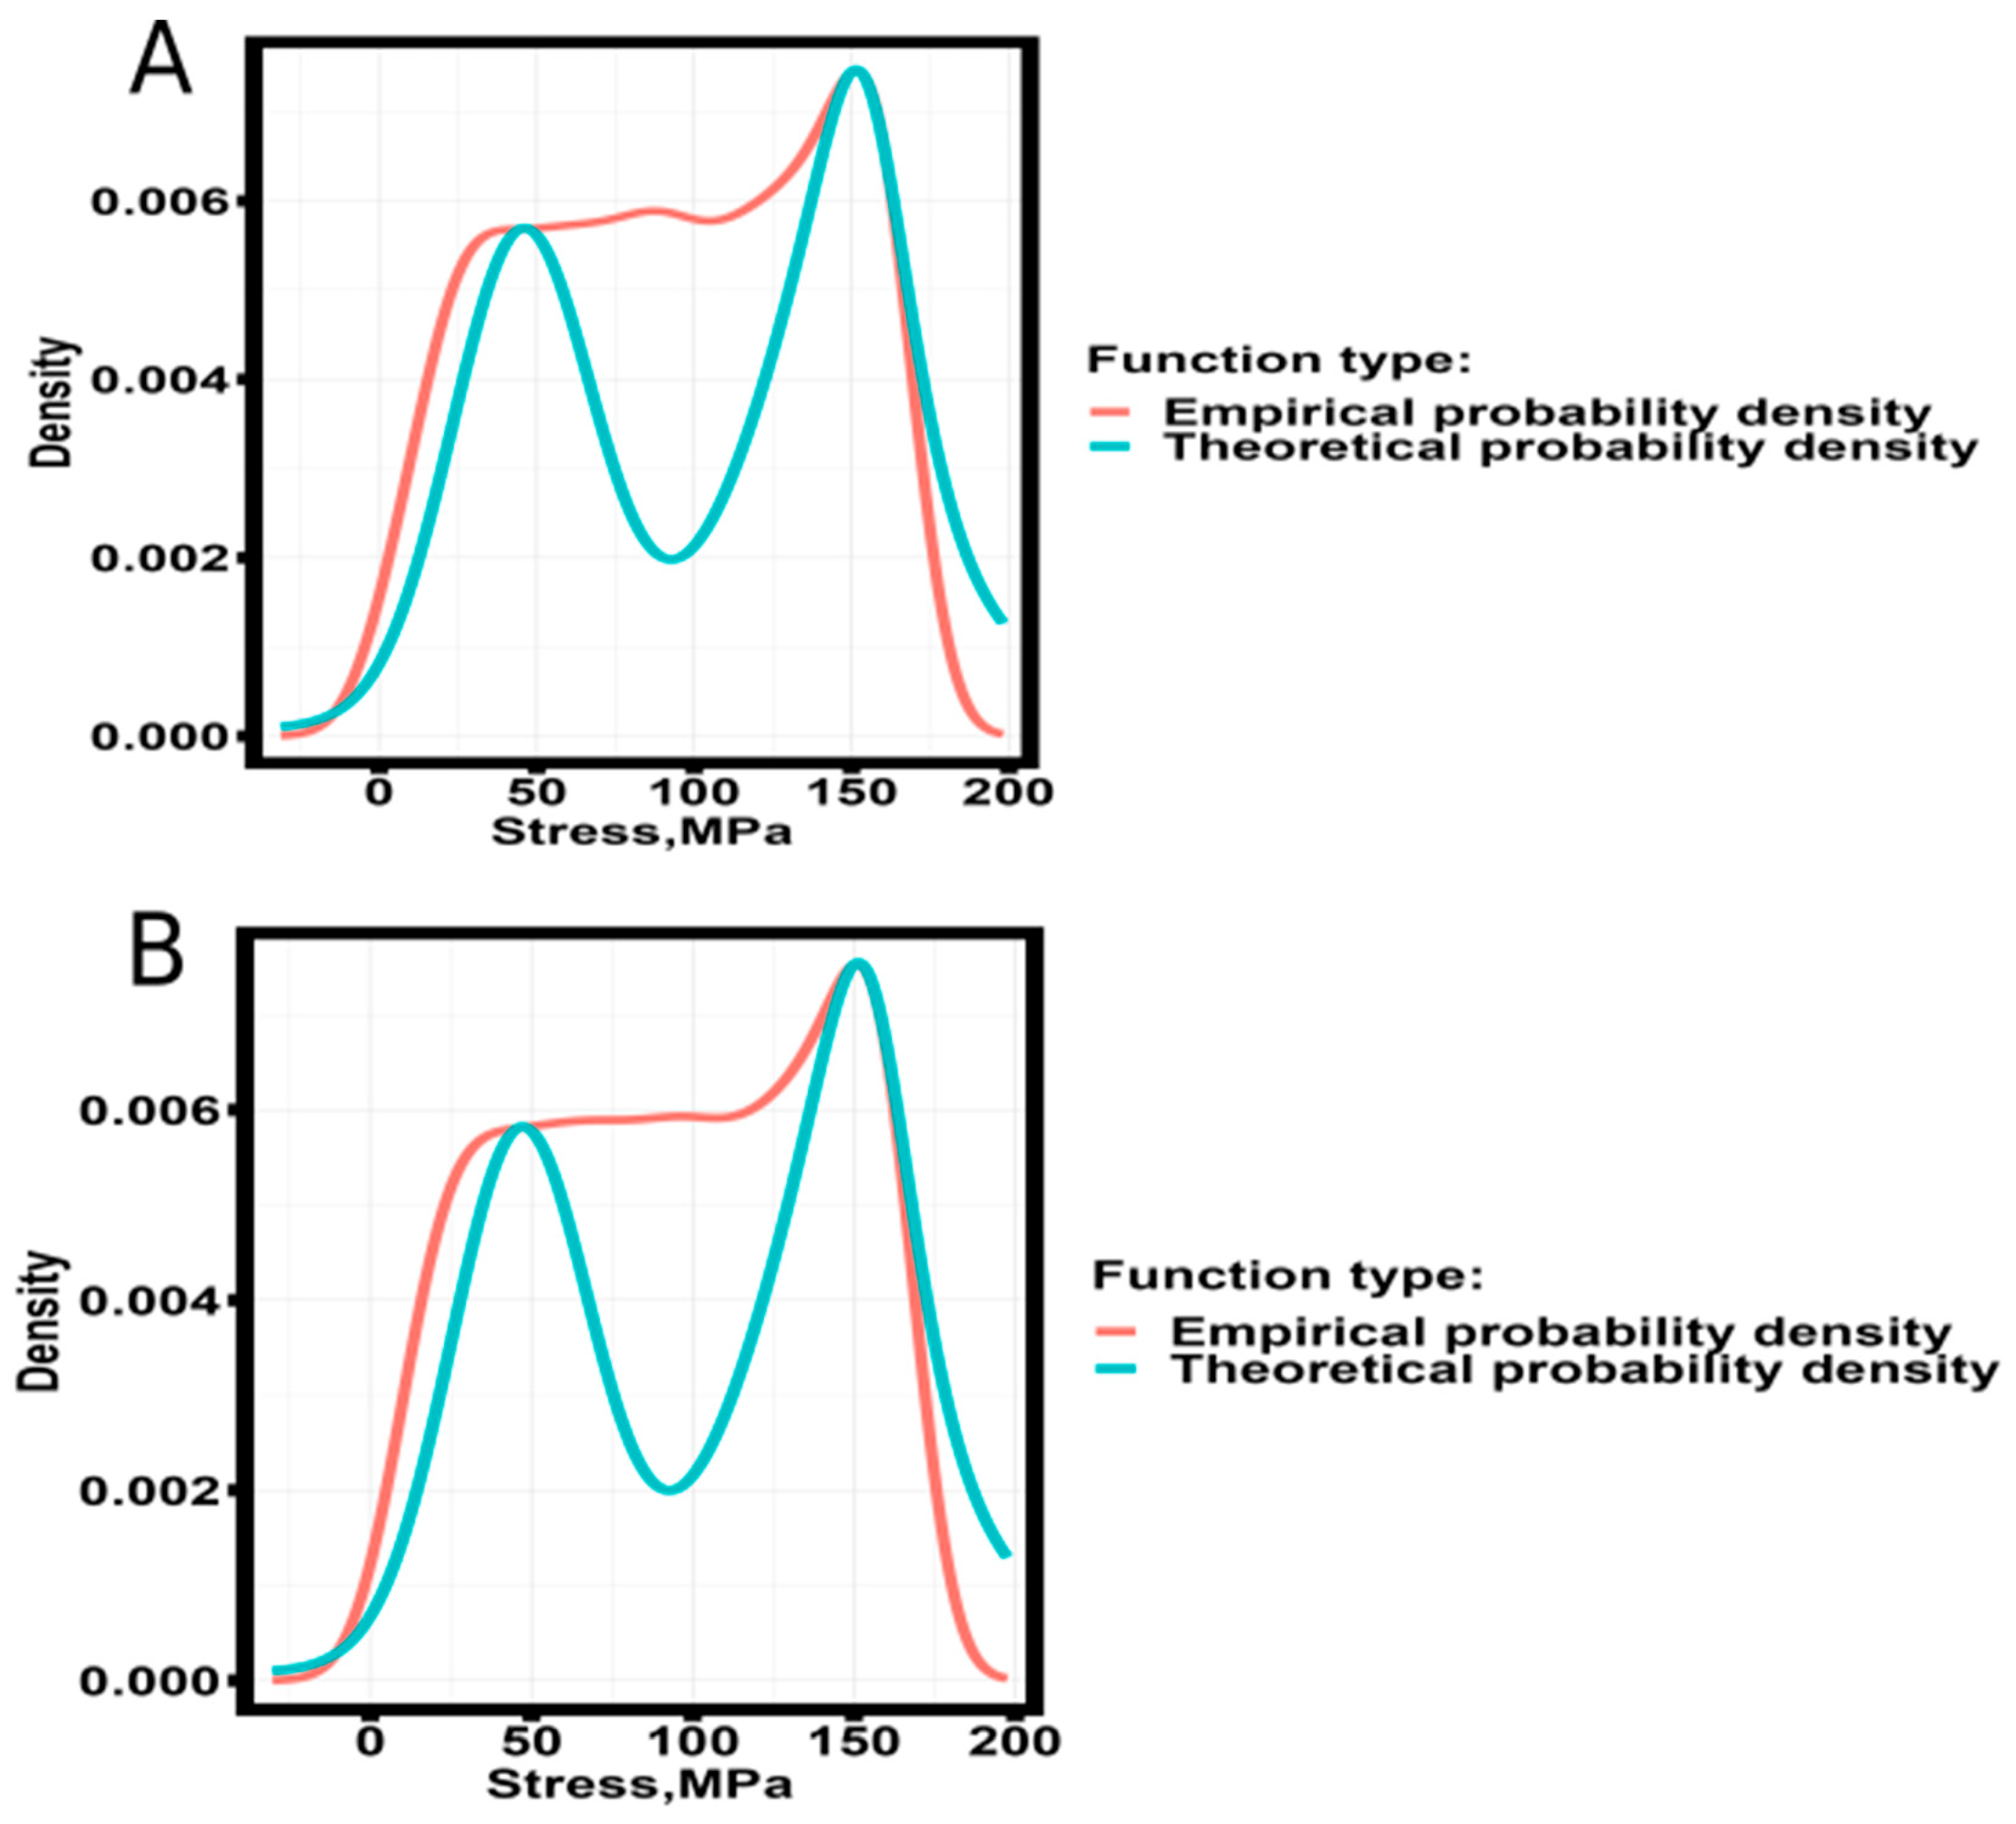
Figure 8 shows the results of probability density modeling of samples No. 1 and No. 2 heat-treated at 440 °C.
In contrast to the description of the fracture probability density of filament and samples made by FDM printing technology [
31], for samples made of AlSi10Mg the theoretical fracture probability density has more pronounced features in the region of the transition point, which requires further studies to refine the model (15). Despite the presence of visual discrepancies, the deviations of the theoretical probability density (16) from the empirical one have extremely small values. The results of calculating the deviations are presented in
Table 5.
Thus, developed in [
31] can be applied to describe the fracture probability of samples obtained by selective laser melting technology from AlSi10Mg.
4. Conclusions
The analysis revealed that the stress value corresponding to minus infinity of the argument of the spectral function of the density of states (transition stress) is strongly correlated with the strain hardening coefficient calculated in the section from the yield strength to the strength of the engineering stress-strain diagram. The application of robotic regression analysis and the theory of dimensionality allowed us to establish a general relationship between the mechanical properties of the material, the strain hardening coefficient and the value of the transition point.
Application of the Akaike and Bayes information criteria allowed us to establish that the distribution of stresses to the left of the transition point changes from a Weibull distribution to a normal distribution with increasing temperature of heat treatment of the samples. Application of Cramer’s criterion showed that this change has a moderate statistically significant relationship with the heat treatment temperature of samples made by selective laser melting technology from AlSi10Mg. Considering the studies conducted by other authors, it can be concluded that the change in the closest theoretical stress distribution is associated with structural and phase changes occurring in the material during heat treatment.
As a result of the analysis of the bound states of the specimens, it was found that with increasing ductility of the material after heat treatment, the contribution of the fracture probability density described by the Cauchy distribution with a mode in the fracture stress region of the specimens increases.
The theoretical model describing the fracture probability density developed because of the analysis agrees well with the empirical fracture probability density.
Further studies will be aimed at describing the transition from the Weibull distribution to the normal distribution and establishing the relationship between the coefficients of the theoretical distributions and strain hardening in the corresponding areas of engineering stress-strain diagrams.
Author Contributions
Conceptualization, N.N., A.F. and P.S.; methodology, N.N., A.M. and M.V.; software, N.N., R.K. and I.I.; validation, A.F., P.S. and A.M.; formal analysis, N.N., M.V.; investigation, R.K.; resources, S.N.G. and P.P.; data curation, I.I.; writing—original draft preparation, N.N.; writing—review and editing, N.N. and S.N.G.; visualization, A.F. and P.S.; supervision, S.N.G.; project administration, P.P.; funding acquisition, S.N.G. and P.P. All authors have read and agreed to the published version of the manuscript.
Funding
This study was funded by Ministry of Science and Higher Education of the Russian Federation (grant number: 056-00041-23-00).
Data Availability Statement
All data are presented in manuscript.
Conflicts of Interest
The authors declare no conflict of interest.
References
- Huebner, Kenneth H. (2001). The Finite Element Method for Engineers. Wiley. ISBN 978-0-471-37078-9.
- Eymard, R. Gallouët, T. R., Herbin, R. (2000) The finite volume method Handbook of Numerical Analysis, Vol. VII, 2000, p. 713–1020. Editors: P.G. Ciarlet and J.L. Lions.
- Atanackovic, Teodor M.; Guran, Ardeshir (16 June 2000). Theory of Elasticity for Scientists and Engineers. Dover books on physics. Springer Science & Business Media. ISBN 978-0-8176-4072-9.
- Rodríguez, J.F. , Thomas J.P., Renaud J.E. Mechanical behaviour of acrylonitrile butadiene styrene (ABS) fused deposition materials. Experimental investigation // Rapid Prototyping Journal. 2001.Vol. 7. No. 3. P. 148-158.
- Grigoriev, S.; Peretyagin, N.; Apelfeld, A.; Smirnov, A.; Morozov, A.; Torskaya, E.; Volosova, M.; Yanushevich, O.; Yarygin, N.; Krikheli, N.; et al. Investigation of Tribological Characteristics of PEO Coatings Formed on Ti6Al4V Titanium Alloy in Electrolytes with Graphene Oxide Additives. Materials 2023, 16, 3928. [Google Scholar] [CrossRef] [PubMed]
- Zak, G., Haberer, M., Park, C.B. and Benhabib, B. Mechanical properties of short fiber layered composites // Rapid Prototyping Journal, 2000. Vol. 6 No. 2, pp.
- Contuzzi, N.; Campanelli, S.L.; Ludovico, A.D. 3D Finite Element Analysis in the selective laser melting process. Int. J. Simul. Model. 2011, 10, 113–121. [Google Scholar] [CrossRef] [PubMed]
- Ahmadi, Arman, et al. “Finite element modeling of selective laser melting 316l stainless steel parts for evaluating the mechanical properties.” International Manufacturing Science and Engineering Conference. Vol. 49903. American Society of Mechanical Engineers, 2016.
- Păcurar, R.; Păcurar, A.; Petrilak, A.; Bâlc, N. Finite Element Analysis to Predict the Mechanical Behavior of Lattice Structures Made by Selective Laser Melting Technology. Appl. Mech. Mater. 2014, 657, 231–235. [Google Scholar] [CrossRef]
- B. R. Lawn, Fracture of Brittle Solids, 2nd ed. Cambridge University Press, Cambridge, 1993.
- Konov, S., Frolov, A., Shapovalov, P., Peretyagin, P., Grigoriev, S. Segmented Four-Element Photodiodes in a Three-Dimensional Laser Beam Angle Measurement. Photonics, 2023, 10 (7), 704.
- Statistical Models for the Fracture of Disordered Media, edited by H. J. Herrmann and S. Roux North-Holland, Amsterdam, 1990.
- Grigoriev, S.; Peretyagin, N.; Apelfeld, A.; Smirnov, A.; Yanushevich, O.; Krikheli, N.; Kramar, O.; Kramar, S.; Peretyagin, P. Investigation of MAO Coatings Characteristics on Titanium Products Obtained by EBM Method Using Additive Manufacturing. Materials 2022, 15, 4535. [Google Scholar] [CrossRef] [PubMed]
- S. L. Pheonix and R. Raj, Acta Metall. Mater. 40, 2813, 1992; P. L. Leath and P. M. Duxbury, Phys. Rev. B 49, 14 905, 1994; W. A. Curtin, Phys. Rev. Lett. 80, 1445, 1998.
- Smirnov, A.; Kuznetsova, E.; Pristinskiy, Y.; Podrabinnik, P.; Mironov, A.; Gershman, I.; Peretyagin, P. Effect of Milling Conditions on the Microstructural Design in Aluminum Based Alloy Fabricated by SPS. Metals 2019, 9, 1164. [Google Scholar] [CrossRef]
- Kurmysheva, A.Y.; Yanushevich, O.; Krikheli, N.; Kramar, O.; Vedenyapina, M.D.; Podrabinnik, P.; Pinargote, N.W.S.; Smirnov, A.; Kuznetsova, E.; Malyavin, V.V.; et al. Adsorption Ability of Graphene Aerogel and Reduced Graphene Aerogel toward 2,4-D Herbicide and Salicylic Acid. Gels 2023, 9, 680. [Google Scholar] [CrossRef] [PubMed]
- Grigoriev, S.; Peretyagin, N.; Apelfeld, A.; Smirnov, A.; Rybkina, A.; Kameneva, E.; Zheltukhin, A.; Gerasimov, M.; Volosova, M.; Yanushevich, O.; et al. Investigation of the Characteristics of MAO Coatings Formed on Ti6Al4V Titanium Alloy in Electrolytes with Graphene Oxide Additives. J. Compos. Sci. 2023, 7, 142. [Google Scholar] [CrossRef]
- Skorodumov, S.V.; Neganov, D.A.; Studenov, E.P.; Poshibaev, P.V.; Nikitin, N.Y. Statistical analysis of mechanical test results for samples of pipes from trunk oil pipelines after long-term operation. Industr. Lab. Diagn. Mater. 2022, 88, 82–91. [Google Scholar] [CrossRef]
- Bolotin, V.V., Statistical methods in construction mechanics. Publishing house of literature on construction. Moscow, 1965, p. 267.
- Weibull, W. Fatigue testing and analysis of results, New York, Pergamon Press, 1961, cc.
- W. Weibull, Proc. Ing. Vatenskaps. Akad. 151, 1, 1939; J. Appl. Mech. 18, 293, 1951.
- Abdullin, M.R. and Berezin, A.V. Prediction of basic strength values of metallic materials by distribution of microdefects formed in the process of plastic deformation// Problems of Mechanical Engineering and Automation, 2006, No. 3, pp. 40-44.
- H. Akaike, in Applications of Statistics, edited by P. R. Krishnaiah North-Holland, Amsterdam, 1977, p. 27; Y. Sakamoto, M. Ishiguro, and G. Kitagawa, Akaike Information Criterion Statistics Reidel, Dordrecht, 1983.
- Lu, C.; Danzer, R.; Fischer, F.D. Fracture statistics of brittle materials: Weibull or normal distribution. Phys. Rev. E 2002, 65, 067102. [Google Scholar] [CrossRef] [PubMed]
- Grigoriev, S.N.; Nikitin, N.; Yanushevich, O.; Kriheli, N.; Kramar, O.; Khmyrov, R.; Idarmachev, I.; Peretyagin, P. Experimental and Statistical Analysis of the Effect of Heat Treatment on Surface Roughness and Mechanical Properties of Thin-Walled Samples Obtained by Selective Laser Melting from the Material AlSi10Mg. Materials 2023, 16, 7326. [Google Scholar] [CrossRef] [PubMed]
- Oakley, Jeremy E., and Anthony O’Hagan. “Probabilistic sensitivity analysis of complex models: a Bayesian approach.” Journal of the Royal Statistical Society Series B: Statistical Methodology 66.3 (2004): 751-769.
- El-Awady, A.; Ponnambalam, K. Integration of simulation and Markov Chains to support Bayesian Networks for probabilistic failure analysis of complex systems. Reliab. Eng. Syst. Saf. 2021, 211, 107511. [Google Scholar] [CrossRef]
- McLachlan, G.; Sharon X., L.; Rathnayake, S.I. Finite mixture models. Annu. Rev. Stat. Appl. 2019.
- Smirnov, A.; Peretyagin, P.; Nikitin, N. Assessment effect of nanometer-sized Al2O3 fillers in polylac-tide on fracture probability of filament and 3D printed samples by FDM. Materials 2023, 16, 1671. [Google Scholar] [CrossRef] [PubMed]
- Nikitin, N.Y. Calculation of Fracture Probability. Scientific readings by them. Corre-sponding Member of the Russian Academy of Sciences Ivan A. Oding. Mechanical Properties of Structural Materials. Moscow 2020.
- Smirnov, A.; Peretyagin, P.; Nikitin, N. Modeling of Stress Distribution and Fracture in ABS, PLA, and Alumina-Filled PLA Filaments and FDM-Printed Specimens. J. Compos. Sci. 2023, 7, 265. [Google Scholar] [CrossRef]
- Scott, D. W. (1992). Multivariate Density Estimation. Theory, Practice and Visualization. New York: Wiley.
- Sheather, S.J.; Jones, M.C. A Reliable Data-Based Bandwidth Selection Method for Kernel Density Estimation. J. R. Stat. Soc. Ser. B Stat. Methodol. 1991, 53, 683–690. [Google Scholar] [CrossRef]
- Silverman, B. W. (1986). Density Estimation. London: Chapman and Hall.
- Venables, W. N.; Ripley, B. D. (2002). Modern Applied Statistics with S. New York: Springer.
- Sinay, Y.G. Theory of phase transitions. Rigorous Results. - Moscow: Nauka. Main Ed-itorial Office of Physical and Mathematical Literature. 1980, 208 с.
- Venables WN and Ripley BD (2002), Modern applied statistics with S. Springer, New York, pp. 435-446.
- Delignette-Muller ML and Dutang C (2015), fitdistrplus: An R Package for Fitting Distributions. Journal of Statistical Software, 64(4), 1-34.
- Landau, L. D. and Lifshitz, E. M. Theoretical physics. Vol. 5. Statistical physics. - Moscow: Nauka, 1964. 568 с.
- Patakham, U.; Palasay, A.; Wila, P.; Tongsri, R. MPB characteristics and Si morphologies on mechanical properties and fracture behavior of SLM AlSi10Mg. Mater. Sci. Eng. A 2021, 821, 141602. [Google Scholar] [CrossRef]
- P. J. Huber (1981) Robust Statistics. Wiley.
- Sena, L. A. “Units of physical quantities and their dimensions.” (1977).
- Rossi, Richard J. (2018). Mathematical Statistics: An Introduction to Likelihood Based Inference. New York: John Wiley & Sons. p. 227.
- Cramér, Harald. 1946. Mathematical Methods of Statistics. Princeton: Princeton University Press, page 282.
|
Disclaimer/Publisher’s Note: The statements, opinions and data contained in all publications are solely those of the individual author(s) and contributor(s) and not of MDPI and/or the editor(s). MDPI and/or the editor(s) disclaim responsibility for any injury to people or property resulting from any ideas, methods, instructions or products referred to in the content. |
© 2024 by the authors. Licensee MDPI, Basel, Switzerland. This article is an open access article distributed under the terms and conditions of the Creative Commons Attribution (CC BY) license (http://creativecommons.org/licenses/by/4.0/).
