Submitted:
21 August 2024
Posted:
21 August 2024
You are already at the latest version
Abstract
Keywords:
1. Introduction
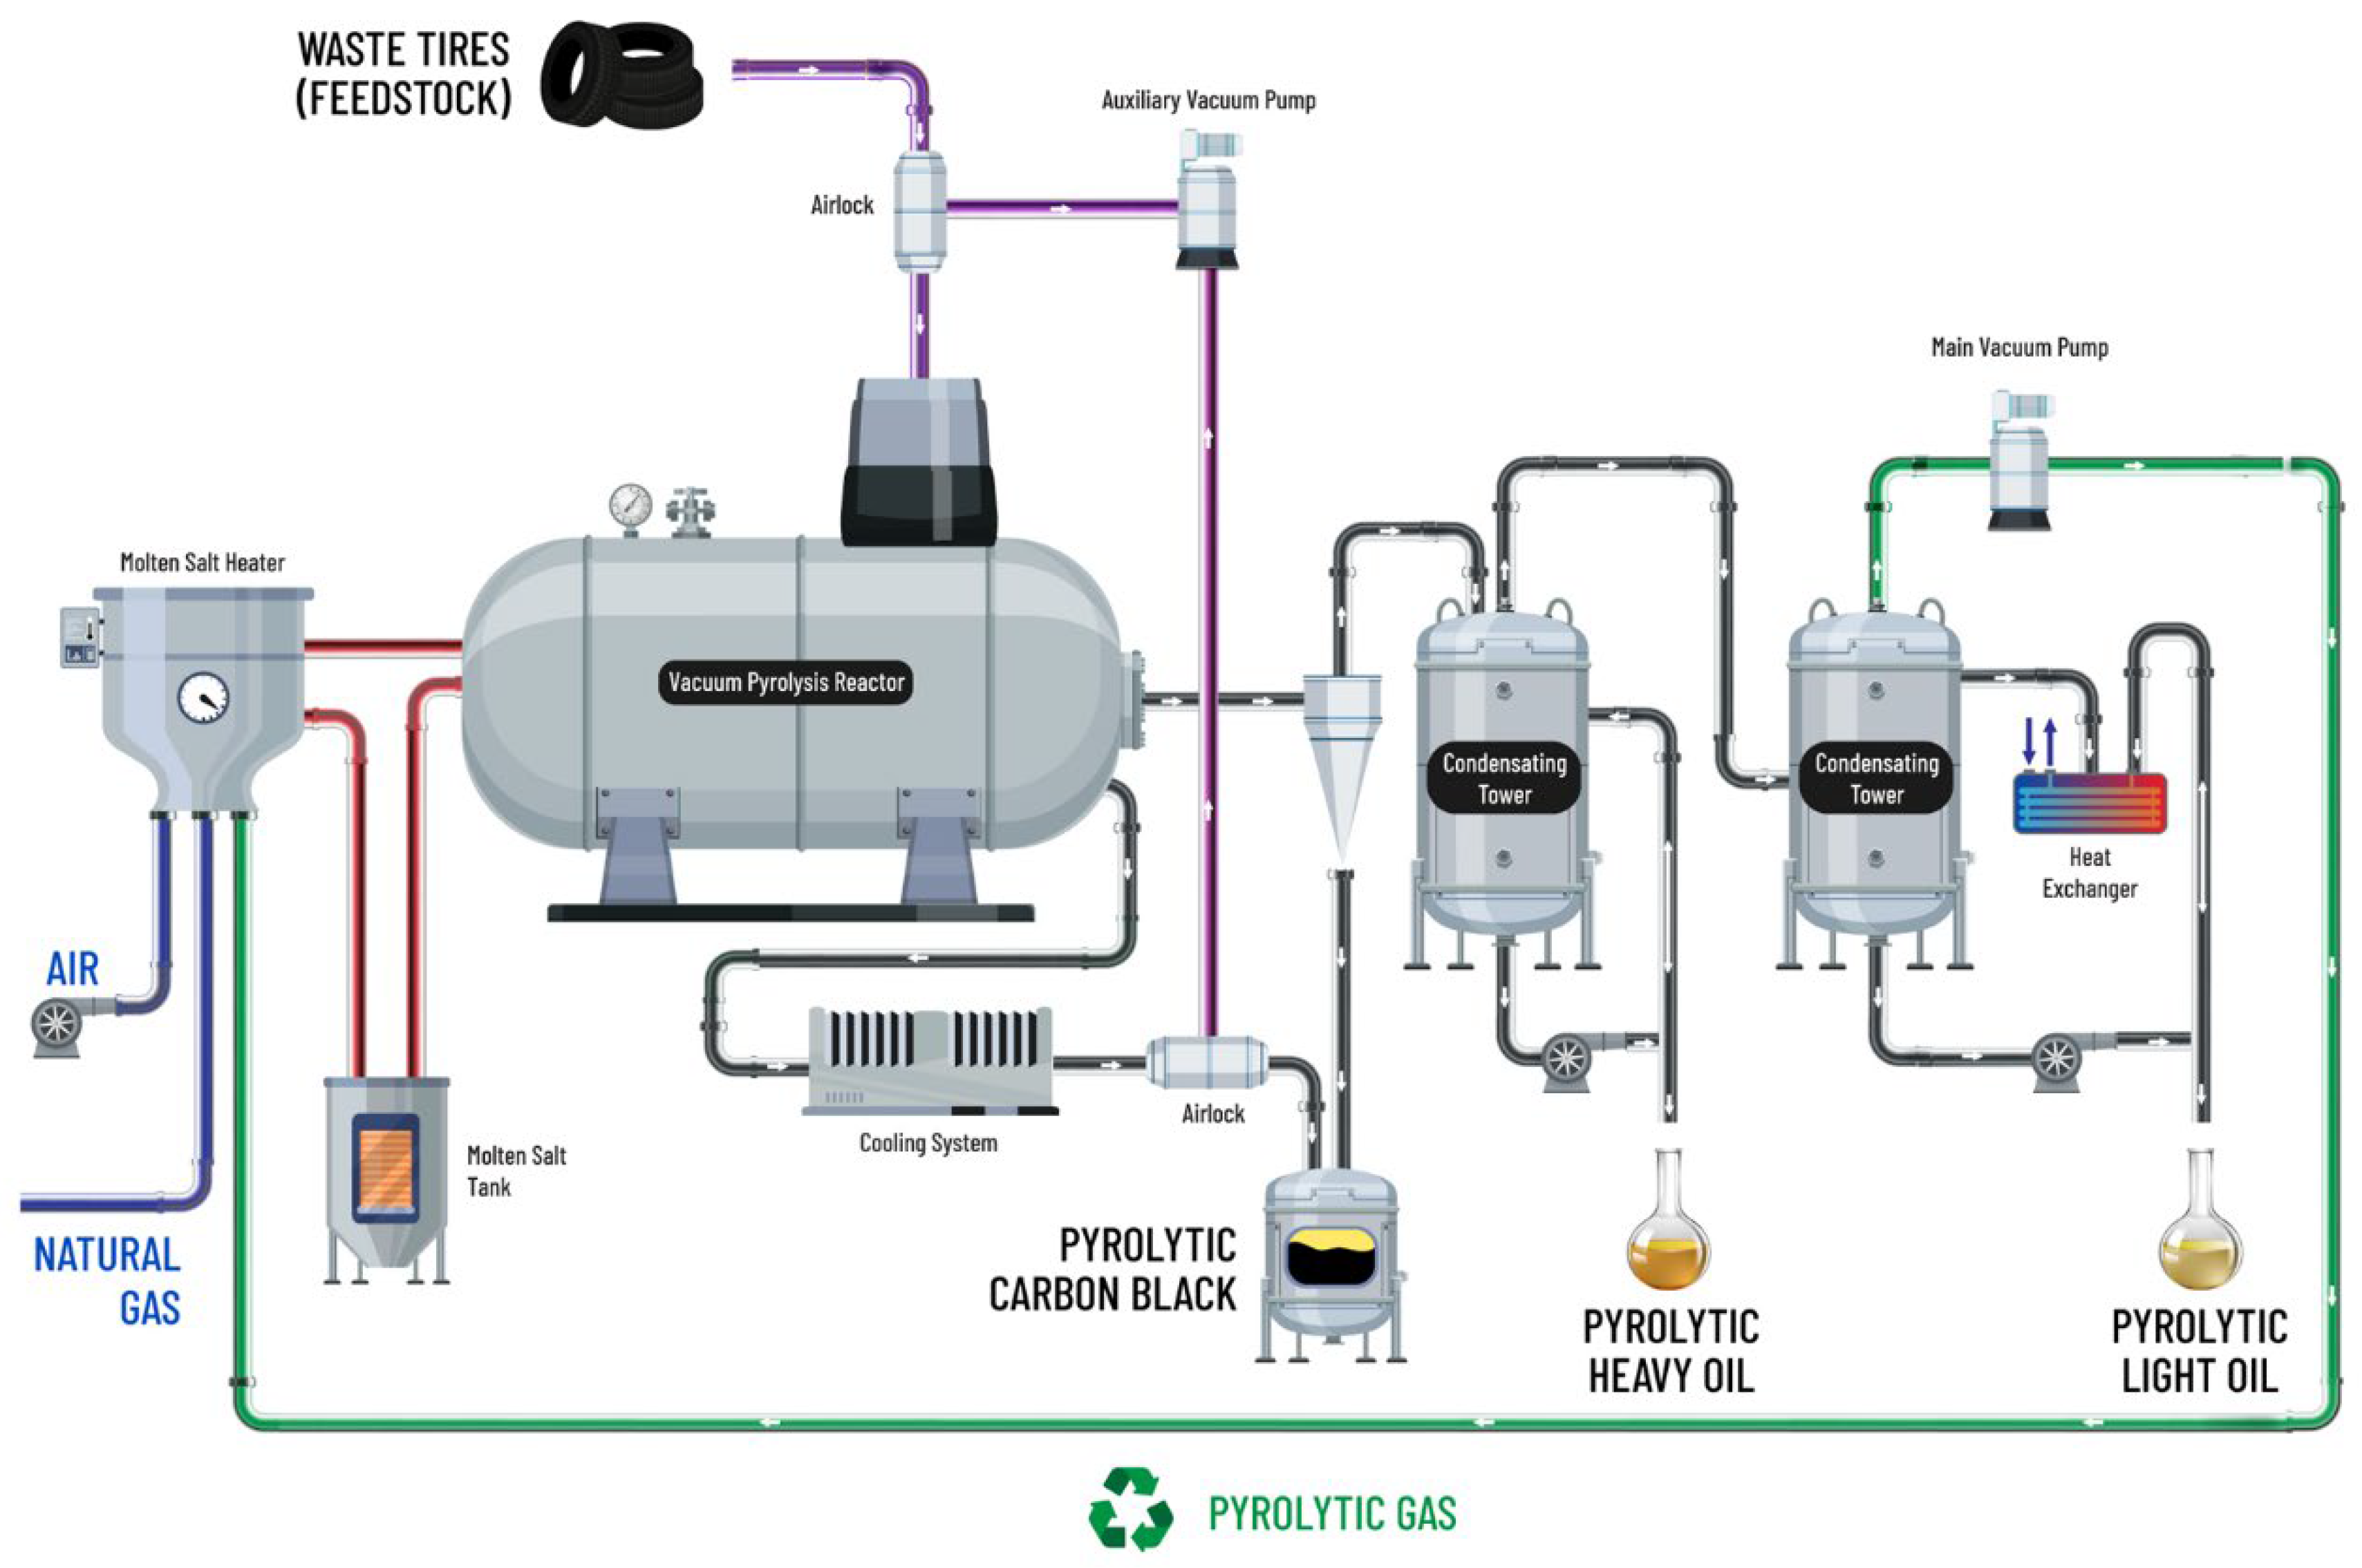
2. Experimental
2.1. Materials
2.2. Sample Preparation
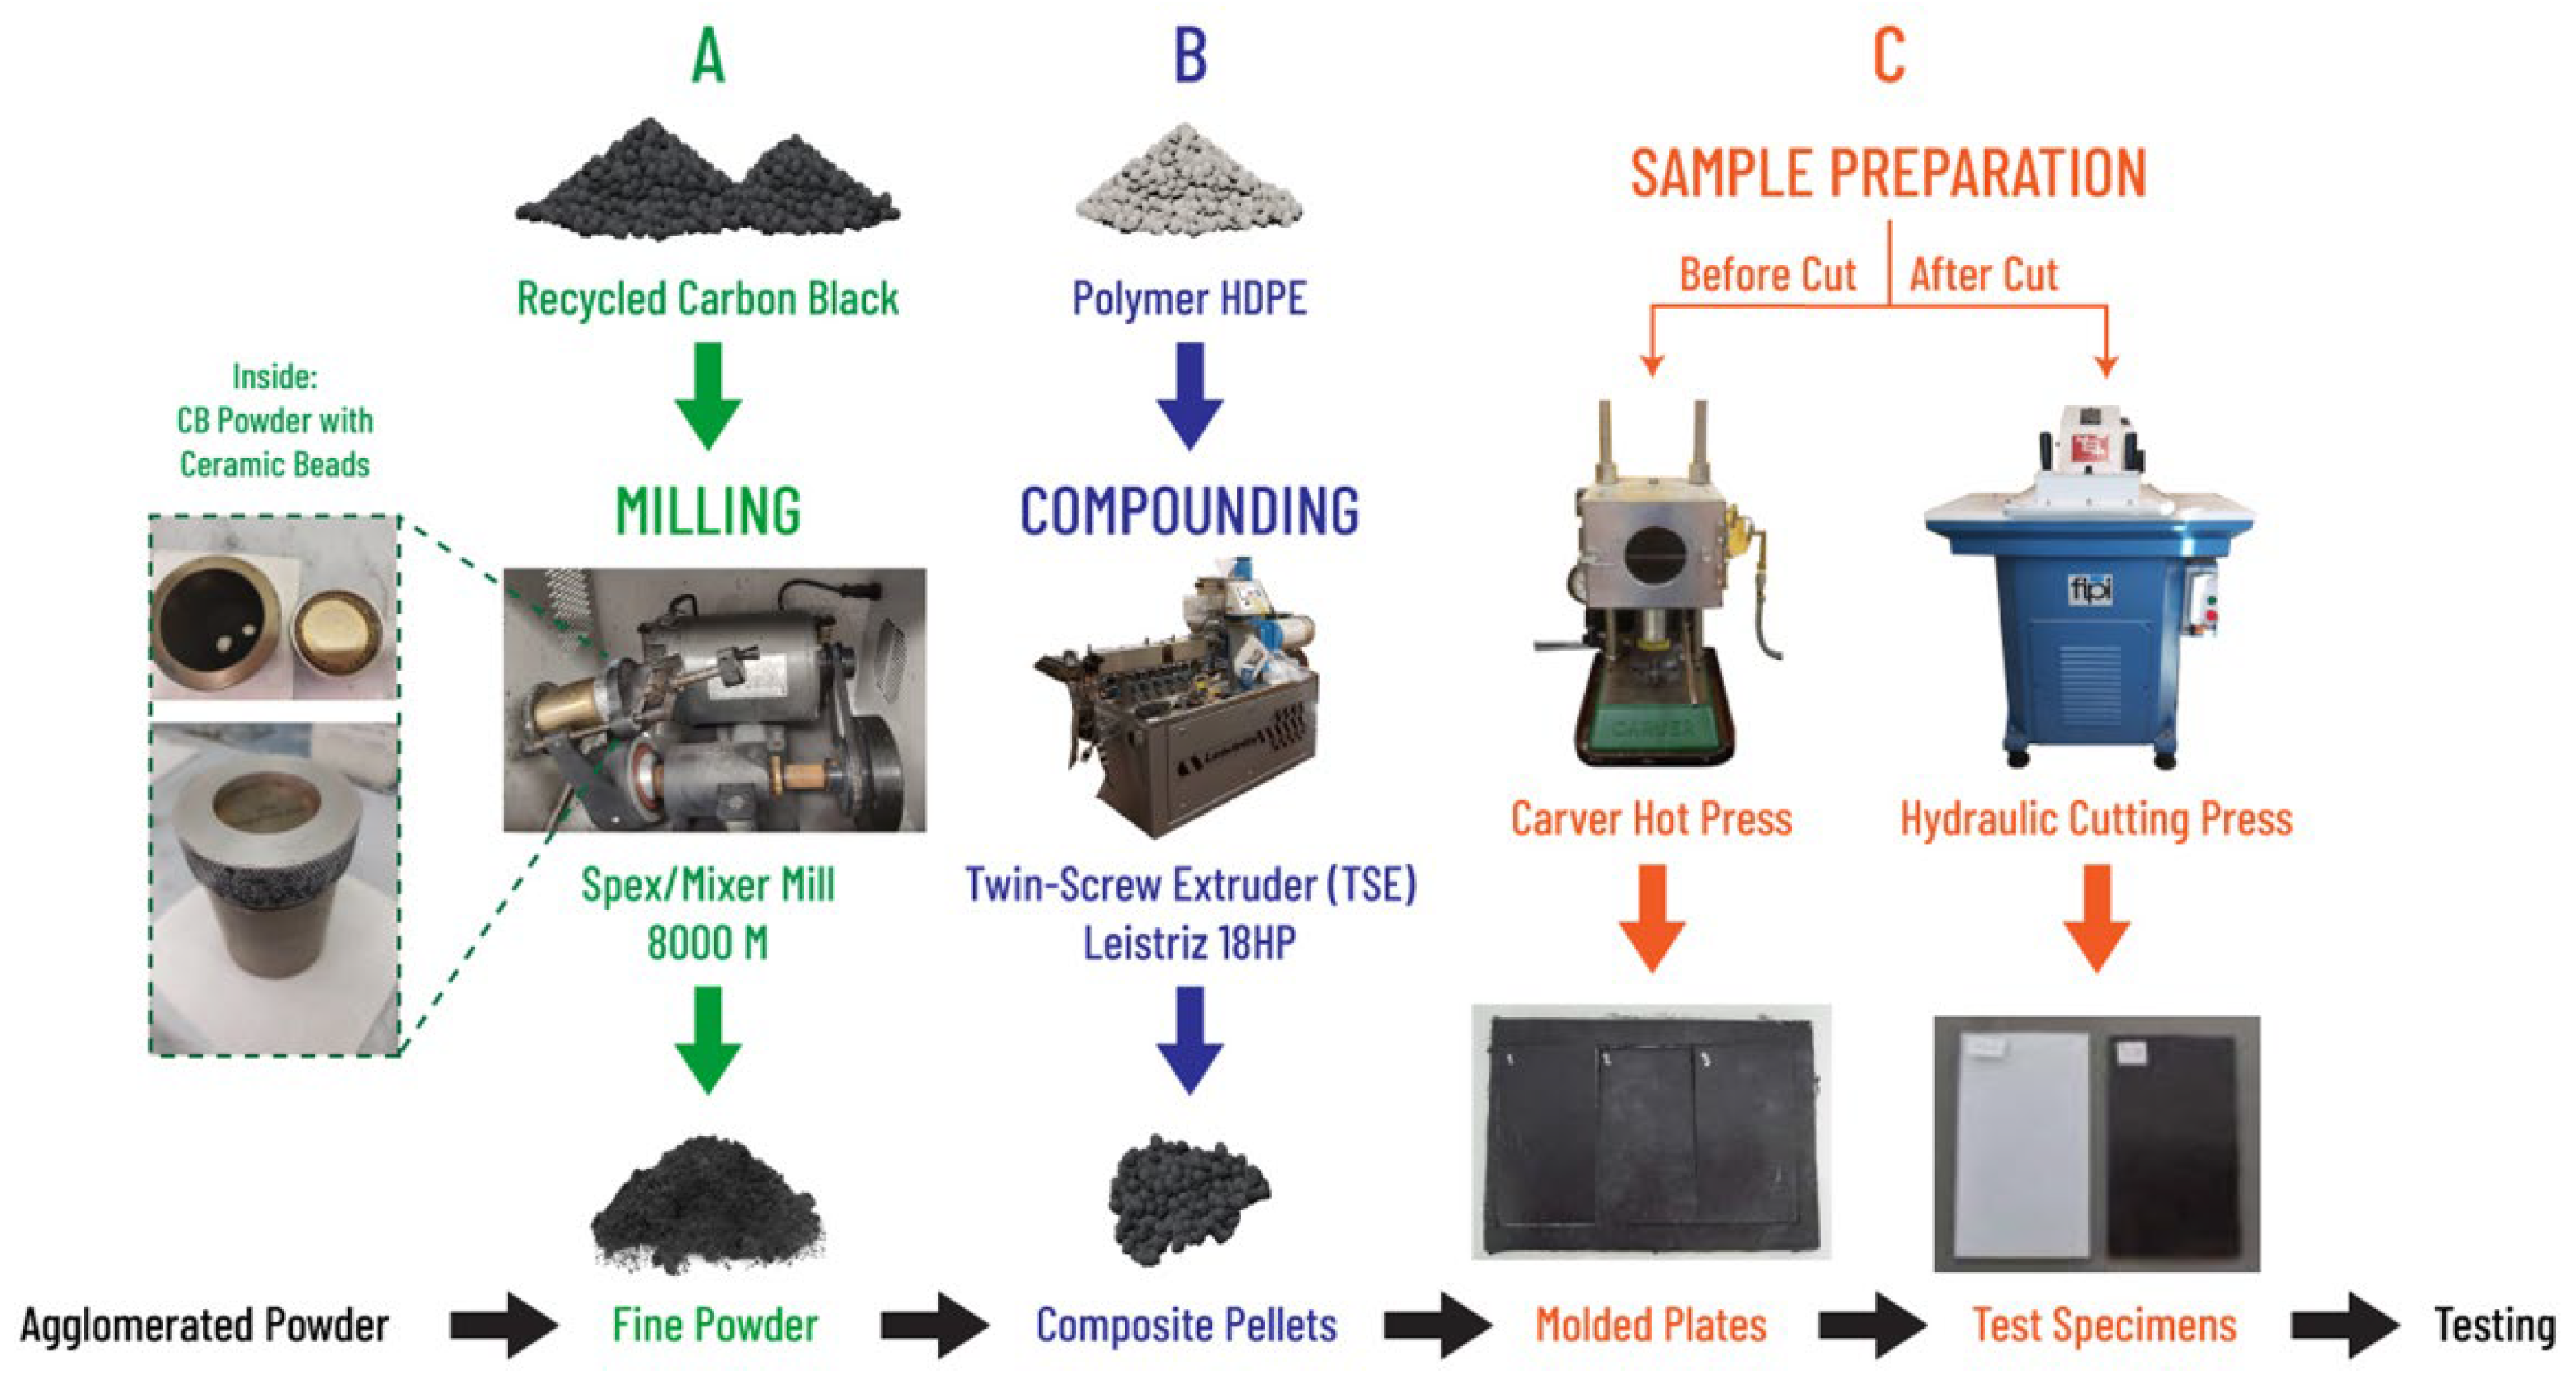

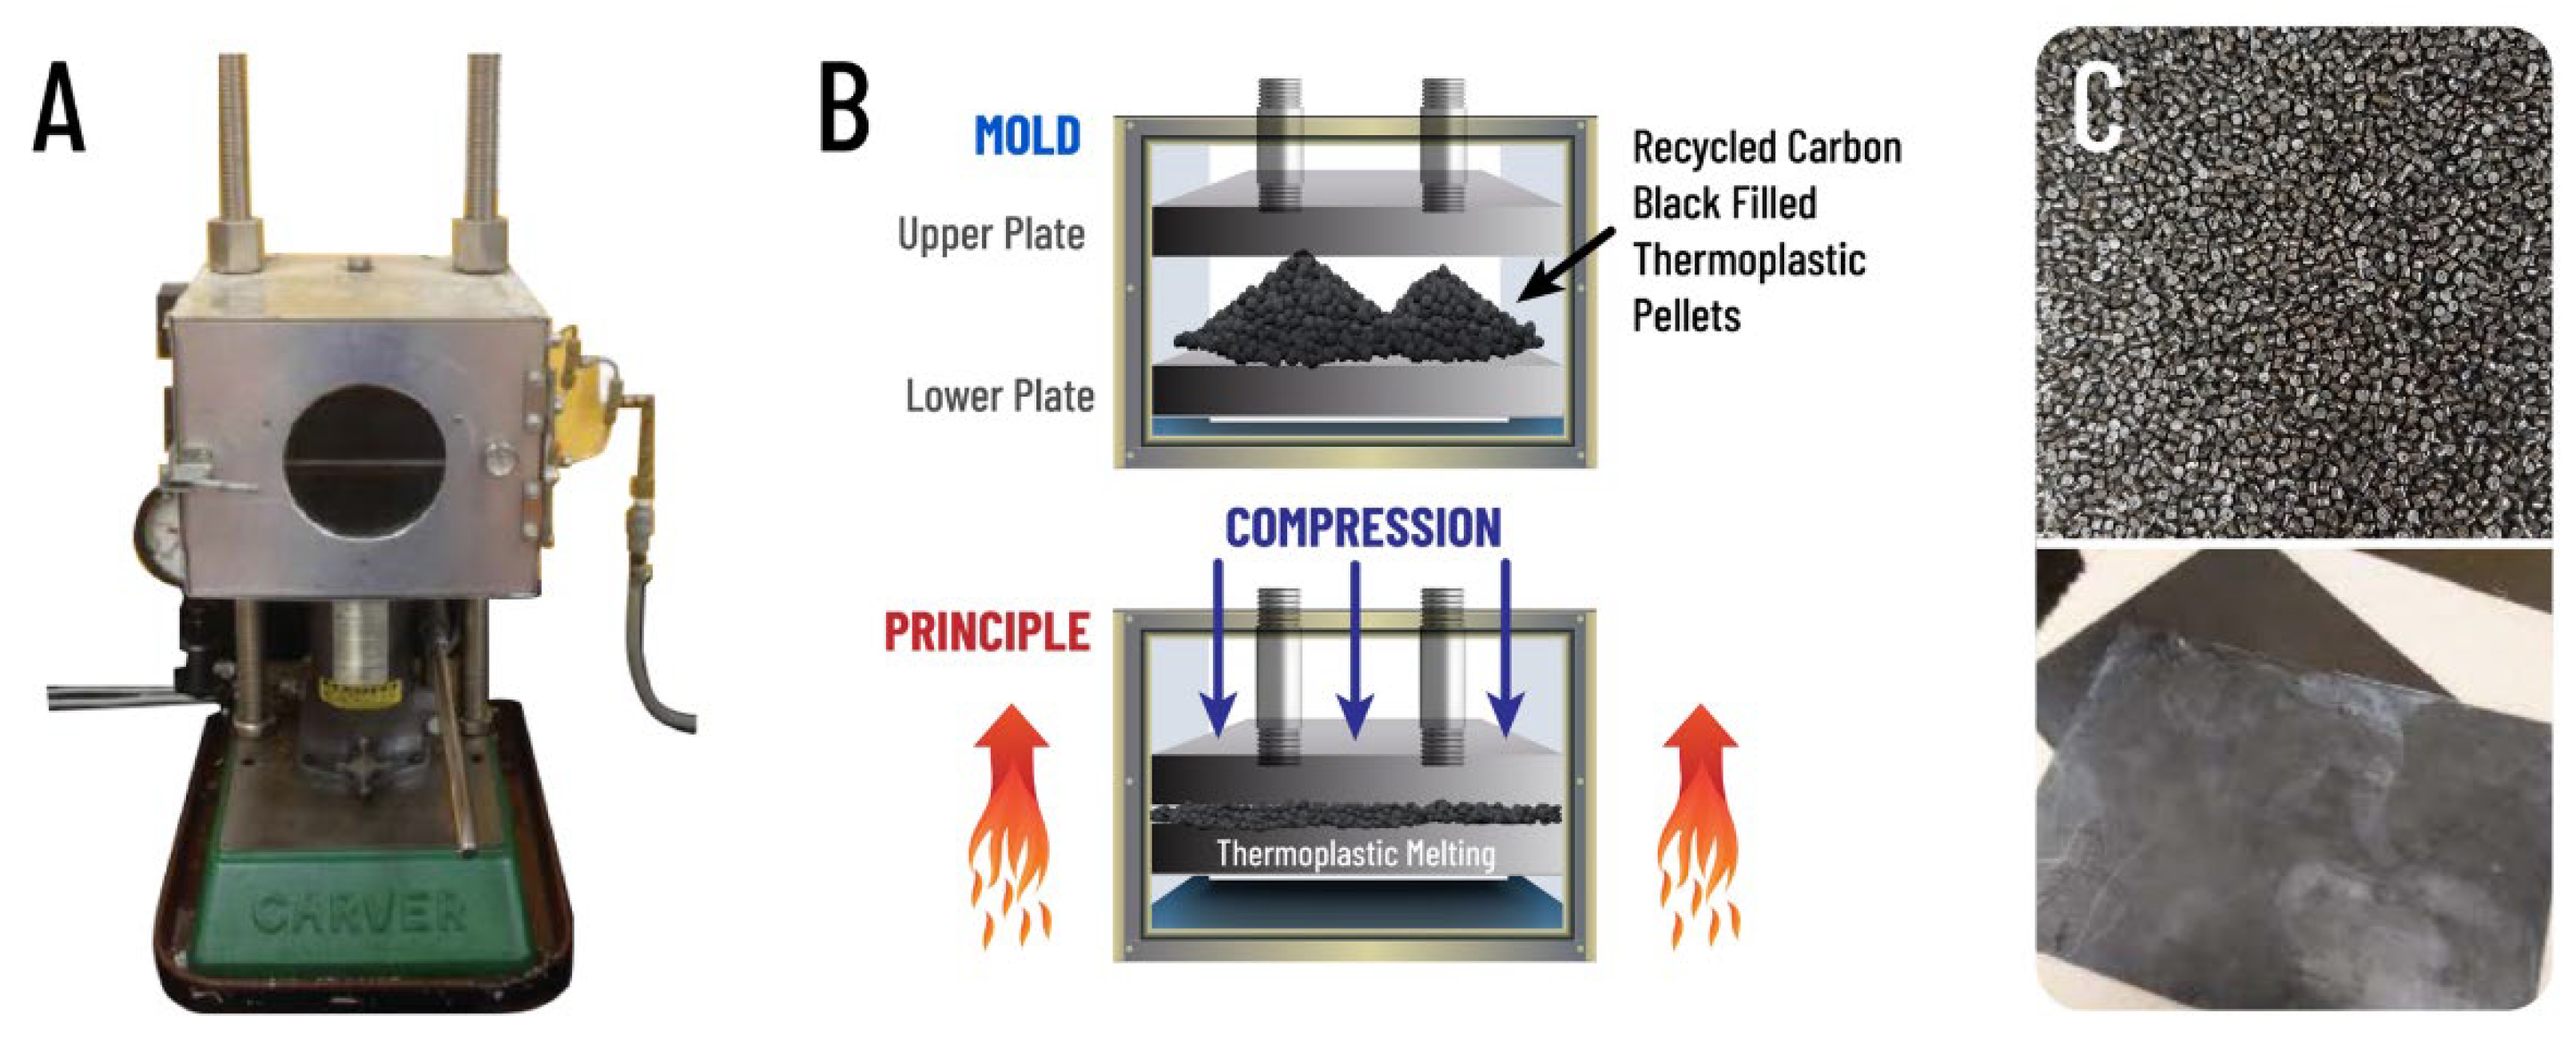
2.3. Sample Aging
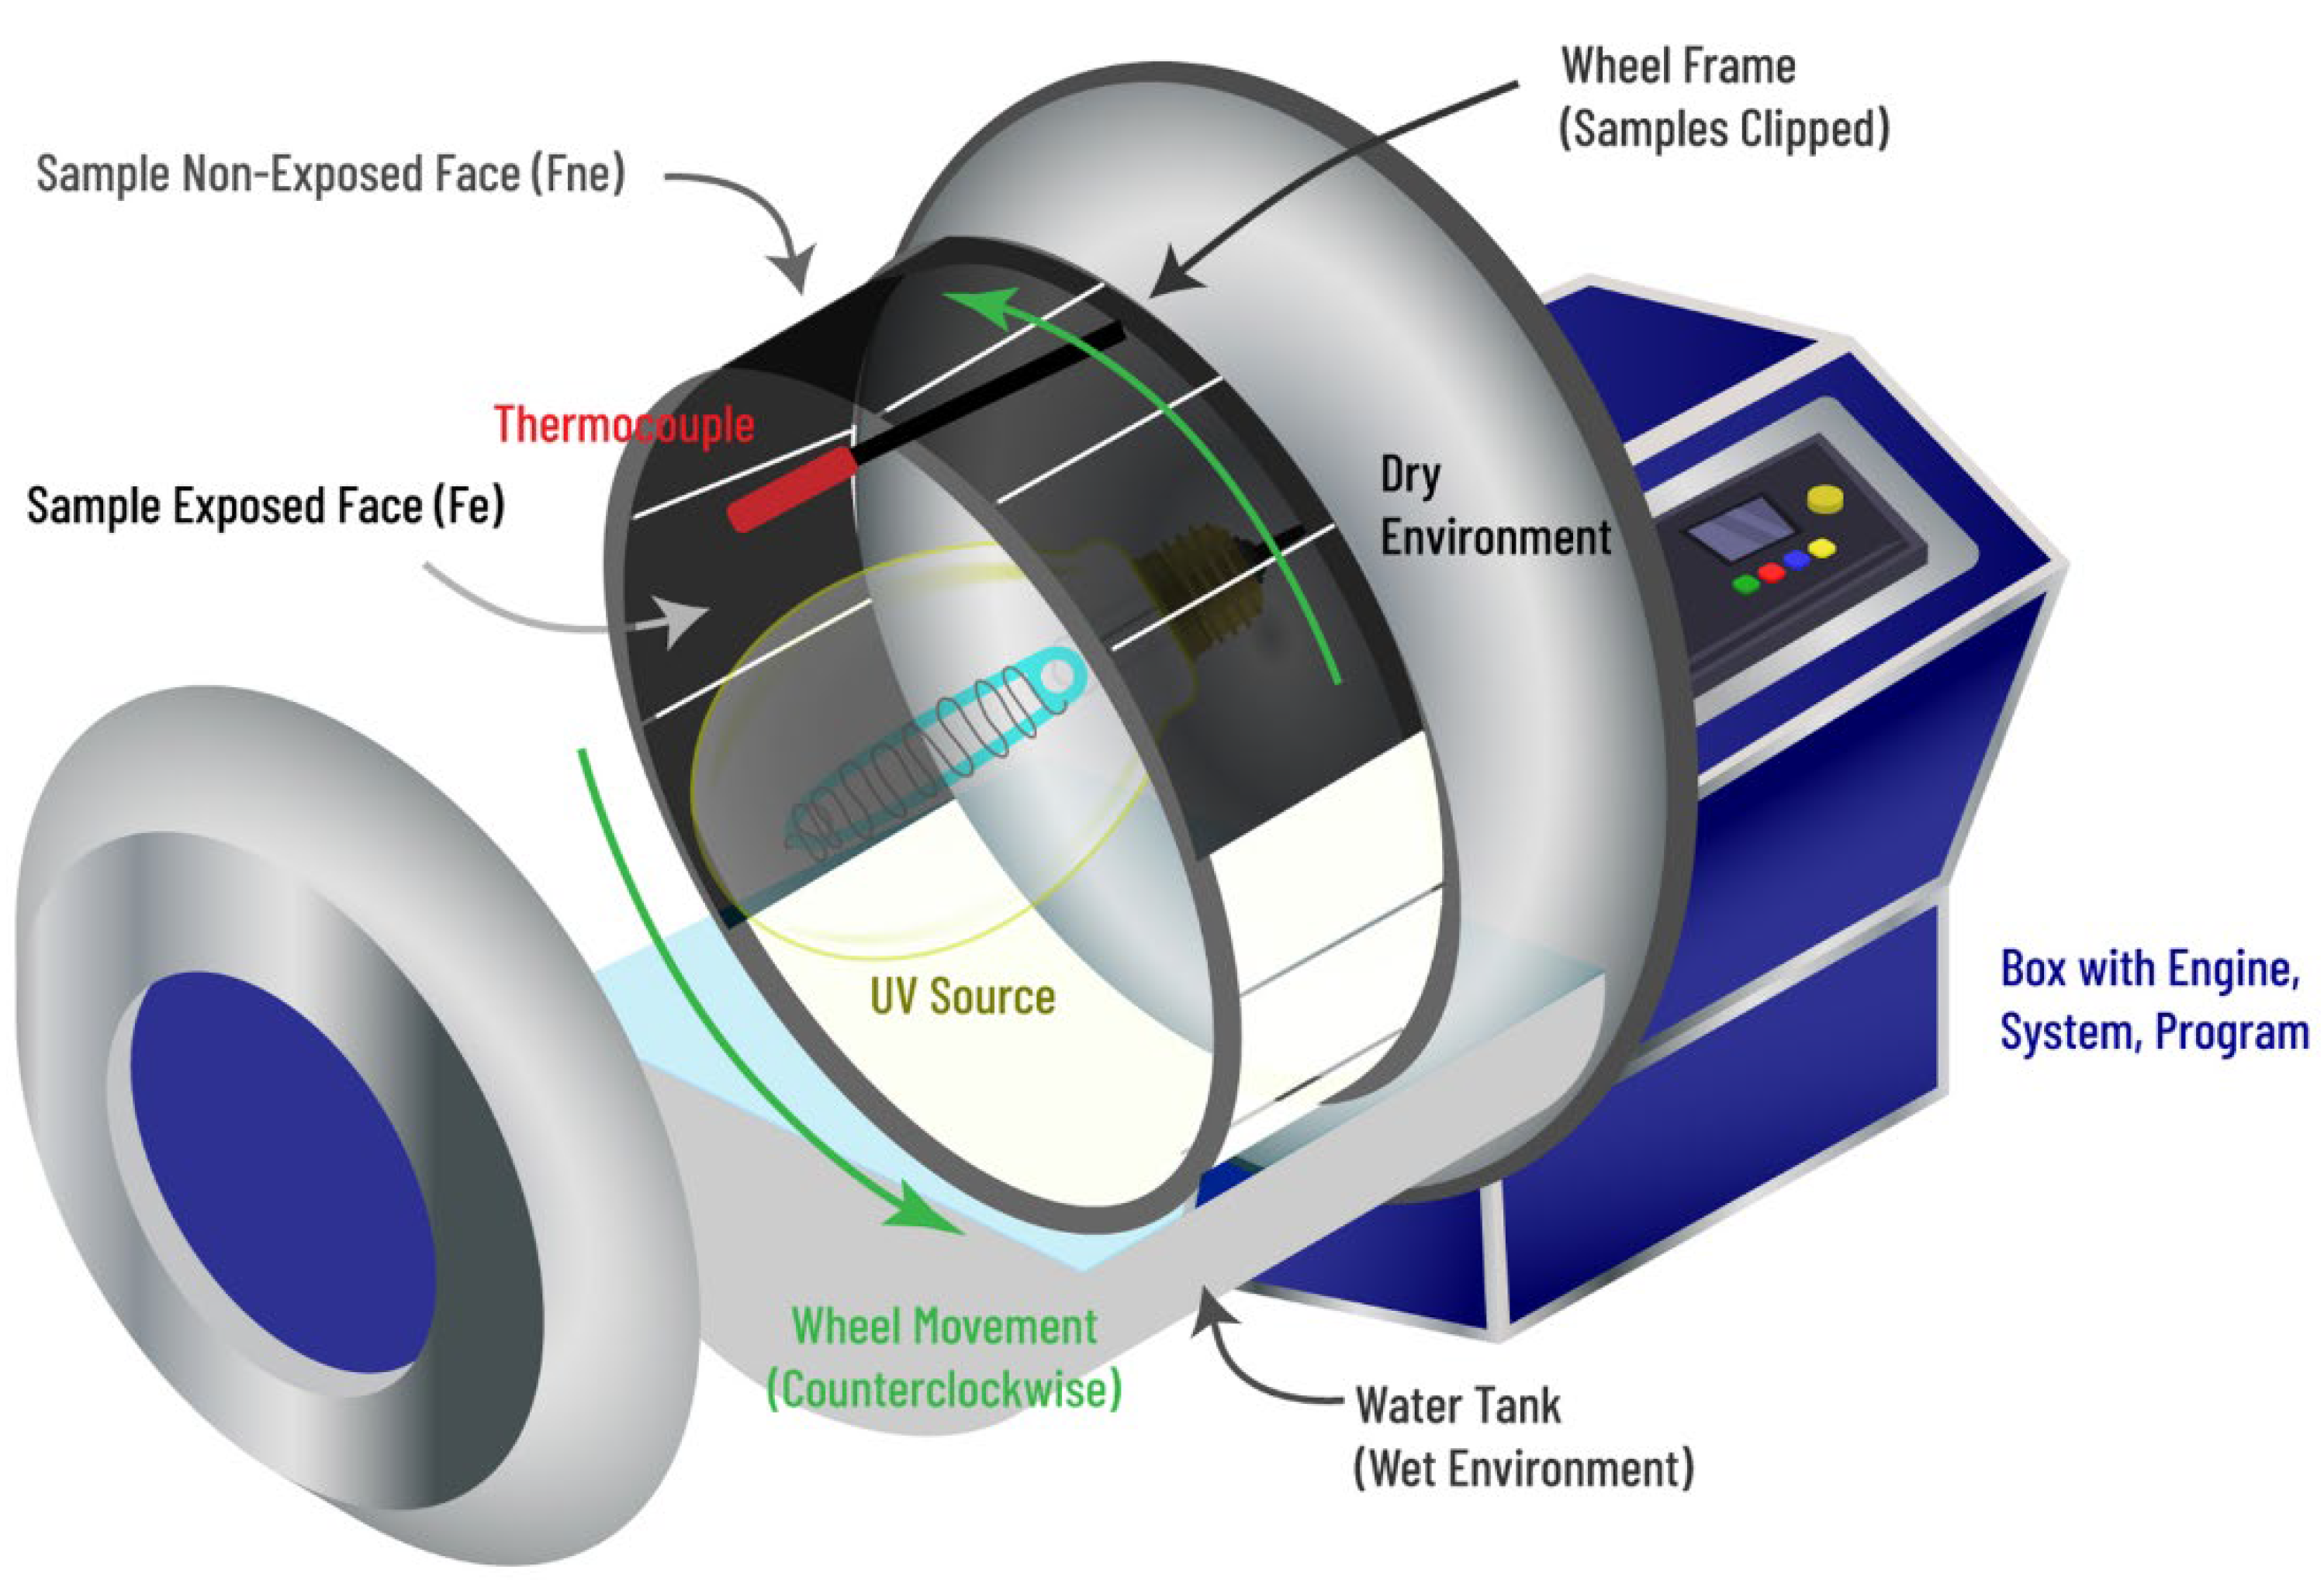
2.4. Sample Analyses
3. Results and Discussion
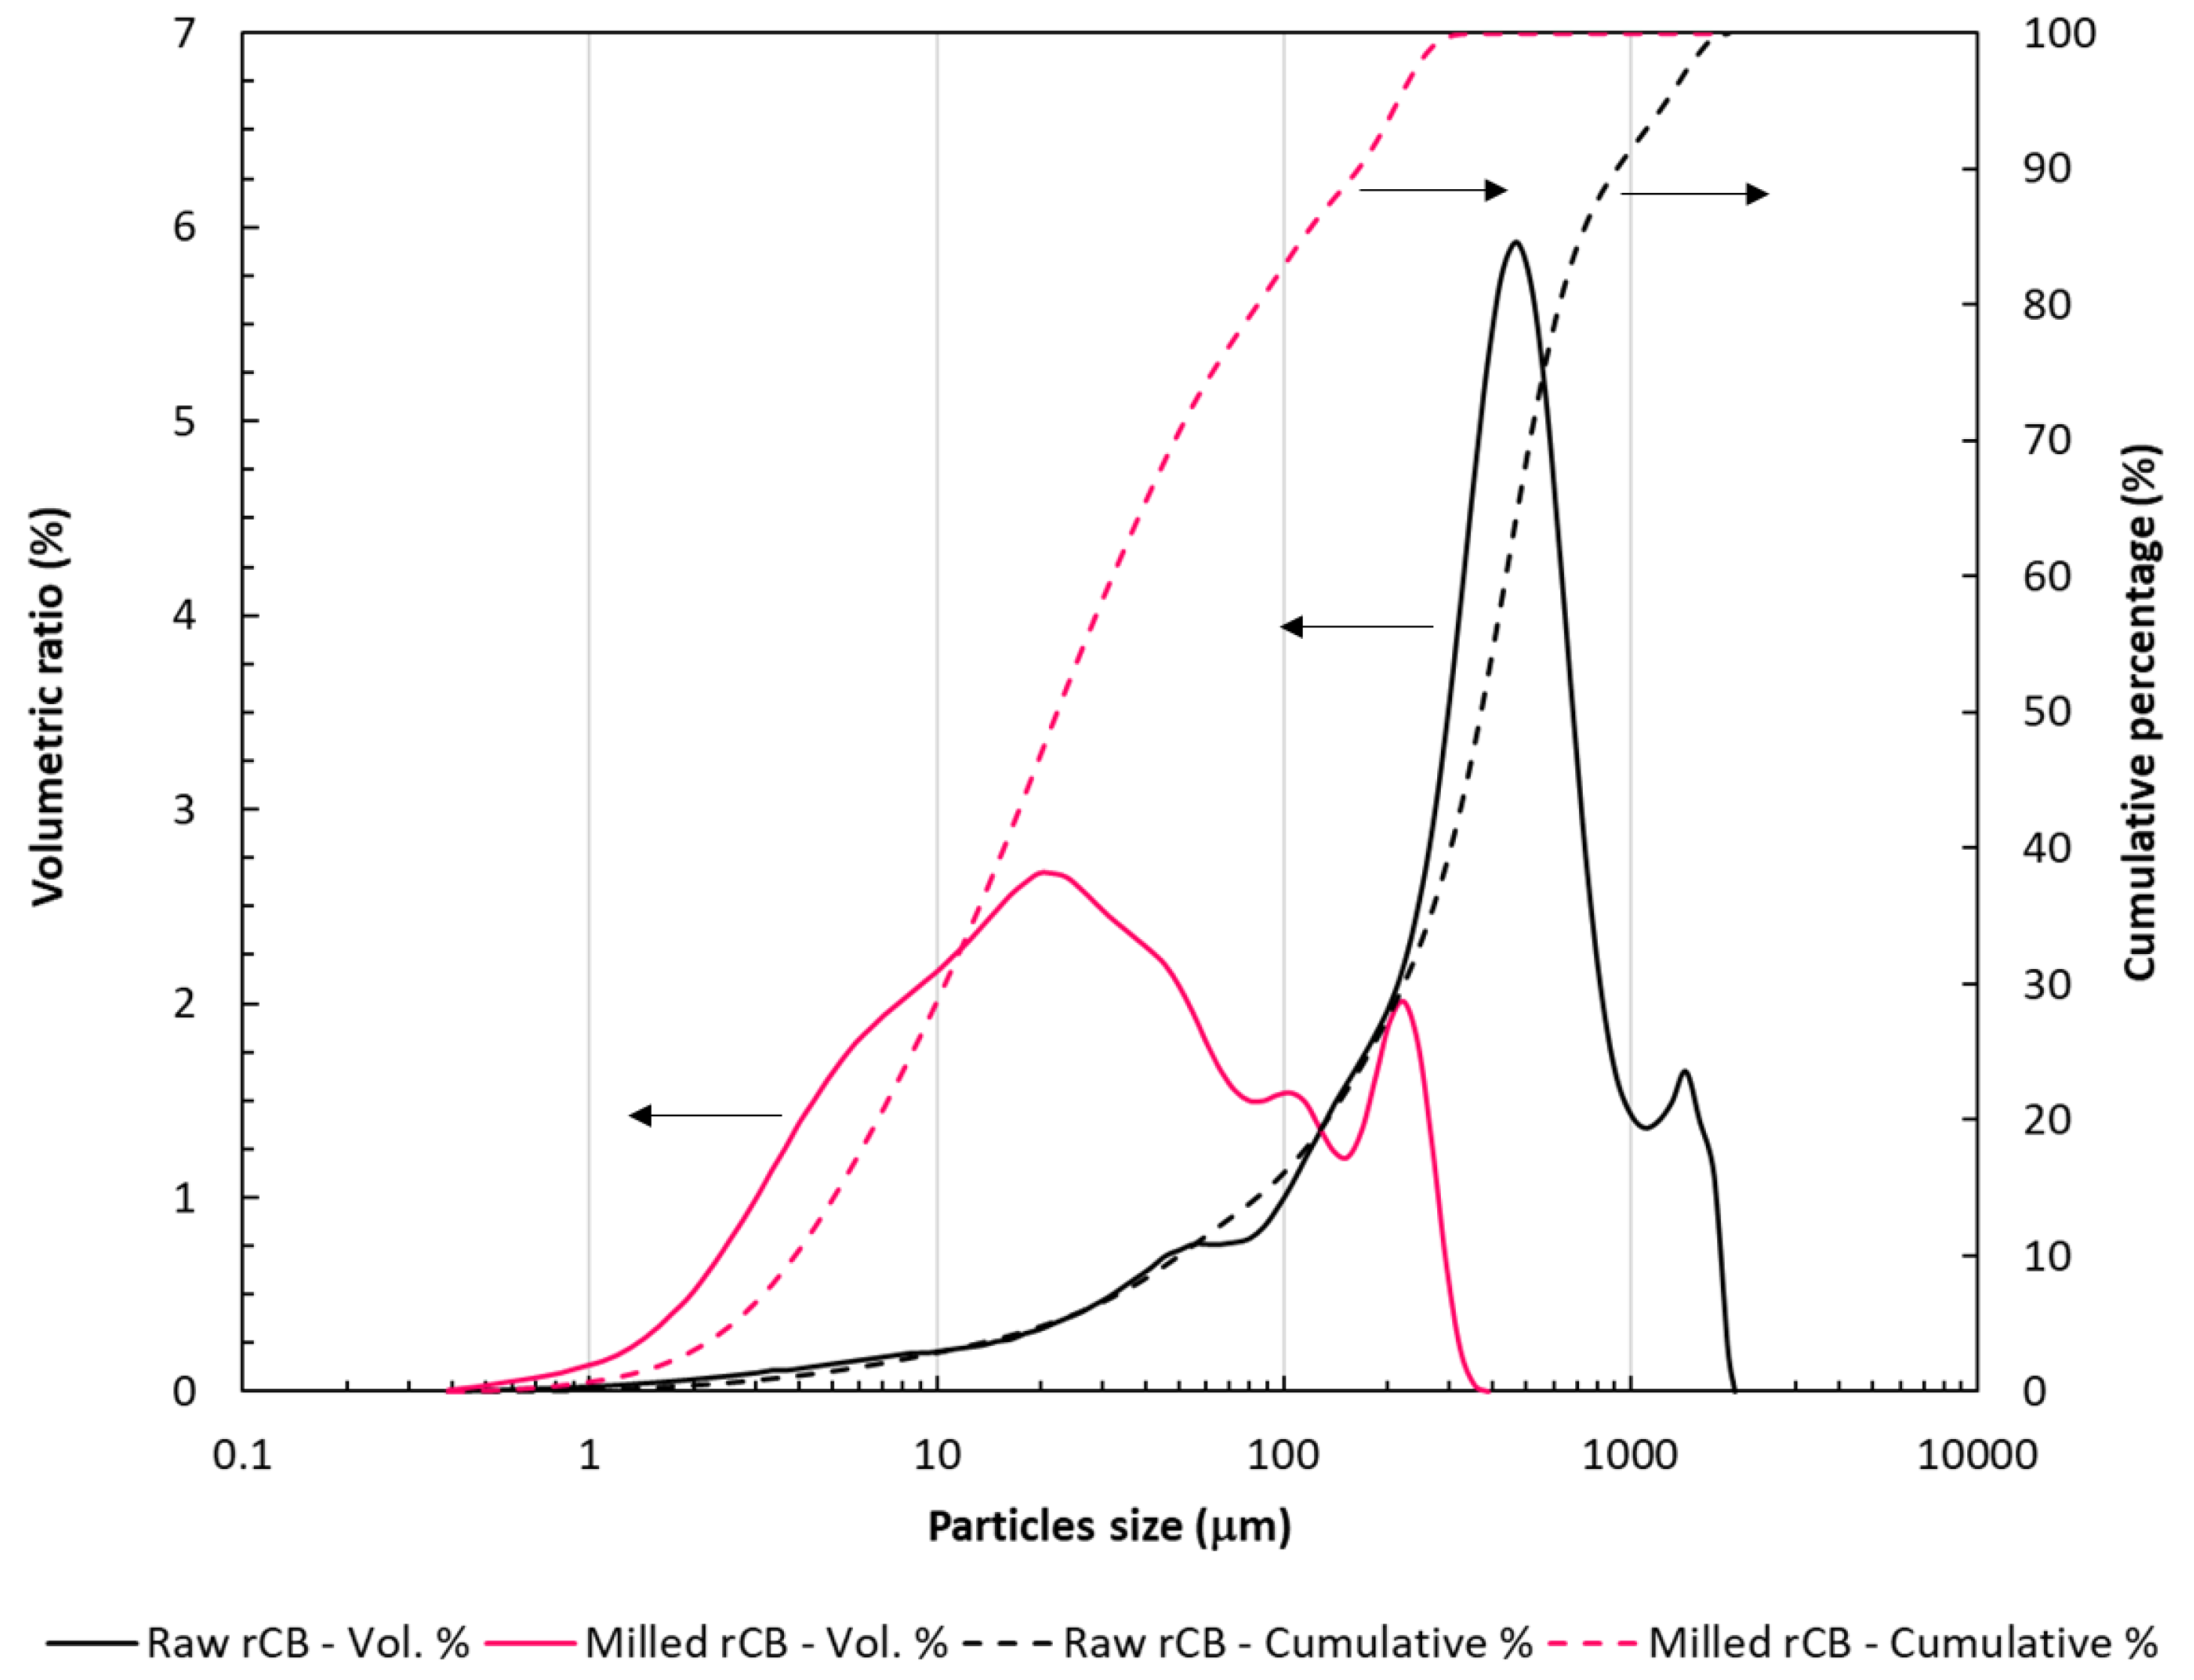
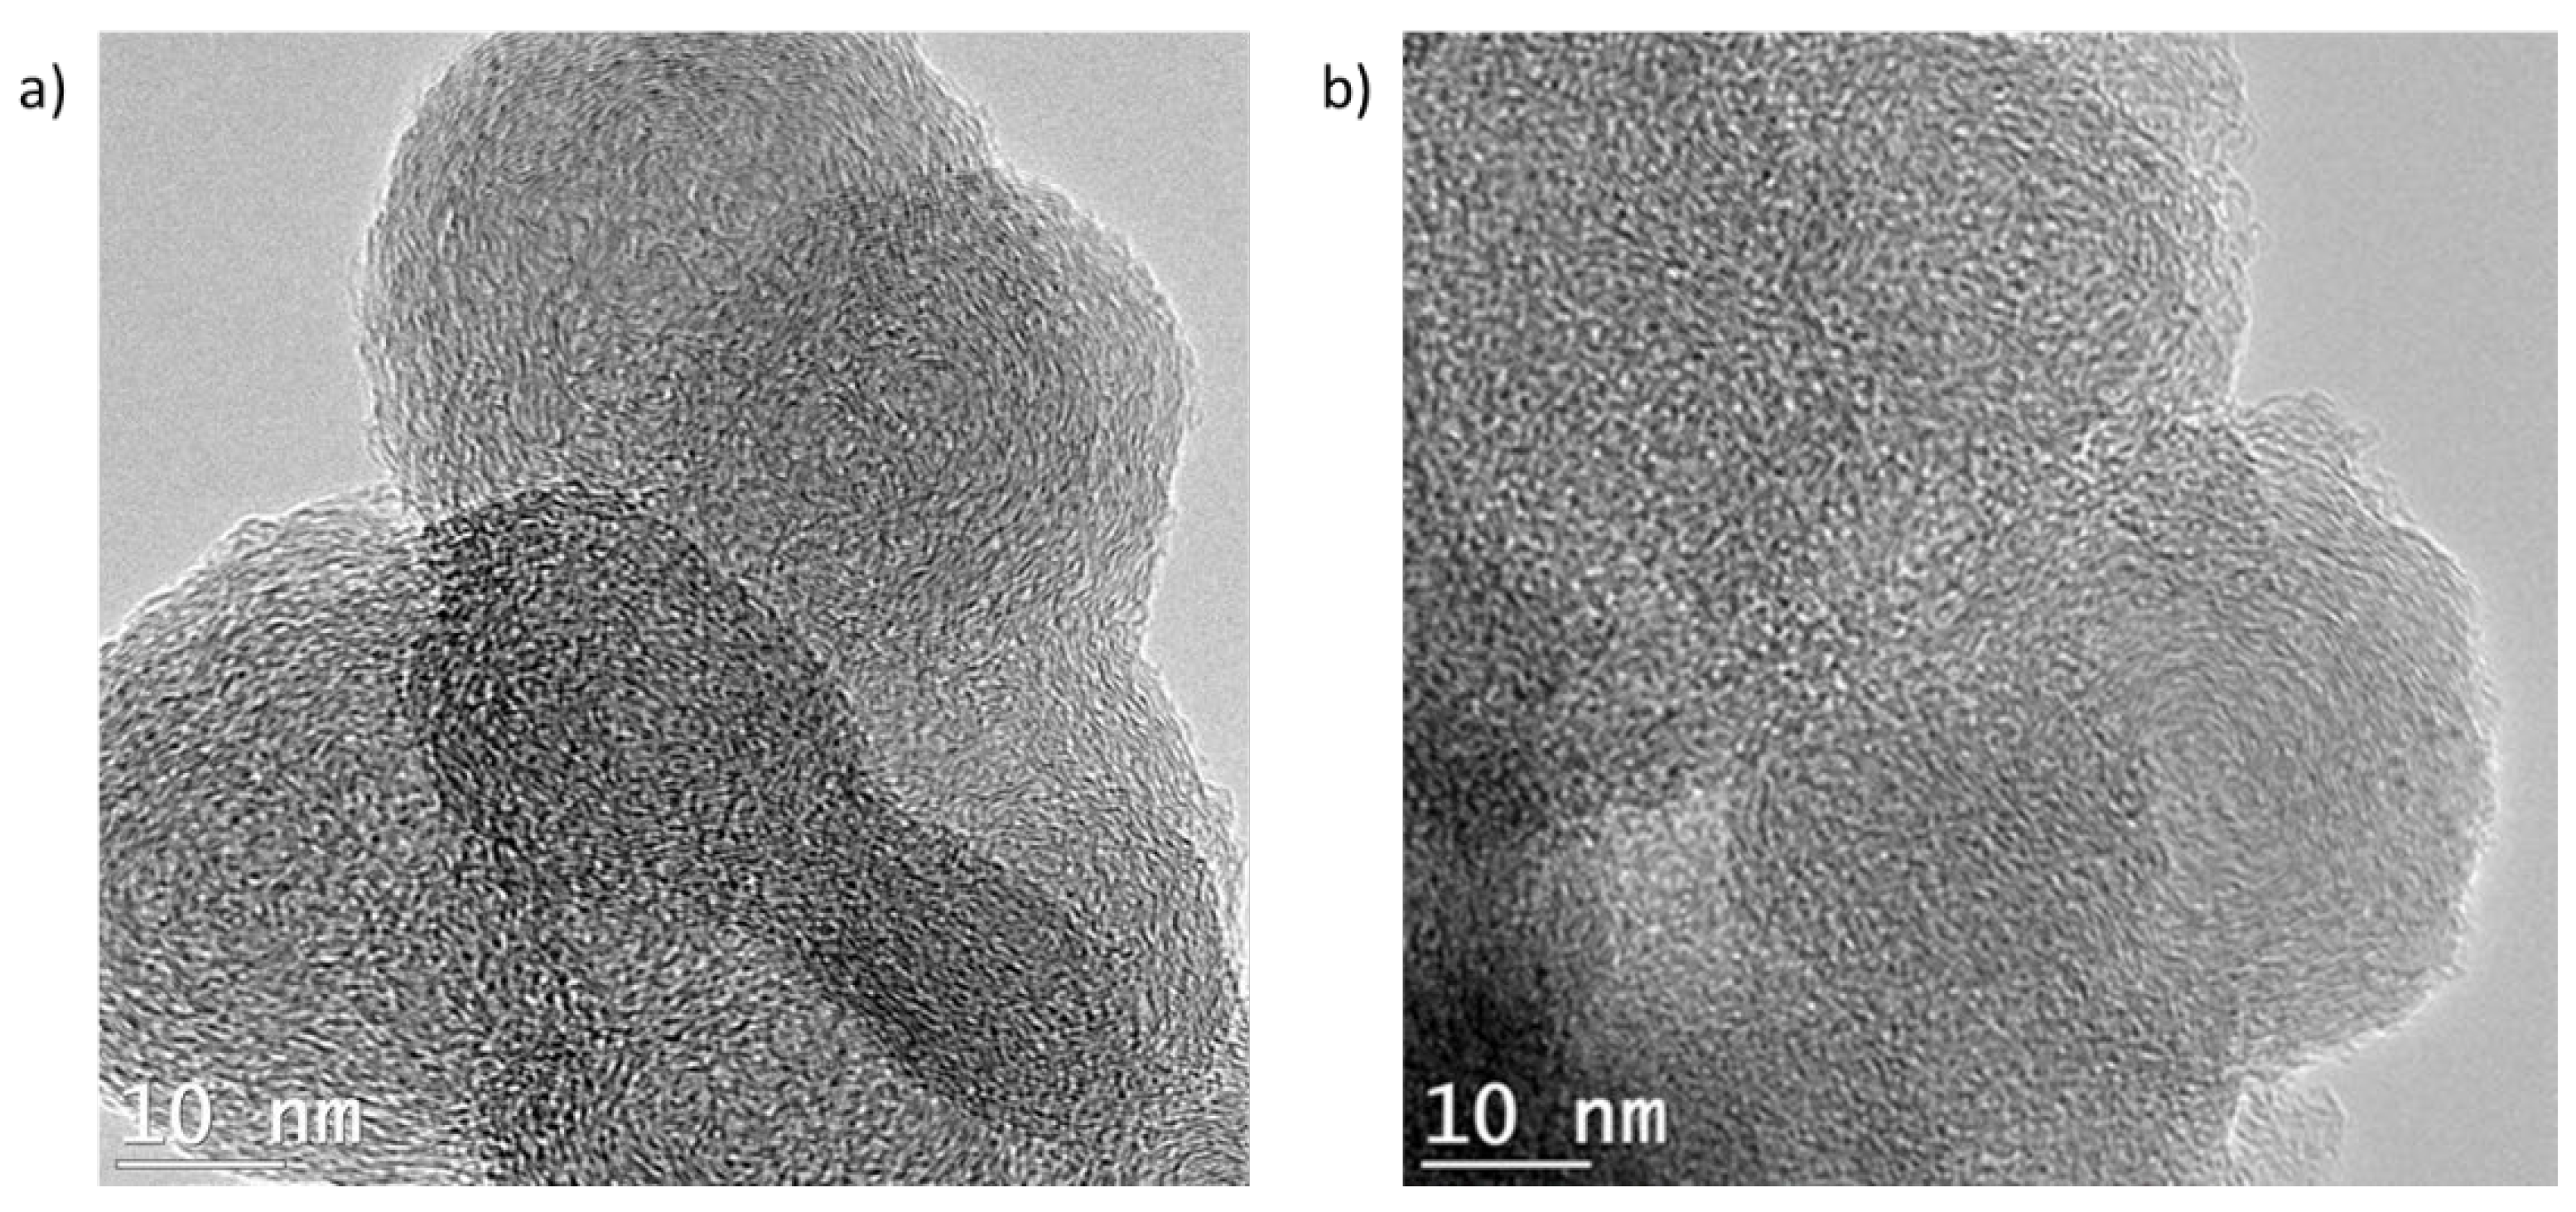
3.1. Carbon Black Analyses

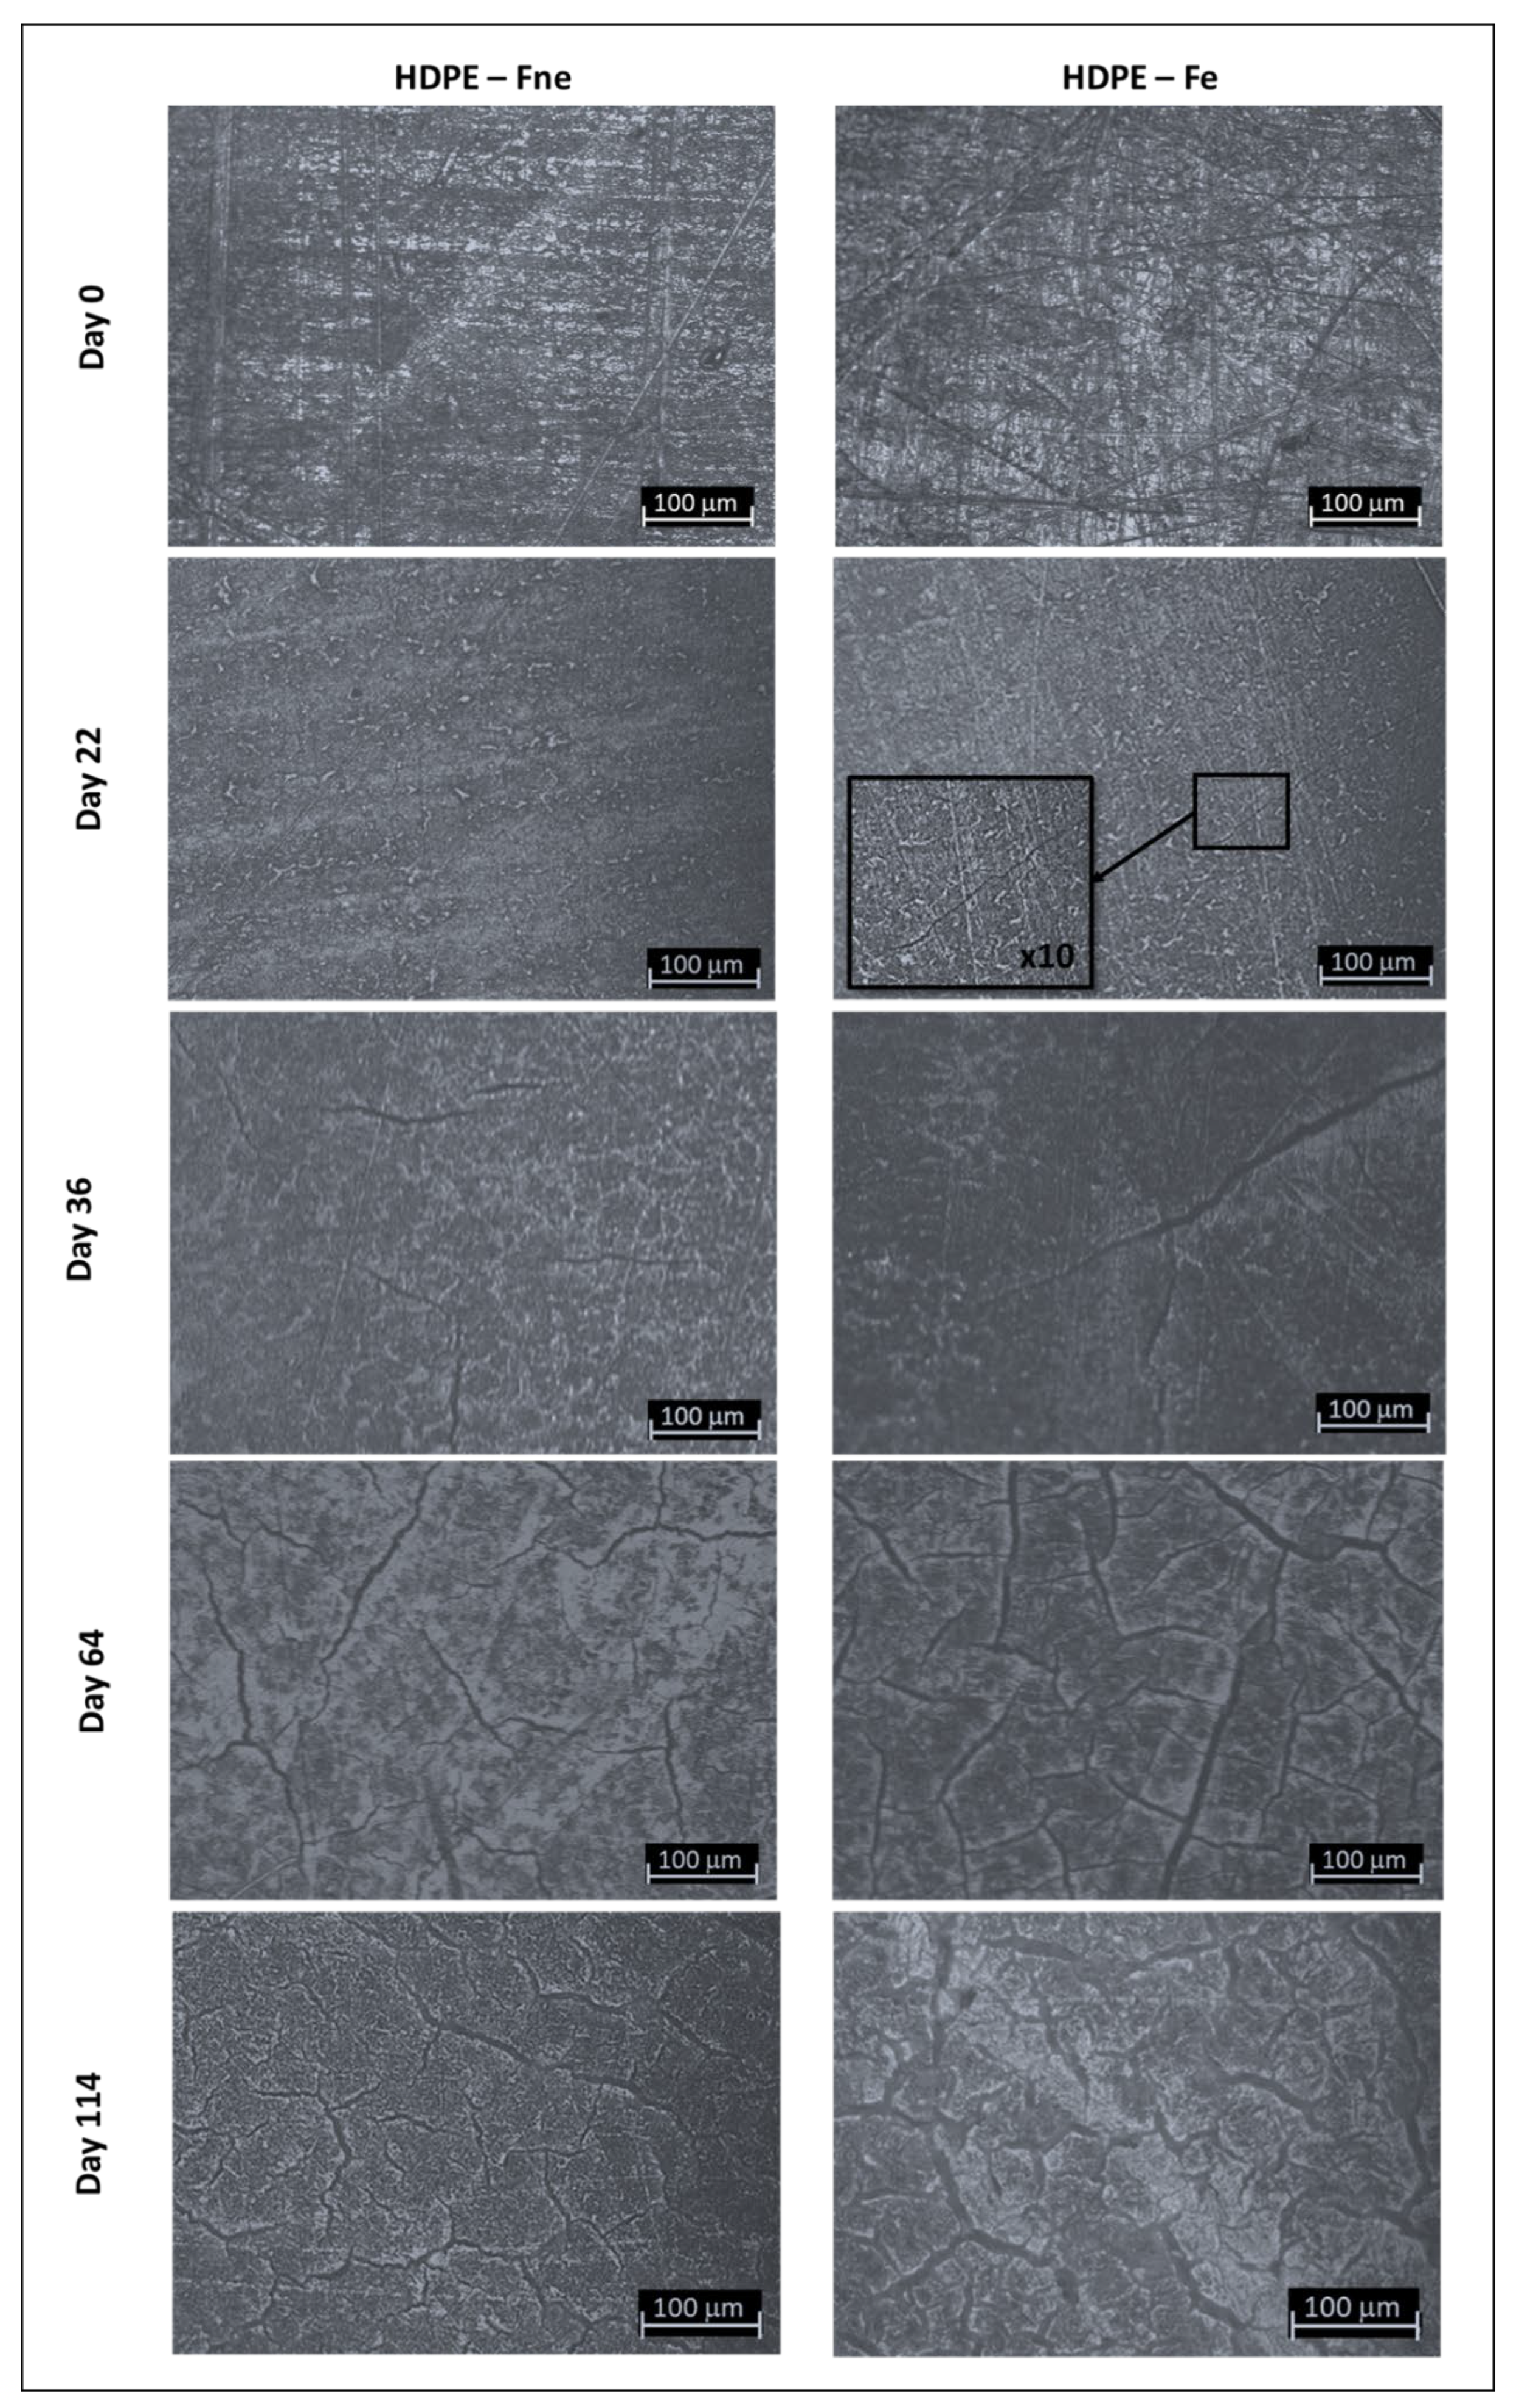
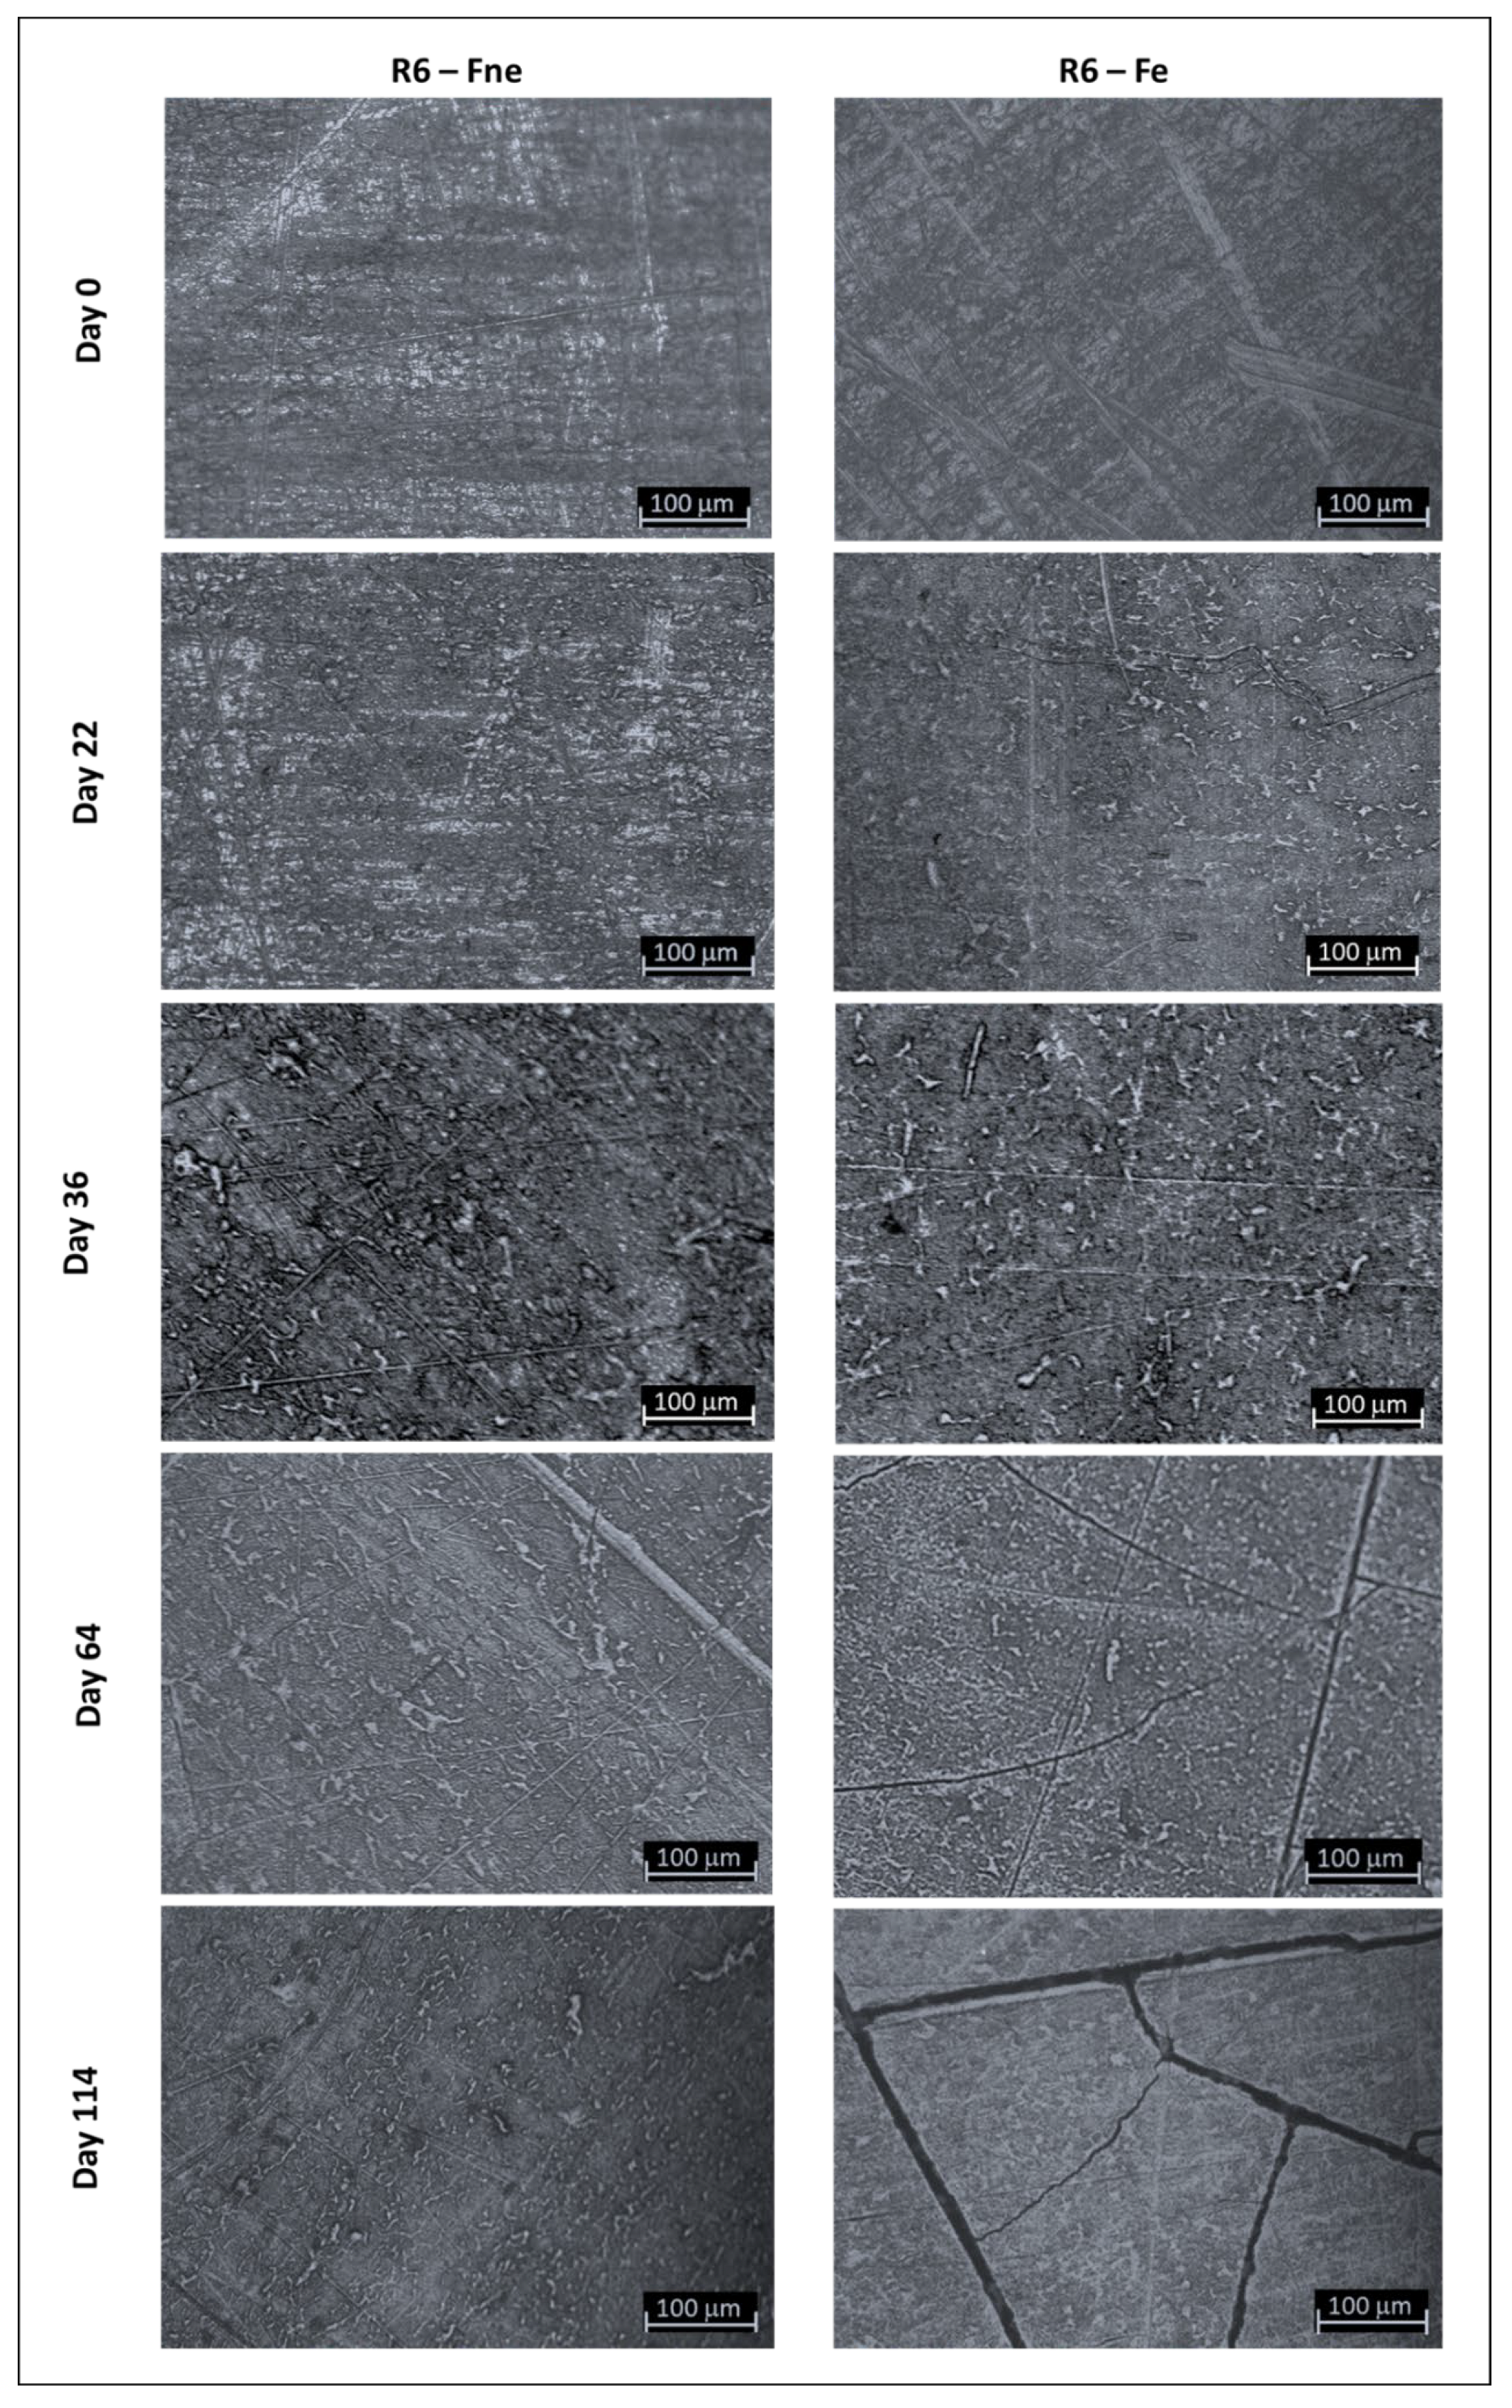
3.2. Evolution of Sample Topography with Ageing
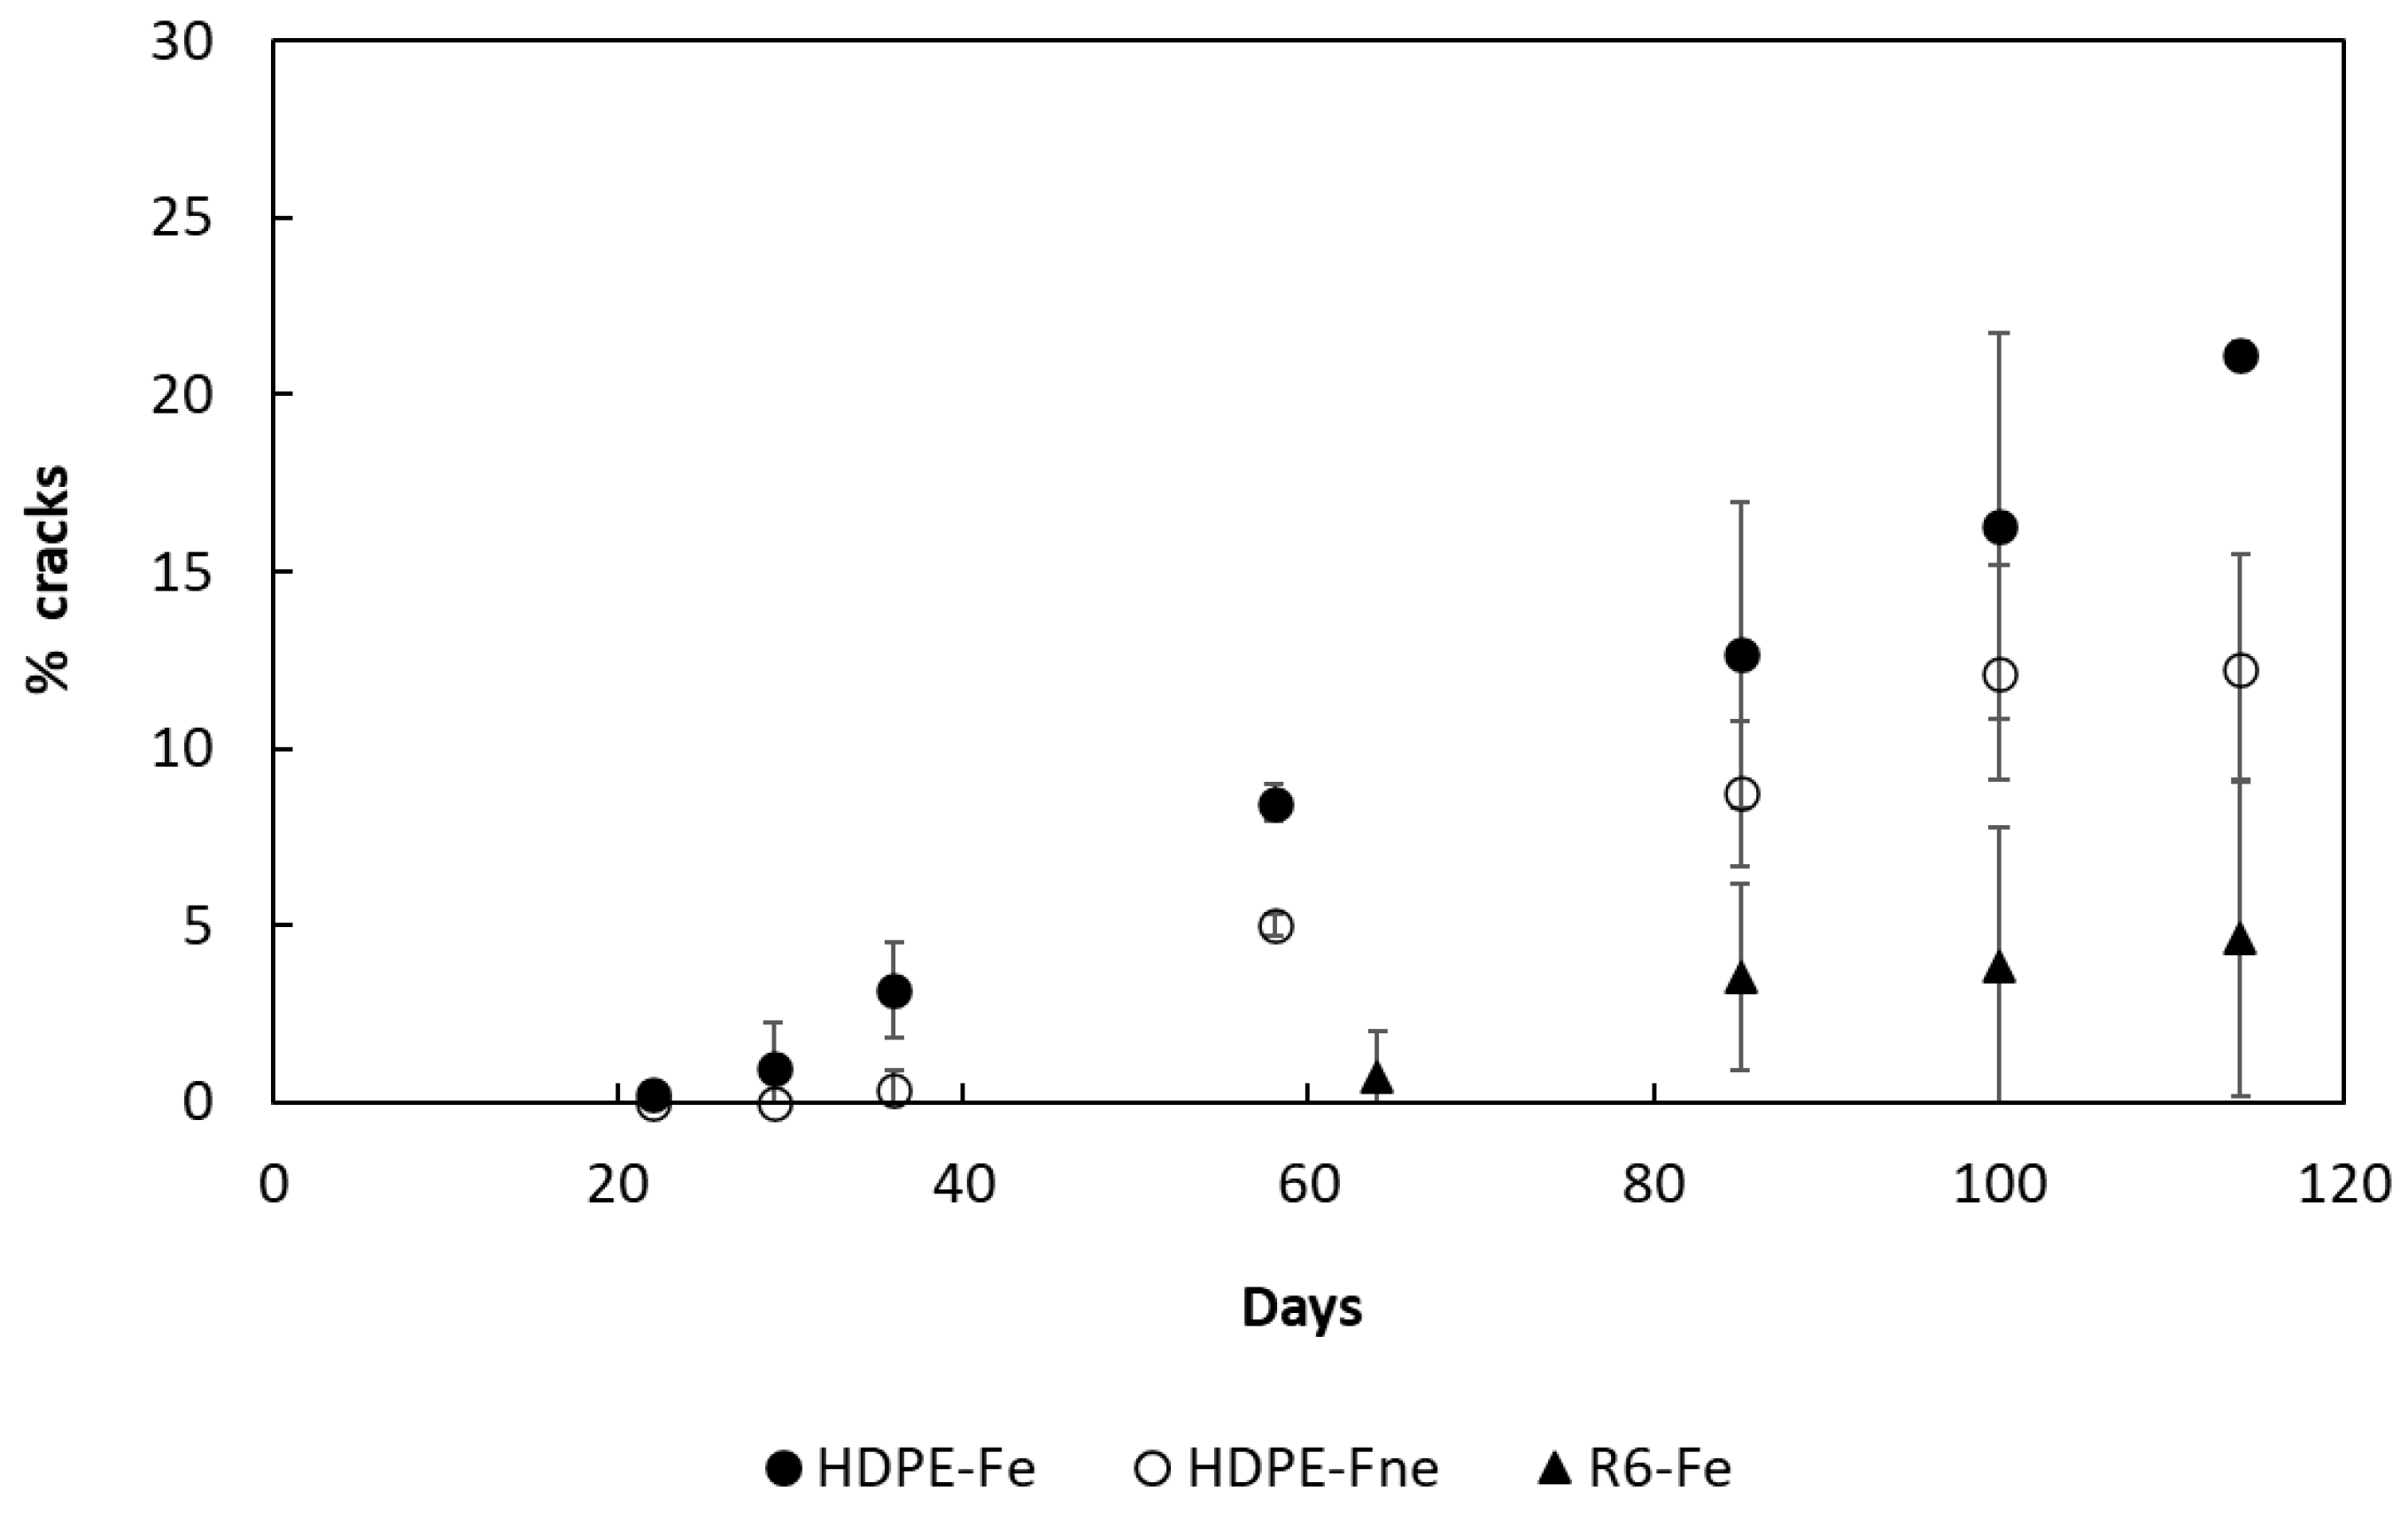
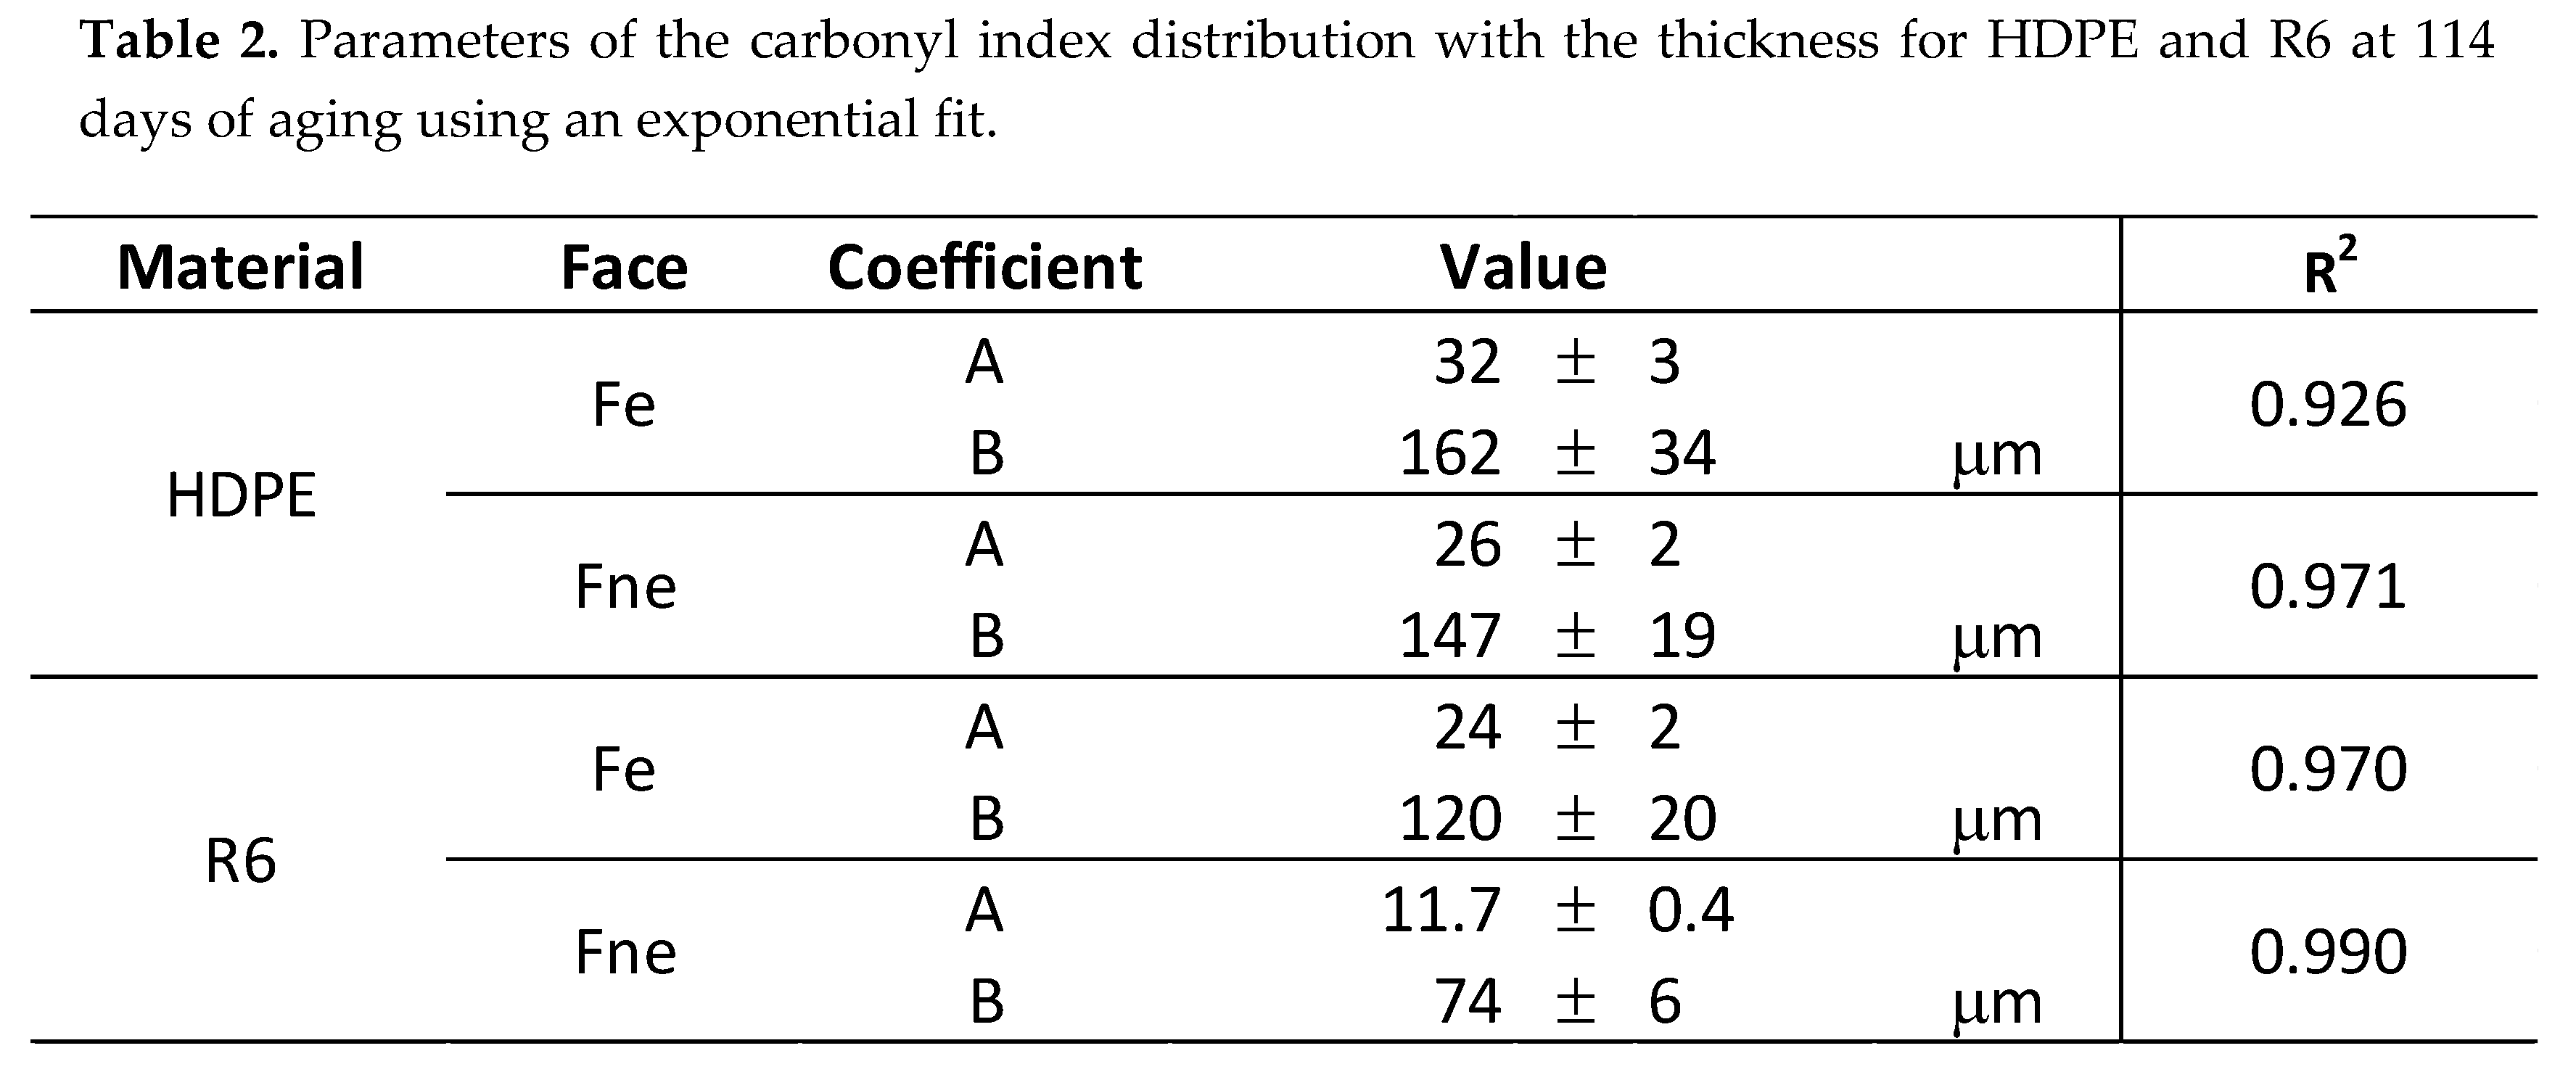
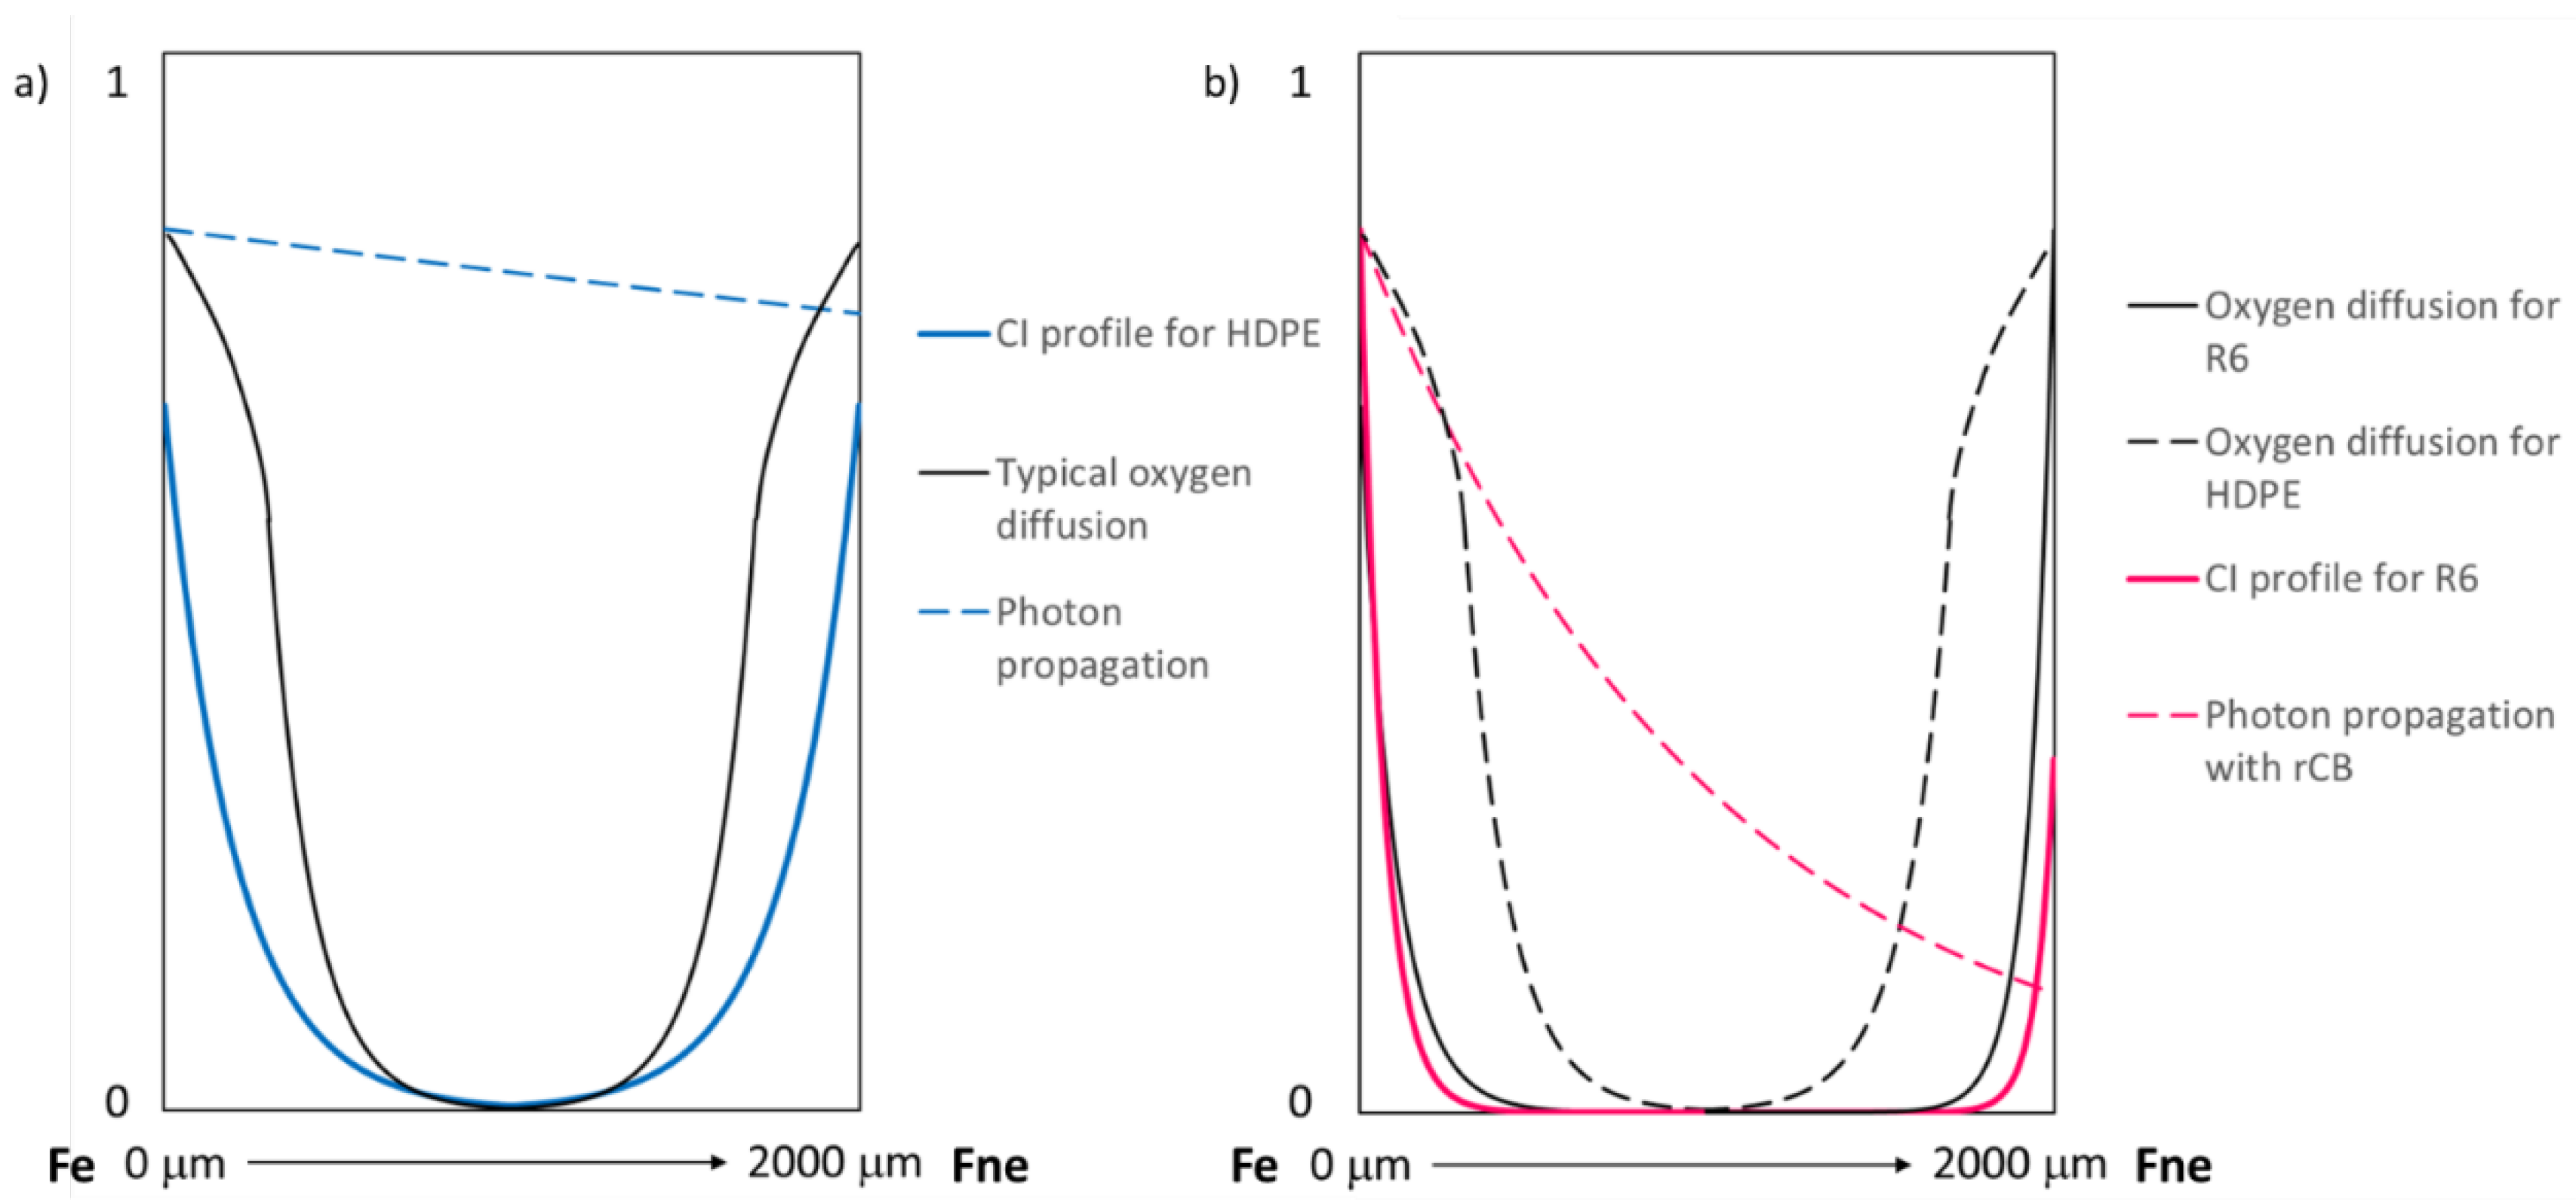
3.3. Degradation Kinetic and Formation of Oxidative Products
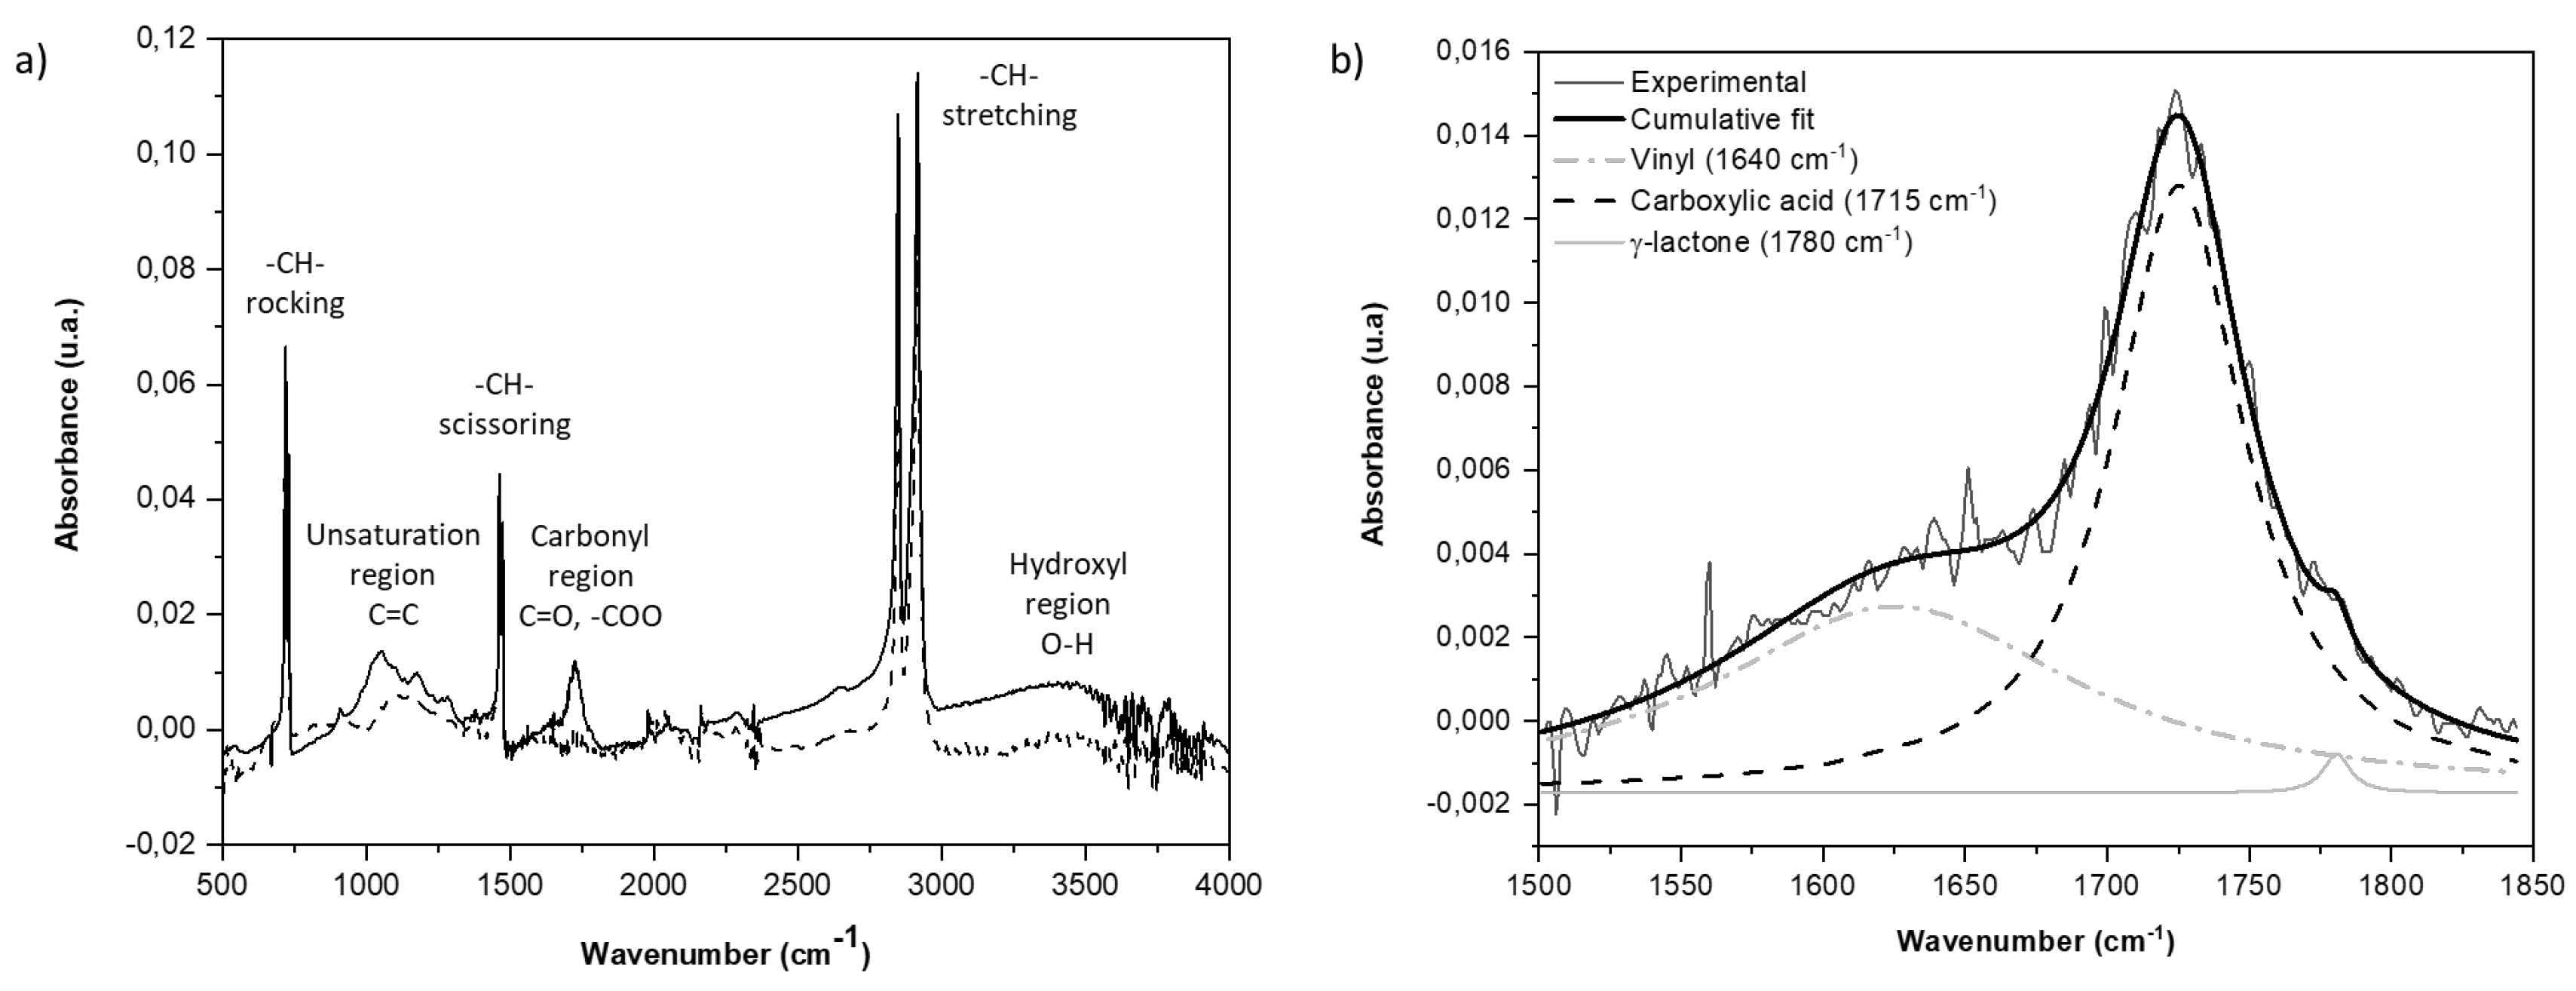
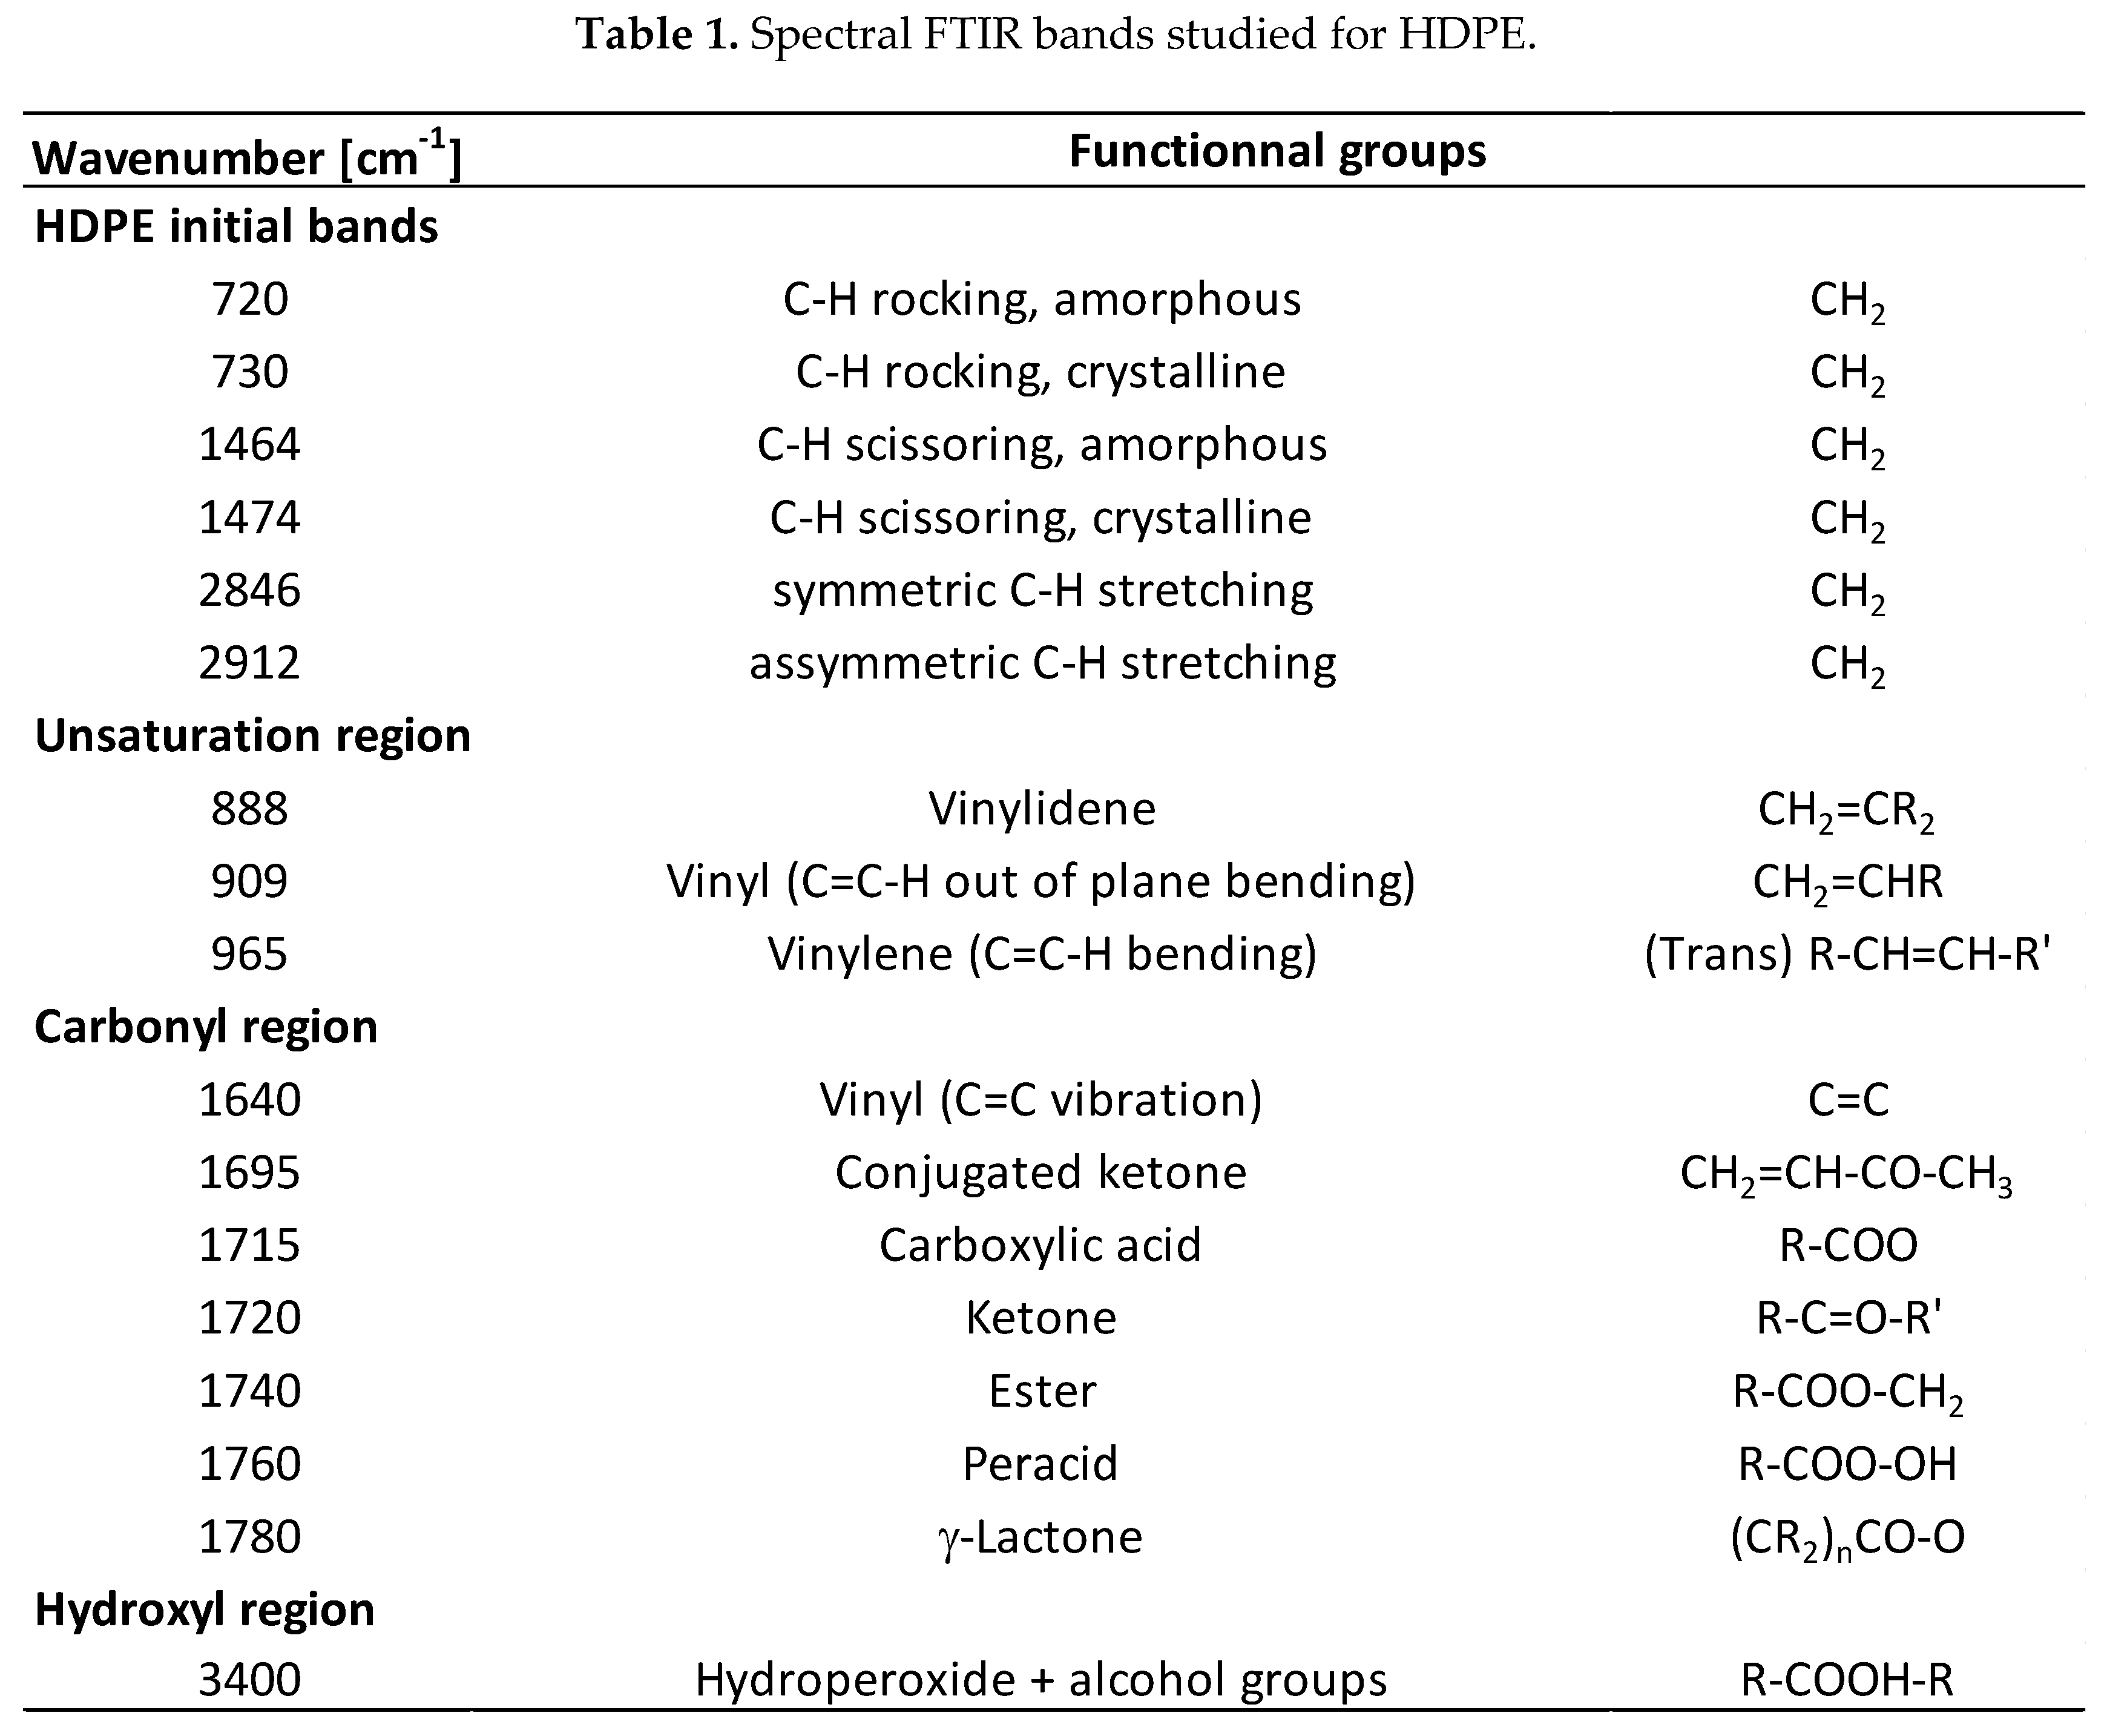

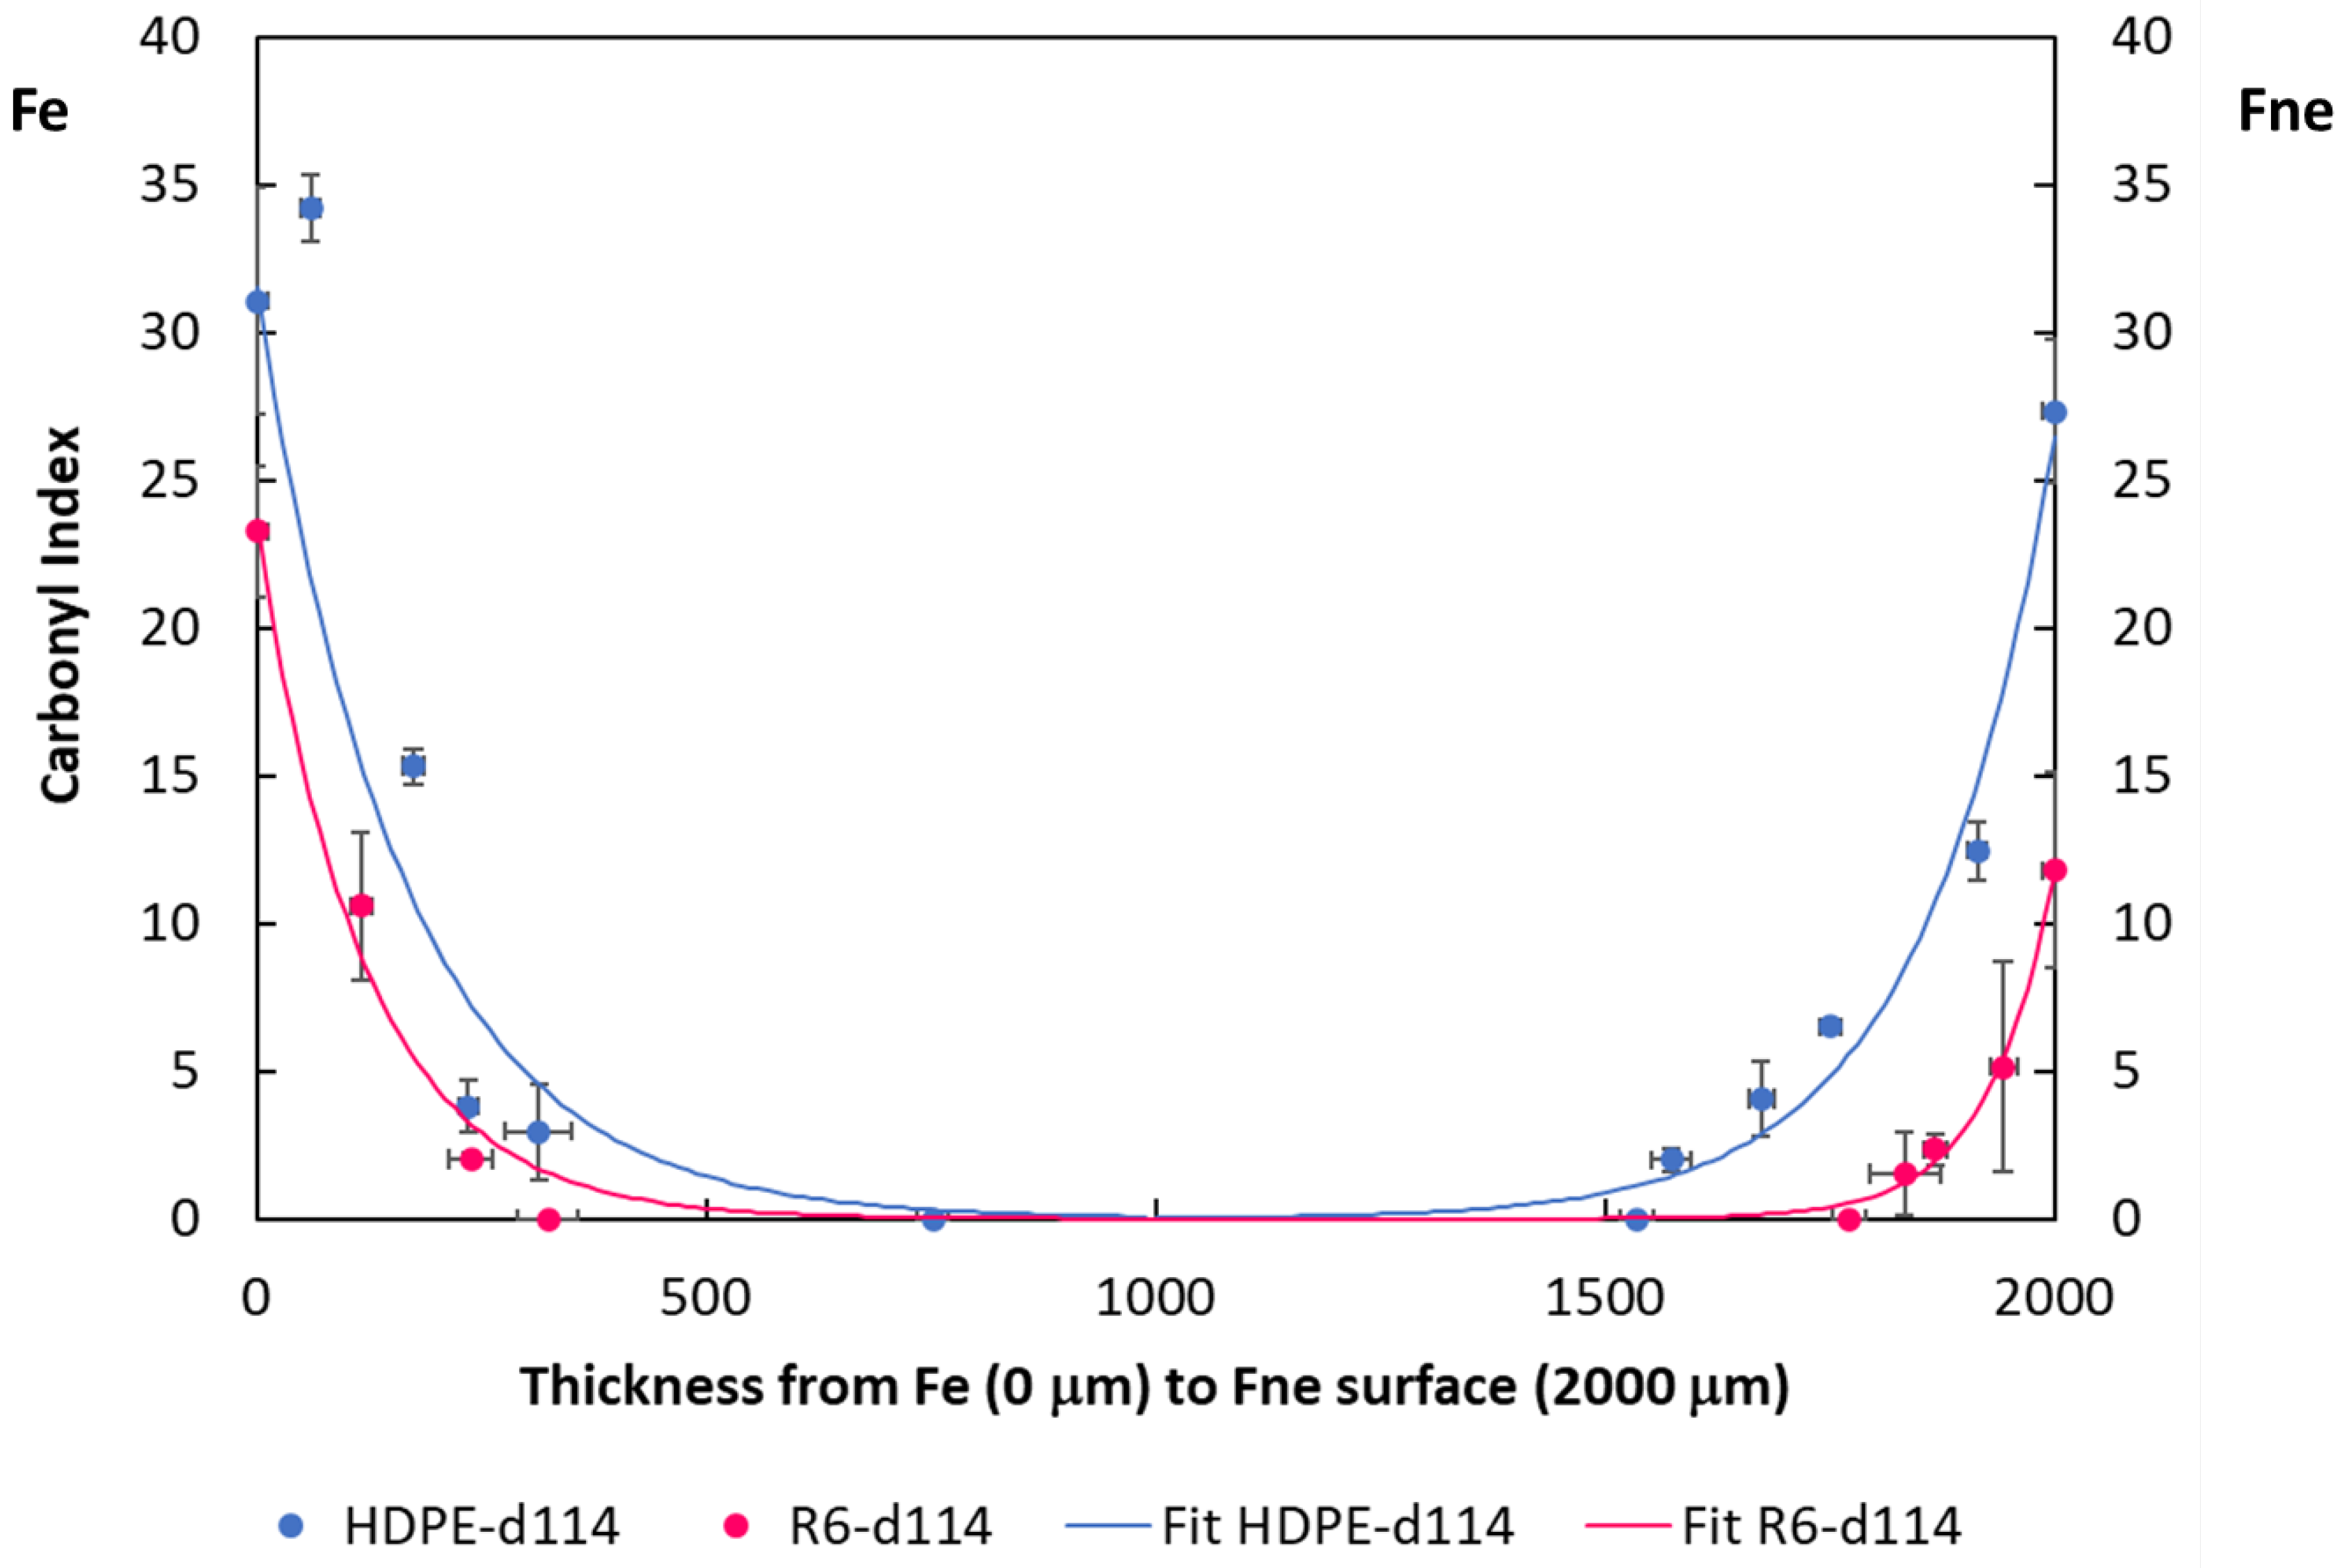
4. Conclusions
Acknowledgments
References
- Sienkiewicz, M.; Kucinska-Lipka, J.; Janik, H.; Balas, A. Progress is used types management in the European Union: A review. Waste Management 2012, 32, 1742–1751. [Google Scholar] [CrossRef] [PubMed]
- Hoang, A.T.; Nguyen, T.H.; Nguyen, H.P. Scrap tire pyrolysis as a potential stategy for waste management pathway: a review. Energy Sources, Part A: Recovery, Utilization, and Environmental Effects 2020. [Google Scholar] [CrossRef]
- Martinez, J.D.; Puy, N.; Murillo, R.; Garcia, T.; Navarro, M.V.; Mastral, A.M. Waste tyre pyrolysis - A review. Renewable and Sustainable Energy Reviews 2013, 23, 179–213. [Google Scholar] [CrossRef]
- ADEME (ADEME). Pneumatiques - Données 2020; ADEME: Angers (France), 2020; p. 58. [Google Scholar]
- ACARP Rapport annuel 2021 de l'Association Canadienne des Agences de Recyclage des Pneus; 2021; p. 22.
- USTMA 2019 US Scrapt Tire Management Summary; 2019; p. 20.
- Xu, J.; Yu, J.; Xu, J.; Sun, C.; He, W.; huang, J.; Li, G. High-value utilization of waste tires: A review with focus on modified carbon black from pyrolysis. Science of the Total Environment 2020, 742. [Google Scholar] [CrossRef] [PubMed]
- Williams, P.T. Pyrolysis of waste tyres: a review. Waste Management 2013, 33, 1714–1728. [Google Scholar] [CrossRef]
- Roy, C.; Chaala, A.; Darmstadt, H.; de Caumia, B.; Pakdel, H.; Yang, J. Conversion of used tires to carbon black and oil by pyrolysis. In Rubber Recycling; CRC Press, Taylor & Francis Group, LLC.: 2005; p. 528.
- Deveci, S.; Antony, N.; Eryigit, B. Effect of carbon black distribution on the properties of polyethylene pipes - Part 1: Degradation of post yield mechanical properties and fracture surface analyses. Polymer Degradation and Stability 2018, 148, 75–85. [Google Scholar] [CrossRef]
- Wallder, V.T.; Clarke, W.J.; Decoste, J.B.; Howard, J.B. Weathering Studies on Polyethylene. Industrial & Engineering Chemistry 1950, 42, 2320–2325. [Google Scholar]
- Horrocks, A.R.; Mwila, J.; Miraftab, M.; Liu, M.; Chohan, S.S. The influence of carbon black on properties of orientated polypropylene 2. Thermal and photodegradation. Polymer Degradation and Stability 1999, 65, 25–36. [Google Scholar] [CrossRef]
- Crump, E.L. (U.S. Environmental Protection Agency (EPA)). Economic Impact Analysis For the Proposed Carbon Black Manufacturing NESHAP; U.S. Environmental Protection Agency (EPA): 2000; p. 19.
- Ecoinvent. ecoinvent v3.6 database. Available online: https://ecoinvent.org (accessed on.
- Roy, C.; Labrecque, B.; De Caumia, B. Recycling of scrap tires to oil and carbon black by vacuum pyrolysis. Resources, Conservation and Recycling 1990, 4, 203–213. [Google Scholar] [CrossRef]
- LRCCP Bioproof - Rapports axe Recyclage; Vitry-sur-Seine (France), 2018.
- Li, S.-Q.; Yao, Q.; Chi, Y.; Yan, J.-H.; Cen, K.-F. Pilot-Scale Pyrolysis of Scrap Tires in a Continuous Rotary Kiln Reactor. Industrial & Engineering Chemistry Research 2004, 43, 5133–5145. [Google Scholar]
- Sahouli, B.; Blacher, S.; Brouers, F.; Darmstadt, H.; Roy, C.; Kaliaguine, S. Surface morphology and chemistry of commercial carbon black and carbon black from vacuum pyrolysis of used tyres Fuel. 1996, 75, 1244–1250. [Google Scholar]
- Roy, C.; Darmstadt, H. Carbon blacks recovered from rubber waste by vacuum pyrolysis - comparison with commercial grades. In Proceedings of the International Conference on Rubbers, Calcutta (India), 12-14 December 1997, 1998; pp. 341-345.
- Environmental, F. Solar Radiation and Photosynethically Active Radiation. Available online: https://www.fondriest.com/environmental-measurements/parameters/weather/photosynthetically-active-radiation/ (accessed on February 2022.
- Gijsman, P.; Meijers, G.; Vitarelli, G. Comparison of the UV-degradation chemistry of polypropylene, polyethylene, polyamide 6 and polybutylene terephthalate. Polymer Degradation and Stability 1999, 65, 433–441. [Google Scholar] [CrossRef]
- Furneaux, G.C.; Ledbury, K.J.; Davis, A. Photo-oxidation of thick polymer samples - Part 1: the variation of photo-oxidation with depth in naturally and artificially weathered low density polyethylene. Polymer Degradation and Stability 1981, 3, 431–442. [Google Scholar] [CrossRef]
- Tüdos, F.; Iring, M. Polyolefine oxidation: rates and products. Acta Polymerica 1988, 39, 19–26. [Google Scholar] [CrossRef]
- Gardette, M.; Perthue, A.; Gardette, J.-L.; Janecska, T.; Foldes, E.; Pukanszky, B.; Therias, S. Photo- and thermal-oxidation of polyethylene: Comparison of mechanisms and influence of unsaturation content. Polymer Degradation and Stability 2013, 98, 2383–2390. [Google Scholar] [CrossRef]
- Yousif, E.; Haddad, R. Photodegradation and photostabilization of polymers, especially polystyrene: a review. Springer Plus 2013, 2, 398–430. [Google Scholar] [CrossRef] [PubMed]
- Mwila, J.; Miraftab, M.; Horrocks, A.R. Effect of carbon black on the oxidation of polyolefins - An overview. Polymer Degradation and Stability 1994, 44, 351–356. [Google Scholar] [CrossRef]
- Hawkins, W.L.; Hansen, R.H.; Matreyek, W.; Winslow, F.H. The effect of carbon black on thermal antioxidants for polyethylene. Journal of Applied Polymer Science 1959, 1, 37–42. [Google Scholar] [CrossRef]
- Chemicals, D. DOW DMDA-8904 NT 7 High Density Polyethylene Resin - Technical Information; Dow Chemicals, 2018.
- Carrasco, F.; Pagès, P.; Pascual, S.; Colom, X. Artificial aging of high-density polyethylene by ultraviolet irradiation. European Polymer Journal 2001, 37, 1457–1464. [Google Scholar] [CrossRef]
- Donnet, J.-B. Structure and Reactivity of Carbon. Tanso 1977, 88, 12–33. [Google Scholar] [CrossRef]
- Ono, K.; Yanak, M.; Tanaka, S.; Saito, Y.; Aoki, H.; Fukuda, O.; Aoki, T.; Yamaguchi, T. Influence of furnace temperature and residence time on configurations of carbon blacks. Chemical Engineering Journal 2012, 200-202, 541–548. [Google Scholar] [CrossRef]
- Hjelm, R.P.J.; Wampler, W.A.; Seeger, P.A.; Gerspacher, M. The microstructure and morphology of carbon black: A study using small angle neutron scattering and contrast variation. Journal of Materials Research 1994, 9, 3210–3222. [Google Scholar] [CrossRef]
- Medalia, A.I. Morphology of Aggregates - VI. Effective volume of aggregates of carbon black from electron microscopy; application to vehicule absorption and to die swell of filled rubber. Journal of Colloid and Interface Science 1970, 22, 115–131. [Google Scholar] [CrossRef]
- Pertin, T. Etude d'une matrice thermoplastique sous contraintes environnementales tropicales : approche multi-échelle. Université des Antilles, Guadeloupe (FWI), 2022.
- Yakimets, I.; Lai, D.; Guigon, M. Effect of photo-oxidation cracks on behaviour of thick polypropylene samples. Polymer Degradation and Stability 2004, 86, 59–67. [Google Scholar] [CrossRef]
- Liu, M.; Horrocks, A.R. Effect of Carbon Black on UV stability of LLDPE films under artificial weathering conditions. Polymer Degradation and Stability 2002, 75, 485–499. [Google Scholar] [CrossRef]
- Pertin, T.; Minatchy, G.; Adoue, M.; Flory, A.; Romana, L. Investigation of nanoindentation as a fast characterization tool for polymer degradation study. Polymer Testing 2019, 81. [Google Scholar] [CrossRef]
- Yang, R.; Liu, Y.; Zhang, D. Spatial Heterogeneity of Photo-Oxidation and Its Relation With Crack Propagation in Polyethylene Composites. Polymer Engineering and Science 2008, 48, 2270–2276. [Google Scholar] [CrossRef]
- Krishnaswamy, R.K.; Yang, Q.; Fernandez-Ballester, L.; Kornfield, J.A. Effect of the Distribution of Short-Chain Branches on Crystallization Kinetics and Mechanical Properties of High-Density Polyethylene. Macromolecules 2008, 41, 1693–1704. [Google Scholar] [CrossRef]
- Stark, N.M.; Matuana, L.M. Surface chemistry changes of weathered HDPE/wood-flour composites studied by XPS and FTIR spectroscopy. Polymer Degradation and Stability 2004, 86, 1–9. [Google Scholar] [CrossRef]
- Tidjani, A. Comparison of formation of oxidation products during photo-oxidation of linear low density polyethylene under different natural and accelerated weathering conditions. Polymer Degradation and Stability 2000, 68, 465–469. [Google Scholar] [CrossRef]
- Grause, G.; Chien, M.-F.; Inoue, C. Changes during the weathering of polyolefins. Polymer Degradation and Stability 2020, 181. [Google Scholar] [CrossRef]
- Douminge, L. Étude du comportement du polyéthylène haute densité sous irradiation ultraviolette ou sollicitation mécanique par spectroscopie de fluorescence. Université de La Rochelle, La Rochelle (France), 2010.
- Almond, J.; Sugumaar, P.; Wenzel, M.N.; Hill, G.; Wallis, C. Determination of the carbonyl index of polyethylene and polypropylene using specified area under band methodology with ATR-FTIR spectroscopy. e-Polymer 2020, 20, 369–381. [Google Scholar] [CrossRef]
- Cunliffe, A.V.; Davis, A. Photo-oxidation of thick polymer samples - Part II: The influence of oxygen diffusion on the natural and artificial weathering of polyolefins. Polymer Degradation and Stability 1982, 4, 17–37. [Google Scholar] [CrossRef]
- Richaud, E.; Verdu, J. Vieillissement chimique des polymères - Cinétique de dégradation (AM3152 V1). In Technique de l'ingénieur, l'ingénieur, T.d., Ed.; Technique de l'ingénieur: France, 2011. [Google Scholar]
Disclaimer/Publisher’s Note: The statements, opinions and data contained in all publications are solely those of the individual author(s) and contributor(s) and not of MDPI and/or the editor(s). MDPI and/or the editor(s) disclaim responsibility for any injury to people or property resulting from any ideas, methods, instructions or products referred to in the content. |
© 2024 by the authors. Licensee MDPI, Basel, Switzerland. This article is an open access article distributed under the terms and conditions of the Creative Commons Attribution (CC BY) license (http://creativecommons.org/licenses/by/4.0/).


