Submitted:
21 August 2024
Posted:
21 August 2024
You are already at the latest version
Abstract
Keywords:
1. Introduction
2. Related Work
2.1. User Profiling Methods
2.2. Technologies
2.3. Visitor Groups
2.4. Smart Badges
3. System Design
3.1. Architecture
3.2. Methodology
3.3. Database Design
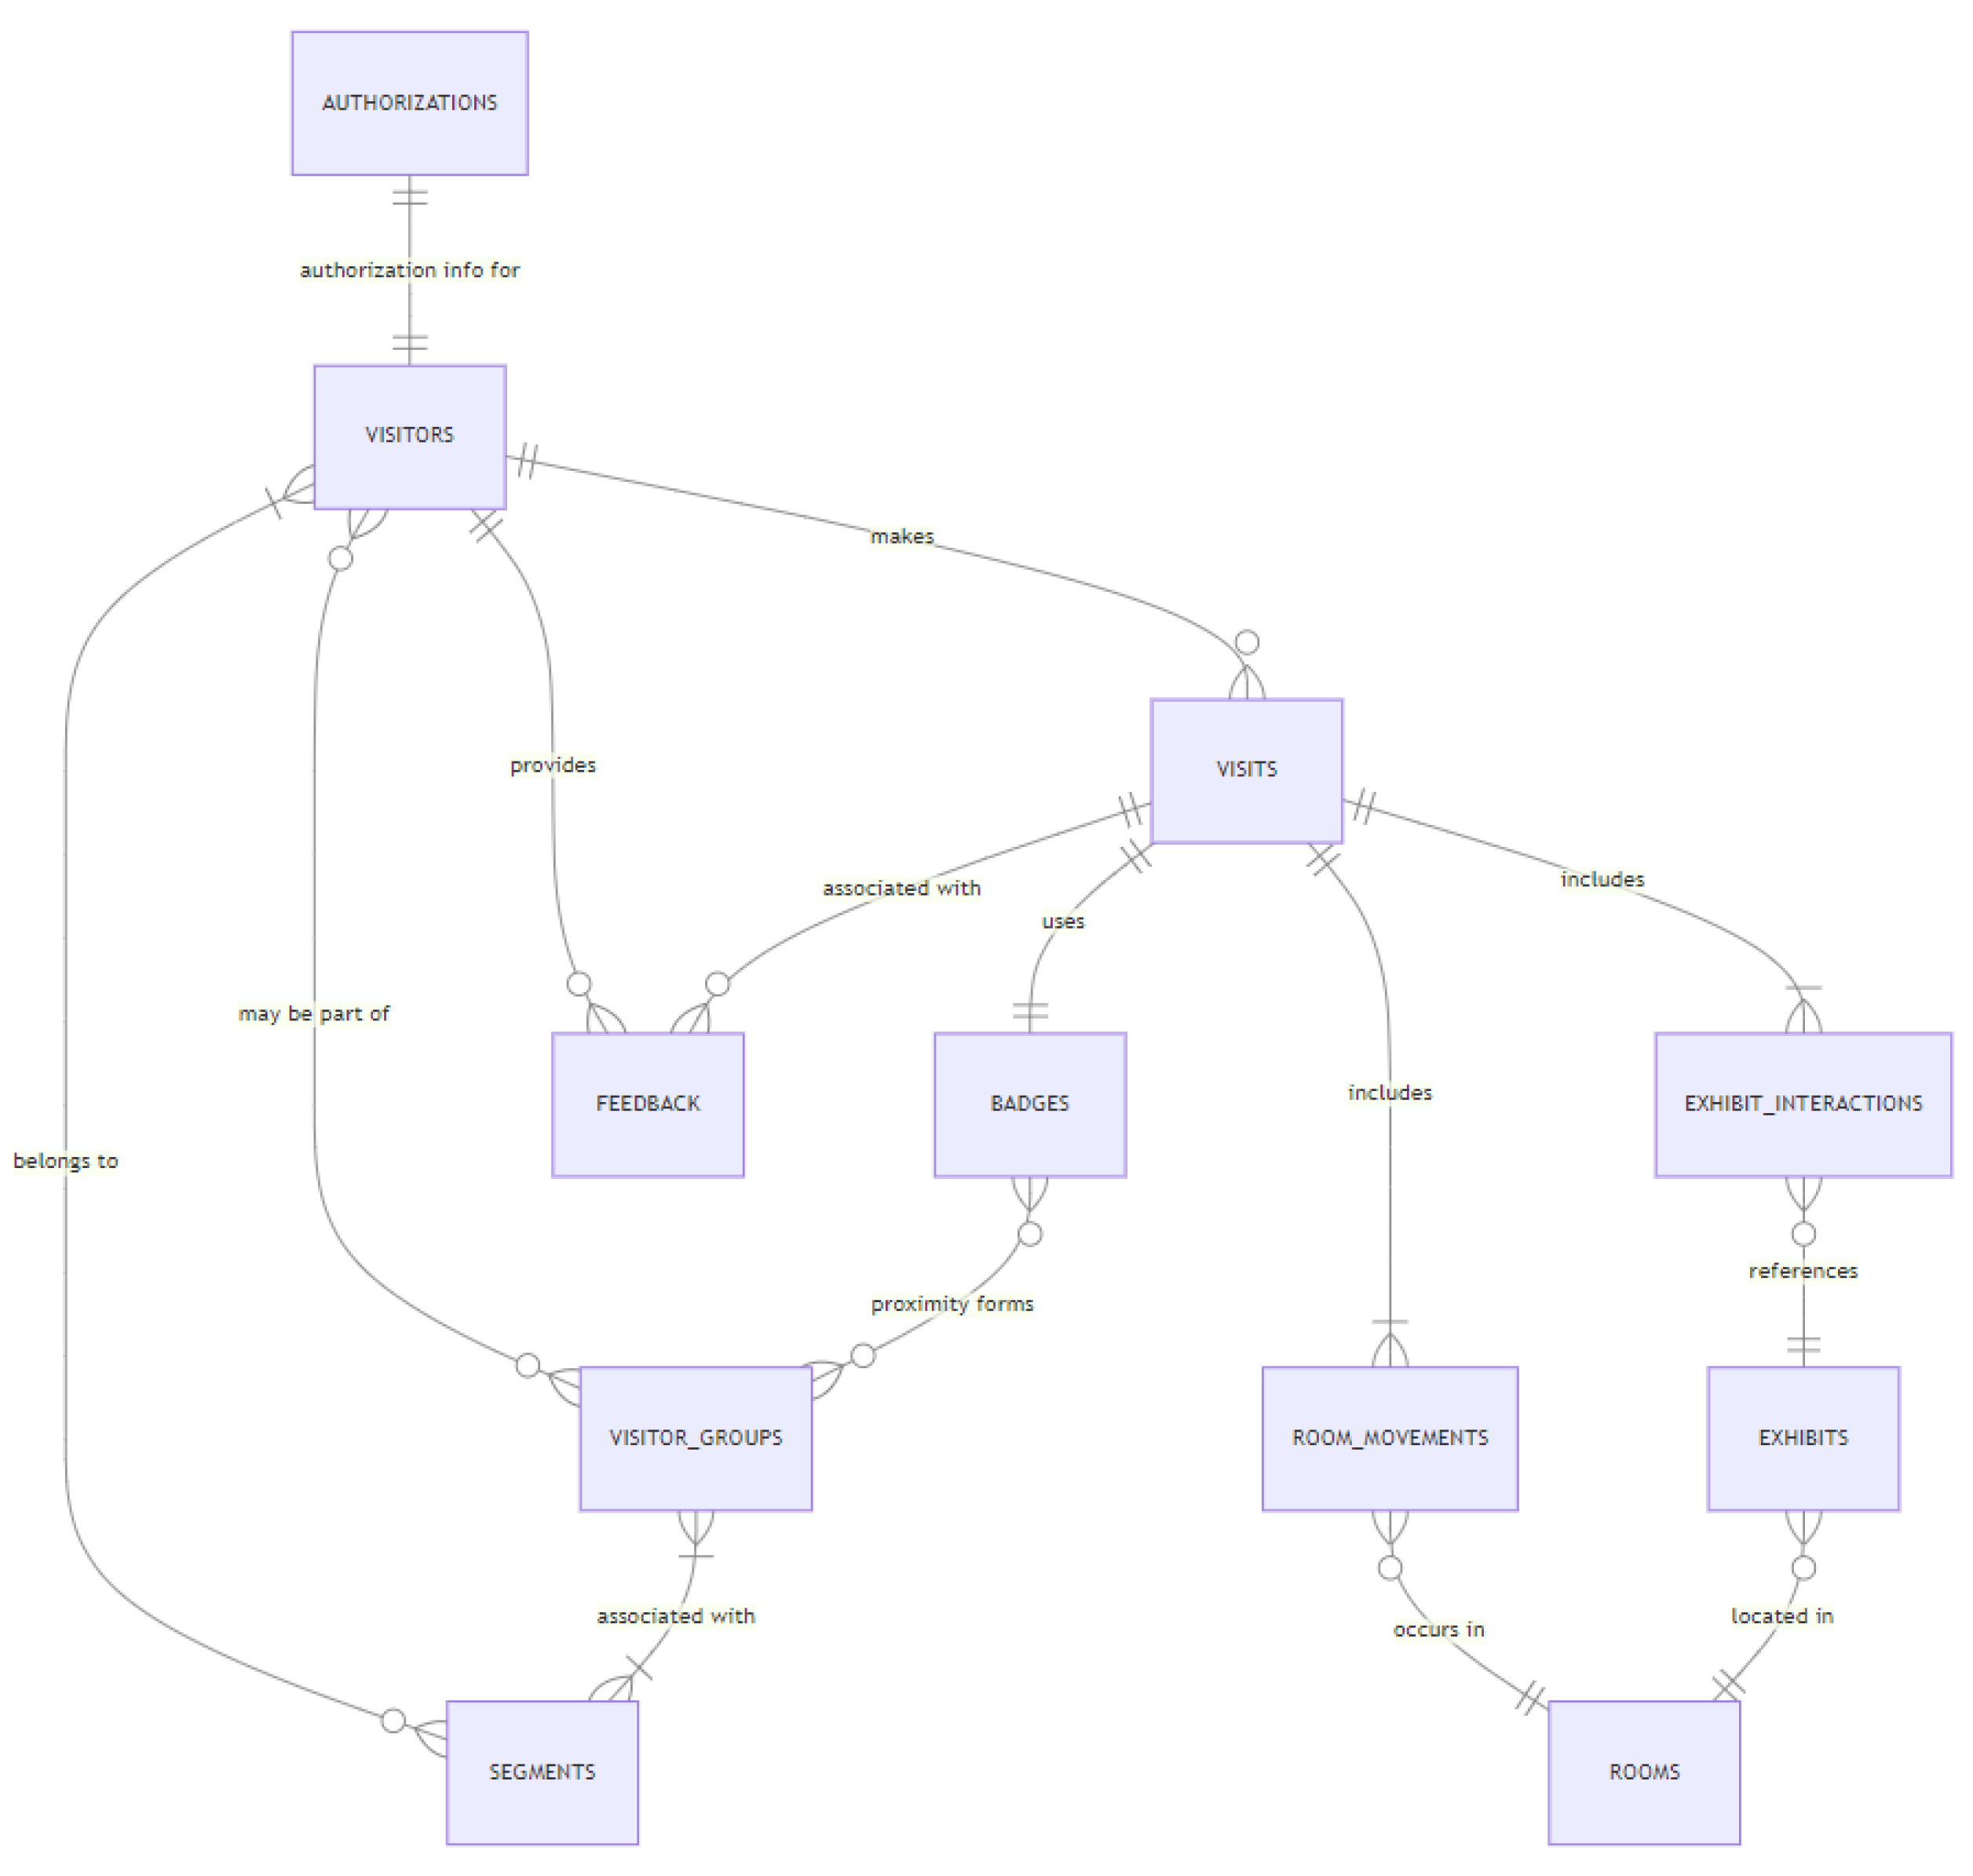
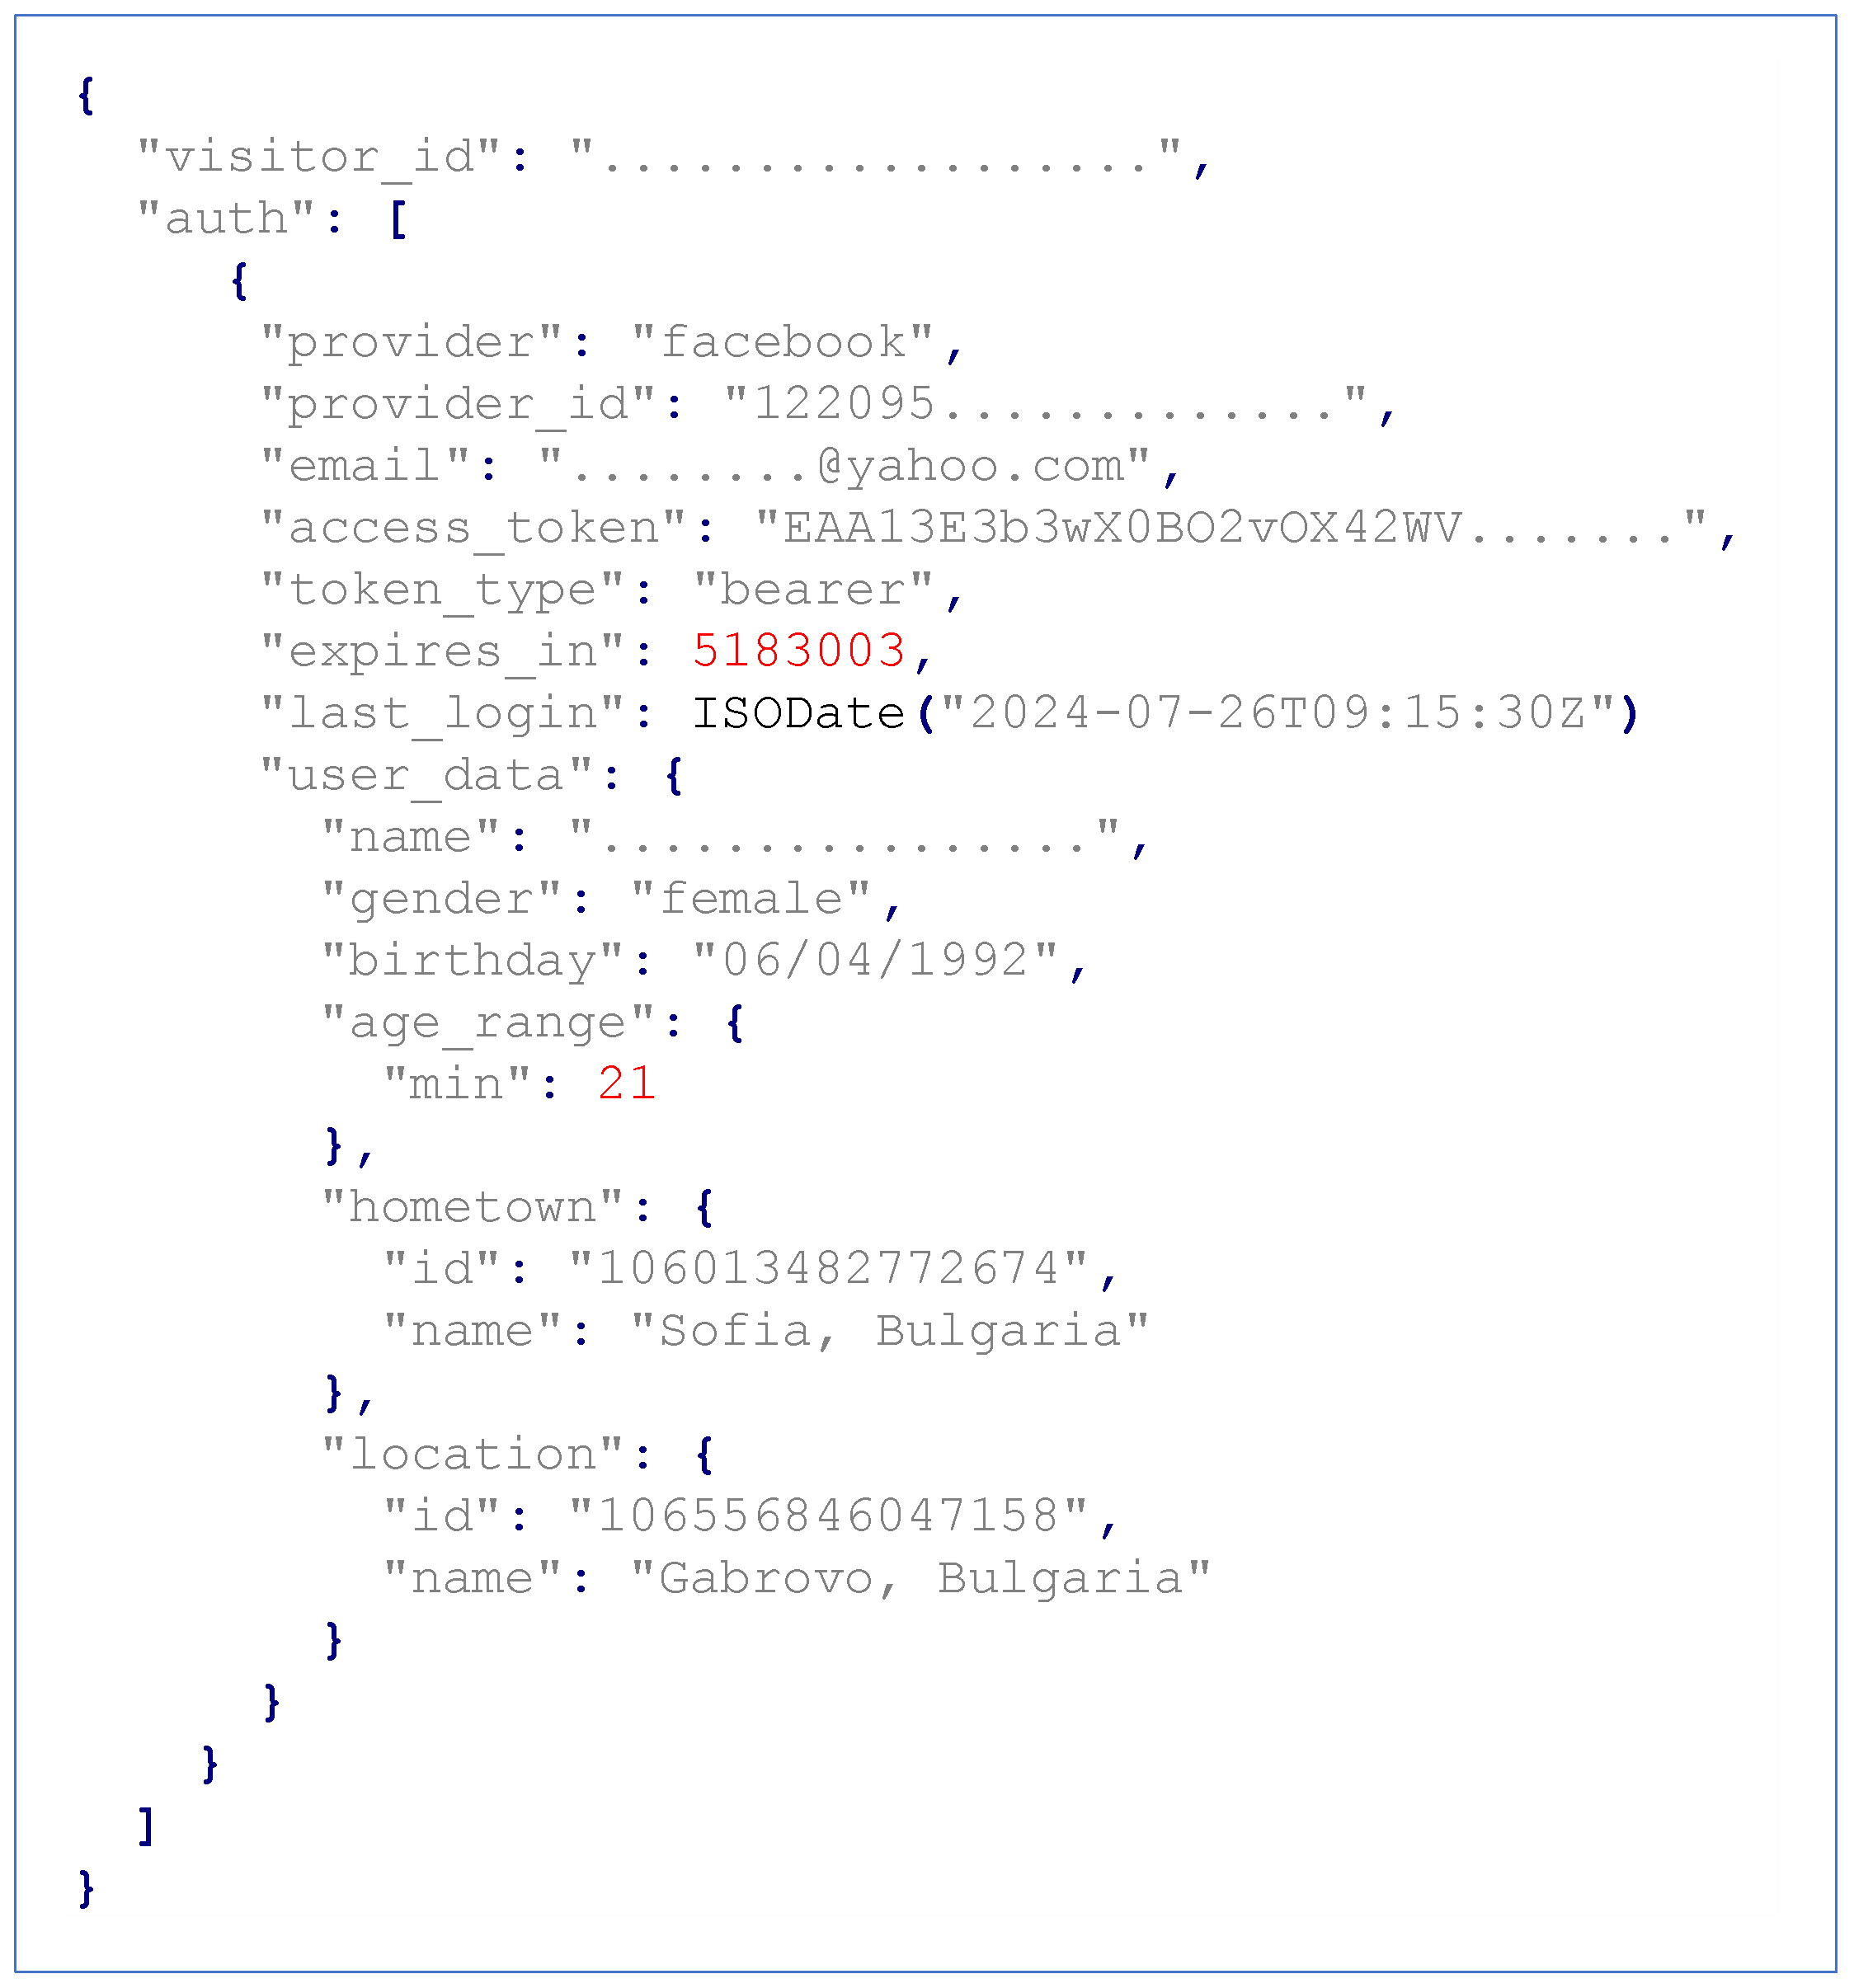
- visitor_id: A unique identifier for the visitor within the database, ensuring that authorization details are correctly associated with the visitor’s profile regardless of the social network used for authentication.
- auth: An array of objects, each representing authentication details for a specific OAuth provider. Each object includes the provider, which specifies the OAuth service provider used for authentication, such as „facebook” or „google.” The „provider_id” contains the unique identifier assigned by the provider, linking the visitor’s account to the external service. The „email” field stores the visitor’s email address associated with the specific provider, ensuring accurate identification across different platforms. The „access_token” field holds the encrypted access token provided by the OAuth service, used for authenticating the visitor. The „user_data” field stores user information obtained from the OAuth provider.
- Quick Visitors: Quick Visitors spend approximately 1-2 minutes per exhibit. They move quickly through the museum, focusing on key highlights and major attractions. They prefer quick highlights and brief overviews, favoring concise, impactful presentations. These visitors move rapidly through exhibits, focusing on the main attractions rather than in-depth exploration.
- Moderate Explorers: Moderate Movers spend about 3-5 minutes per exhibit. They enjoy a balanced experience that includes both quick highlights and more detailed content. Their pace is moderate, allowing them to engage with a mix of brief and moderately detailed exhibits.
- Leisurely Movers: Leisurely Movers spend approximately 6-10 minutes per exhibit. They engage more deeply with each exhibit, taking their time to explore detailed information and absorb the content. Their slower pace indicates a preference for thorough examination and contemplation of exhibits.
- In-Depth Movers: In-Depth Movers spend more than 10 minutes per exhibit. They immerse themselves extensively in the details, often revisiting exhibits and taking significant time to fully engage with and understand the content. Their extended viewing time reflects a desire for a comprehensive and immersive museum experience.
- Interactive Kids: This group consists of children aged 6 to 12 who are particularly attracted to interactive exhibits. Their visits tend to be brief, and the system should prioritize delivering content in the form of images, audio, and video to effectively engage this audience.
- Teen Trendsetters: Teen Trendsetters are teenagers aged 13-17 years who are interested in technology and interactive media. They engage with multimedia and social features and tend to move quickly through exhibits, focusing on the latest trends and interactive elements.
- Young Professionals: Young Professionals are individuals aged 18-30 years who are attracted to contemporary art, innovative exhibits, and social media. They prefer fast-paced exploration of trending exhibits and are often interested in the intersection of technology and art.
- Midlife Explorers: Midlife Explorers are adults aged 31-50 who are deeply engaged with historical artifacts, detailed exhibitions, and educational content. They seek meaningful and in-depth experiences that reflect their mature perspective and extensive life experience.
- Senior Art Connoisseurs: Senior Art Connoisseurs are visitors aged 51 and older who appreciate classic art, historical narratives, and in-depth stories. They enjoy leisurely visits with detailed explanations, taking their time to fully understand and reflect on the exhibits.
- Mobility-Friendly Visitors: Mobility-Friendly Visitors are individuals with mobility impairments who need accessible routes and interactive aids. They are interested in exhibits with accessibility features and may prefer guided tours that accommodate their needs.
- Sensory-Sensitive Visitors: This group includes individuals with sensory sensitivities, such as visual or hearing impairments. Visitors with visual impairments should be provided with audio content tailored to their needs. In contrast, visitors with hearing impairments should primarily receive visual content to ensure an accessible and engaging experience.
- Language-Specific Aficionados: Language-Specific Aficionados are visitors who prefer or require exhibits in specific languages. They seek out exhibits with multilingual information or content available in their native or preferred language. They are interested in ensuring that their museum experience is accessible and comprehensible in their chosen language.
- Group Collaborators: Group Collaborators are visitors who are willing to form a group. They enjoy collaborative and group-oriented exhibits and activities, valuing interactive and social experiences that allow them to engage with others.
- Family Visitors: Family Visitors include groups consisting of parents and children or extended family members. They are interested in exhibits that are engaging for all age groups and may seek out interactive, educational, and family-friendly activities. They prefer exhibits that offer something for everyone and provide opportunities for family interaction and learning.
- Solo Navigators: Solo Navigators prefer visiting the museum alone. They are interested in self-guided tours and personal reflection exhibits. These visitors value independence and personal space during their museum experience.
- Art and Cultural Enthusiasts: Art and Cultural Enthusiasts are deeply interested in art history, cultural exhibits, and historical artifacts. They engage thoroughly with exhibits related to art and culture, seeking detailed narratives and rich historical context.
- First-Time Explorers: First-Time Explorers are new visitors to the museum who seek a broad introduction to its offerings. They are interested in general overviews and introductory exhibits and may look for guidance or highlights to help them get acquainted with the museum.
- Frequent Visitors: Frequent Visitors are regular patrons of the museum who come often to see new and changing exhibits, explore special collections, and access behind-the-scenes content. They appreciate the opportunity to engage with fresh displays and exclusive material.
3.4. Software Architecture
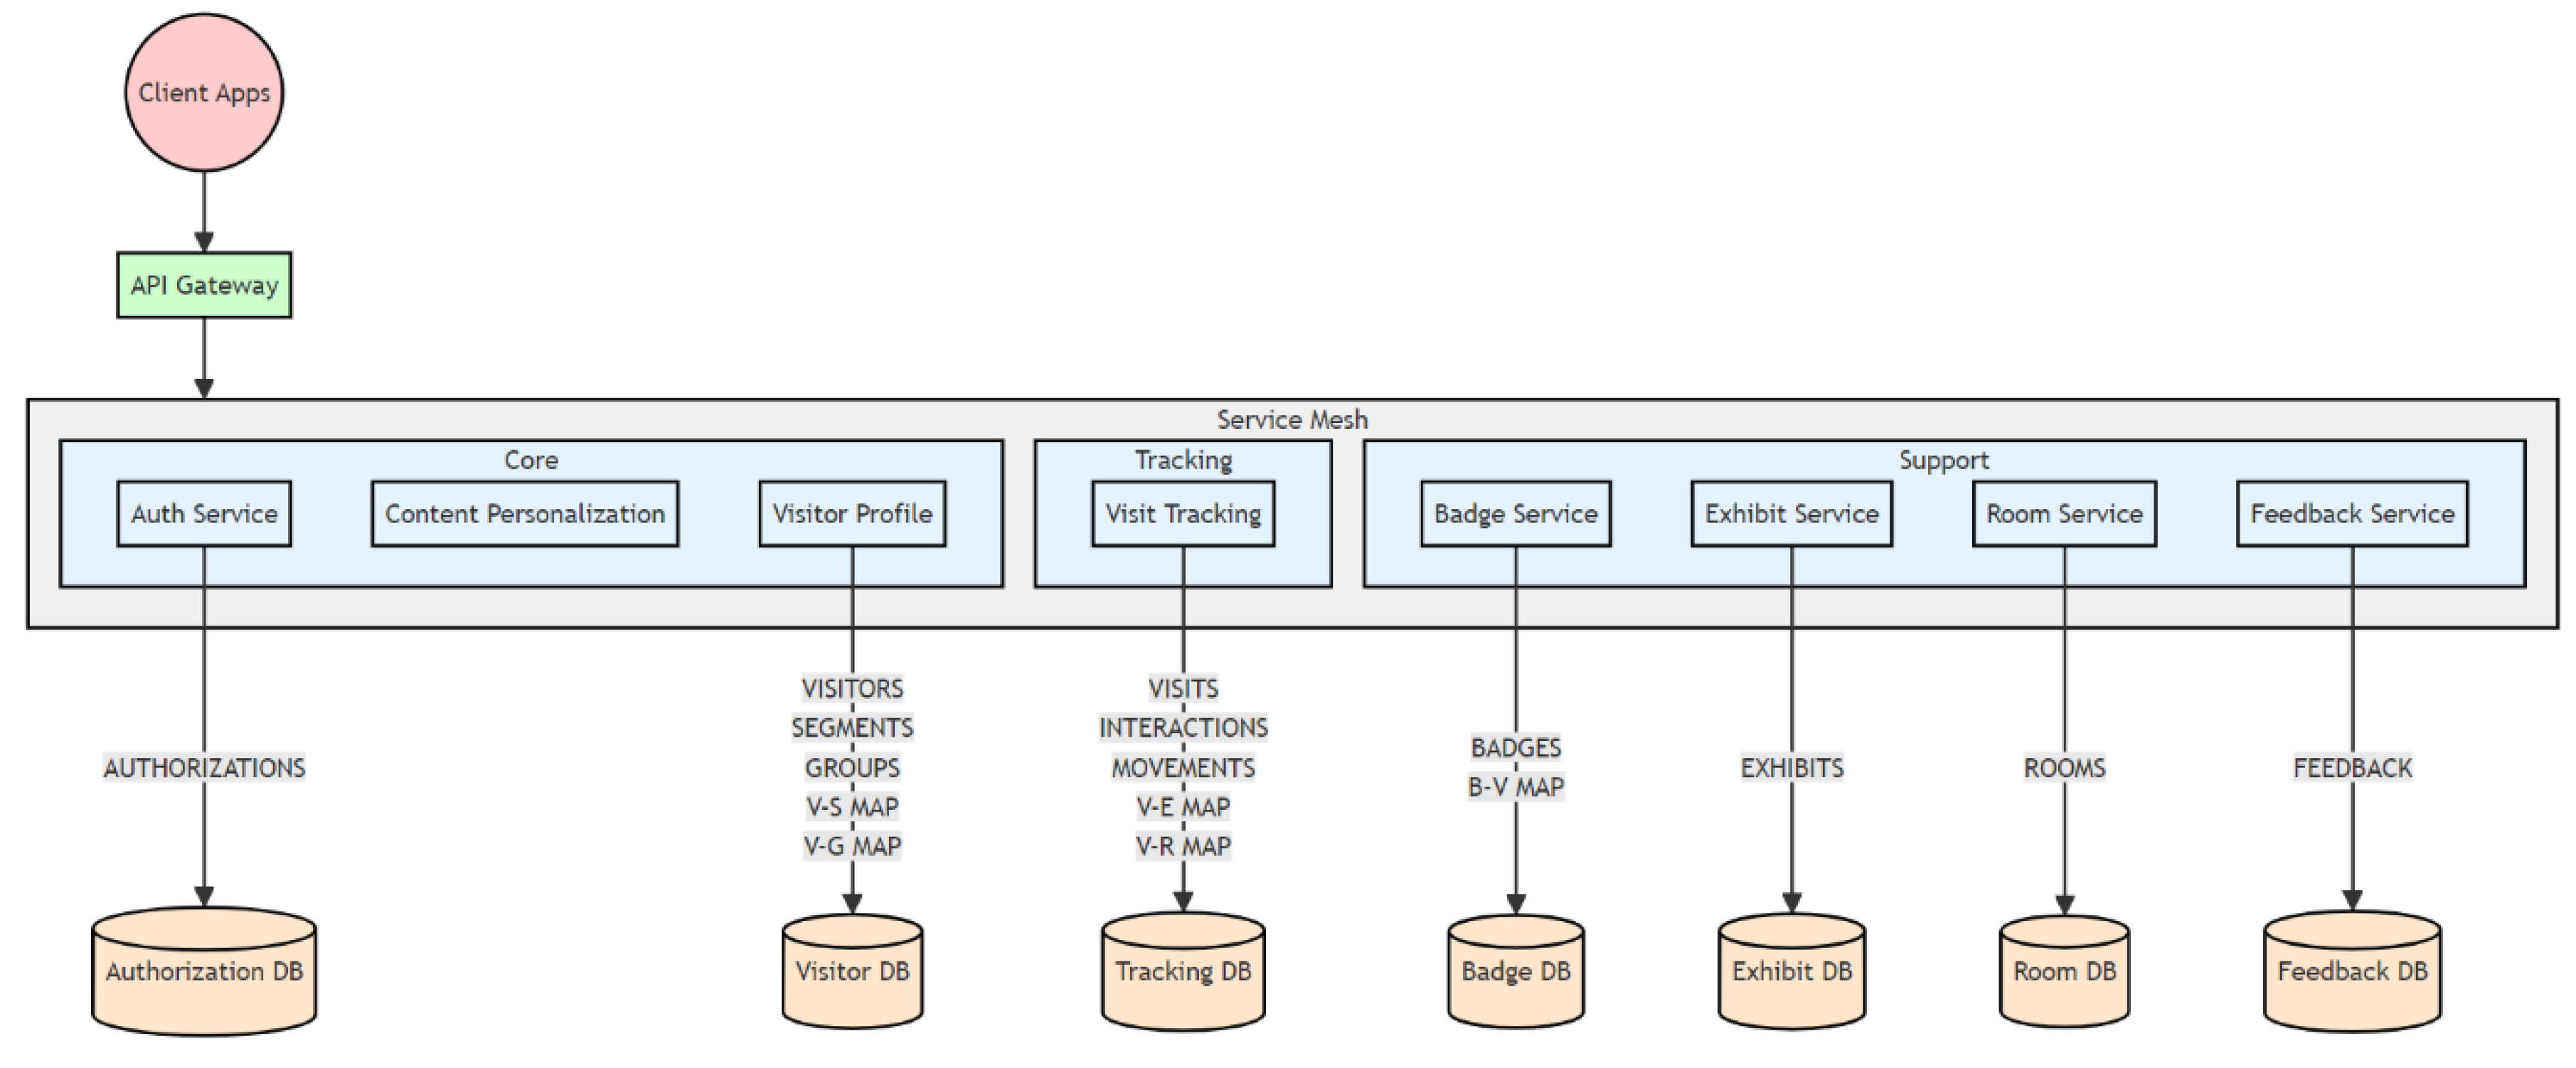
- The Auth Service plays a critical role by managing user access, ensuring that only authorized individuals can interact with the system. It handles tasks such as registration, login, permission checks, and security protocols.
- The Visitor Profile microservice maintains profiles for each visitor. This service manages the core visitor data, including the VISITORS, SEGMENTS, and VISITOR_GROUPS collections. It’s responsible for handling visitor profiles, implementing visitor segmentation, and managing visitor groups. The service also maintains two mapping collections: VISITOR_SEGMENT_MAPPING (V-S MAP) and VISITOR_GROUP_MAPPING (V-G MAP). In a microservice architecture, „mapping collections” refer to database collections specifically designed to manage the relationships or associations between different entities. These collections are essential when different services need to know about relationships without directly accessing each other’s primary data collections. They store references to the IDs of the entities they link, providing a way to look up connections efficiently. In our case mapping collections allow for flexible associations between visitors and their segments or groups without tightly coupling the data.
- The Content Personalization Service utilizes visitor profile data to customize recommendations and content for individual visitors. Functioning as both an aggregator and analyzer, this microservice integrates data from various other microservices to create tailored content suggestions. The service uses a Chatbot service from ExhibitExplorer to interact with ChatGPT. It transmits requests to the Chatbot service that encompass detailed information about all current visitor segments. By using these information, ChatGPT delivers highly relevant and personalized exhibit recommendations, precisely aligned with each visitor’s specific interests and preferences.
- The Visit Tracking microservice monitors and records how visitors engage with exhibits and navigate through the museum. It tracks movements, interactions, and other visit-related activities to enhance visitor experiences and optimize exhibit placements. It manages the VISITS, EXHIBIT_INTERACTIONS, and ROOM_MOVEMENTS collections. To maintain relationships between visits and specific interactions or movements, it also includes two mapping collections: VISIT_EXHIBIT_MAPPING (V-E MAP) and VISIT_ROOM_MAPPING (V-R MAP). These mapping collections allow the service to efficiently record and query a visitor’s journey through the museum, including which exhibits they interacted with and how they moved between rooms.
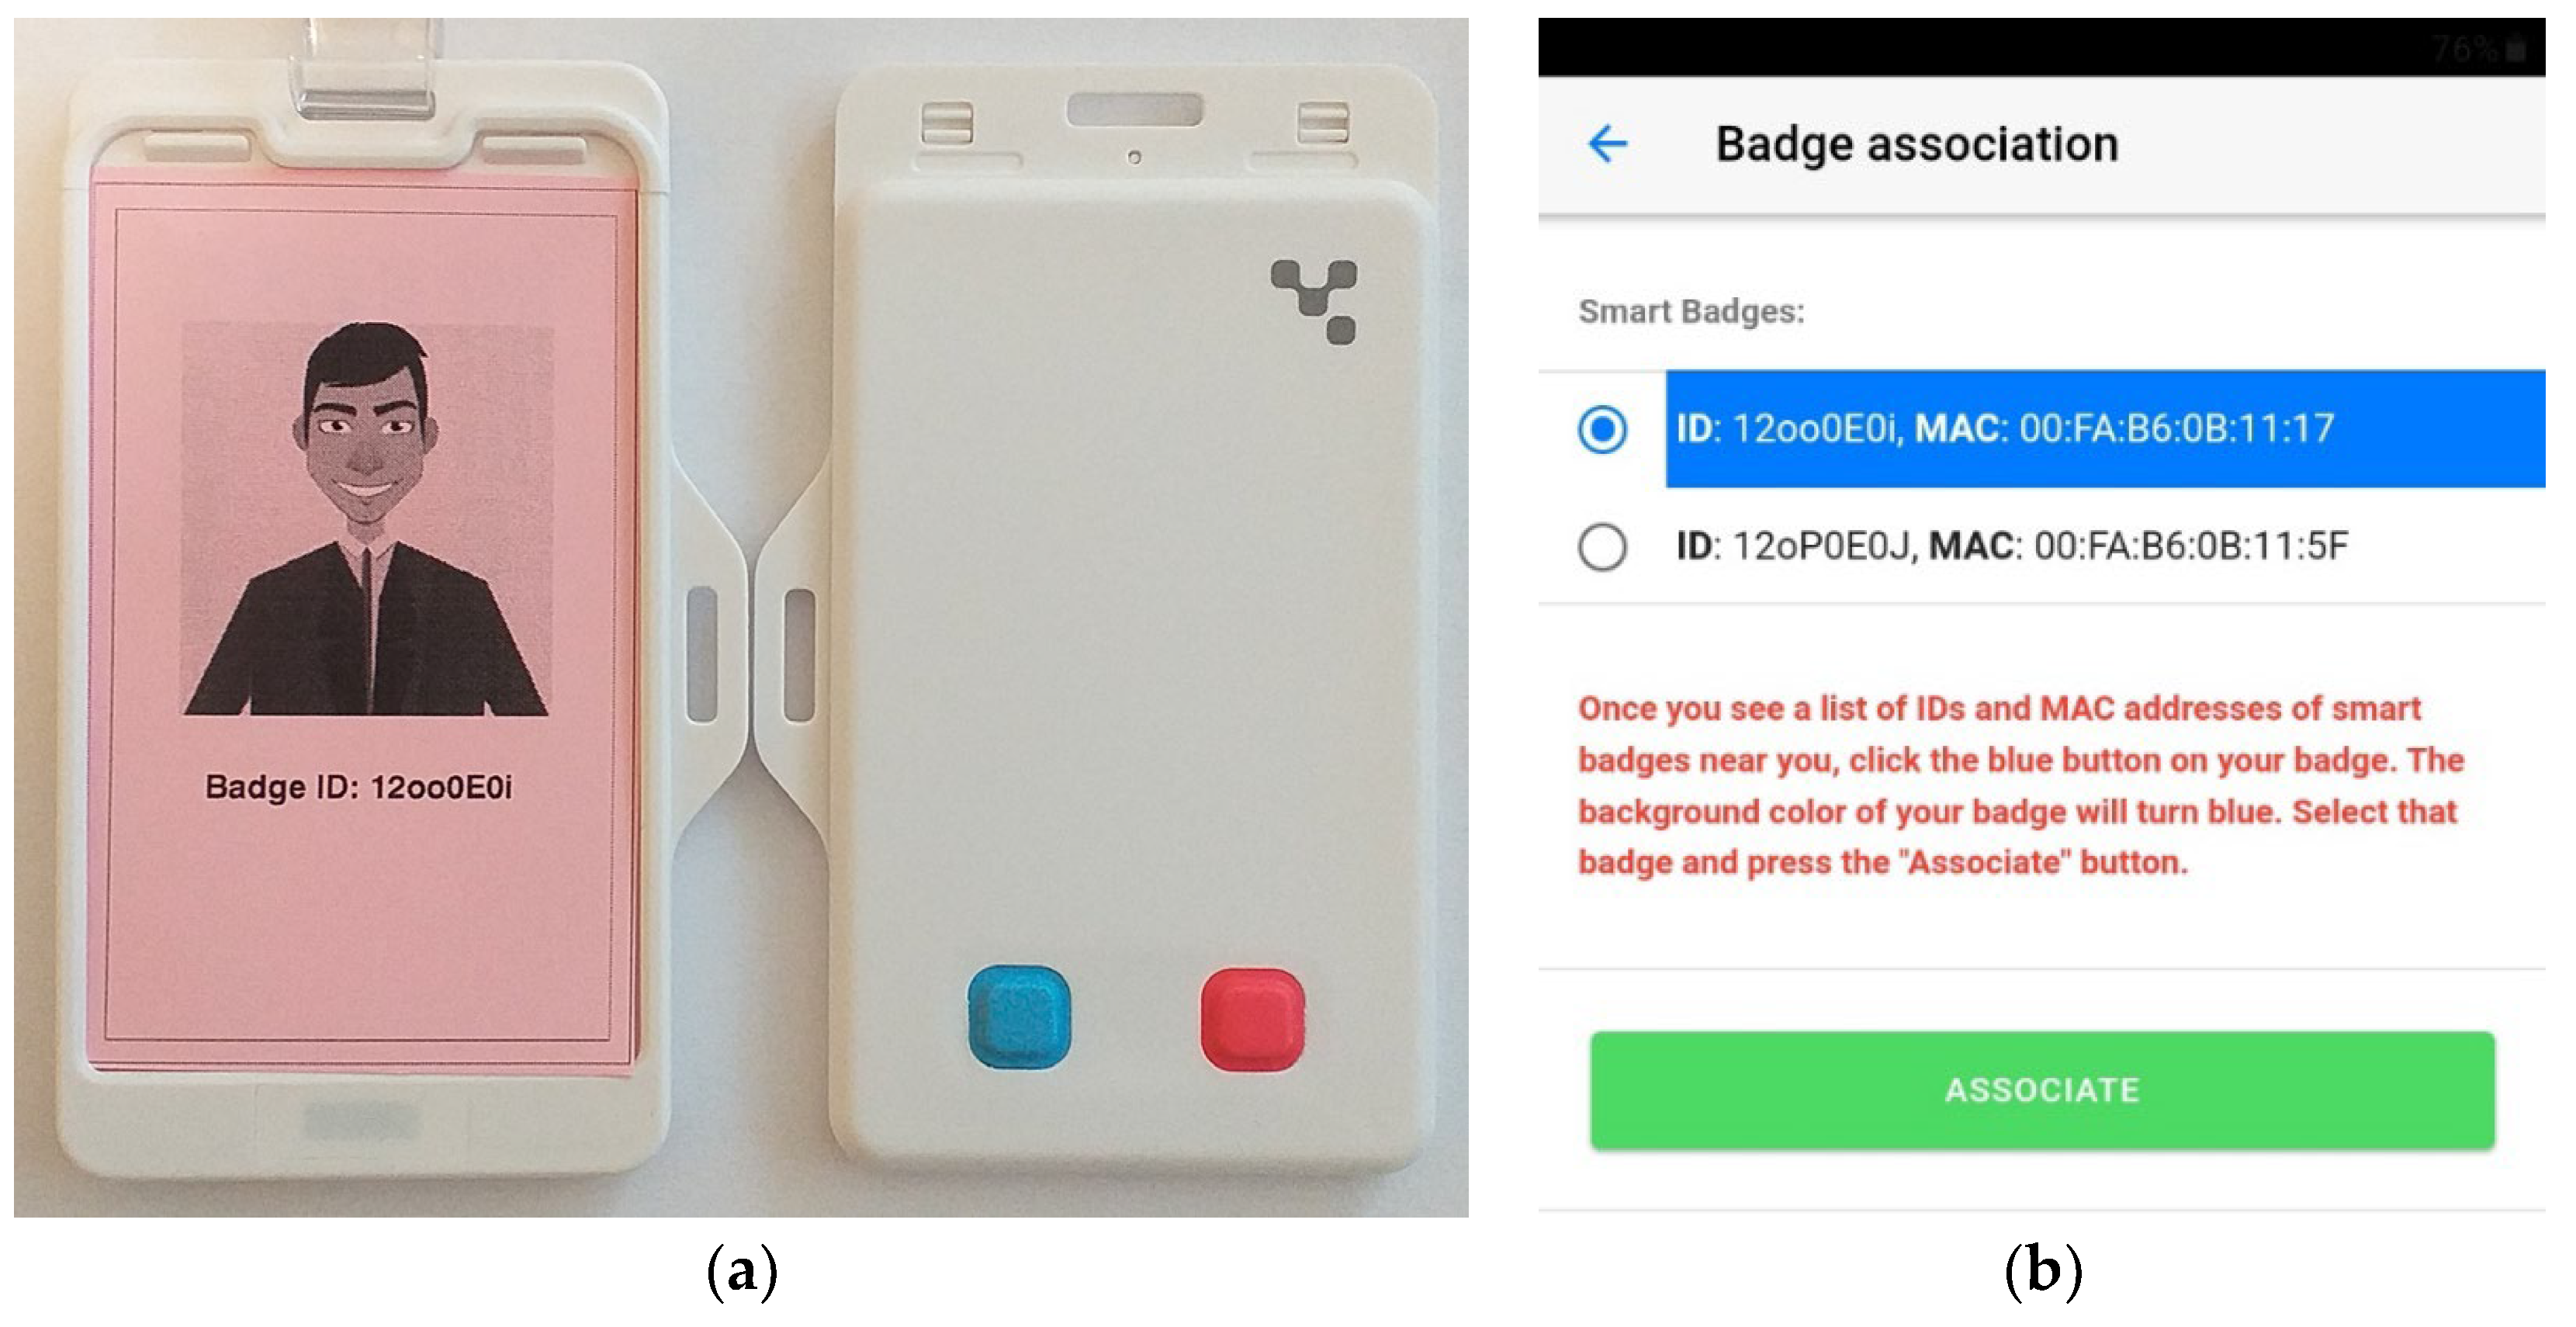
- The Badge Service manages visitor badges, which are used for access control and personalized experiences. It handles badge issuance, tracking, and associated data. It maintains the BADGES collection and includes a BADGE_VISITOR_MAPPING (B-V MAP) collection. This mapping collection is crucial for implementing proximity-based group formation, as it allows the service to quickly determine which visitors are associated with which badges at any given time. The Badge Service provides API for assigning badges to visitors and querying badge-visitor associations.
- The Exhibit Service maintains detailed information about museum exhibits, including their descriptions and attributes, ensuring that accurate and up-to-date information is available. It maintains the EXHIBITS collection, storing details about each exhibit such as its description, location, and any multimedia content associated with it. The Exhibit Service provides API for retrieving exhibit information.
- The Room Service manages data related to the museum’s physical layout, including room configurations and features. It maintains the ROOMS collection. The Room Service offers API for querying room information, which can be used in conjunction with the Visit Tracking Service to analyze visitor movement patterns.
- The Feedback Service collects and processes visitor feedback, which is crucial for assessing visitor satisfaction and making improvements to exhibits and services. It maintains the FEEDBACK collection, storing comments, ratings, and other forms of feedback provided by visitors. The Feedback Service offers APIs for submitting new feedback and retrieving existing feedback, which can be used to improve the museum experience and contribute to visitor profiling.
3.5. Methods
3.5.1. Group Profiling
3.5.2. Visitor Similarity Estimates
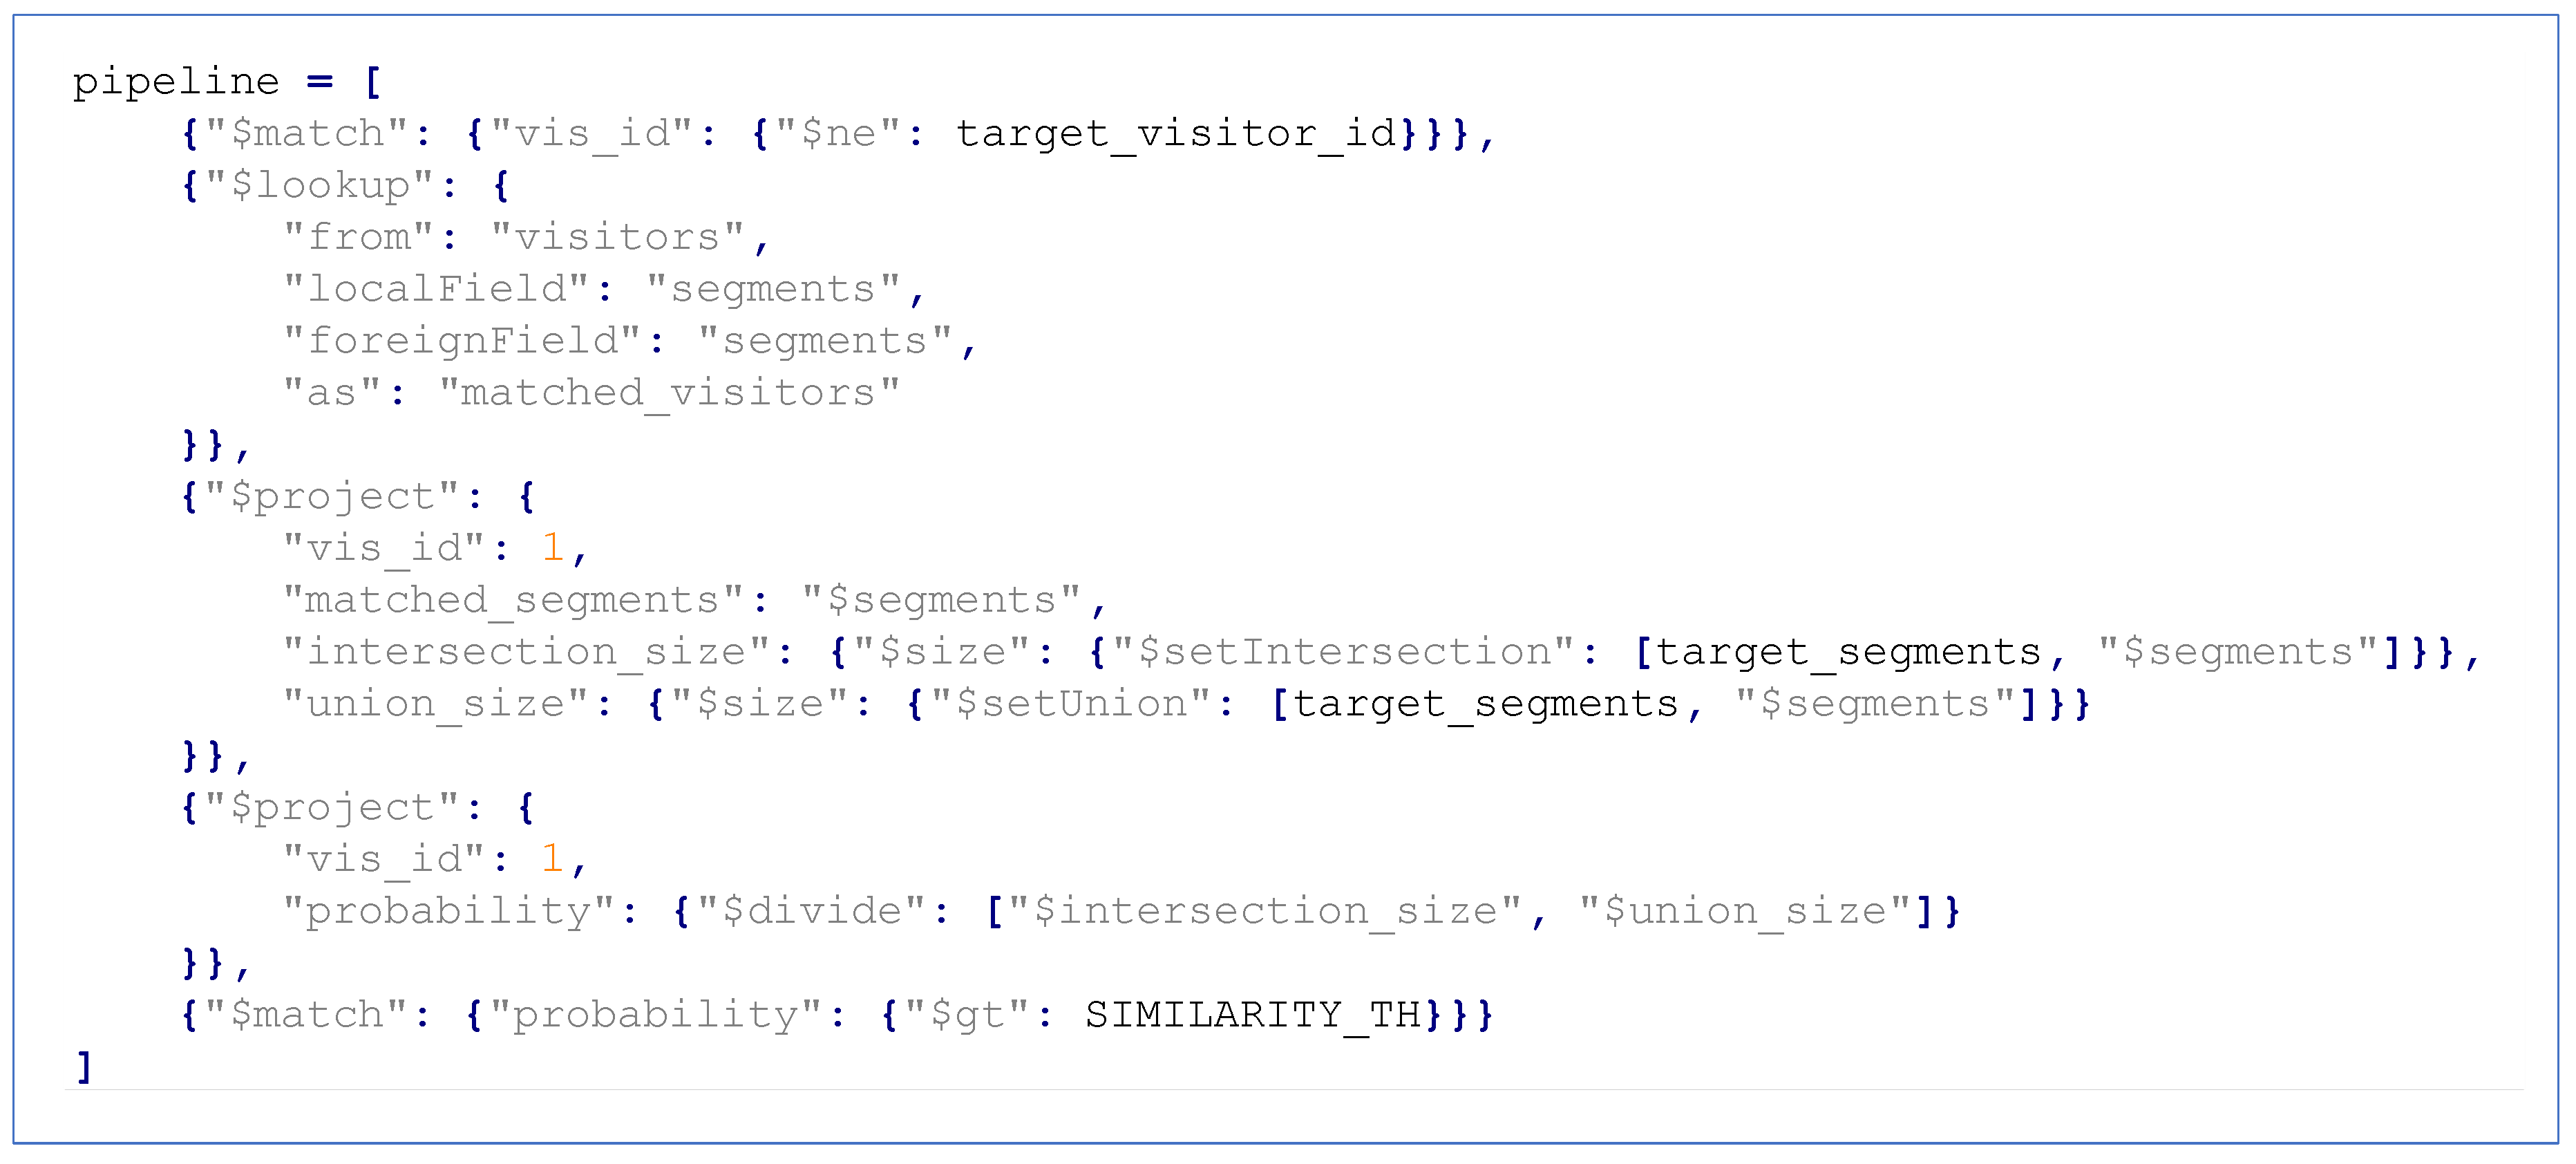
- Exhibit-Centric Strategy: This strategy starts by querying the cache to check for content related to the desired exhibit. If cached content is available, the system retrieves the identifiers of the visitors for whom this content was created. It then compares the visitor’s segments with those of the cached visitors to assess similarity. If a visitor with a sufficiently similar profile is found, the corresponding cached content is retrieved. If no similar profile is found or no cached content exists, the system will generate new content using ChatGPT.
- Profile-Centric Strategy: This strategy begins by identifying visitors in the database whose profiles resemble that of the current visitor. Once similar profiles are identified, the system checks the cache for any content related to the desired exhibit that was generated for these visitors. If relevant cached content is found, it is retrieved. If no suitable cached content is available, the system defaults to generating new content using ChatGPT.
4. Results
4.1. Mobile Application
4.2. Visitor Registration and Login
4.3. Smart Badge
4.4. Static Profiling
4.5. Dinymic Profiling
4.6. Group Profiling
5. Discussion
5.1. Key Findings
5.2. Limitations and Challenges
5.3. Future Research
5.3.1. Enhancing Localization Accuracy
5.3.2. Data Privacy and Security
5.3.3. Assessing the Impact on Visitor Experience
6. Conclusions
Funding
Data Availability Statement
Acknowledgments
Conflicts of Interest
References
- Ye, B.H.; Ye, H.; Law, R. Systematic Review of Smart Tourism Research. Sustainability 2020, 12, 3401.
- Rodney, S. The Personalization of the Museum Visit. Art Museums, Discourse, and Visitors; Routledge: London, UK, 2019.
- Fogli, D.; Arenghi, A. “Design for All” versus “One-Size-Fits-All”: The Case of Cultural Heritage. In Proceedings of the CEUR Workshop Proceedings; 2018; Vol. 2101, pp. 89–96.
- Ifraheem, S.; Rasheed, M.; Siddiqui, A. Transforming education through artificial intelligence: Personalization, engagement, and predictive analytics. J. Adv. Distrib. Syst. 2024, 13, 22. [CrossRef]
- Fernández-Hernández, R.; Vacas-Guerrero, T.; García-Muiña, F.E. Online Reputation and User Engagement as Strategic Resources of Museums. Mus. Manag. Curatorship 2021, 36, 553–568. [CrossRef]
- Purificato, E.; Boratto, L., De Luca, E. W. User Modeling and User Profiling: A Comprehensive Survey. arXiv 2024, arXiv:2402.09660.
- Eke, C.I.; Norman, A.A.; Shuib, L.; Nweke, H.F. A Survey of User Profiling: State-of-the-Art, Challenges, and Solutions. IEEE Access 2019, 7, 144907–144924. [CrossRef]
- Mokatren, M.; Wecker, A.; Bogina, V.; Kuflik, T. A Museum Visitors Classification Based on Behavioral and Demographic Features. In Proceedings of the ACM UMAP 2019 Adjunct - Adjunct Publication of the 27th Conference on User Modeling, Adaptation and Personalization; 2019; pp. 383–386.
- Hijazi, A.N.; Baharin, H. The Effectiveness of Digital Technologies Used for the Visitor’s Experience in Digital Museums. A Systematic Literature Review from the Last Two Decades. Int. J. Interact. Mob. Technol. 2022, 16, 142–159. [CrossRef]
- Li, J.; Wider, W.; Ochiai, Y.; Fauzi, M.A. A Bibliometric Analysis of Immersive Technology in Museum Exhibitions: Exploring User Experience. Front. Virtual Real. 2023, 4. [CrossRef]
- Saihood, G. S. W.; Haddad, A. T. H.; & Eyada, F. Personalized experiences within heritage buildings: Leveraging AI for enhanced visitor engagement. In Proceedings of the 2023 International Conference on Data Science and Engineering (DeSE); 2023; 10468984. [CrossRef]
- Wu, W., Ghazali, M., & Huspi, S. H. A Review of User Profiling Based on Social Networks. IEEE Access 2024. [CrossRef]
- Yoshimura, Y.; Sinatra, R.; Krebs, A.; Ratti, C. Analysis of Visitors’ Mobility Patterns through Random Walk in the Louvre Museum. J. Ambient Intell. Humaniz. Comput. 2024, 15, 1643–1658. [CrossRef]
- Centorrino, P.; Corbetta, A.; Cristiani, E.; Onofri, E. Managing Crowded Museums: Visitors Flow Measurement, Analysis, Modeling, and Optimization. J. Comput. Sci. 2021, 53. [CrossRef]
- Brida, J.G.; Meleddu, M.; Pulina, M. Understanding Museum Visitors’ Experience: A Comparative Study. J. Cult. Herit. Manag. Sustain. Dev. 2016, 6, 47–71. [CrossRef]
- Gupta, R.; Dubey, A. K. ANALYSING DEMOGRAPHIC TRENDS AND VISITORS’ SATISFACTION AT THE NATIONAL MUSEUM, DELHI. PUSA J. Hosp. Appl. Sci. 2024, 10, 8–18.
- Kuflik, T.; Wecker, A.J.; Lanir, J.; Stock, O. An Integrative Framework for Extending the Boundaries of the Museum Visit Experience: Linking the Pre, during and Post Visit Phases. Inf. Technol. Tour. 2015, 15, 17–47. [CrossRef]
- Antoniou, A.; Katifori, A.; Roussou, M.; Vayanou, M.; Karvounis, M.; Kyriakidi, M.; Pujol-Tost, L. Capturing the Visitor Profile for a Personalized Mobile Museum Experience: An Indirect Approach. In Proceedings of the CEUR Workshop Proceedings; 2016.
- Gargiulo, R.; Carignani, F. Novel Approaches in Profiling in Museums. In Handbook of Research on Museum Management in the Digital Era; 2022; pp. 228–247.
- Taormina, F.; Baraldi, S.B. Museums and Digital Technology: A Literature Review on Organizational Issues. In Rethinking Culture and Creativity in the Digital Transformation; 2023; pp. 69–87.
- Verde, D.; Romero, L.; Faria, P.M.; Paiva, S. Indoor Content Delivery Solution for a Museum Based on BLE Beacons. Sensors 2023, 23. [CrossRef]
- Spachos, P.; Plataniotis, K.N. BLE Beacons for Indoor Positioning at an Interactive IoT-Based Smart Museum. IEEE Syst. J. 2020, 14, 3483–3493; [CrossRef]
- Chianese, A.; Piccialli, F. Designing a Smart Museum: When Cultural Heritage Joins IoT. In Proceedings of the Proceedings - 2014 8th International Conference on Next Generation Mobile Applications, Services and Technologies, NGMAST 2014; 2014; pp. 300–306.
- Mohamed, S.; Sethom, K.; Namoun, A.; Tufail, A.; Kim, K.H.; Almoamari, H. Customer Profiling Using Internet of Things Based Recommendations. Sustainability 2022, 14. [CrossRef]
- Arvaniti-Bofili, M.; Gkouskos, S.; Kalampokis, K.; Papaioannou, G.; Gogolos, G.; Chaldeakis, I.; Petridis, K.; Magoutis, K. Towards Personalized Recommendations in an IoT-Driven Tour Guide Platform. In Proceedings of the Communications in Computer and Information Science; 2020; Vol. 1310, pp. 3–11.
- Ronco, F. Smart technologies in the museum environment: AR experiments on physical models at the Museum of Oriental Art in Turin. In Proceedings of the 2024 Conference on Human-Computer Interaction in Museums; 2024; 17472.
- Sepe, F.; Marzullo, M. Making Smarter Museums Through New Technologies. In Handbook of Research on Museum Management in the Digital Era; 2022; pp. 75–98.
- Carolis, B. D., Macchiarulo, N., Bochicchio, M. A. AI-assisted virtual reality for cultural heritage education: The experience of the MARTA Museum. In Proceedings of the 2023 IEEE Conference on Experimental Technology and Digital Humanities; 2023.
- Ferrato, A.; Limongelli, C.; Mezzini, M.; Sansonetti, G. Using Deep Learning for Collecting Data about Museum Visitor Behavior. Appl. Sci. 2022, 12. [CrossRef]
- Yan, T. Research and application of AI-based interactive exhibits in Wuhan Museum of Science and Technology. J. Educ. Res. Appl. 2024, 8, 6091.
- Blud, L.M. Social Interaction and Learning among Family Groups Visiting a Museum. Mus. Manag. Curatorship 1990, 9, 43–51. [CrossRef]
- Tolmie, P.; Benford, S.; Greenhalgh, C.; Rodden, T.; Reeves, S. Supporting Group Interaction in Museum Visiting. In Proceedings of the Proceedings of the ACM Conference on Computer Supported Cooperative Work, CSCW; 2014; pp. 1049–1059.
- Shaby, N.; Assaraf, O.B.Z.; Koch, N.P. Students’ Interactions During Laboratory Group Activity in a Science Museum. Int. J. Sci. Math. Educ. 2024, 22, 703–720. [CrossRef]
- Fosh, L.; Lorenz, K.; Benford, S.; Koleva, B. Personal and social? Designing personalized experiences for groups in museums. MW2015: Museums and the Web 2015. MW2015: Museums and the Web 2015, Chicago, IL.
- Massarani, L.; Norberto Rocha, J.; Scalfi, G.; Silveira, Y.; Cruz, W.; Lage dos Santos Guedes, L. Families Visit the Museum: A Study on Family Interactions and Conversations at the Museum of the Universe – Rio de Janeiro (Brazil). Front. Educ. 2021, 6. [CrossRef]
- Tsiropoulou, E.E.; Thanou, A.; Paruchuri, S.T.; Papavassiliou, S. Self-Organizing Museum Visitor Communities: A Participatory Action Research Based Approach. In Proceedings of the Proceedings - 12th International Workshop on Semantic and Social Media Adaptation and Personalization, SMAP 2017; 2017; pp. 101–105.
- Stryker Co., Vocera V-Series Smartbadge User Guide, Available online: https://pubs.vocera.com/device/vseries/production/docs/vseries_v5000_user_guide.pdf (accessed on 14 August 2024).
- Abeeway Co., Datasheet DEABE3XX v1.7, Available online: https://www.abeeway.com/wp-content/uploads/2021/03/Abeeway_Badge-data-sheet_14.pdf (accessed on 14 August 2024).
- Kontakt.io Inc., Smart Badge technical specification, Available online: https://kontakt.io/app/uploads/2023/11/Technical-Specifications-Smart-Badge.pdf (accessed on 14 August 2024).
- Caneschi, F.; Ammendola, G. Pin: A smart wearable badge to track and augment your museum experience. Museo Marino Marini; 2019, pp. 1–16.
- Park, G.; Oh, H.; Lim, B.C.; Khoo, B.L.Z. Can Smart Technology Make Group Members More Creative? The Effect of Interactive Feedback Using Sociometric Badges on Members’ Creativity. Behav. Inf. Technol. 2023, 42, 2452–2466. [CrossRef]
- De Jode, M.; Hudson-Smith, A.; Mavros, P.; Coulton, P.; Huck, J.; Roberts, J.; Powell, P. Showing Mutual Support through Digital Empathy Badges. In Proceedings of the UbiComp and ISWC 2015 - Proceedings of the 2015 ACM International Joint Conference on Pervasive and Ubiquitous Computing and the Proceedings of the 2015 ACM International Symposium on Wearable Computers; 2015; pp. 1–4.
- Su, C.M.; Shi, C.Y.; Wu, Y.L.; Lee, H.C. Demo Abstract: A LoRa Wireless Smart Badge for Enhancing Museum Visitors’ Experience. In Proceedings of the Proceedings - 2017 16th ACM/IEEE International Conference on Information Processing in Sensor Networks, IPSN 2017; 2017; pp. 261–262.
- Ivanov, R. ExhibitXplorer: Enabling Personalized Content Delivery in Museums Using Contextual Geofencing and Artificial Intelligence. ISPRS Int. J. Geo-Inf. 2023, 12. [CrossRef]
- Harisha, A.; Salian, L.; Yermal, A.; Shastry, C.G.A. Open Standard Authorization Protocol: OAuth 2.0 Defenses and Working Using Digital Signatures. In Advancements in Cybercrime Investigation and Digital Forensics; 2023; pp. 319–344 ISBN 9781000840834.
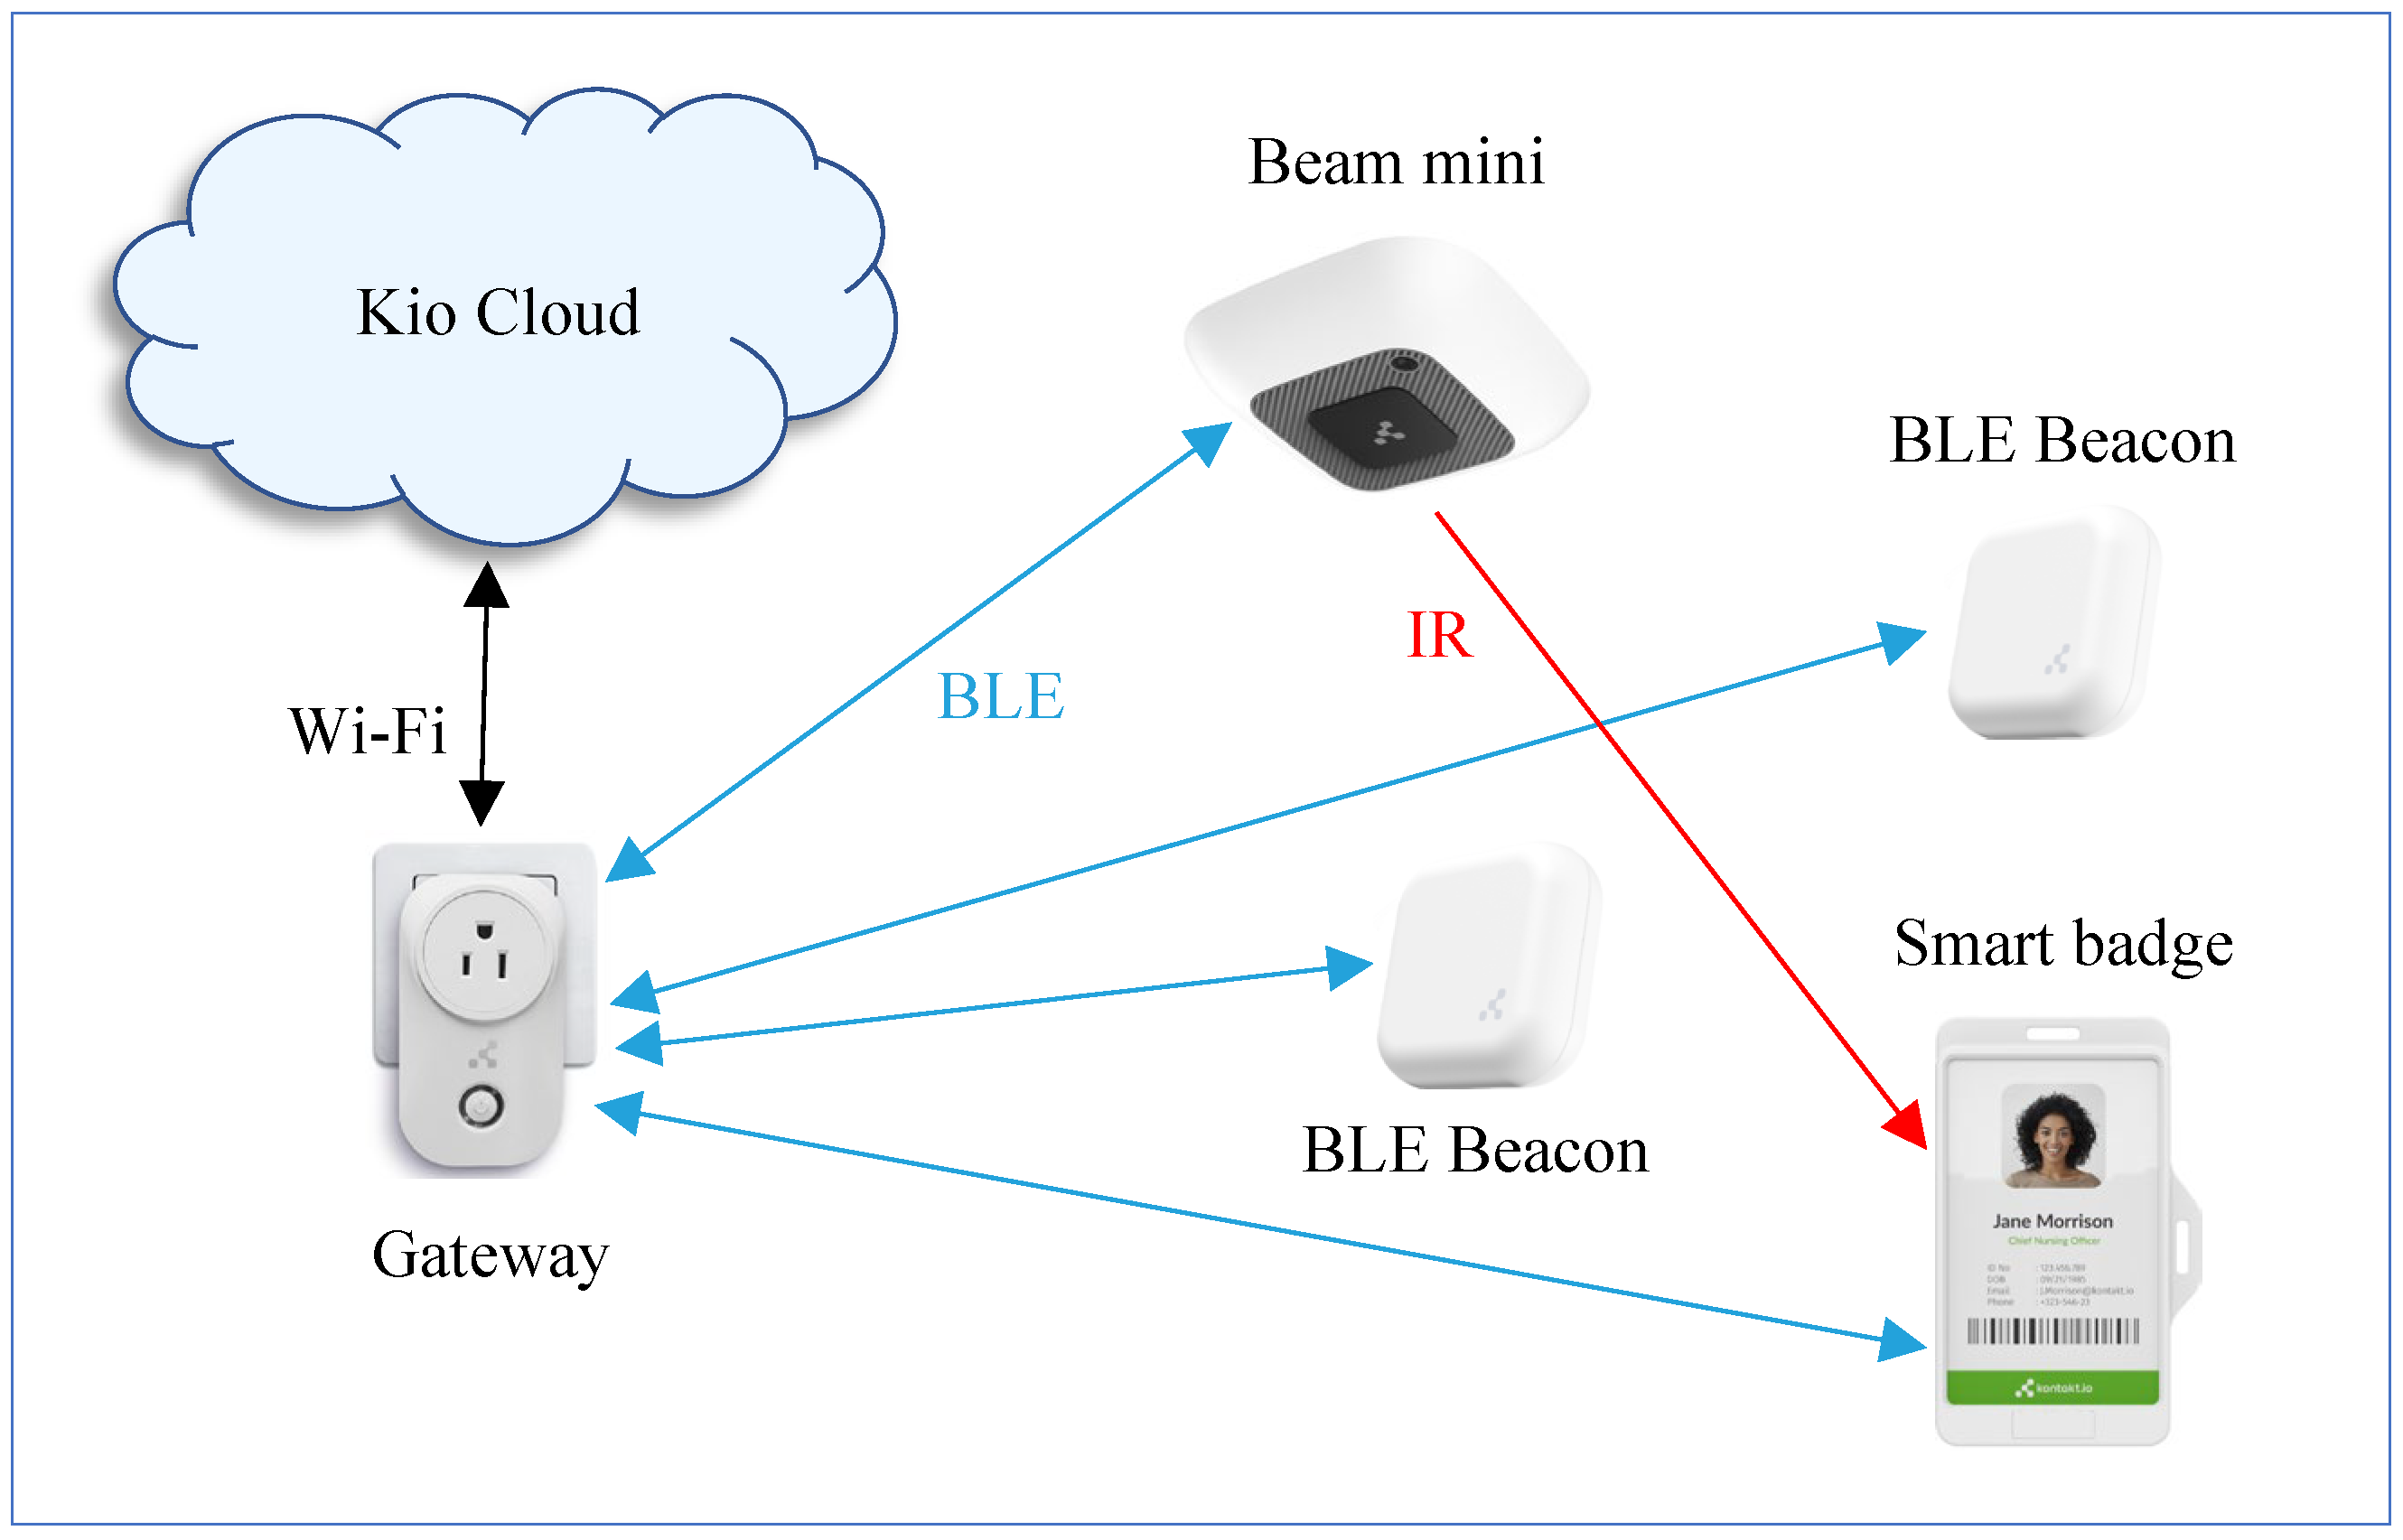
| Config parameter | Management |
|---|---|
| Telemetry packets | Enabled, Interval=1500ms |
| Location packets | Enabled, Interval=1500ms |
| Secure Profile packet | Disabled |
| TX Power Level for all packets | 5 (-4dBm) |
| iBeacon packets | Disabled |
| Eddystone packets (all types) | Disabled |
| Smart Badge Power on/off | Enabled |
| Power Saving Mode | Enabled, Working Hours |
| Button Events | Enabled |
Disclaimer/Publisher’s Note: The statements, opinions and data contained in all publications are solely those of the individual author(s) and contributor(s) and not of MDPI and/or the editor(s). MDPI and/or the editor(s) disclaim responsibility for any injury to people or property resulting from any ideas, methods, instructions or products referred to in the content. |
© 2024 by the authors. Licensee MDPI, Basel, Switzerland. This article is an open access article distributed under the terms and conditions of the Creative Commons Attribution (CC BY) license (http://creativecommons.org/licenses/by/4.0/).


