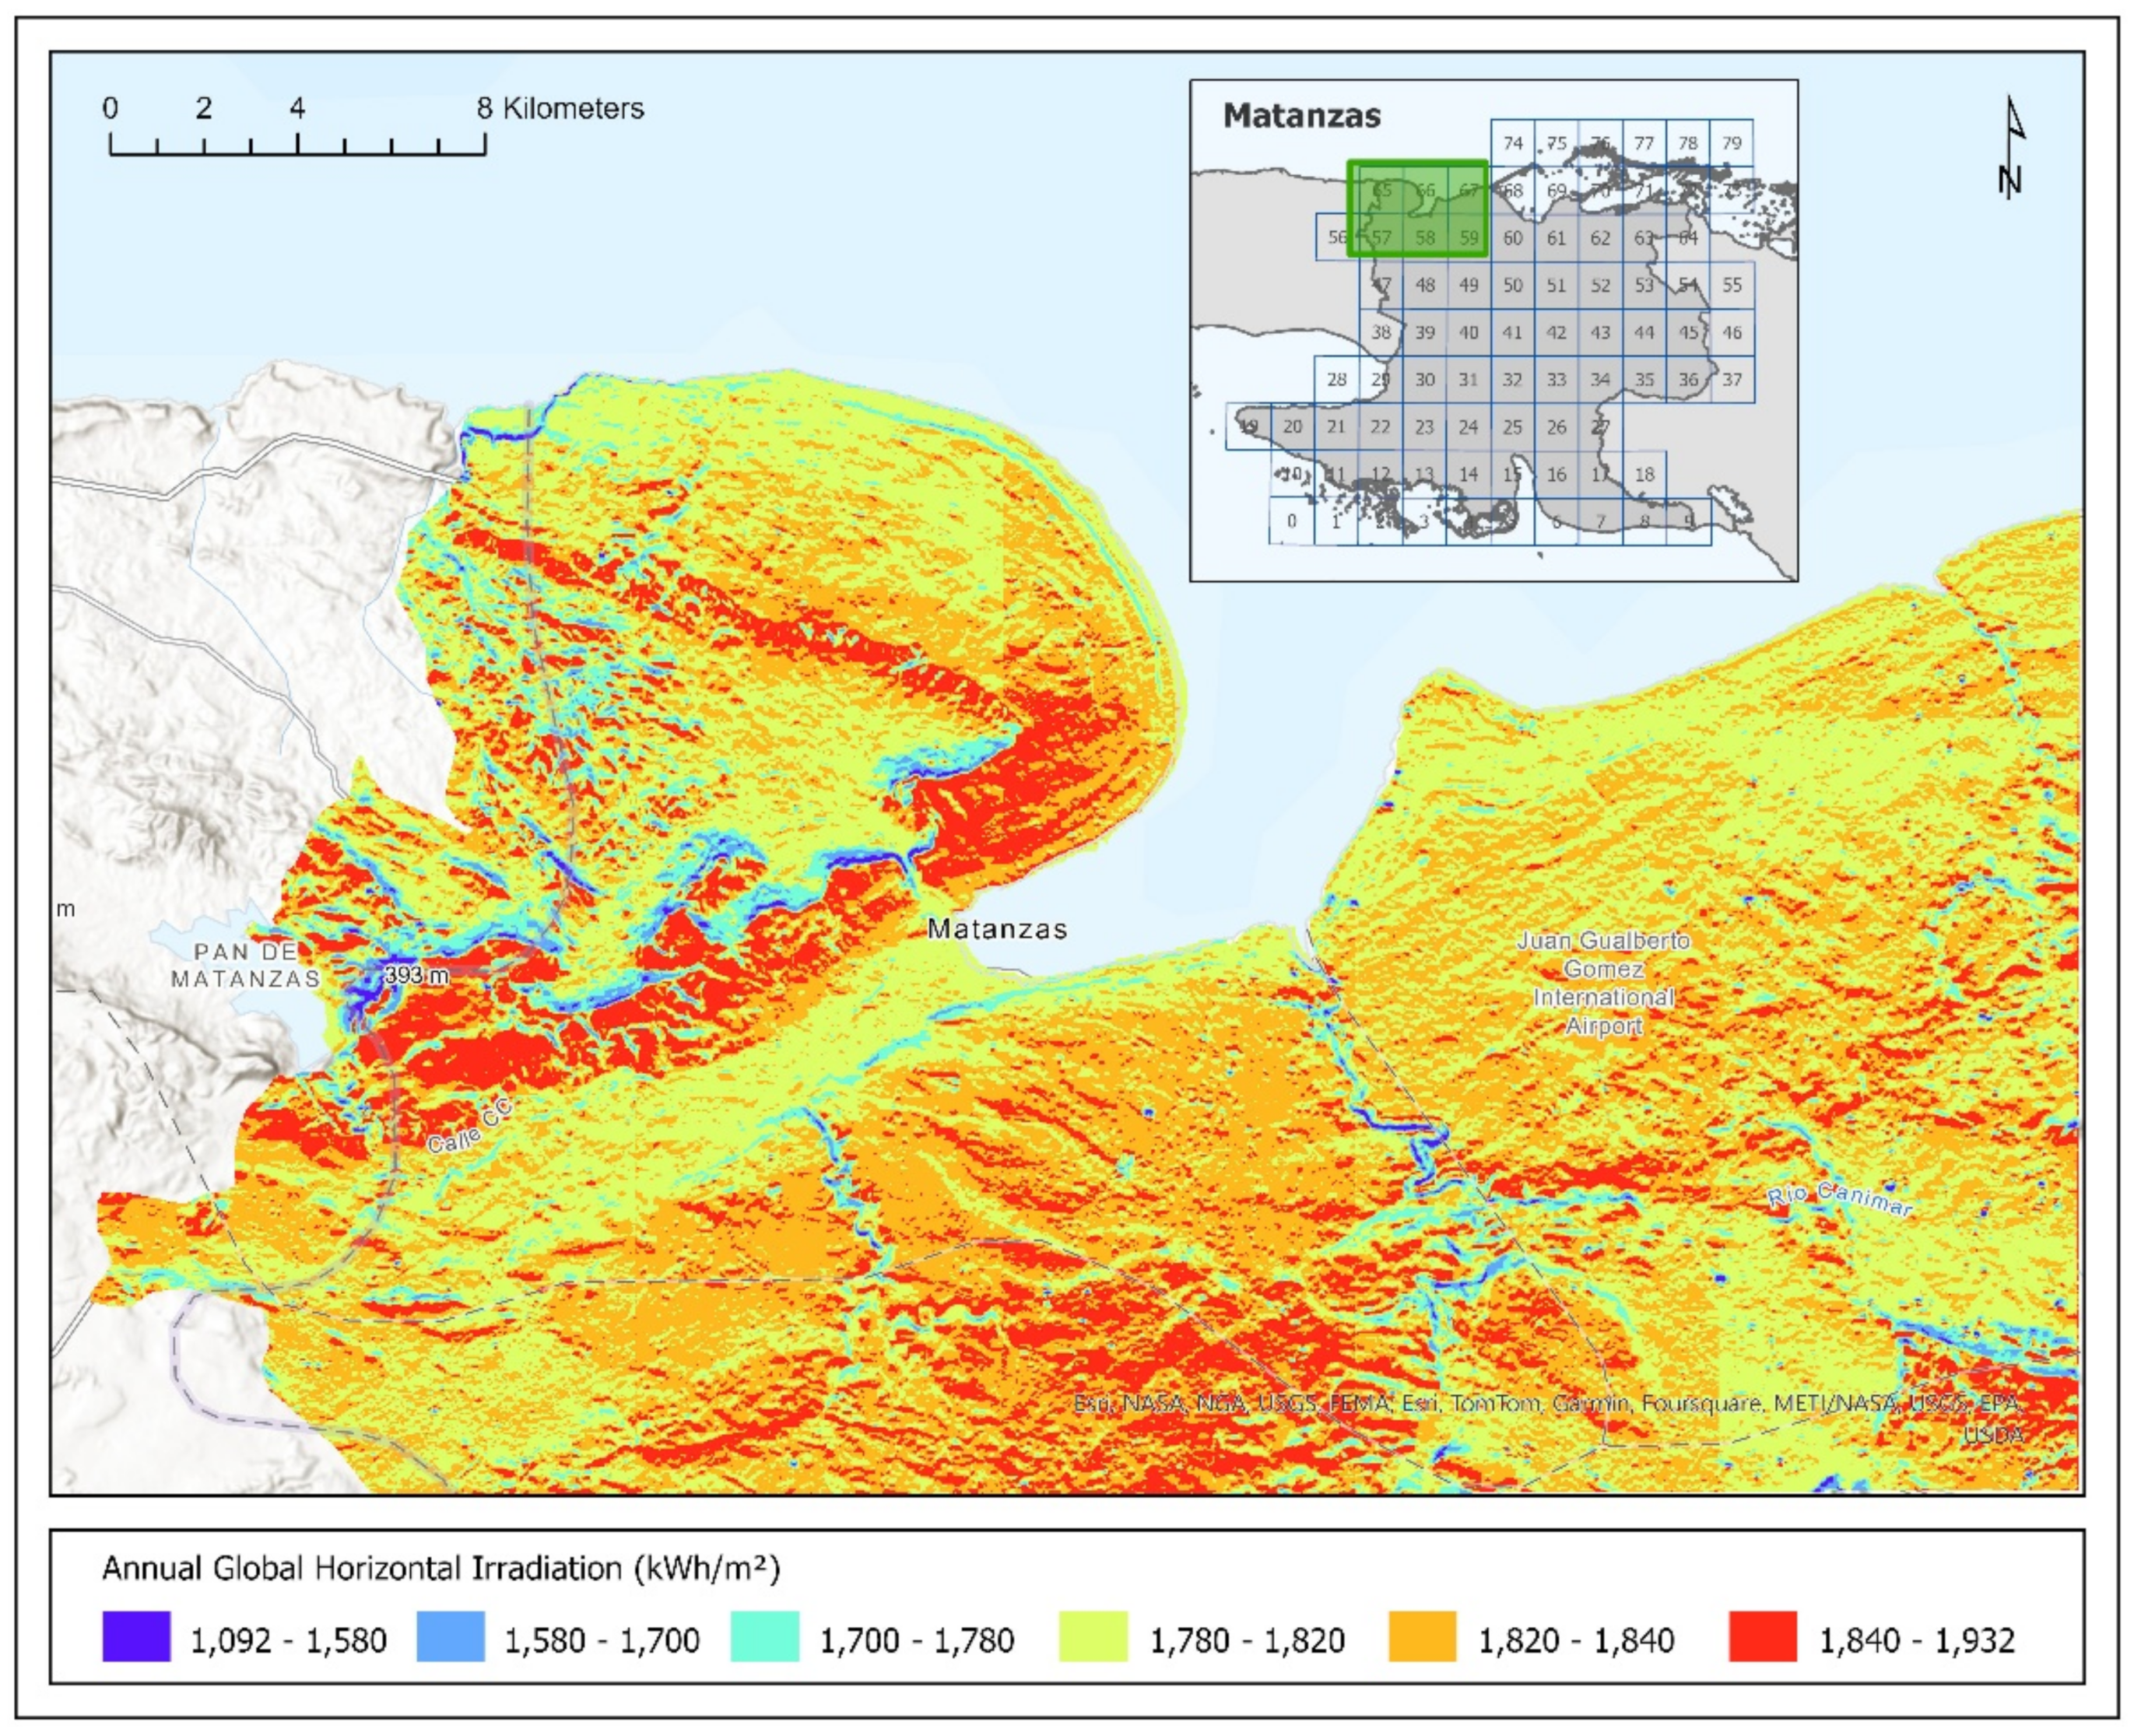
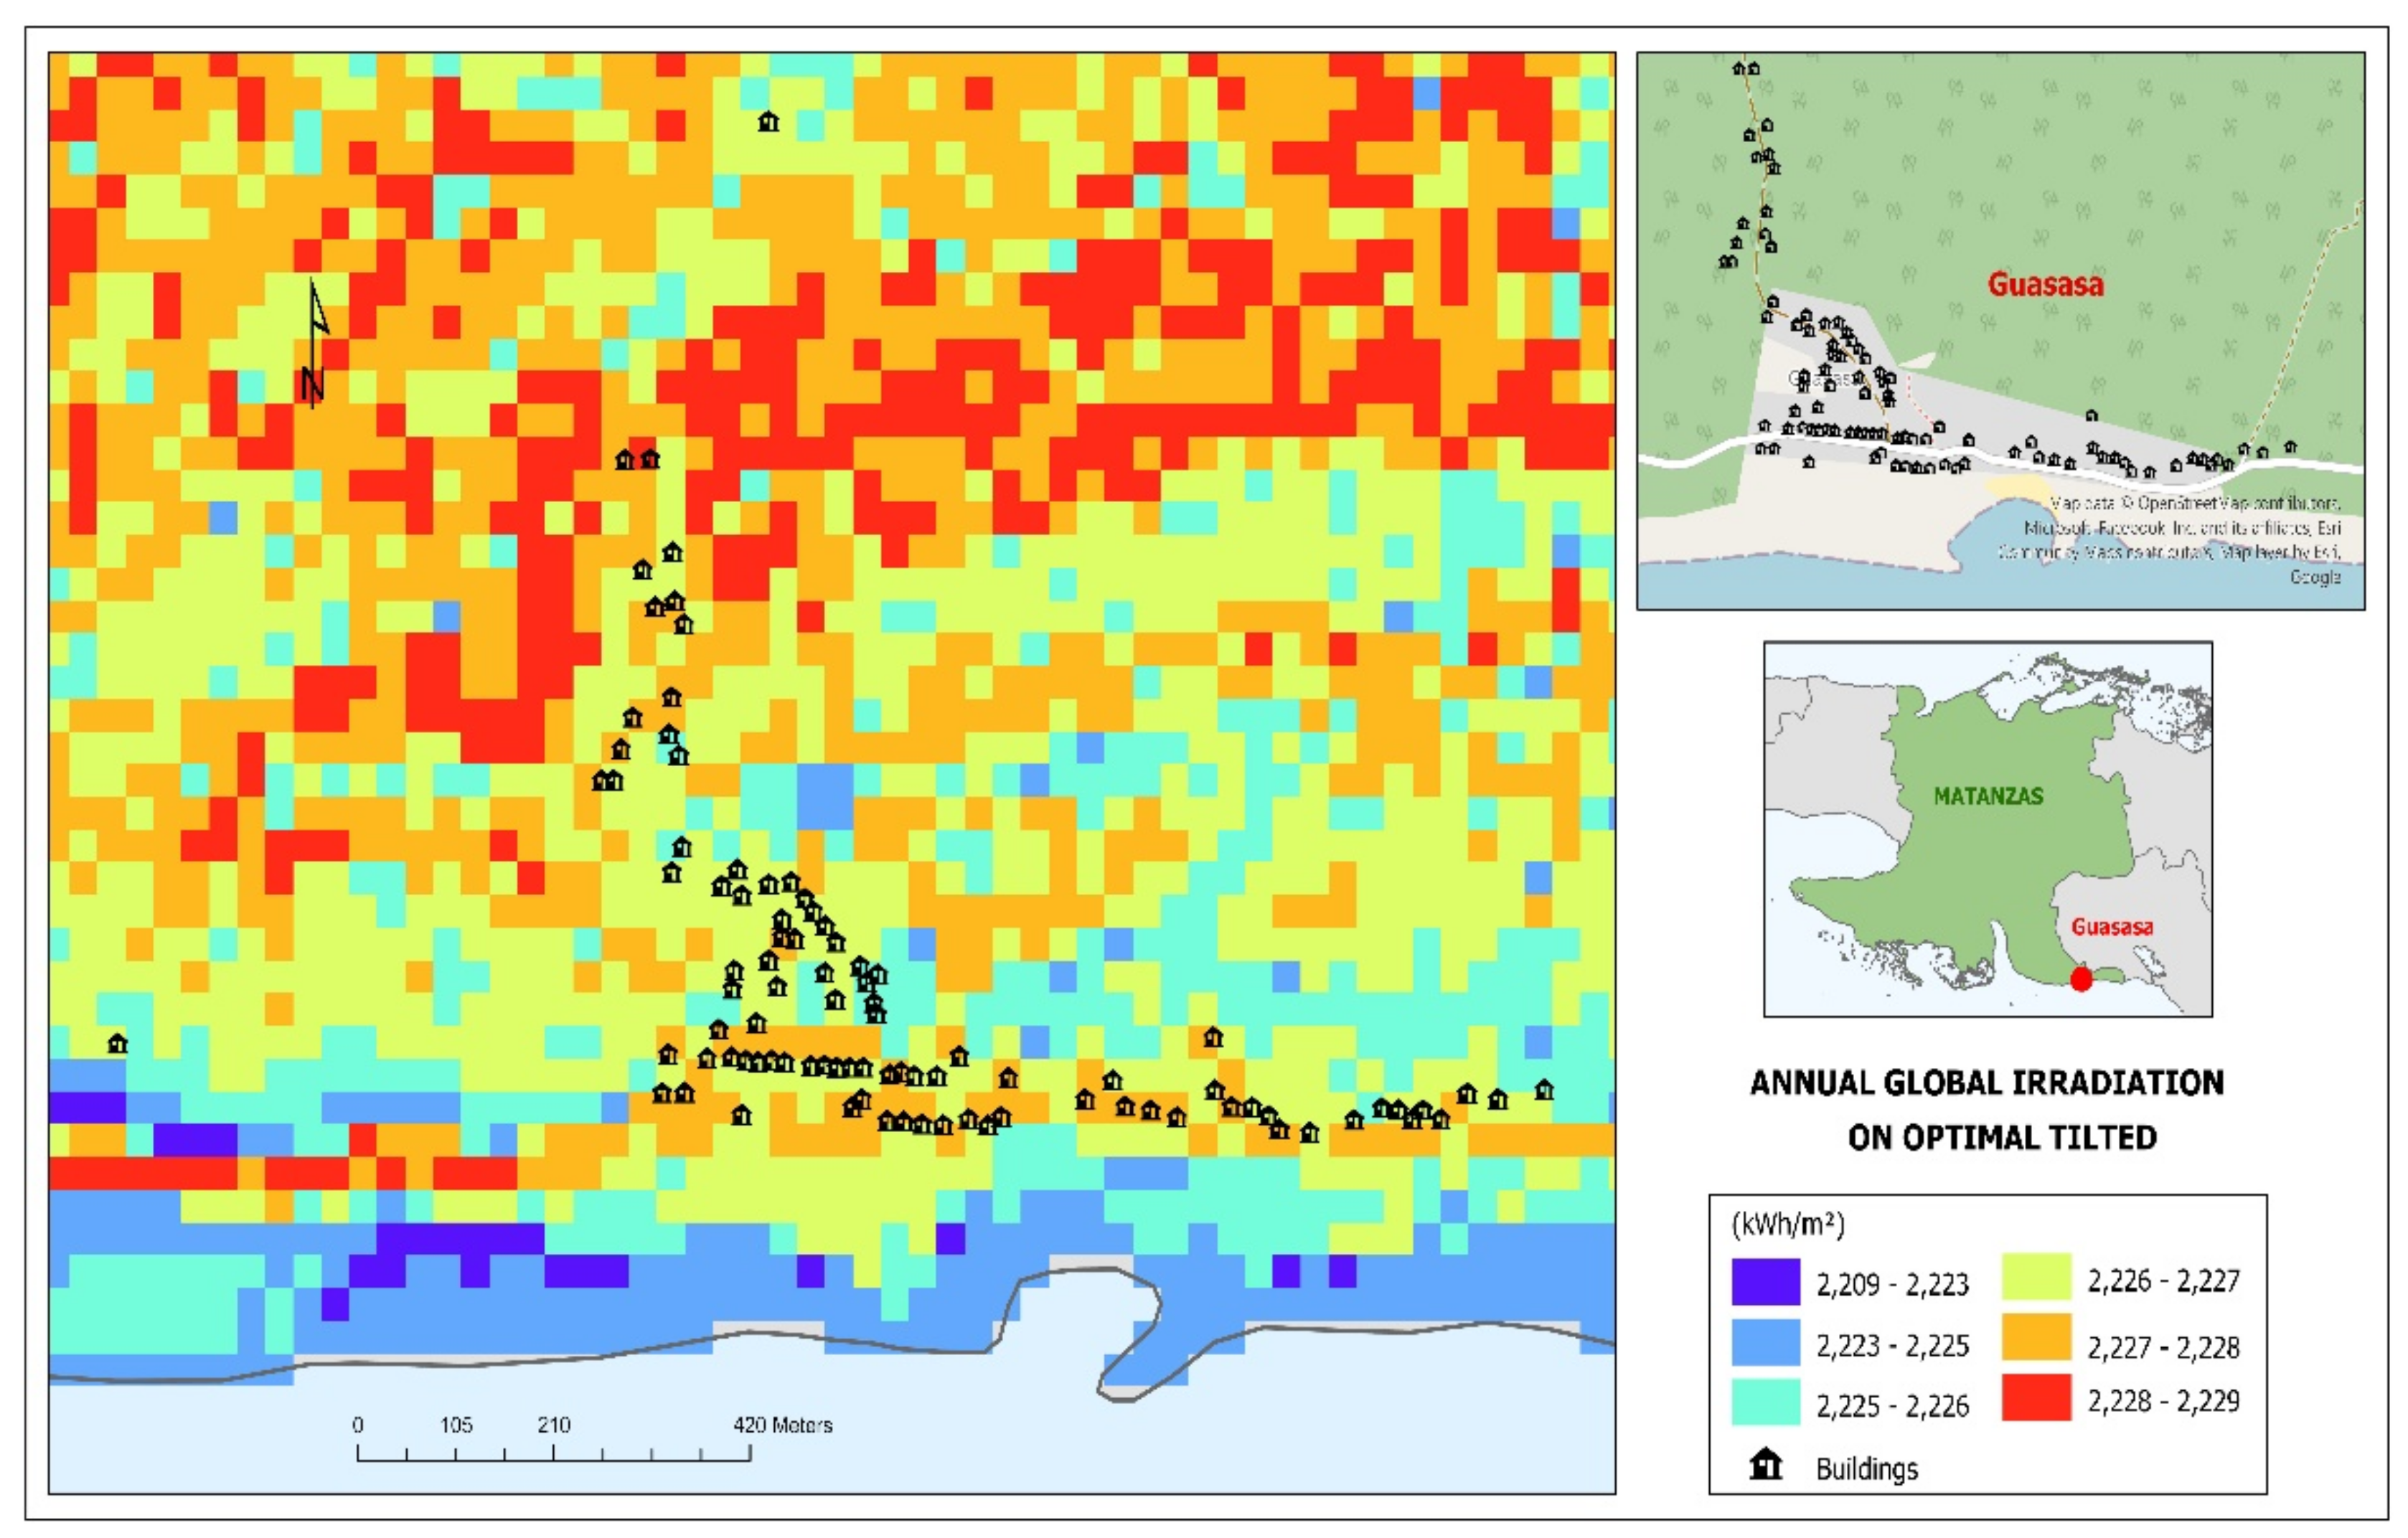
The first key outcome of this study is the successful application of the methodology outlined in the previous section. This approach demonstrates how enhanced accuracy can be achieved through the effective combination of a tessellation procedure with a specific parameterization. This parameterization is derived from an external database, in this case, solar radiation data sourced from ArcGIS.
Secondly, we present two comparative maps illustrating the cartographic outcomes of our methodology. The first map displays solar radiation data for the entire province, showcasing a large geographical area typically not analyzed with such high resolution. This territory possesses significant potential for solar energy utilization due to its specific characteristics. The second map focuses on the detailed analysis of a smaller locality, Guasasa. This area was selected because it lies outside the established electricity grid and represents a promising candidate for autonomous electrification using renewable energy sources.
3.1. Validation and corrections of diffuse proportion and clearness index
The values of KT and KD need to be validated before being used as clearness index and diffuse proportion input for the execution of Area Solar Radiation. An effective method to validate these parameters is to run the solar radiation calculation and compare the outputs with the results provided by Meteonorm, which represents a reliable source, according to the previous section.
For this task
Point Solar Radiation is an ArcGIS tool [
56] belonging to the same
Spatial Analyst extension as
Area Solar Radiation. The required input parameters and the equations used are the same for both, except the location where the calculation is run:
Point Solar Radiation derives incoming solar radiation for specific locations that can be loaded in the format of point feature class or table of point coordinates. This implies short calculation time and allows to compare directly the results with the expected values.
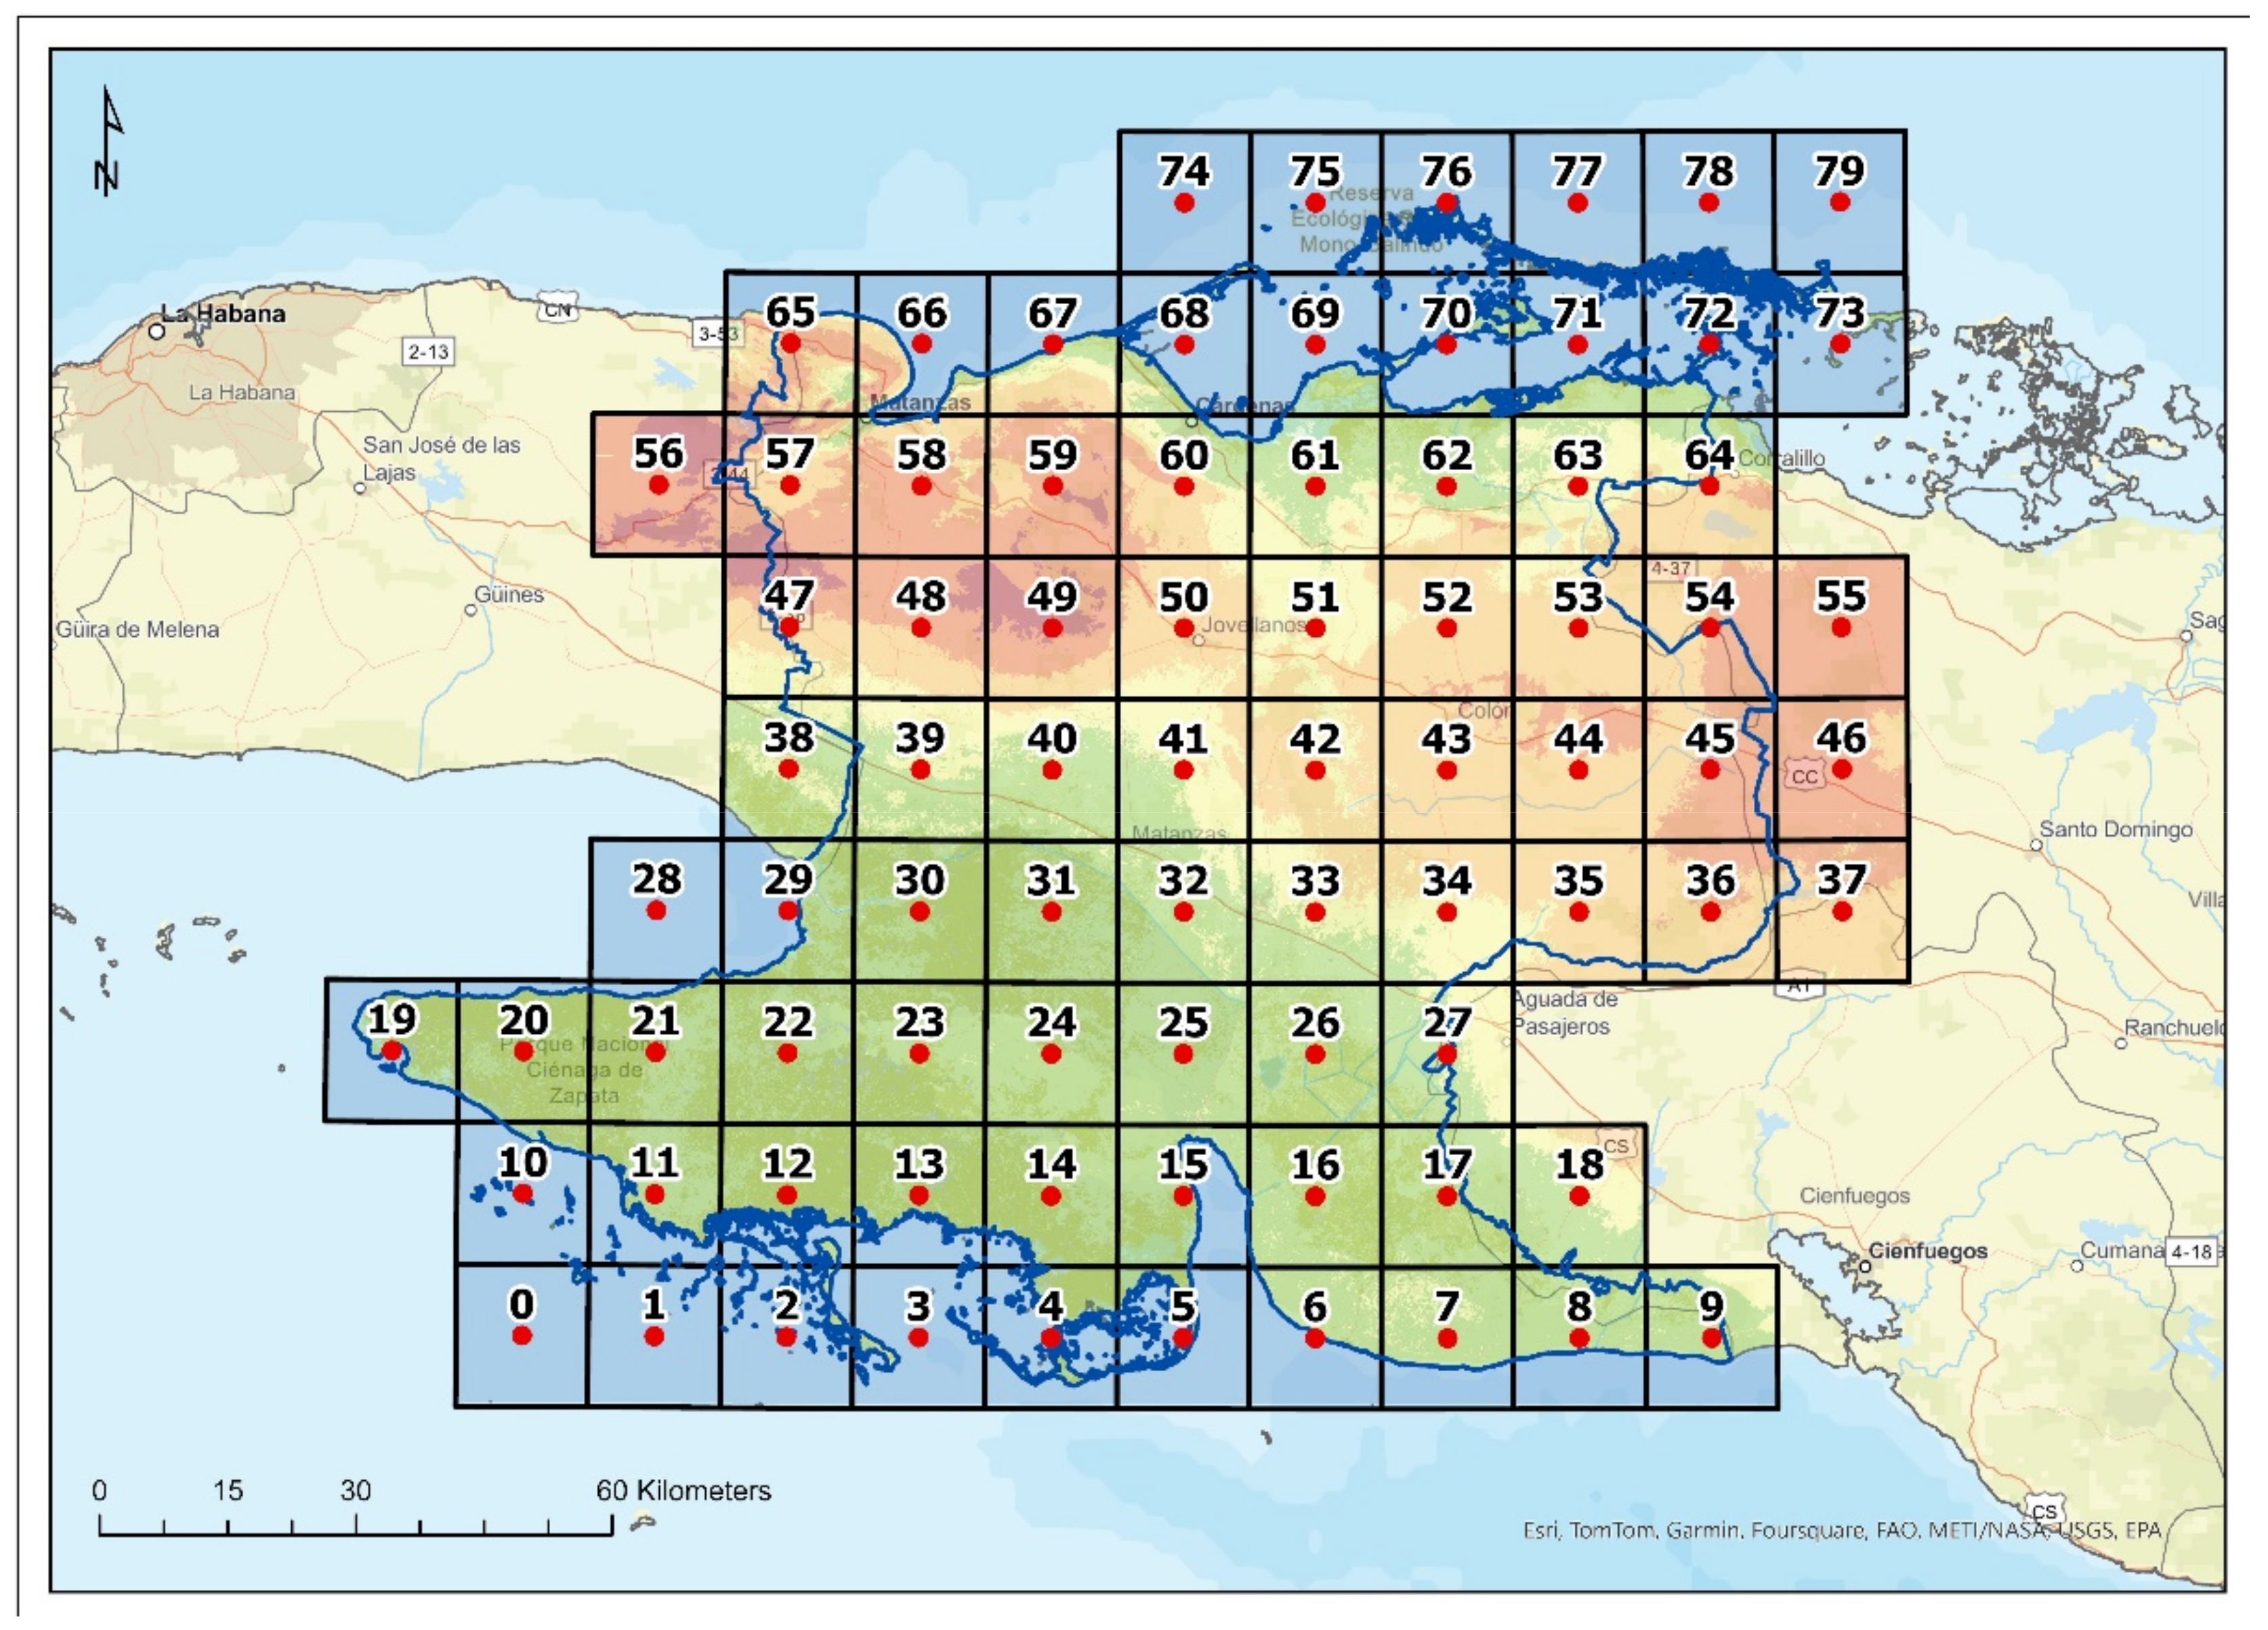
Like in Meteonorm calculation, the centroid coordinates of each of the 80 zones is set as input location for a Point Solar Radiation calculation. At this point, the main issue is the necessity of running a calculation with multiple input setting with a tool which only allows to set a unique value of clearness index and diffuse proportion.
The problem can be solved implementing a Python script that cyclically executes for the 80 grid central points, the function Point Solar Radiation from the “arcpy” environment. The script is run for every month of the year and sequentially load the DEM raster file of the zone in which the point is located, its latitude and the monthly KT and KD values. Once calculated the monthly global, direct and diffuse radiation for each of the 80 points, the outputs are merged into three single files.
The output radiation generated by the script execution differs significantly from the value estimated by Meteonorm. The monthly mean error, calculated as a percentage of the Meteonorm values and averaged for all the 80 study areas, is presented in
Table 2 separating global (err% glob), direct (err% dir) and diffuse (err% diff) radiation.
As can be noticed in Eq. 4, the calculation of direct radiation depends on a fixed solar constant, without taking into account how the Earth’s orbital eccentricity influences the incoming irradiance. Considering the effect of the Sun distance variability over the year (Eq. 13) represents a first correction factor to reduce the error. Using the equations [
40,
45] to calculate the extraterrestrial normal radiation
I0,n:
Taking into account that for each month we must use the middle day of every month as
n input value in Eq. 14. Accounting the eccentricity effect on direct radiation direct results to have an effect of mitigation of the error as can be seen in
Table 3:
A correction of the input values of clearness index and diffuse proportion is still needed to minimize the discrepancy and achieve a better accuracy. The clearness index input required by the ArcGIS tool refers to a condition of zero altitude, while the calculated KT refers to the actual conditions of the respective sites. An average error was therefore predictable. However, the existing heterogeneity across the different areas reflects a good approximation of the variability due to weather conditions forecast. Applying the same correction factor to every area, such variability accuracy is preserved.
A first step is focused on minimizing the percentage error of direct radiation. The
KT values have been modified with a per cent variation of ±5% and different execution of the script have been done, investigating the modified
KT which produces the most accurate direct radiation output (in comparison to Meteonorm values) for each month. In
Table 4, the errors of the outputs produced by using
KT,mod and
KD as input of the calculation, where
KT,mod is the clearness index value, which minimizes the direct radiation error. The second row shows the applied variation from the original
KT values.
Diffuse radiation is calculated depending on global normal radiation
Gn (Eq. 8) which also depends on direct radiation, as can be seen in Eq. 8. For this reason, direct radiation needs to be corrected first. A second step is to minimize the gap of diffuse radiation. Following the same procedure, modified values of
KD with per cent variation of ±5% have been tested, coupled with
KT,mod as input of the point solar radiation script. The chosen couples of
KT,mod and
KD,mod are the ones that produced the minimum error, as reported in the
Table 5.
The second row shows the applied variation respect the original KT and KD values, respectively.
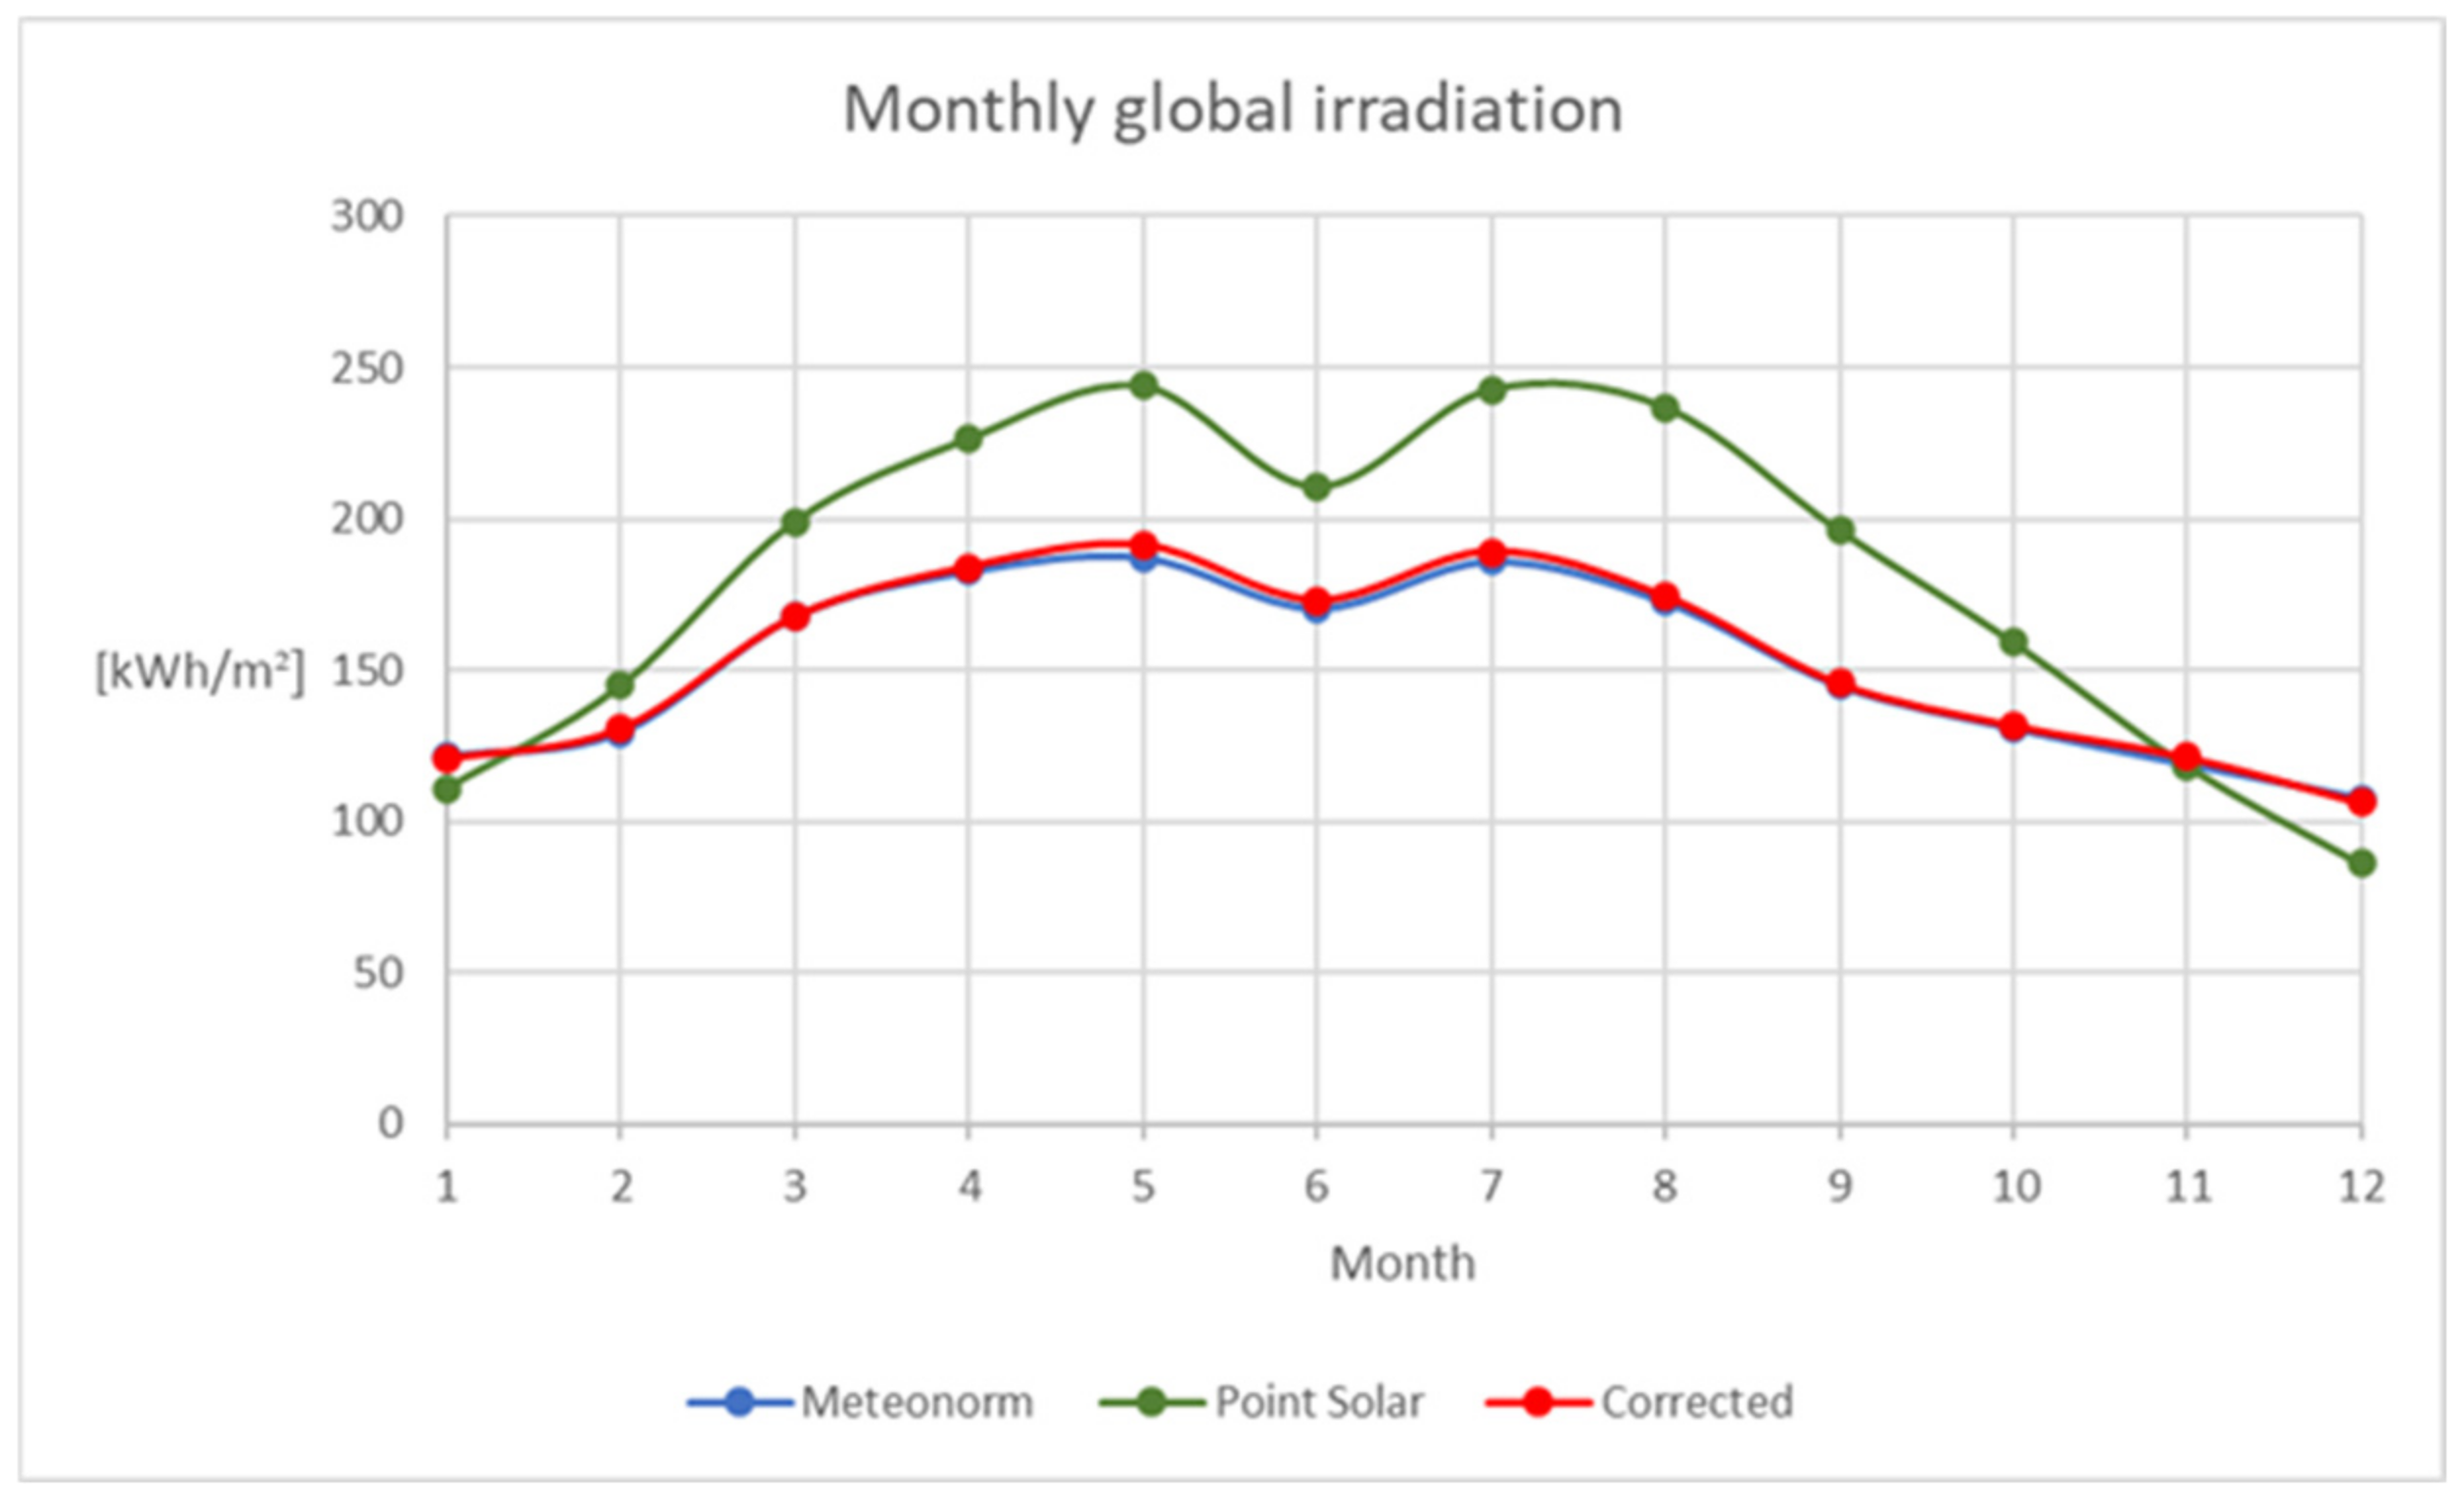
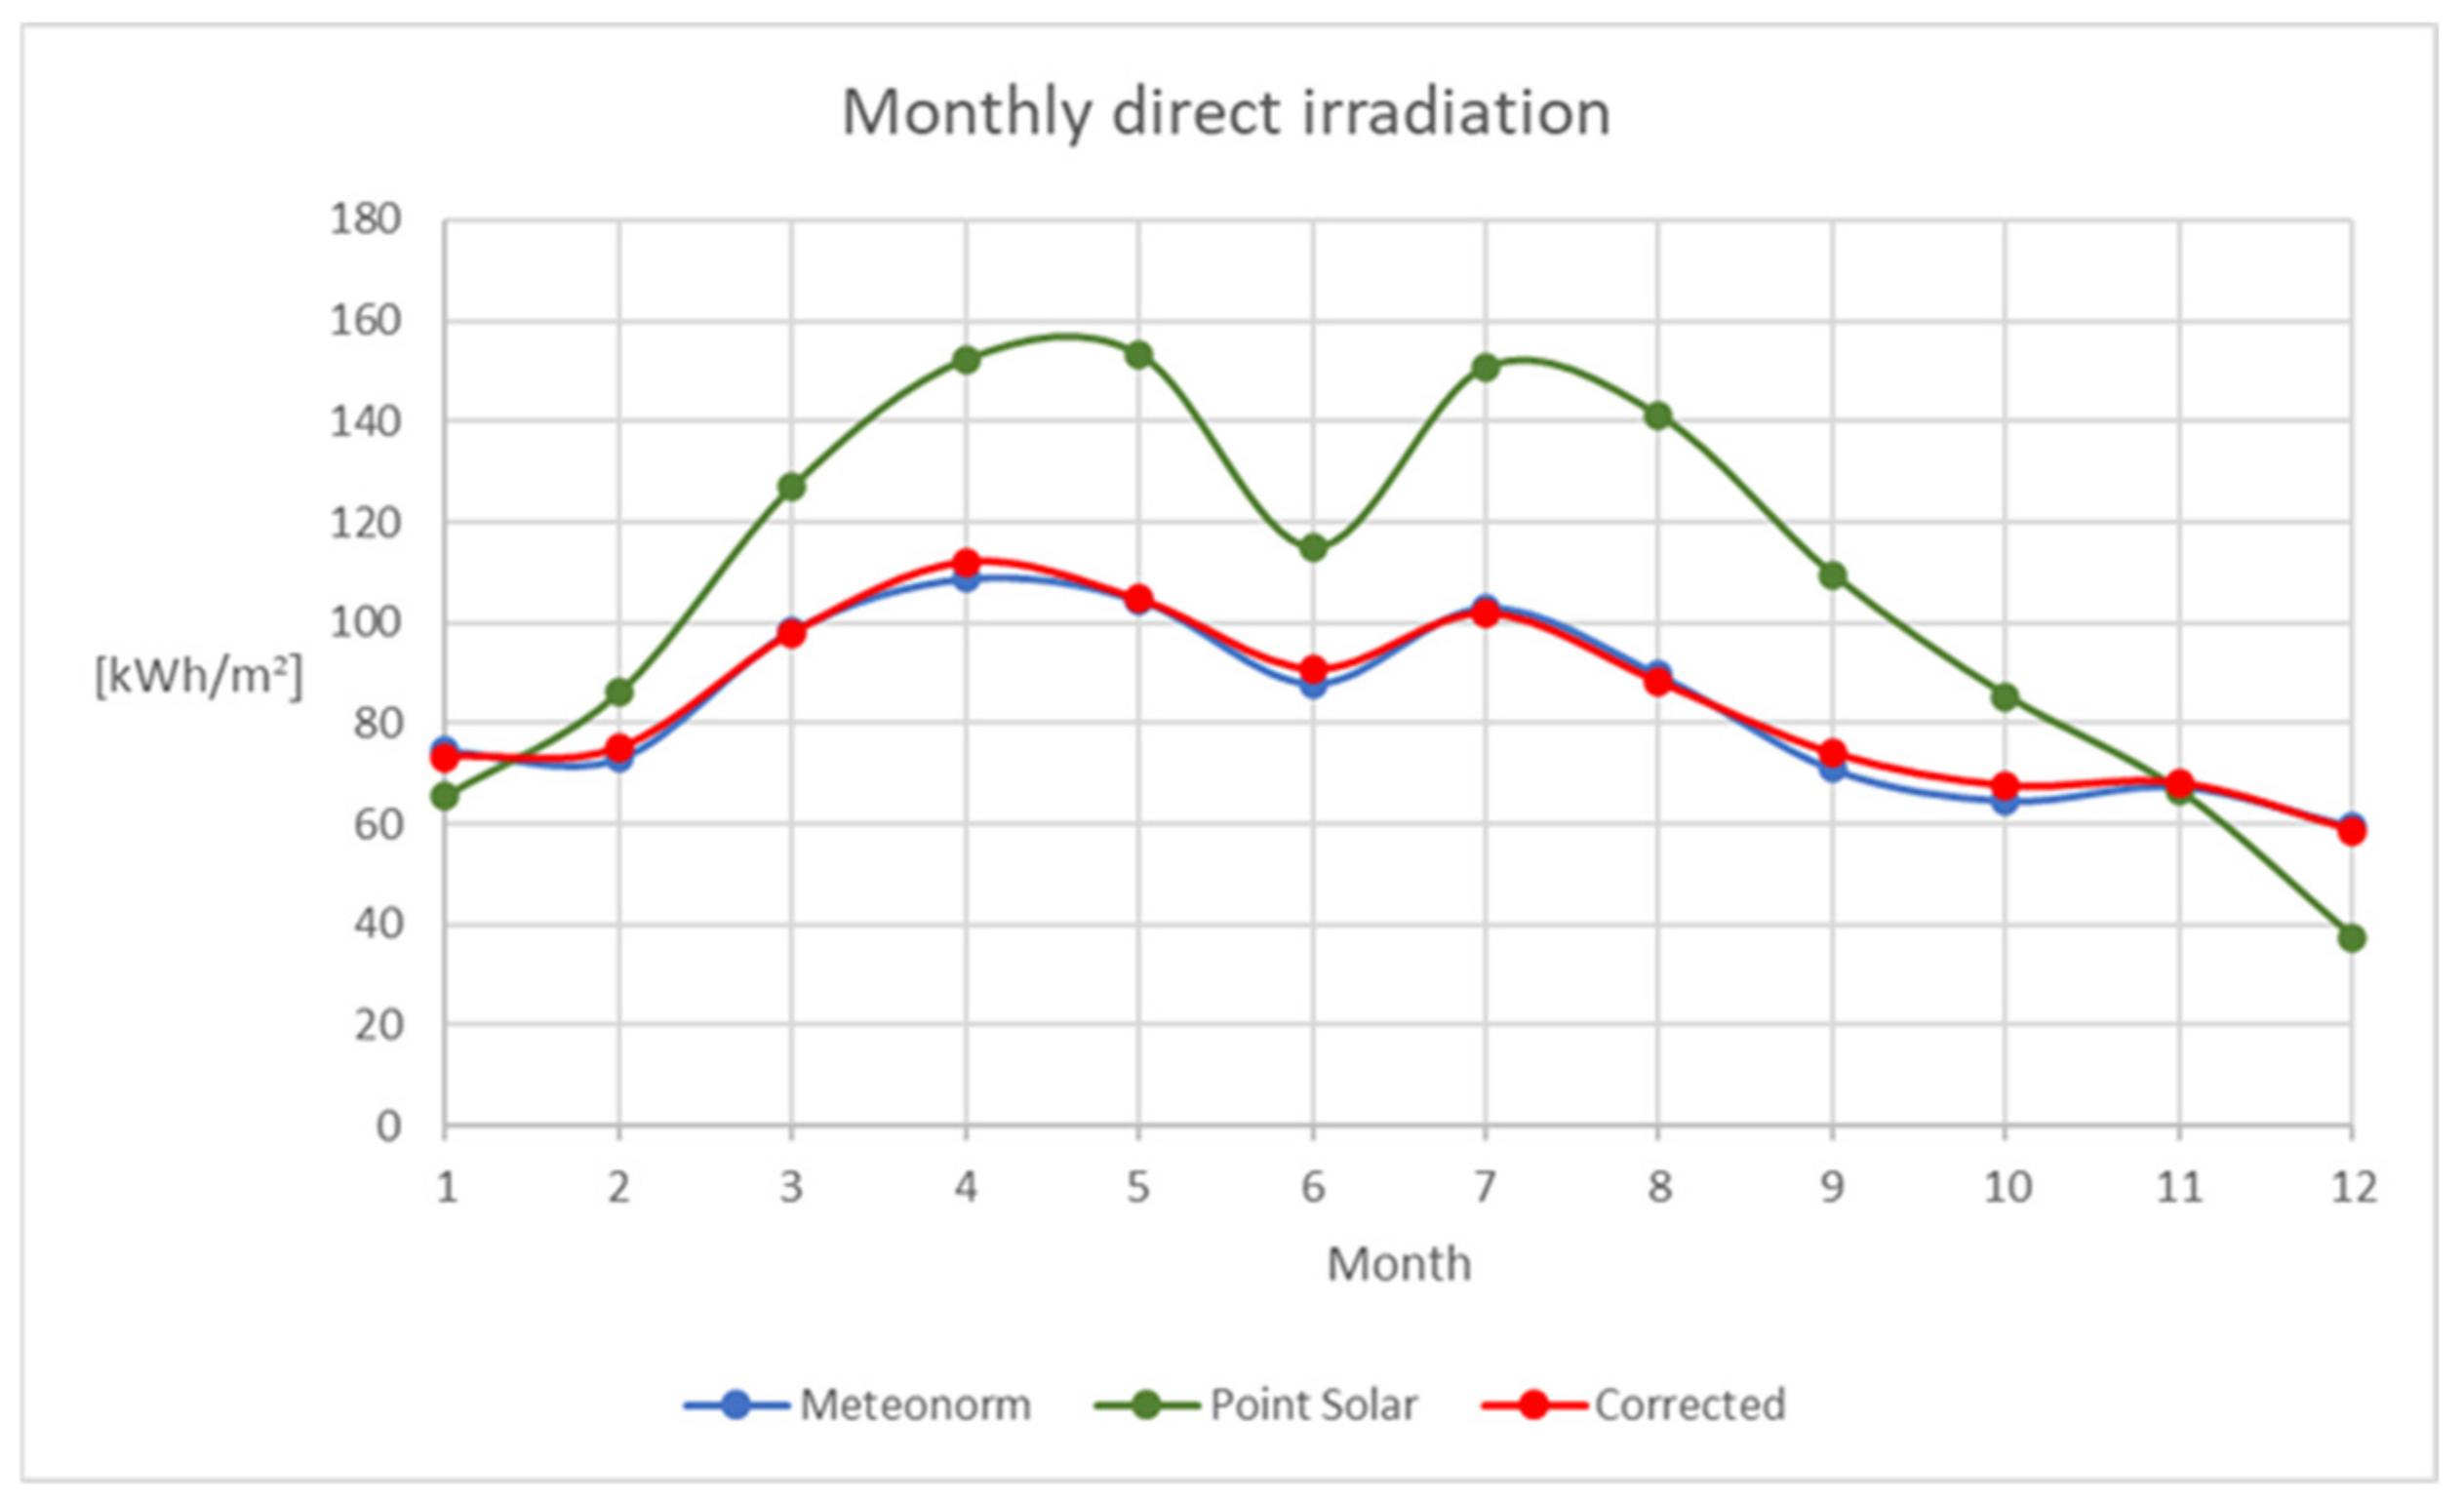
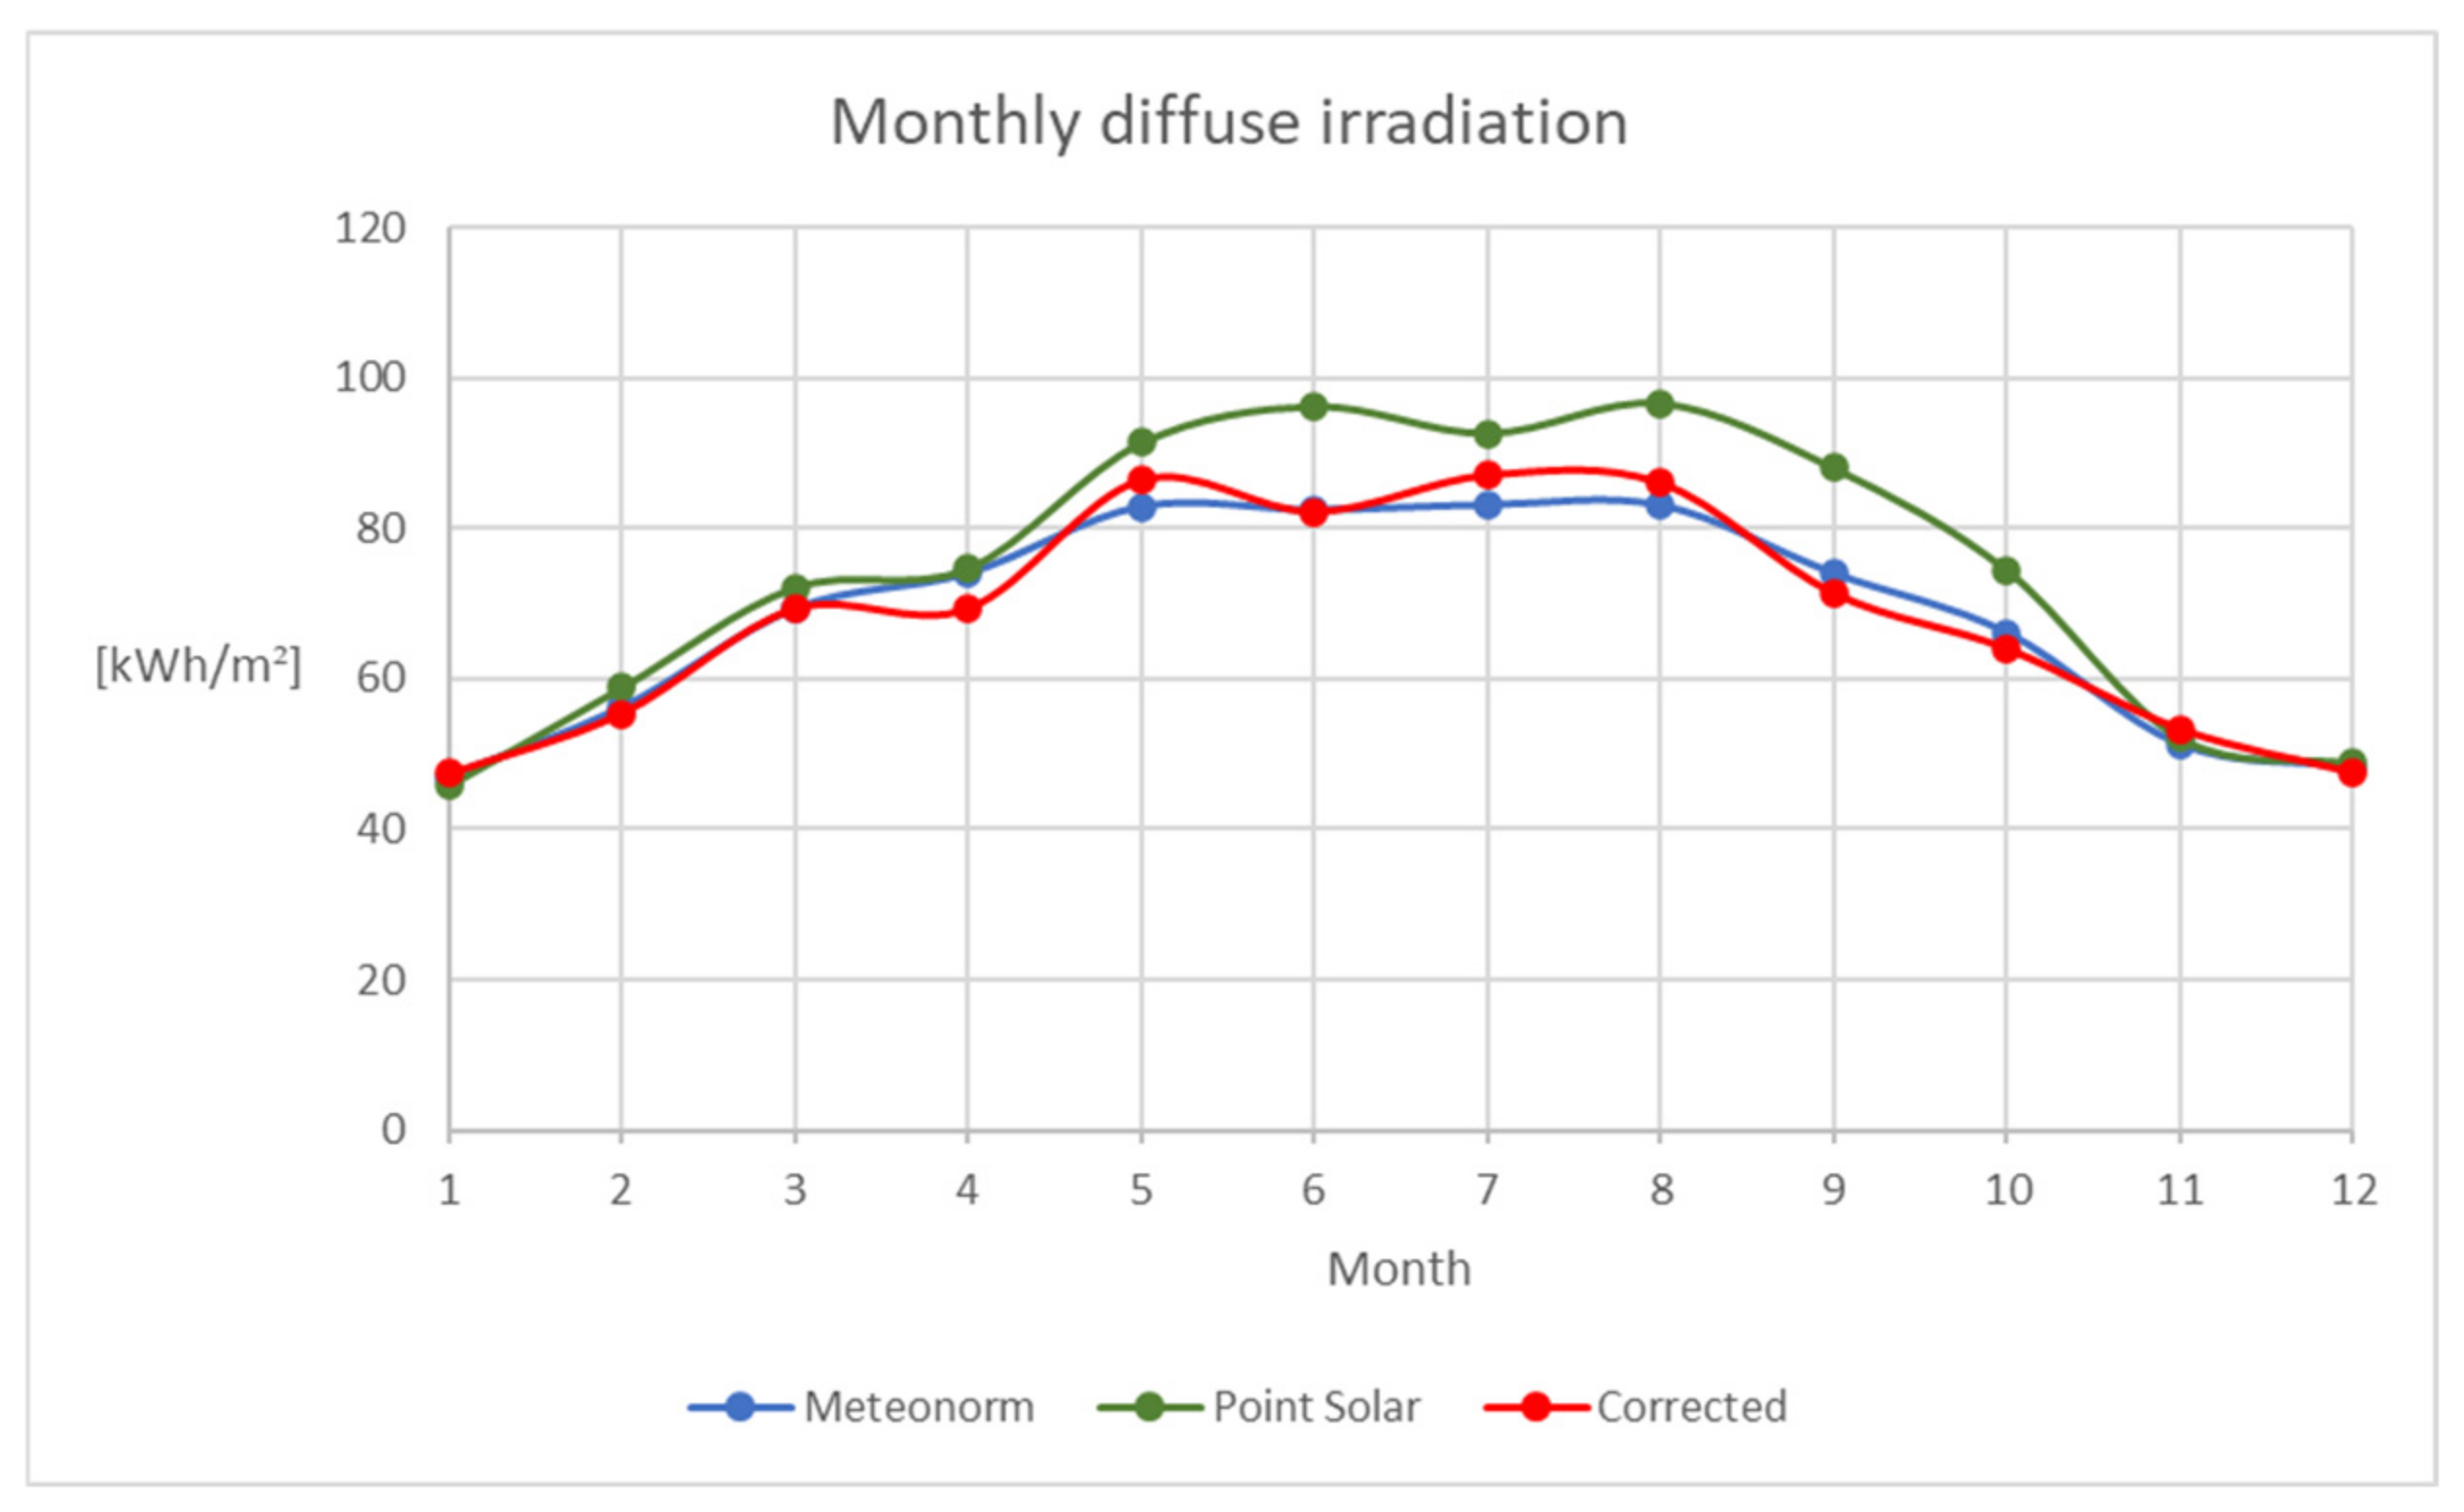
A comparison is useful to visualize the trend and the correction. The monthly global, direct and diffuse horizontal irradiation has been calculated for the 80 point-locations identified along the province of Matanzas. The average values between the 80 locations have been used to compare the output calculated by Point Solar Radiation with the reference values calculated by Meteonorm. Properly adjusting the input values of KT and KD, the error between the two calculations has been minimized.
In the following tables and graphs, “Point solar” refers to the outputs calculated before the correction, while “Corrected” refers to the outputs calculated using the modified KT,mod and KD,mod.
Table 6.
Monthly global horizontal irradiation calculated through: Meteonorm (first row), Point Solar with original values of KT and KD (second row), Point Solar with corrected values KT,mod and KD,mod (third row).
Table 6.
Monthly global horizontal irradiation calculated through: Meteonorm (first row), Point Solar with original values of KT and KD (second row), Point Solar with corrected values KT,mod and KD,mod (third row).
| Global Horizontal Irradiation (kWh/m²) |
|---|
| |
Jan. |
Feb. |
Mar. |
Apr. |
May. |
Jun. |
Jul. |
Aug. |
Sep. |
Oct. |
Nov. |
Dec. |
| Meoteonorm |
121.6 |
129.3 |
167.8 |
182.7 |
187.4 |
170.6 |
186.1 |
172.7 |
145.0 |
130.8 |
118.9 |
107.7 |
| Point Solar |
111.0 |
144.8 |
199.0 |
226.4 |
243.9 |
210.7 |
242.7 |
237.0 |
196.4 |
159.4 |
118.4 |
86.1 |
| Corrected |
120.6 |
130.5 |
167.4 |
184.0 |
191.3 |
173.1 |
189.1 |
174.4 |
145.5 |
131.6 |
121.2 |
106.1 |
Table 7.
Monthly direct horizontal irradiation calculated through: Meteonorm (first row), Point Solar with original values of KT and KD (second row), Point Solar with corrected KT,mod and KD,mod (third row).
Table 7.
Monthly direct horizontal irradiation calculated through: Meteonorm (first row), Point Solar with original values of KT and KD (second row), Point Solar with corrected KT,mod and KD,mod (third row).
| Direct Horizontal Irradiation (kWh/m²) |
|---|
| |
Jan. |
Feb. |
Mar. |
Apr. |
May. |
Jun. |
Jul. |
Aug. |
Sep. |
Oct. |
Nov. |
Dec. |
| Meoteonorm |
74.6 |
73.1 |
98.5 |
108.8 |
104.6 |
88.0 |
103.1 |
89.6 |
71.0 |
64.7 |
57.5 |
59.5 |
| Point Solar |
65.5 |
86.0 |
127.0 |
152.2 |
153.2 |
114.9 |
150.7 |
141.0 |
109.5 |
85.5 |
66.6 |
37.5 |
| Corrected |
73.4 |
75.2 |
98.1 |
112.1 |
104.7 |
90.8 |
101.9 |
88.2 |
74.0 |
67.6 |
68.1 |
58.6 |
Table 8.
Monthly diffuse irradiation calculated through: Meteonorm (first row), Point Solar with original values of KT and KD (second row), Point Solar with corrected values KT,mod and KD,mod (third row).
Table 8.
Monthly diffuse irradiation calculated through: Meteonorm (first row), Point Solar with original values of KT and KD (second row), Point Solar with corrected values KT,mod and KD,mod (third row).
| Diffuse Irradiation (kWh/m²) |
|---|
| |
Jan. |
Feb. |
Mar. |
Apr. |
May. |
Jun. |
Jul. |
Aug. |
Sep. |
Oct. |
Nov. |
Dec. |
| Meoteonorm |
47.0 |
56.2 |
69.4 |
74.1 |
83.0 |
82.5 |
83.2 |
83.1 |
74.1 |
66.2 |
51.3 |
48.3 |
| Point Solar |
45.7 |
58.8 |
72.2 |
74.7 |
91.4 |
96.3 |
92.7 |
96.7 |
88.0 |
74.4 |
52.1 |
48.8 |
| Corrected |
47.4 |
55.4 |
69.3 |
69.4 |
86.5 |
82.3 |
87.1 |
86.1 |
71.4 |
54.0 |
53.3 |
47.5 |
Figure 3.
Trend of the monthly global horizontal irradiation calculated through: Meteonorm (blue), Point Solar with original values of KT and KD (green), Point Solar with corrected values KT and KD (red).
Figure 3.
Trend of the monthly global horizontal irradiation calculated through: Meteonorm (blue), Point Solar with original values of KT and KD (green), Point Solar with corrected values KT and KD (red).
Figure 4.
Trend of the monthly direct horizontal irradiation calculated through: Meteonorm (blue), Point Solar with original values of KT and KD (green), Point Solar with corrected values KT and KD (red).
Figure 4.
Trend of the monthly direct horizontal irradiation calculated through: Meteonorm (blue), Point Solar with original values of KT and KD (green), Point Solar with corrected values KT and KD (red).
Figure 5.
Trend of the monthly diffuse irradiation calculated through: Meteonorm (blue), Point Solar with original values of KT and KD (green), Point Solar with corrected values KT and KD (red).
Figure 5.
Trend of the monthly diffuse irradiation calculated through: Meteonorm (blue), Point Solar with original values of KT and KD (green), Point Solar with corrected values KT and KD (red).
