Preprint
Article

Analysis of Adipose Tissue Characteristics and Lipid Metabolism in Natural Grazing Mongolian Cattle

Altmetrics

Downloads

92

Views

44

Comments

0

Submitted:

21 August 2024

Posted:

22 August 2024

You are already at the latest version

Alerts
Abstract
The color of carcass fat is an important factor in meat quality. To investigate the characteristics and changes in lipid metabolism of SAT in Mongolian cattle at 34 M of age compared with the control group, we evaluated the color, relative expression of genes associated with browning, and profiles of lipid metabolites by using qPCR and non-targeted lipidomics techniques. Overall, the yellowness value and relative expression of mitochondrial biogenesis–specific markers, thermogenic, UCP2, and beige adipocyte marker genes in the SAT of 34 M cattle were higher than those control (p < 0.05). Using multivariate analysis, 172 significantly different lipids (SDLs) were identified. Triacylglycerols (TGs) and phosphatidylcholines (PCs) had high relative contents with abundant unsaturated fatty acids. The upregulation of TGs observed in the SAT of 34 M cattle mainly consisted of medium- and long-chain fatty acids. Pathway analysis demonstrated that 172 SDLs were primarily involved in glycerophospholipid, glycerolipid, ether lipid, and sphingolipid metabolism. In summary, yellow fat of naturally grazed cattle was impacted by many factors such as lipid metabolism, browning genes expression and age. These findings provide new insight into the characteristics and metabolic pathways of adipose tissue in natural grazing Mongolian cattle.
Keywords: 
Subject: Biology and Life Sciences  -   Animal Science, Veterinary Science and Zoology

1. Introduction

Fat deposition is closely associated with production efficiency, meat quality, flavor, and juiciness, and is related to human health and nutrition. There are three types of adipocytes in mammals that have different functions. White adipocytes, which are the primary cells of the white adipose tissue (WAT), store energy. Brown adipocytes are the primary cell type constituting brown adipose tissue (BAT) and are responsible for mammal heat production (thermogenesis). Furthermore, brown adipocytes within BAT harbor mitochondria rich in uncoupling protein-1 (UCP1), indicating that BAT specializes in energy expenditure rather than energy storage. In addition to white and brown adipocytes, beige adipocytes have recently been observed within WAT depots as inducible thermogenic cells that exhibit a mixed function of energy storage or expenditure [1]. Beige adipocytes have recently attracted particular interest due to their ability to regulate energy balance and improve metabolic health [2]. Long-term cold stimulation, sympathetic nerve stimulation, peroxisome proliferator–activated receptor γ agonists, and exercise induce the formation of beige adipocytes [3]. This phenomenon is referred to as “browning,” and cold exposure serves as the most efficient physiological stimulus for inducing browning in mammals. A recent study has found that cold stimulation causes the browning of subcutaneous WAT in cattle, which are more susceptible to cold exposure due to its distribution position [4,5]. Therefore, browning can further enhance lipid metabolism, potentially influencing the overall quality of meat.
Lipids are a primary source of energy and nutrients and play a vital role in food and human health. Recently, lipidomics has emerged as a critical tool for investigating cattle adipose tissue lipid metabolism. Du et al. [6] identified 97 differentially accumulated lipids (DALs) in SAT, 116 DALs in visceral adipose tissue, and 29 DALs in abdominal adipose tissue of Huaxi cattle. TGs accounted for the highest proportion of DALs and were crucial in fat deposition development. Xiong et al. [7] demonstrated that subcutaneous yak fat mainly comprises lysophosphatidylcholines (LPCs), phosphatidylcholines (PCs), phosphatidylethanolamines (PEs), and TGs. Furthermore, the involvement of triglyceride metabolism in yak fat deposition has been established. Gu et al. [8] detected 108, 106, and 77 DALs in comparisons between cattle–yak and cattle, cattle–yak and yak, and yak and cattle. This study aimed to explore the differences in muscle lipid content between plateau and plain cattle. The muscles of plateau cattle contained higher proportions of phospholipids containing long-chain polyunsaturated fatty acids (PUFAs), suggesting the nutritional benefits of yak and cattle–yak meat. These latest research advances indicate that lipidome analysis can provide crucial molecular information for exploring the formation mechanisms of lipid metabolism. Therefore, lipid metabolism in cattle depends on anatomical location [6], feeding conditions [7], and species [8]. However, the lipid composition, characteristics, and metabolism of the yellow fat produced by natural grazing Mongolian cattle still require further investigation for a more comprehensive understanding.
The color of cattle SAT is an essential component of beef carcass quality, depending on the age, gender, diet, and breed of the cattle [9]. Mongolian cattle are one of the most distinctive livestock breeds and represent the surviving treasure of local beef cattle breeds in China [10]. For centuries, nomads have herded these cattle, and they are highly esteemed for their high-quality meat. The Xilingol grassland is one of the primary production areas for Mongolian cattle, where abundant forage species thrive [11,12]. Most naturally grazed cattle calves are born in spring (typically in February) and are generally accustomed to autonomous activities and much free feeding (natural grazing) throughout their lifespan. Therefore, the distinctive phenotypic feature of natural grazing Mongolian cattle is yellow fat, which local inhabitants highly favor due to its exceptional taste and flavor profile. The quality of meat from beef with yellow fat was often perceived as inferior quality, necessarily coming from older or diseased animals in the past. However, it is now widely acknowledged that the presence of yellow fat in healthy beef obtained from natural grazing with strong antioxidant properties, better quality, and higher nutritional value. In the present study, the fat color, relative expression of genes associated with browning, and lipid metabolite profiles were compared and analyzed in natural grazing Mongolian cattle at 34 months (34 M) compared with control at 10 months (10 M). The study aimed to provide a new insight into the lipid composition, characteristics, and metabolic mechanisms of yellow fat produced by natural grazing Mongolian cattle. It provides theoretical evidence for the development of new functional products.

2. Materials and Methods

2.1. Sample Collection

The experimental animals were 12 castrated Mongolian cattle 34 M old (34 M, n = 6) and aged 10 (10 M, n = 6). All samples were selected from the same herd in the Xilingol grasslands, Sunit Banner, Inner Mongolia, China. This region is a typical steppe dominated by continental temperate climates. The extreme maximum summer temperature (approximately 35°C) and the extreme minimum winter temperature (approximately −40°C) were recorded. Following the local traditional grazing management protocol, animals are grazed in natural pasture. Typically, naturally grazed cattle calves are born in February and slaughtered in December (after 30 M). All animals used in the study were fasted for 12 h and transported to a commercial abattoir, where professionals immediately slaughtered them following standard commercial procedures. After slaughter, the skeletal muscle adipose tissue (SAT, backfat at the 12th and 13th ribs) was collected, placed in sterile tubes, frozen in liquid nitrogen, and transferred to −80 °C for real-time quantitative polymerase chain reaction (RT-qPCR) and lipidomic analysis. Subsequently, additional samples (approximately 50 g) were placed in bags and stored at −20 °C until adipose tissue color analysis.

2.2. Tissue Color Measurement

A WSC-S automatic color meter (Shanghai, China) was used to measure the color of the SAT for each sample. The color of the SAT in each sample was recorded using three indexes: L* (lightness), a* (redness), and b* (yellowness), with triplicate measurements.

2.3. Measurement of Mitochondrial DNA Copy Number

For mitochondrial DNA (mtDNA) content analysis, genomic DNA was extracted from adipose tissue using a DNA extraction kit (TIANGEN, Beijing, China). mtDNA levels were determined by calculating the ratio of NADH dehydrogenase subunit 1 (ND1) to genomic glyceraldehyde-3-phosphate dehydrogenase (GAPDH) using RT-qPCR. The relative mtDNA copy number was assessed using the 2−ΔCT method (ΔCT = CTND1 − CTGAPDH) [13]. The primer details are provided in Table S1.

2.4. Quantitative Real-Time RT-qPCR Analysis

Total RNA was extracted from 100 mg of adipose tissues using TRNzol Universal (TIANGEN). HiScripm Ⅱ Q RT SuperMix (Vazyme, Nanjing, China) was used to reverse transcription of total RNA to generate complementary deoxyribonucleic acid (cDNA) according to the manufacturer’s protocol. RT-qPCR was performed to characterize the relative expression of target genes using specific primers. The qPCR reaction mixture (20 μL) included 10 μL of 2 × ChamQ Universal SYBR qPCR MASTER Mix (Vazyme), 0.4 μL of each forward and reverse primer (10 μM for each), 8.2 μL of nuclease-free water, and 1.0 μL of cDNA. The qPCR assay utilized the LightCycler® 96 Real-time PCR system (Roche, Basel, Switzerland) with preincubation at 95 °C for 30 s, followed by 45 cycles of denaturation at 95 °C for 5 s, and annealing and extension at 60 °C for 30 s. After the PCR cycles, a melting curve was generated (95 °C for 5 s, 60 °C for 60 s, and 95 ℃ for 1 s (continuous)) to discriminate between the specific amplicons and nonspecific amplification products. Results were calculated using the 2−ΔΔCt method, normalized by GAPDH. The gene abbreviations and primer sequences are provided in Table S1. Primers were synthesized by Sangon (Shanghai, China).

2.5. Lipid Extraction and Lipidomic Analysis

The samples were thawed on ice after removal from the −80℃ freezer. Lipids were subsequently extracted using 50% methanol buffer (Honeywell). Specifically, 120 μL of precooled 50% methanol buffer was added to the mixture of the metabolites, which was vortexed for 1 min and incubated for 10 min at 25°C. The resulting extraction mixture was stored at −20°C overnight. The mixture was centrifugated at 4,000g for 20 min and stored at −80°C before analysis. Additionally, 10 μL of each extraction mixture was removed to prepare pooled quality control (QC) samples.
All lipid samples underwent analysis using liquid chromatography–mass spectrometry (LC–MS) with an ultra-high-performance liquid chromatography (UPLC) system (SCIEX, UK) and a high-resolution tandem mass spectrometer (TripleTOF5600plus, SCIEX). The analytical conditions were column ACQUITY UPLC HSS T3 (1.8 μm, 2.1 × 100 mm, Waters, UK). The solvent system was A (water, 0.1% formic acid) and B (acetonitrile, 0.1% formic acid). The gradient elution conditions were as follows with a flow rate of 0.4 mL/min: 5% solvent B for 0–0.5 min; 5%–100% solvent B for 0.5–7 min; 100% solvent B for 7–8 min; 100%–5% solvent B for 8–8.1 min; and 5% solvent B for 8.1–10 min. The column temperature was maintained at 35℃. The TripleTOF5600plus system was used to detect metabolites eluted from the column. The Q-TOF was operated in positive and negative ion modes. The curtain gas pressure was set to 30 psi; the ion source gas1 and gas2 pressures were set to 60 psi. The interface heater temperature was 650°C, and the ion spray voltages were 5,000 V (positive) and −4,500 V (negative). The MS data were acquired in IDA mode. The TOF mass range was 60–1,200 Da. Dynamic exclusion was implemented.

2.6. Statistical and Bioinformatics Analyses

Data were expressed as the mean ± standard error of the mean (SEM). Excel and GraphPad Prism (v8.0.2) were used for statistical analysis and graphing of the data. The unpaired t-test was used to assess differences between the two groups.
The LC–MS data were subjected to principal component analysis (PCA) using the OmicStudio tools available at OmicStudio (https://www.omicstudio.cn/tool). Partial least squares discriminant analysis (PLS-DA) was used to validate the PCA model and identify differential lipids. Significantly different lipids (SDLs) were screened using the following criteria: p-value (p < 0.05), fold-change (FC ≥ 2 or FC ≤ 0.5), and variable importance in projection (VIP > 1). The Kyoto Encyclopedia of Genes and Genomes (KEGG) compound database and the MetaboAnalyst 5.0 platform were used to map and differentiate lipid-related metabolic pathways. Topological analyses were performed on these SDLs to calculate the p-values and pathway effects. Significant pathways were identified based on a p-value < 0.05 and an impact value > 0.1. Subsequently, the mapped metabolic pathways were subjected to metabolite set enrichment analysis.

3. Results and Discussion

3.1. Adipose Tissue Color Analysis

The color of SAT in cattle serves as a crucial indicator of beef carcass quality. As shown in Figure 1, the L* value (A) and b* value (C) of SAT were significantly higher in 34 M cattle than in 10 M (p < 0.01). In contrast, the a* value of 10 M cattle was higher than that of 34 M cattle (p < 0.01). Yellowness is considered the most crucial color parameter of adipose tissue. In this study, SAT from 34 M cattle exhibited deeper yellowness (a higher b* value) than SAT from 10 M cattle. The color differences could be partly attributed to climate change, the age of the animals, and their diets [9]. Furthermore, it is well documented that natural grazing promotes carotenoid accumulation, leading to concomitant yellow fat formation. In addition, older cattle tend to have more yellow carcass fat [14,15].

3.2. Expression of mtDNA Copy Numbers, Mitochondrial Biogenesis–Specific Markers, and Browning-Related Factor

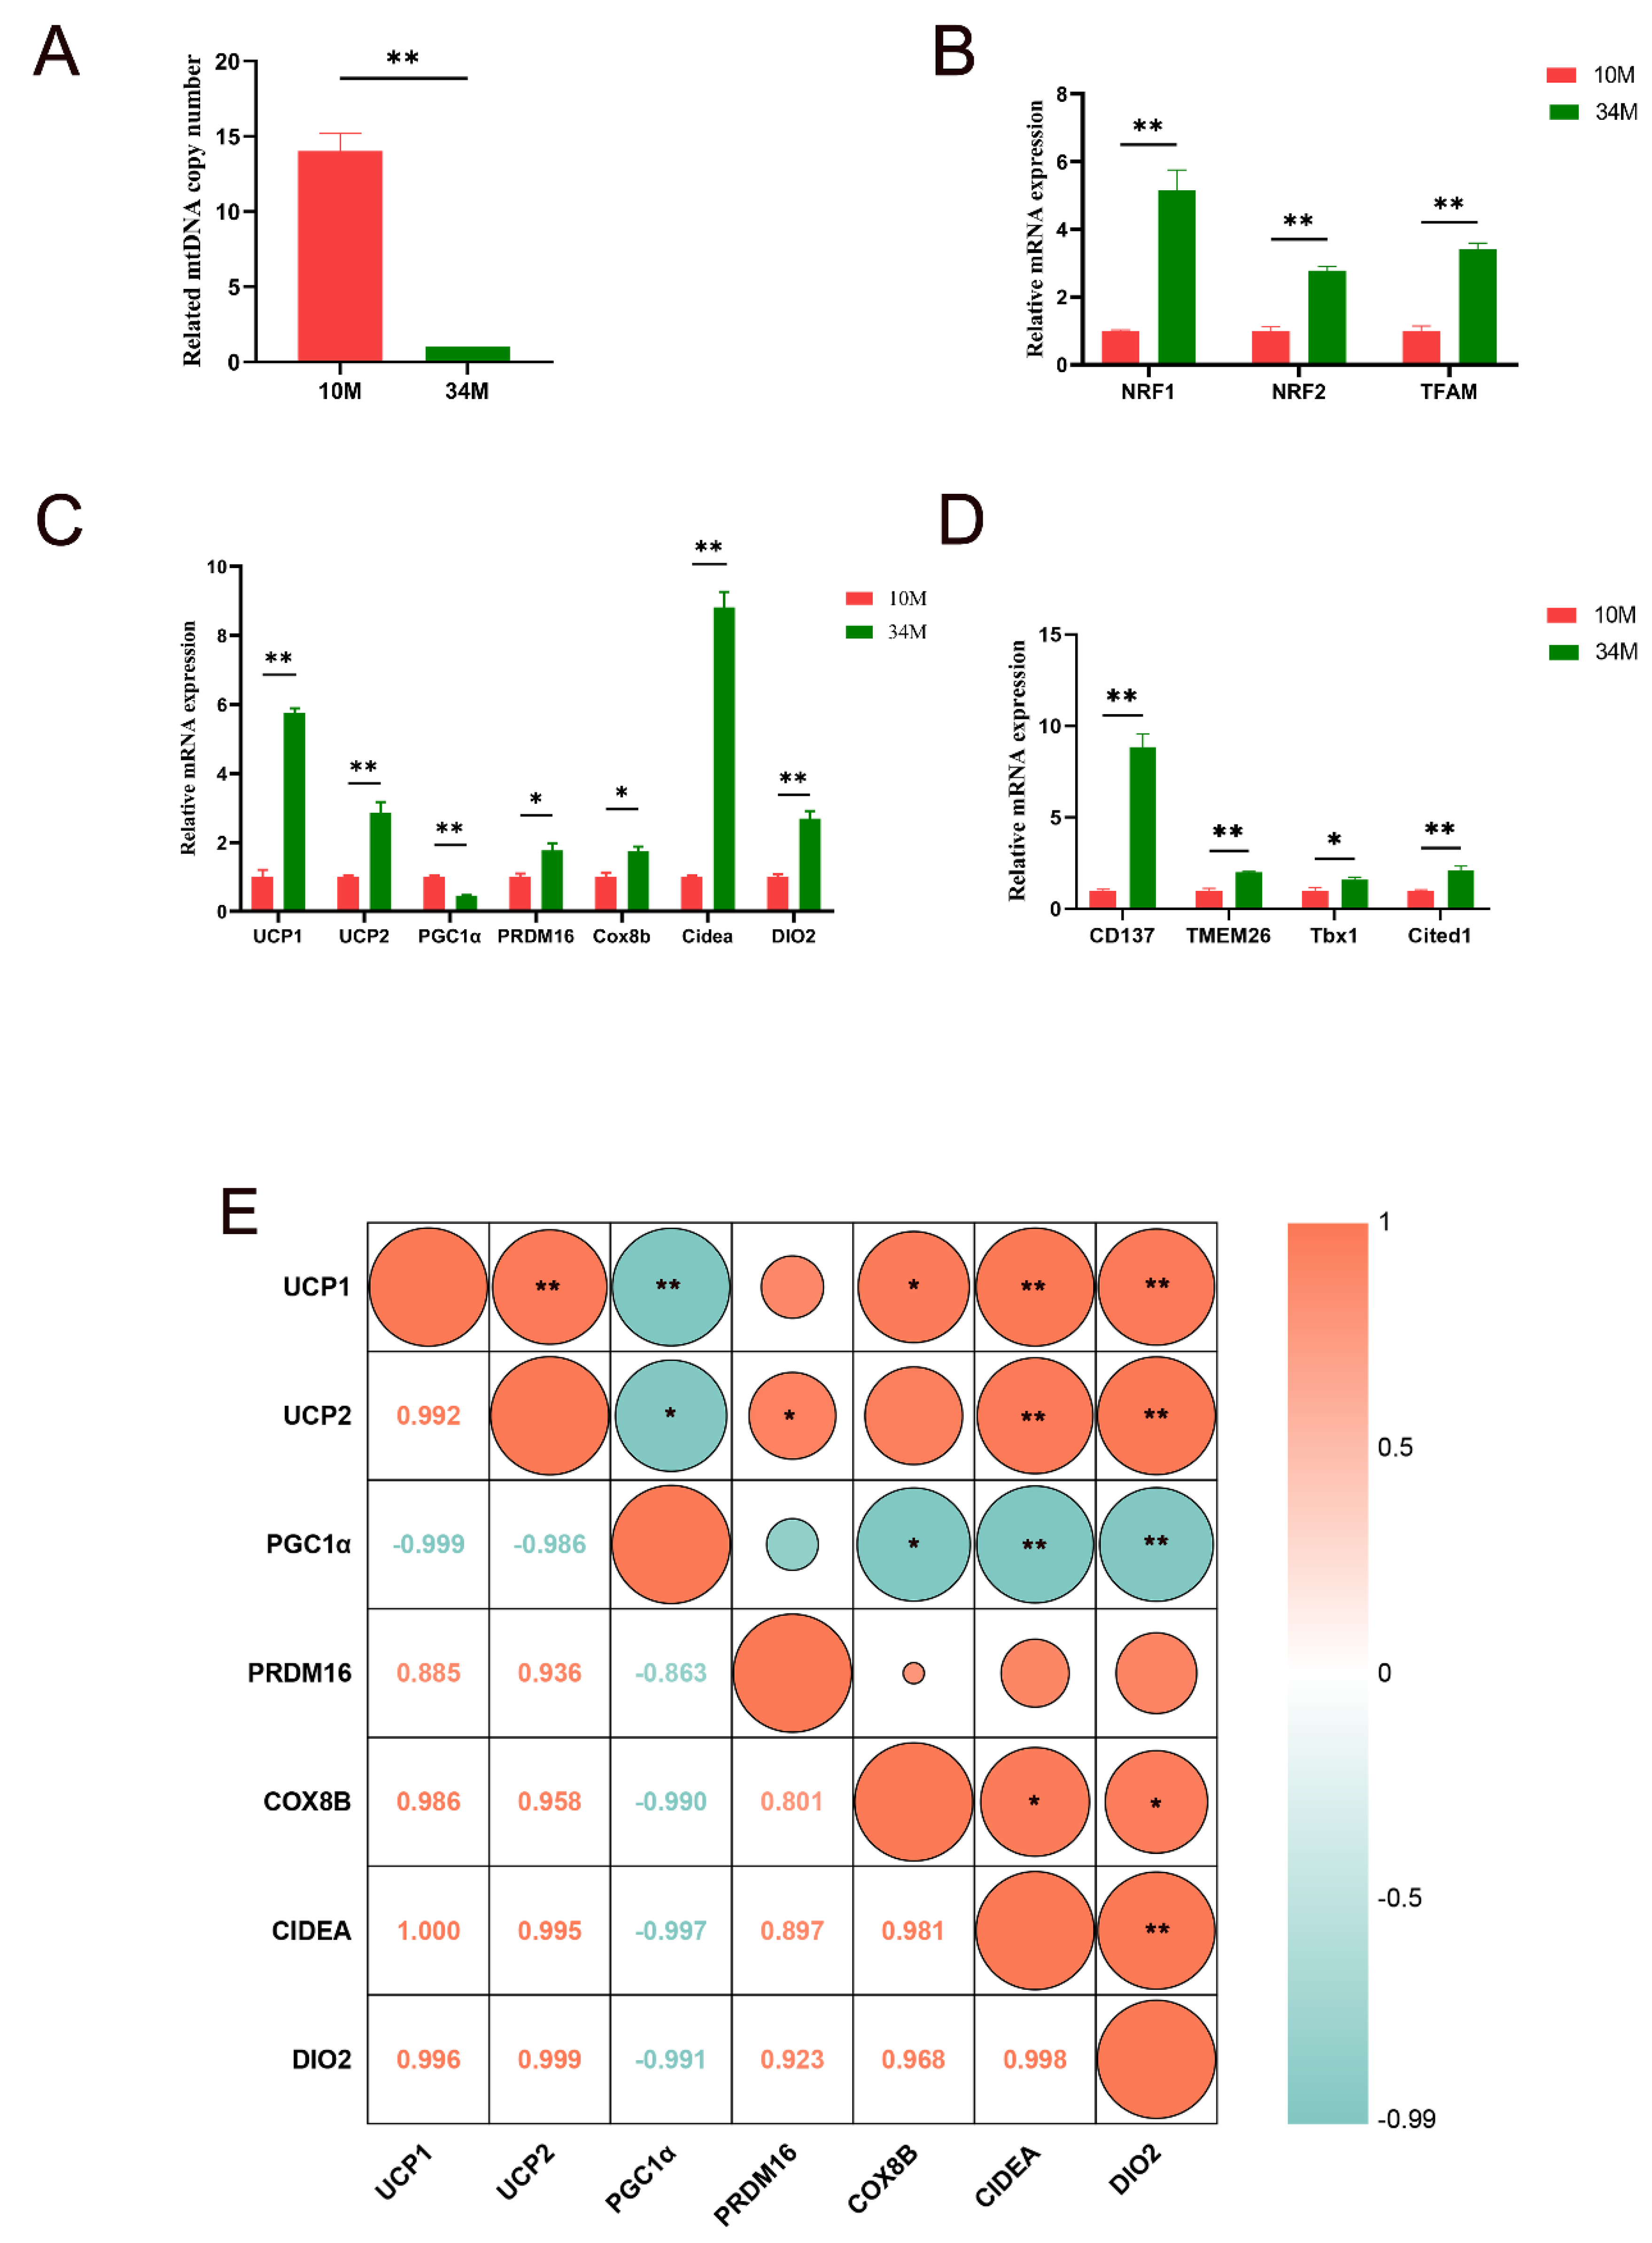
The role of beige adipocyte formation in energy regulation and metabolism has been extensively reported. The key features of browning include increased mtDNA copy numbers, upregulation of marker genes specific to mitochondrial biogenesis, and enhanced expression of genes related to browning. As shown in Figure 2A, the relative mtDNA copy number was significantly reduced in the SAT of the 34 M cattle (14.0-fold, p < 0.01). Generally, there is a significant increase in the number of copies of mtDNA during the first year of an animal’s life, which exhibits a robust positive correlation with lipogenesis [16,17]. Concurrently, the content of mtDNA reflects, to some extent, the physiological state of the organism, its metabolic intensity, and its energy demand. The results indicated that the basal metabolic rate of SAT in 10 M cattle may be higher than that of SAT in 34 M cattle, which increased the mitochondrial activity and copy number of mtDNA. Thus, mtDNA copy numbers decline with advancing age. This result is consistent with those of Barazzoni et al.’s study [18]. However, relative mRNA expression levels of critical regulators of the mitochondrial biogenesis program, including NRF1, NRF2, and TFAM, were markedly increased in the SAT of 34 M cattle (5.2-, 2.8-, and 3.4-fold, respectively, p < 0.01; Figure 2B). Hou et al. [19] demonstrated that mitochondrial biogenesis is increased during the browning fat process. Ultimately, aged cattle stimulate browning by enhancing mitochondrial biogenesis.
Figure 2C shows the relative expression levels of brown/beige adipocyte-related adaptive thermogenesis genes and UCP2 in the SAT of 34 M cattle compared with 10 M cattle. The qPCR results indicated that the relative expression levels of mRNAs for UCP1, UCP2, PRDM16, Cox8b, Cidea, and DIO2 were significantly increased in the 34 M group, except for PGC1α (5.8-, 2.9-, 1.8-, 1.7-, 8.8-, and 2.7-fold, respectively, p < 0.05). In particular, high UCP1 expression in mitochondria was the most striking feature of brown and activated beige adipocytes. UCP1 is essential for maintaining energy homeostasis and is closely related to energy metabolism. Similarly, Cidea has been extensively reported to be relevant in regulating energy homeostasis and lipid metabolism [20]. PRDM16 is a critical transcriptional regulator of brown and beige fat, primarily involved in upregulating BAT/beige adipocyte function and heat production [21]. In contrast, the expression of PGC1α was downregulated in the 34 M group (2.2-fold, p < 0.05). This downregulation may be attributed to various repressors that target PGC1α, inhibiting beige adipocyte development [17]. Furthermore, the level of PGC1α, which was directly proportional to the amount of mtDNA, exhibited a negative correlation with aging [22,23]. In the current study, the observed changes in relative gene expression align with findings from previous studies, providing further support for the rationale behind the experimental group design. Therefore, the expression of beige adipocyte markers was further observed. As shown in Figure 2D, the relative mRNA expression levels of CD137, Tmem26, Tbx1, and Cited1 were markedly upregulated in the SAT of 34 M cattle (8.9-, 2.0-, 1.6-, and 2.1-fold, respectively, p < 0.05). The expression of CD137, Tmem26, Tbx1, and Cited1 would distinguish beige adipocytes from brown and white adipocytes [24]. Overall, the abundance of beige adipocytes may increase in aged cattle compared to calves, potentially contributing to the observed yellowing of SAT in aged cattle. The study’s findings contradicted the observations made in mice [25] and humans [26]. Although species and tissue differences can partially explain variations in beige adipocytes with aging, the primary factors contributing to these disparities are likely attributed to the cold climate and year-round free movement of Mongolian cattle. Li et al. [5] showed that inducing subcutaneous WAT browning through cold exposure benefits heat production and helps regulate body temperature in cattle. In the inguinal WAT of long-term exercise-aged mice, there was an increase in the expression of genes related to mitochondrial biogenesis, thermogenesis, and beige adipocytes [27]. In addition, the browning of white adipocytes and the activation of brown adipocytes enhance energy metabolism [28]. Thus, the formation of beige adipocytes is a significant physiological adaptation for naturally grazed Mongolian cattle to cope with the cold climate in the Xilingol grassland, which could improve meat quality.
Figure 2E shows the correlation analysis of UCP2 and brown/beige adipocyte-related adaptive thermogenesis genes. The strongest correlation was observed between UCP2 and DIO2 (r = 0.999, p < 0.01), implying the potential roles of UCP2 in energy metabolism during Mongolian cattle growth. Cidea (r = 0.995, p < 0.01) and UCP1 (r = 0.992, p < 0.01) were closely followed. The results were similar to those reported by Shigematsu et al. [29], who reported correlations between UCP2 expression levels and certain brown or beige adipocyte-related genes. Thus, the increased relative expression levels of UCP2 may be related to the formation of beige adipocytes, although the precise mechanism remains unclear.

3.3. Lipid Metabolomics Analysis

3.3.1. Overview of Lipid Metabolomics Results

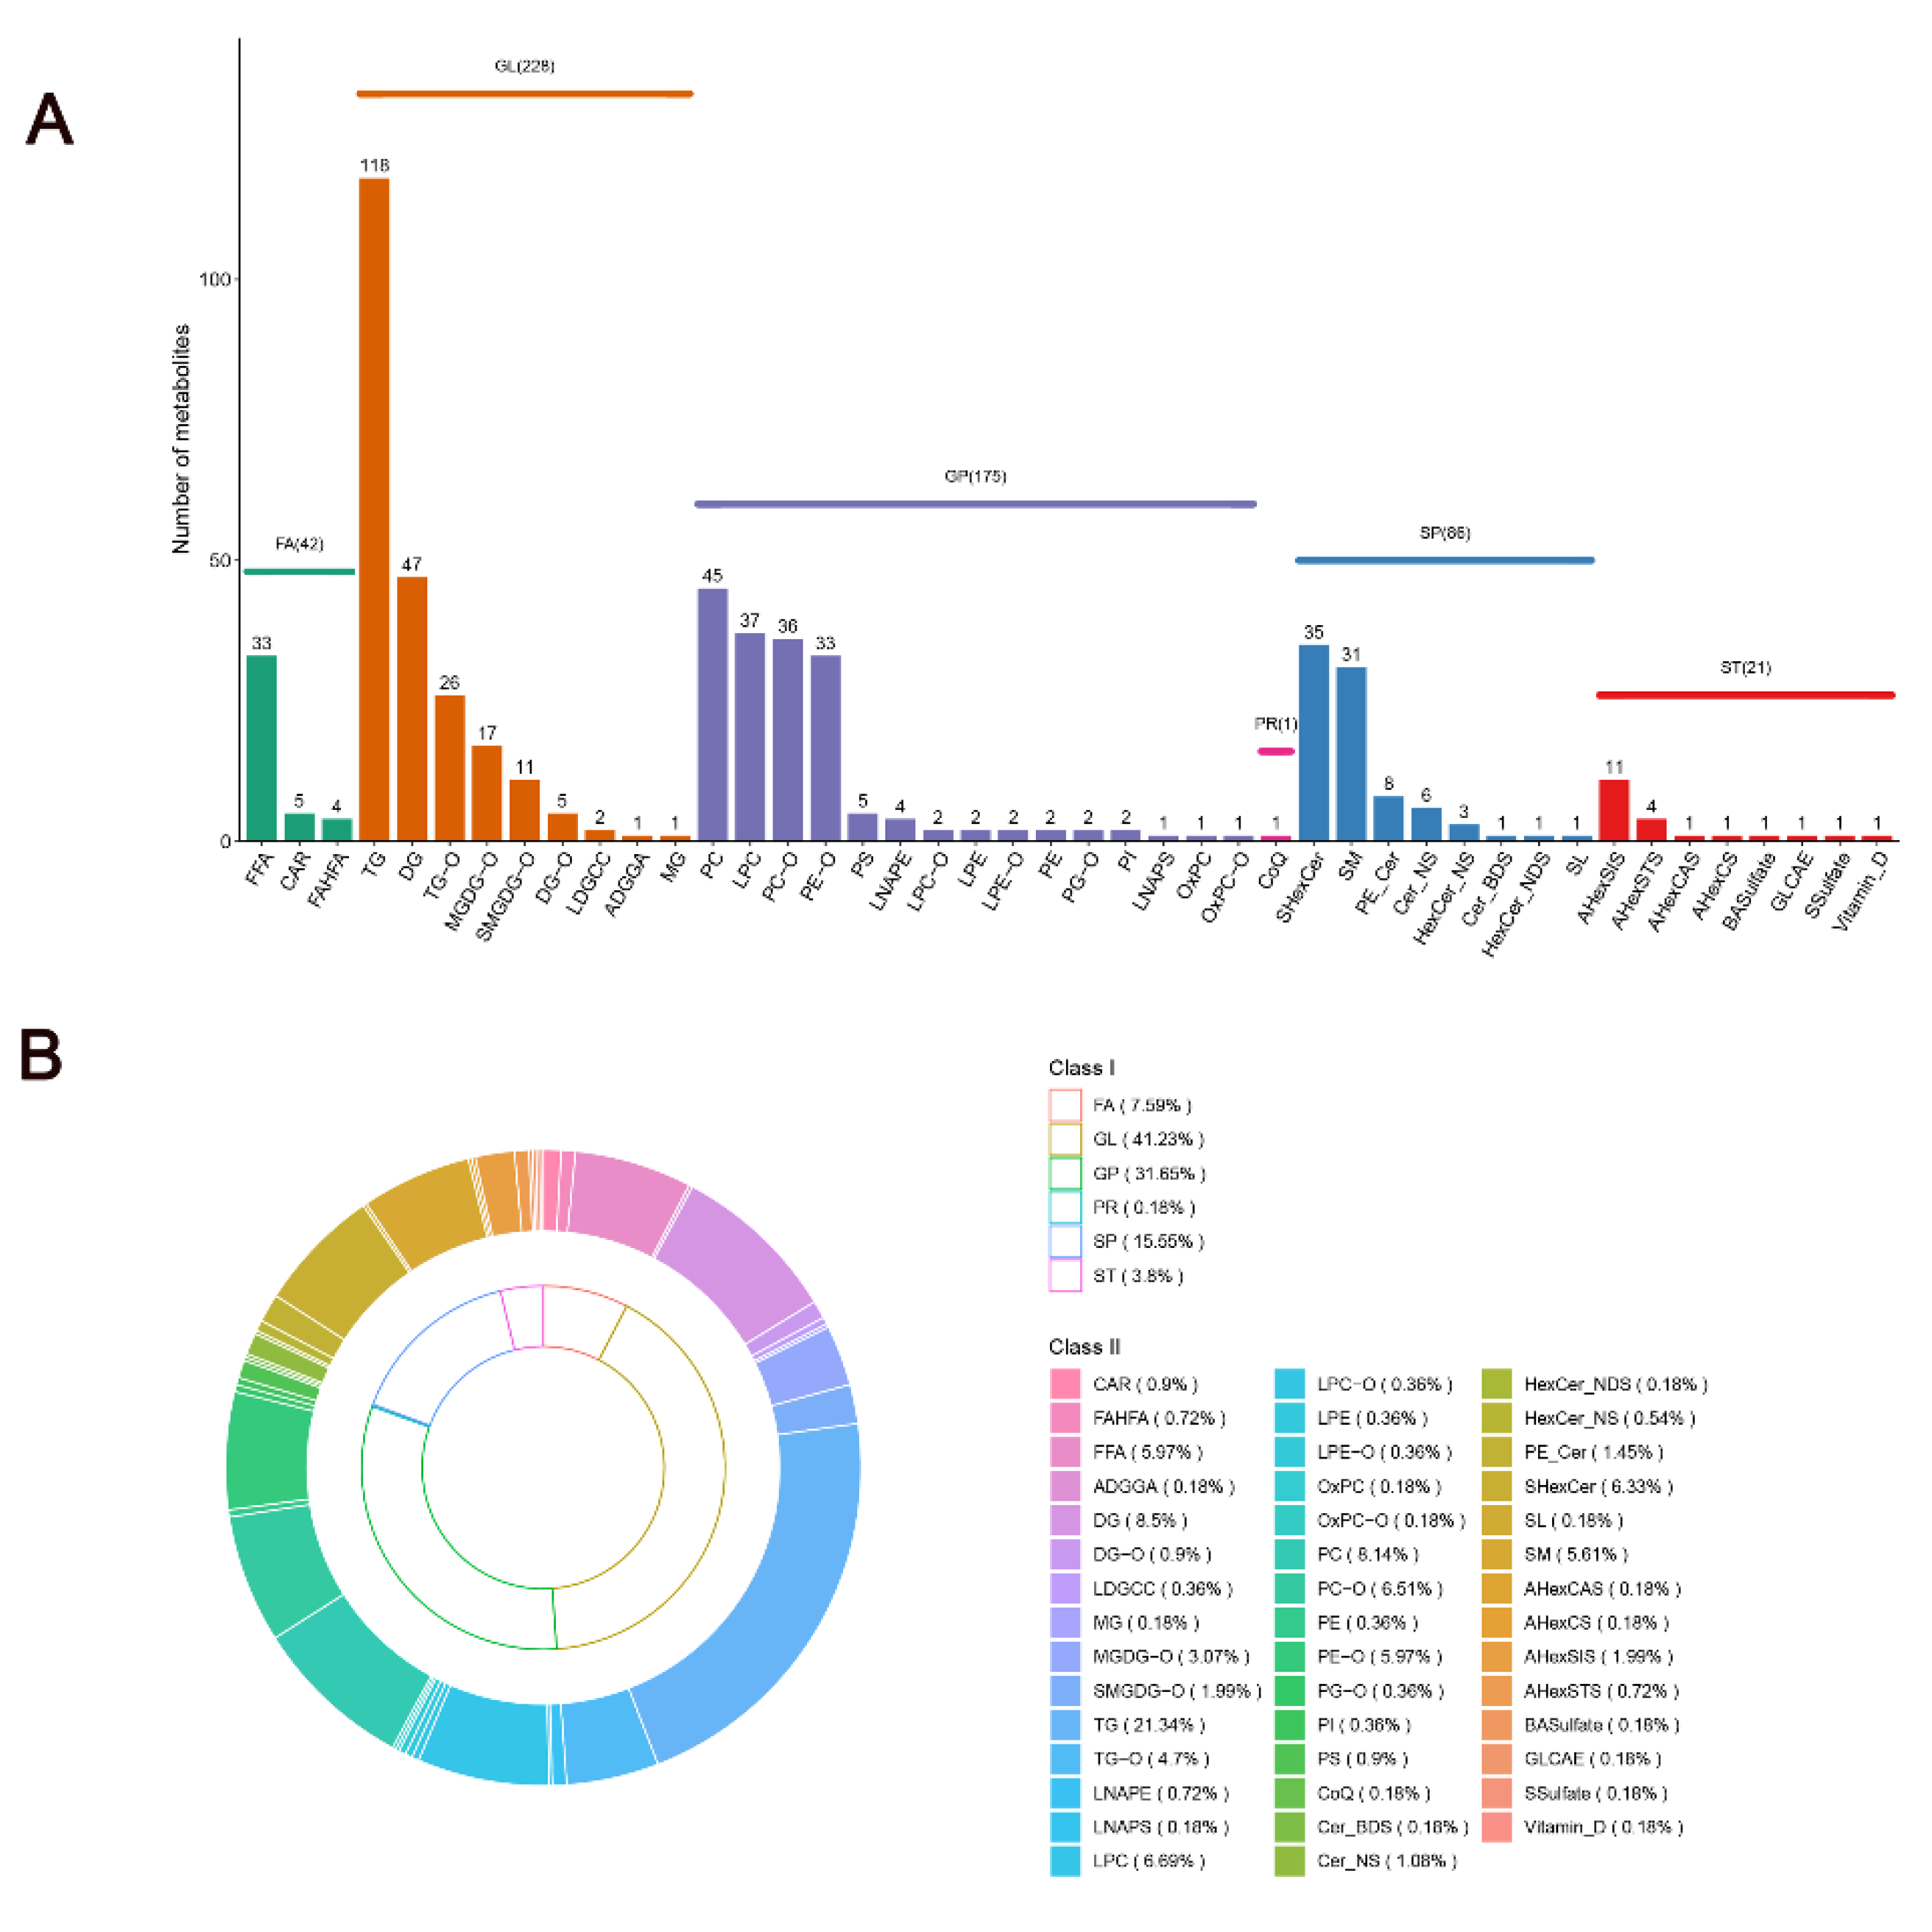
Lipid molecules, which are critical components of meat and vital functional substances in the body, initiate a cascade of physiological and biochemical processes. The lipid profiles of SAT in Mongolian cattle were examined, and the classification of SAT lipids was established. After filtering out lipids detected in the positive and negative ion modes, 553 lipids were successfully characterized in the 10 and 34 M samples. These lipid molecules can be further divided into six classes: glycerolipids (GLs; n = 228; 41.23%), glycerophospholipids (GPs; n = 175; 31.65%), sphingolipids (SPs; n = 86; 15.55%), fatty acyls (FAs; n = 42; 7.59%), sterol lipids (STs; n = 21; 3.80%), and prenol lipids (PRs; n = 1; 0.18%) (Figure 3A,B, Supplementary Data S1). The data suggest that glycerolipids are more abundant. Among glycerolipids, TGs had the most abundant lipid molecules, accounting for 21.34% of the total lipids, followed by DG, which accounted for 8.5% of the total lipid molecules (Figure 3B). Furthermore, the proportions of lipid molecules from four key subclasses of glycerophospholipids—namely, PC, LPC, PC-O, and PE-O were analyzed. Their percentage values were 8.14%, 6.69%, 6.51%, and 5.97% (Figure 3B). It was found that sphingolipids mainly existed in the form of SHexCer and SM, accounting for 6.33% and 5.61% of the total lipid molecules, respectively (Figure 3B). The results of the lipidomic analysis were consistent with those of Xiong et al. [7], who reported that the lipids in the SAT of yaks were mainly composed of DGs, LPCs, PCs, PEs, SMs, and TGs. These results suggested the diversity and complexity of the SAT lipids of Mongolian cattle.

3.3.2. Identification of Characteristic Lipids

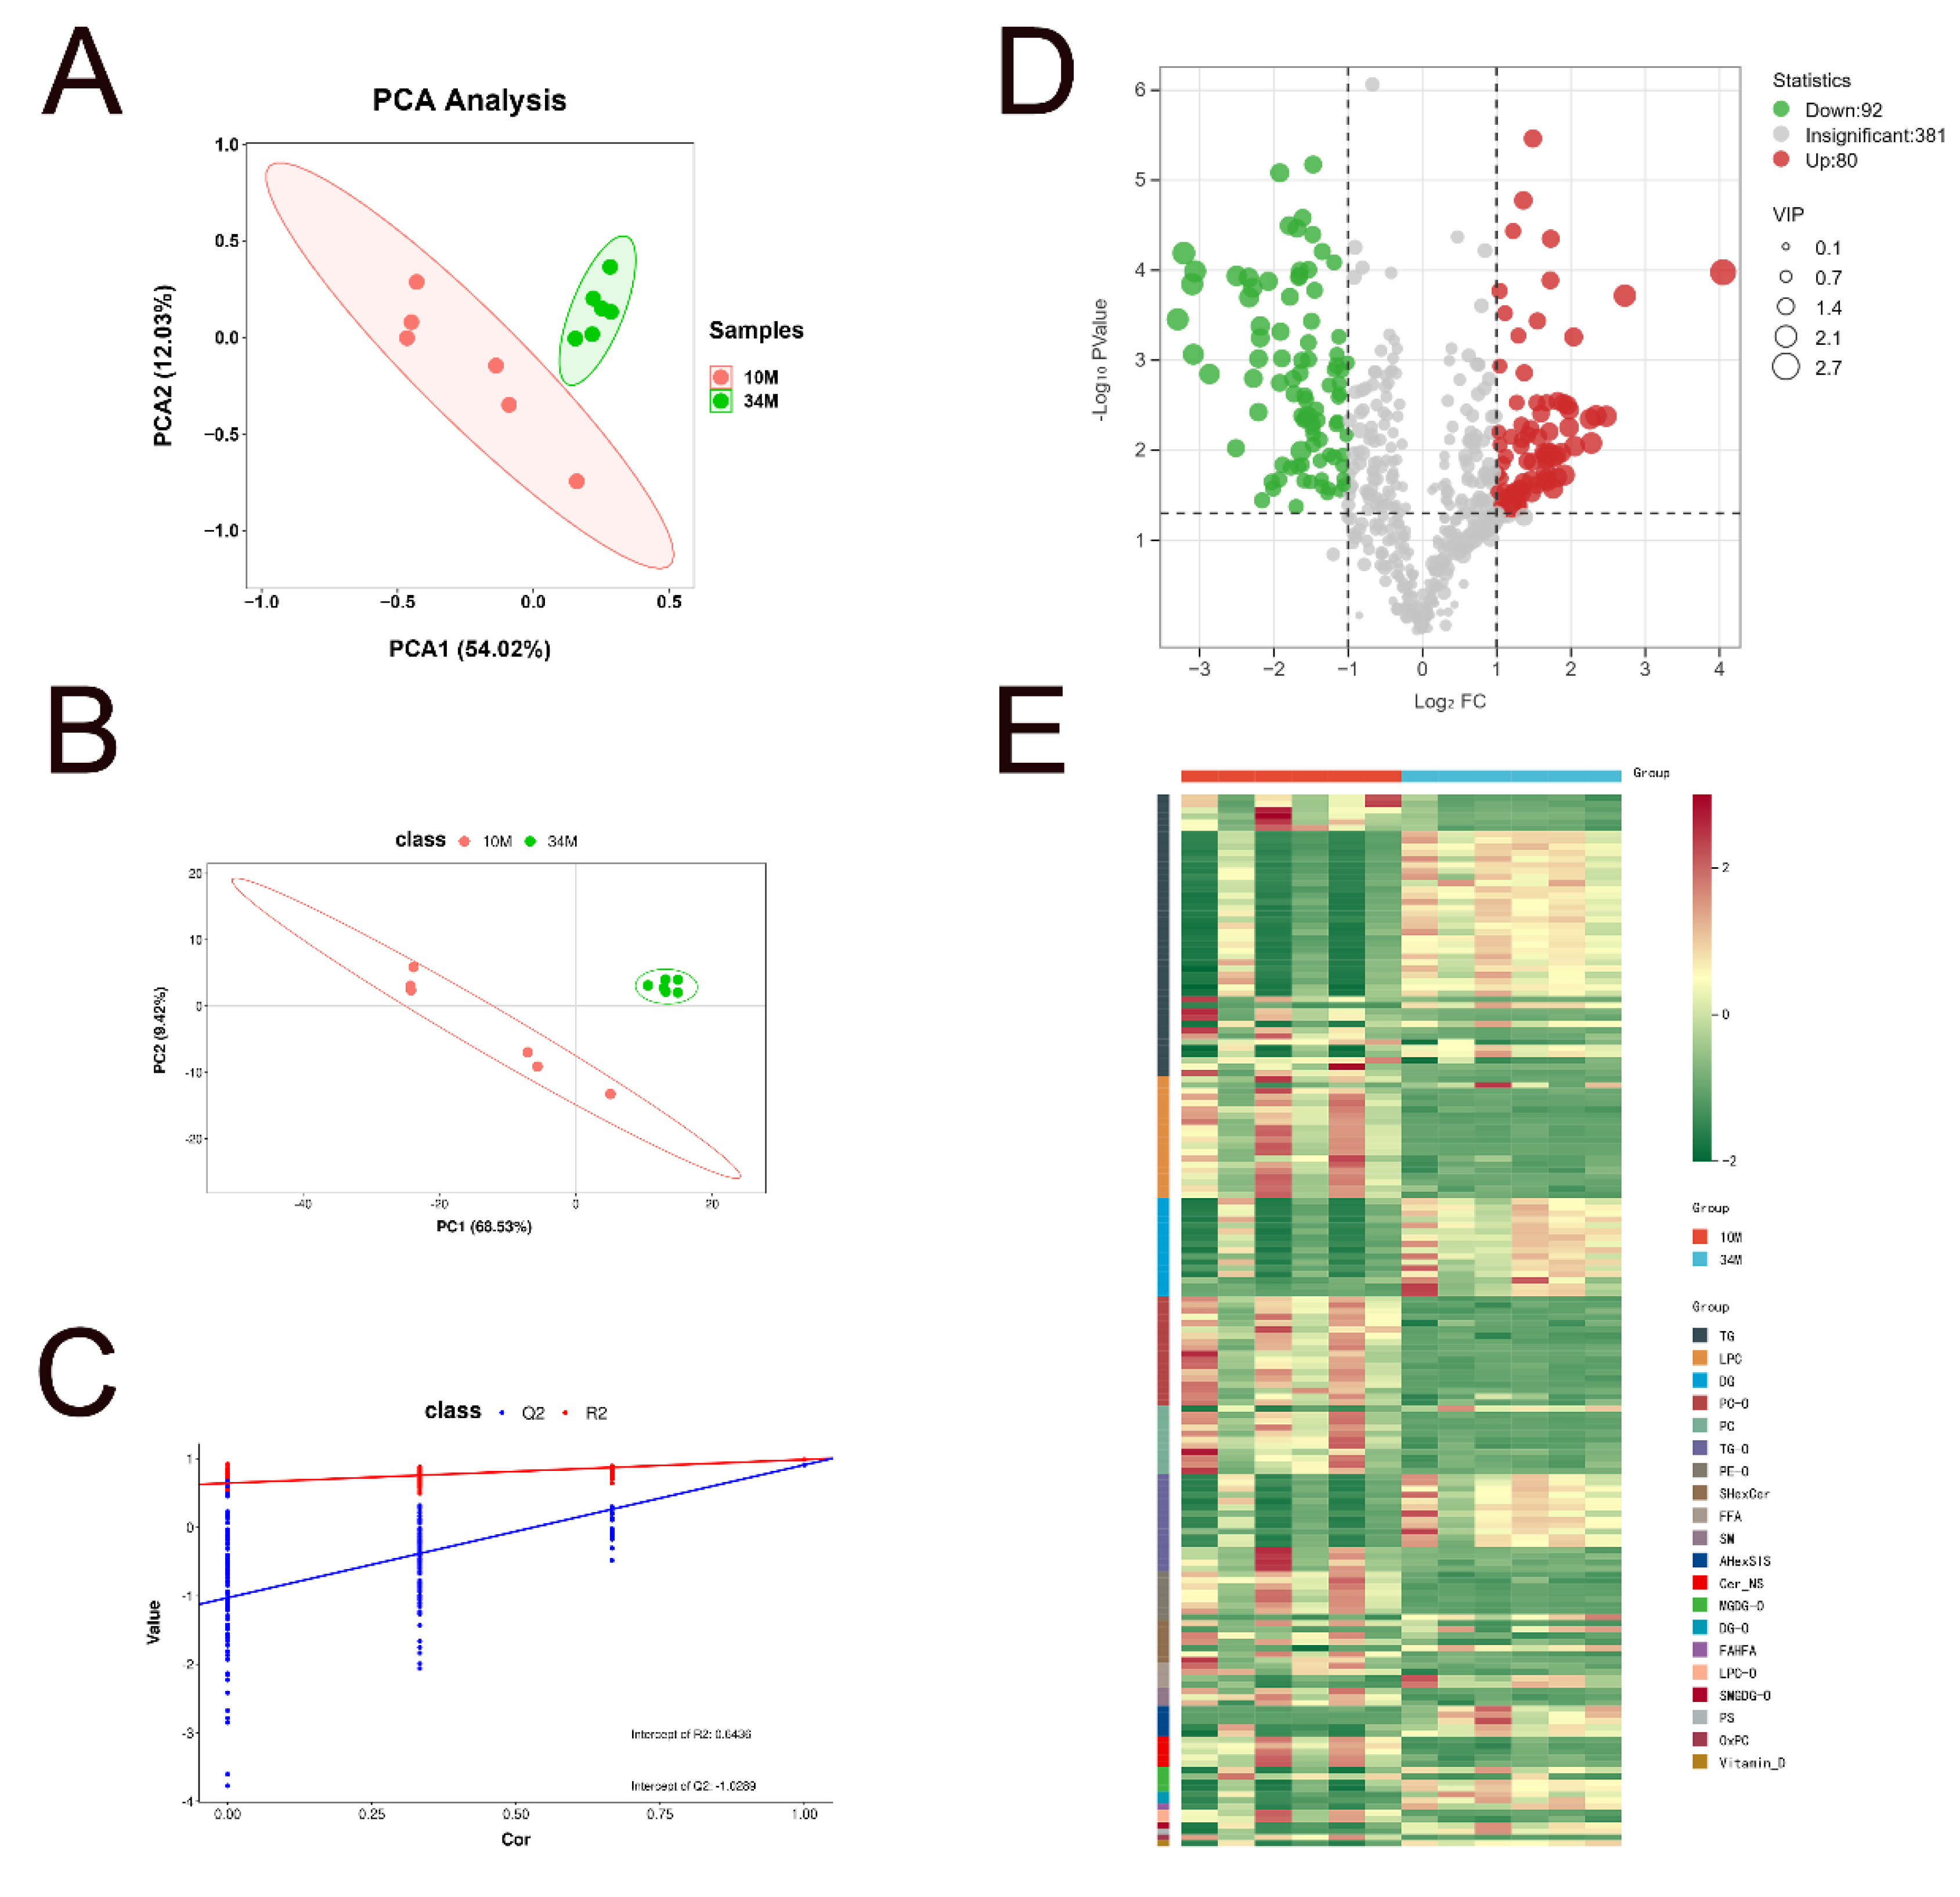
Before identifying differential lipid molecules, the lipid profiles of SAT in Mongolian cattle at 10 and 34 M were compared to distinguish their lipidomic features using unsupervised (PCA) and supervised (PLS-DA) methods. The PCA score plot demonstrates the grouping by principal components (PC1) and (PC2), which explain 54.02% and 12.03% of the total variation, respectively (Figure 4A). Remarkably, PCA analysis showed discrimination between the two groups, suggesting a difference in lipid composition between the 10 and 34 M groups. PLS-DA (Figure 4B,C), a supervised dimensionality reduction method that incorporates class labels in the analysis, maximizes the separation between different predefined groups (e.g., healthy vs. diseased) in the dataset [30]. The model was validated through a comprehensive permutation test to ensure that discrimination in the PLS-DA model was not due to data overfitting. The permutation test (200 repeats) showed that an R2 value of 0.6421 and a Q2 below zero suggest a well-fitted model. The lipid metabolites were further filtered using a combination of p < 0.05 coupled with FC ≥ 2 or FC ≤ 0.5 and VIP > 1 predicted by a PLS-DA model to identify representative lipid metabolites. From the volcano plot results, 172 SDLs were identified (Figure 4D). For better visualization and analysis, a heatmap was generated to compare the SDLs of each lipid subclass (Figure 4E, Supplementary Data S1). The levels of 92 lipids in the SAT of 34 M cattle were considerably lower than those in the SAT of 10 M cattle, including 15 TGs, 19 LPCs, 18 PC-Os, 10 PCs, 4 TG-Os, 7 PE-Os, 5 SHexCers, 2 FFAs, 3 SMs, 5 Cer_NSs, 1 MGDG-O, 2 LPCs, and 1 OxPC. The remaining 80 lipids exhibited increases in the SAT of 34 M cattle, including 31 TGs, 1 LPC, 16 DGs, 1 PC, 12 TG-Os, 1 PE-O, 2 SHexCers, 2 FFAs, 5 AHexSISs, 3 MGDG-Os, 2 DG-Os, 1 FAHFA, 1 SMGDG-O, 1 PS, and 1 vitamin D.
Based on the heatmap observations, there was an increased deposition of phospholipid molecules in the SAT of 10 M cattle. These phospholipids included LPC, PC-O, PC, and PE-O, which are consistent with the findings of Li et al. [31]. The balance between neutral lipids and phospholipids is likely influenced by the total lipid content during development [32]. Therefore, if the total lipid content of cattle increases, neutral lipids may account for a more significant proportion, while there is a corresponding decrease in phospholipid content. Generally, phospholipids are essential components of cell membranes, and their amounts remain relatively constant or increase little as the animal increases in fatness [33].
In the present study, sterol lipid species, including AHexSIS and vitamin D, were abundant in the SAT of 34 M cattle. The top five SDLs with the highest VIP values were observed in the two groups (Figure S1). ST (29:1; 0; Hex; FA 17:1) and ST (29:1; 0; Hex; FA 17:0) were upregulated in the SAT of 34 M cattle, which were considered potential biomarkers to distinguish yellow fat. Furthermore, the presence of vitamin D in the SAT of cattle is likely due to their natural grazing throughout the year. Vitamin D acts as a multifunctional hormone (steroid) and is amongst the most important biomolecules to regularize and help in sustainable health. To the best of our knowledge, this is the first time that AHexSIS and vitamin D have been discovered in the SAT of cattle.
In the SAT of 34 M cattle, FFA (22:0) and FFA (28:0) were upregulated. Conversely, in the SAT of 10 M cattle, FFA (22:6) and FFA (22:5) exhibited upregulation. Wood et al. [33] demonstrated that an increase in saturated fatty acid (SFA) content is related to the acquisition of total ruminal functionality in cattle compared with veal animals. Therefore, increased ruminal activity with increasing ruminant age could explain the increase in SFA with slaughter age. The essential health benefits of docosapentaenoic acid (22:5n−3, DPA) and docosahexaenoic acid (22:6n−3, DHA) have been extensively studied [34]. These acids play essential roles in the growth, development, optimal functioning, and maintenance of health and well-being throughout life. In addition, a certain intensity of FAHFA was upregulation in the SAT of 34 M, which was believed to be a functional lipid that can be used for the treatment of metabolic or inflammatory diseases [35].

3.3.3. Distribution and Composition of Fatty Acids in Lipid Molecules

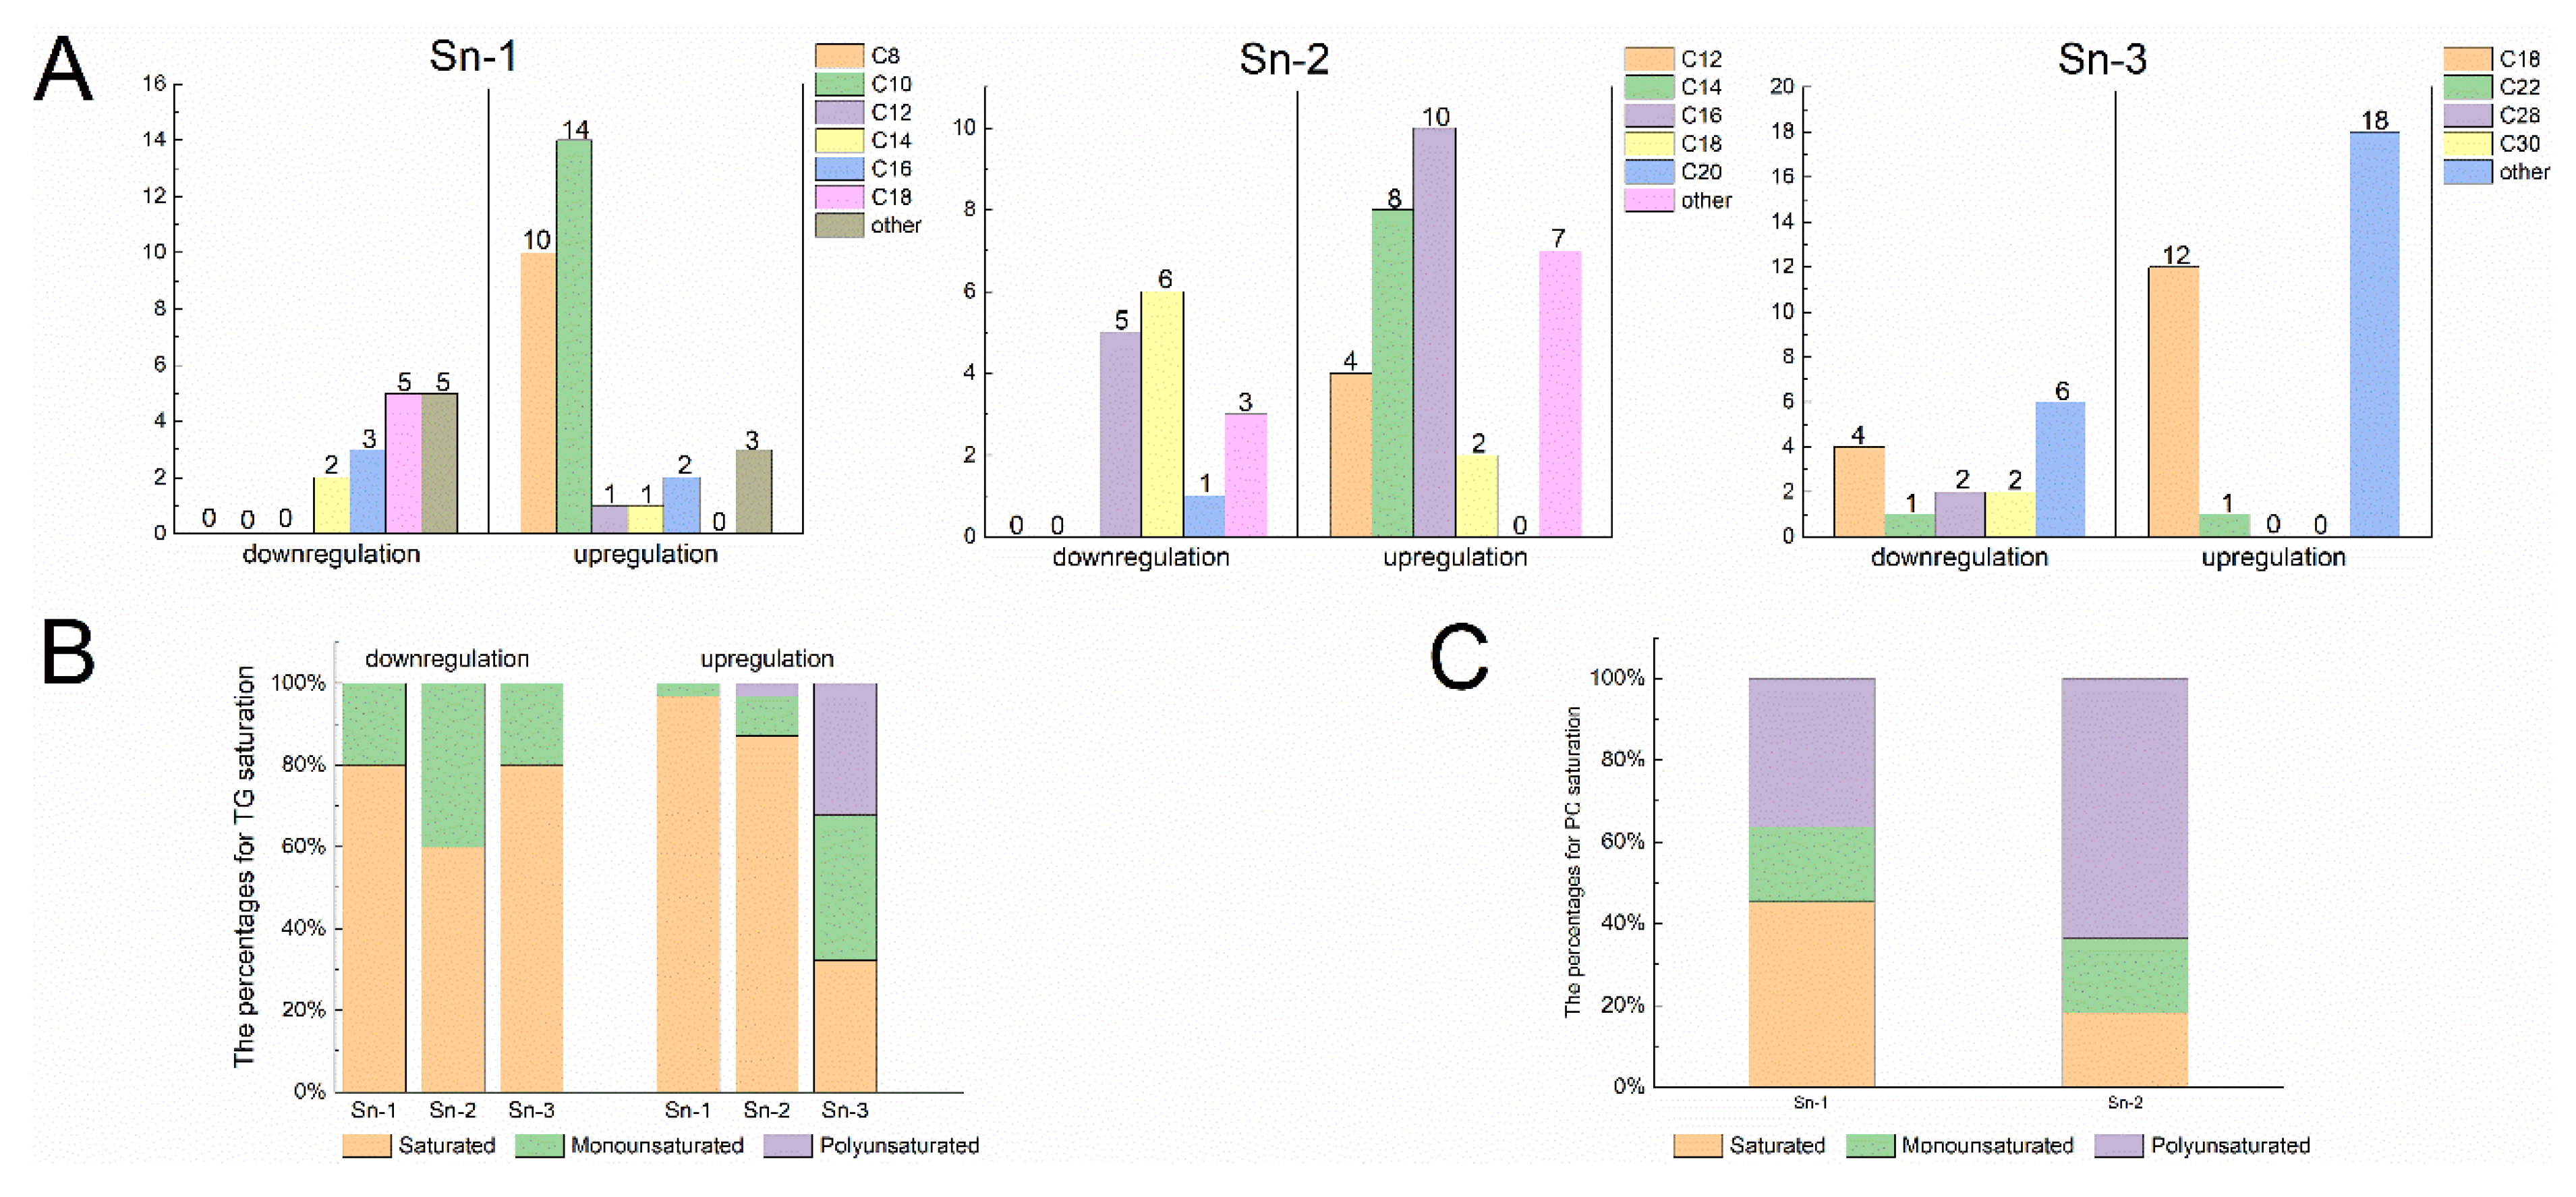
Except for a minor portion of fatty acids existing as free fatty acids, most fatty acyl molecules play a fundamental role in the lipid structure [36]. Molecules participate in the formation of glycerol backbones through esterification, generating GP and GL. These molecules interact with other complex lipids, influencing various aspects such as food texture, flavor compound formation, and nutritional value [37]. As shown in Figure 5A, an increase in medium-chain fatty acids (MCFAs) at the sn-1 site of TG molecules was observed in 34 M cattle, primarily consisting of C8 and C10. Conversely, the FA composition at the sn-1 site of TG molecules primarily consists of long-chain fatty acids (LCFAs) in 10 M cattle. Furthermore, ultra-LCFAs even emerged at the sn-3 sites of TG. Research showed that cold stimulation can lead to highly selective increases in the abundance of long-chain, ultra-long-chain, and odd-chain acyls [38]. These long acyl chains are then directed toward the α-oxidation pathway, which typically processes branched-chain fatty acids and subsequently enters the classical β-oxidation pathway [38]. The increased α- and β-oxidation of these triglycerides (TAGs) may contribute to heat production in 10 M cattle. Additionally, it was observed that most of the upregulated TAGs in the SAT of 34 M cattle consisted of MCFAs and LCFAs. In contrast, those with downregulated expression had few short-chain fatty acids and MCFAs. As is well known, long-chain triglycerides, mainly consumed in the daily diet, have a slower metabolism rate, and long-term consumption may lead to fat accumulation in the body. However, medium- and long-chain triglyceride (MLCT) formed by combinations of MCFAs and LCFAs, including MLM, MML, LMM, LML, MLL, and LLM (where L stands for LCFA and M stands for MCFA), are more digestible and absorbable [39]. MLCT reduces body fat accumulation and improves insulin resistance. Therefore, it is believed that the fat tissue of aged cattle may provide energy to the human body more efficiently and be of greater value compared with that of calves.
Figure 5B shows the saturation levels at three sites of upregulated and downregulated TG molecules in SDLs. In the SAT of 10 M cattle, the sn-1 and sn-3 sites of TGs predominantly display SFAs, with no PUFAs detected. Conversely, in the SAT of 34 M cattle, the sn-1 and sn-2 sites of TG are primarily composed of SFAs, while the sn-3 site exhibits a higher proportion of MUFAs and PUFAs. Interestingly, the TG species upregulated at the sn-3 position in the 34 M cattle group were rich in essential fatty acids, such as DPA, linoleic acid, and α-linolenic acid. Examples of these TGs include TG (8:0_16:0_18:3), TG (10:0_15:0_18:2), TG (10:0_16:0_18:3), TG (10:0_16:0_18:2), TG (10:0_15:0_22:5), TG (16:0_18:2_18:3), and TG (17:1_18:1_18:3). This finding is consistent with the study by Xiong et al. [7], which indicated that functionally high UFAs were found at the sn-3 position of TGs in the SAT of grazing cattle. Thus, Mongolian cattle in natural grazing accumulate significantly rich functional lipids in SAT, which may have potential nutritional advantages. Furthermore, based on our current findings, fatty acids in PCs were predominantly saturated at the sn-1 site. In contrast, the sn-2 sites of PC contained a high proportion of PUFAs (Figure 5C). The SAT of 10 M cattle had a significantly higher content of PUFA-enriched PCs, such as PC (18:2_20:4), PC (18:3_20:4), PC (18:1_20:4), PC (18:0_20:4), PC (20:4_20:4), and PC (20:3_20:3). In ruminants, PUFAs are preferentially deposited in phospholipids. Their primary role in metabolism and physiology helped to elucidate the potential beneficial effects of meat [15]. The results indicate that UFAs in PCs, especially ARA, were upregulated in the SAT of 10 M cattle, which may be related to the age of the cattle.

3.3.4. Metabolic Pathway Analysis

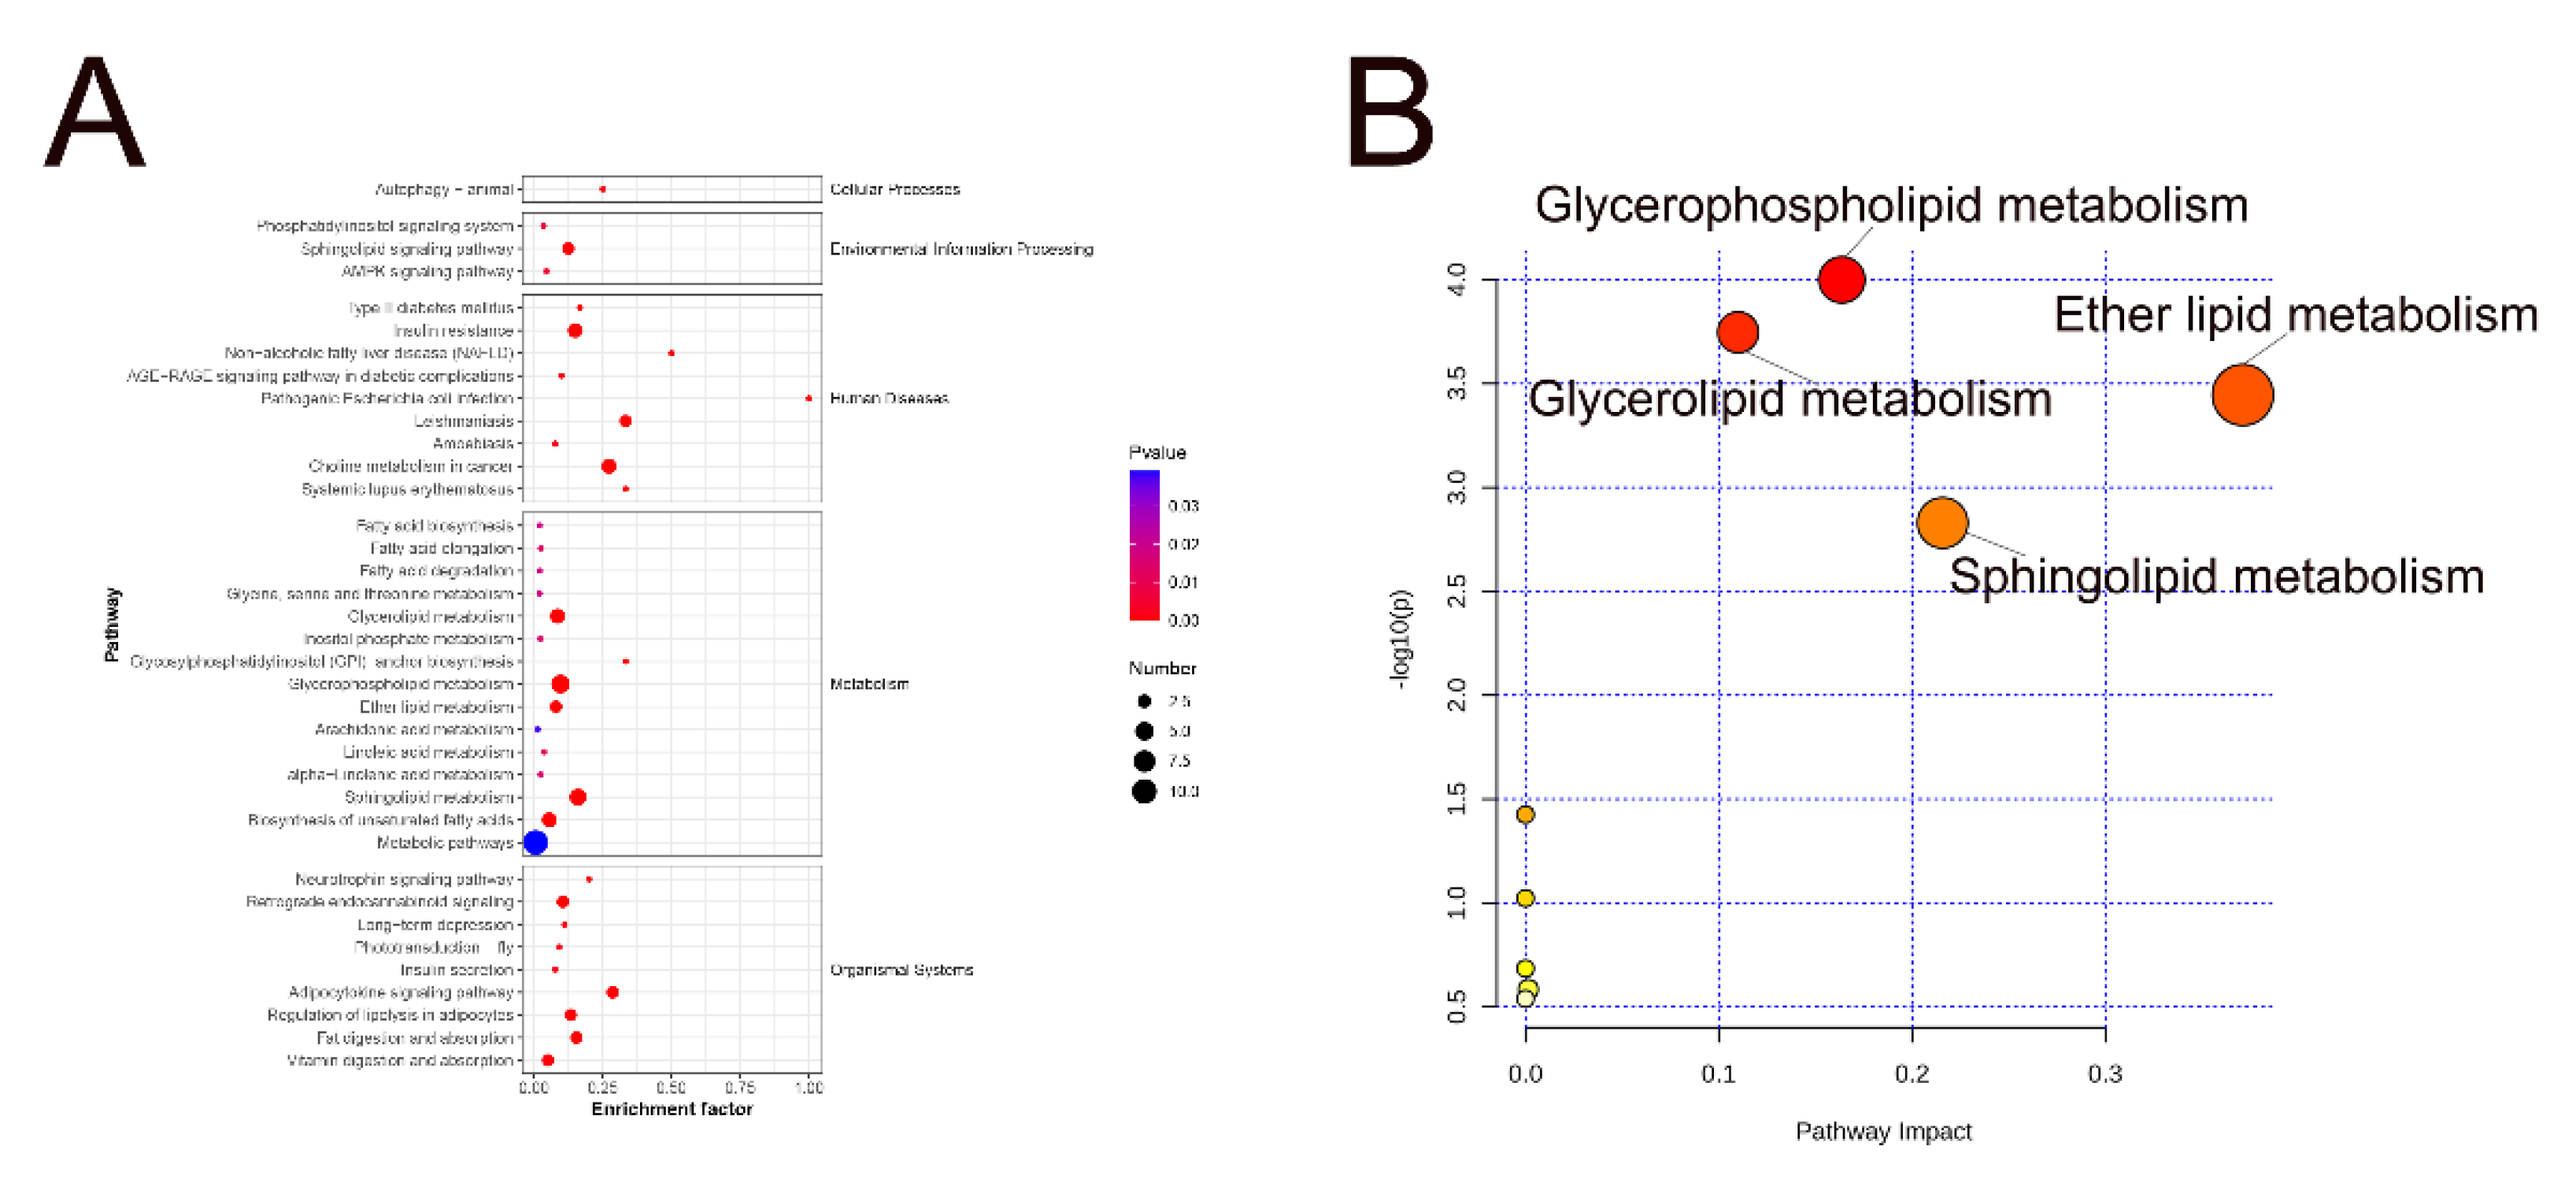
To investigate differences in the lipid metabolic pathways of SAT in Mongolian cattle, we performed KEGG classification on 37 pathways related to 172 SDLs (Figure 6A). Using the MetaboAnalyst 5.0 platform (https://www.metaboanalyst.ca/), we conducted topology analysis on these lipids, calculating p-values and pathway influence. Significance was attributed to correlation pathways with a p < 0.05 and an effect value > 0.1 (Figure 6B). Ten metabolic pathways associated with lipid changes were identified, including glycerophospholipid metabolism, glycerolipid metabolism, sphingolipid metabolism, fatty acid degradation, ether lipid metabolism, inositol phosphate metabolism, ARA metabolism, linoleic acid metabolism, alpha-linolenic acid metabolism, and the phosphatidylinositol signaling system. Notably, the glycerophospholipid and glycerolipid pathways exhibited significant differences between the 10 and 34 M cattle groups, followed by ether lipid and sphingolipid metabolism (Table S2). These findings have suggested a significant difference in lipid metabolisms in the 10 and 34 M groups.
Glycerophospholipids are the major structural lipids of eukaryotic cell membranes and regulate various cellular metabolic processes. Moreover, phospholipases play crucial roles in phospholipid metabolism and cell signaling. Glycerophospholipid metabolism primarily regulates PC, PS, and LPC, with PC and LPC being the predominant species. The LPC levels received particular attention among the GPs of SDLs identified in the 10 and 34 M groups, which exhibited the most significant changes. The ratio of LPC (20:3)/PC (20:3_20:3) in the study increased from 1:7.30 to 1:0.89 between 10 M to 34 M groups. This change suggests that the lipid transformations of PC and LPC progressed based on glycerophospholipid metabolism, reflecting the activity of phospholipase A. Specifically, LPC can be generated through the cleavage of PC molecules by phospholipase A2 [40]. Additionally, LPC and acyl-coenzyme A can form PC in the presence of lysophospholipid acyltransferase. Additionally, DGs showed an upward trend in the SAT of 34 M cattle. DGs serve as raw material sources for synthesizing PC, PE, PE-O, and PC-O. The decrease in DG content in 10 M cattle may be attributed to two factors. First, hydrolysis by various lipases could contribute to this decrease [41]. Second, certain DG species might participate in the synthesis of PE and PC. This involvement can occur either through corresponding phosphotransferases or via CDP-DAGm acting as a lipid anchor [42]. This explains why there were significantly higher PC levels in the SAT of the 10 M cattle compared with 34 M cattle.
Ether phospholipids (such as PC-O, PE-O, and LPC-O) are primarily associated with ether lipid metabolism (Figure 6B). Ether phospholipid species showed a downward trend in the SAT of 34 M cattle. Cohen et al. [43] revealed that white adipocytes exhibit higher levels of PE and PC ether lipids as well as lipid species containing long-chain PUFAs compared to beige and brown adipocytes. PE-O was also observed in the hind legs of Xinjiang fine wool sheep [44]. The changes in these ether lipids may be attributed to the age of the cattle.

5. Conclusions

Herein, SAT from 34 M cattle exhibited deeper yellowness than SAT from 10 M cattle. The expression of mitochondrial biogenesis–specific marker genes, thermogenic genes, and beige adipocyte marker genes showed relative upregulation in the SAT of 34 M cattle. It was suggested that the abundance of beige adipocytes may increase with advancing age, potentially impacting fat color and lipid metabolism. UCP2 may be involved in the browning of SAT in Mongolian cattle. Lipidomics analysis revealed that 172 SDLs were selected from a pool of 553 lipids in the 10 and 34 M age groups. These SDLs exhibited high proportions of GLs and GPs. TGs and PCs had high relative content with abundant UFAs, specifically linoleic acid, linolenic acid, and ARA. The upward trend of TG observed in the SAT of the 34 M cattle mainly consists of MCFAs and LCFAs. In addition, the sn-3 position, which is rich in essential fatty acids. Pathway analysis indicated that the most significant metabolic pathways were glycerophospholipid and glycerolipid metabolism, followed by ether lipid and sphingolipid metabolism. This work conducted theoretical evidence of yellow fat derived from natural grazing Mongolian cattle.

Supplementary Materials

The following supporting information can be downloaded at: www.mdpi.com/xxx/s1, Figure S1: five lipid molecules with the highest VIP scores and significantly different abundances. Table S1: RT-qPCR primer sequences. Table S2: Metabolic pathway with significant enrichment of differential lipids, Supplementary Date S1: 553 total lipid metabolites; Supplementary Date S2: 172 significantly different lipids.

Author Contributions

Conceptualization: X.Y., R.S., and G.B.; Methodology: X.Y., and G.B.; Software: X.Y., X.H., L.C., and J.W.; Validation: X.Y., Y.H. (Yunfei Han), and X.H.; Formal analysis: X.Y., and L.C.; Investigation: X.Y., Y.H. (Yunfei Han), Y.H. (Yajuan Huang), L.C., X.H., and J.W.; Resources: G.B.; Data curation: X.Y., and X.H..; Writing—original draft preparation: X.Y.; Writing—review and editing: X.Y., X.H., and G.B.; Visualization: X.Y., Y.H. (Yajuan Huang), and L.C.; Supervision: R. S. and G.B.; Project administration: R.S. and G.B.; Funding acquisition: G.B. All authors have read and agreed to the published version of the manuscript.

Funding

This research was funded by the National Nature Science Foundation of China, grant number 32260556.

Institutional Review Board Statement

This study complied with the Laboratory Animal—Guideline for ethical review of animal welfare (National Technical Committee on Laboratory Animals of Standardization Administration of China, 2018) and was approved by the Specialized Committee on Scientific Research and Academic Ethics of Inner Mongolia Agricultural University (approval document number [2022]086).

Informed Consent Statement

Not applicable.

Data Availability Statement

The data presented in this study are available on request from the corresponding author.

Acknowledgments

We appreciate the generous help received from the Laboratory of Meat Science and Biotechnology of the Inner Mongolia Agricultural University, China.

Conflicts of Interest

The authors declare no conflict of interest.

References

  1. Leiria, L.O.; Tseng, Y.H. Lipidomics of brown and white adipose tissue: Implications for energy metabolism. BBA - Gen Subjects. 2020, 1865, 158788–158788. [Google Scholar] [CrossRef] [PubMed]
  2. Xue, S.; Lee, D.; Berry, D.C. Thermogenic adipose tissue in energy regulation and metabolic health. Front. Endocrinol. 2023, 14. [Google Scholar] [CrossRef] [PubMed]
  3. Ikeda, K.; Maretich, P.; Kajimura, S. The Common and Distinct Features of Brown and Beige Adipocytes. Trends Endocrinol Metab. 2018, 29, 191–200. [Google Scholar] [CrossRef] [PubMed]
  4. Barbatelli, G.; Murano, I.; Madsen, L.; Hao, Q.; Jimenez, M.; Kristiansen, K.; Giacobino, J.P.; De, M.R.; Cinti, S. The emergence of cold-induced brown adipocytes in mouse white fat depots is determined predominantly by white to brown adipocyte transdifferentiation. Am J Physiol Endocrinol Metab. 2010, 298, E1244–1253. [Google Scholar] [CrossRef] [PubMed]
  5. Li, T.; Bai, H.; Yang, L.; Wang, H.; Wei, S.; Yan, P. Cold exposure induces browning of bovine subcutaneous white fat in vivo and in vitro. J. Therm. Biol. 2023, 112, 103446–103446. [Google Scholar] [CrossRef]
  6. Du, L.; Chang, T.; An, B.; Liang, M.; Deng, T.; Li, K.; Cao, S.; Du, Y.; Gao, X.; Xu, L.; et al. Transcriptomics and Lipid Metabolomics Analysis of Subcutaneous, Visceral, and Abdominal Adipose Tissues of Beef Cattle. Genes. 2022, 14. [Google Scholar] [CrossRef]
  7. Xiong, L.; Pei, J.; Bao, P.; Wang, X.; Guo, S.; Cao, M.; Kang, Y.; Yan, P.; Guo, X. The Effect of the Feeding System on Fat Deposition in Yak Subcutaneous Fat. Int. J. Mol. Sci. 2023, 24. [Google Scholar] [CrossRef]
  8. Gu, X.; Sun, W.; Yi, K.; Yang, L.; Chi, F.; Luo, Z.; Wang, J.; Zhang, J.; Wang, W.; Yang, T.; et al. Comparison of muscle lipidomes between cattle-yak, yak, and cattle using UPLC–MS/MS. J. Food Compos. Anal. 2021, 103. [Google Scholar] [CrossRef]
  9. Dunne, P.G.; Monahan, F.J.; O’Mara, F.P.; Moloney, A.P. Colour of bovine subcutaneous adipose tissue: A review of contributory factors, associations with carcass and meat quality and its potential utility in authentication of dietary history. Meat Sci. 2008, 81, 28–45. [Google Scholar] [CrossRef]
  10. Ahmad, A.A.; Zhang, J.; Liang, Z.; Du, M.; Yang, Y.; Zheng, J.; Yan, P.; Long, R.; Tong, B.; Han, J.; et al. Age-dependent variations in rumen bacterial community of Mongolian cattle from weaning to adulthood. BMC Microbiol. 2022, 22, 213–213. [Google Scholar] [CrossRef]
  11. Aricha, H.; Simujide, H.; Wang, C.; Zhang, J.; Lv, W.; Jimisi, X.; Liu, B.; Chen, H.; Zhang, C.; He, L.; et al. Comparative Analysis of Fecal Microbiota of Grazing Mongolian Cattle from Different Regions in Inner Mongolia, China. Animals. 2021, 11, 1938–1938. [Google Scholar] [CrossRef] [PubMed]
  12. Bao, J.; Wang, Z.; Zhao, M.; Wang, Y.; Zhang, J.; Li, Y.; Gegen, T.; Jia, Y. Study on quality characteristics of natural pastures in different steppe types. Feed. 2022, 45, 75–78. [Google Scholar]
  13. Wei, S.; Zhang, M.; Zheng, Y.; Yan, P. ZBTB16 Overexpression Enhances White Adipogenesis and Induces Brown-Like Adipocyte Formation of Bovine White Intramuscular Preadipocytes. Cell. Physiol. Biochem. 2018, 48, 2528–2538. [Google Scholar] [CrossRef]
  14. Shemeis, A.R.; Liboriussen, T.; Andersen, B.B.; Abdallah, O.Y. Changes in carcass and meat quality traits of Danish friesian cull cows with the increase of their age and body condition. Meat Sci. 1994, 37, 161–167. [Google Scholar] [CrossRef] [PubMed]
  15. Vahmani, P.; Ponnampalam, E.N.; Kraft, J.; Mapiye, C.; Bermingham, E.N.; Watkins, P.J.; Proctor, S.D.; Dugan, M.E.R. Bioactivity and health effects of ruminant meat lipids. Invited Review. Meat Sci. 2020, 165. [Google Scholar] [CrossRef] [PubMed]
  16. Kaaman, M.; Sparks, L.M.; van Harmelen, V.; Smith, S.R.; Sjölin, E.; Dahlman, I.; Arner, P. Strong association between mitochondrial DNA copy number and lipogenesis in human white adipose tissue. Diabetologia. 2007, 50, 2526–2533. [Google Scholar] [CrossRef]
  17. Pohjoismäki, J.L.O.; Goffart, S.; Taylor, R.W.; Turnbull, D.M.; Suomalainen, A.; Jacobs, H.T.; Karhunen, P.J. Developmental and Pathological Changes in the Human Cardiac Muscle Mitochondrial DNA Organization, Replication and Copy Number. PLoS ONE. 2010, 5, 1–9. [Google Scholar] [CrossRef]
  18. Barazzoni, R.; Short, K.R.; Nair, K.S. Effects of aging on mitochondrial DNA copy number and cytochromec oxidase gene expression in rat skeletal muscle, liver, and heart. J. Biol. Chem. 2000, 275, 3343–3347. [Google Scholar] [CrossRef]
  19. Hou, L.; Xie, M.; Cao, L.; Shi, J.; Xu, G.; Hu, C.; Wang, C. Browning of Pig White Preadipocytes by Co-Overexpressing Pig PGC-1alpha and Mice UCP1. Cell Physiol Biochem. 2018, 48, 556–568. [Google Scholar] [CrossRef]
  20. Xu, L.; Zhou, L.; Li, P. CIDE Proteins and Lipid Metabolism. Arterioscler Thromb Vasc Biol. 2012, 32, 1094–1098. [Google Scholar] [CrossRef] [PubMed]
  21. Seale, P.; Conroe, H.M.; Estall, J.; Kajimura, S.; Frontini, A.; Ishibashi, J.; Cohen, P.; Cinti, S.; Spiegelman, B.M. Prdm16 determines the thermogenic program of subcutaneous white adipose tissue in mice. J Clin Invest. 2011, 121, 96–105. [Google Scholar] [CrossRef]
  22. Wu, Z.; Puigserver, P.; Andersson, U.; Zhang, C.; Adelmant, G.; Mootha, V.; Troy, A.; Cinti, S.; Lowell, B.; Scarpulla, R.C.; et al. Mechanisms Controlling Mitochondrial Biogenesis and Respiration through the Thermogenic Coactivator PGC-1. Cell. 1999, 98, 115–124. [Google Scholar] [CrossRef] [PubMed]
  23. Anderson, R.; Prolla, T. PGC-1α in aging and anti-aging interventions. BBA - Gen Subjects. 2009, 1790, 1059–1066. [Google Scholar] [CrossRef]
  24. Harms, M.; Seale, P. Brown and beige fat: development, function and therapeutic potential. Nat. Med. 2013, 19, 1252–1263. [Google Scholar] [CrossRef] [PubMed]
  25. Shin, W.; Okamatsu-Ogura, Y.; Machida, K.; Tsubota, A.; Nio-Kobayashi, J.; Kimura, K. Impaired adrenergic agonist-dependent beige adipocyte induction in aged mice. Obesity. 2017, 25, 417–423. [Google Scholar] [CrossRef]
  26. Silva, G.d.N.; Amato, A.A. Thermogenic adipose tissue aging: Mechanisms and implications. Front. Cell Dev. Biol. 2022, 10, 955612. [Google Scholar] [CrossRef]
  27. Félix-Soriano, E.; Sáinz, N.; Gil-Iturbe, E.; Castilla-Madrigal, R.; Celay, J.; Fernández-Galilea, M.; Pejenaute, Á.; Lostao, M.P.; Martínez-Climent, J.A.; Moreno-Aliaga, M.J. Differential remodeling of subcutaneous white and interscapular brown adipose tissue by long-term exercise training in aged obese female mice. J. Physiol. Biochem. 2023, 79, 451–465. [Google Scholar] [CrossRef] [PubMed]
  28. Sano, T.; Sanada, T.; Sotomaru, Y.; Shinjo, T.; Iwashita, M.; Yamashita, A.; Fukuda, T.; Sanui, T.; Asano, T.; Kanematsu, T. Ccr7 null mice are protected against diet-induced obesity via Ucp1 upregulation and enhanced energy expenditure. Nutr. Metab. 2019, 16, 43. [Google Scholar] [CrossRef]
  29. Shigematsu, M.; Yamada, T.; Wong, Y.Y.; Kanamori, Y.; Murakami, M.; Fujimoto, Y.; Suzuki, M.; Kida, R.; Qiao, Y.; Tomonaga, S. Dietary regulation of Ucp2 and Ucp3 expressions in white adipose tissues of beef cattle. Can. J. Anim. Sci. 2016, 457–460. [Google Scholar] [CrossRef]
  30. Pousinis, P.; Gowler, P.R.W.; Burston, J.J.; Ortori, C.A.; Chapman, V.; Barrett, D.A. Lipidomic identification of plasma lipids associated with pain behaviour and pathology in a mouse model of osteoarthritis. Metabolomics. 2020, 16, 32. [Google Scholar] [CrossRef]
  31. Li, J.; Yang, Y.; Zhan, T.; Zhao, Q.; Zhang, J.; Ao, X.; He, J.; Zhou, J.; Tang, C. Effect of slaughter weight on carcass characteristics, meat quality, and lipidomics profiling in longissimus thoracis of finishing pigs. Lwt. 2021, 140. [Google Scholar] [CrossRef]
  32. Yang, Y.; Zhao, C.; Xiao, S.; Zhan, H.; Du, M.; Wu, C.; Ma, C. Lipids deposition, composition and oxidative stability of subcutaneous adipose tissue and Longissimus dorsi muscle in Guizhou mini-pig at different developmental stages. Meat Sci. 2010, 84, 684–690. [Google Scholar] [CrossRef] [PubMed]
  33. Wood, J.D.; Enser, M.; Fisher, A.V.; Nute, G.R.; Sheard, P.R.; Richardson, R.I.; Hughes, S.I.; Whittington, F.M. Fat deposition, fatty acid composition and meat quality: A review. Meat Sci. 2008, 78, 343–358. [Google Scholar] [CrossRef]
  34. Shahidi, F.; Ambigaipalan, P. Omega-3 Polyunsaturated Fatty Acids and Their Health Benefits. Annu Rev. Food Sci Technol. 2018, 9, 345–381. [Google Scholar] [CrossRef] [PubMed]
  35. Pham, T.H.; Vidal, N.P.; Manful, C.F.; Fillier, T.A.; Pumphrey, R.P.; Doody, K.M.; Thomas, R.H. Moose and Caribou as Novel Sources of Functional Lipids: Fatty Acid Esters of Hydroxy Fatty Acids, Diglycerides and Monoacetyldiglycerides. Molecules. 2019, 24. [Google Scholar] [CrossRef]
  36. Vanni, S.; Riccardi, L.; Palermo, G.; De Vivo, M. Structure and Dynamics of the Acyl Chains in the Membrane Trafficking and Enzymatic Processing of Lipids. Acc. Chem. Res. 2019, 52, 3087–3096. [Google Scholar] [CrossRef]
  37. Cao, Z.; Xu, M.; Qi, S.; Xu, X.; Liu, W.; Liu, L.; Bao, Q.; Zhang, Y.; Xu, Q.; Zhao, W.; et al. Lipidomics reveals lipid changes in the intramuscular fat of geese at different growth stages. Poultry Sci. 2023, 103, 103172–103172. [Google Scholar] [CrossRef] [PubMed]
  38. Marcher, A.-B.; Loft, A.; Nielsen, R.; Vihervaara, T.; Madsen, J.G.S.; Sysi-Aho, M.; Ekroos, K.; Mandrup, S. RNA-Seq and Mass-Spectrometry-Based Lipidomics Reveal Extensive Changes of Glycerolipid Pathways in Brown Adipose Tissue in Response to Cold. Cell Rep. 2015, 13, 2000–2013. [Google Scholar] [CrossRef]
  39. Wang, Y.; Zhang, T.; Liu, R.; Chang, M.; Wei, W.; Jin, Q.; Wang, X. Reviews of medium- and long-chain triglyceride with respect to nutritional benefits and digestion and absorption behavior. Food Res. Int. 2022, 15. [Google Scholar] [CrossRef]
  40. Zhang, R.; Zhu, Z.; Jia, W. Molecular mechanism associated with the use of magnetic fermentation in modulating the dietary lipid composition and nutritional quality of goat milk. Food Chem. 2022, 366, 130554–130554. [Google Scholar] [CrossRef]
  41. Yan, H.; Jiao, L.; Fang, C.; Benjakul, S.; Zhang, B. Chemical and LC–MS-based lipidomics analyses revealed changes in lipid profiles in hairtail (Trichiurus haumela) muscle during chilled storage. Food Res. Int. 2022, 159. [Google Scholar] [CrossRef] [PubMed]
  42. Sohlenkamp, C.; López-Lara, I.M.; Geiger, O. Biosynthesis of phosphatidylcholine in bacteria. Prog. Lipid Res. 2003, 42, 115–162. [Google Scholar] [CrossRef] [PubMed]
  43. Cohen, P.; Schweizer, S.; Liebisch, G.; Oeckl, J.; Hoering, M.; Seeliger, C.; Schiebel, C.; Klingenspor, M.; Ecker, J. The lipidome of primary murine white, brite, and brown adipocytes—Impact of beta-adrenergic stimulation. PLOS Biol. 2019, 17. [Google Scholar]
  44. Guo, X.; Shi, D.; Liu, C.; Huang, Y.; Wang, Q.; Wang, J.; Pei, L.; Lu, S. UPLC-MS-MS-based lipidomics for the evaluation of changes in lipids during dry-cured mutton ham processing. Food Chem. 2022, 377. [Google Scholar] [CrossRef]
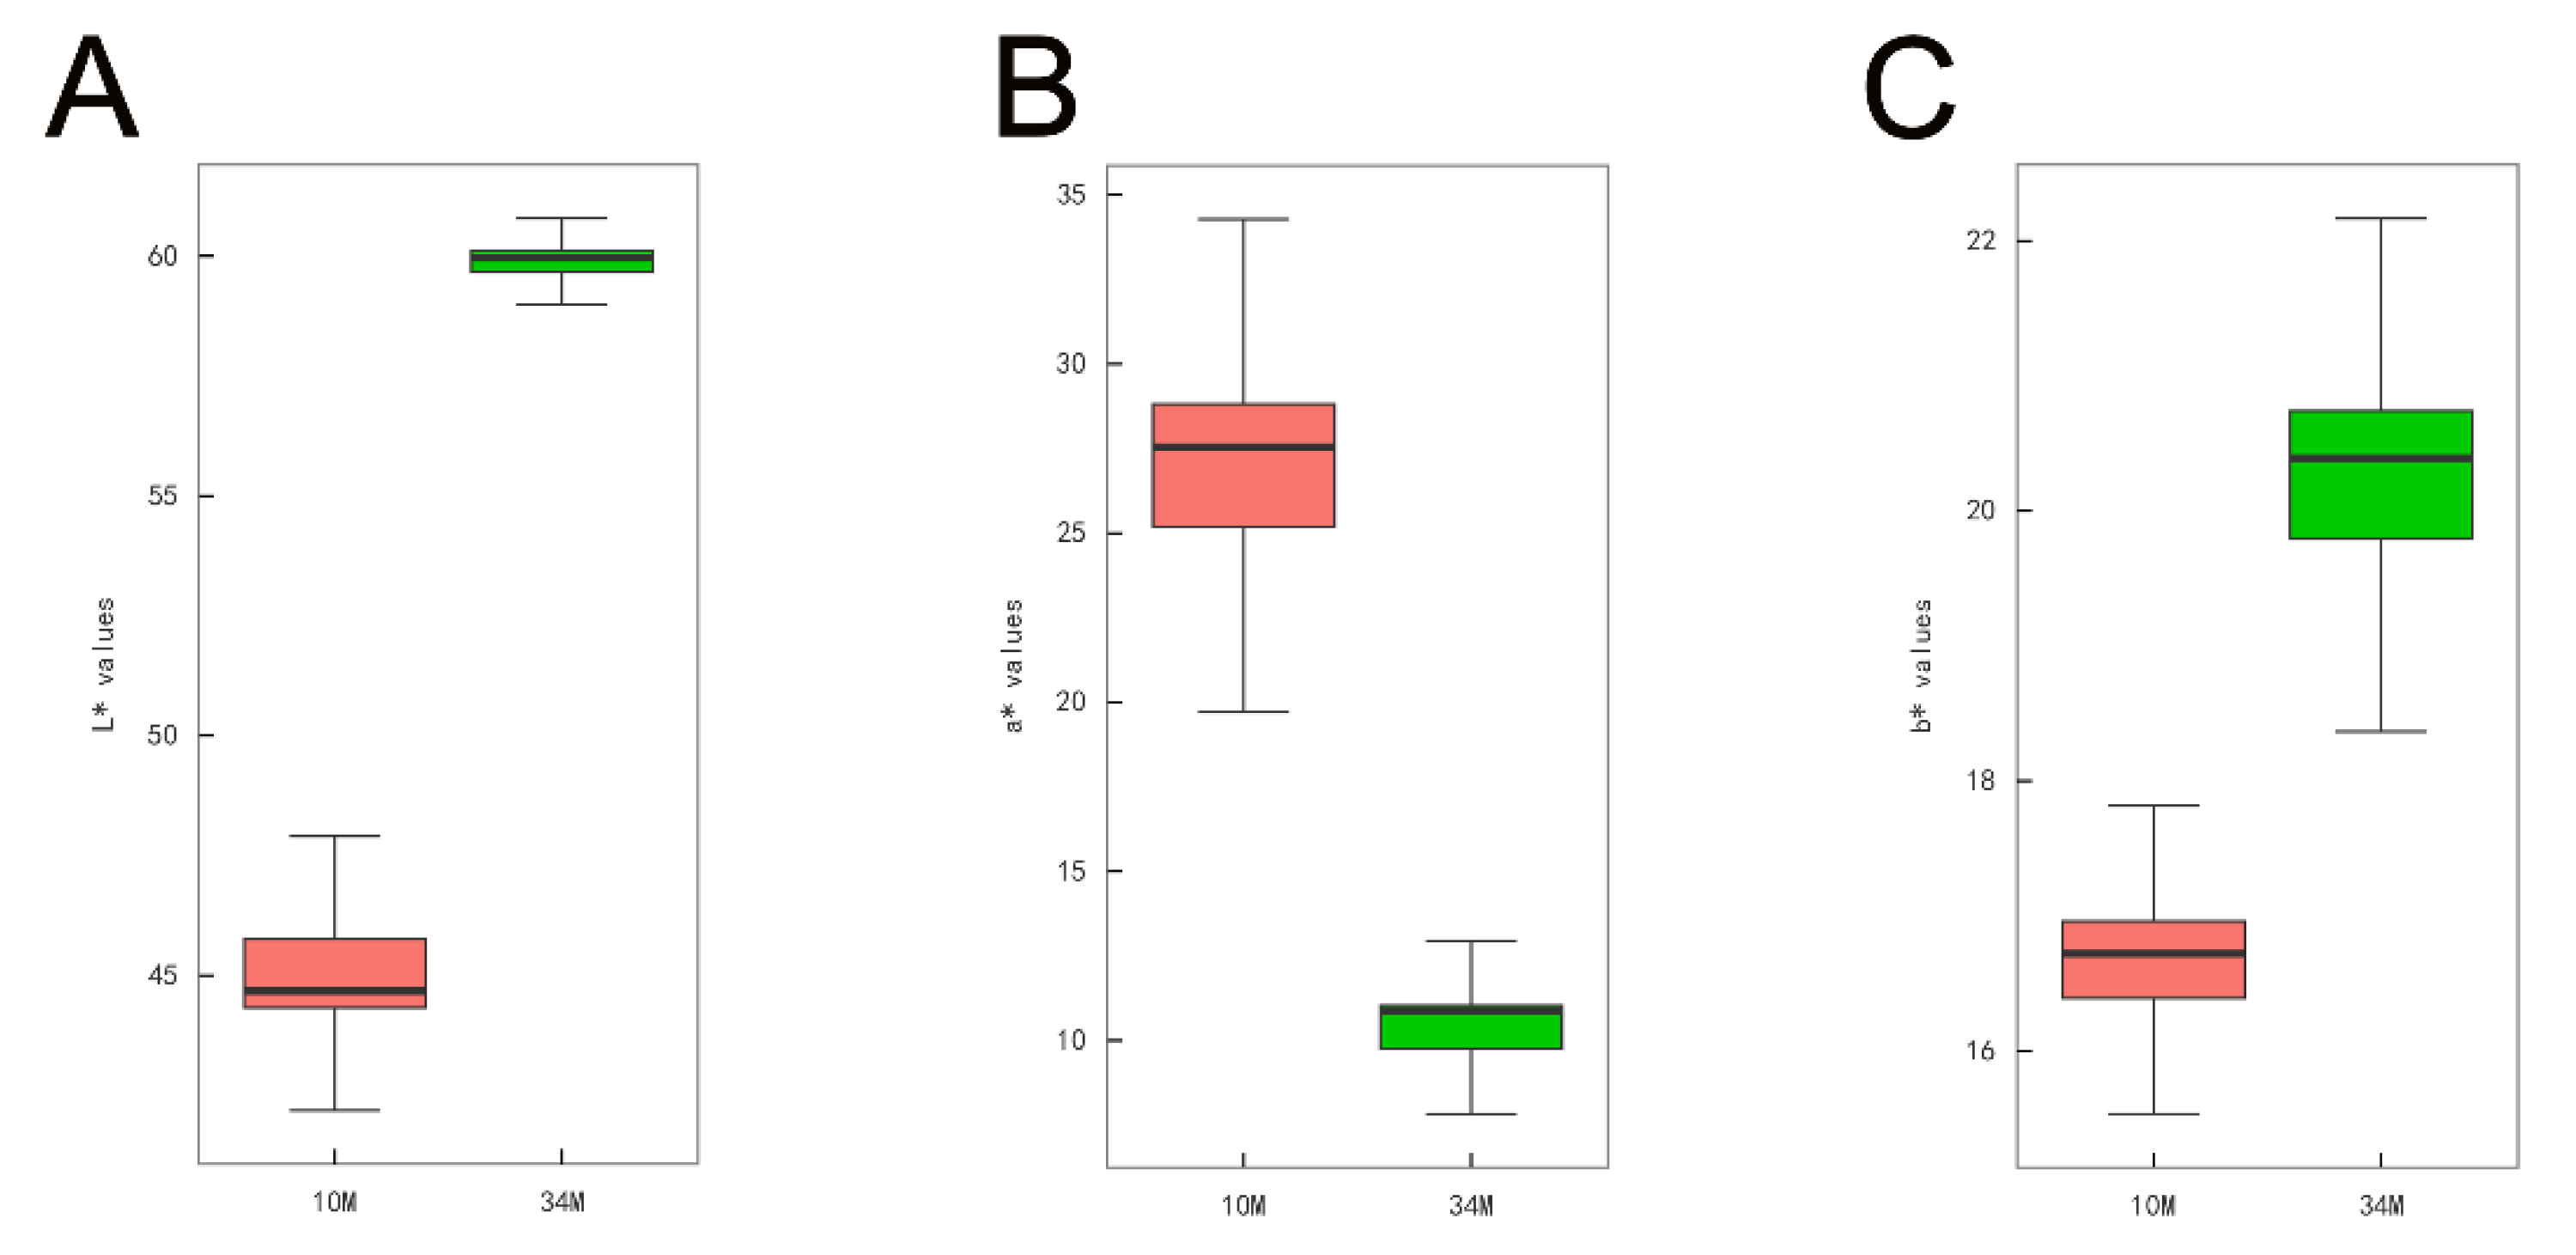
Figure 1. SAT color between 10 and 34 M Mongolian cattle. (A) L* (lightness) values. (B) a* (redness) values. (C) b* (yellowness) values. ** represents p < 0.01 in comparison with the 10 M group.
Preprints 115827 g001
Figure 2. Expression of browning-related factors and correlation analysis of UCP2. (A) Relative mtDNA copy number. (B) relative mRNA expression levels of mitochondrial biomarkers. (C) Brown/beige adipocyte-related and UCP2 mRNA-relative expression levels. (D) Beige-fat-selective marker genes relative expression levels. (E) Correlation analysis of UCP2 and brown/beige adipocyte-related adaptive thermogenesis genes. The upper triangle displays the circles (correlation represented by size and color), and the lower triangle displays the correlation coefficient values. Data are presented as the mean ± SEM, * and **, respectively, representing p < 0.05 and p < 0.01 in comparison with the 10 M group.
Preprints 115827 g002
Figure 3. Lipids in SAT from Mongolian cattle at different growth stages. (A) Quantities of lipid categories and subclasses. (B) Percentages of lipid categories and subclasses.
Preprints 115827 g003
Figure 4. Differences in the SAT of 10 and 34 M Mongolian cattle. (A) PCA scatter plot of differentially expressed lipid metabolites. (B) PLS-DA score plots of the SAT from Mongolian cattle based on the extracted spectral data. (C) PLS-DA permutation plot. (D) Volcano map of differential lipids. Under the triple screening conditions of VIP + FC + p-value, the abscissa represents the fold-change (log2FoldChange), the vertical axis indicates the significance level of the difference (log10 p-value), and the size of the dot represents the VIP value. (E) Heatmap analysis of 172 SDLs in 10 and 34 M groups.
Preprints 115827 g004
Figure 5. Distribution at different sites and fatty acid composition in TG and PC. (A) Changes in the side chain fatty acid length of 67 differential TG molecules. (B) Saturation degree of side chain fatty acids in TG molecules. (C) Saturation degree of side chain fatty acids in 11 differential PC molecules. Different color regions in the pie chart represent FA ratios. The number in brackets indicates the number of FAs. Upregulation indicates high lipid abundance in the SAT of 34 M Mongolian cattle, while downregulation indicates high lipid levels in the SAT of 10 M Mongolian cattle.
Preprints 115827 g005
Figure 6. Metabolic pathway analysis of differential lipids. (A) Lipid metabolic pathway analysis of the identified differentially expressed lipid species. (B) Key metabolic pathways involved in lipid changes. The abscissa value and bubble size represent the degree of impact, with larger values indicating higher degrees of enrichment. The ordinate value and bubble color represented the enrichment analysis’s p-value; the darker the bubble color, the smaller the p-value, and the more significant the degree of enrichment.
Preprints 115827 g006
Disclaimer/Publisher’s Note: The statements, opinions and data contained in all publications are solely those of the individual author(s) and contributor(s) and not of MDPI and/or the editor(s). MDPI and/or the editor(s) disclaim responsibility for any injury to people or property resulting from any ideas, methods, instructions or products referred to in the content.
Copyright: This open access article is published under a Creative Commons CC BY 4.0 license, which permit the free download, distribution, and reuse, provided that the author and preprint are cited in any reuse.
Prerpints.org logo

Preprints.org is a free preprint server supported by MDPI in Basel, Switzerland.

Subscribe

© 2024 MDPI (Basel, Switzerland) unless otherwise stated