Preprint
Article

Self-Coagulation Theory and Related Astro-Structures in Electronegative and Gaseous Discharging Plasmas of Laboratory

Altmetrics

Downloads

86

Views

21

Comments

0

A peer-reviewed article of this preprint also exists.

This version is not peer-reviewed

Submitted:

22 August 2024

Posted:

22 August 2024

You are already at the latest version

Alerts
Abstract
The astro-structures with the shape of comet and semi-circle, are found in the electronegative inductively coupled plasmas (ICPs), e.g., Ar/O2 and Ar/SF6. They are formed by means of the self-coagulation theory. This theory is built and based on two-dimensional fluid model simulation dynamic data of the above ICP sources. Concretely, quasi-Helmholtz equation is constructed through the free diffusion transport component and a novel negative chemical source term. The absolute value of recombination rate is higher than the attachment rate and so the net source of simulated anion is negative. This is quite a new chemical phenomenon in the electronegative and gaseous discharging plasmas when compared to the previously reported normal positive chemical source that will generate ambi-polar diffusion potential. In electronegative plasma, the self-coagulation is ambi-polar to sustain the electrical neutrality. Besides, when the anions are accelerated by ambi-polar potential before self-coagulated, the self-coagulation is again advective which leads to the formation of blue sheath. At the ambi-polar self-coagulation of high electronegativity, the electrons dynamics are relatively decoupled from ions and meanwhile they have their own relatively weak, spontaneous, and monopolar self-coagulation in the periphery of astro-structure. At the ambi-polar self-coagulation, both the anion and cation are individually treated as mass point models that carry charge (point charge models, more precisely). When the charge amounts of two individual astr-structures, e.g., semi-circle SF3+ and Ar+, are equal, the coagulated profile of heavy species SF3+ collapses by the expelling effect of Coulomb force that exists between the two point-charges. This is an anti-collective behavior of astro-structure, instead of the collective interaction of plasma, since the collapse of coagulated heavy species creates spatially dispersed charge density that cannot be shielded. The simulation shows that the lighter the species, the easier it self-coagulates, determined by the inertial effect of density quantity. The discharge picture of electronegative plasma is combined by a dynamic continuum transport (e.g., forming the ellipse background) and the mechanical balance contained in the static self-coagulation process (proven by dimensional analysis of continuity equation). The popular astro-structure of electronegative ICP source awaits urgently for the validation of experiment.
Keywords: 
Subject: Physical Sciences  -   Fluids and Plasmas Physics

1. Introduction

The low-pressure and electronegative radio frequency plasma sources are widely used in the Si-based material etching and functional thin film deposition[1,2]. In general, the capacitive [3] and inductive radio frequency sources are applied and the inductively coupled plasma [4,5] (abbreviated as ICP) is characterized by its low-pressure discharge, high plasma density and simple device, etc. Due to the interference of negative ion (anion), the transport process and discharge structure of electronegative and gaseous discharging plasma are quite different to the electropositive plasma. In Ref. [6], based on the ambi-polar diffusion of triple species, i.e., electron, cation, and anion, in a highly electronegative plasma, the parabola discharge theory was established by Lieberman and Lichtenberg. Later in Ref. [7], they built the ellipse theory again for the highly electronegative plasma at the case that the Boltzmann’s balance is not reasonable anymore for the anion. In Ref. [8], they still found internal sheaths existing in the electronegative discharges and the structure of non-neutral region was shown to vary significantly with the parameters, ratio of anion and electron densities and ratio of their temperatures. Besides, the phenomenon of stratification through the electronegative core and electropositive halo in the whole discharge region of highly electronegative plasma has been recognized in Refs. [6,7,8,9]. At the interface of core and halo, a double layer structure was founded by Sheridan in Ref. [10] and the electronegative plasma is thereby called as double-layer-stratified discharge. More of interest is that the double layer is accompanied by the oscillation in electropositive halo, which had temporarily triggered the interests of many scholars, such as Chabert (utilizing the kinetic model) and Franklin (concluding the oscillation as an artefact) in Refs. [11,12], respectively. In addition, the negative ion front was found by Kaganovich at observing the temporal evolution of electronegative plasma [13]. The above discharge structure theories of electronegative plasma are based on a quasi-direct current discharge, i.e., ICP source. When the electronegative plasma oscillates, such as in the CCP source, the famous drift-ambipolar (abbreviated as DA) and striation discharging models were built By Schulze and Liu in Refs. [14,15], respectively.
Besides for the above interesting phenomena and mechanism early investigated in electronegative plasma, our recent works revealed that astro-structure, such as comet anion, was found in Ar/O2 ICP source (with low electronegativity) by means of fluid model [16,17]. In Refs. [16,17], the self-coagulation idea is the first time suggested to explain the forming mechanism of astro-structure in the dispersed background. In the present article, the self-coagulation discharge theory is formally proposed and it is used to interpret the related astro-structures in general electronegative plasmas, such as Ar/SF6 plasma with rather high electronegativity. Our fluid simulation and analytic analysis both revealed the significance of ratio of ionic recombination loss in the chemical source, which somehow determines the discharge structure. In particular, if it is neglected the discharge structure is described by parabola theory. If it is comparative to the generation of cation (ionization), the discharge is described by ellipse theory. Furthermore, if this loss rate is larger than the generation rate, the self-coagulation behavior is happened and astro-structure is formed. More of interest is that the astro-structure, such as semi-circle in Ar/SF6 plasma, perhaps collapses at the expelling interaction of Coulomb force. The discovering of this article helps correlate again the gaseous discharging plasma of laboratory and astrophysics plasma of universe, besides for the double layer (accelerating cosmic particle and also appearing in the expanded ICP source) [18,19] and shock (by means of multifluid model and transport theory) [20,21].
This article is outlined as follow. In Sec. 2, the used fluid model for ICP source and chemical reactions of Ar/O2 and Ar/SF6 plasmas are given. In Sec. 3, the interesting phenomena of fluid simulation are presented, such as the blue sheath. In Sec. 4, these interesting simulated phenomena are explained, based on many supposed concepts for astro-structure, such as ambi-polar self-coagulation and anti-collective role of astro-structure, etc. In Sec. 5, the conclusion and further remarks are given.

2. Fluid Model, Plasma Chemistry and Reactor Configuration

2.1. Fluid Model Formula

The formulae of fluid model used in the work are described in this section. They include the mass, momentum and energy equations of different plasma species, and the Poisson’s and Maxwell’s equations as well.

2.1.1. Electrons Equation

The equations of electron density and energy are given as follows.
n e t + · Γ e = R e , n ε t + · Γ ε + E · Γ e = R ε + P o h m .
The fluxes of electron density and energy at the assumption of drift and diffusion are described in Eq. (2).
Γ e = ( μ e · E ) n e D e · n e , Γ ε = ( μ ε · E ) n ε D ε · n ε .
Herein, n e and n ε are the number density and energy density of electrons, respectively. μ e and μ ε are the electron mobility and electron energy mobility, respectively. D e and D ε are electron diffusivity and electron energy diffusivity, respectively. The relations among the above mass and energy transport coefficients are D e = μ e T e , D ε = μ ε T e , and μ ε = 5 3 μ e .
R e and R ε in Eq. (1) are the respective source terms of number density and energy density of electrons. Their expressions are stated in Eq. (3).
R e = j = 1 M l j k j m = 1 P n m ν j m , R ε = j = 1 M ε j l j k j m = 1 P n m ν j m .
Herein, l j is the number of electrons created (lost) per electron-impact reaction that generates (depletes) electrons. M is the number of these reactions. k j is the rate coefficient of reaction j , which are expressed in the Table 1. n m is the number density of reactant m of reaction j . ν is the stoichiometric coefficient of the reaction and P is the number of reactants. ε j is the electron energy loss per electron-impact reaction.
P o h m is the deposited power density via the Ohm's heating scheme, illustrated in Eq. (4).
P o h m = 1 2 Re ( σ E θ 2 ) .
Herein, σ is the electron conductivity. E θ is the radio frequency azimuthal field, which is calculated from the Maxwell’s equation; see next the Sec. 2.1.3. Without the secondary electron emissions, the boundary conditions for the above equation are set in Eq. (5).
n · Γ e = 1 r e 1 + r ( 1 2 ν e , t h n e ) , n · Γ ε = 1 r e 1 + r e ( 5 6 ν e , t h n e ) .
Herein, v e , t h is the thermal velocity of electrons. r e is the reflection coefficient of electrons from the reactor wall, which is set to 0.2 in this model.

2.1.2. Heavy Species Equation

Heavy species are supposed to comprise a reacting flow that consists of k= 1,2,...,Q species, except for the electron. The mass transport equations of these heavy species are summarized in Eq. (6).
ρ w k t = · j k + R k .
Herein, ρ is the total mass density of heavy species and w k is the mass fraction of species k . j k is the diffusive and drift flux of species k and expressed in Eq. (7).
j k = ρ w k V k , V k = D k , m ln ( w k ) z k μ m E .
Herein, V k is the velocity of species k , z k is elementary charge number that species k carries, μ m is the mobility, and E is the electrostatic field vector, calculated from the Poisson's equation (see next). It is noted that the multi-component mass diffusion is considered and D k , m is the averaged diffusion coefficient of mixture, expressed in Eq. (8).
D k , m = 1 w k j k Q x j / D k j .
Herein, x j is the number fraction of species j and D k , j is just the Chapman-Enskog binary diffusion coefficient [22,23].
The source term of Eq. (6), R k , is expressed in Eq. (9).
R k = M k j = 1 N l k , j r j .
Herein, M k is the molecular weight, r j is the rate of reaction j that creates or consumes species k , N is the reaction number, and l k , j is the particle number of species k created or consumed for each reaction j . The reaction rate, r j , is expressed in Eq. (10).
r j = k j m = 1 S c m ν j m .
Herein, k j is the rate coefficient, also given in Tab. 1, S is the number of reactants, ν j , m is the stoichiometric coefficient of reaction j with the reactant m and the reactant species k , and c m is the molar concentration of reactant m .
In sum, the heavy species equation, described in Eq. (6), sequentially describes the inertia term, diffusion, drift and chemical kinetic of heavy species. It is noted the inertia term considered herein is the inertia of mass, like the electron equation of Eq. (1) (not the flux inertia) which we believe is one possible origin of self-coagulation happened in radio frequency plasma sources, i.e., the inertial effect of density (see next Sec. 4.3). Besides, only Q-2 equations are used, since the mass fractions of feedstock gases of mixture, i.e., Ar and SF6, are governed by the mass constraint condition, ω Ar , SF 6 = 1 k Q 2 ω k , and meanwhile the assigned gas ratio between them.
The total mass density of heavy species, ρ , is obtained from the ideal gas law in Eq. (11).
ρ = P k T · M N A .
Herein, k is the Boltzmann’s constant, T is gas temperature, equal to 300K, P is the fixed gas pressure, set as 10mTorr, and N A is the Avogadro's constant. M is the mole averaged molecular weight, expressed in Eq. (12).
1 M = k = 1 Q w k M k .
The mean molecular weight M is generally not a constant, since it is a function of mass fractions and molecular weight of various species and the mass fractions, calculated from the Eq. (6), are both spatially and temporally varied.
The total flux boundary condition that includes both the diffusion and drift components is used onto the chamber wall, i.e., Γ k = n · ρ ω k V k , where the surface reaction kinetics of all species listed in Tab. 2 are considered.

2.1.3. Electromagnetic Equation

To describe the electromagnetic field in the reactor, the Maxwell's equations are combined to express the Ampere's law in Eq. (13).
( j ω σ ω 2 ε 0 ε r ) A + × ( μ 0 1 μ r 1 × A ) = J a .
Herein, j is the imaginary unit and ω is the angular frequency of power source, expressed as 2 π f at f = 13.56 MHz . ε 0 and ε r are the vacuum permittivity and the relative permittivity of dielectric window material (quartz), respectively. μ 0 and μ r are the vacuum permeability and the relative permeability of coil that is made of copper, respectively. A is the magnetic vector potential, from which both the radio frequency (RF) magnetic and electric fields are calculated via the Coulomb’s gauge, i.e., B = × A , E = A t . J a is the applied external coil current density and will be persistently varied in the simulation until the deposited total power approaches to the assigned value, i.e., 300W. When considering the azimuthal symmetry, only the azimuthal component of RF electric field, E θ , and the axial and radial components of RF magnetic field, B r , B z , need to be addressed. σ is the electron conductivity, expressed in Eq. (14). It is given by analytically solving the Langevin’s equation at the assumption of zero electron temperature (~ cold plasma), i.e., neglecting the diffusion [24].
σ = n e q 2 m e ( ν e + j ω ) .
Herein, n e , m e and q are the number density, mass, and charge of electron, separately. ν e is the elastic collision frequency of electrons with the neutral species. The magnetic insulation, i.e., n × A = 0 , is taken as the boundary condition for solving the Maxwell’s equation.

2.1.4. Electrostatic Equation

The Poisson's equation is used to calculate electrostatic field in Eq. (15).
E = V , · D = ρ V .
Herein, E is the electrostatic field, V is the potential, and ρ V is the charge density of space, separately. Zero potential boundary condition is used at both the chamber wall and the dielectric window underneath surface, since the Poisson’s equation only needs to be solved in the discharge chamber. Our previous simulation of pure argon inductive discharge revealed the approximation of grounded dielectric window potential does not significantly change the simulation results, and the reasonability of this approximation is extended to the present article. As mentioned before, only the axial and radial electrostatic field components are considered at the assumption of azimuthal symmetry.

2.2. Chemistry of Ar/SF6 Plasma

The Ar/SF6 gas-phase chemistry and surface kinetics are given in Table 1 and Table 2. The electron-impact elastic collision, excitation and deexcitation, ionization, direct attachment and dissociative attachment, and dissociation are included. The heavy species reaction types considered are neutral and ionic recombination, detachment, Penning ionization and charge exchange. The rate coefficients and cross sections can be found in Refs. [25,26,27,28]. The surface kinetics of species considered in Table 2 include recombination and de-excitation.
Table 1. Ar/SF6 chemical reaction set considered in the model.
No. Reaction Rate coefficienta Threshold (eV) Ref.
Elastic collisions
1 e + Ar e + Ar Cross Section 0 [25]
2 e + SF 6 e + SF 6 Cross Section 0 [25]
3 e + F 2 e + F 2 Cross Section 0 [25]
4 e + F e + F Cross Section 0 [25]
Excitation and deexcitation reactions
5 e + Ar e + Ar * Cross Section 11.6 [25]
6 e + Ar * e + Ar Cross Section -11.6 [25]
Ionization reactions
7 e + Ar 2 e + Ar + Cross Section 15.76 [25]
8 e + Ars 2 e + Ar + Cross Section 4.43 [25]
9 e + SF 6 SF 5 + + F + 2 e 1.2 × 10 7 exp 18.1 / T e 16 [26,27]
10 e + SF 6 SF 4 + + 2 F + 2 e 8.4 × 10 9 exp 19.9 / T e 20 [26,27]
11 e + SF 6 SF 3 + + 3 F + 2 e 3.2 × 10 8 exp 20.7 / T e 20.5 [26,27]
12 e + SF 6 SF 2 + + F 2 + 2 F + 2 e 7.6 × 10 9 exp 24.4 / T e 28 [26,27]
13 e + SF 6 SF + + F 2 + 3 F + 2 e 1.2 × 10 8 exp 26.0 / T e 37.5 [26,27]
14 e + SF 6 F + + SF 4 + F + 2 e 1.2 × 10 8 exp 31.7 / T e 29 [26,27]
15 e + SF 6 S + + 4 F + F 2 + 2 e 1.4 × 10 8 exp 39.9 / T e 18 [26,27]
16 e + SF 5 SF 5 + + 2 e 1.0 × 10 7 exp 17.8 / T e 11 [26,27]
17 e + SF 5 SF 4 + + F + 2 e 9.4 × 10 8 exp 22.8 / T e 15 [26,27]
18 e + SF 4 SF 4 + + 2 e 4.77 × 10 8 exp 16.35 / T e 13 [26,27]
19 e + SF 4 SF 3 + + F + 2 e 5.31 × 10 8 exp 17.67 / T e 14.5 [26,27]
20 e + SF 3 SF 3 + + 2 e 1.0 × 10 7 exp 18.9 / T e 11 [26,27]
21 e + F F + + 2 e 1.3 × 10 8 exp 16.5 / T e 15 [26,27]
22 e + S S + + 2 e 1.6 × 10 7 exp 13.3 / T e 10 [26,27]
23 e + F 2 F 2 + + 2 e 1.37 × 10 8 exp 20.7 / T e 15.69 [26,27]
Attachment and dissociative attachment reactions
24 e + SF 6 SF 6 Cross Section 0 [25]
25 e + SF 6 SF 5 + F Cross Section 0.1 [25]
26 e + SF 6 SF 4 + 2 F Cross Section 5.4 [25]
27 e + SF 6 SF 3 + 3 F Cross Section 11.2 [25]
28 e + SF 6 SF 2 + 4 F Cross Section 12 [25]
29 e + SF 6 F + SF 5 Cross Section 2.9 [25]
30 e + SF 6 F 2 + SF 4 Cross Section 5.4 [25]
31 e + F 2 F + F Cross Section 0 [25]
Dissociation reactions
32 e + SF 6 SF 5 + F + e 1.5 × 10 7 exp 8.1 / T e 9.6 [26,27]
33 e + SF 6 SF 4 + 2 F + e 9.0 × 10 9 exp 13.4 / T e 12.4 [26,27]
34 e + SF 6 SF 3 + 3 F + e 2.5 × 10 8 exp 33.5 / T e 16 [26,27]
35 e + SF 6 SF 2 + F 2 + 2 F + e 2.3 × 10 8 exp 33.9 / T e 18.6 [26,27]
36 e + SF 6 SF + F 2 + 3 F + e 1.5 × 10 9 exp 26.0 / T e 22.7 [26,27]
37 e + SF 5 SF 4 + F + e 1.5 × 10 7 exp 9.0 / T e 5 [26,27]
38 e + SF 4 SF 3 + F + e 6.2 × 10 8 exp 9.0 / T e 8.5 [26,27]
39 e + SF 3 SF 2 + F + e 8.6 × 10 8 exp 9.0 / T e 5 [26,27]
40 e + SF 2 SF + F + e 4.5 × 10 8 exp 9.0 / T e 8 [26,27]
41 e + SF S + F + e 6.2 × 10 8 exp 9.0 / T e 7.9 [26,27]
42 e + F 2 2 F + e 1.2 × 10 8 exp 5.8 / T e 1.6 [26,27]
Neutral / neutral recombination reactions
43 S + F SF 2 × 10 16 0 [26,27]
44 SF + F SF 2 2.9 × 10 14 0 [26,27]
45 SF 2 + F SF 3 2.6 × 10 12 0 [26,27]
46 SF 3 + F SF 4 1.6 × 10 11 0 [26,27]
47 SF 4 + F SF 5 1.7 × 10 11 0 [26,27]
48 SF 5 + F SF 6 1.0 × 10 11 0 [26,27]
49 SF 3 + SF 3 SF 2 + SF 4 2.5 × 10 11 0 [26,27]
50 SF 5 + SF 5 SF 4 + SF 6 2.5 × 10 11 0 [26,27]
51 SF + SF S + SF 2 2.5 × 10 11 0 [26,27]
52 SF x + F 2 SF x + 1 + F b 7.0 × 10 15 0 [26,27]
Ion / ion recombination reactions
53 X + + Y X + Y c 5.0 × 10 9 0 [26,27]
Detachment reactions
54 Z + Y Z + Y + e d 5.27 × 10 14 0 [26,27]
Other reactions
55 Ars + Ars e + Ar + Ar + 6.2 × 10 10 0 [26,27]
56 Ars + Ar Ar + Ar 3.0 × 10 15 0 [26,27]
57 Ar + + SF 6 SF 5 + + F + Ar 9.0 × 10 10 0 [26,27]
58 SF 5 + + SF 6 SF 3 + + SF 6 + F 2 6.0 × 10 12 0 [26,27]
aThe unit of the rate coefficient is cm3s-1. b x stands for the number 1-5. c X = SF5, SF4, SF3, SF2, SF, F, S or F2 and Y = SF6, SF5, SF4, SF3, SF2, F or F2. d Z = SF6, SF5, SF4, SF3, SF2, SF, F, S or F2 and Y = SF6, SF5, SF4, SF3, SF2, F or F2.

2.3. Chemistry of Ar/O2 Plasma and O- Chemical Kinetics

As listed in Table 3, the Ar/O2 chemical reaction types considered for this simulation include (1) elastic, ionization, dissociative attachment, electronic excitation, de-excitation, and detachment occurring among electrons and neutral species, and (2) metastable quenching, recombination, associative detachment, and charge transfer between heavy species. In total, this set contains five charged species, i.e., electron, O-, O+, O2+, and Ar+; three metastable molecules, i.e., O2*, O*, and Ar*; and three grounded molecules, i.e., O, Ar, and O2. The surface reactions of reactive species are listed in Table 4. More details about the reaction set can be referred to Refs. [29,30,31,32,33,34,35,36]. Specially, the reactions for the O- generation and loss are listed in Table 5 and Table 6, respectively. In this chemical kinetic of O-, reaction No. 3 mainly contributes to the O- generation and reaction No. 42 mainly contributes to the O- loss.

2.4. ICP Reactor Configuration

The reactor used consists of the vacuum chamber (also called as matching box) and the discharge chamber, which are separated by the dielectric window. The discharge chamber is 15 cm in radius and 13 cm in height. The dielectric window and vacuum chamber hold the same radius as the discharge chamber, and the heights of them are 1 cm and 3 cm, respectively. A substrate with the radius of 12 cm and the height of 4 cm is seated at the bottom center of discharge chamber. A two-turn coil is installed above the dielectric window, with the radial locations of 8 cm and 10 cm, respectively. The coil is square in cross section, with the side-length of 0.6 cm. More detail about the reactor can be found in Ref. [37] and Figure 1.

3. Results

3.1. Comet Structure

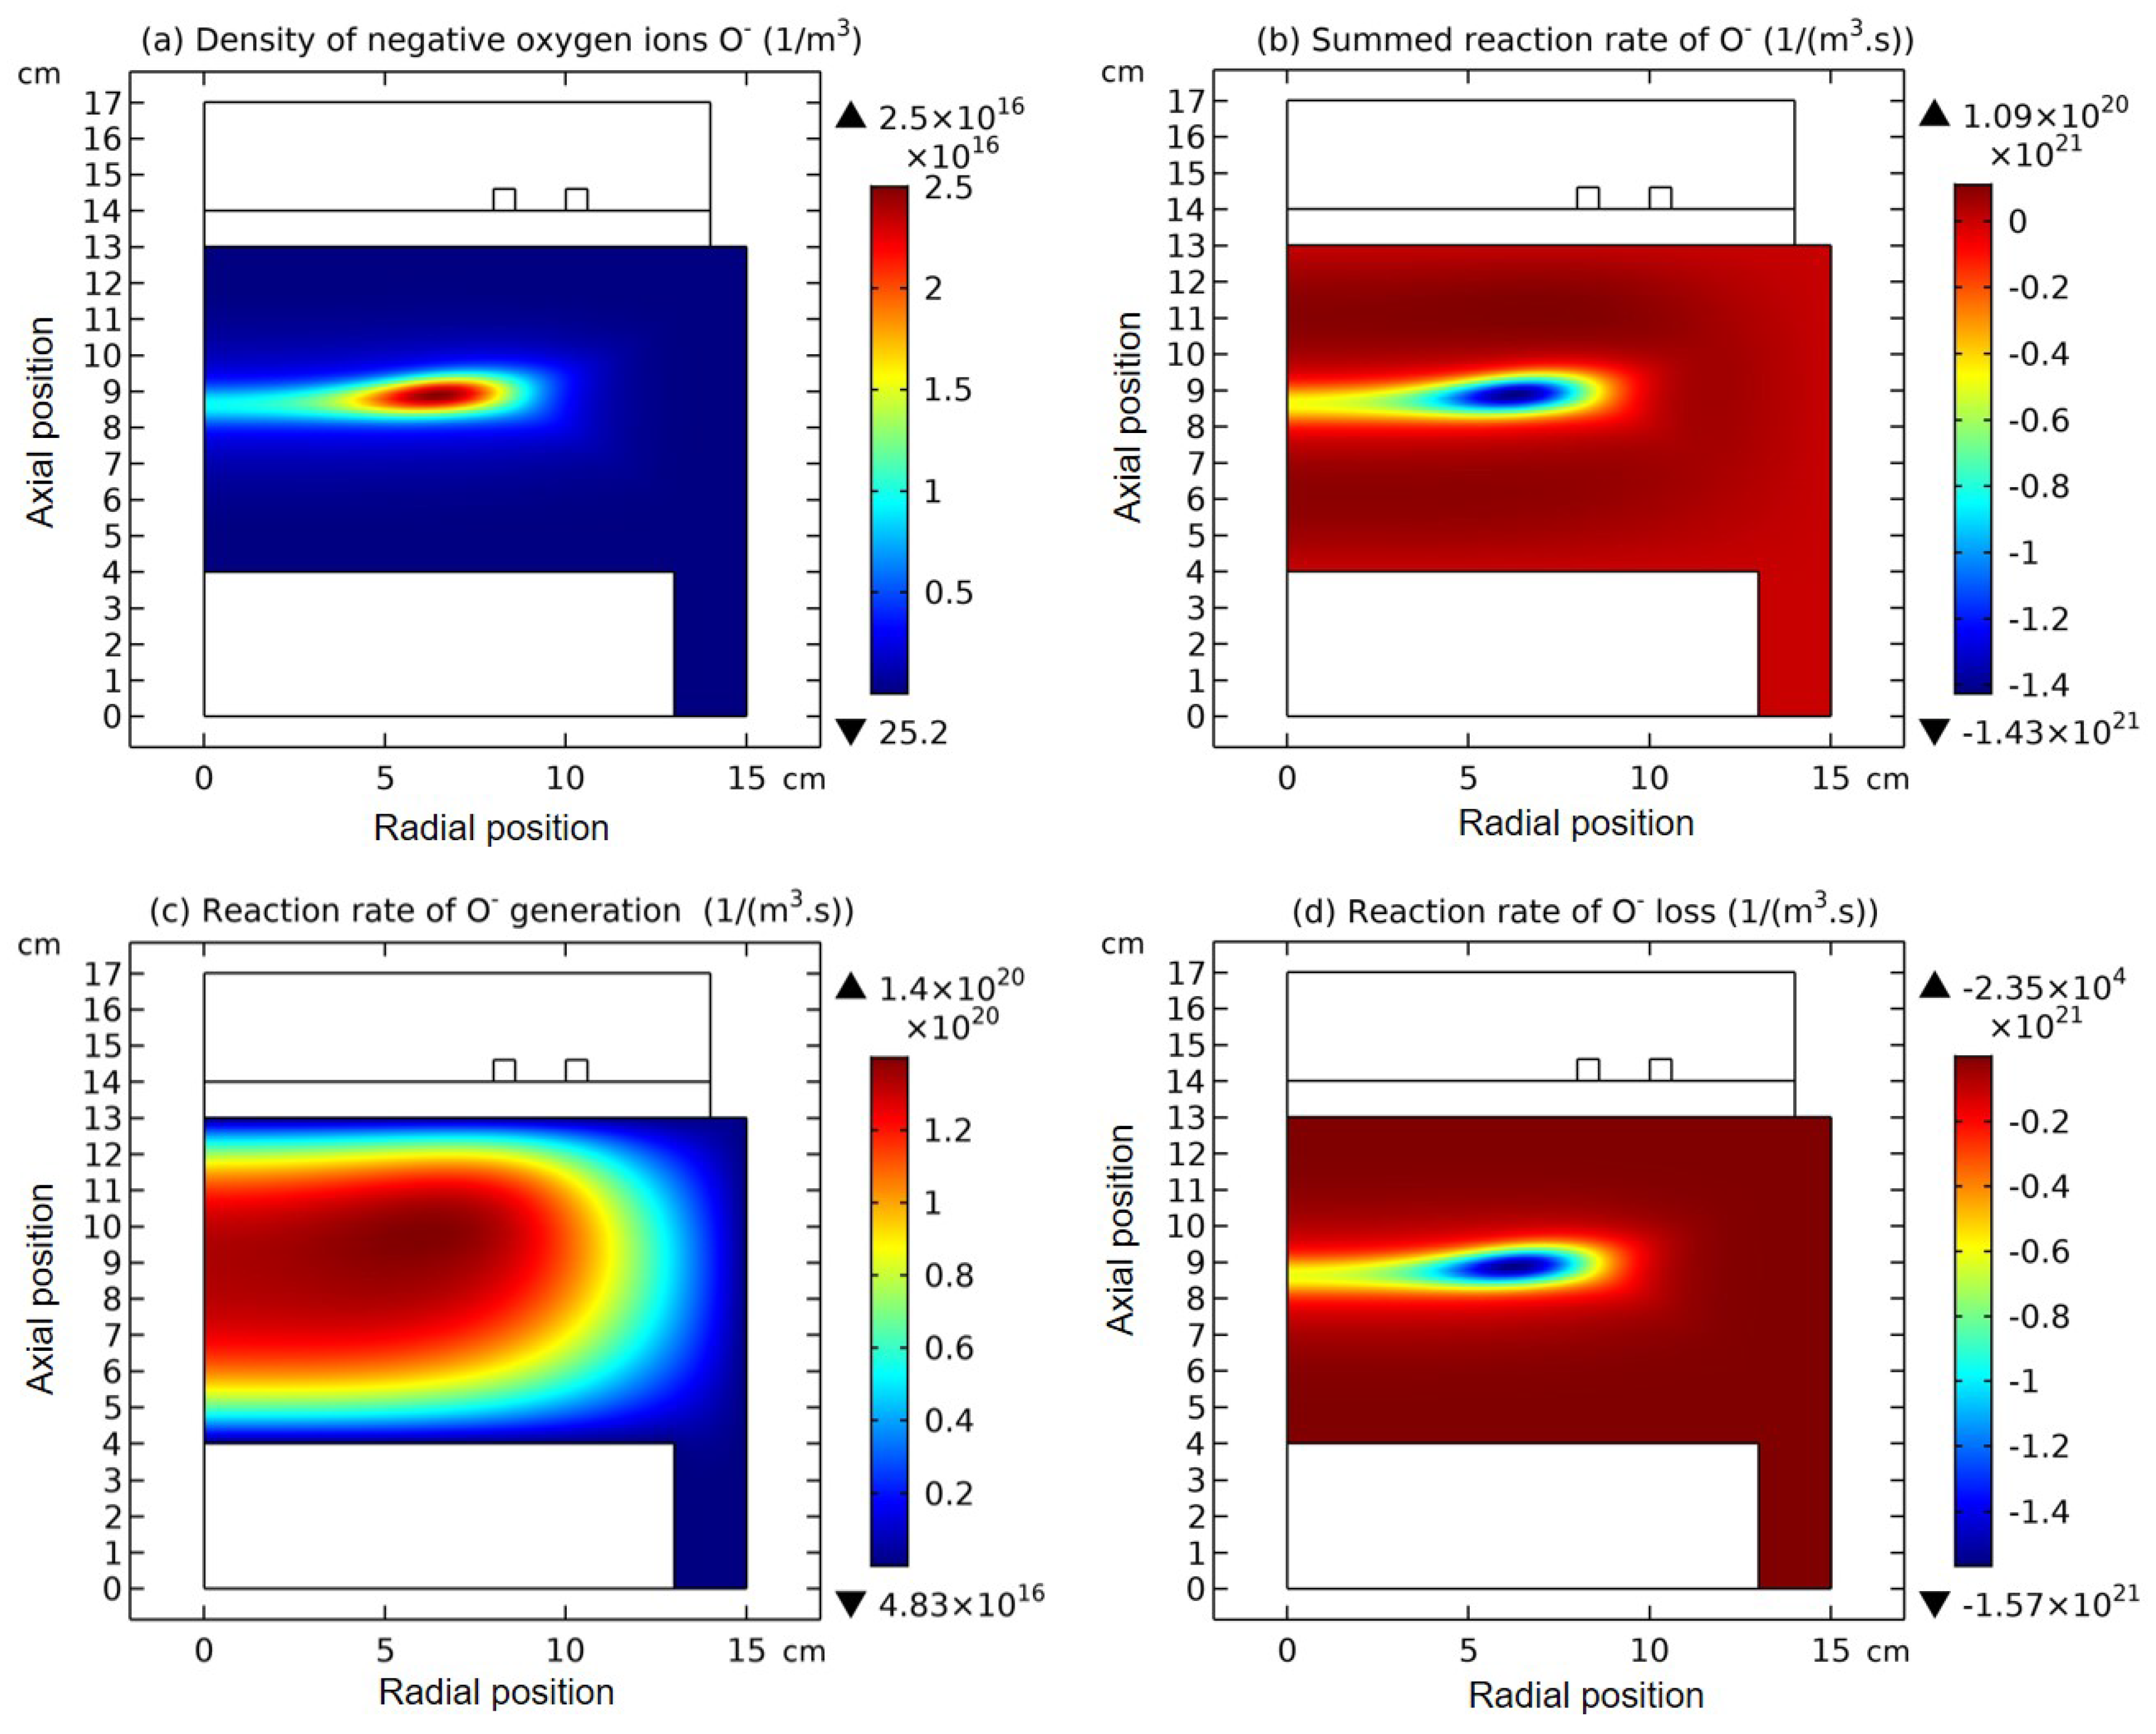
A "comet" type of negative ions O- density was discovered occasionally in our previous simulation works, which is shown in Figure 1(c). This novel density profile of plasma species provokes our profound interest, as it had never been reported before. As seen, the comet O- density looks like a Dirac-delta function, especially at the axial direction. To investigate the behind mechanism, we checked the relevant quantities, such as electron density, argon ions Ar+ density, plasma potential in Figure 1 and its chemical process, i.e., the reaction rates of O- generation and loss, as well as the summed rate, in Figure 2. One very important feature was noticed, i.e., the O- species holds an obvious negative source term in the position of delta. In the mature analytic works [1] (pp. 330-333), the species density morphology of electropositive plasmas, such as the parabola, cosine, and Bessel at high pressure limit, the variable mobility model of intermediate pressure range, and the Langmuir solution at low pressure limit, are all based on the continuity equation of species with positive source term. This is logic, since in the electropositive plasmas, the species are mainly lost on chamber wall via the surface kinetics. In electronegative plasmas this is not always true, and at certain circumstance the negative source of negative ions (recombination and detachment) possibly exceeds the positive source (electron-impact dissociative attachment) at low electronegativity, as illustrated in Figure 2.
It is seen in Figure 1(c,d) that the delta type of O- is located at the top of ambi-polar potential and so its main transport component is free diffusion, without the influence of drift. To interpret the forming mechanism of delta, in Eq. (16) an unsteady state continuity equation of O- that consists of the free diffusion flux in Figure 1(d) (represented by the second term at the left side of equation) and the recombination negative source in Figure 2(b) (represented by the term at the right side of equation) is given. Herein, D is the diffusion coefficient of O- and ν r e c is the recombination frequency of O-. n represents the O- density. As seen next, through dimension analysis the chemical source term can play the role of a transformed drift that may be caused by an effective electric field. In Eq. (17), the transformed drift flux Γ d that is caused by the effective field and its divergence are given. Herein, E is the effective field and ρ is the net charge density transformed. It is noticed in the process of calculating the divergence, the Poisson’s equation has been used. In addition, the dimensional analysis is executed only to the second term of flux divergence, μ n ρ ε 0 . The first term of divergence, μ n · E , is not chosen for dimension analysis since it contains the density gradient, which is not existed at the condition of a delta density type. As seen in Eq. (18), the dimension of μ n ρ ε 0 is the same with the chemical source, n ν r e c . It is stressed herein that the dimensional analysis is not enough for validating the drift role of chemical source, but the fact that chemical source contains the density of species considered, herein n , representing the density of O-, is key factor for suggesting such a transformation. It is meant that the considered species is attracted by the transformed potential of recombination. This attraction is balanced by free diffusion, illustrated in Eqs. (19-21), and ultimately a delta type of O- is formed. This is more like a static mechanic system, but not dynamic transport problem anymore. More detail of the supposed static balance is summarized in a self-coagulation theory (see next the Sec. (4.1)).
n t D 2 n = n ν r e c ,
Γ d = μ n E , · Γ d = μ n · E + μ n · E = μ n · E + μ n ρ ε 0 ,
[ μ ] = m 2 V · s , [ n ] = 1 m 3 , [ ρ ] = C m 3 , [ ε 0 ] = C m · V , [ μ n ρ ε 0 ] = 1 m 3 · s = [ n ν r e c ] ,
n t D 2 n + n ν r e c = 0 ,
n t D 2 n + μ n ρ ε 0 = 0 ,
n t D 2 n + · Γ d = 0.

3.2. Blue Sheath Phenomenon

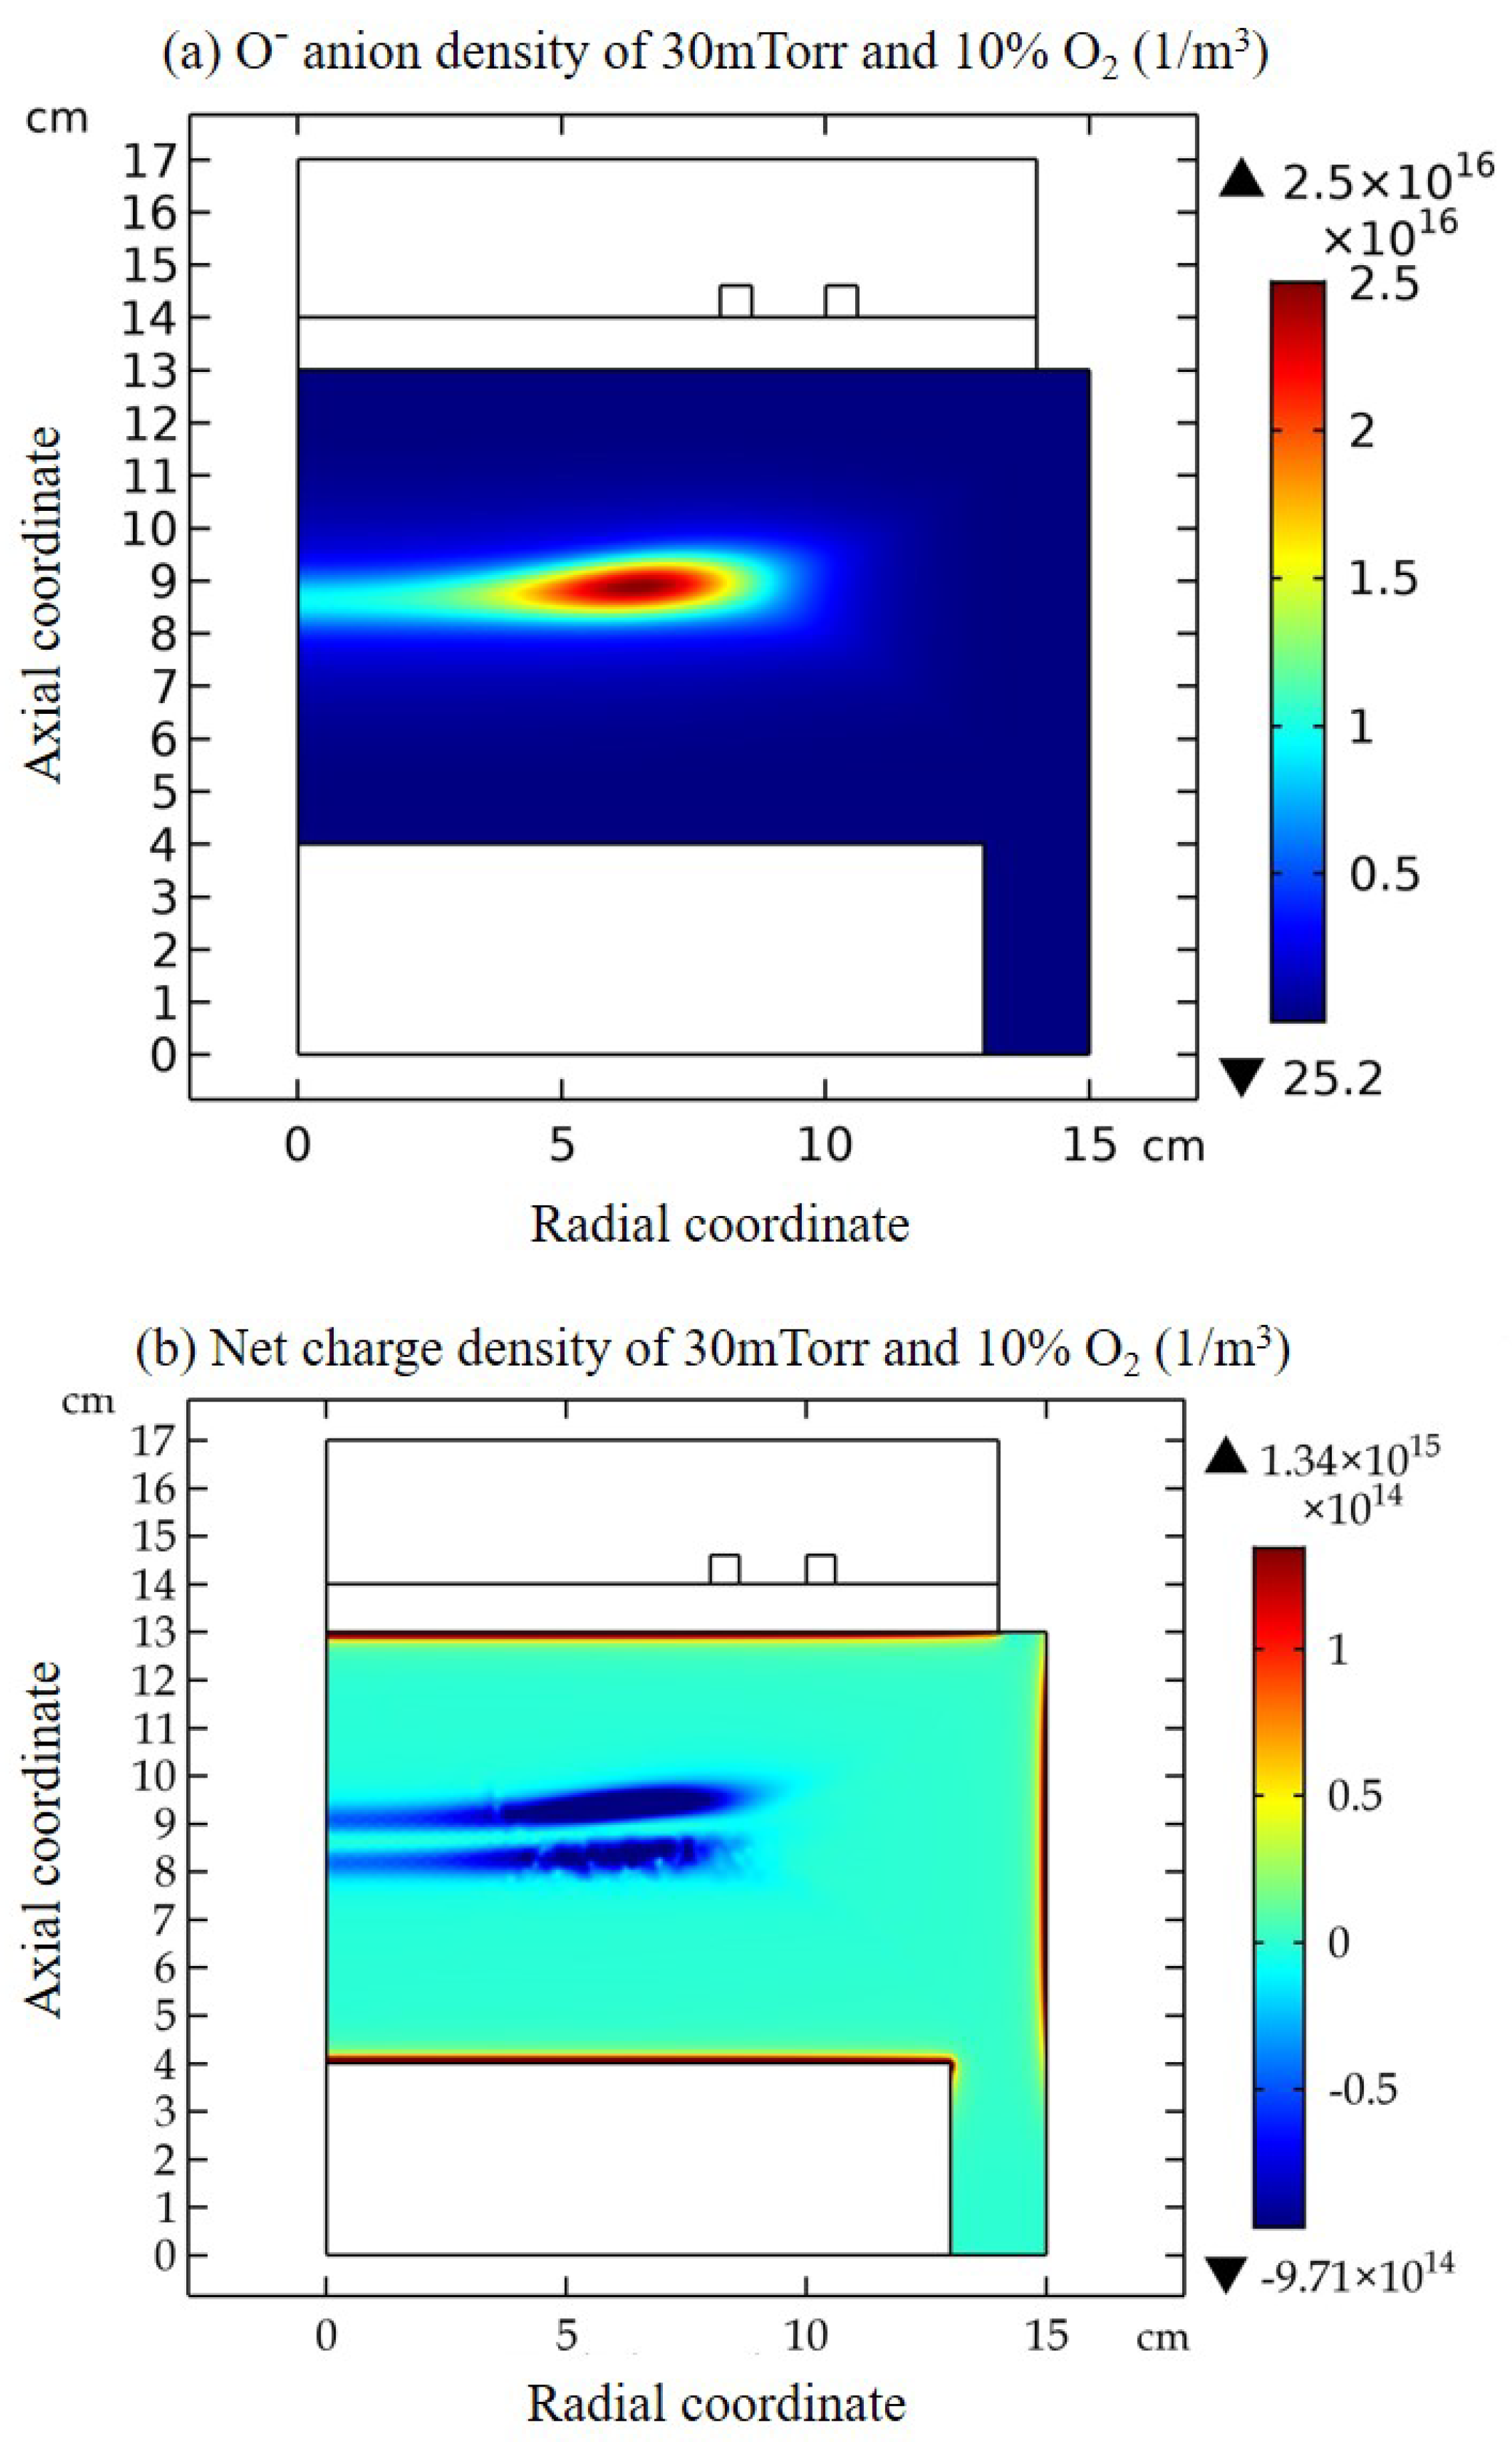
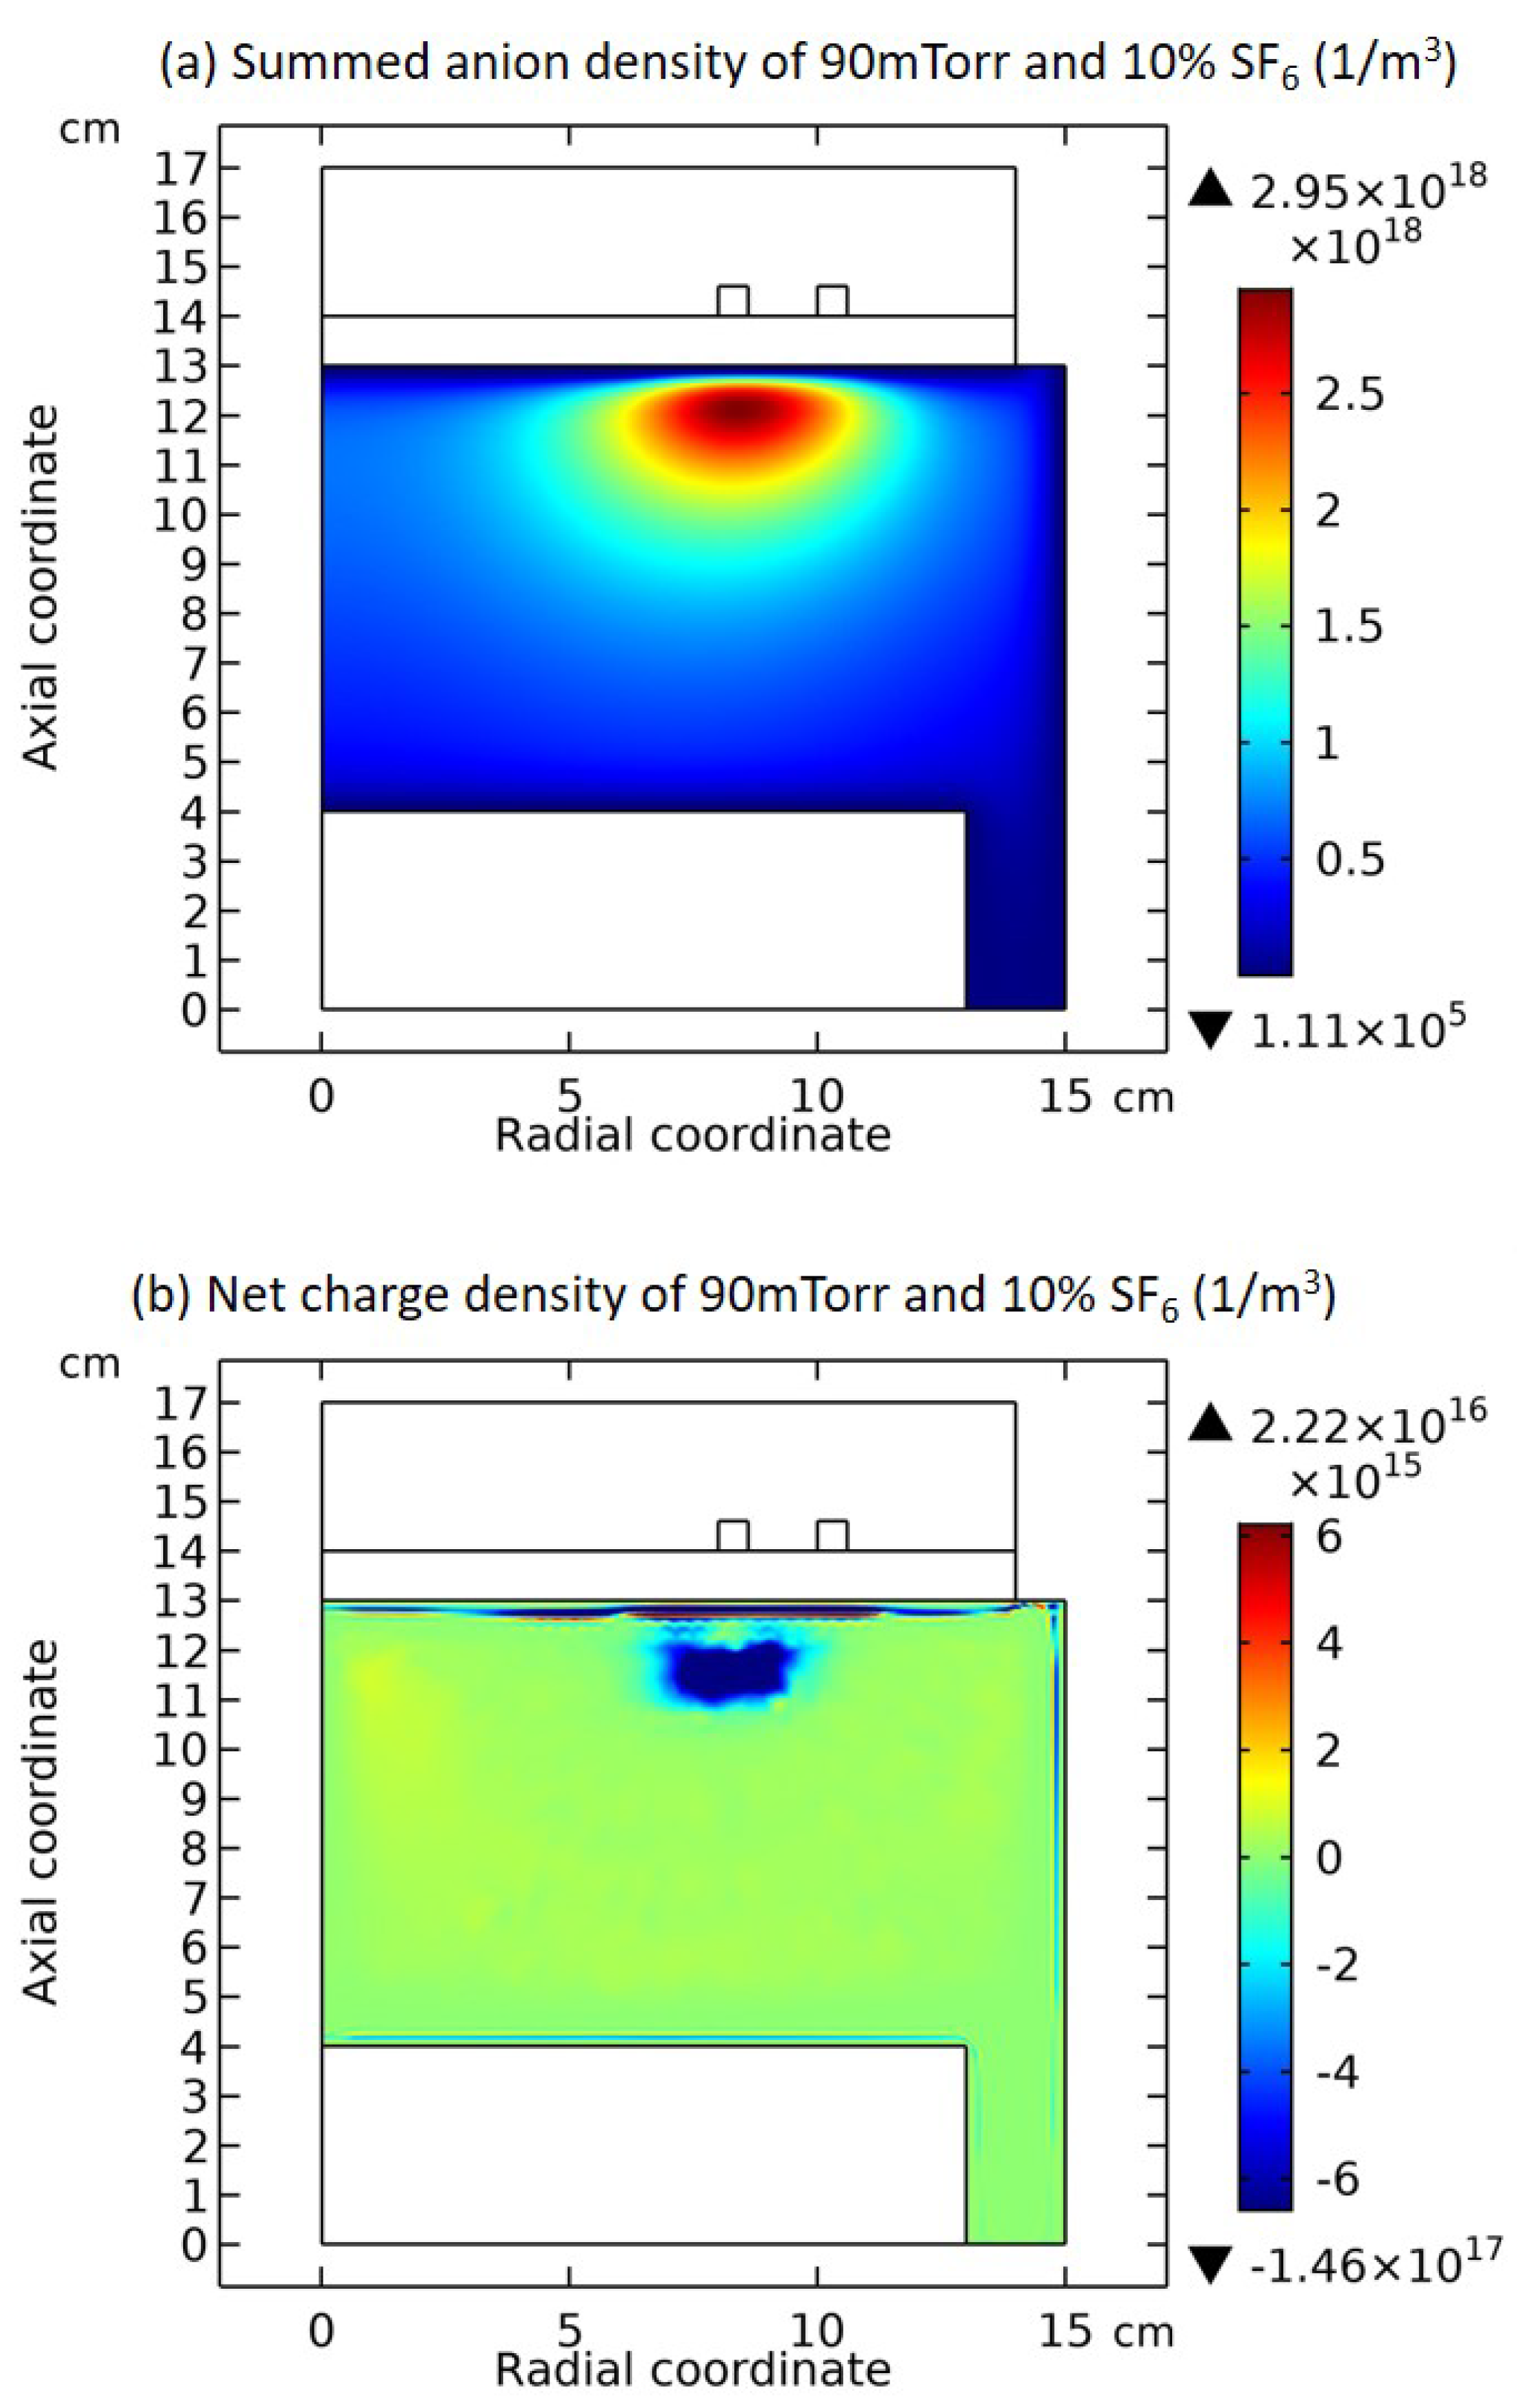
It is seen that around the comet in the Ar/O2 plasma in Figure 3(a), there is a layer of “blue” sheath. Blue sheath is meant an electronegative sheath, among which the net charge density is negative (see the legend of Figure 3(b) for reference). Similarly, in the Ar/SF6 plasma of Figure 4 with high electronegativity, around the semi-circle (another astro-structure) there is a layer of blue sheath as well. As seen next in Sec. (4.2), the blue sheath is caused by an advective and ambi-polar self-coagulation.

3.3. Collapse of Individual Semi-Circle Structure

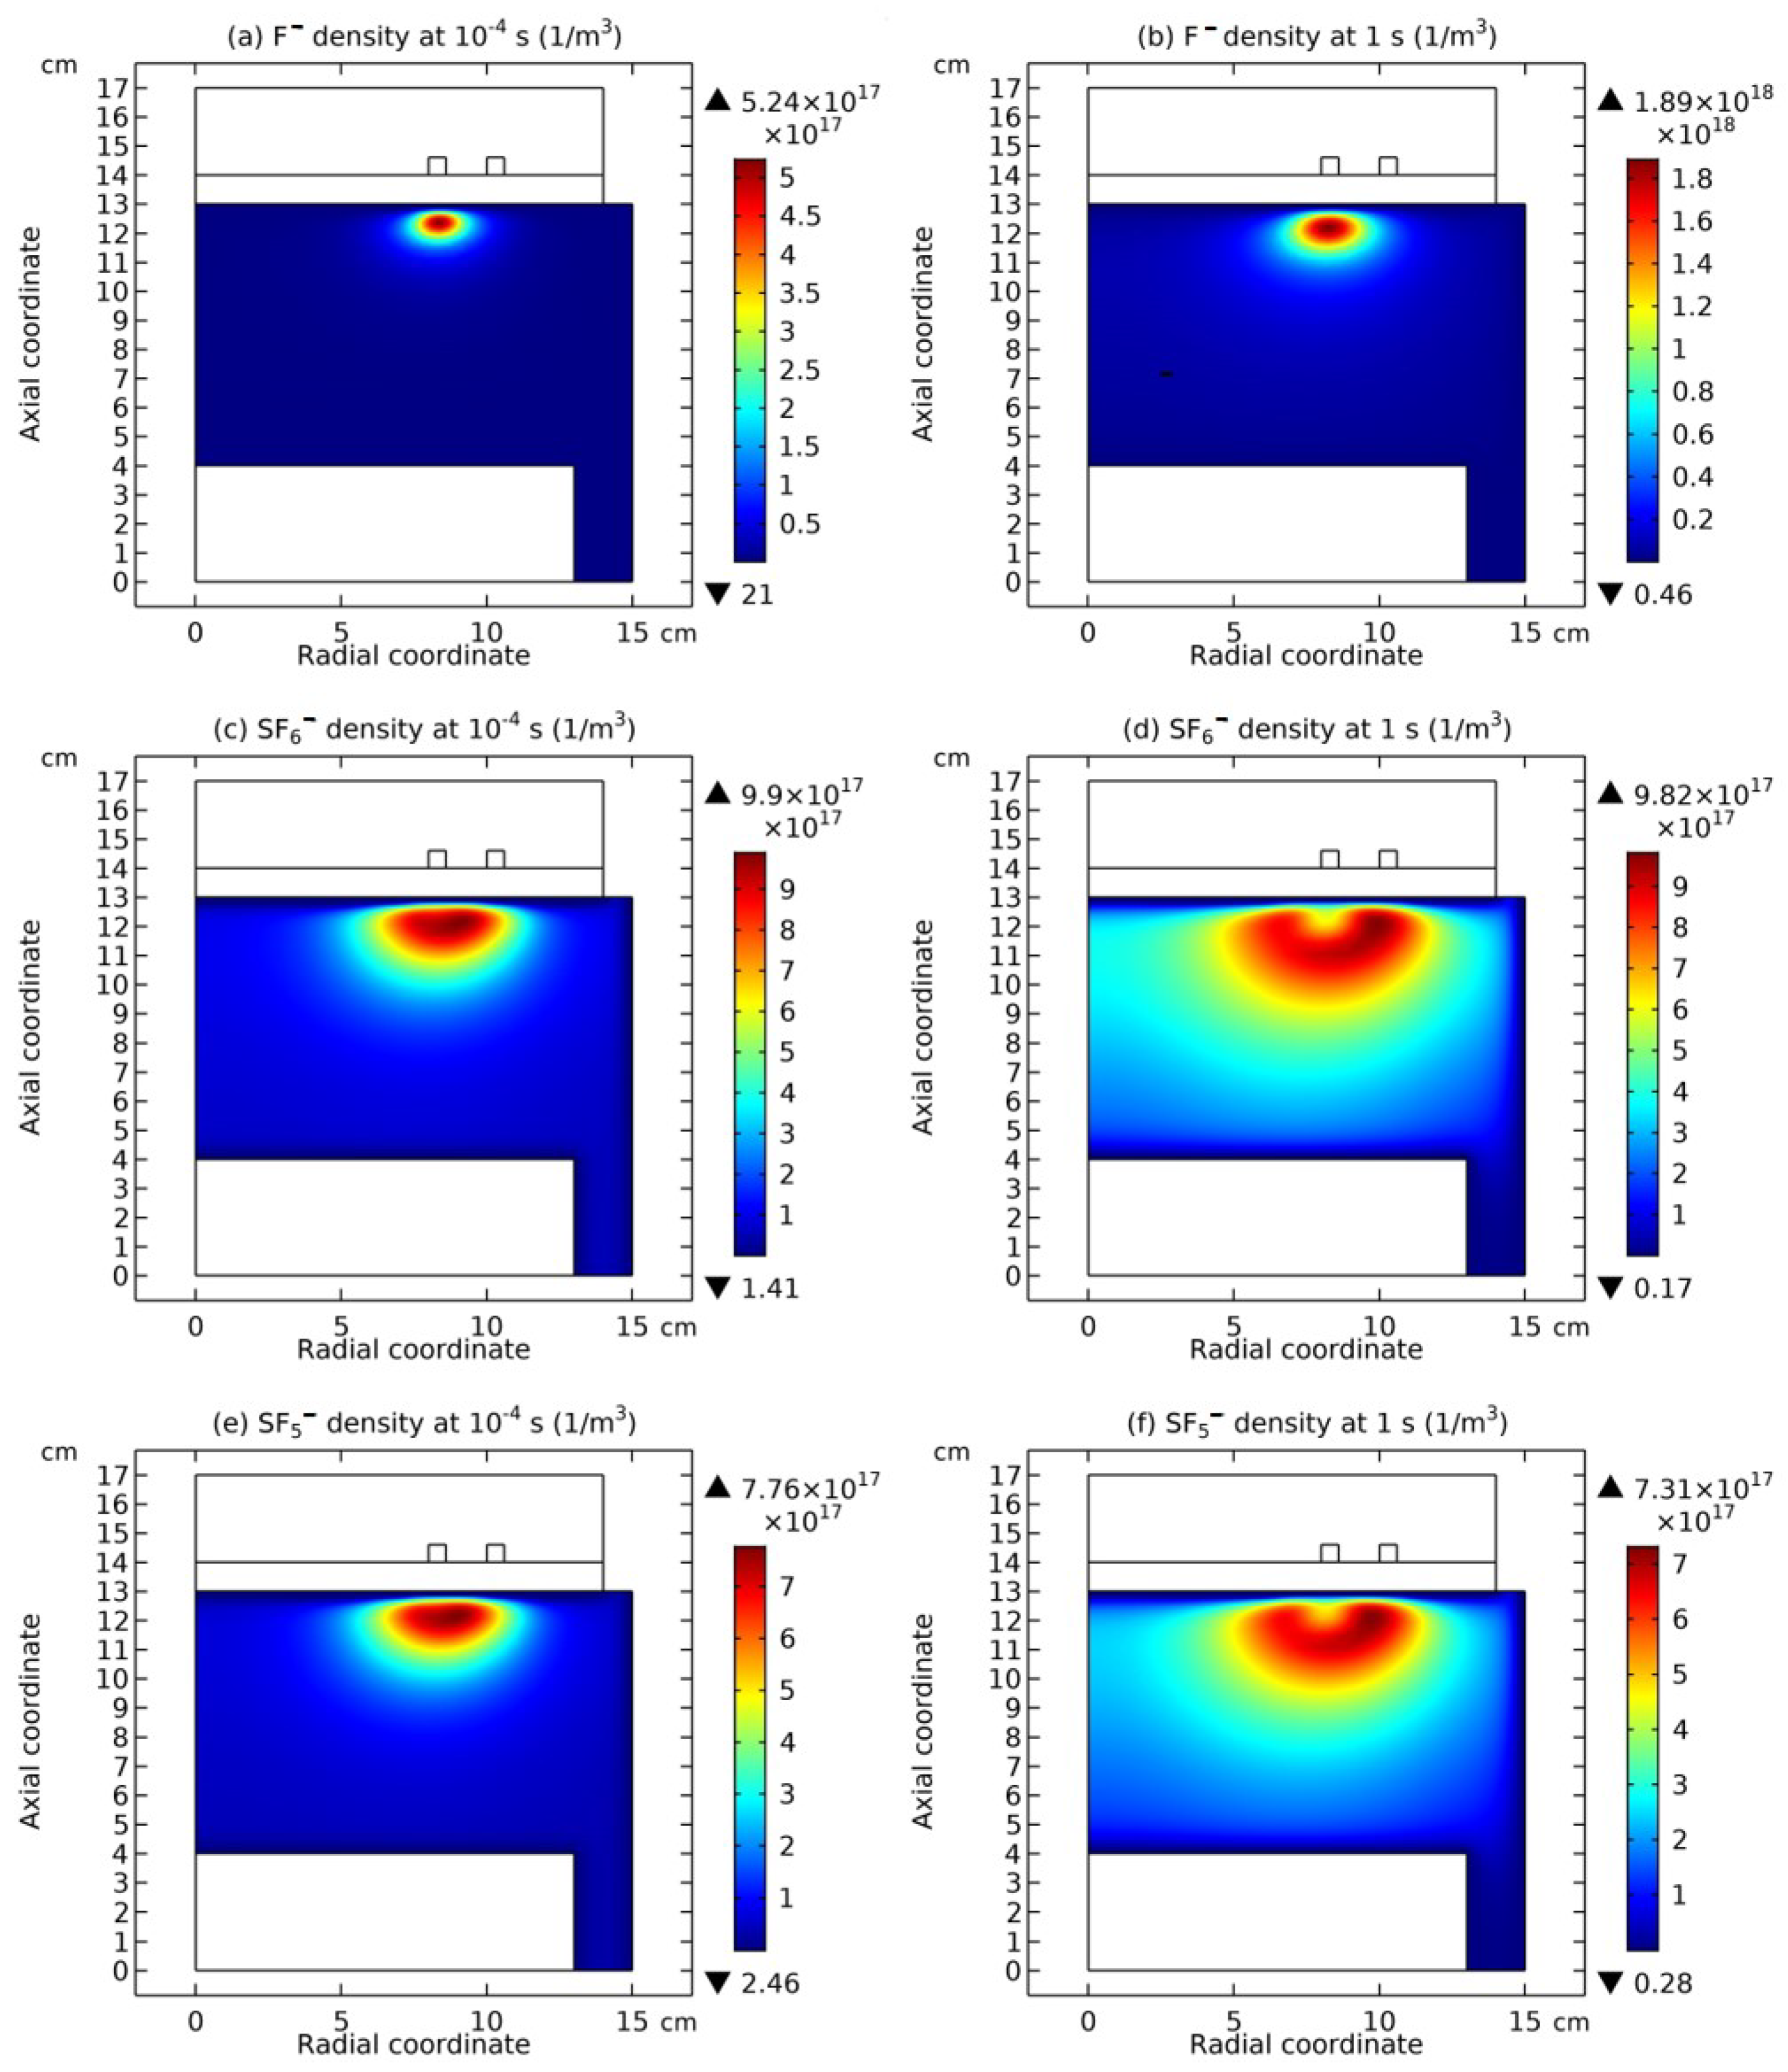
Ar/SF6 gaseous discharge creates many species of cation and anion (refer to the chemistry of Ar/SF6 plasma in Sec. 2). In Secs. (3.2) and (4.2), the densities of different cation/anion species are summarized. In the present section, it is seen that the astro-structures of certain species is collapsed when the densities of anions and cations are shown individually. In Figure 5(a,b) the density profiles of F species at two selected simulating times, 10 4 s and 1.0 s , are shown and in Figure 5(c-d) the density profiles of SF 6 and SF 5 species of the two times are shown. As seen, when increasing the simulating time the coagulated distribution of F is kept while the coagulations of SF 6 and SF 5 are obviously dispersed. Moreover, in the profiles of SF 6 and SF 5 a density vacancy is seen to apprear at the concise position that F is coagulated. As seen further in Sec. (4.3), these dispersions of anion density profiles are caused by the electrically expelling force that exists between themselves and their opponent, F , after they are viewed as mass-point (or point-charge more precisely) models.
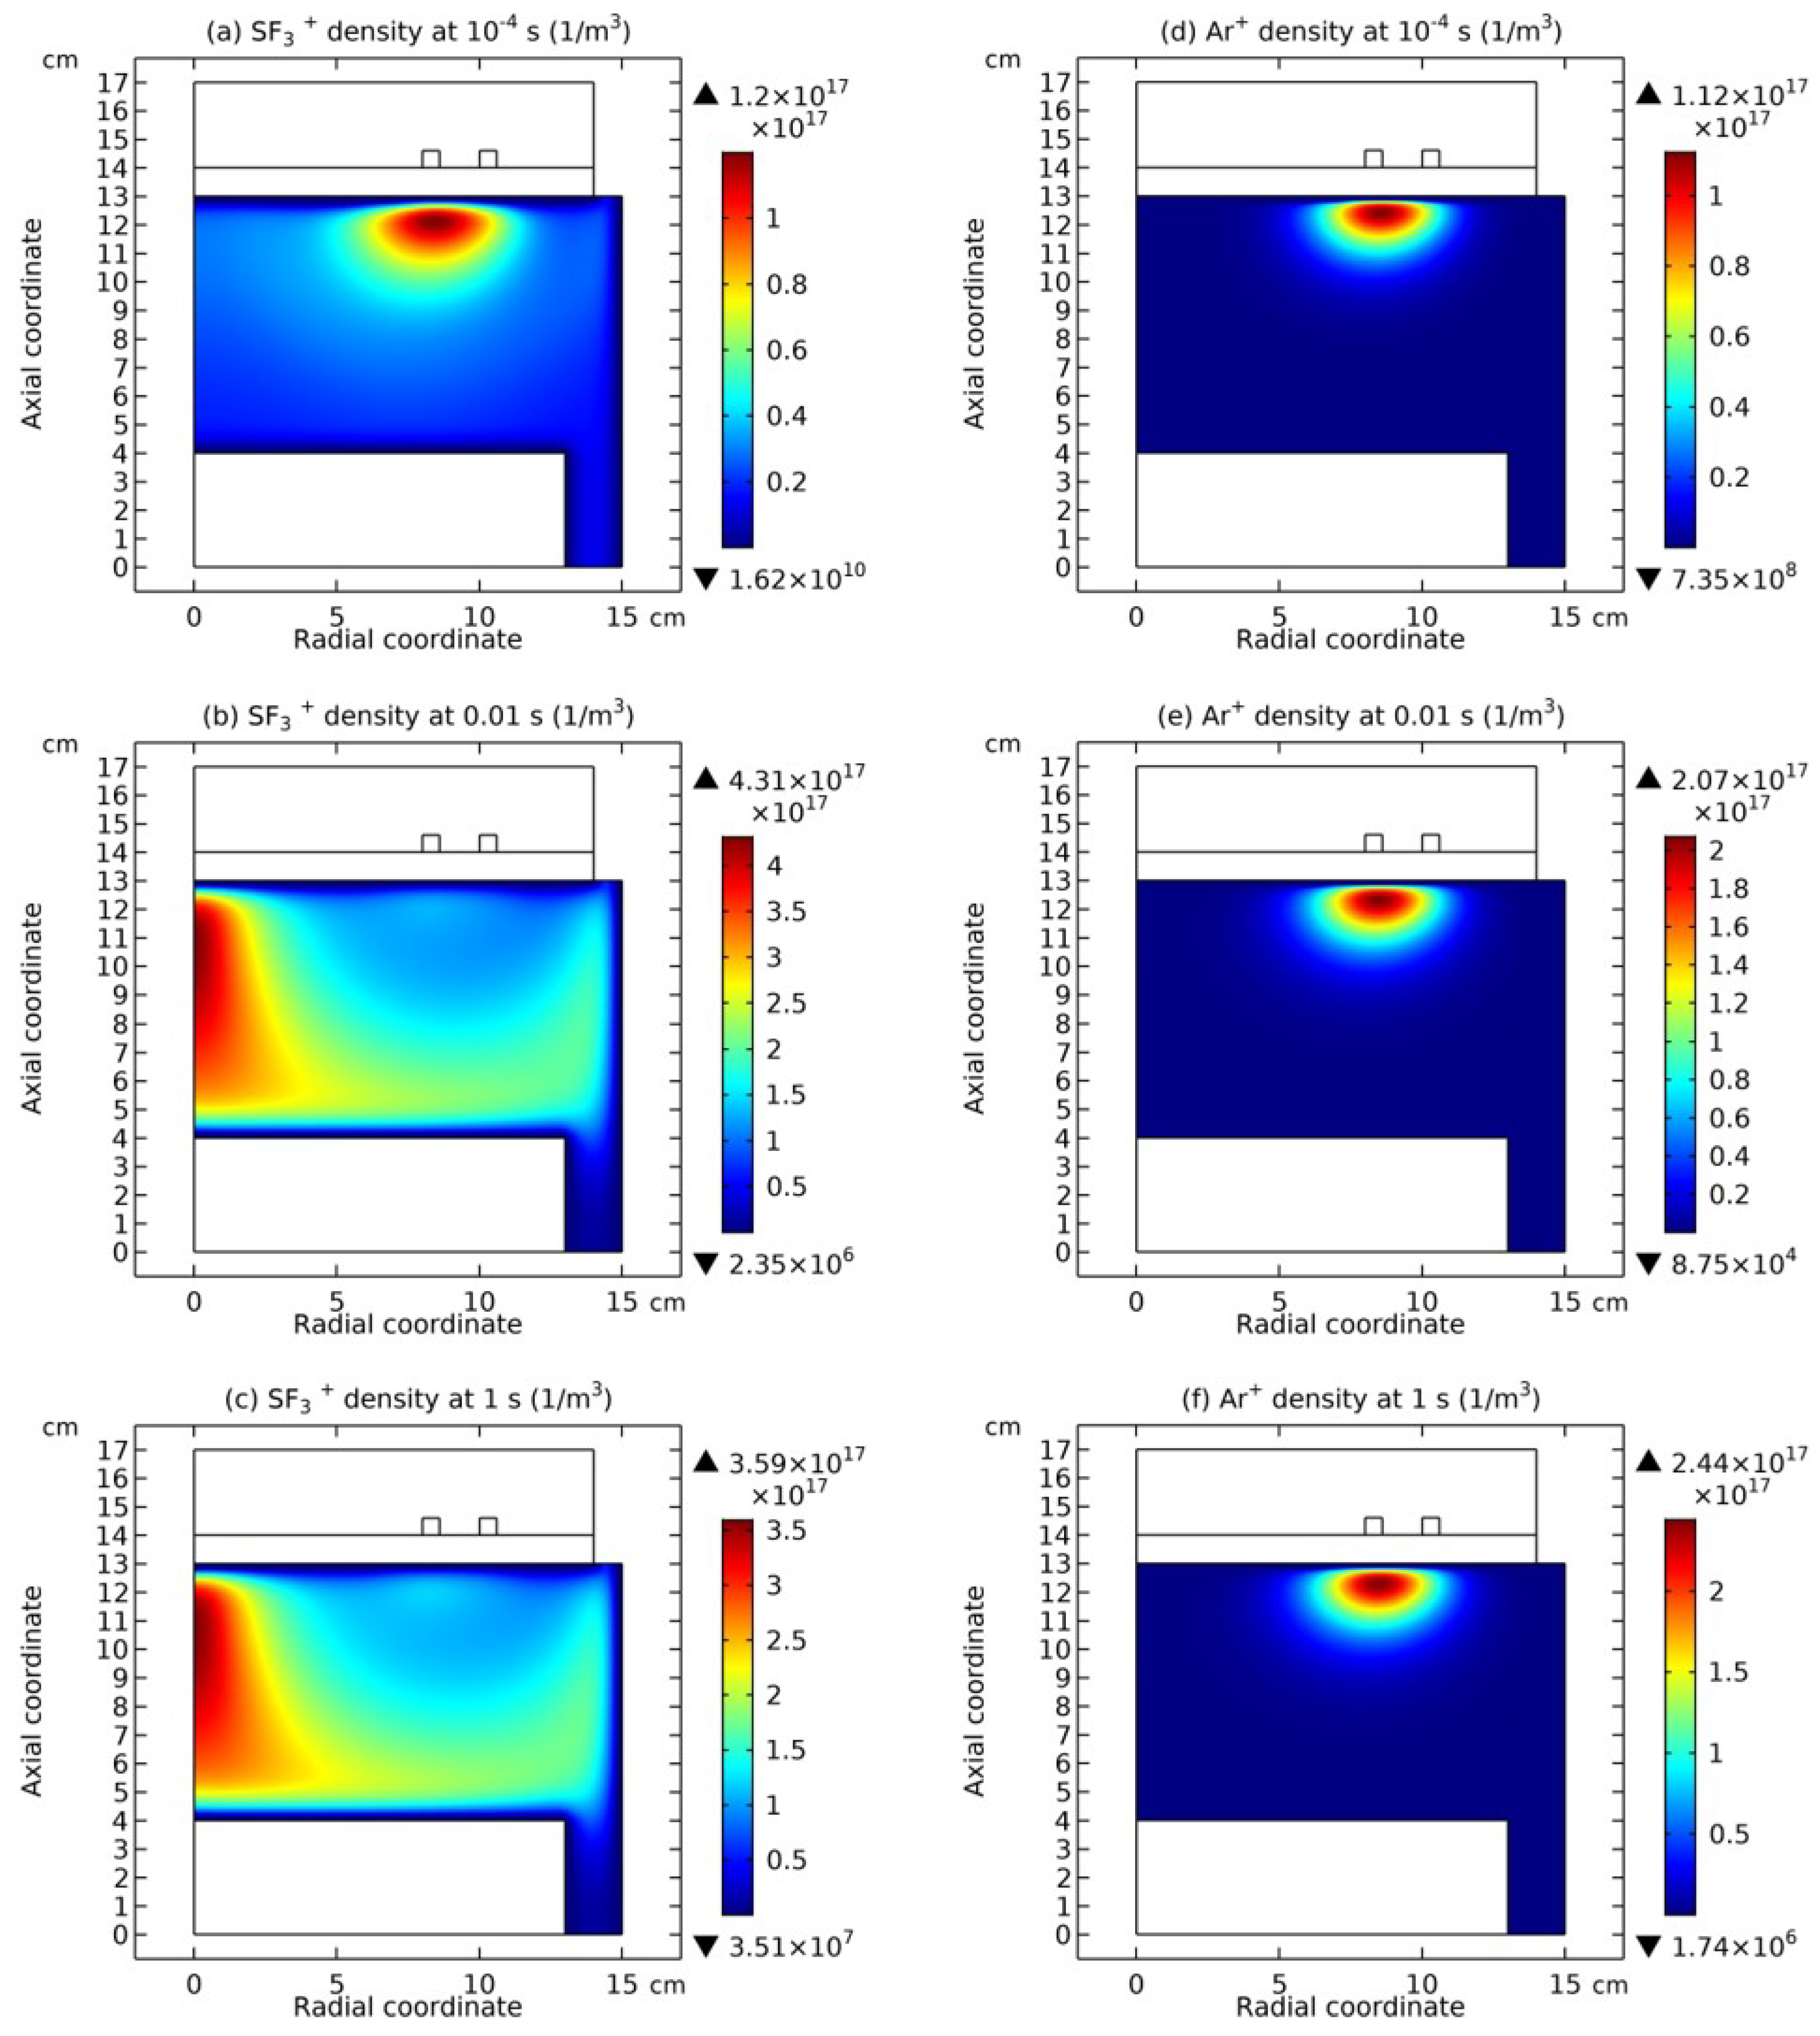
In Figure 6, the density profiles of two cation species, SF 3 + and Ar + , at three selected simulating times, 10 4 s , 0 . 01 s and 1.0 s , are shown. Upon increasing the simulating time, the original coagulation of SF 3 + under the coil is totally dispersed and new coagulation is formed along the central axis as shown in Figure 6(a-c). Nevertheless, the coagulation of Ar + is not changed with the time in Figure 6(d-f). As seen further, the collapse of cation coagulation is caused by the expelling effect of astro-structures that carry positive charge. Besides, the coagulation of cation (totally disappreared) is more dispersed than the anions in Figure 5. Moreover, in the collapsing processes of both anions and cation it is found the lighter the species is, the easier the coagulation is. In particular, in Figure 5 and Figure 6 the coagulations of anion, F , that is lighter than SF 6 and SF 5 and of cation, Ar + , that is lighter than SF 3 + are not dispersed.
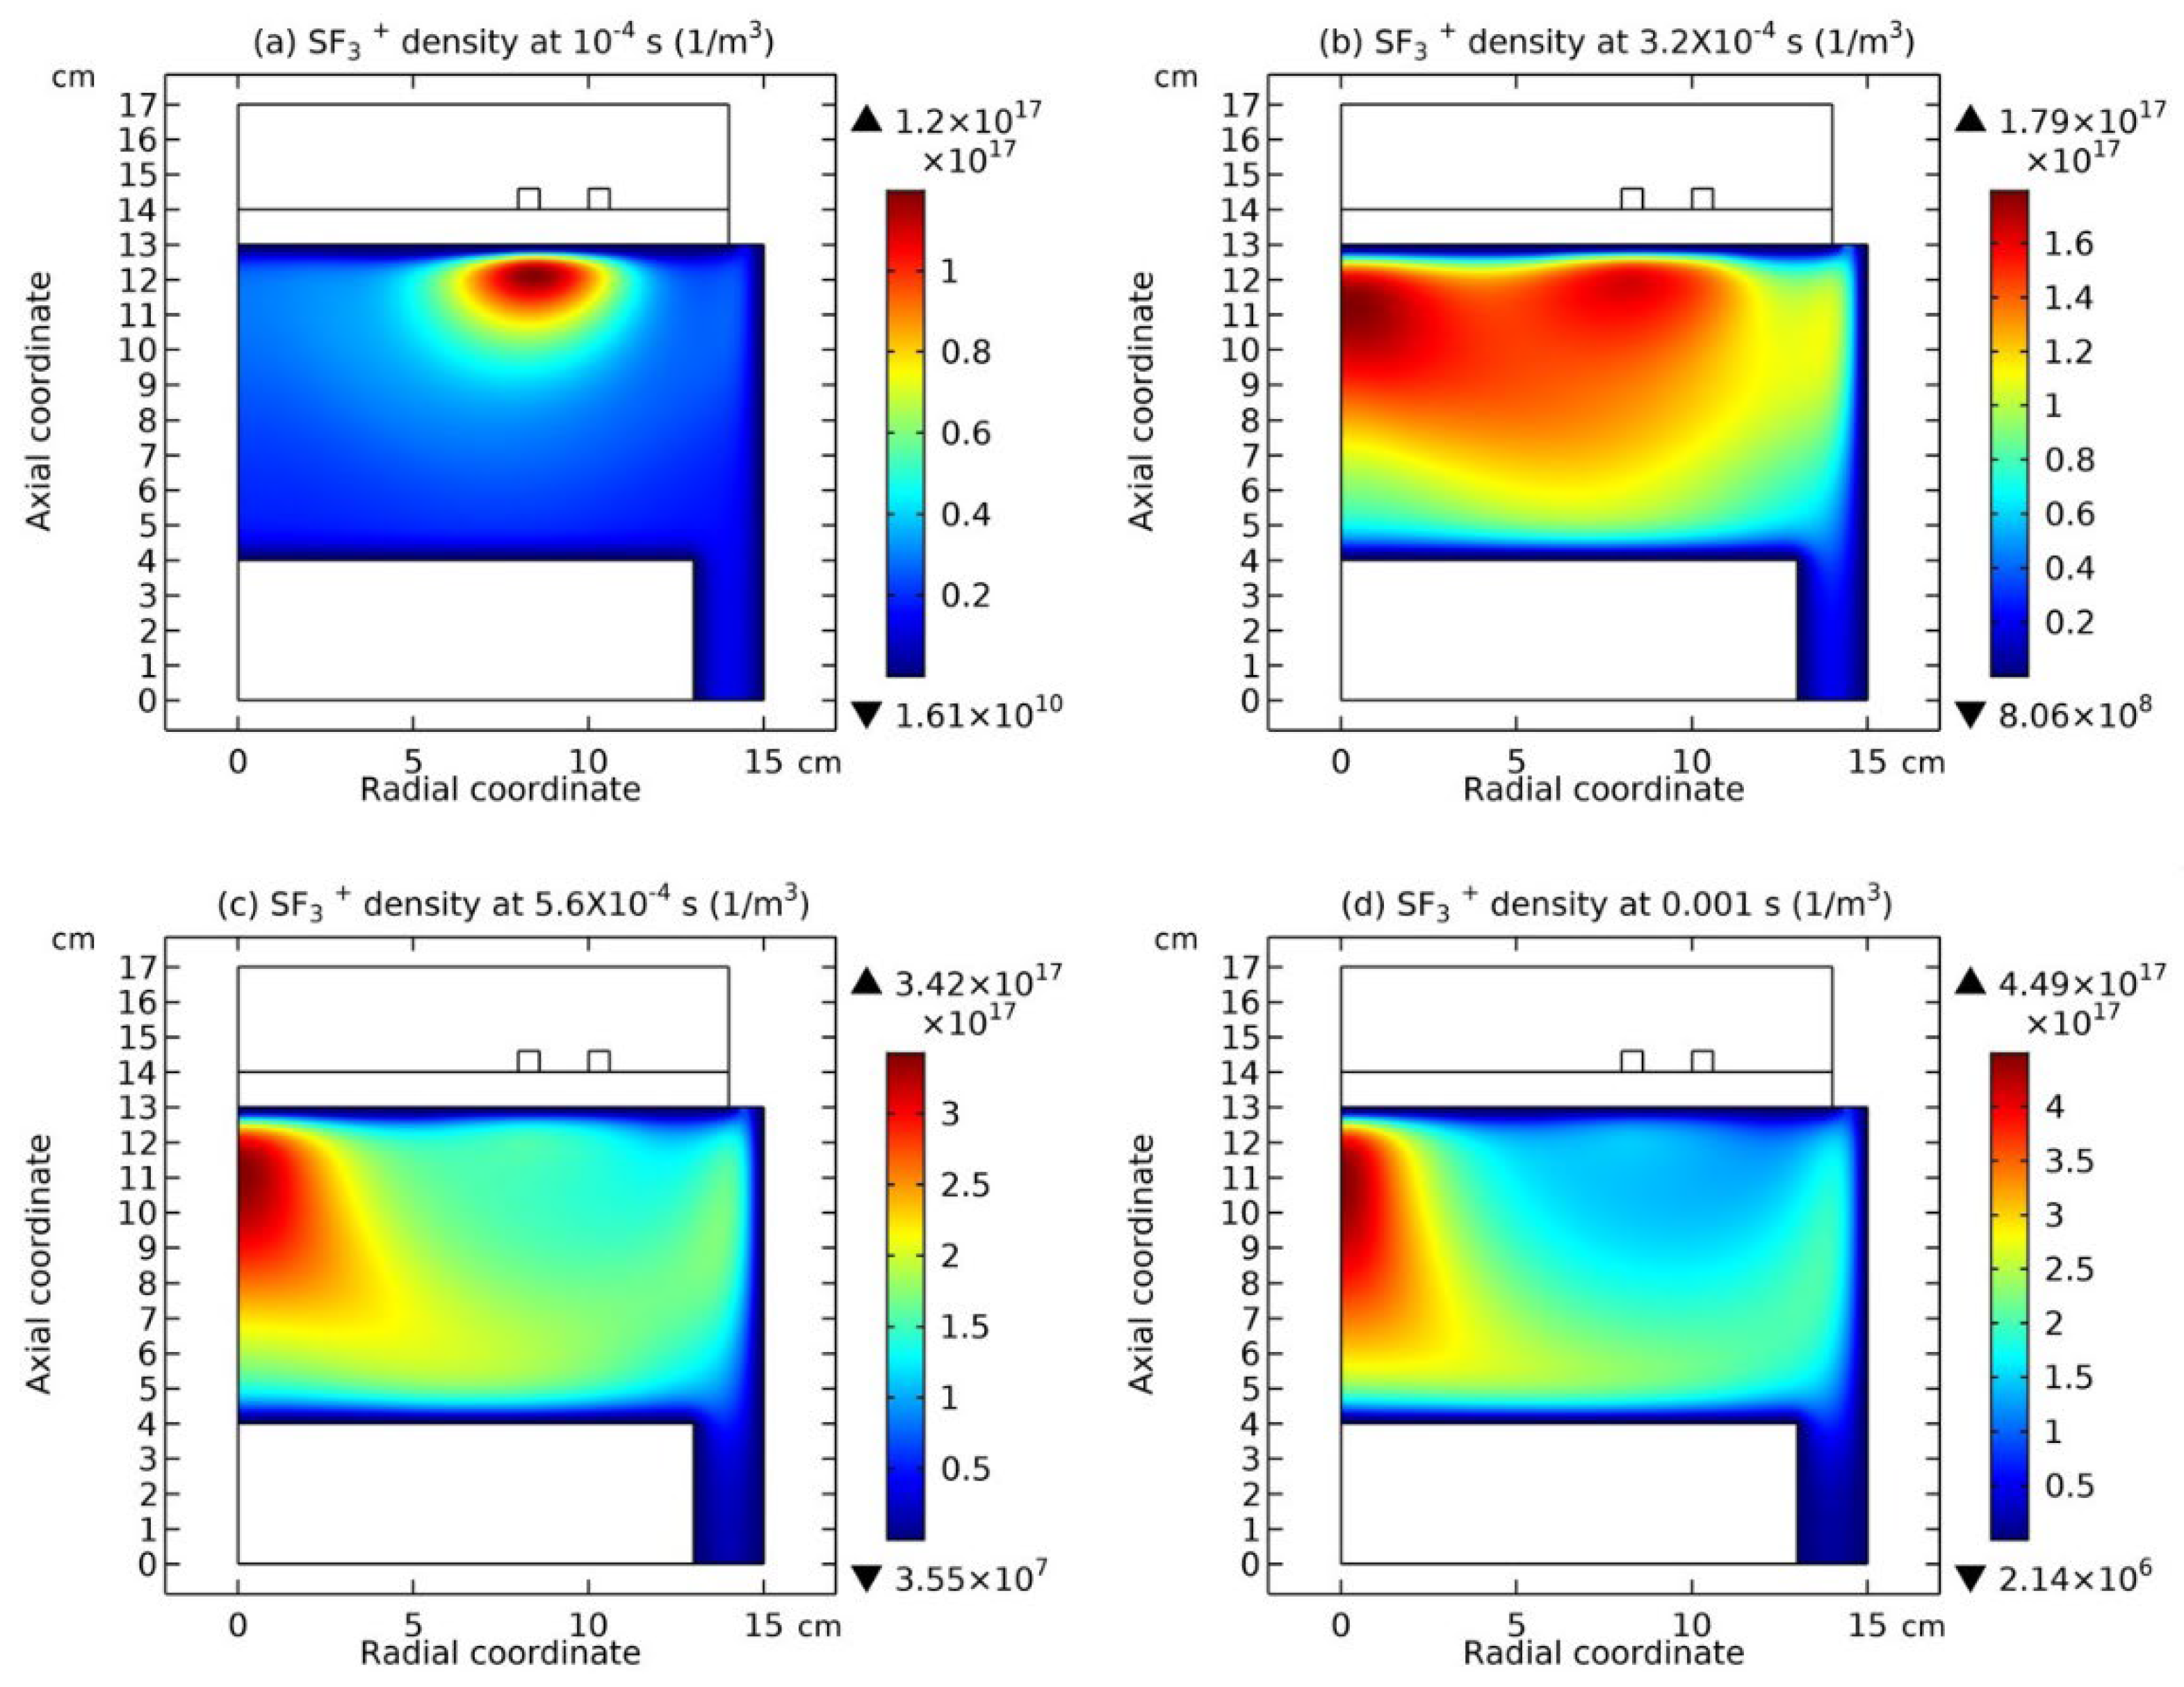
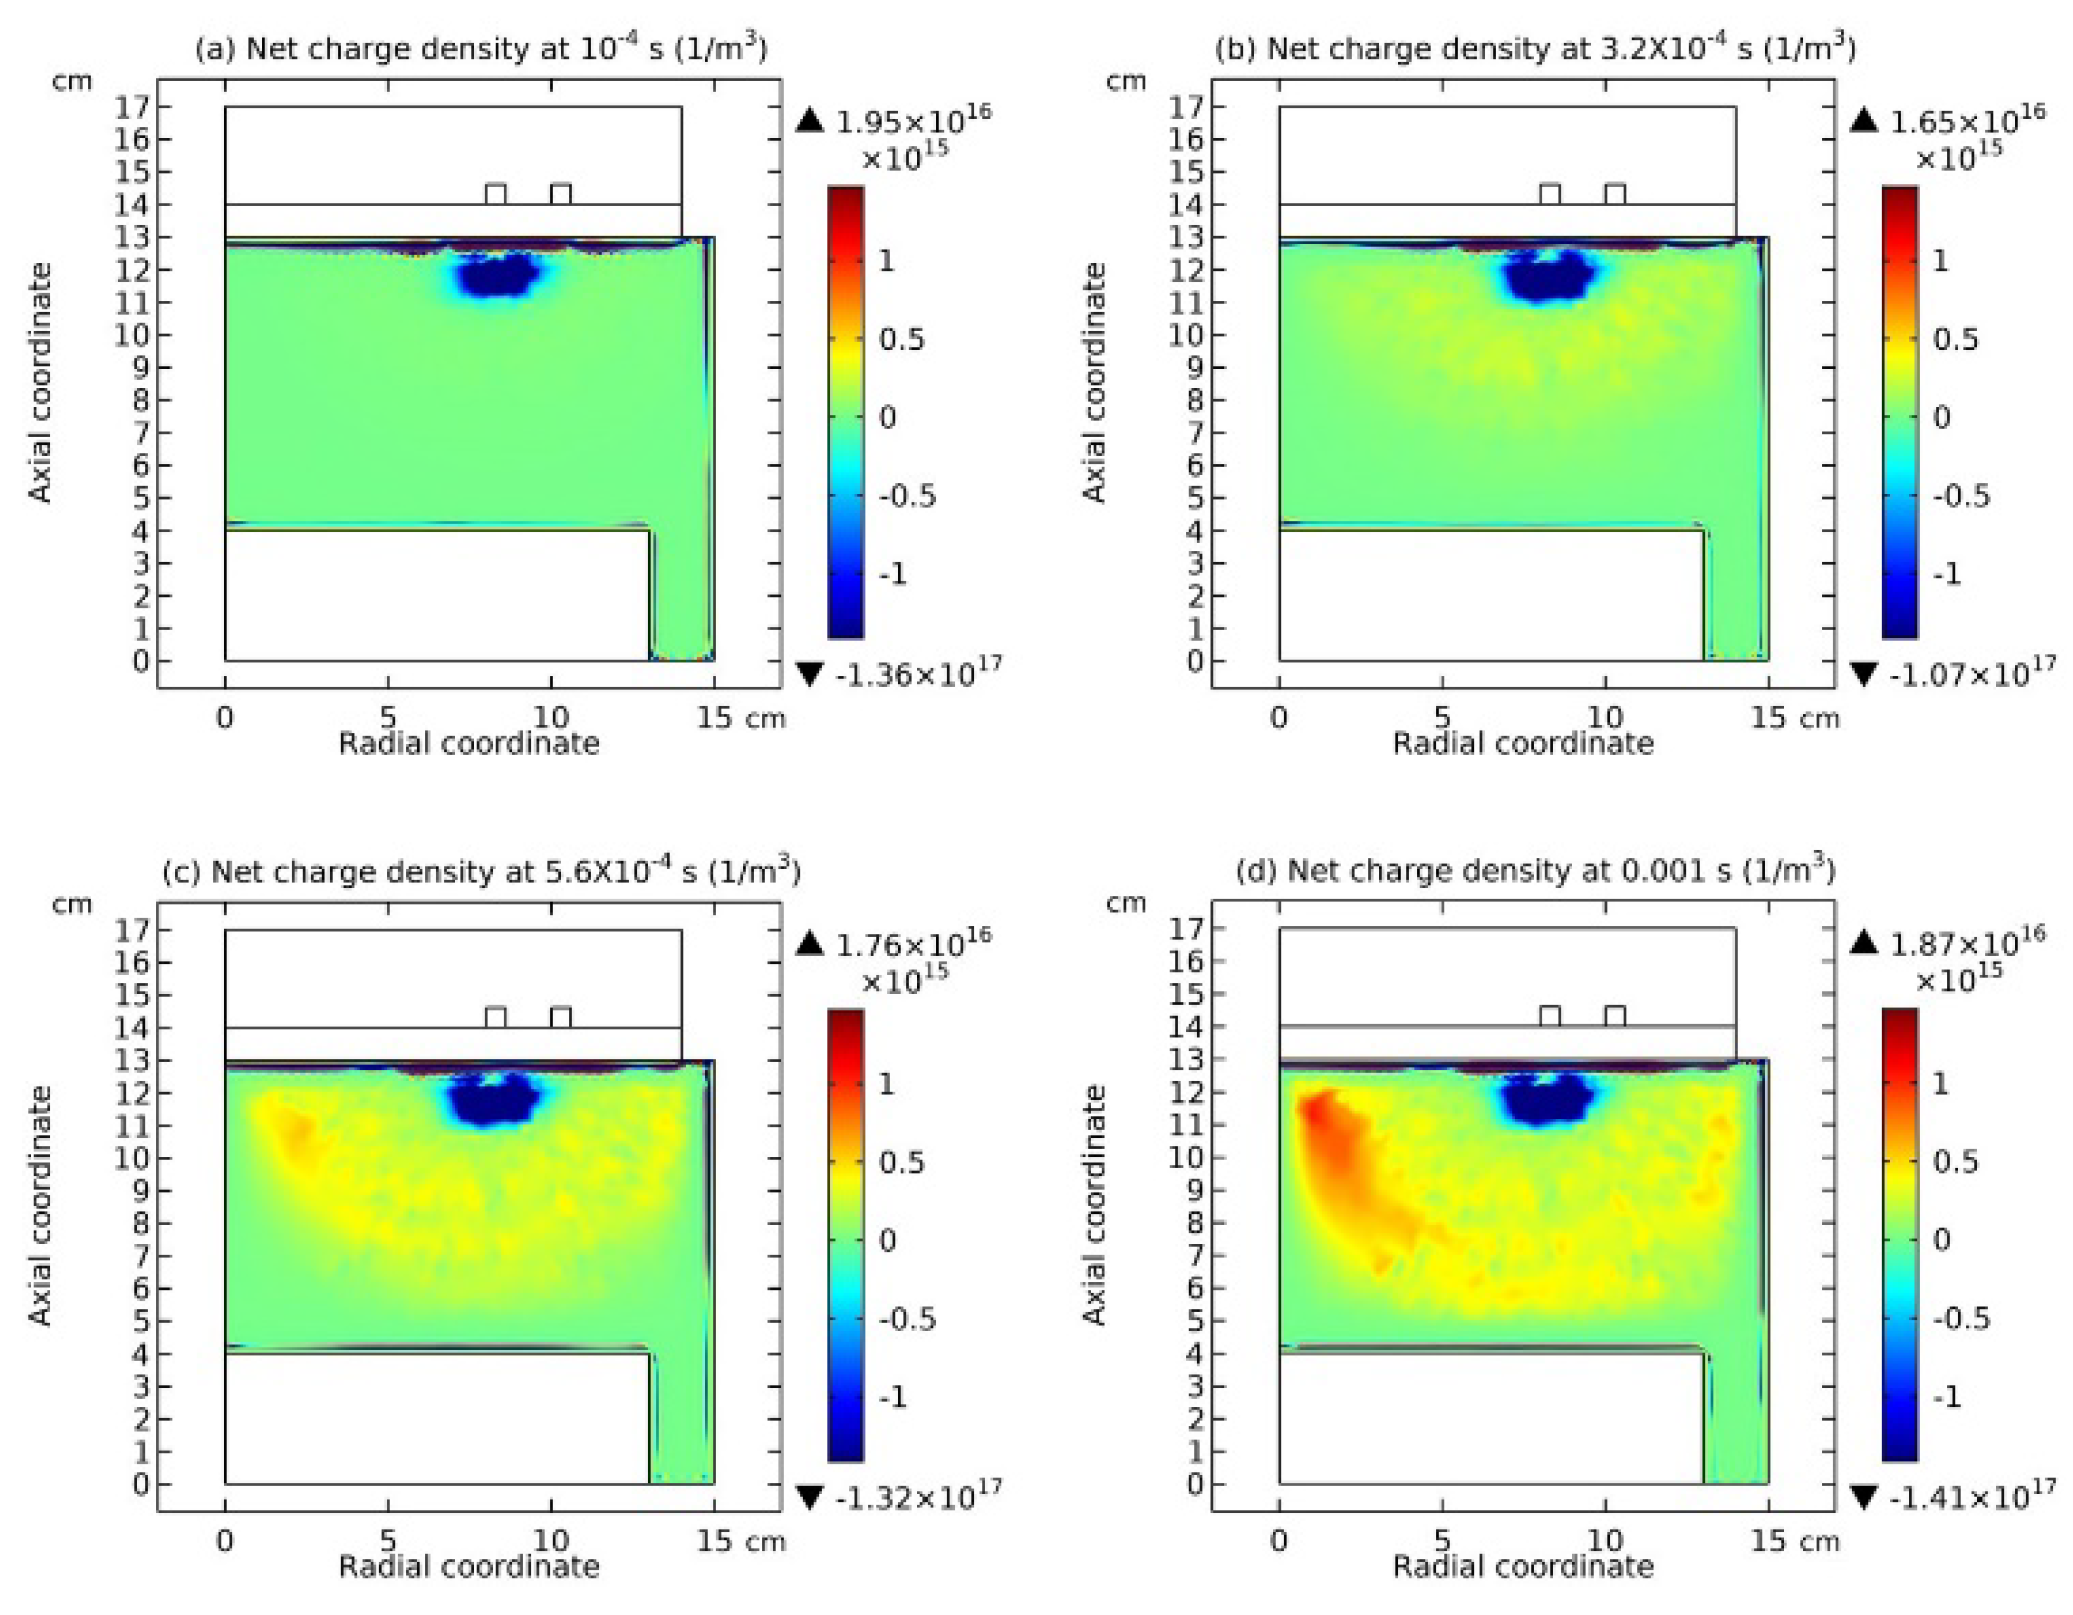
In Figure 7, more detail for the collapsing process of SF 3 + astro-structure is presented, corresponding to four different times. In Figure 8, the charge density profiles at the above four times are given. It is seen from the Figure 7 and Figure 8 that along the dispersion of SF 3 + species, radiative positive charge cloud is appreared in the periphery of astro-structure. The simulation shows the radiative charge cloud is not compresded into a layer (i.e., non-neutral sheath) by means of the Debye’s shield. It is an anti-collective behavior of astro-structure in electronegative plasmas.

3.4. Rebuilding of Astro-Structure by Minor Species

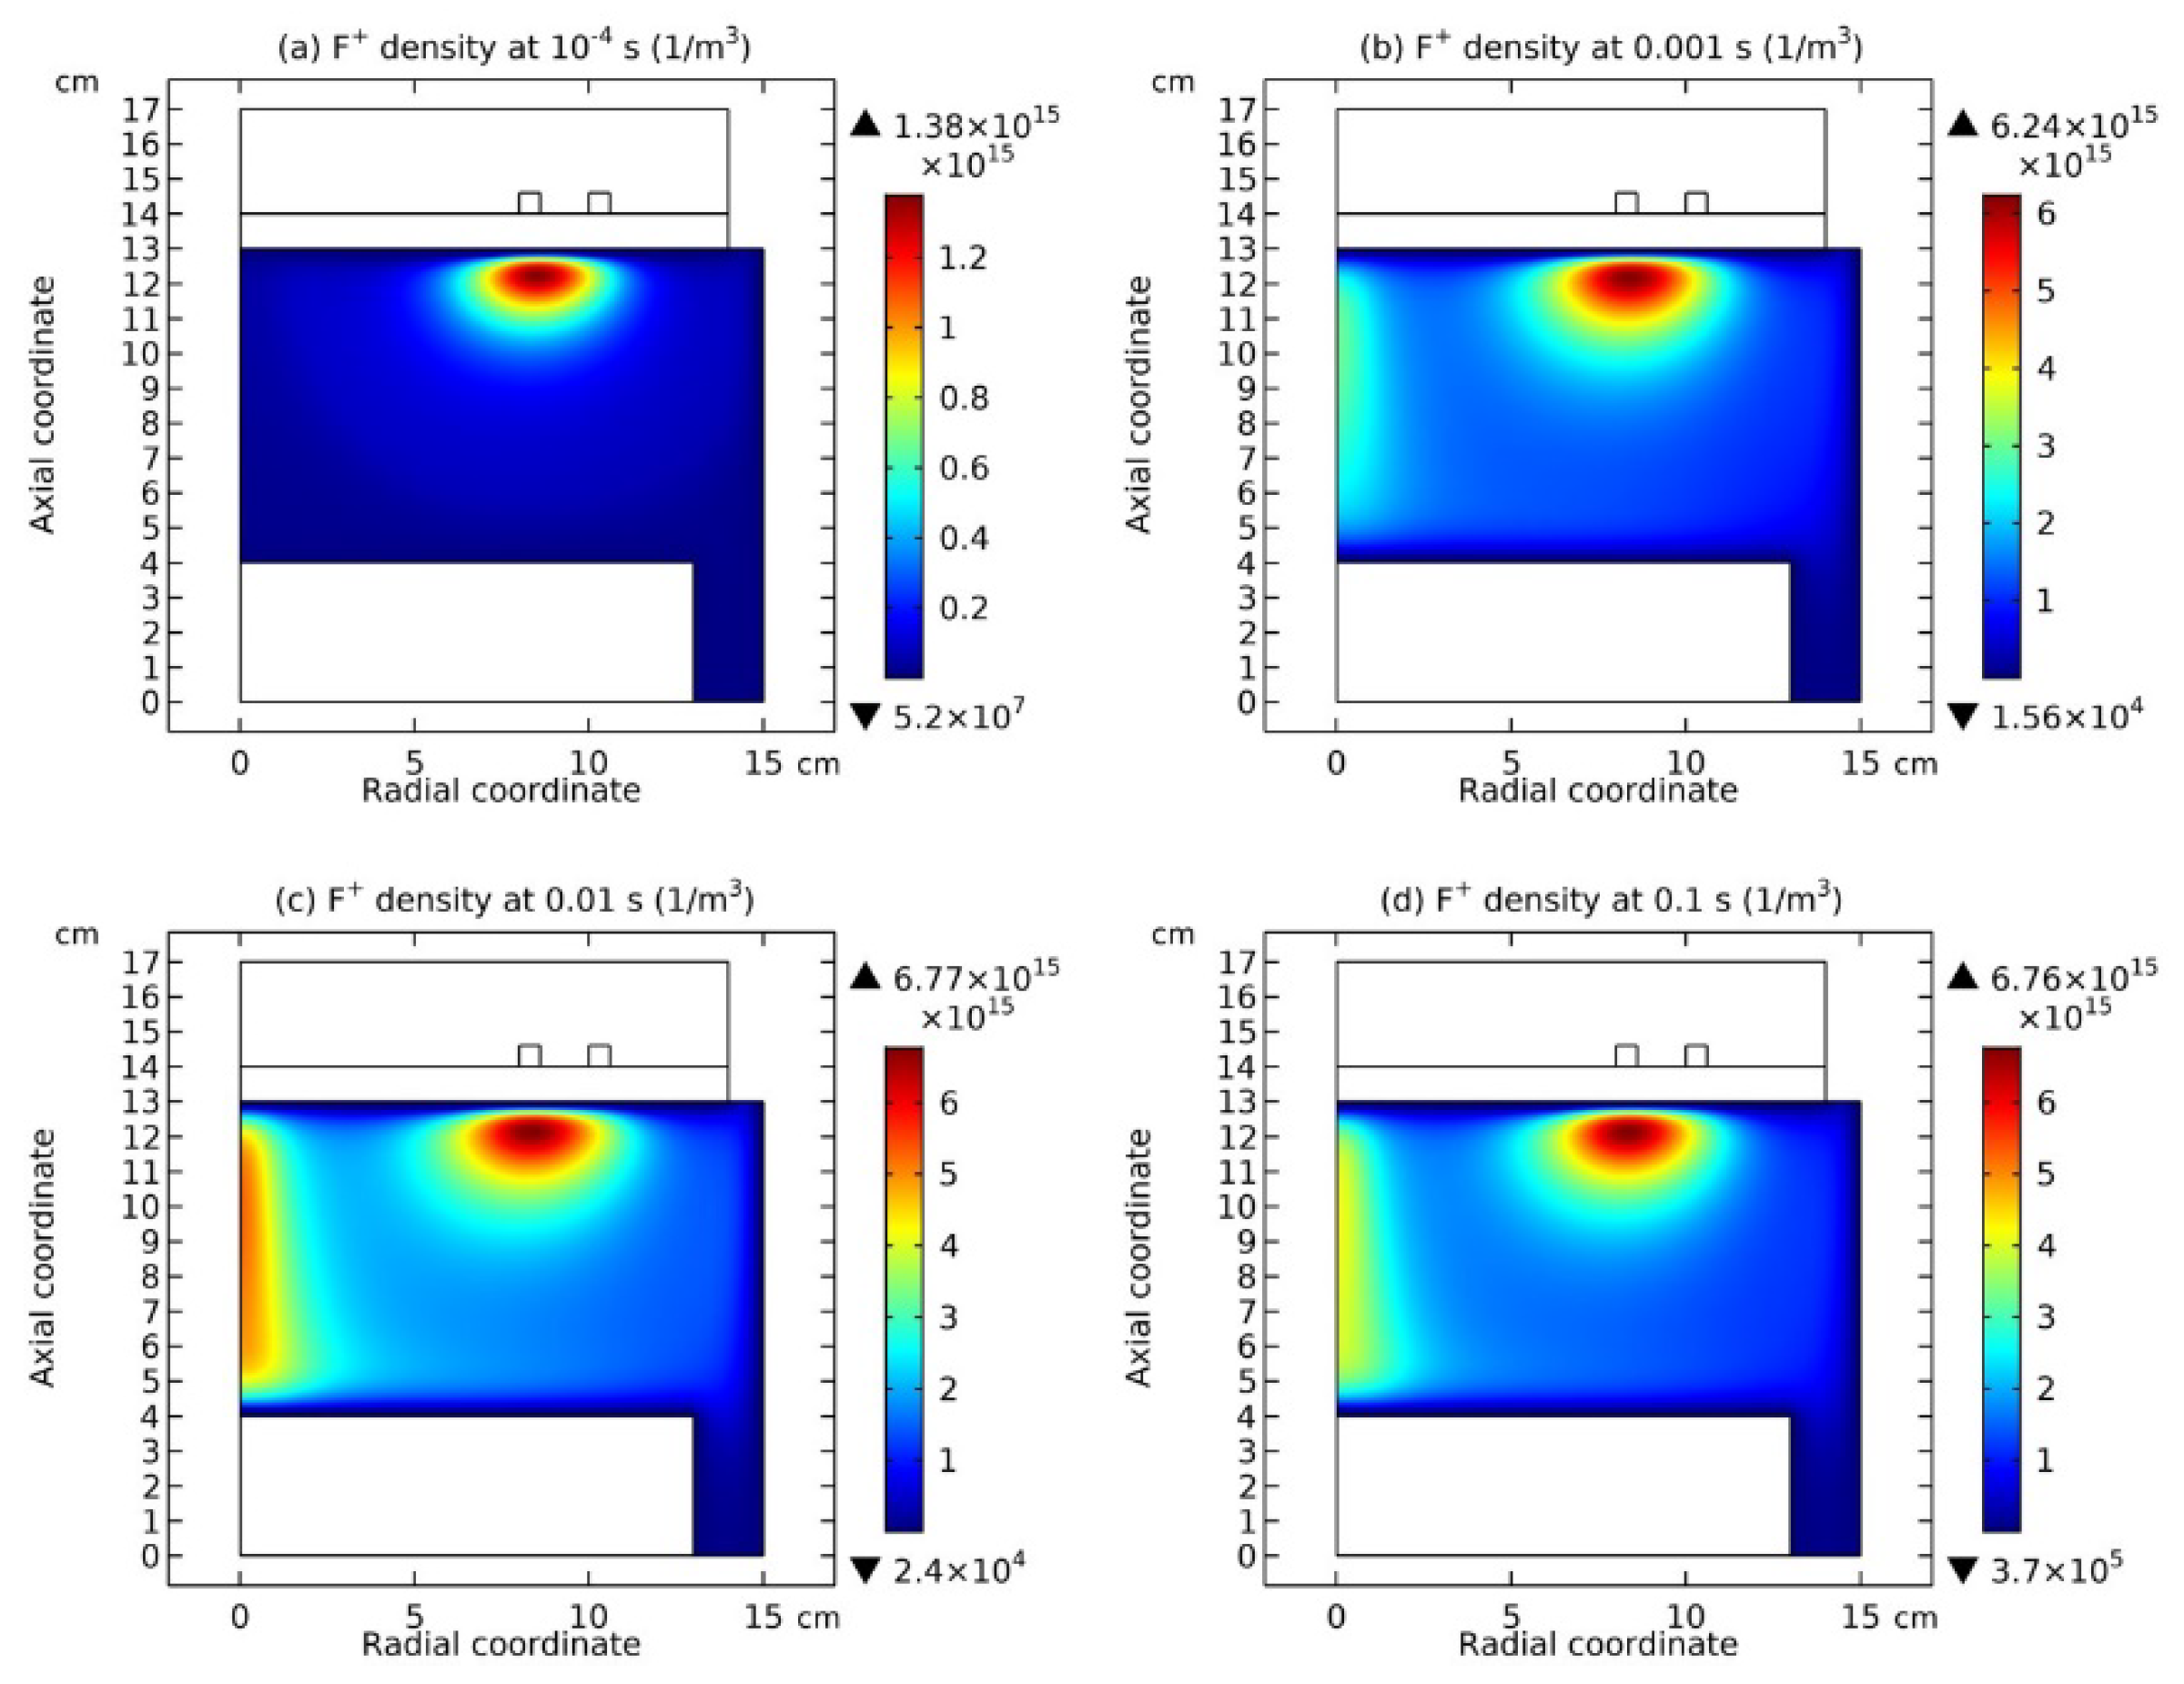
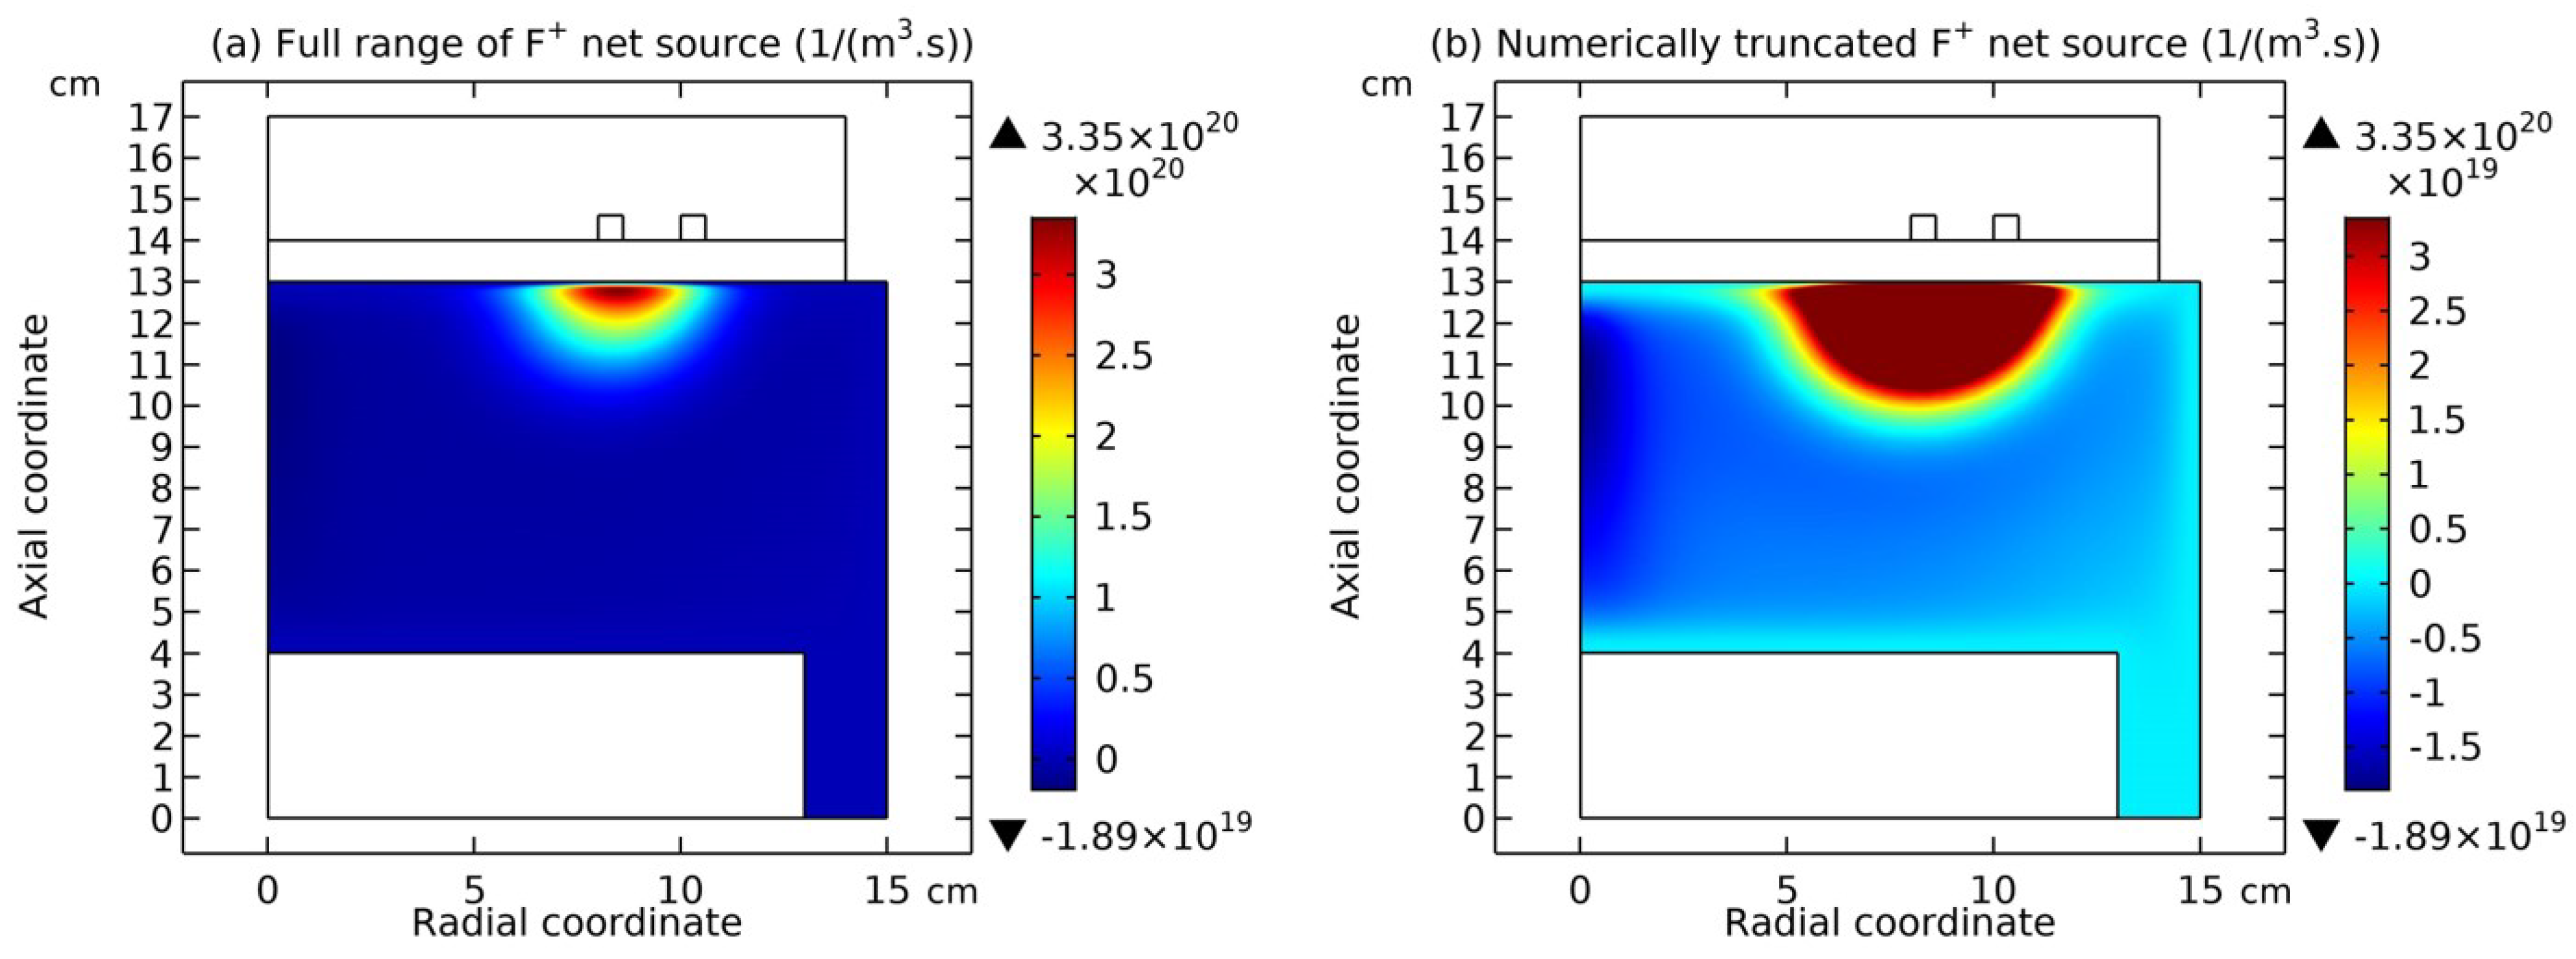
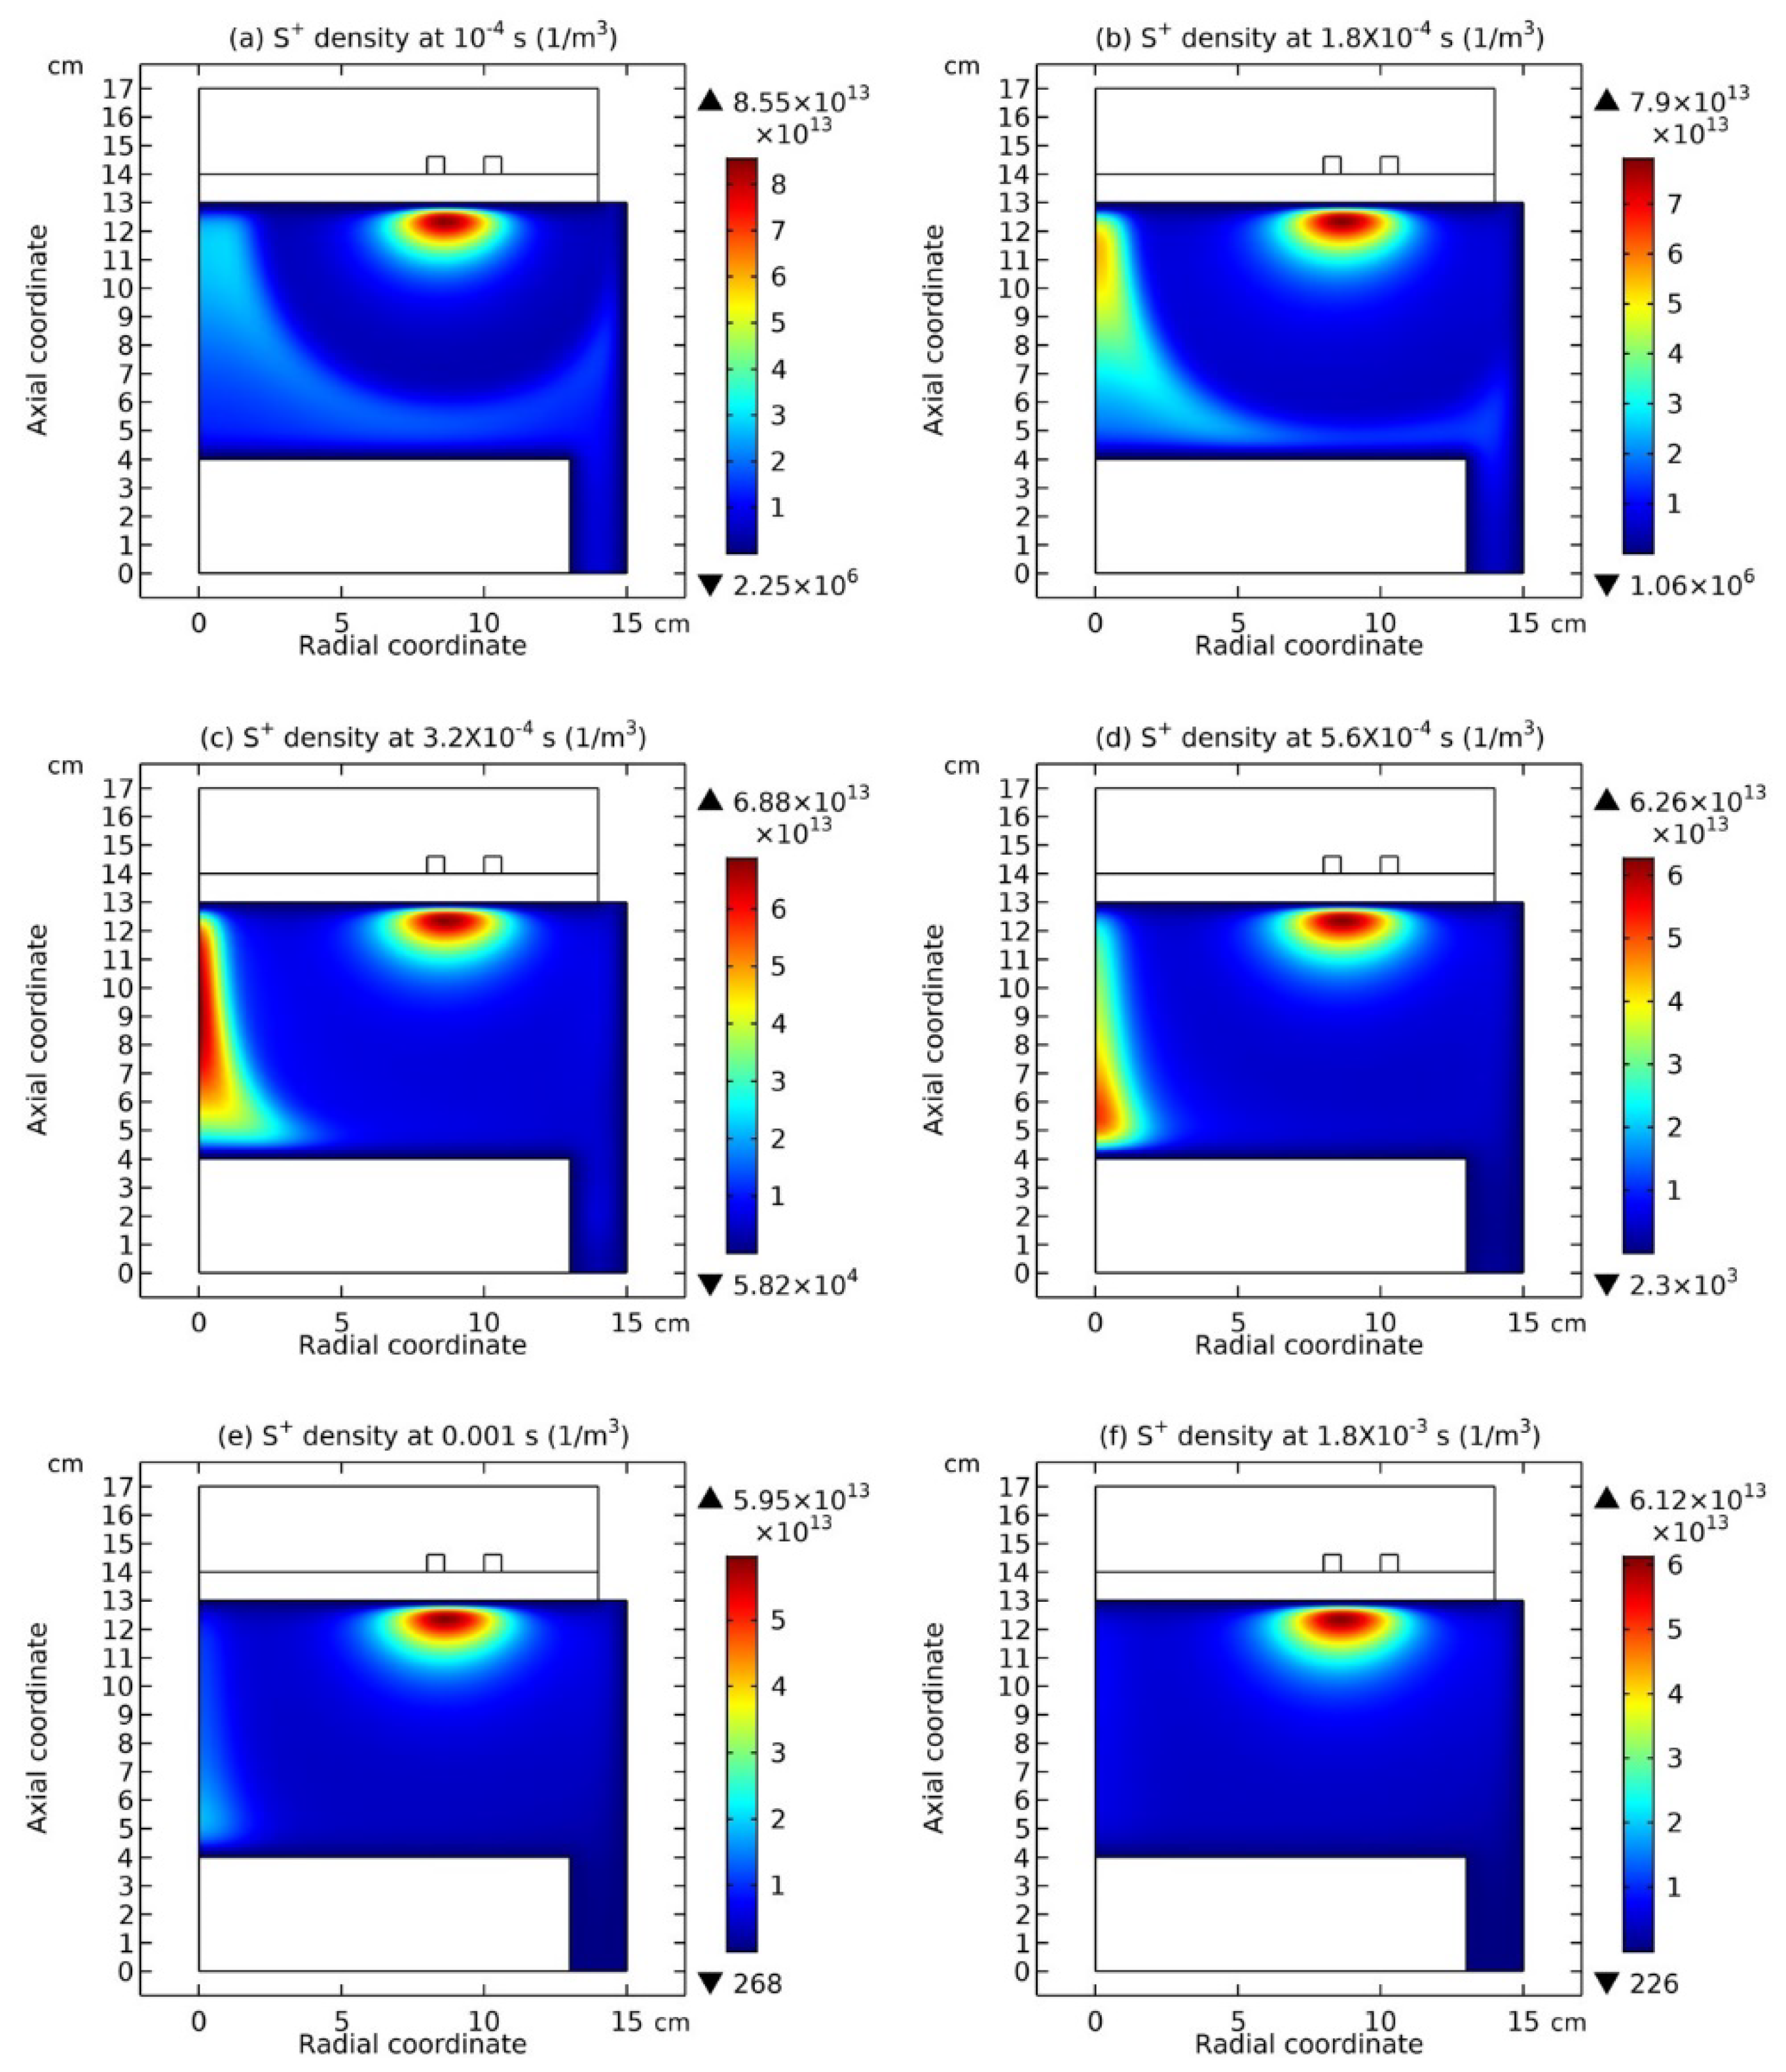
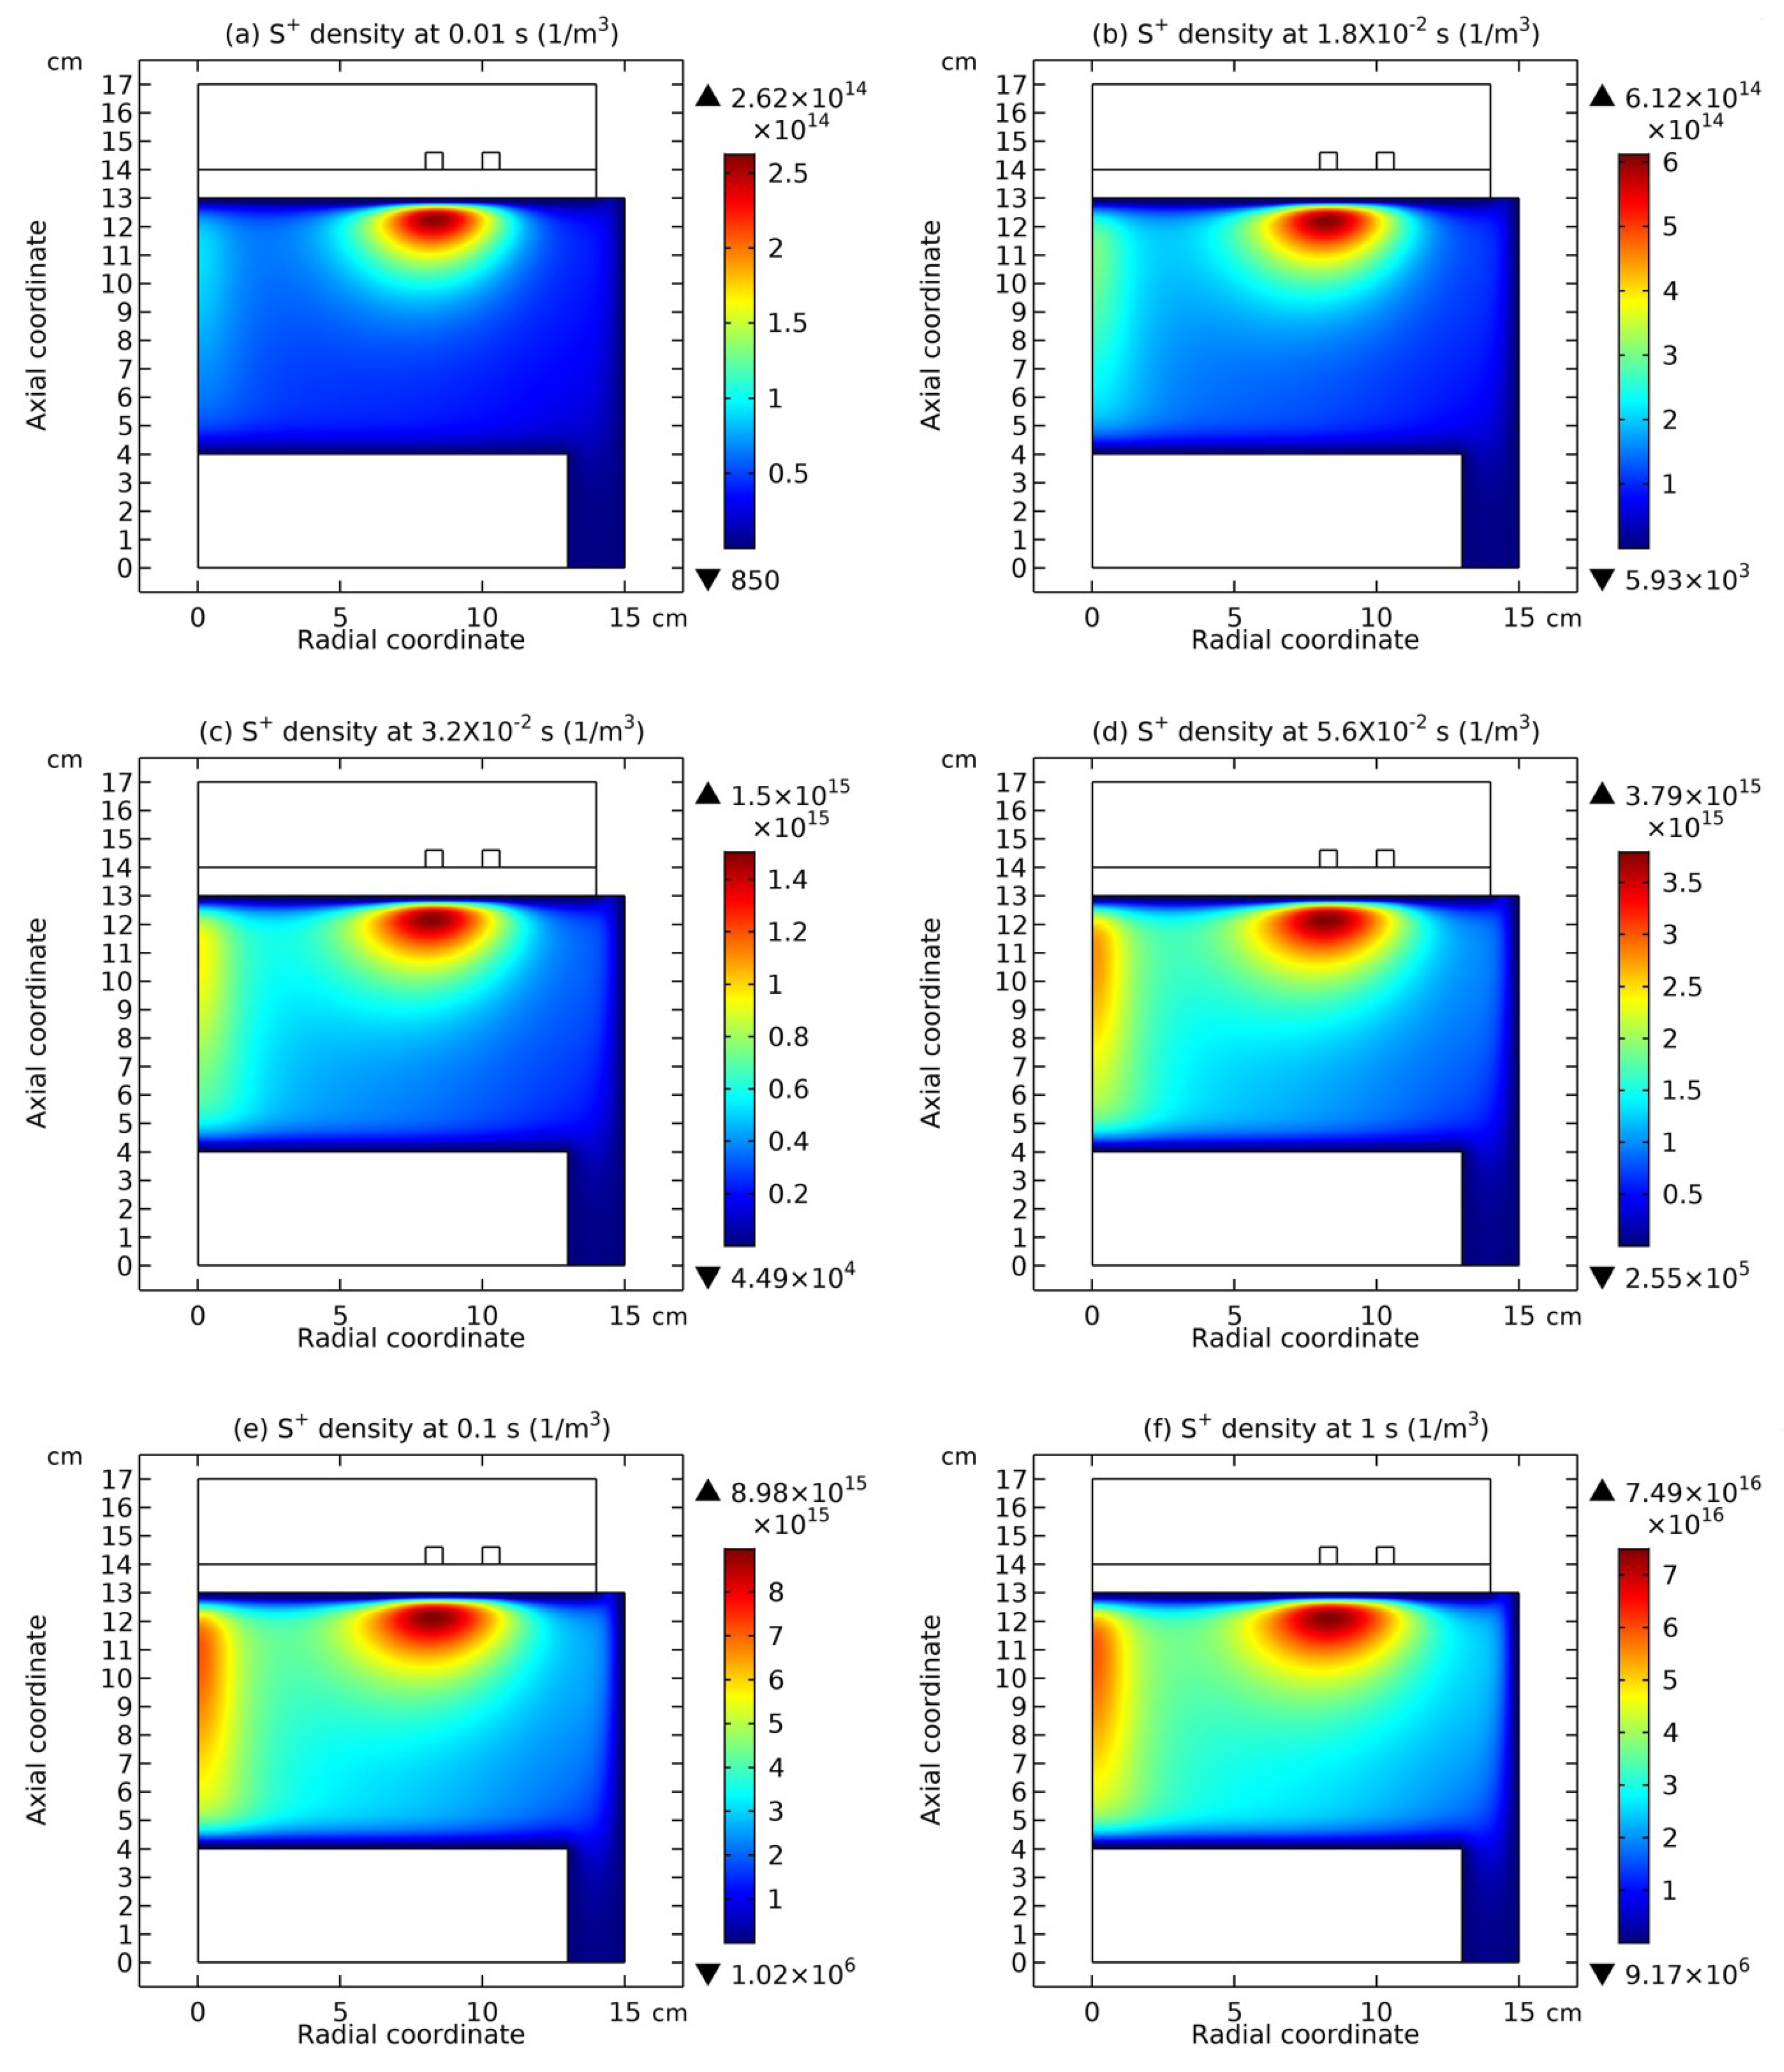
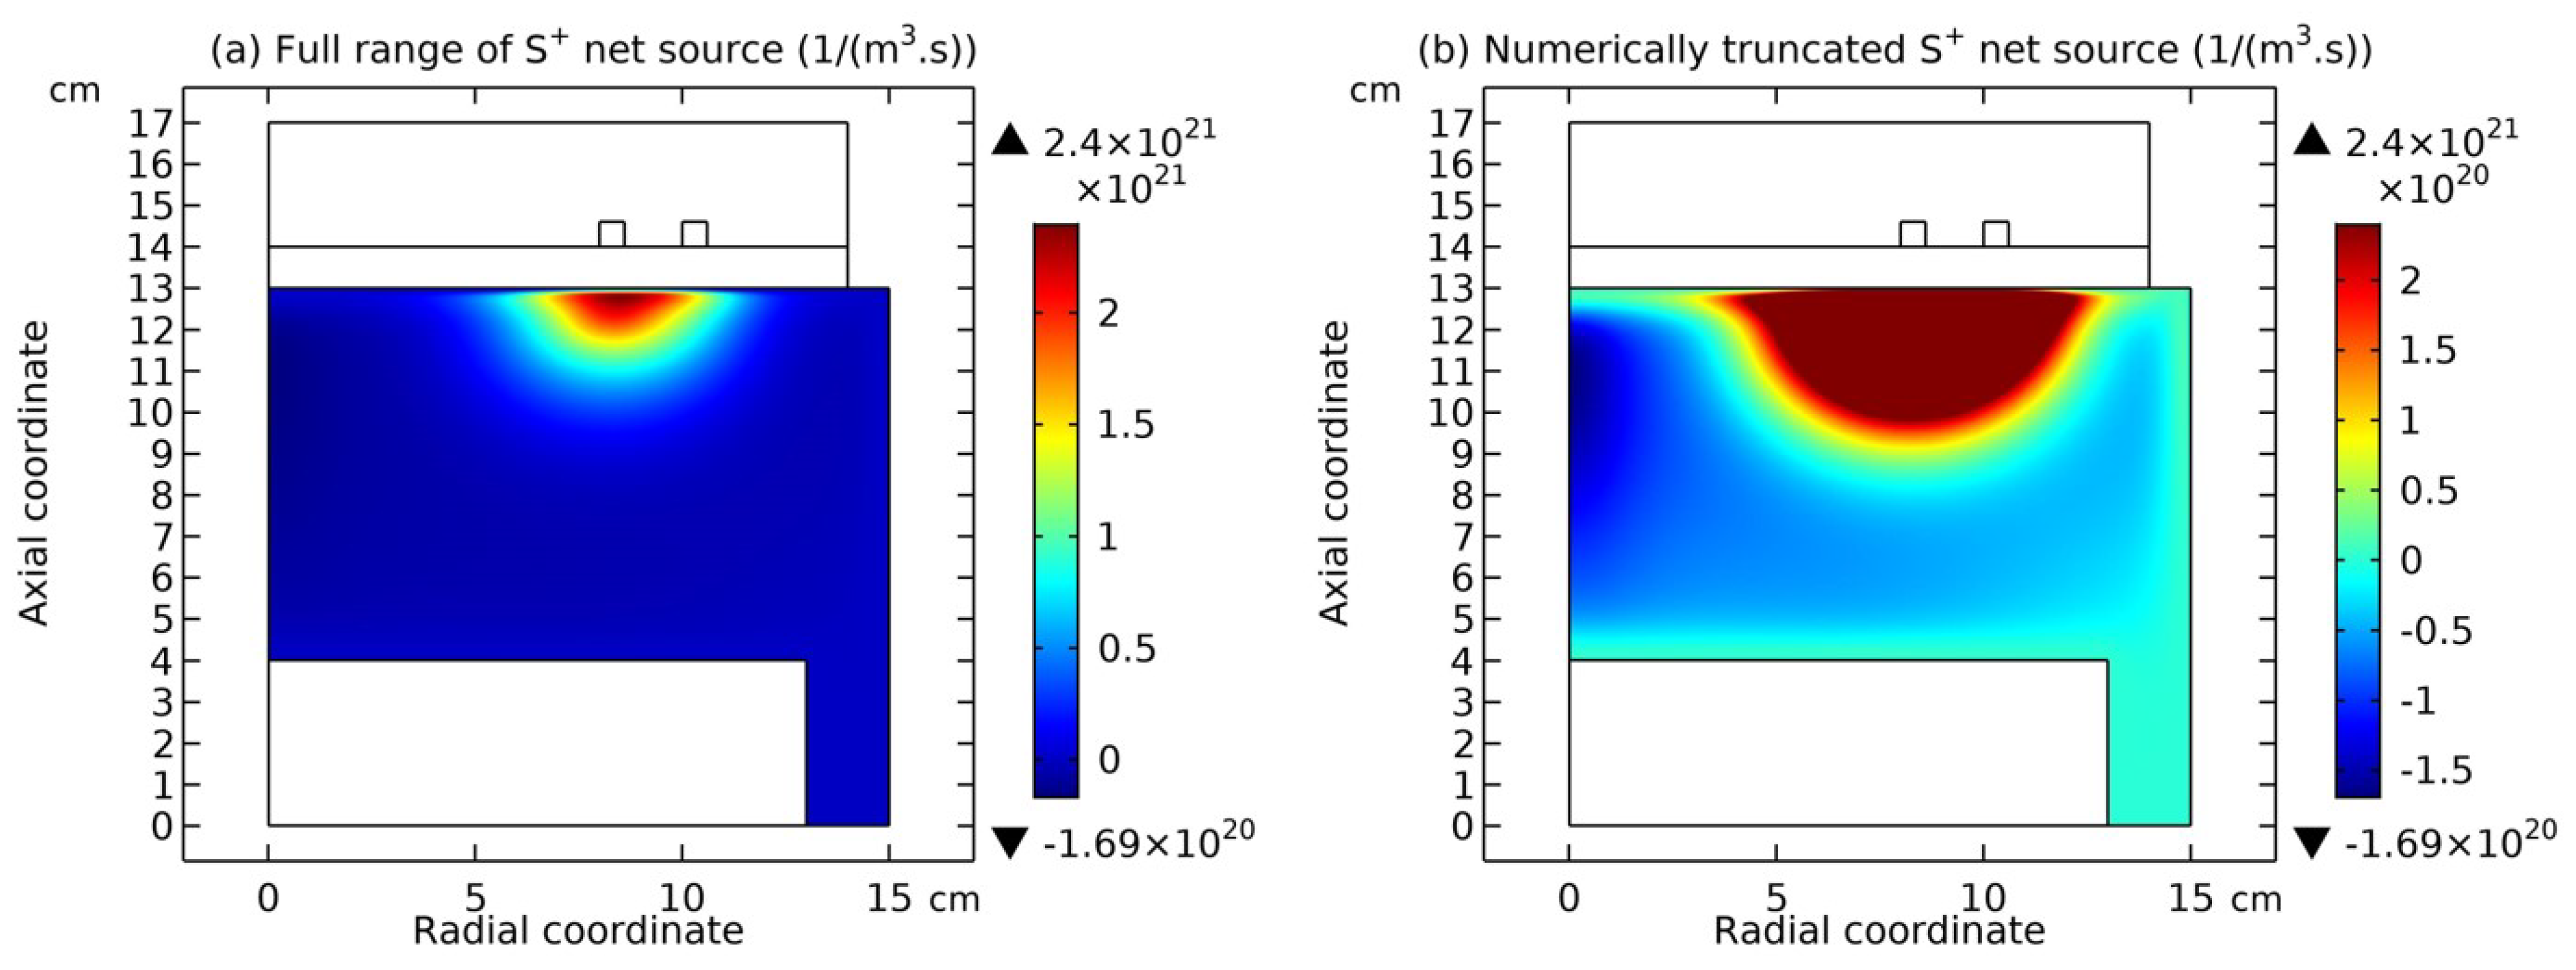
In this section, it is shown that the minor cations re-self-coagulate after the mass point expelling effect, for instance the F + cation in Figure 9. The position of re-self-coagulation is selected at the discharge axis where it is easier for species assembling (geometric effect), hence forming negative source as shown in Figure 10. In addition, the drift of ambi-polar potential is not reached in this region (refer to Figure 17), providing free diffusion condition. It is noted that the original F + coagulation under the coil is not influenced, where the ambi-polar self-coagulation holds. One more minor cation, S + , re-self-coagulates in the Figure 11 and Figure 12. The difference is that it experiences two attempts for finishing the re-self-coagulation. The first attempt in Figure 11 is failed for the forming negative source location is far away from the positive source at the coil. The negative source arises from the positive source normal transport. WAS their communication channel cut, the self-coagulation halts. The finally formed negative source of S + is presented in Figure 13. One more distinction is that the S + re-self-coagulation is not that strong as the F + minor cation, again caused by the mass difference. Other minor cations (refer to Figure 20), e.g., SF + and SF 2 + , fails to re-self-coagulate also because of their relatively large masses. The minor cations re-self-coagulation has important astronomic significance, correlating the formation of celestial bodies. In Sec. (4.4), it is shown that the re-self-coagulation behavior of minor species shown herein, together with the decoupled dynamics of electrons in Sec. (4.2.2), belong to the spontaneous and monopolar self-coagulation type.

4. Discussion

Authors should discuss the results and how they can be interpreted from the perspective of previous studies and of the working hypotheses. The findings and their implications should be discussed in the broadest context possible. Future research directions may also be highlighted.

4.1. Self-Coagulation Theory

The steady state continuity equation of anions that consists of free diffusion flux and negative source term (represented by the recombinations) is expressed in Eq. (22).
D 2 n = n n + k r e c = n ν r e c .
Slightly reforming the Eq. (22) and meanwhile introducing a parameter, k , a quasi-Helmholtz equation is constructed in Eq. (23).
2 n n ν r e c . D = 2 n n k 2 = 0 , 2 n n k 2 = 0.
Herein, k 2 = ν r e c . D . For simplicity, in Eq. (24), all the subscripts of quantities are omitted.
2 n n k 2 = 0.
In Eq. (25), this quasi- Helmholtz equation is reformed by the method of separation of variables in the cylindrical coordinate system, at the assumption of azimuthal symmetry.
1 ρ ρ ρ n ρ + 2 n z 2 k 2 n = 0 , n ( ρ , z ) = R ( ρ ) Z ( z ) , Z ' ' + ν 2 Z = 0 , d 2 R d ρ 2 + 1 ρ d R d ρ k 2 + ν 2 R = 0.
Herein, ν 2 represents the eigenvalues. By means of utilizing the homogeneous boundary conditions of the axial and ordinary differential equation, Z ' ' + ν 2 Z = 0 , the eigenvalues of ν 2 and the eigen functions, Z m ( z ) , are acquired in Eq. (26).
ν m 2 = m 2 π 2 / l 2 , Z m = sin ( m π z / l ) , Z = m = 0 c m Z m = m = 0 c m sin ( m π z / l ) .
As noticed, the radial and ordinary differential equation, d 2 R d ρ 2 + 1 ρ d R d ρ k 2 + ν m 2 R = 0 , is one zero-order imaginary Bessel equation, because of the property of negative source. Considering that the density value is limit at the axial center, the imaginary Bessel function, not the Hankel function, is adopted. Then, we get the expression of R ( ρ ) as follow in Eq. (27).
R ( ρ ) = d m I 0 ( k 2 + ν m 2 ρ ) = d m I 0 ( k 2 + m 2 π 2 / l 2 ρ ) .
Finally, we obtain the expression of n ( ρ , z ) in a product of R ( ρ ) and Z m ( z ) in Eq. (28).
n ( ρ , z ) = R ( ρ ) Z m ( z ) = m = 0 c m sin ( m π z / l ) · d m I 0 ( k 2 + ν m 2 ρ ) = m = 0 a m sin ( m π z / l ) · I 0 ( k 2 + m 2 π 2 / l 2 ρ ) .
Next, some special mathematic skills, i.e., the limit idea, are used in Eq. (29) and a delta distribution that is independent on the spatial coordinates is obtained, which interprets the self-coagulation idea.
n ( ρ , z ) = R ( ρ ) Z m ( z ) = m = 0 a m sin ( m π z / l ) · I 0 ( k 2 + m 2 π 2 / l 2 ρ ) = lim m a m sin ( m π z / l ) · = lim m a m sin ( m π z / l ) · lim z 0 1 z = lim z 0 lim m a m sin ( m π z / l ) · 1 z = lim z 0 lim m a m · sin ( m π z / l ) z π / l · π l = lim ζ 0 lim m a m ' · 1 π sin ( m ζ ) ζ = lim ζ 0 a ' lim m 1 π sin ( m ζ ) ζ = a ' lim ζ 0 δ ( ζ ) .
In the above deduction, the property of imaginary Bessel function, lim x I 0 ( x ) , is utilized, which represents the condition of lim m I 0 ( k 2 + m 2 π 2 / l 2 ρ ) . The condition when m is chosen as the final solution. Other m values give rise to either vibrating solutions ( m > 1 ), which are not suitable to describe the density positive property, n > 0 , or solution with the profile that is relatively smooth, i.e., m = 1 , not in accord to the simulated localized profile. Besides, it is seen that only the limit result, i.e., the infinite given by lim m I 0 ( k 2 + m 2 π 2 / l 2 ρ ) , is important, not the process, since when m , lim m sin ( m π z / l ) that represents the infinite coefficient of lim m I 0 ( k 2 + m 2 π 2 / l 2 ρ ) is uncertain. So, an invented limit lim z 0 1 z , although holding different evolving mathematic behavior with the imaginary Bessel, is used to replace the infinite given by the imaginary Bessel limit. In addition, the limit, lim z 0 , is moved in front of another limit, lim m , because at m , the value of z in the expression of sin ( m π z / l ) has no meaning, except at the point, z = 0 .

4.2. Advective Ambi-Polar Self-Coagulation

4.2.1. Comet Structrure for Advective Type

(a). Bohm’s criterion of sheath
In Eq. (30), the energy conservation equation of ions in an assumption of neglecting elastic collisions is given. Herein, M is the mass of ions and Φ ( x ) is the potential of sheath. u s is the velocity of ions at the beginning of considered region, i.e., x = 0 , which is taken to be the interface between the neutral plasma and sheath.
1 2 M u 2 ( x ) = 1 2 M u s 2 e Φ ( x ) .
Utilizing another assumption that neglects the inelastic collision in the sheath (i.e., without the ionization source), the continuity equation of ions is evolved into the Eq. (31).
n i ( x ) u ( x ) = n i s u s .
Herein, n i ( x ) is the ions density of arbitrary position and n i s is the constant density at x = 0 , respectively. Correlating the Eqs. (30, 31) and eliminating the arbitrary velocity of ions, u ( x ) , an expression is achieved for the ions density in Eq. (32).
n i x = n i s 1 2 e Φ M u s 2 1 / 2 .
In Eq. (33), the Boltzmann’s relation of electrons density is presented. Herein, n e ( x ) is the arbitrary electrons density and n e s is the constant density at x = 0 , respectively. T e is the electrons temperature.
n e ( x ) = n e s e Φ ( x ) / T e .
In Eq. (34), the relation between n i s and n e s is given. As seen, they are equal since the sheath is always connected to electrically neutral plasma. In Eq. (35), the Poisson’s equation is shown. And in Eq. (36), the ions density and electrons density of the Poission’s equation are replaced by the Eqs. (32, 33), respectively. Herein, a new parameter, ξ s , is introduced and the term, e ξ s , represents the kinetic energy of ions at x = 0 , as illustrated in Eq. (37).
n e s = n i s = n s ,
d 2 Φ d x 2 = e ε 0 n e n i ,
d 2 Φ d x 2 = e n s ε 0 exp Φ T e 1 Φ ξ s 1 / 2 ,
e ξ s = 1 2 M u s 2 .
In Eq. (38) the reformed Poisson’s equation is to be integrated (herein certain mathematic skill of integrating is used) and in Eq. (39) the integrated result is calculated, by utilizing the limit conditions that are expressed in Eq. (40). In Eq. (39), the Taylor’s expansion is applied onto the exponential function and square root function and then an inequality is obtained in Eq. (41) at the first order approxmations of these Taylor’s expansions, given by the fact that the term of left side of Eq. (39), 1 2 d Φ d x 2 , should be larger than zero. This inequality is reformed in Eq. (42) and the Bohm’s creterion of electropositive plasama is obtained.
0 Φ d Φ d x d d x d Φ d x d x = e n s ε 0 0 Φ d Φ d x exp Φ T e 1 Φ ξ s 1 / 2 d x ,
1 2 d Φ d x 2 = e n s ε 0 T e exp Φ T e T e + 2 ξ s 1 Φ ξ s 1 / 2 2 ξ s ,
Φ 0 = 0 , d Φ d x | x = 0 = 0 ,
1 2 Φ 2 T e 1 4 Φ 2 ξ s 0 ,
u s u B = e T e M 1 / 2 .
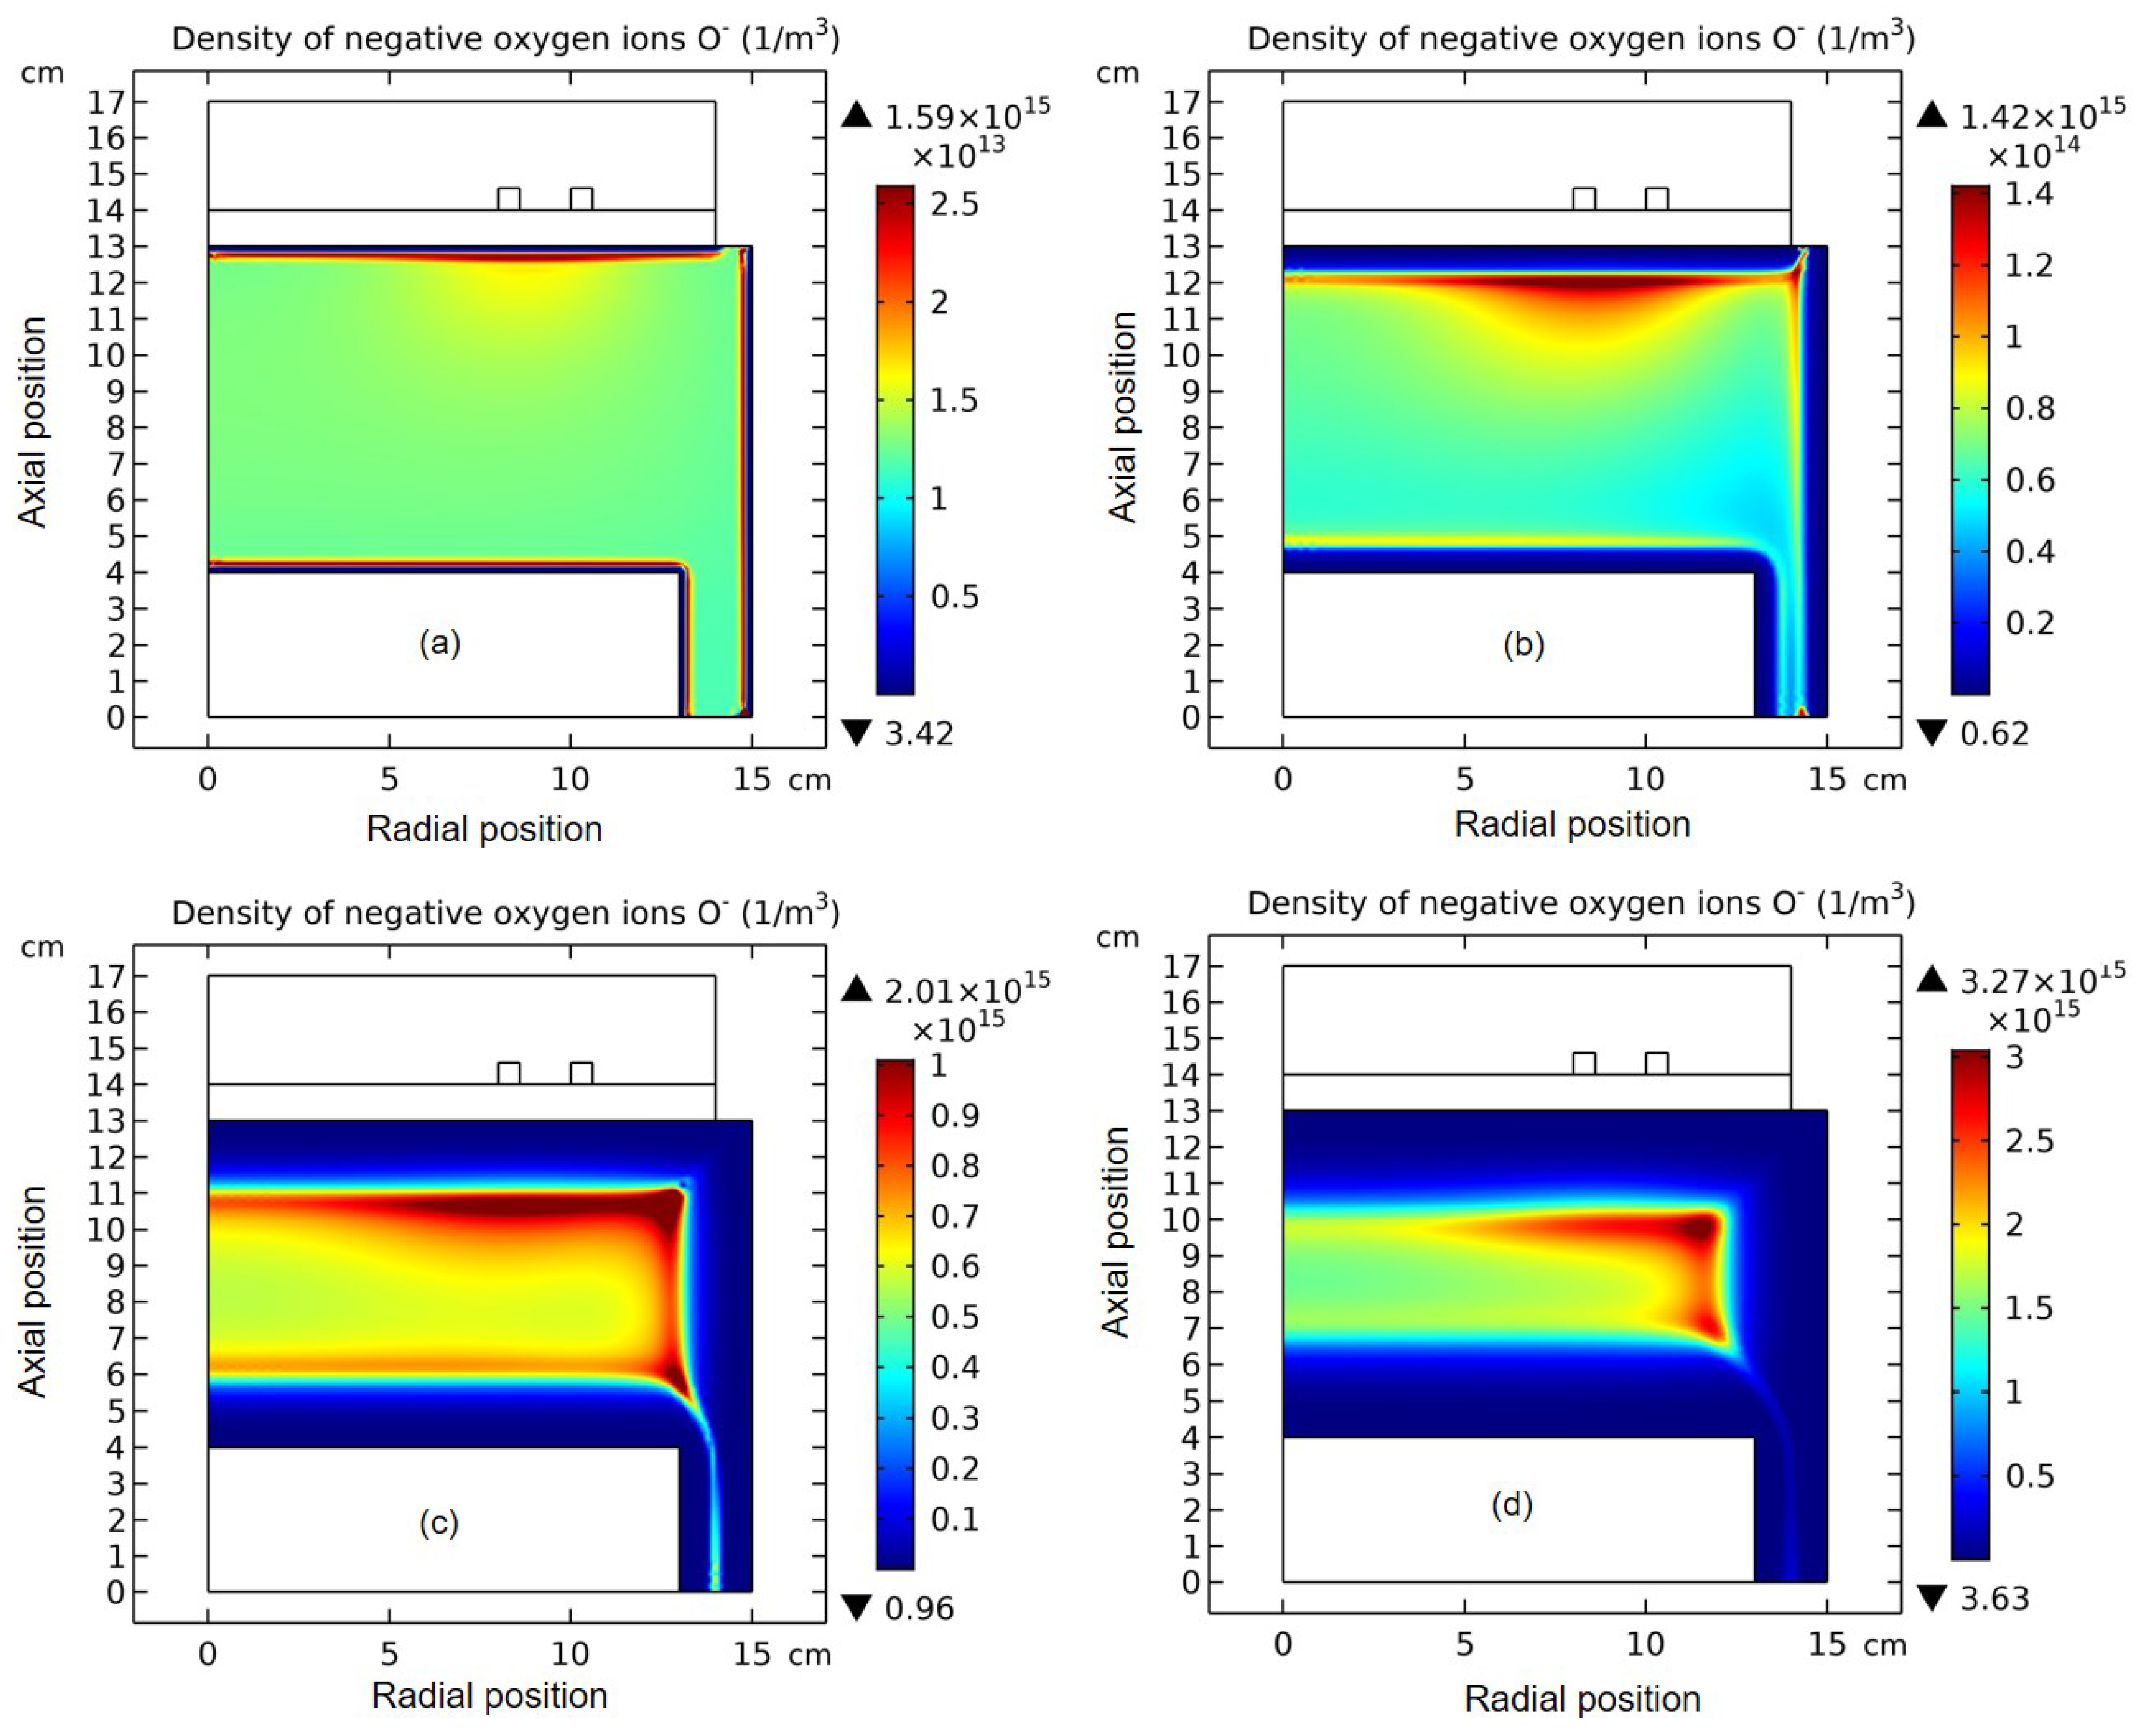
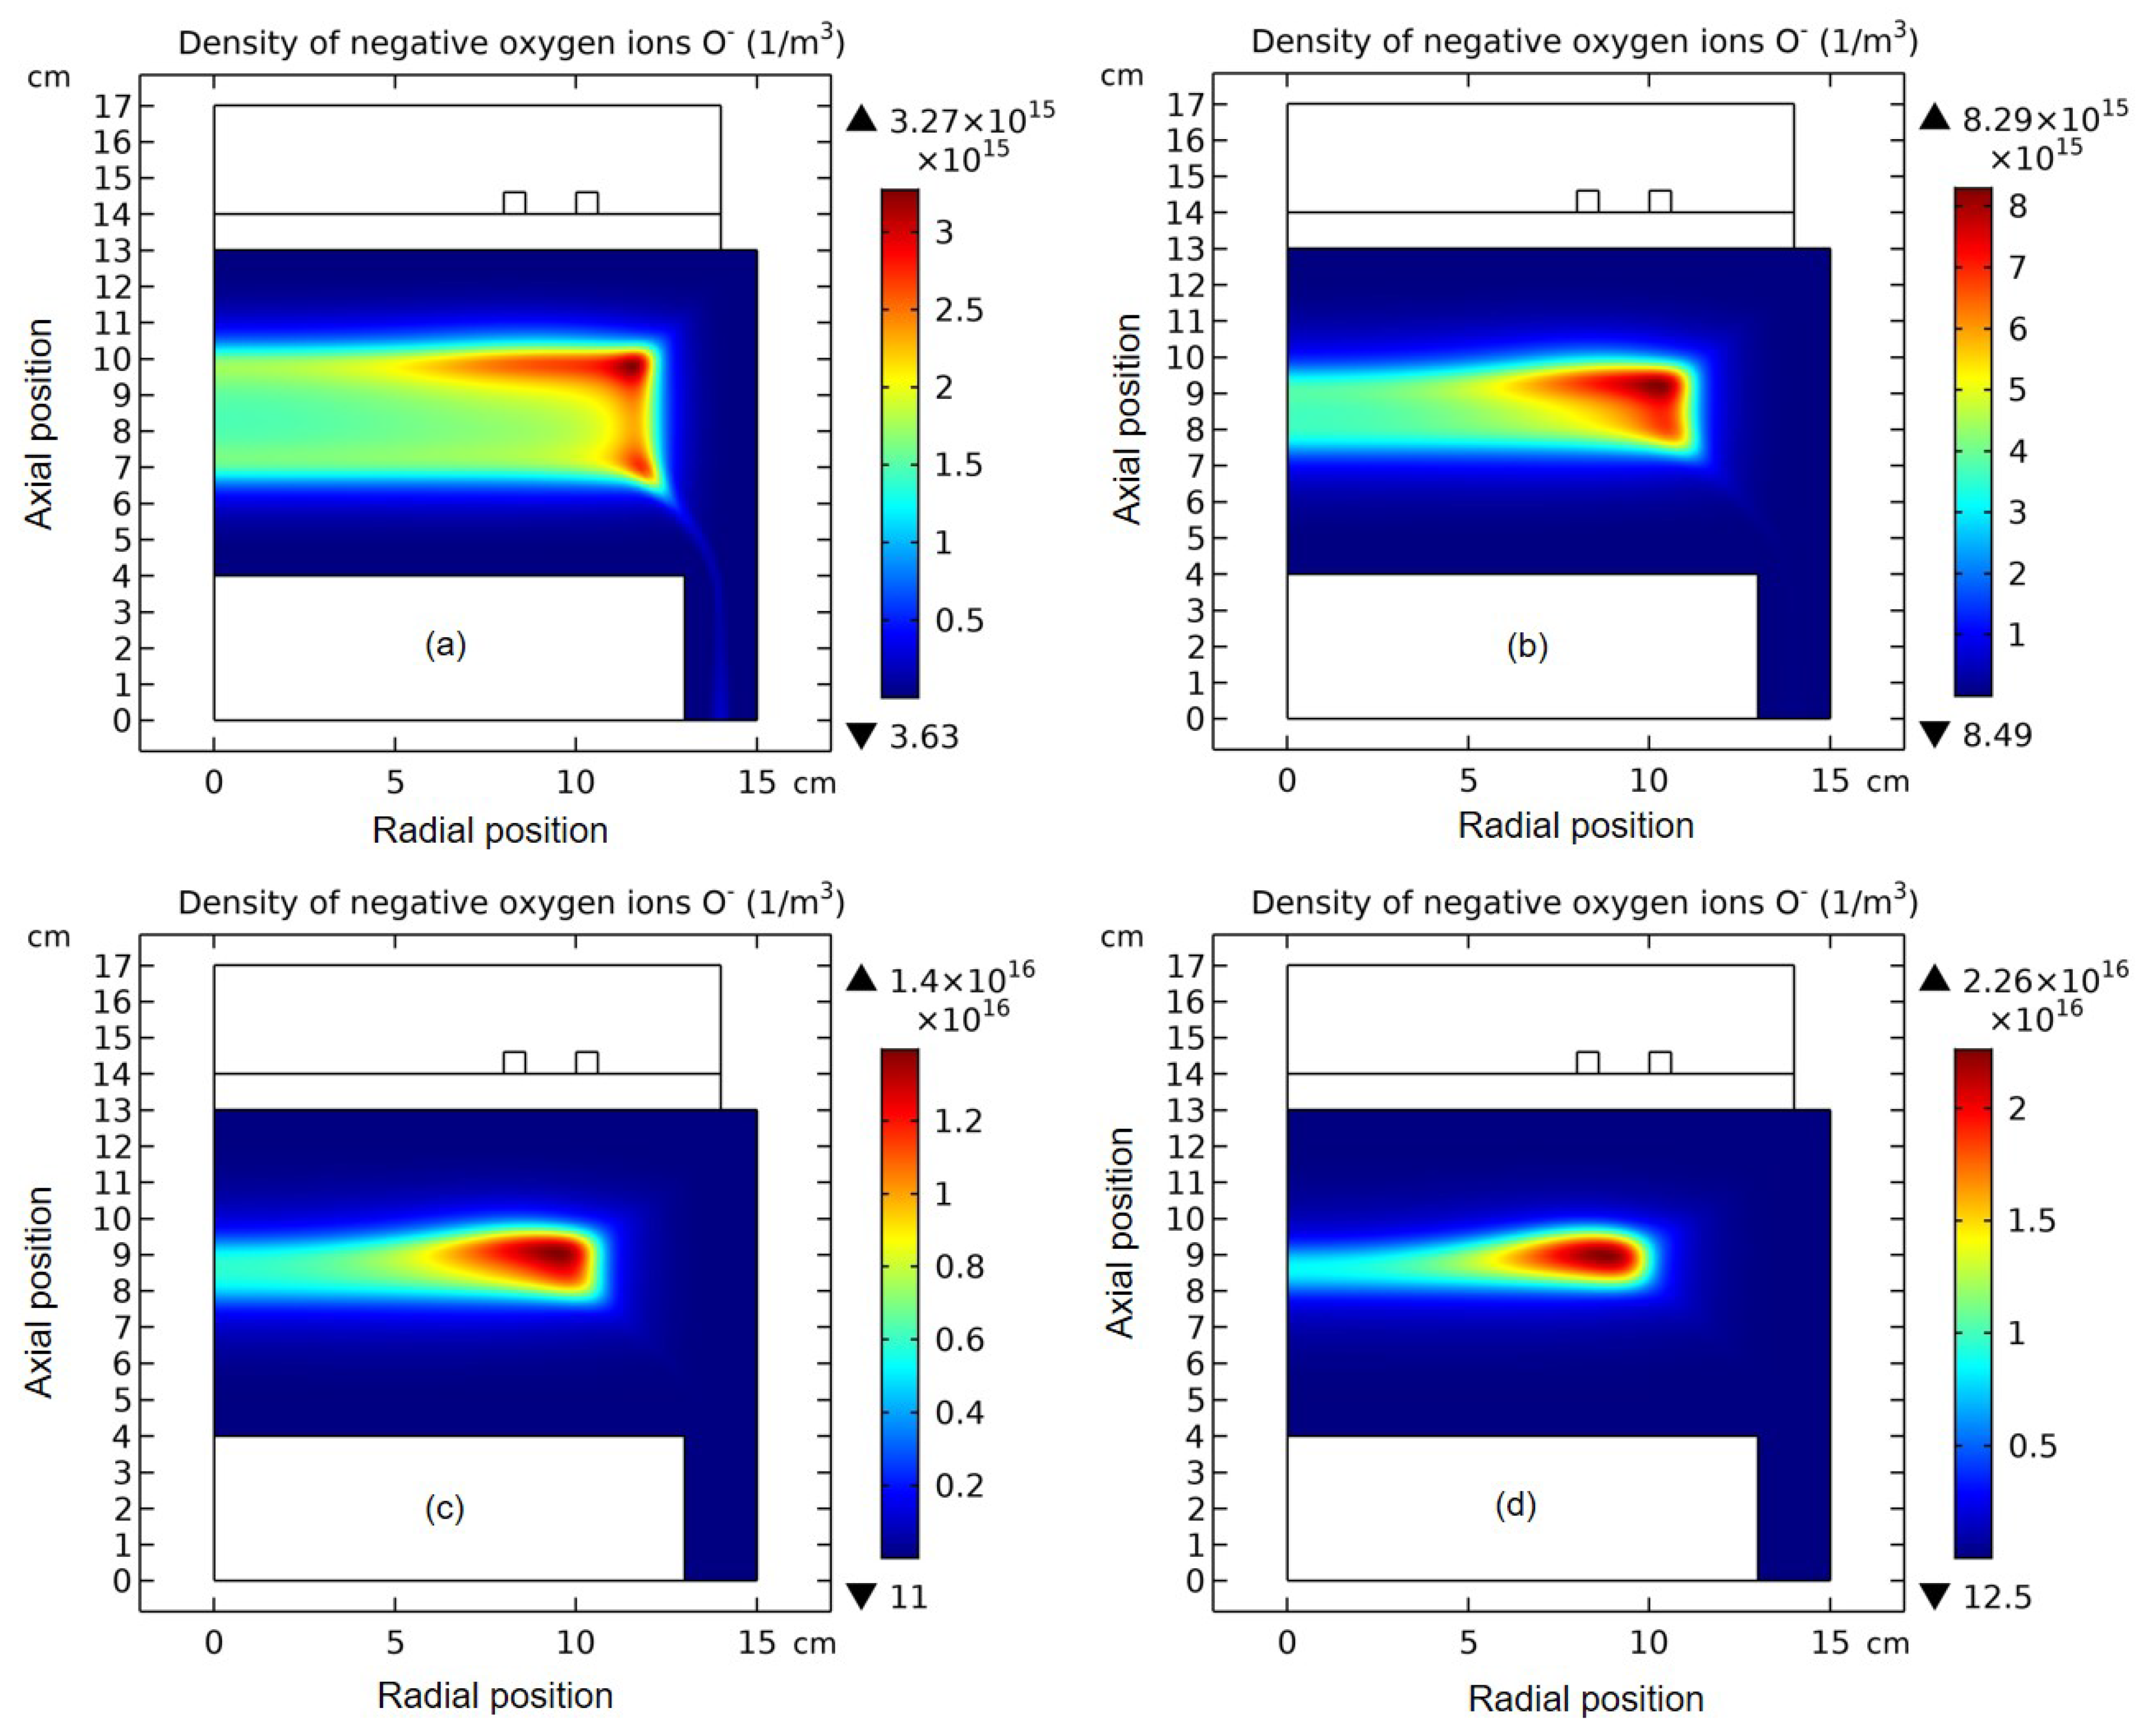
(b) Early stage dynamics of simulated O- species
In Figure 14 and Figure 15, the temporal evolution of O- density profile in the two early stages of simulation, i.e., before the self-coagulation happens, are shown. It is seen that upon increasing the simulating time, the anions are kept to be pushed inward by the ambi-polar potential due to the inefficient creation source of them (i.e., low electronegativity). In the above section, the Bohm’s criterion of cations is given, and it is meant that the ambi-polar potential pulls the cations outward and at the interface of plasma and sheath the cations velocity exceeds the Bohm’s threshold, then forming electropositive and red sheath. Similarly, the anions can exceed the Bohm’s velocity threshold as well at the top of potential after the inward pushing process, then forming electronegative and blue sheath (see Figure 3(b) for reference). Due to the appearance of blue sheath, the comet structure is defined as an advective type of self-coagulation since the anions have experienced the advection of ambi-polar potential before coagulated chemically. As seen next, this advective self-coagulation is also ambi-polar due to the requirement of electrical neutrality. Whether an electropositive or electronegative plasma is considered the neutrality is a basis condition, which embodies the collective interaction of plasma, i.e., shielding the non- neutral region. The ambi-polar attribute of self-coagulation is validated by a neutral core of comet structure in Figure 3(b).

4.2.2. Semi-Circle Structrure for Ambi-Polar Type
(a). Chemical coagulation versus physical coagulation
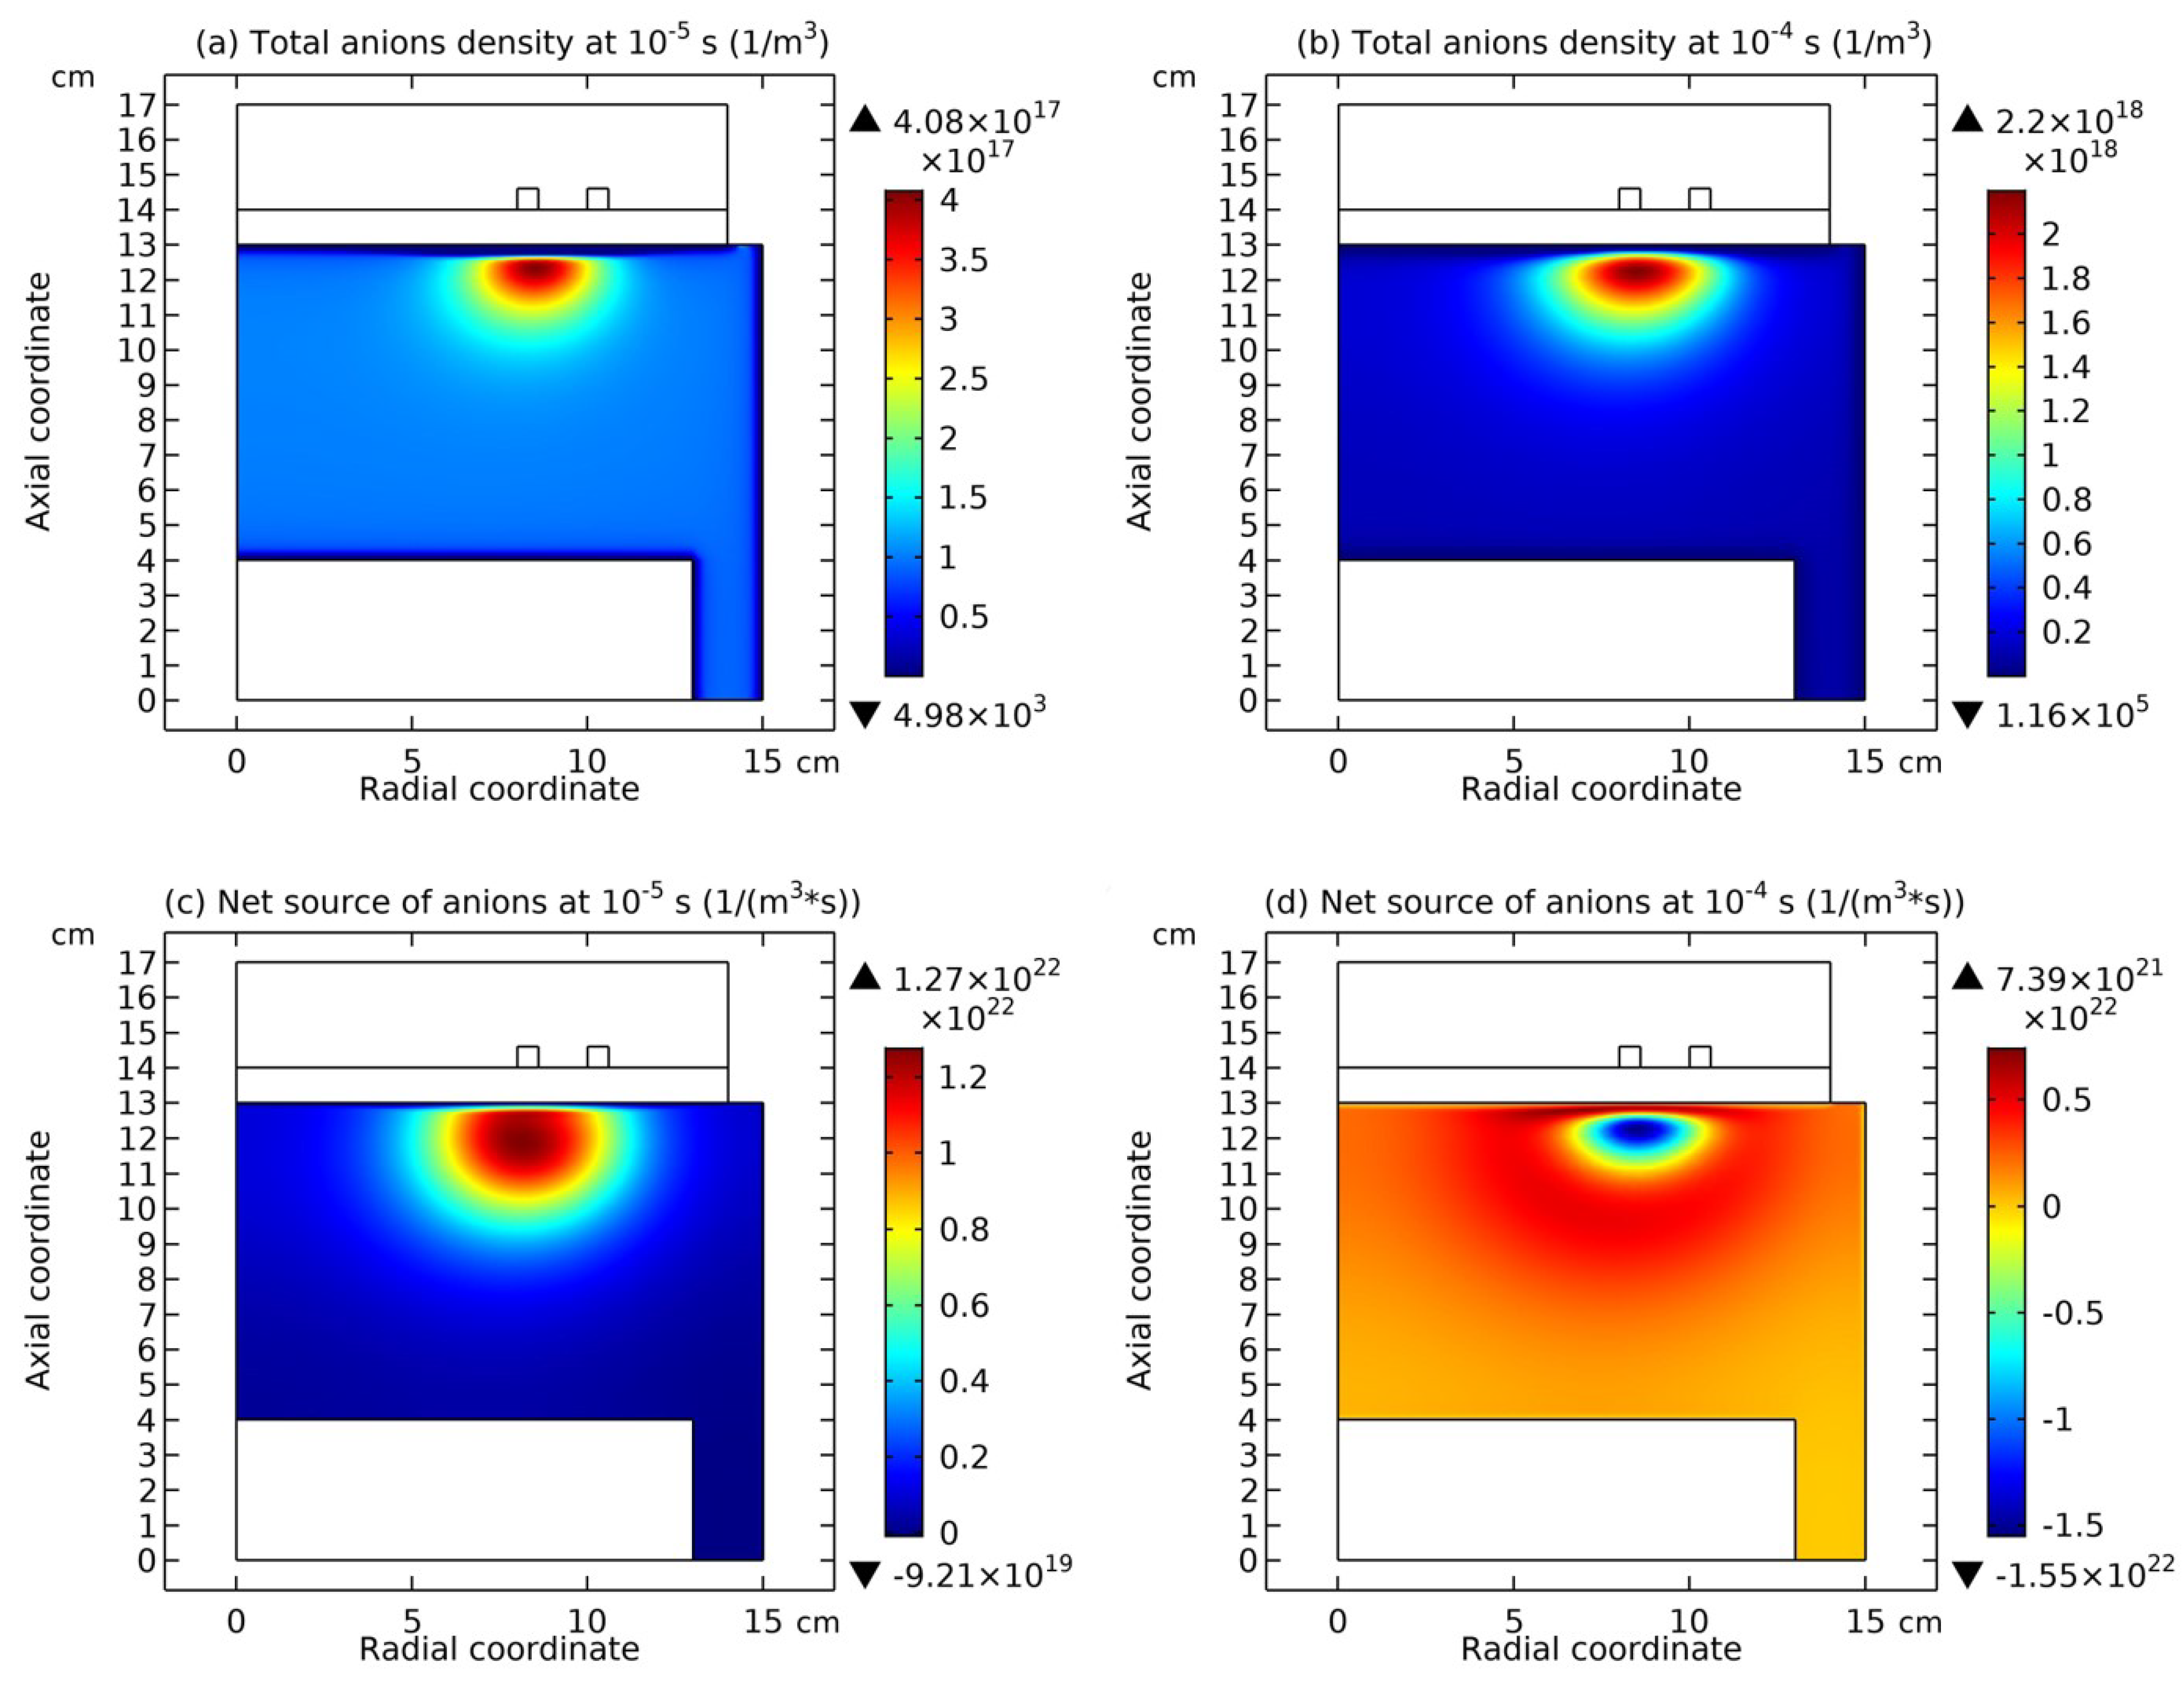
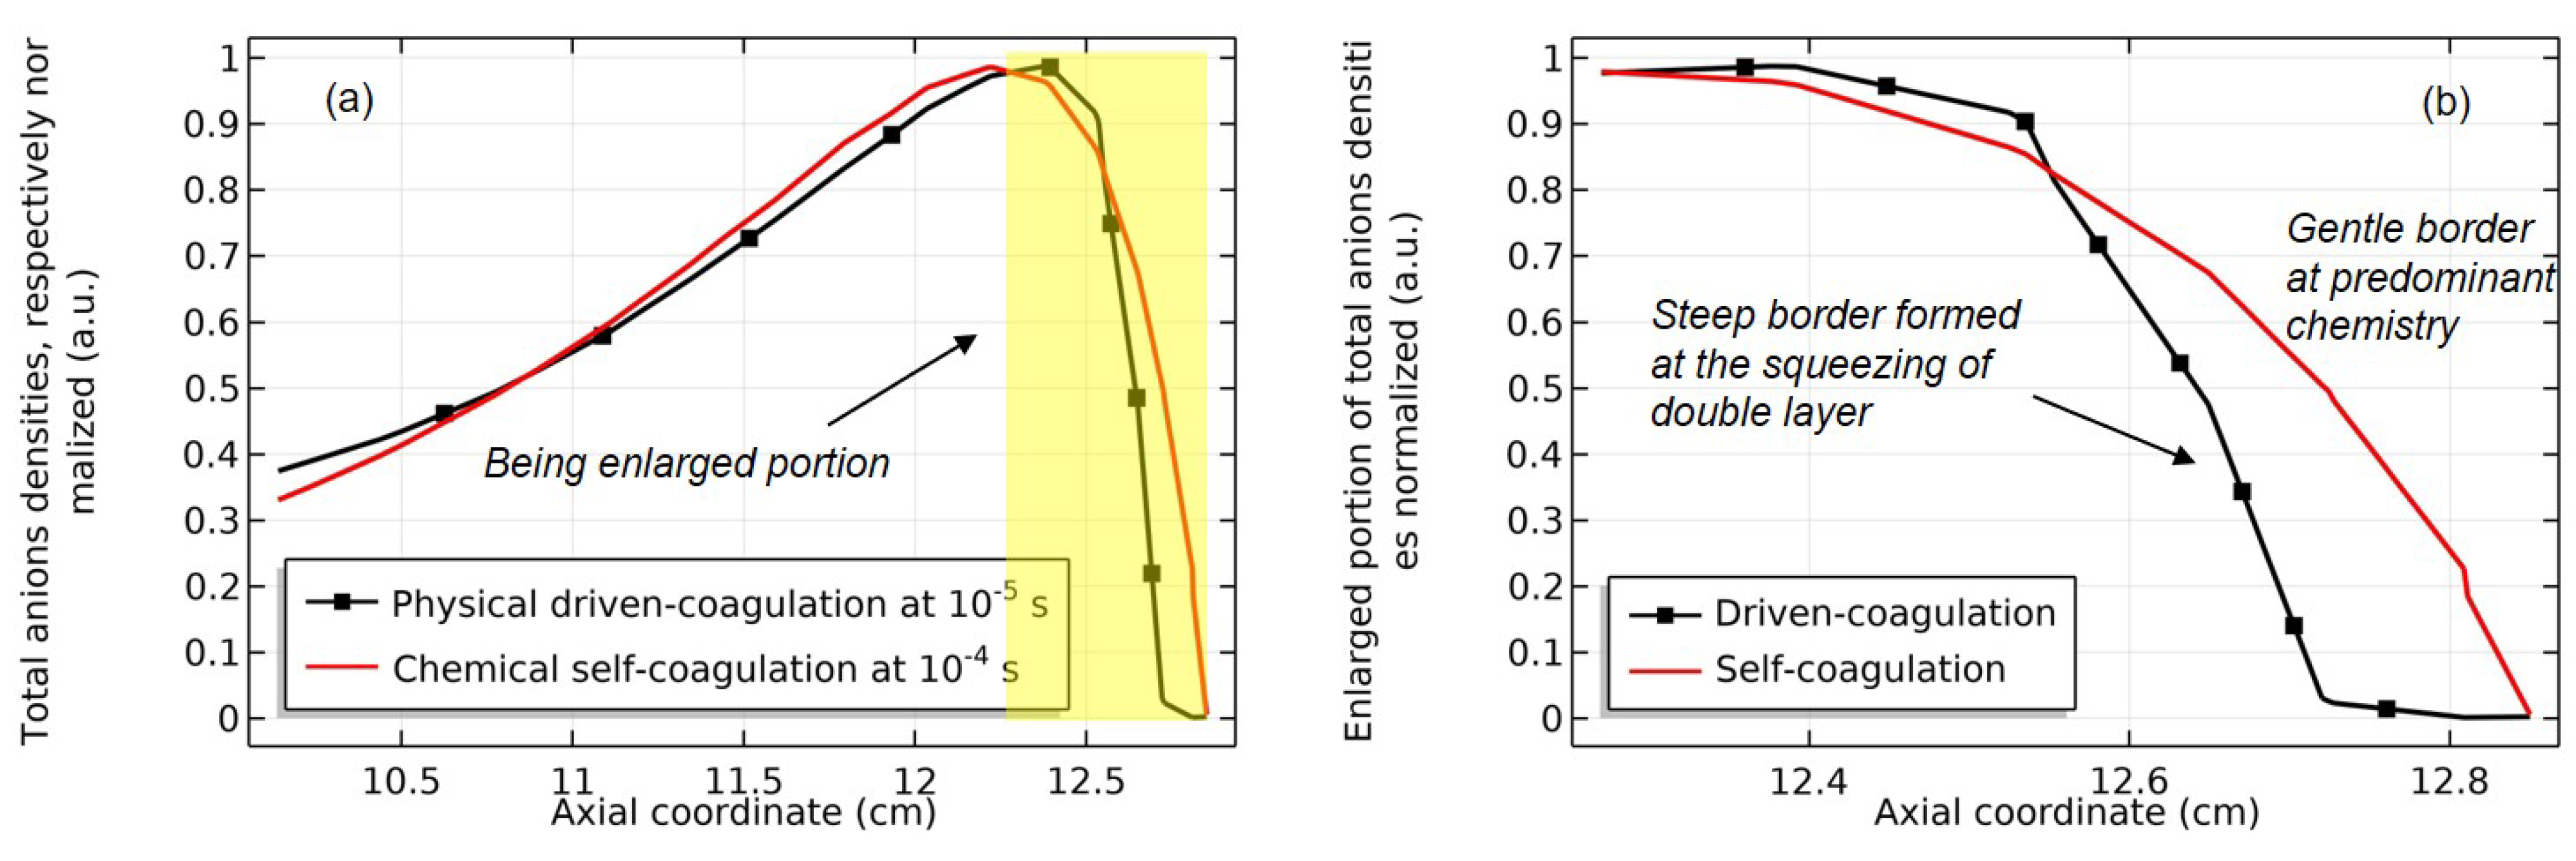
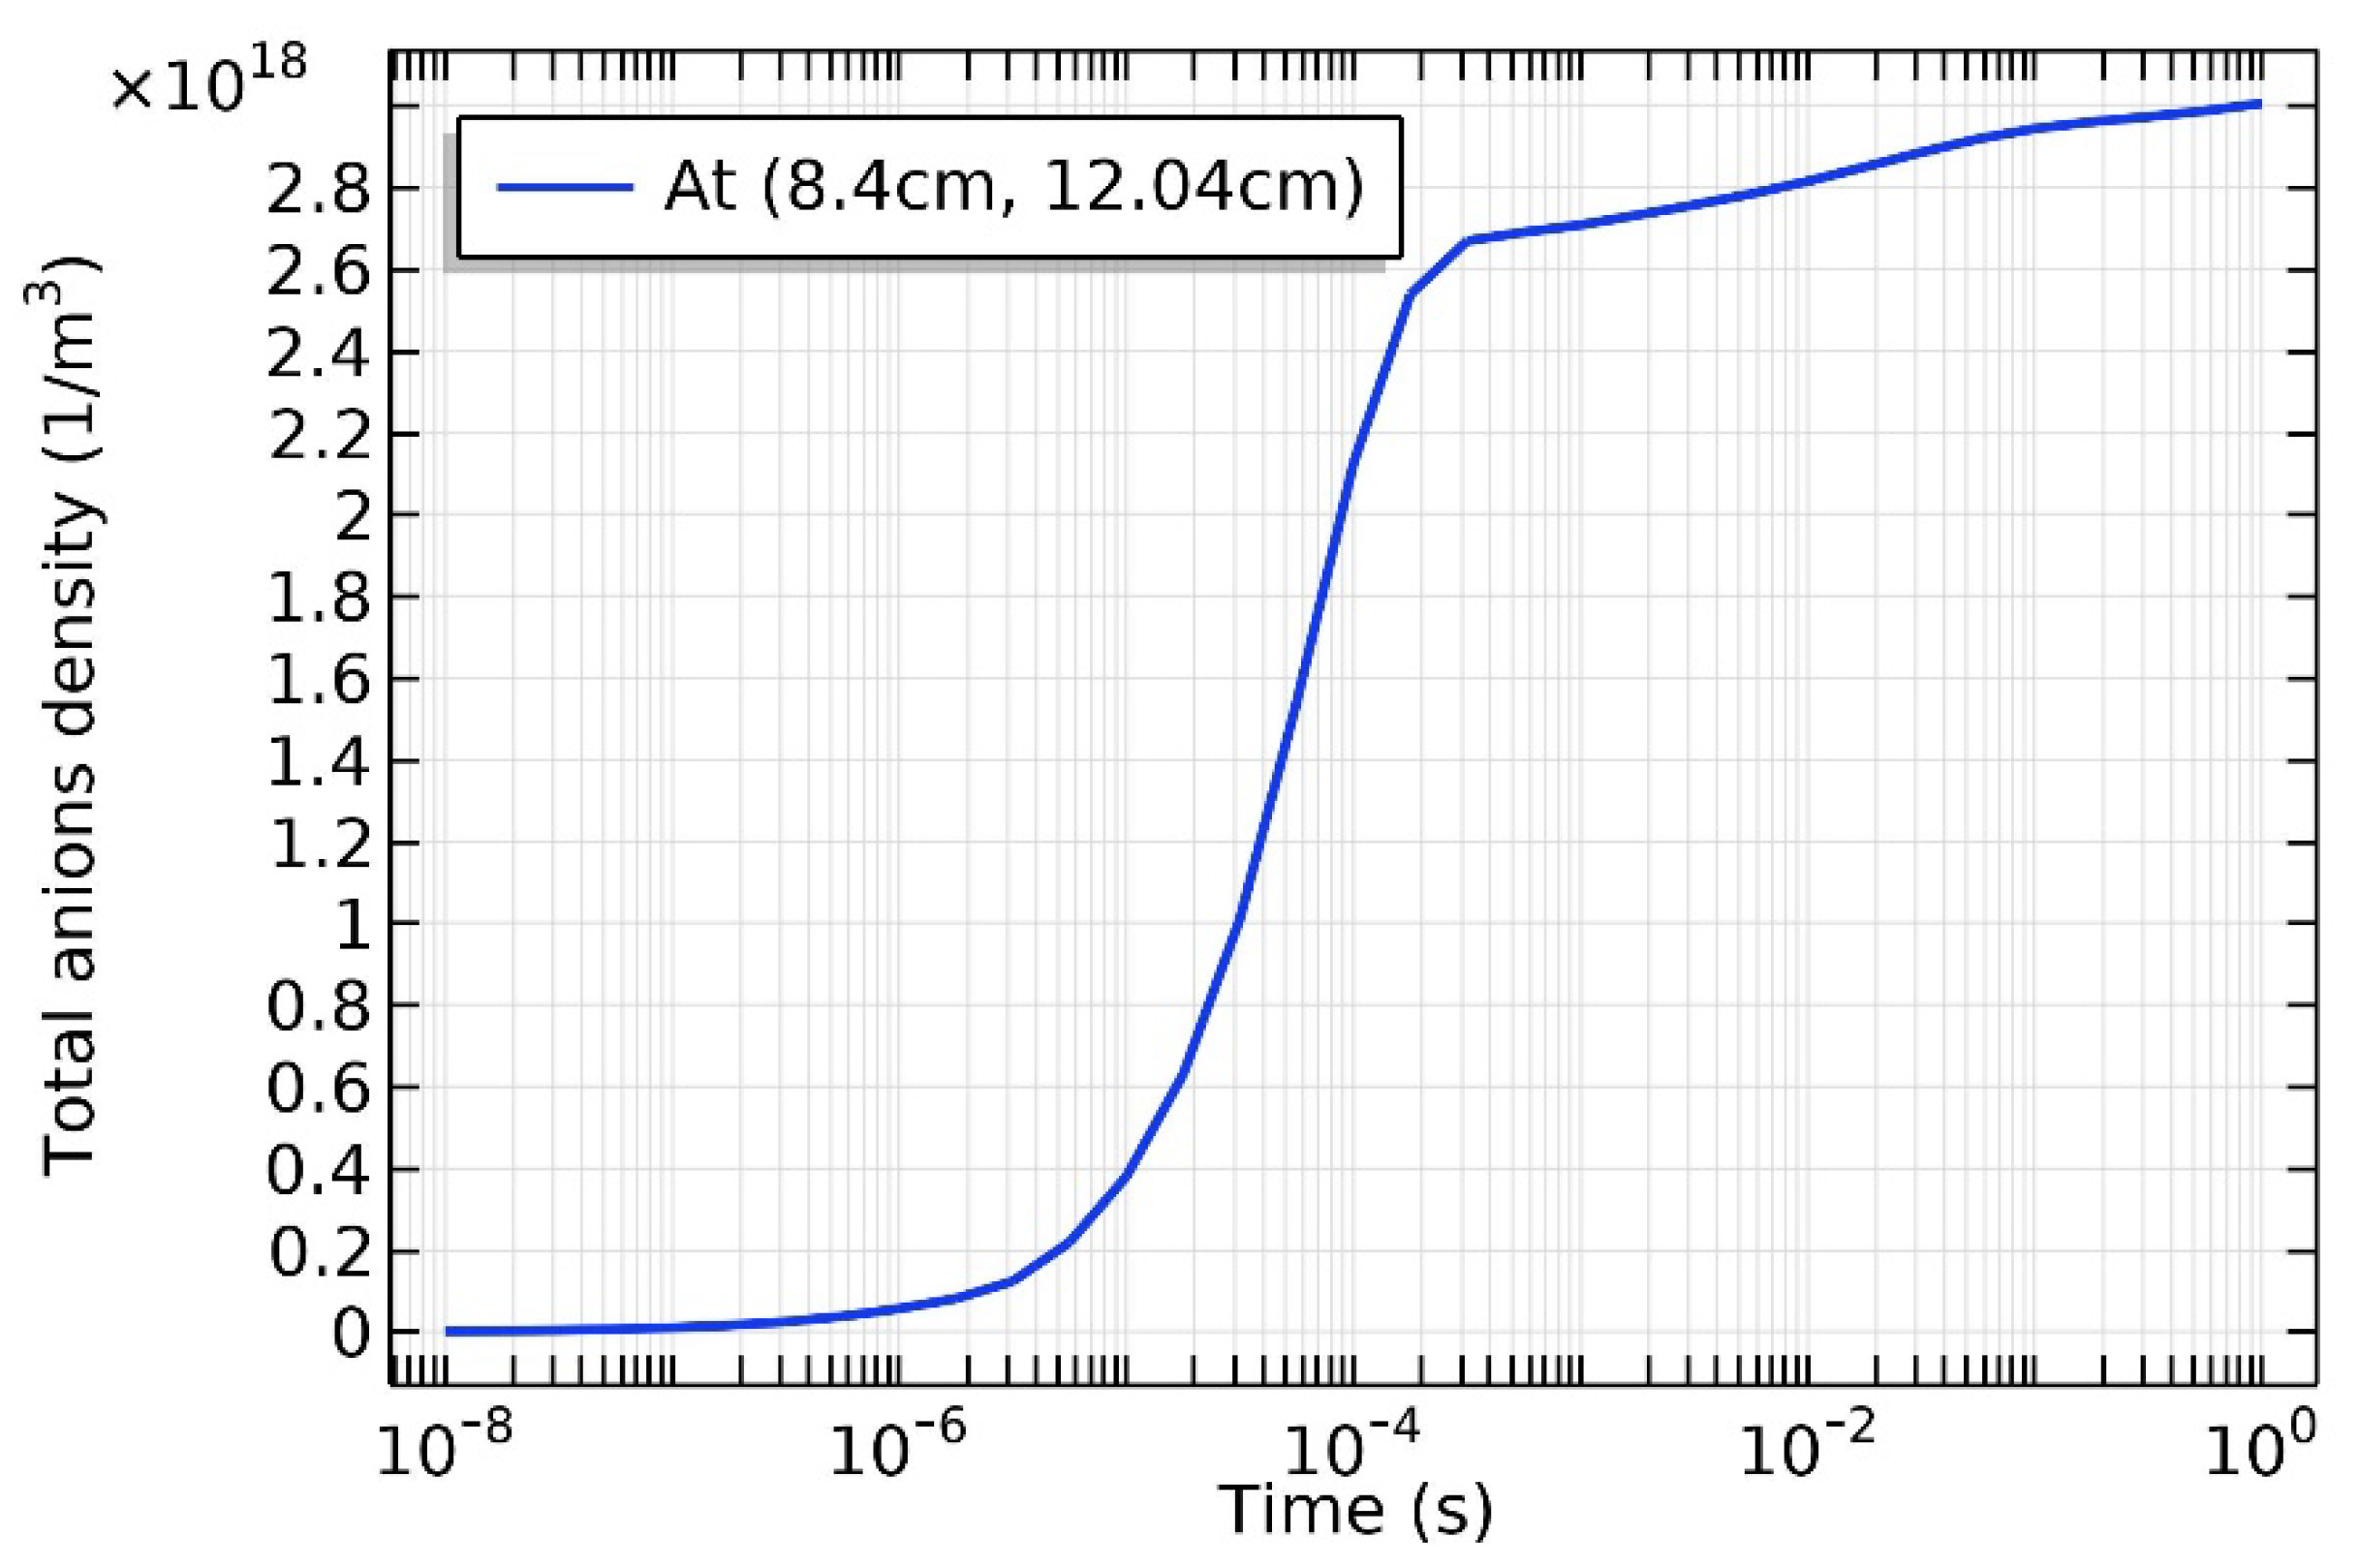
In Figure 16, the temporal evolution of anions density that is sampled under the coil (the coordinates of sampled position can be referred to the figure) is plotted. In the time range of 10 5 s 10 4 s , the anions density is seen to increase swiftly, which indicates the self-coagulation occurrence. In Figure 17, the anions densities and their respective net chemical source of the two times are shown and it is validated again that the self-coagulation is accompanied by negative source of anions in Figure 17(d). Before the self-coagulation, the chemical source is positive in Figure 17(c). In Figure 18, the curves of anions density close to the border under the coil are compared before and after the self-coagulation. It is seen that the curve is cliffy at 10 5 s , which is physically formed by the pushing role of ambi-polar diffusion potential and double layer[38]. The curve is then softened by the self-coagulation at 10 4 s , implying a chemistry process different to the physics process. This temporal behavior is hence summarized by a mode transition from the physical coagulation to chemical coagulation. Besides, the astro-structure found in the Ar/SF6 ICP simulation is a semi-circle shape, as seen in Figure 17(b).
Figure 16. Temporal variation of simulated total anions density sampled under the coil (refer to the previous two dimensional density profile of Figure 4(a)) in Ar/SF6 ICP plasma, by means of fluid model. The discharge conditions are the same as the Figure 4. The sampled position corresponds to the summed anions density peak and its coordinates are given in the figure.
Preprints 115954 g016
Figure 17. Simulated two-dimensional profiles of total anions density at two simulating times, (a)  10 5 s and (b)  10 4 s , and their net chemical source at the two times, (c)  10 5 s (before self-coagulation) and (d)  10 4 s (after self-coagulation). The discharge conditions are the same as the Figure 4.
Preprints 115954 g017
Figure 18. (a) Simulated and partial axial profiles of total anions density (near the coil) in Ar/SF6 ICP plasma at two simulating times, 10 5 s (before self-coagulation) and 10 4 s (after self-coagulation). In panel (b), the decreasing curves of total anions density border beneath the coil is enlarged to compare the curve characteristics, steep (corresponding to the physical coagulation) and gentle (corresponding to the chemical coagulation). The discharge conditions are the same as the Figure 4.
Preprints 115954 g018
(b). Ambi-polar diffusion versus ambi-polar self-coagulation
In Eqs. (43, 44), the balances of flux and density are shown. Herein, Γ e and Γ i are the fluxes of electrons and ions, respectively. They are both equal to Γ . n e and n i are the densities of electrons and ions, respectively. They are approximately equal to n .
Γ e = Γ i = Γ ,
n e n i = n .
In Eq. (45), the flux balance is rewritten at utilizing the drift and diffusion approximation of momentum equation. Herein, μ i and μ e are the mobilities of ions and electrons, respectively. D i and D e are the diffusion coefficients of ions and electrons, respectively. E represents the electrostatic field that is caused by the ambi-polar diffusion potentail.
μ i n E D i n = μ e n E D e n .
In Eq. (46), the electric field is expressed as a funciton of the transport coefficients and density gradient. This field is then substituted into the flux of ions in Eq. (47) and the flux is thereby reformed.
E = D i D e μ i + μ e n n ,
Γ = μ i D i D e μ i + μ e n D i n = μ i D e + μ e D i μ i + μ e n .
In Eq. (48), an ambi-polar diffusion coefficient, D a , is introduced based on the reformed flux. In Eq. (49) the approximation between the mobilities of electrons and ions is utilized and the ambi-polar coefficient is simplified. Then in Eq. (50), the normally used expression of ambi-polar diffusion coefficient is obtained at utilizing the Einstein’s relation.
D a = μ i D e + μ e D i μ i + μ e ,
μ e μ i D a D i + μ i μ e D e ,
D a D i 1 + T e T i .
It is seen that the ambi-polar diffusion potential is created in the electropositive plasma self-consistently because of the hige difference bwteen the masses of electrons and ions. Without this potential barrel, all electons escape to the chamber wall and the gaseous discharge is extinguished. That’s why the ambi-polar diffusion potential established is usually high, around ten Volts as seen in the Ar/O2 plasma of Figure 1(d) and in the early stage of simulated Ar/SF6 plasma of Figure 19(a) (see next). The ambi-polar self-coagulation discovered in electronegative plasma has the same meaning as the ambi-polar diffusion, i.e., to sustain the plasma’s neutrality. In particlular, the ambi-polar diffusion potential is used to sustain the neutrality of electrons and ions plasma and the ambi-polar self-coagulation is used to sustain the neutrality of anions and cations plasma. Since there is no obvious difference between the masses of anions and cations the ambi-polar self-coagulation potentail (if exised) is not needed for sustaining the neutrality, as the simulation has predicted. It is expected from the simulation the cations instantaneously follows the self-coagulation of anions through the electrically appealing role bwteen them.
(c). Decoupled dynamics of electrons
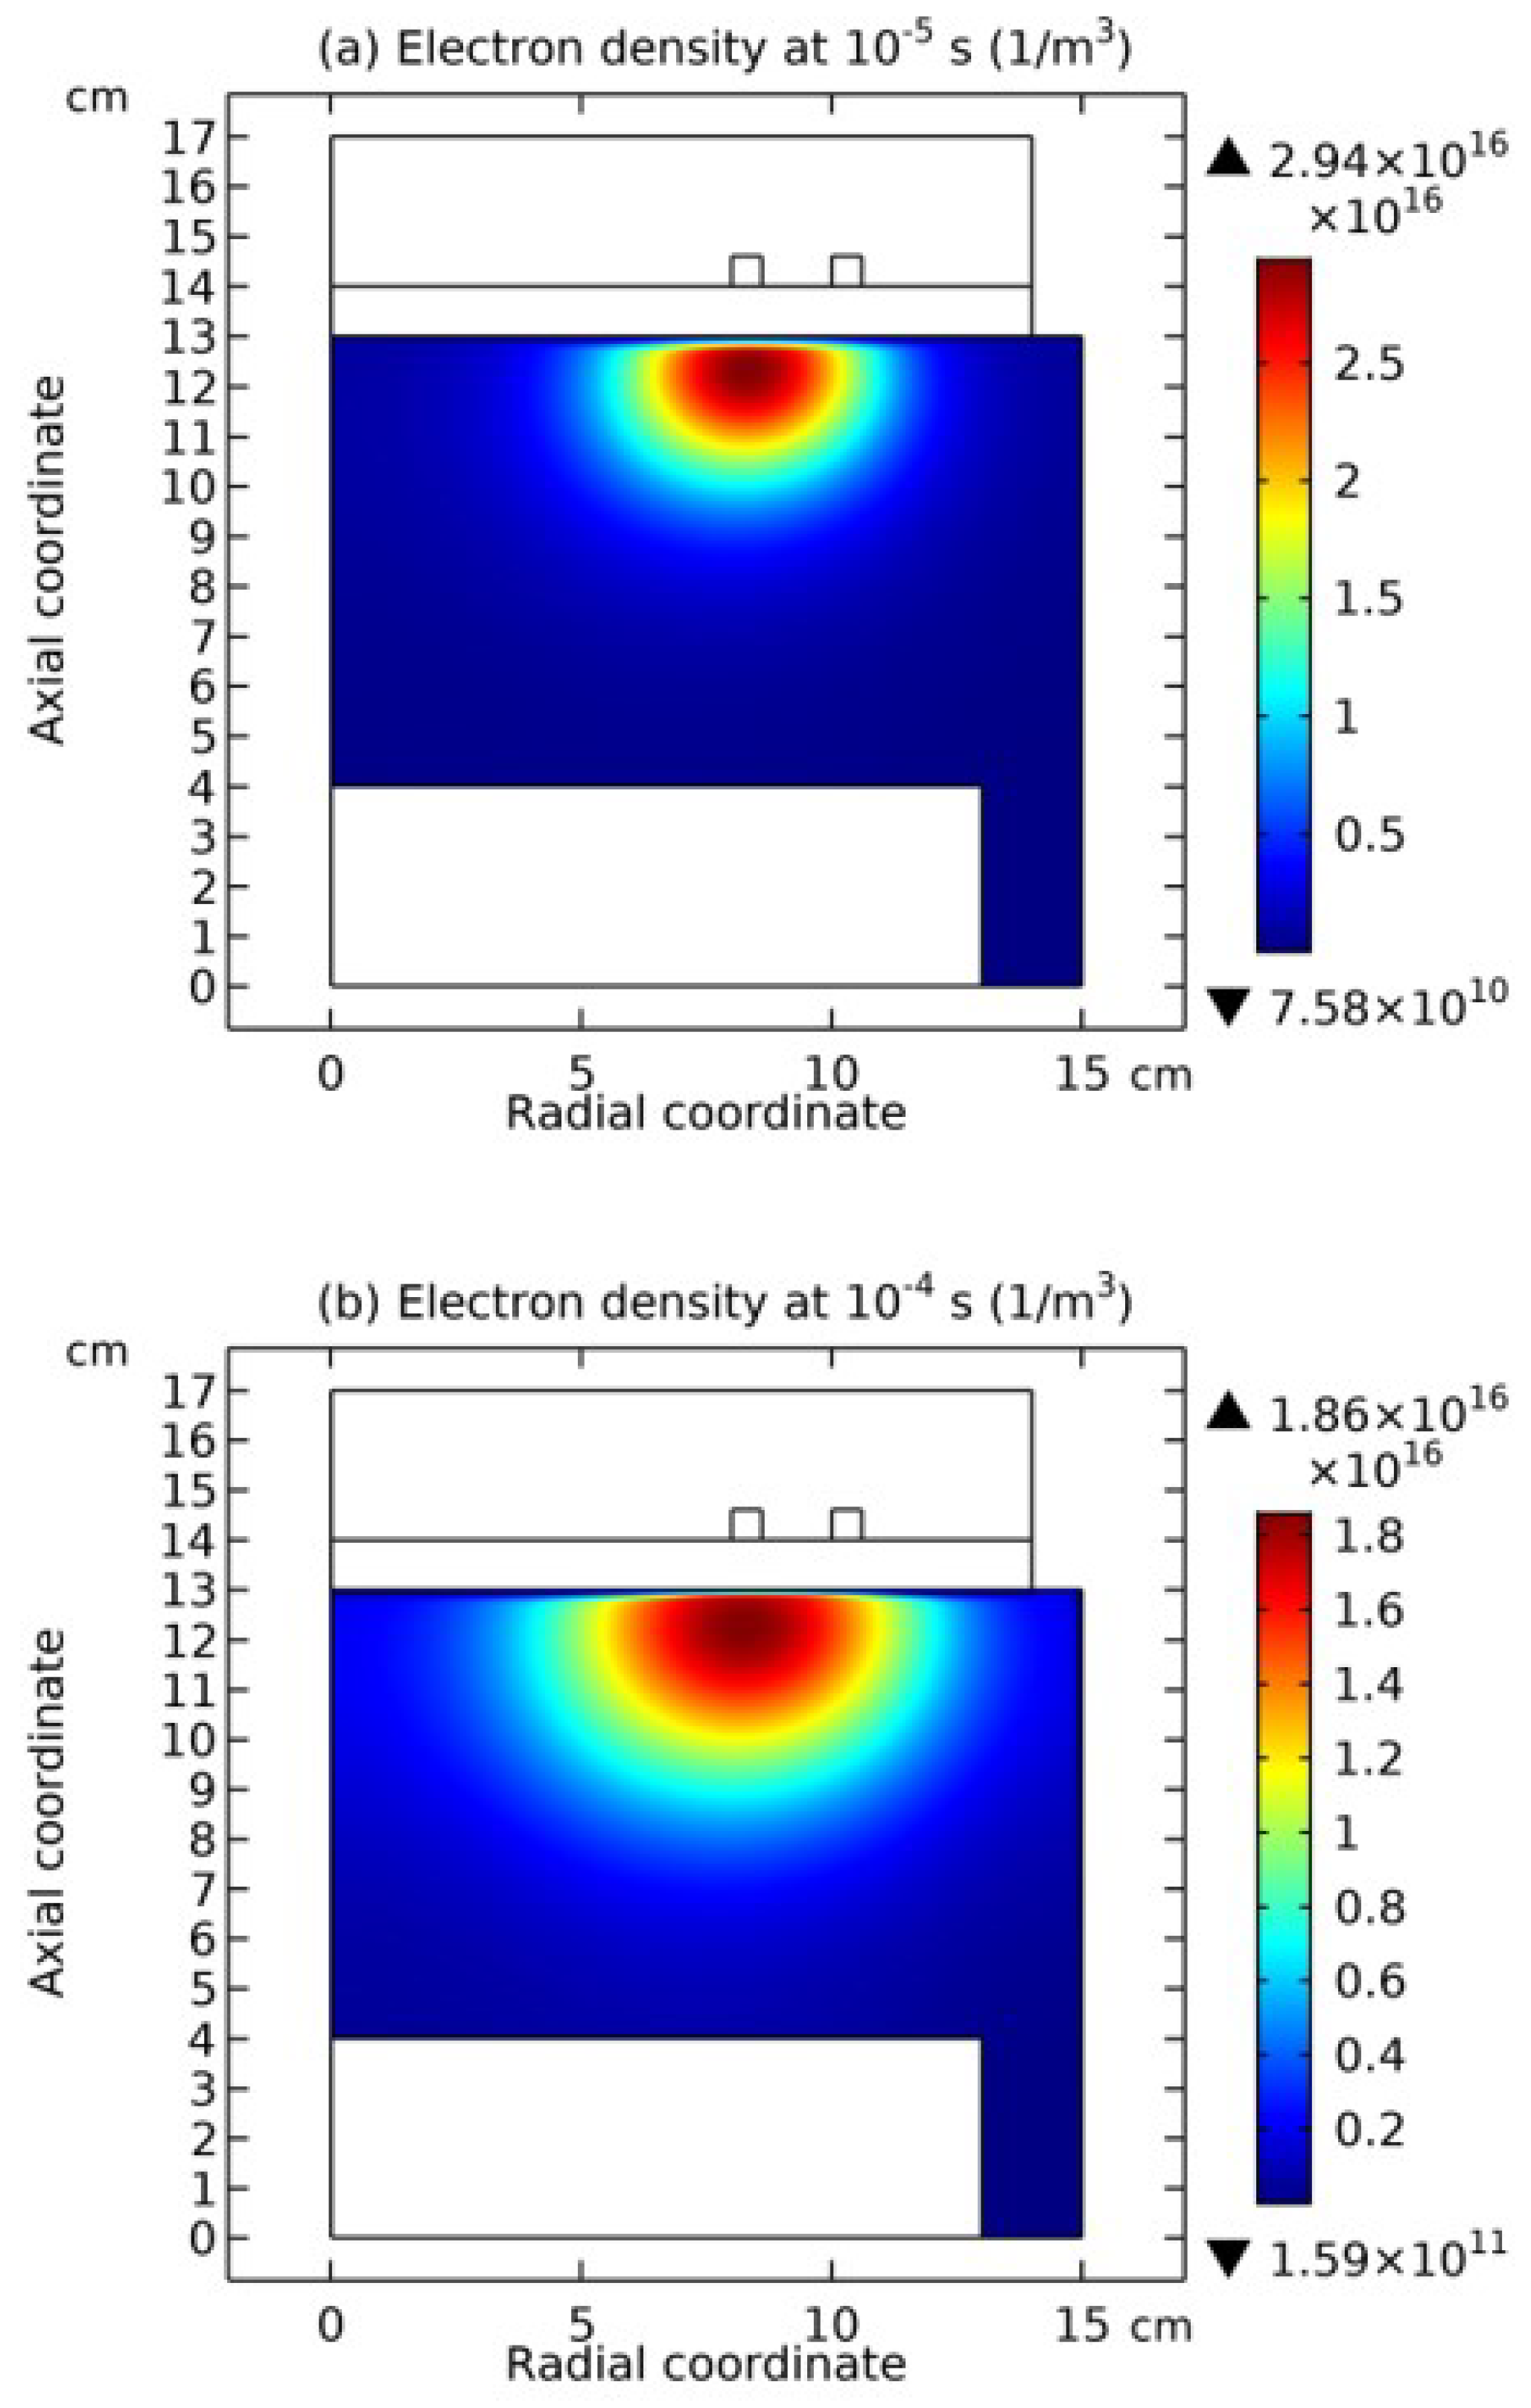
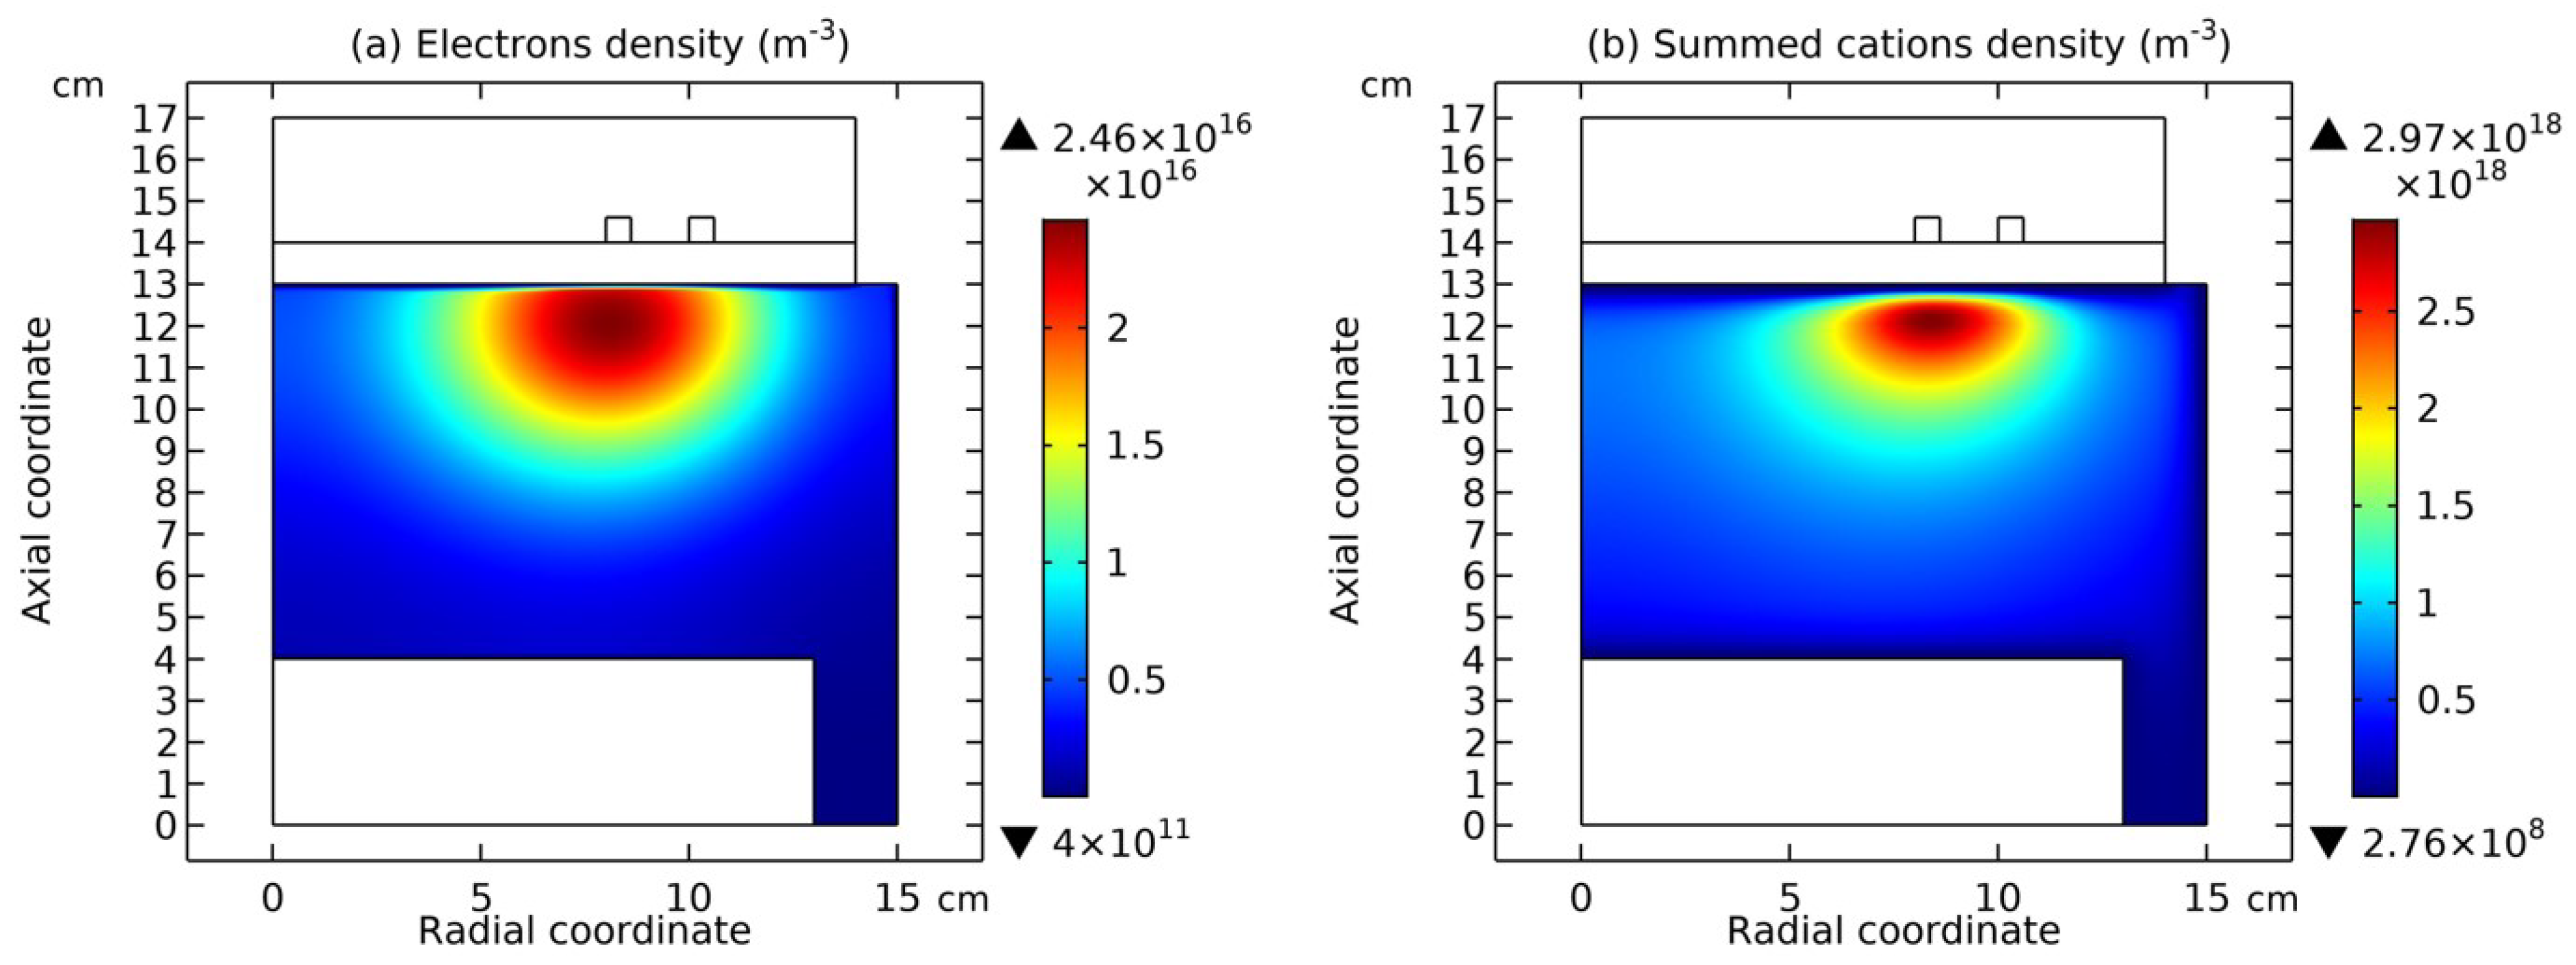
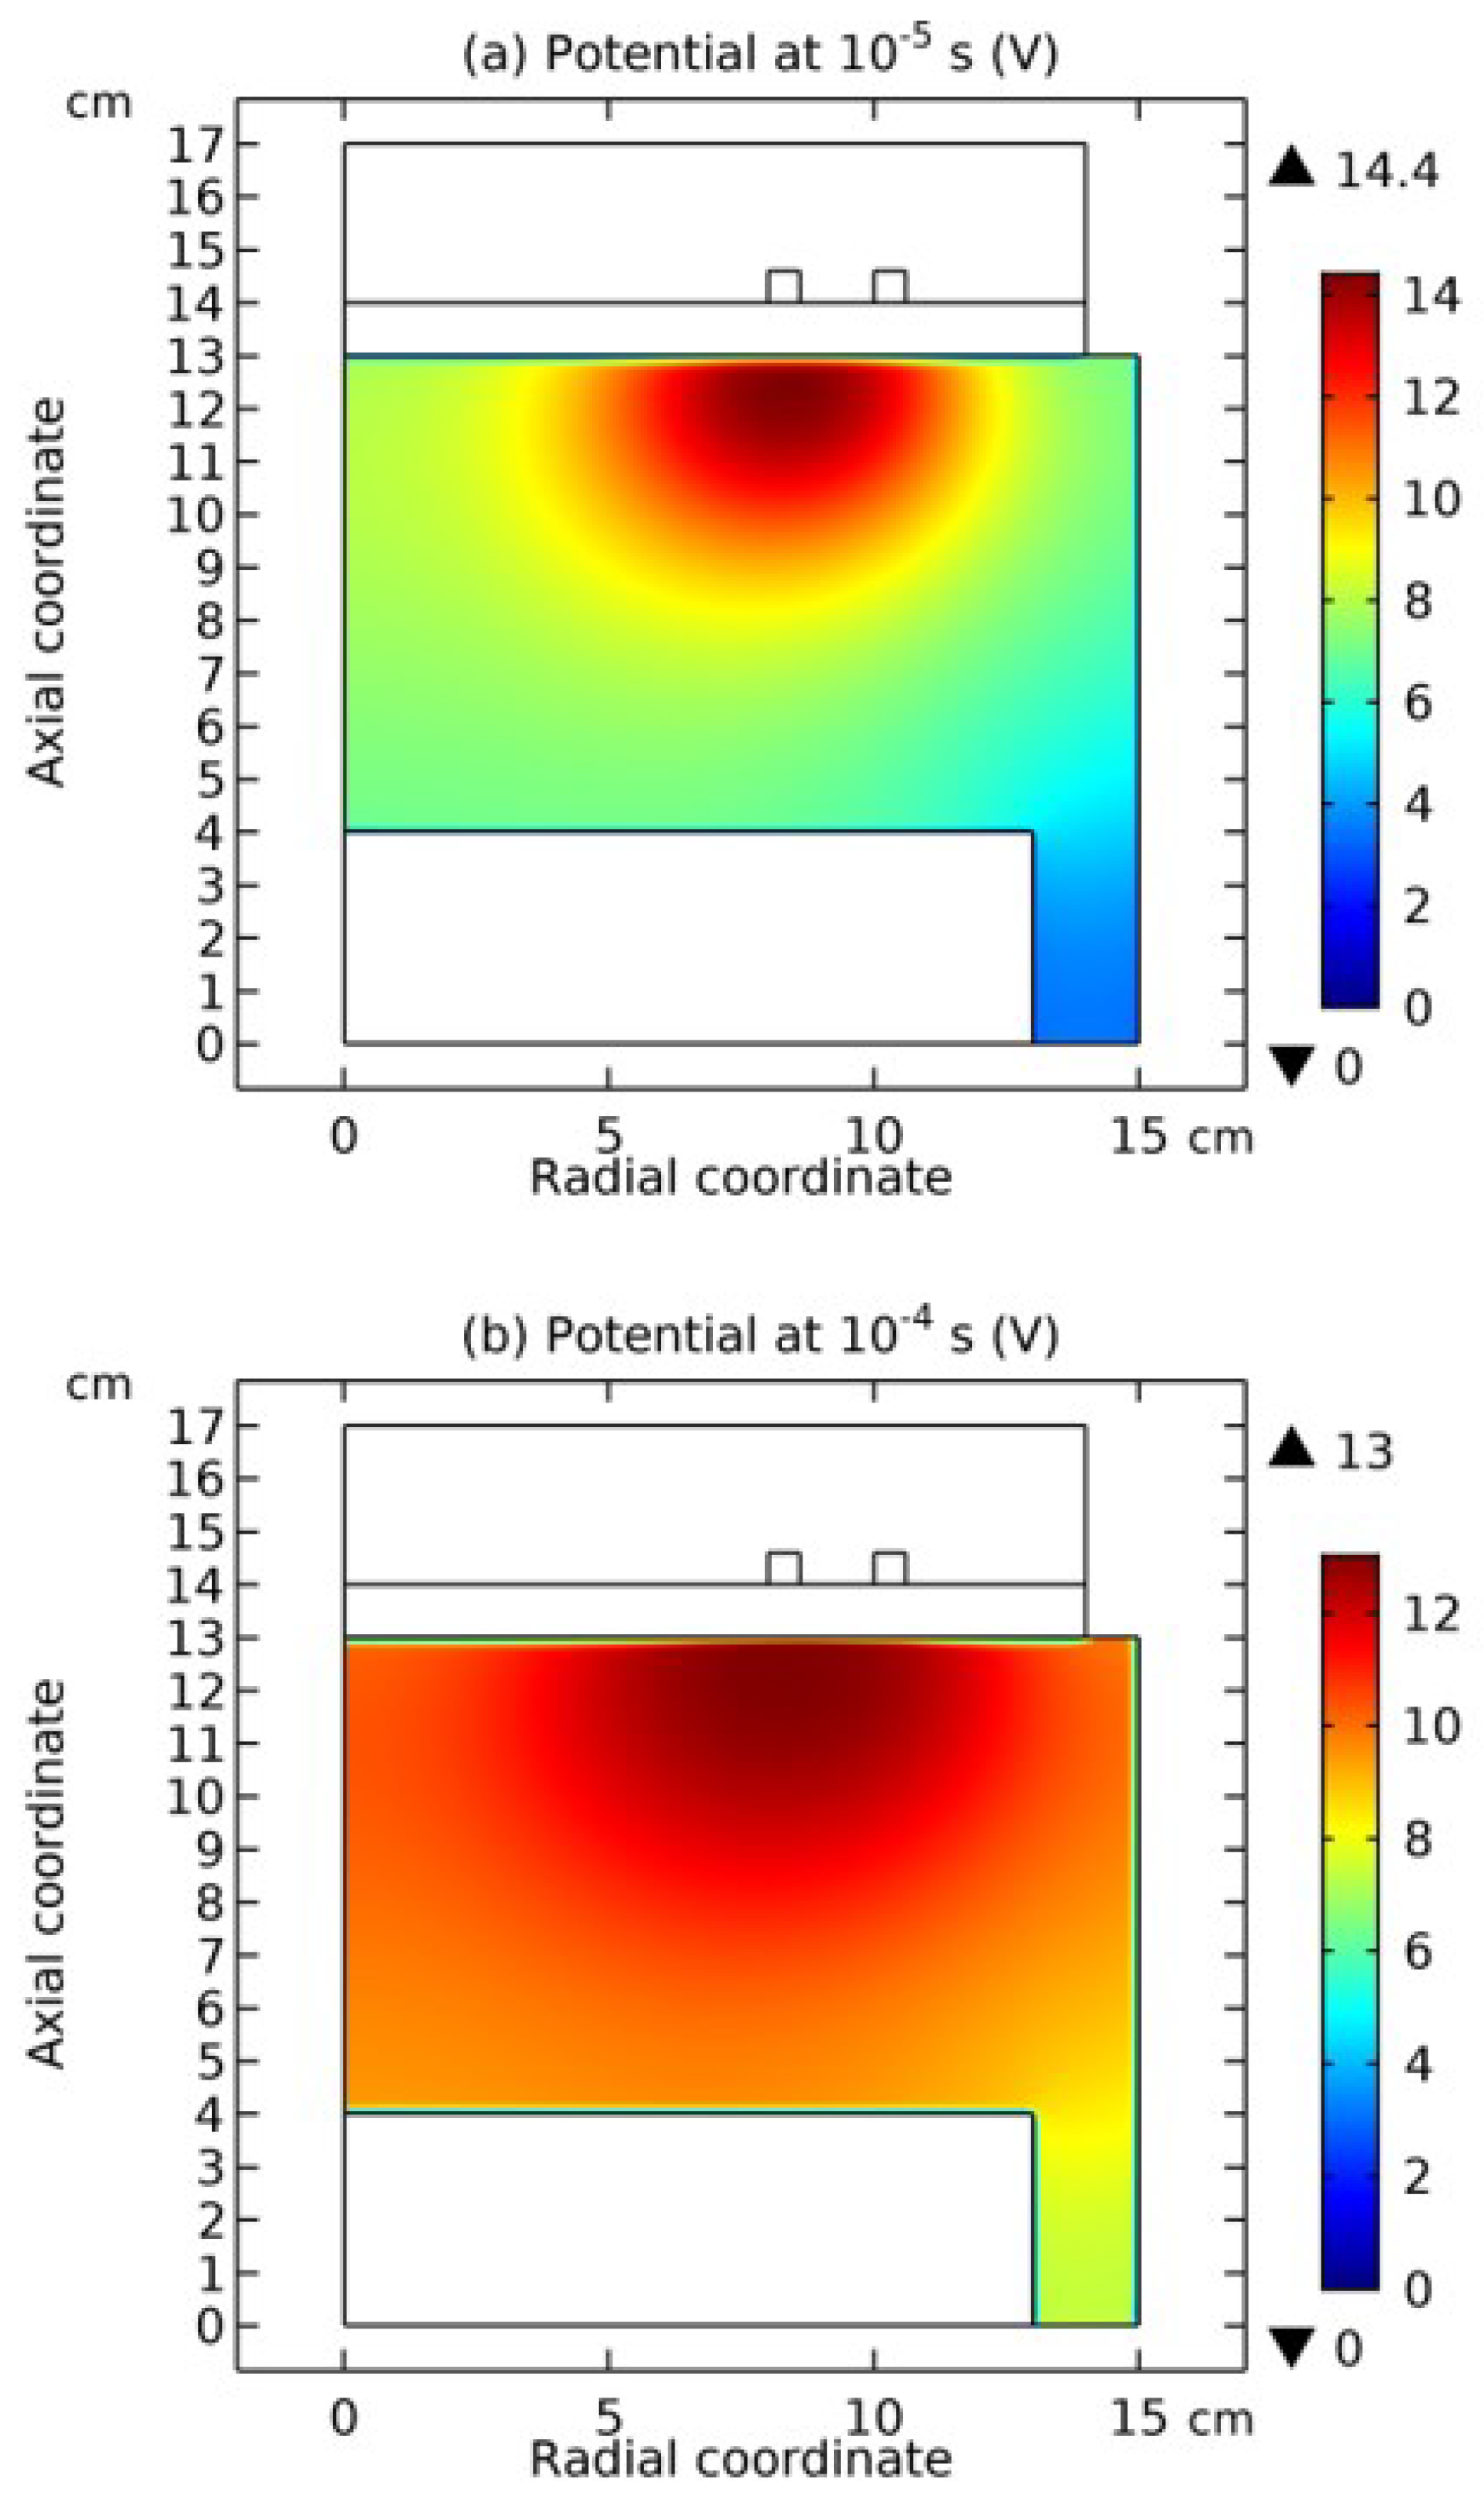
In the highly electronegative Ar/SF6 plasma, due to the existence of ambi-polar self-coagulation, the dynamics of electrons are more independent on the ions. As seen in Figure 19, after the ambi-polar self-coagulation happens, the gradient of ambi-polar diffusion potential that is originally established by the coupled electrons and cations system is strikingly weakened. And meanwhile, the electrons density profile is expanded as shown in Figure 20. This is meant that the electrons dynamics are decoupled partially from the self-coagulation behavior of ions. As seen next in Sec. (4.4), the electrons in the peripherical region of semi-circle astro-structure is sustained by a spontaneous monopolar self-coagulation, not by the ambi-polar diffusion potential that has been collapsed anymore. It is noticed that in the center of semi-circle the electrons are sustained by the ambi-polar diffusion potential since the potential barrel, although collapsed, is still sustained in an order of several Volts (see Figure 19(b) for reference). The chemical source of electrons in the semi-circle center is positive, which is of significance for supporting the whole electronegative gaseous discharging system by providing all species needed, e.g., electrons, cations and anions. In Figure 21, the steady state density profiles of electrons and cations are plotted. The expansive electrons density profile and the aggregative cations density profile (analogous to the anions in Figure 4(a)) are kept to the end in the simulation, validating the decouple of dynamics of electrons and ions in the periphery of astro-structure. It is noticed that the steady state density profile of cations in Figure 21(b) is a superposition of coagulated semi-circle and dispersed ellipse (i.e., the homogeneous background). So is the anions profile again due to the requirement of neutrality (see Figure 4(a) for reference). More detail about the ellipse background can be found in one of our articles related[38].
Besides, since the ambi-polar diffusion potential was established in the early stage of simulation the ionic self-coagulation of Ar/SF6 plasma is advective due to the early pushing role of potential, by noticing the blue sheath appearing in the periphery of semi-circle in Figure 4(d).
Figure 20. Simulated two-dimensional profiles of electron density at two simulating times, (a)  10 5 s (before self-coagulation) and (b)  10 4 s (after self-coagulation), in Ar/SF6 ICP plasma. The discharge conditions are the same as the Figure 4. The electrons density profile expands along with the ambi-polar self-coagulation of ions.
Preprints 115954 g020
Figure 21. Steady-state and two-dimensional profiles of (a) electrons density and (b) summed cations density, given by fluid model in Ar/SF6 ICP plasma. The discharge conditions are the same as the Figure 4.
Preprints 115954 g021

4.3. Expelling Effectt between Astro-Structures with the Same Charge Type

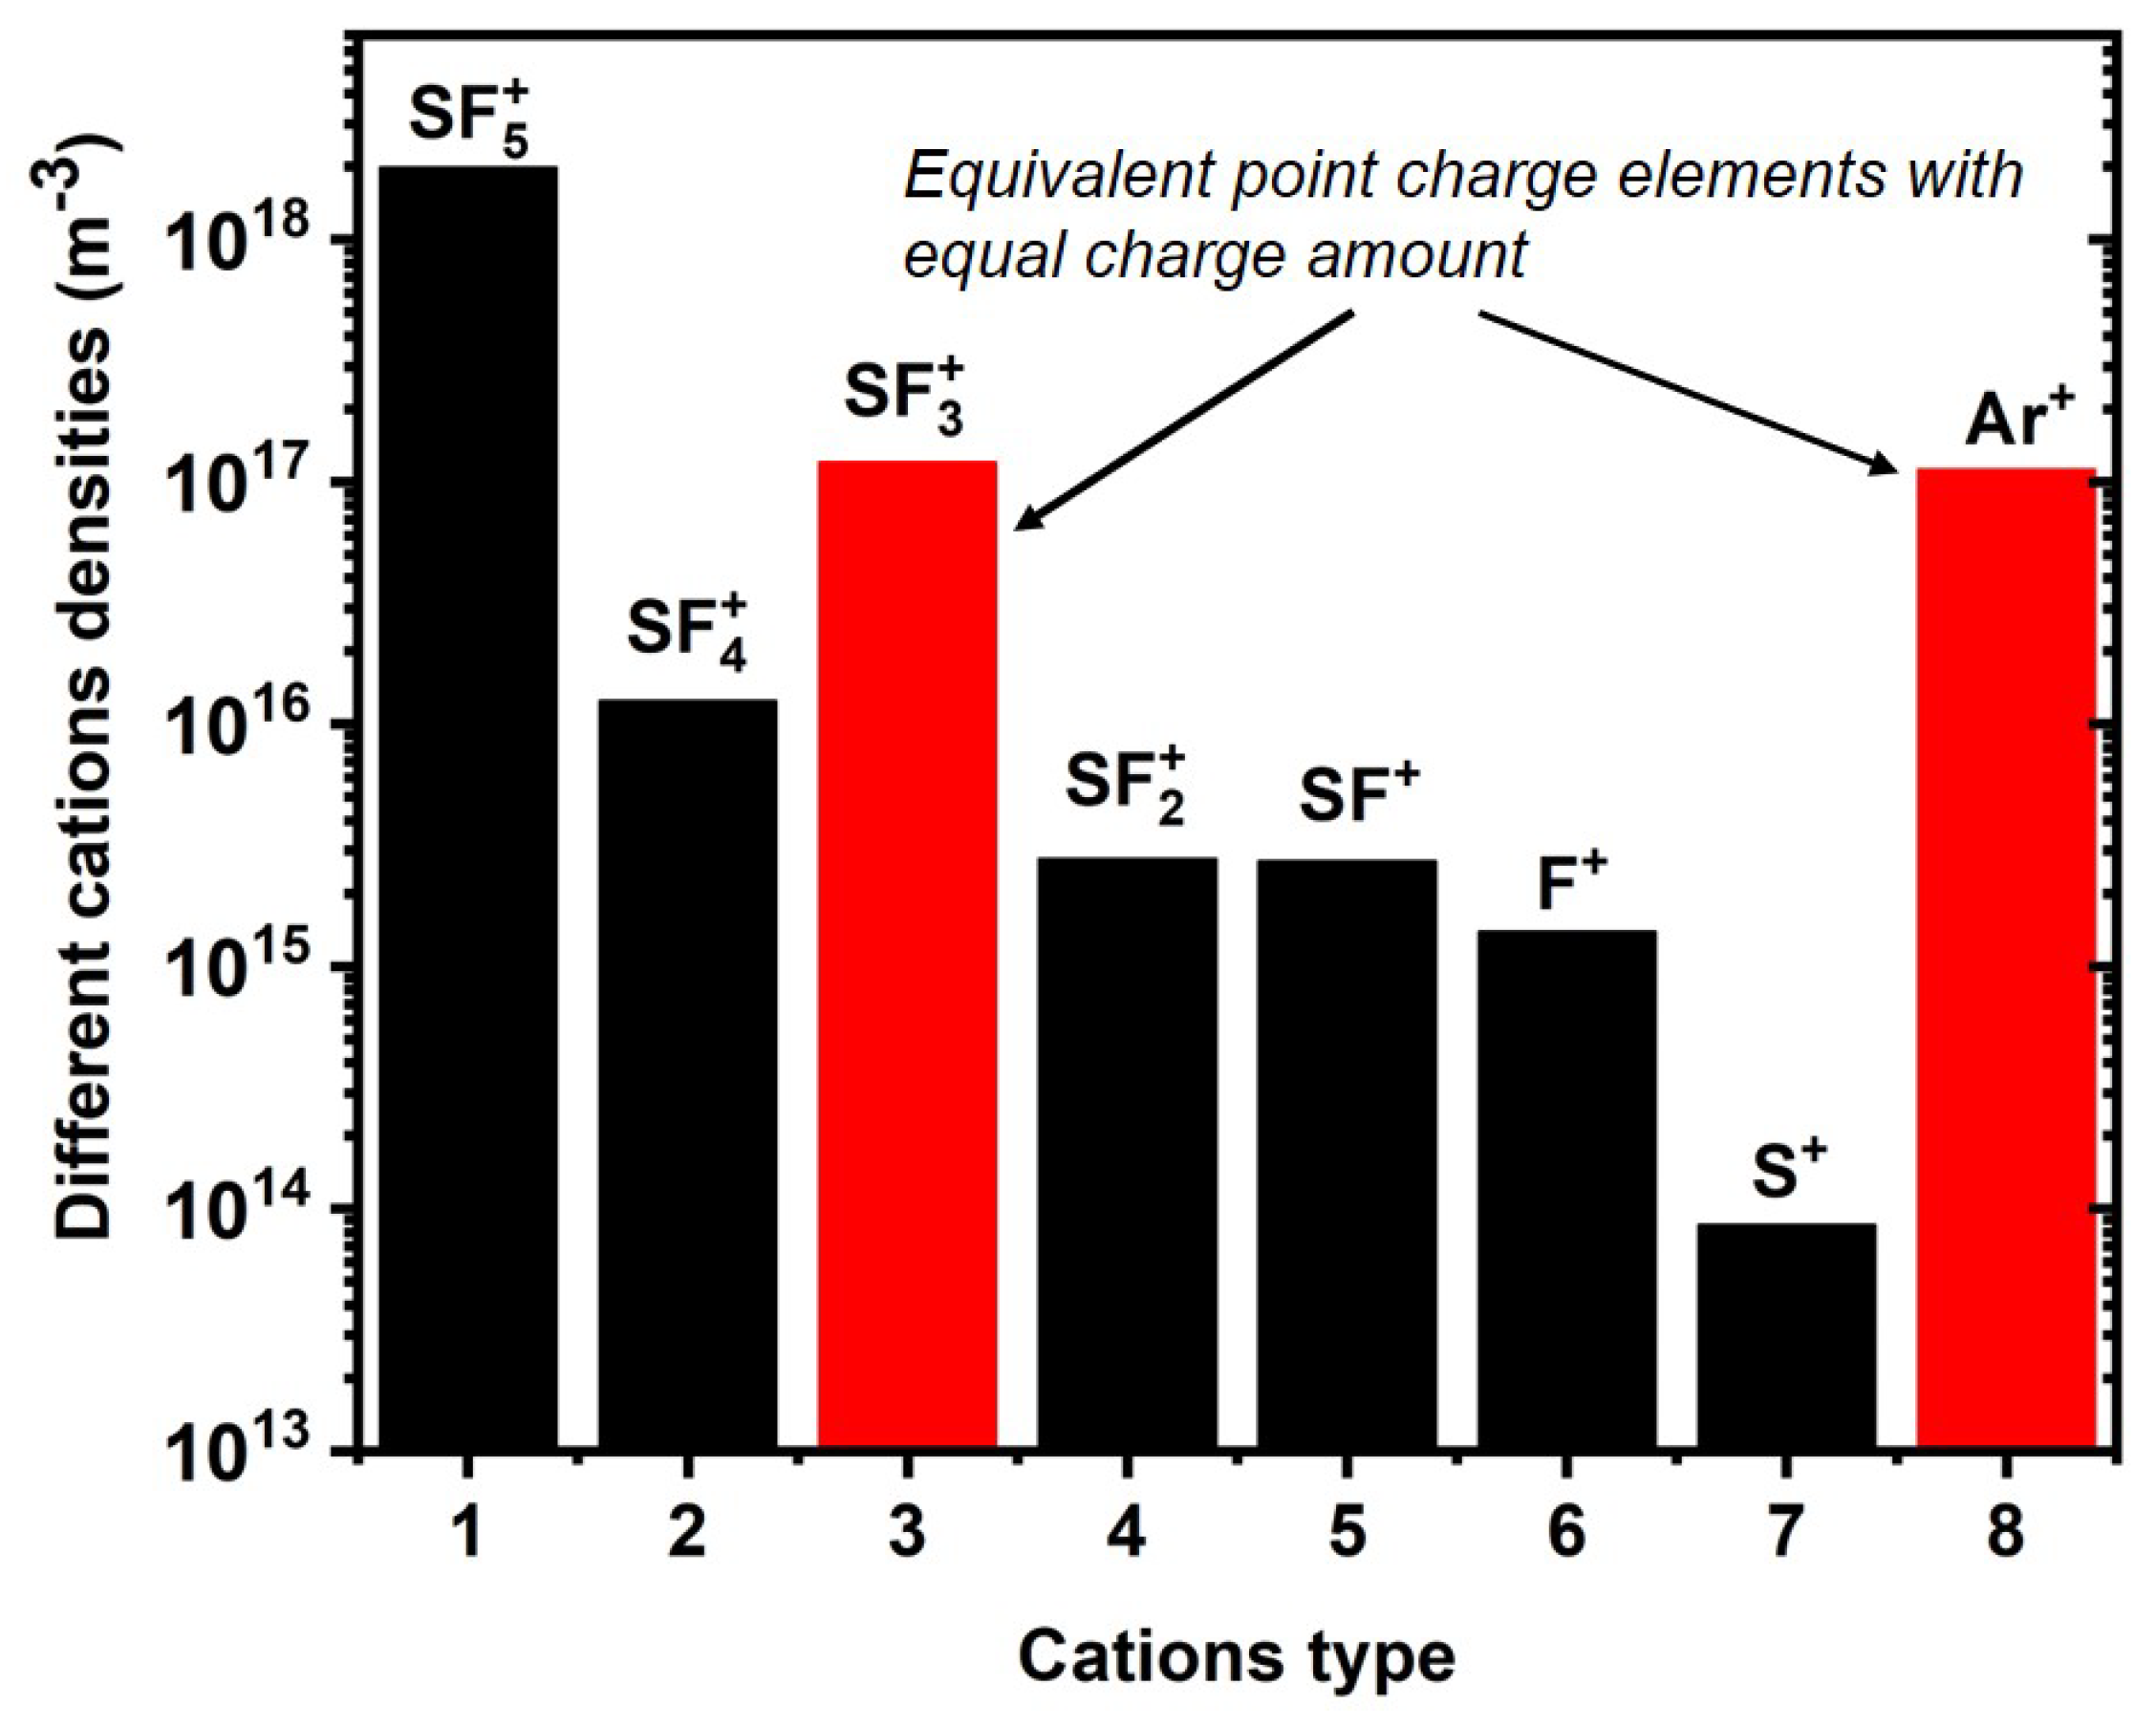
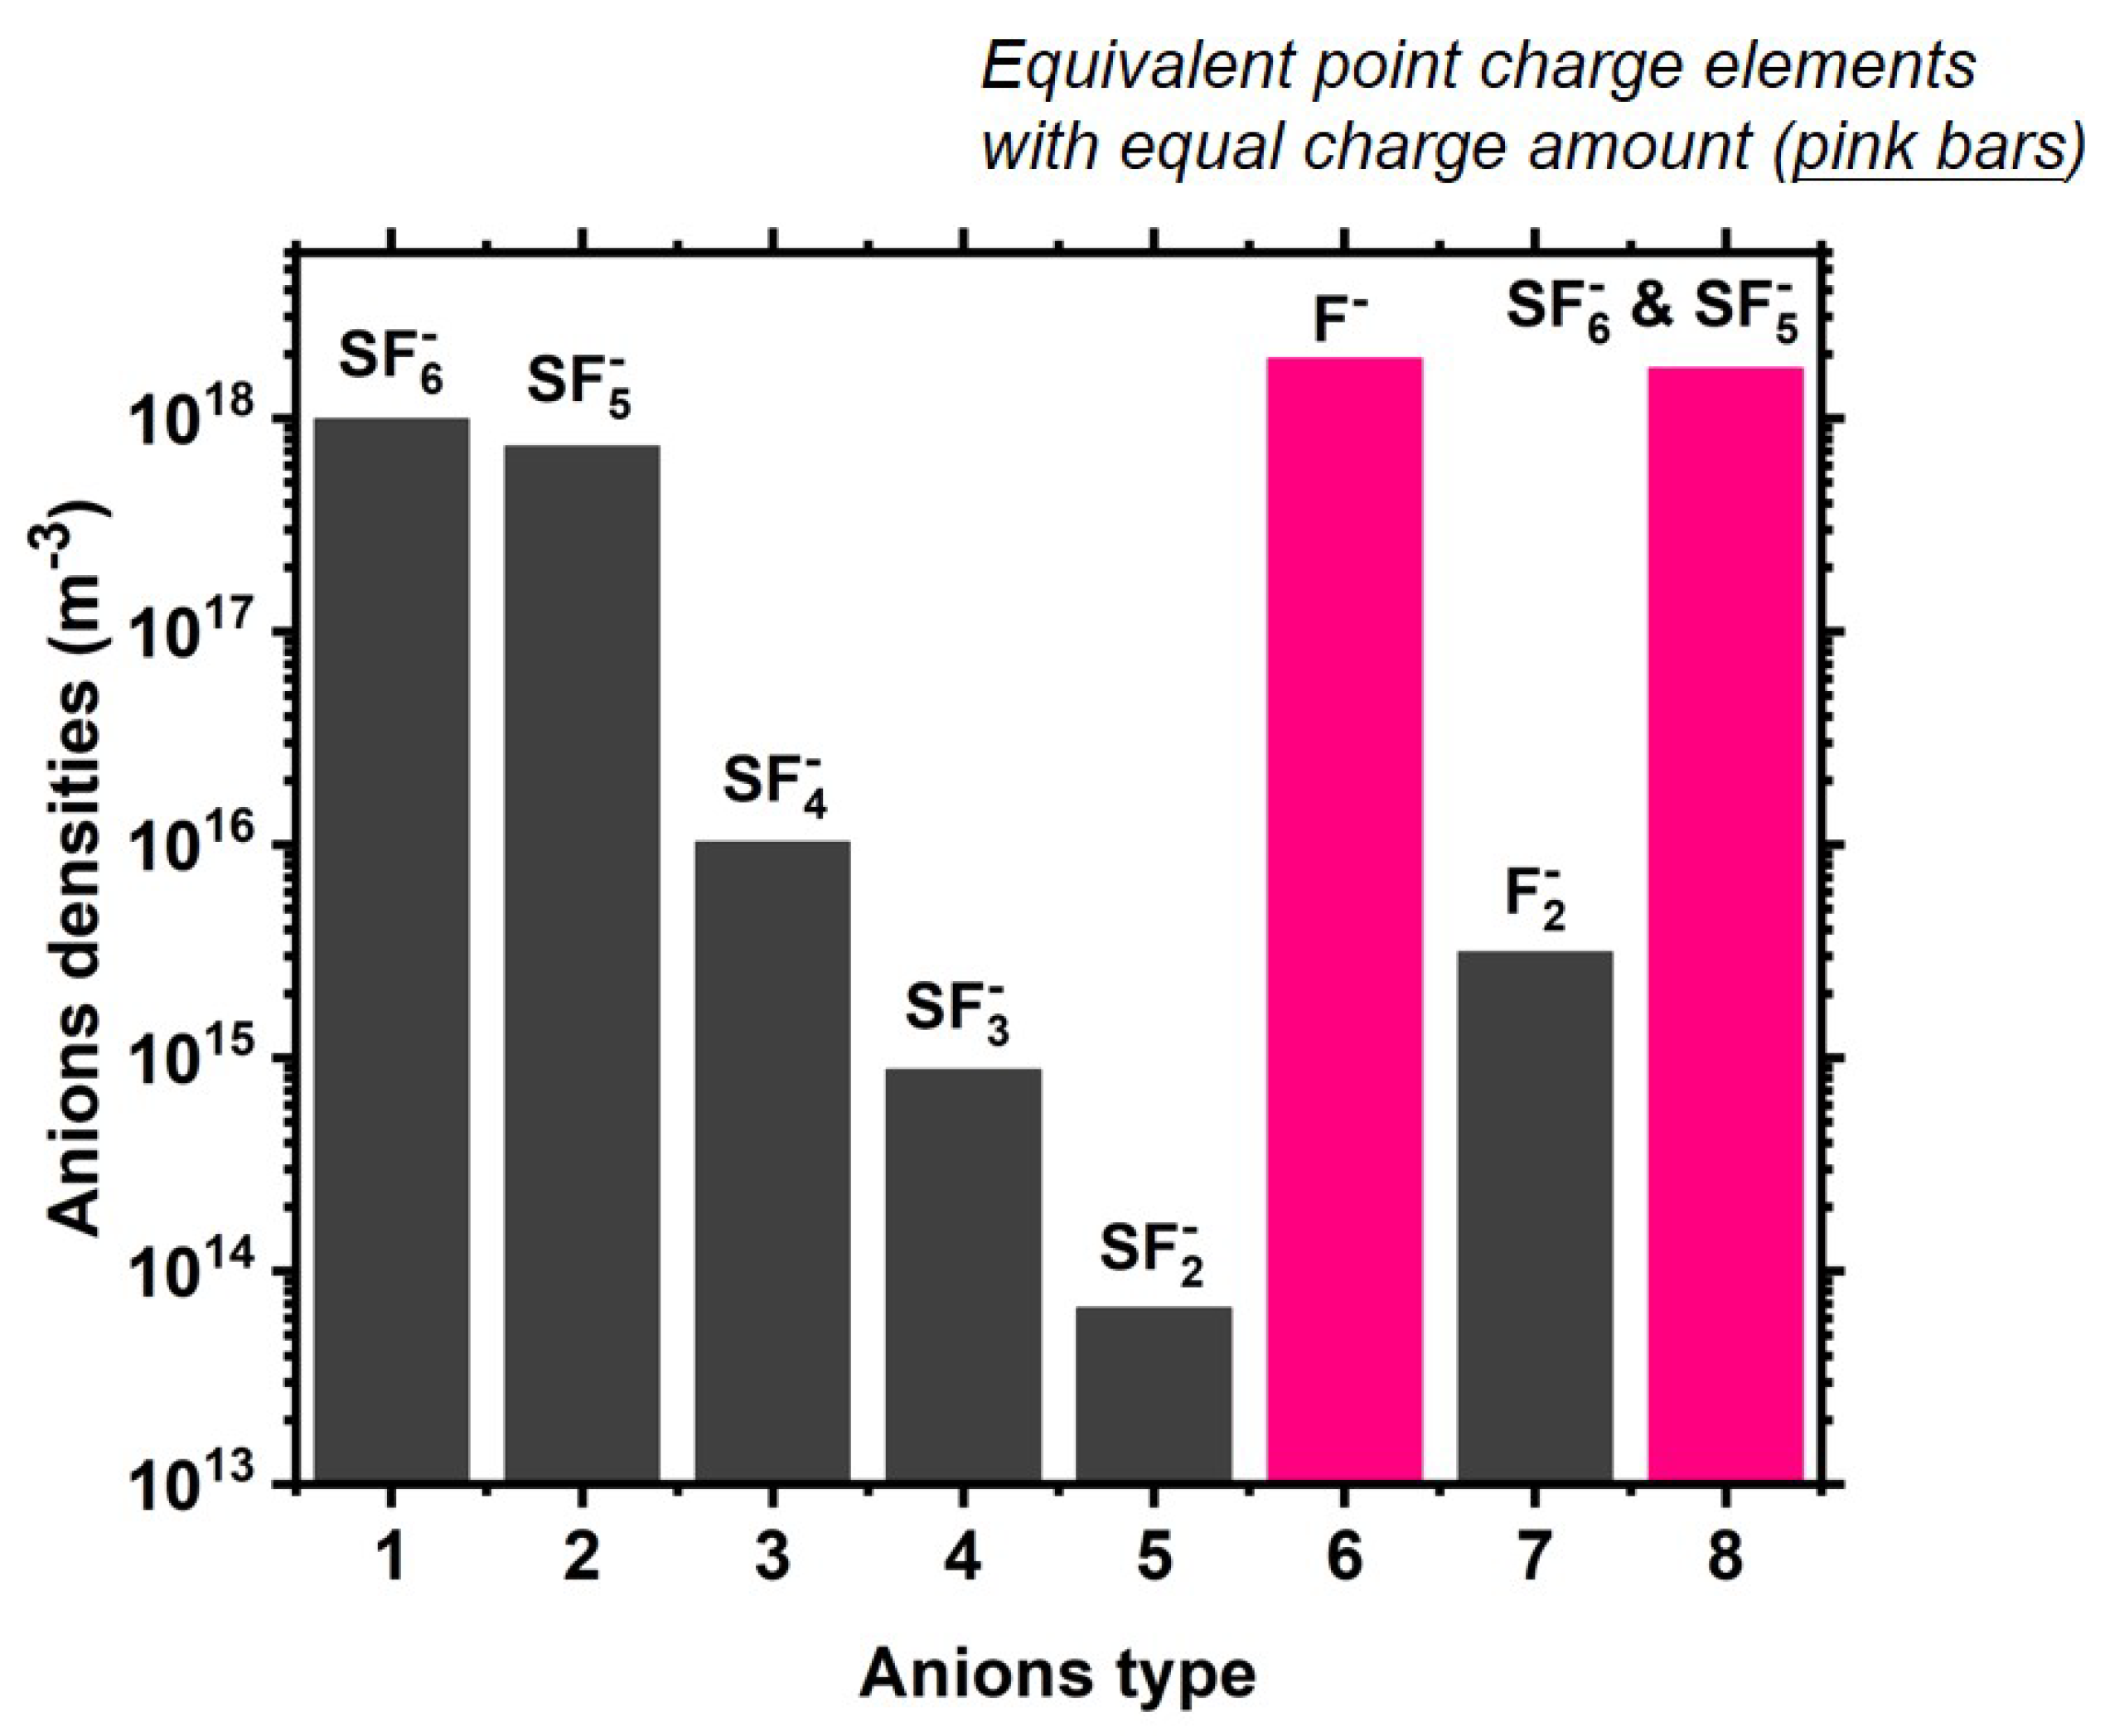
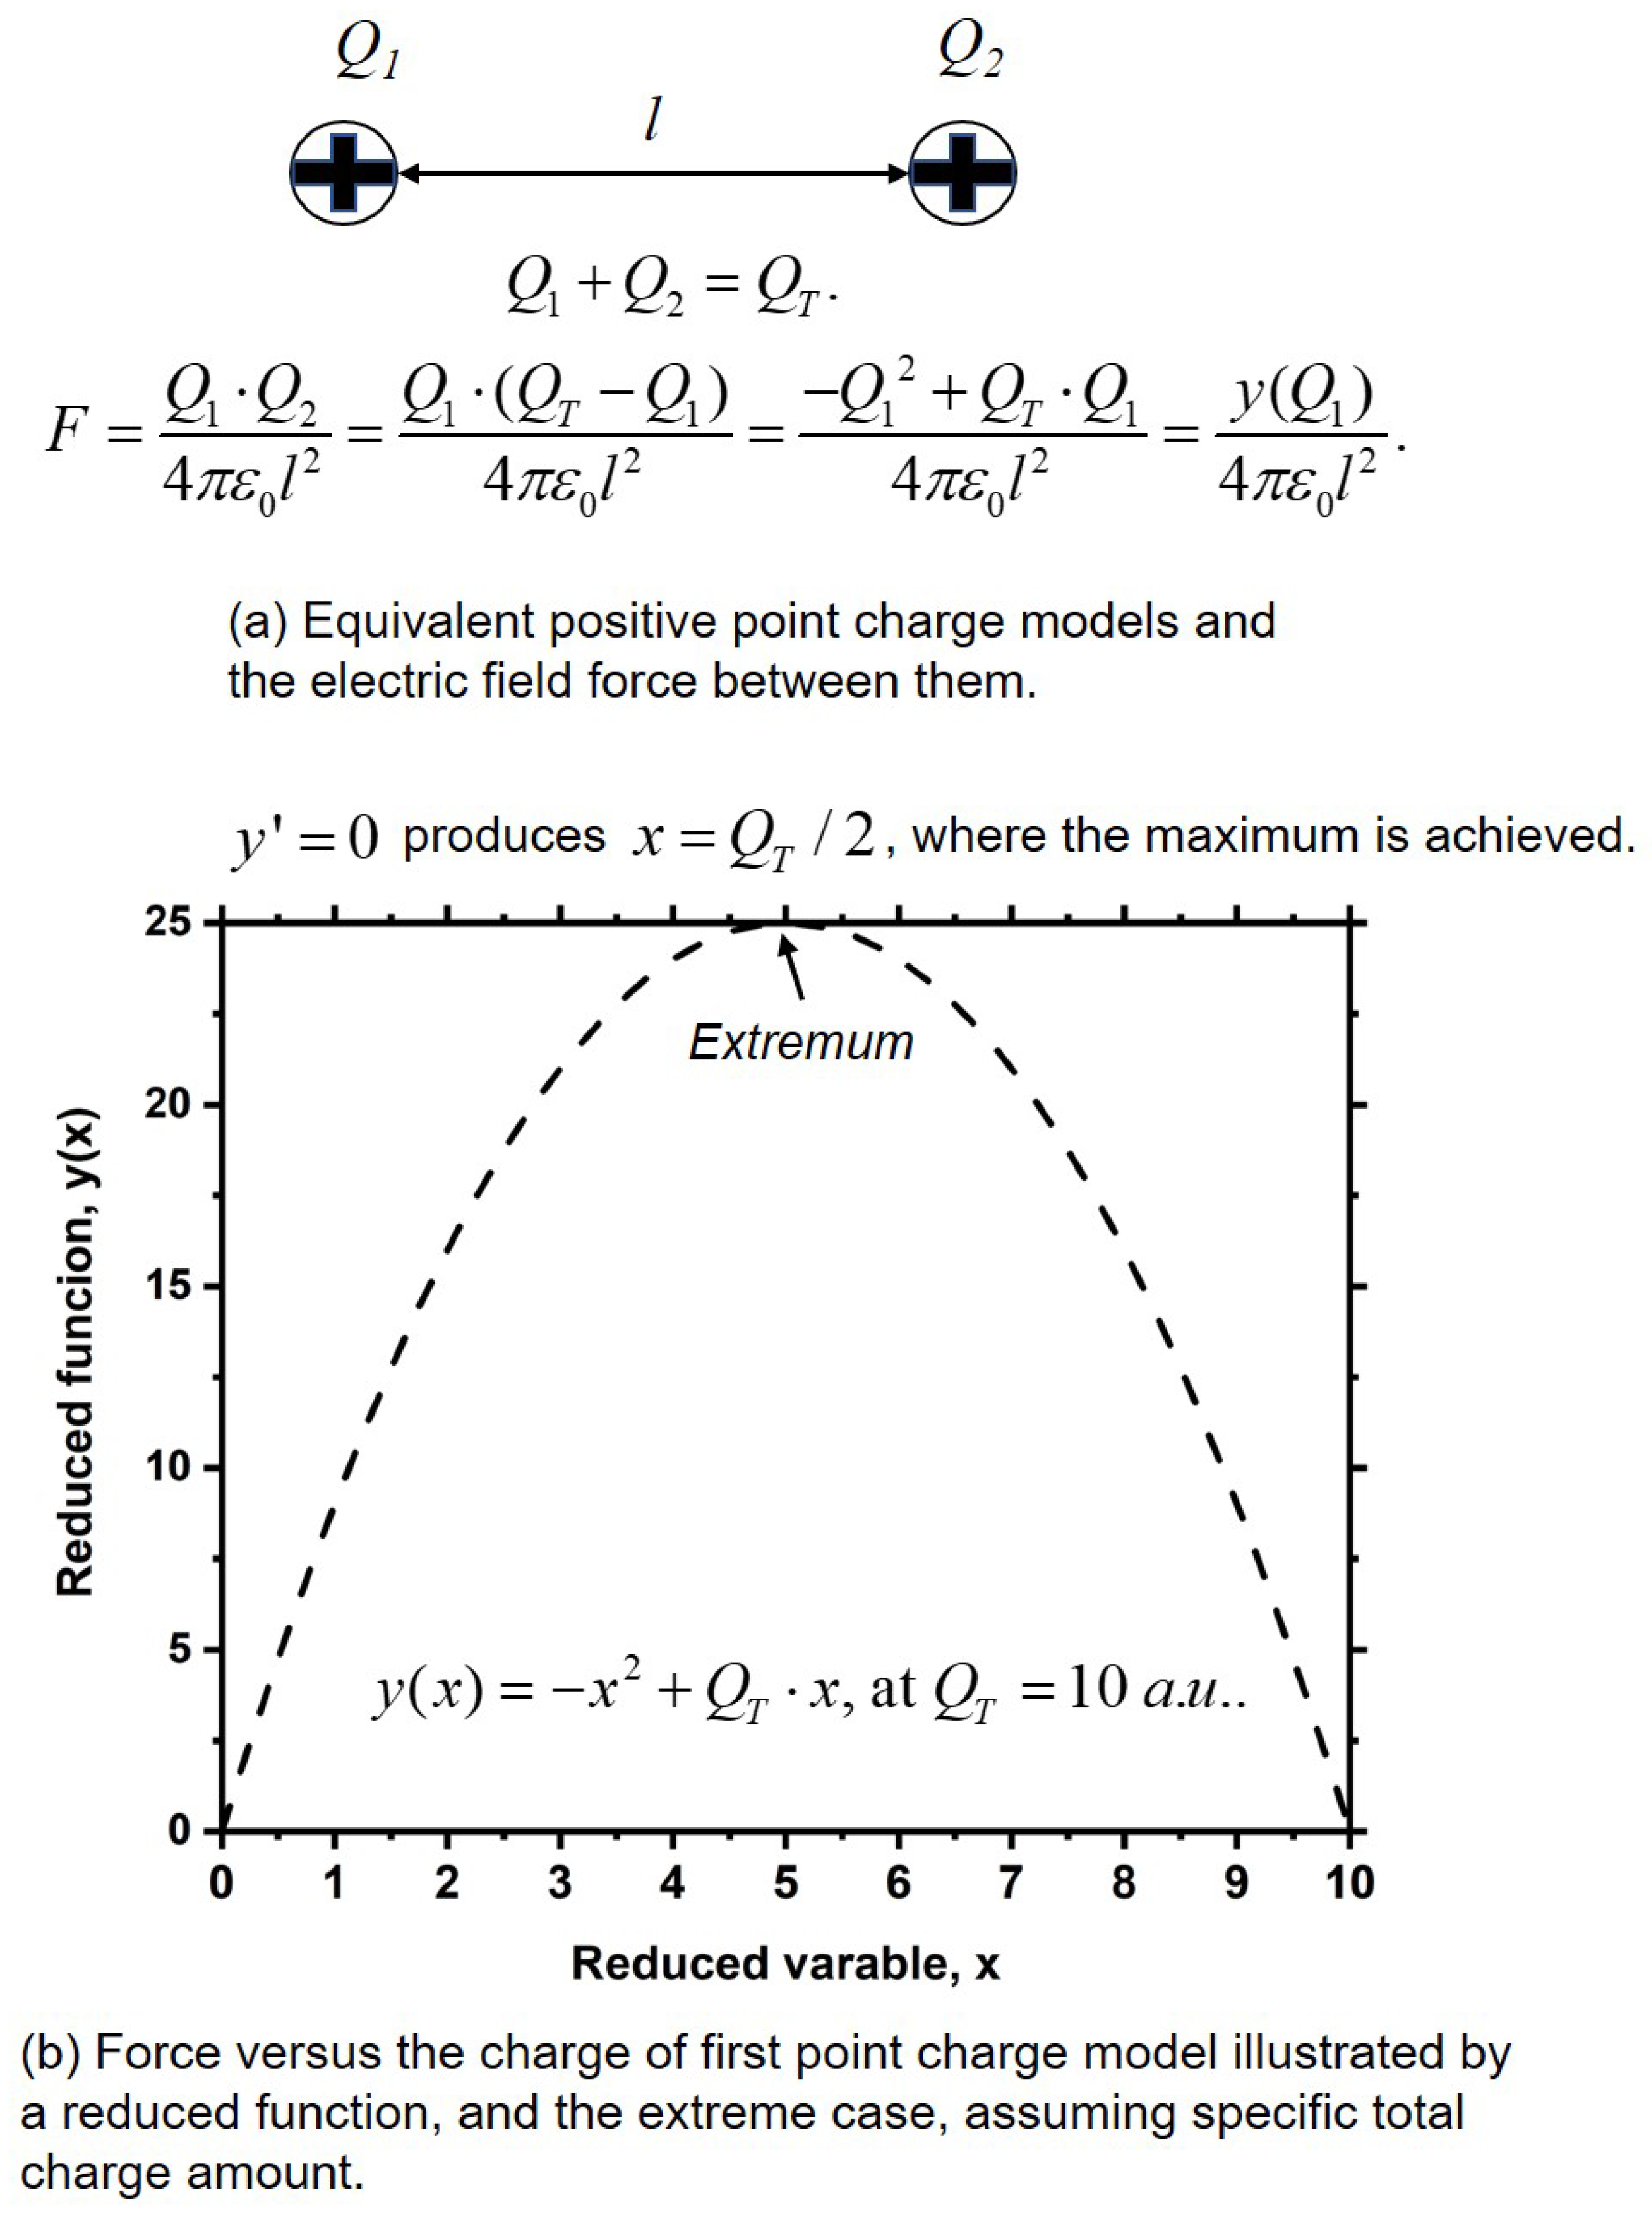
In Figure 22, the density peaks of different cation species are compared. In Figure 23, the density peaks of different anions species are compared and it is noticed that the densities of SF 6 and SF 5 are summed. It is seen from the Figure 22 and Figure 23 that the density peaks of SF 3 + and Ar + are the most close, and the density peak of F and the peak of summed SF 6 and SF 5 density are the most close. In Figure 24(a), The Coulomb’s force between the two equivalent positive point-charge models is presented. In Figure 24(b), when fixing the total charge amount of two transformed point-charge models, it is shown that the Coulumb expelling force is the largest when the charge amount of the two models are the same. This explains well the collapses of anions and cation in Figures. 5 and 6 of Sec. (4.3), since their density peaks are the most close to their respective opponent as shown in the Figure 22 and Figure 23. It is predicted from Figure 24 that if the two point-charge models carry negative charge, the maximum of force is still appeared when the total charge amount is averaged.
Besides, in Sec. (3.3), the dispersion of cation coagulation in Figure 6 is severer than the anions in Figure 5. It is caused by the fact that the coagulation of anions is a chemical process while the coagulation of cations is more a physical process, i.e., an ambi-polar type (see the Secs. (4.2.2(b))). As analyzed, the ambi-polar type is originated from the self-coagulation of anions (chemical process) and ultimately led to by means of an electrically appealing interaction between the anions and cations to keep the neutrality. Herein, the chemical role is stronger than the physical role.
Moreover, the light species are more coagulated as shown in Figure 5 and Figure 6. This is caused by the inertial effect of density quantity. In the self-coagulation theory of Sec. (4.1), it is shown that the self-coagulation is caused by the negative chemical source, i.e., recombination. The dimensional analysis of Sec. (3.1) reveals that the chemical source can be transformed into the drift term caused by effective field. So, the negative source plays the electrical role. In the continuity equation of species, the inertial term can be multiplied by the species mass. An electrical interaction is independent on the species mass. So, the species with large mass is relatively difficult to be coagulated since the accelerating velocity that is given by the fixed drifting force but large object mass is small.

4.4. Spontaneous Monopolar Self-Coagulation

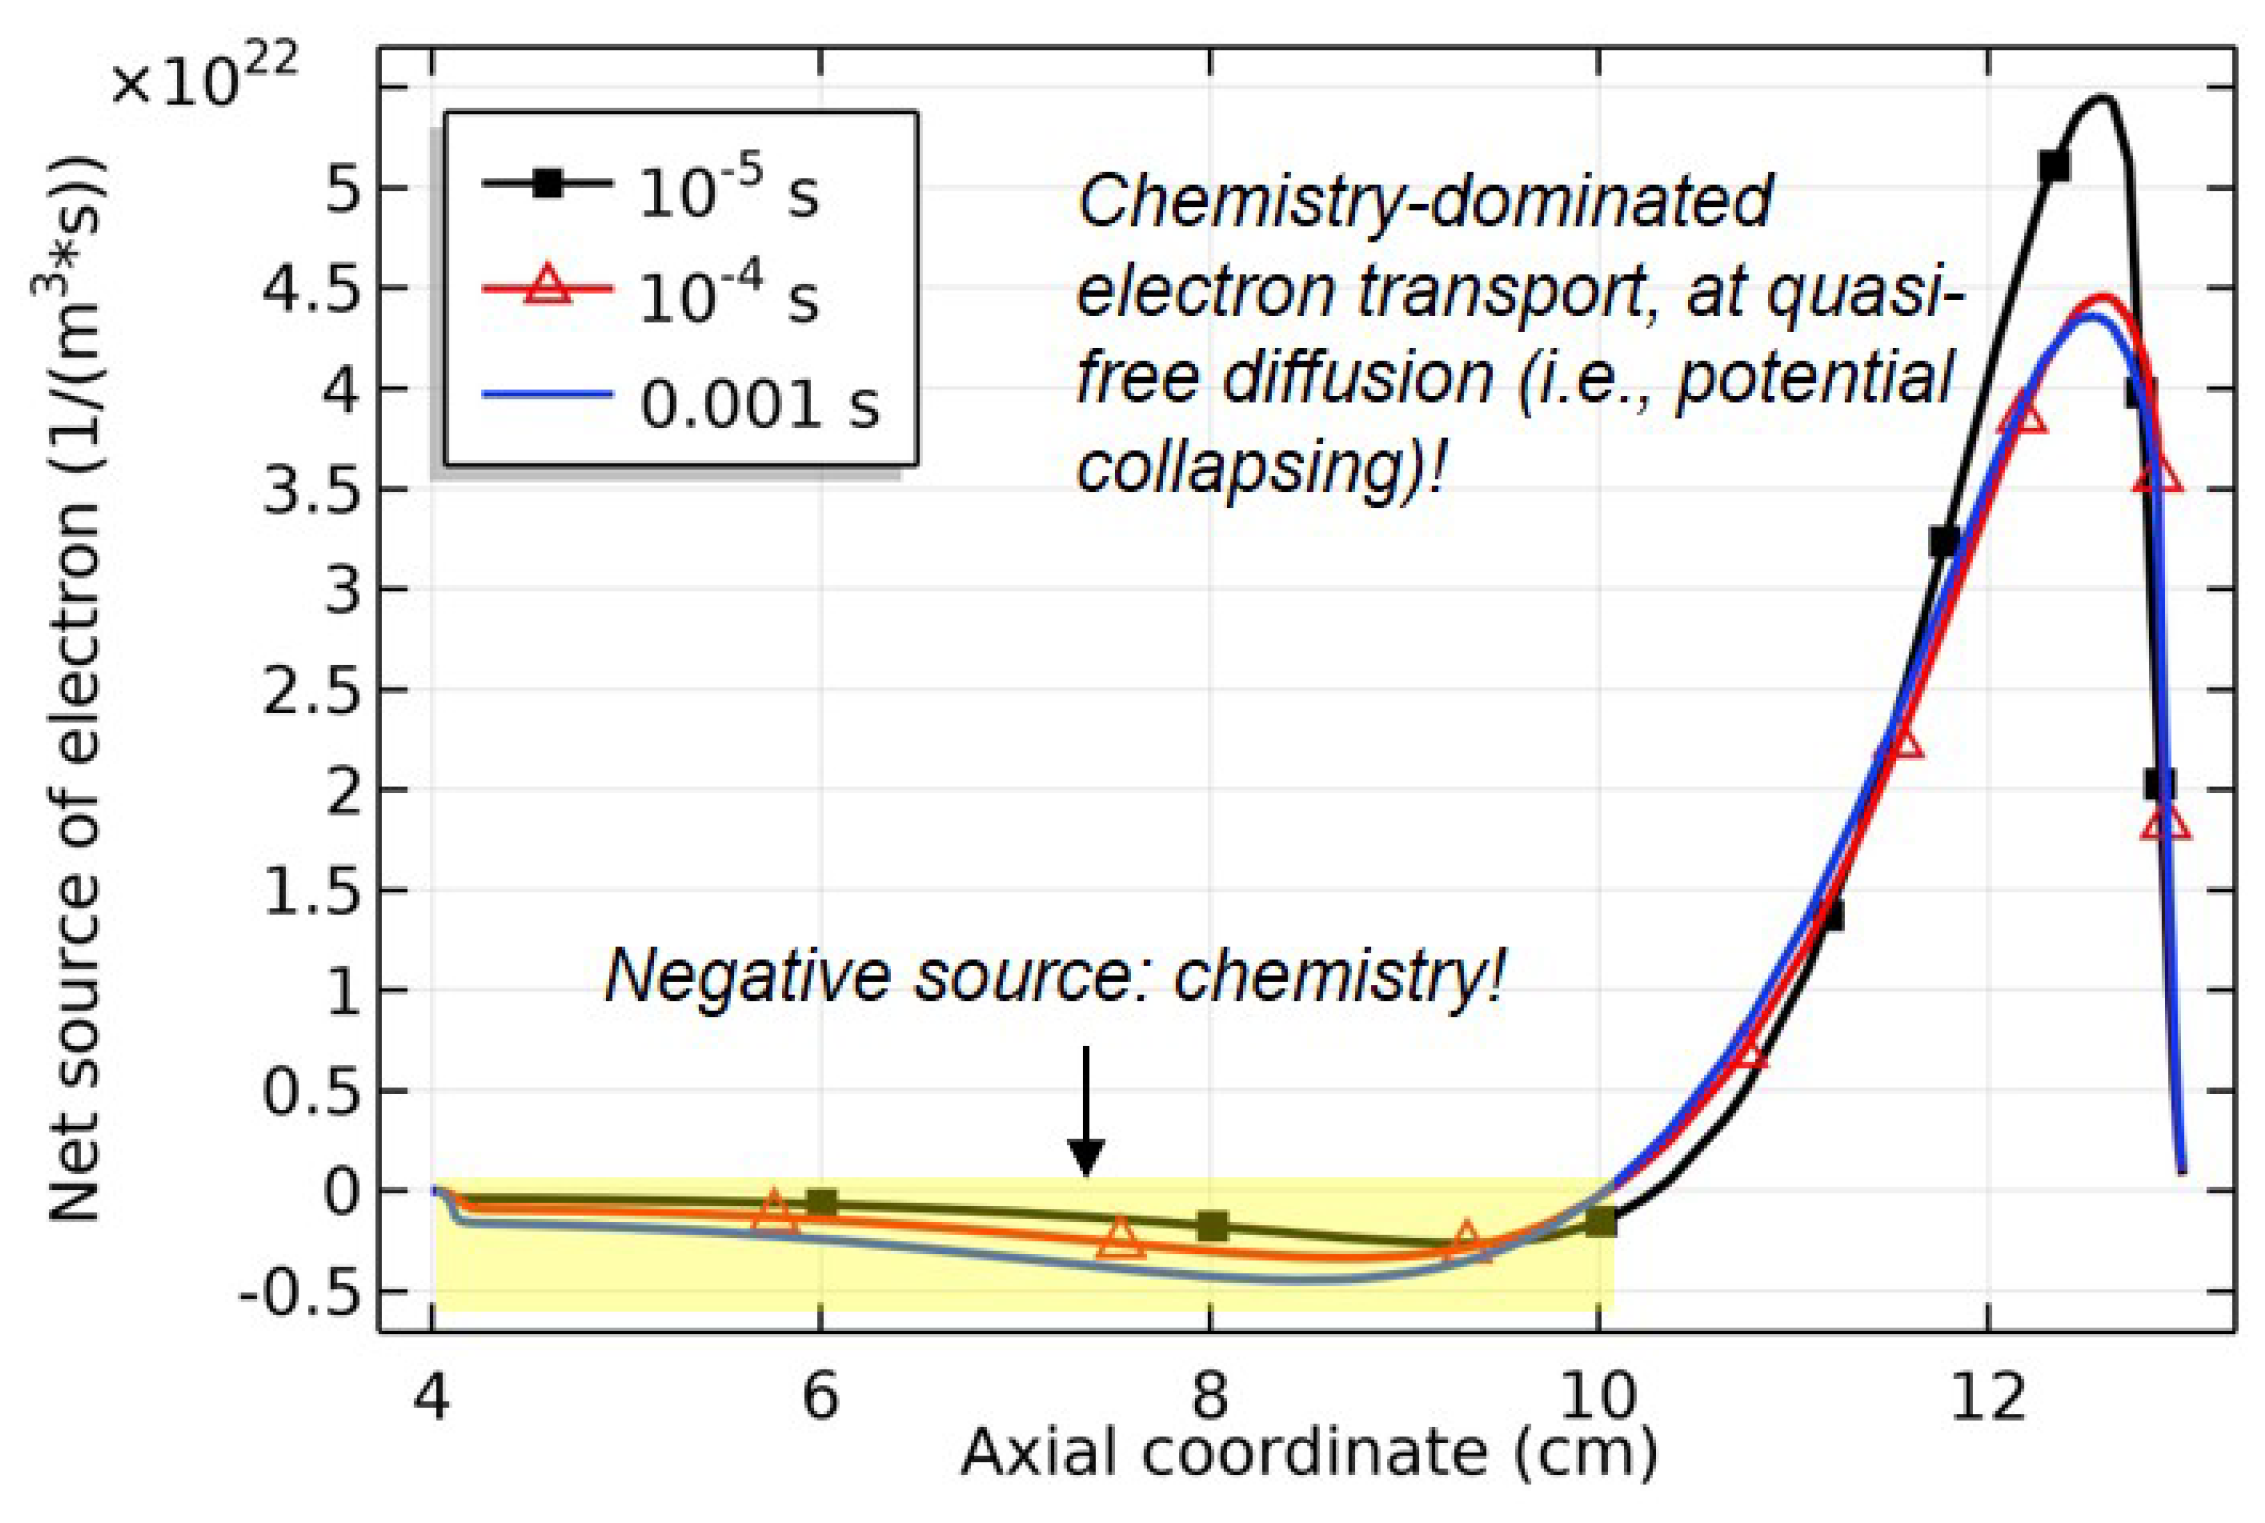
In Figure 25, the axial profiles of net chemical source of electrons at different simulating times are shown. It is seen that in the periphery of astro-structure, the chemical source is negative and it becomes more negative at increasing the time. In Sec. (4.2.2), it is shown that the potential collapses at increasing the time due to the decouple of electrons from ions. The collapsed potential therefore provides the free diffusion component. Together with the negative source herein, the self-coagulation of electrons is formed in the periphery of astro-structure. It is noticed that the electrons self-coagulation, together with the re-self-coagulations of minor species in Sec. (3.4), is a spontaneous (i.e., non-advective) type since it has not been experienced the pushing role of ambi-polar potential. Besides, the self-coagulations of electrons and minor species are also monopolar due to the decouple feature. Finally, the spontaneous monopolar self-coagulation can be described by the Eq. (51), which can generate the delta function at the steady state as illustrated in Sec. (4.1). Herein, n is the species density that is to be coagulated, and D and ν r e c are the free diffusion coefficient of this species and its recombination frequency, respectively.
n t D 2 n = n ν r e c .

5. Conclusions and Further Remarks

In this article, the self-coagulation theory is the first time formally suggested and applied to explain the astro-structures of anions that are discovered in the fluid simulations of Ar/O2 and Ar/SF6 ICPs. To keep the neutrality, the cations have to follow the anions, therefore forming the ambi-polar self-coagulation process, which is similar to the ambi-polar diffusion. The ambi-polar self-coagulation does not create the potential gradient, since the masses of attending species, i.e., anions and cations, are almost the same. This is different to the ambi-polar diffusion potential of electropositive plasma that is caused by the significant mass difference of electrons and ions. Accompanied to the self-coagulation behavior happened in the electronegative sources, many novel phenomena are occurred, such as the collapse of astro-structure and blue sheath. The advective self-coagulation concept is proposed to explain the origin of blue sheath and based on the advective type, the anion Bohm’s criterion is defined. Ar/SF6 discharge generates many types of anions and cations. At the ambi-polar self-coagulation, each charged heavy species has its own astro-structure, semi-circle. Since they are coagulated, they can be treated as point-charge models. The expelling effect of Coulomb force existing between the individual cation or anion astro-structures, leads to the collapse or at least disperse of relatively weak astro-structure. The inertial effect of density quantity explains the characteristic of self-coagulation (the lighter the species, the easy it self-coagulates), and anti-collective property of astro-structure is observed in the collapse of astro-structure that creates spatially radiative charge cloud. This is different to the collective interaction of plasma whether electropositive or electronegative that shields non-neutral region into a Debye length [39]. There is a competition between the electron-ion system and anion-cation system. At low electronegativity, such as Ar/O2 source, the electron-ion system is more coupled and hence the conventional ambi-polar diffusion potential is formed (refer to Figure 1(d)). Nevertheless, at high electronegativity, the anion-cation system is a tight couple and the ambi-polar self-coagulation of them is more predominant. Hence the potential is collapsed (refer to Figure 19) and so, the electron dynamics are more independent. Besides, the strong physical coagulation by means of potential barrel pushing that occurs in the early discharge and the static gentle chemical coagulation happened in the late discharge stage are compared and they give different types of density border under the coil, i.e., cliffy and smooth, in Figure 18. The coexistence of astro-structure and dispersed discharge background waits for the validation of related experiments that utilize either the laser detachment technique of anion that is assisted by probe diagnostic [40] or spectroscopy measurement, directly [41].

Author Contributions

For research articles with several authors, a short paragraph specifying their individual contributions must be provided. The following statements should be used “Conceptualization, Z.S.X.; methodology, Z.S.X; software, T.Y.; validation, T.Y.; formal analysis, Z.S.X.; investigation, Z.S.X.; resources, T.Y.; data curation, T.Y.; writing—original draft preparation, Z.S.X.; writing—review and editing, T.Y.; visualization, T.Y.; supervision, T.Y. All authors have read and agreed to the published version of the manuscript.”.

Data Availability Statement

Data available on request from the authors.

Acknowledgments

In this section, you can acknowledge any support given which is not covered by the author contribution or funding sections. This may include administrative and technical support, or donations in kind (e.g., materials used for experiments).

Conflicts of Interest

The authors declare no conflicts of interest.

References

  1. Liberman, M.A.; Lichtenberg, A.J. Principles of Plasma Discharges and Materials processing, 2nd ed.; Wiley-Interscience: New York, America, 2005; pp. 1–6. [Google Scholar]
  2. Chabert, P.; Braithwaite, N. Physics of Radio-Frequency Plasmas; Cambridge University Press: New York, America, 2011; pp. 1–9. [Google Scholar]
  3. Wang, S.; Xu, X.; Wang, Y.N. Numerical investigation of ion energy distribution and ion angle distribution in a dual-frequency capacitively coupled plasma with a hybrid model. Phys. Plasmas 2007, 14, 113501. [Google Scholar] [CrossRef]
  4. Zhao, S.X. , Xu, X., Li, X.C., Wang, Y.N. Fluid simulation of the E-H model transition in inductively coupled plasma. J. Appl. Phys. 2009, 105, 083306. [Google Scholar] [CrossRef]
  5. Zhao, S.X. , Gao, F., Wang, Y.N. Dynamic investigation of mode transition in inductively coupled plasma with a hybrid model. J. Phys. D: Appl. Phys. 2009, 42, 225203. [Google Scholar] [CrossRef]
  6. Lichtenberg, A.J.; Vahedi, V.; Lieberman, M.A. Modeling electronegative plasma discharges. J. Appl. Phys. 1994, 75, 2339–2347. [Google Scholar] [CrossRef]
  7. Lichtenberg, A.J. , Kouznetsov, I.G., Lee, Y.T., Lieberman, M.A., Kaganovich, I.D., Tsendin, L.D. Modelling plasma discharges at high electronegativity. Plasma Sources Sci. Technol. 1997, 6, 437–449. [Google Scholar] [CrossRef]
  8. Kouznetsov, I.G. , Lichtenberg, A.J., Lieberman, M.A. Internal sheaths in electronegative discharges. J. Appl. Phys. 1999, 86, 4142–4153. [Google Scholar] [CrossRef]
  9. Lampe, M. , Manheimer, W.M., Fernsler, R.F., Slinker S.P., Joyce G. The physical and mathematical basis of stratification in electronegative plasmas. Plasma Sources Sci. Technol. 2004, 13, 15–26. [Google Scholar] [CrossRef]
  10. Sheridan, T.E. Double layers in a modestly collisional electronegative discharge. J. Phys. D: Appl. Phys. 1999, 32, 1761–1767. [Google Scholar] [CrossRef]
  11. Chabert, P.; Sheridan, T.E. Kinetic model for a low-pressure discharge with negative ions. J. Phys. D: Appl. Phys. 2000, 33, 1854–1860. [Google Scholar] [CrossRef]
  12. Franklin, R.N.; Snell, J. Are the oscillations found in electronegative plasmas at low pressure an artefact? J. Phys. D: Appl. Phys. 2000, 33, 1990–1995. [Google Scholar] [CrossRef]
  13. Kaganovich, I. Negative ion density fronts. Phys. Plasmas 2001, 8, 2540–2548. [Google Scholar] [CrossRef]
  14. Schulze, J.; Derzsi, A.; Dittmann, K.; Hemke, T.; Meichsner, J.; Donko, Z. Ionization by Drift and Ambipolar Electric Field in Electronegative Capacitive Radio Frequency Plasmas. Phys. Rev. Lett. 2011, 107, 275011. [Google Scholar] [CrossRef]
  15. Liu, Y.X.; Schungel, E.; Korolov, I.; Donko, Z.; Wang, Y.N.; Schulze, J. Experimental Observation and Computational Analysis of Striations in Electronegative Capacitively Coupled Radio-Frequency Plasmas. Phys. Rev. Lett. 2016, 116, 255002. [Google Scholar] [CrossRef] [PubMed]
  16. Zhao, S.X. Quasi-delta negative ions density of Ar/O2 inductively coupled plasma at very low electronegativity. Chin. Phys. B 2021, 30, 055201. [Google Scholar] [CrossRef]
  17. Zhao, S.X.; Li, J.Z. Delta distribution of electronegative plasma predicted by reformed spring oscillator dynamic equation with dispersing force. Chin. Phys. B 2021, 30, 055202. [Google Scholar] [CrossRef]
  18. Carlqvist, P. On the acceleration of energetic cosmic particles by electrostatic double layers. IEEE Trans. Plasma Sci. 1986, 14, 794–799. [Google Scholar] [CrossRef]
  19. Plihon, N.; Corr, C.S.; Chabert, P.; Raimbault, J.L. Periodic formation and propagation of double layers in the expanding chamber of an inductive discharge operating in Ar/SF6 mixtures. J. Appl. Phys. 2005, 98, 023306. [Google Scholar] [CrossRef]
  20. Hu, X.W. Fundamental of Plasma Theory; Peking University Press: Beijing, China, 1997; pp. 238–243. (In Chinese) [Google Scholar]
  21. Wang, W.H. Study on the closed fluid mechanics model based on the kinetic theory and self-consistent solution for the transport coefficients of heavy species. PhD. Thesis, Dalian University of Technology, Dalian, June 7th, 2023. (In Chinese). [Google Scholar]
  22. Wang, W.H.; Zhao, S.X.; Dai, Z.L. A self-consistent method for solving ion diffusion and mobility coefficients. Phys. Plasmas 2021, 28, 103503. [Google Scholar] [CrossRef]
  23. Wang, W.H.; Zhao, S.X.; Dai, Z.L. The impact of ion mobility coefficients on plasma discharge characteristics. Phys. Plasmas 2022, 29, 073501. [Google Scholar] [CrossRef]
  24. Qiu, J.L. Gaseous electronics; Huazhong Science and Technology University Press: Wuhan, China, 1999; pp. 36–39. (In Chinese) [Google Scholar]
  25. Plasma Data Exchange Project. Available online: https://fr.lxcat.net/instructions/ (accessed on 8 March 2020).
  26. Yang, W.; Zhao, S.X.; Wen, D.Q.; Liu, W.; Liu, Y.X.; Li, X.C.; Wang, Y.N. F atom kinetics in SF6/Ar inductively coupled plasmas. J. Vac. Sci. Technol. A 2016, 34, 031305. [Google Scholar] [CrossRef]
  27. Mao, M.; Wang, Y.N.; Bogaerts, A. Numerical study of the plasma chemistry in inductively coupled SF6 and SF6/Ar plasmas used for deep silicon etching application. J. Phys. D: Appl. Phys. 2011, 44, 435202. [Google Scholar] [CrossRef]
  28. Lallement, L.; Rhallabi, A.; Cardinaud, C.; Peignon-Fernandez, M.C.; Alves, L.L. Global model and diagnostic of a low-pressure SF6/Ar inductively coupled plasma. Plasma Sources Sci. Technol. 2009, 18, 025001. [Google Scholar] [CrossRef]
  29. You, Z.W.; Dai, Z.L.; Wang, Y.N. Simulations of capacitively coupled dual-frequency N2, O2, N2/O2 discharge: effects of external parameters on plasma characteristics. Plasma Sci. Technol. 2014, 16, 335–343. [Google Scholar] [CrossRef]
  30. Gudmundsson, J.T.; Kouznetsov, I.G.; Patel, K.K.; Lieberman, M.A. Electronegativity of low-pressure high-density oxygen discharges. J. Phys. D: Appl. Phys. 2001, 34, 1100–1109. [Google Scholar] [CrossRef]
  31. Wang, Y.H.; Liu, W.; Zhang, Y.R.; Wang, Y.N. Fluid simulation of inductively coupled Ar/O2 plasma: Comparisons with experiment. Chin. Phys. B 2015, 24, 095203. [Google Scholar] [CrossRef]
  32. Brezmes, A.O.; Breitkopf, C. Fast and reliable simulations of argon inductively coupled plasma using COMSOL. Vacuum 2015, 116, 65–72. [Google Scholar] [CrossRef]
  33. Levko, D. Decay of a low-pressure oxygen magnetized and unmagnetized plasma. J. Appl. Phys. 2014, 116, 103304. [Google Scholar] [CrossRef]
  34. Hsu, C.C.; Neirode, M.A.; Coburn, J.W.; Graves, D.B. Comparison of model and experiment for Ar, Ar/O2, and Ar/O2/Cl2 inductively coupled plasmas. J. Phys. D: Appl. Phys. 2006, 39, 3272–3284. [Google Scholar] [CrossRef]
  35. Takechi, K.; Lieberman, M.A. Effect of Ar addition to an O2 plasma in an inductively coupled traveling wave driven, large area plasma source: O2/Ar mixture plasma modeling and photoresist etching. J. App. Phys. 2001, 90, 3205–3211. [Google Scholar] [CrossRef]
  36. Graves, D.B.; Kiehlbauch, M.K. Inductively coupled plasmas in oxygen: Modeling and experiment. J. Vac. Sci. Technol. A 2003, 21, 660–670. [Google Scholar] [CrossRef]
  37. Zhao, S.X. Non-monotonic behavior of electron temperature in argon inductively coupled plasma and its analysis via novel electron mean energy equation. Phys. Plasmas 2018, 25, 033516. [Google Scholar] [CrossRef]
  38. Zhao, S.X.; Sun, Y.H. Discharge structure theory of highly electronegative plasma. J. Phys. D: Appl. Phys. submitted. 2024. [Google Scholar]
  39. Chen, F.F. Introduction to Plasma Physics and Controlled Fusion, 3rd ed.; Springer: Switzerland, 2018; pp. 7–10. [Google Scholar]
  40. Du, P. C.; Gao, F.; Wang, X.K.; Liu, Y.X.; Wang, Y.N. Measurement of electronegativity during the E to H mode transition in a radio frequency inductively coupled Ar/O2 plasma. Chin. Phys. B 2021, 30, 035202. [Google Scholar] [CrossRef]
  41. Gao, F.; Liu, W.; Zhao, S.X. , Zhang, Y.R.; Sun, C.S.; Wang, Y.N. Changes of the electron dynamics in hydrogen inductively coupled plasma. Chin. Phys. B 2013, 22, 115205. [Google Scholar] [CrossRef]
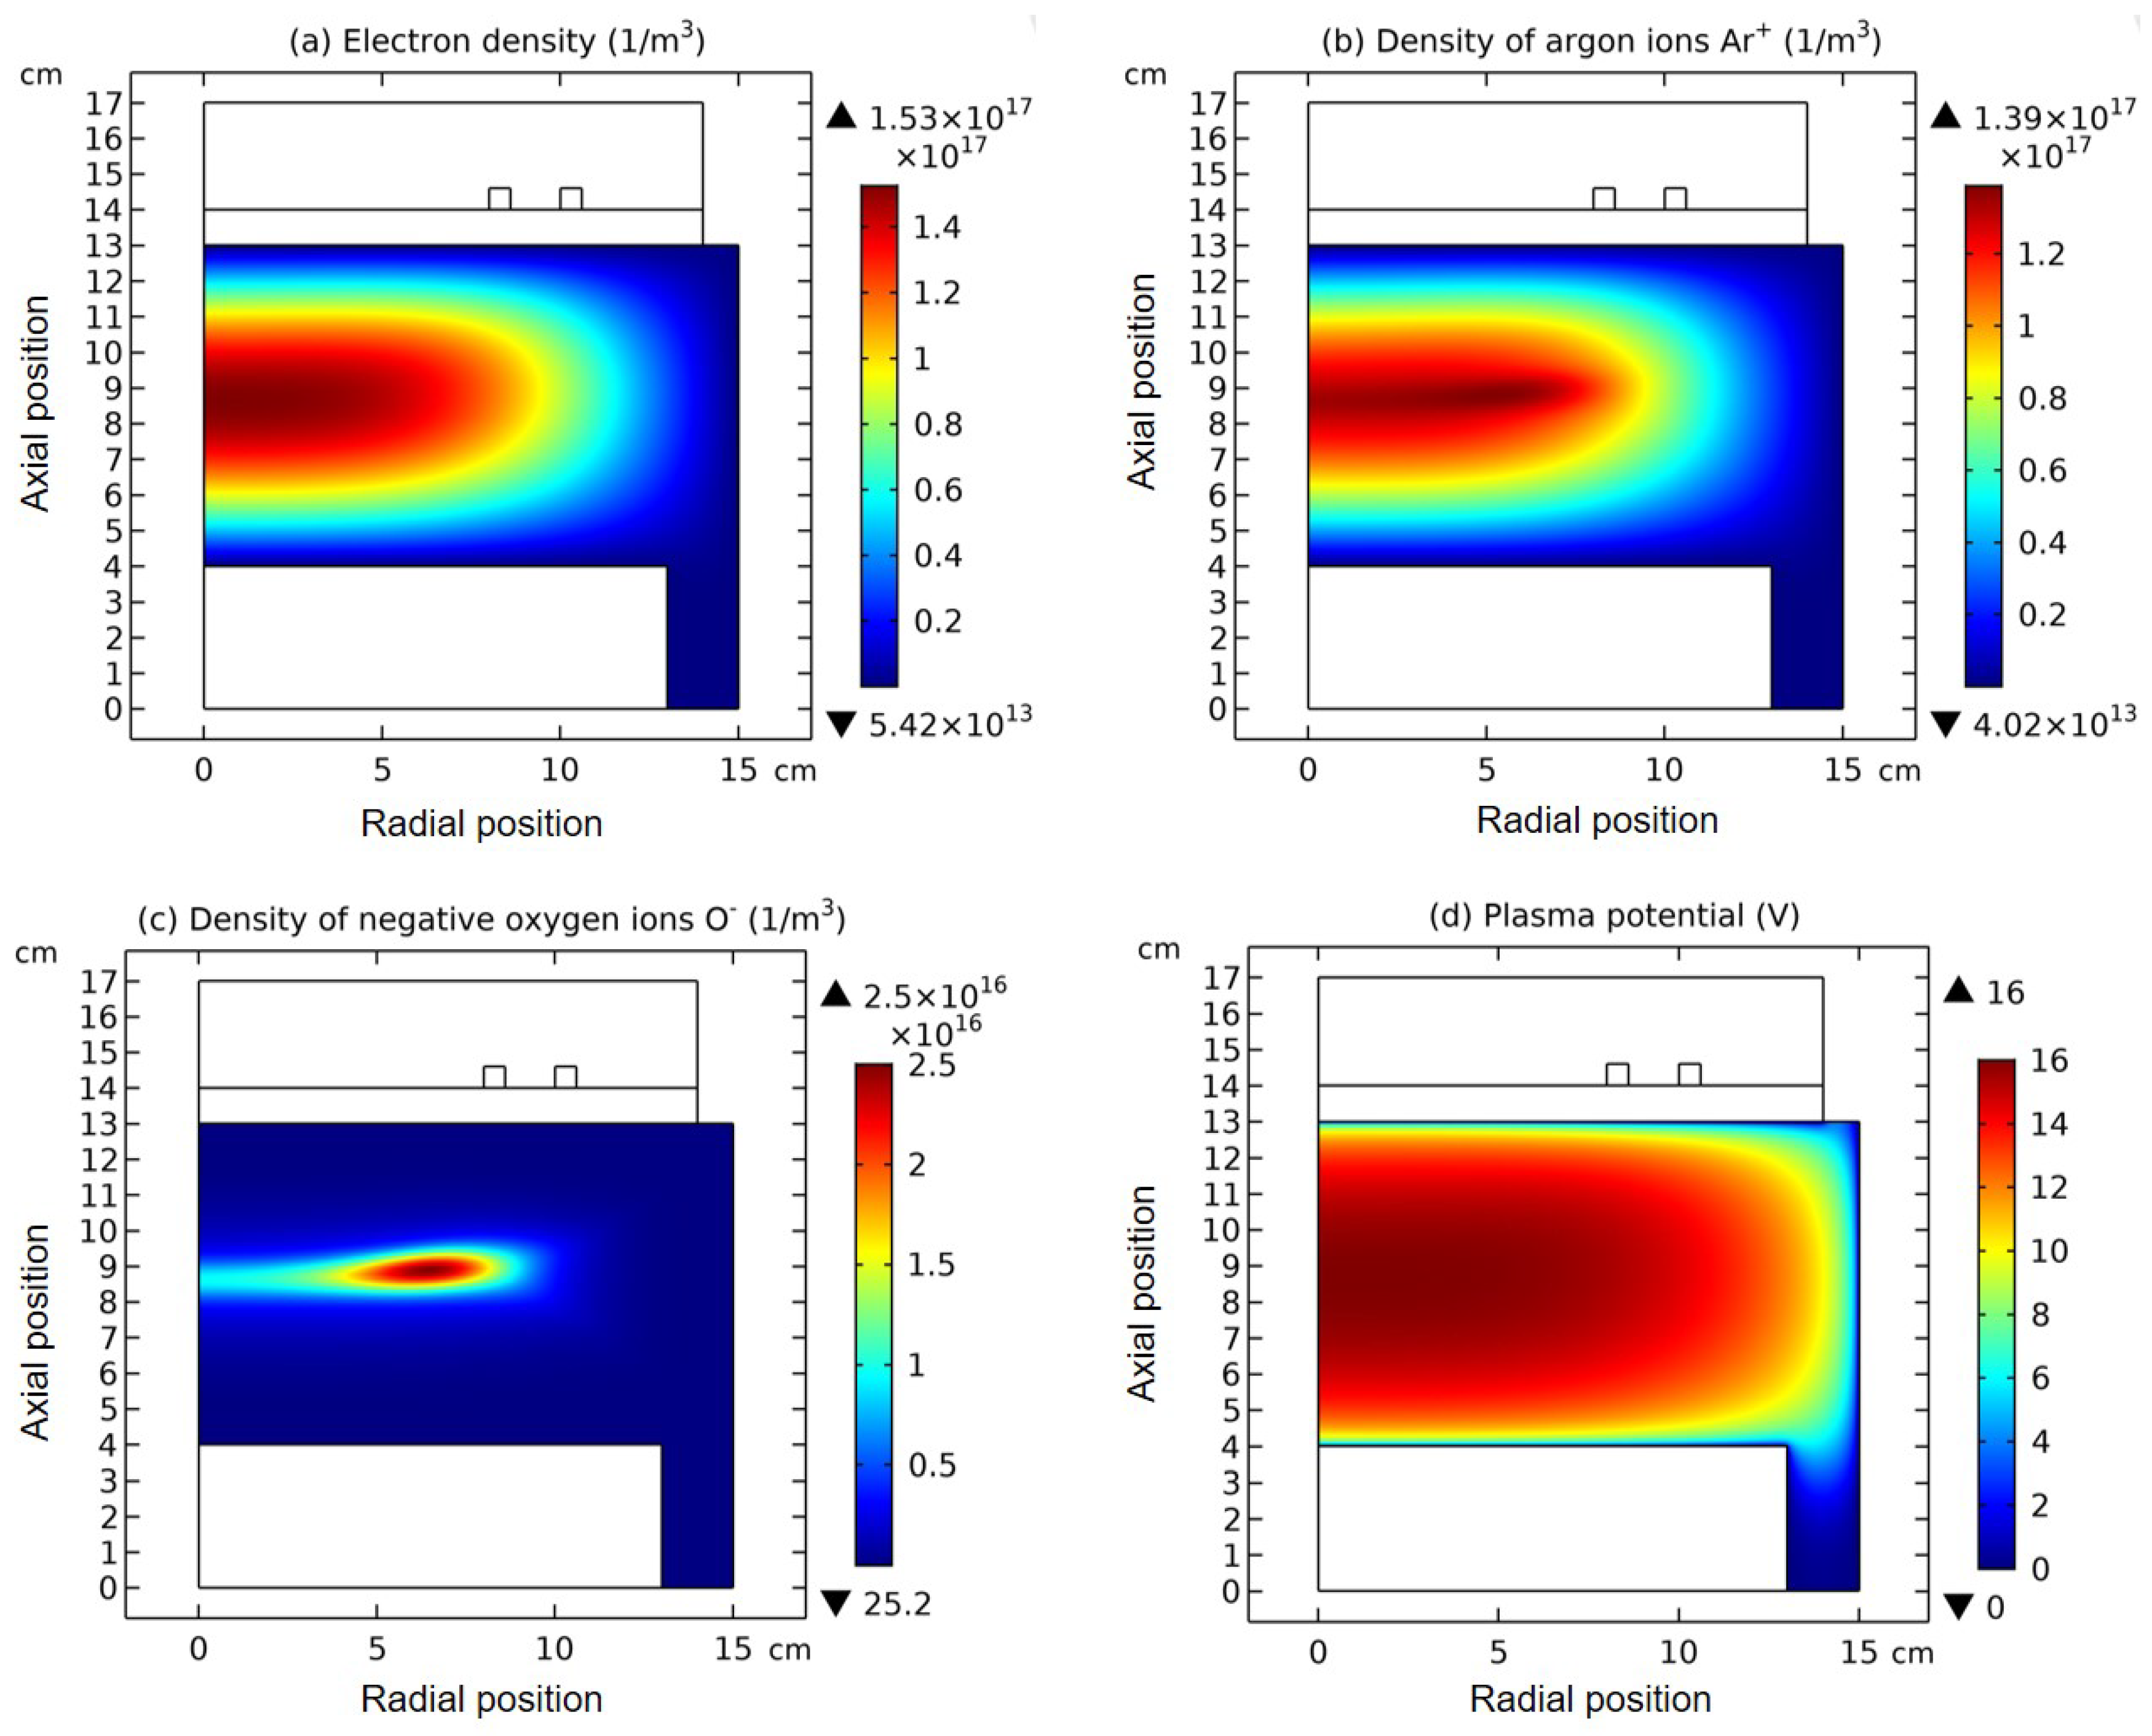
Figure 1. Simulated two-dimensional profiles of (a) electrons density, (b) Ar+ density, (c) O- density, and (d) plasma potential in Ar/O2 ICP plasma, by means of fluid model and at the discharge conditions of 300W, 30mTorr and 10% O2 content.
Preprints 115954 g001
Figure 2. Simulated two-dimensional profiles of (a) O- density, (b) summed reaction rate of O-, (c) reaction rate for O- generation, and (d) reaction rate for O- loss in Ar/O2 ICP plasma, by means of fluid model and at the discharge conditions of 300W, 30mTorr, and 10% O2 content.
Preprints 115954 g002
Figure 3. Simulated two-dimensional profiles of (a) O- density and (b) net charge density in Ar/O2 ICP plasma, by means of fluid model. The discharge conditions are the same as the Figure 1 and Figure 2.
Preprints 115954 g003
Figure 4. Simulated two-dimensional profiles of (a) summed anions density and (b) net charge density in Ar/SF6 ICP plasma, by means of fluid model and at the discharge conditions of 300W, 90mTorr and 10% SF6 content. .
Preprints 115954 g004
Figure 5. Simulated two-dimensional profiles of certain individual anions densities, F-, SF6- and SF5- at two simulating times, 10 4 s and 1.0 s . Panels (a,c,e) present the densities of F-, SF6- and SF5- at an early time, 10 4 s , and panels (b,d,f) present the densities of F-, SF6- and SF5- at a late time, 1.0 s . The discharge conditions are the same as the Figure 4.
Preprints 115954 g005
Figure 6. Simulated two-dimensional profiles of certain individual cations densities, SF3+ and Ar+, at three simulating times, 10 4 s , 10 2 s , and 1.0 s . Panels (a,d) present the densities of SF3+ and Ar+ at an early time, 10 4 s . Panels (b,e) present the densities of SF3+ and Ar+ at an intermediate time, 10 2 s . Panels (c,f) present the densities of SF3+ and Ar+ at a late time, 1.0 s . The discharge conditions are the same as the Figure 4.
Preprints 115954 g006
Figure 7. Simulated two-dimensional profiles of cation density, SF3+, at four simulating times, (a) 10 4 s , (b)  3.2 × 10 4 s , (c)  5.6 × 10 4 s , and (d)  10 3 s . The discharge conditions are the same as the Figure 4.
Preprints 115954 g007
Figure 8. Simulated two-dimensional profiles of net charge density of Ar/SF6 ICP plasma at four simulating times, (a) 10 4 s , (b)  3.2 × 10 4 s , (c)  5.6 × 10 4 s , and (d)  10 3 s . The discharge conditions are the same as the Figure 4.
Preprints 115954 g008
Figure 9. Simulated two-dimensional profiles of cation density, F+, at four simulating times, (a) 10 4 s , (b)  10 3 s , (c)  10 2 s , and (d)  10 1 s . The discharge conditions are the same as the Figure 4.
Preprints 115954 g009
Figure 10. Simulated two-dimensional profile of net chemical source, F+, in (a) full range and (b) numerically truncated range. Refer to the maxima of legends of panels (a,b). The discharge conditions are the same as the Figure 4.
Preprints 115954 g010
Figure 11. Simulated two-dimensional profiles of cation density, S+, at six early simulating times, (a) 10 4 s , (b)  1.8 × 10 4 s , (c)  3.2 × 10 4 s , (d)  5.6 × 10 4 s , (e)  10 3 s , and (f)  1.8 × 10 3 s . The discharge conditions are the same as the Figure 4.
Preprints 115954 g011
Figure 12. Simulated two-dimensional profiles of cation density, S+, at six late simulating times, (a) 10 2 s , (b)  1.8 × 10 2 s , (c)  3.2 × 10 2 s , (d)  5.6 × 10 2 s , (e)  10 1 s , and (f)  1.0 s . The discharge conditions are the same as the Figure 4.
Preprints 115954 g012
Figure 13. Simulated two-dimensional profile of net chemical source, S+, in (a) full range and (b) numerically truncated range. Refer to the maxima of legends of panels (a,b). The discharge conditions are the same as the Figure 4.
Preprints 115954 g013
Figure 14. Simulated two-dimensional profiles of O- density at early four simulating times, (a)  10 7 s , (b)  10 6 s , (c)  5.1 × 10 6 s , and (d)  10 5 s , by means of fluid model. The discharge conditions are the same as the Figure 1 and Figure 2. .
Preprints 115954 g014
Figure 15. Simulated two-dimensional profiles of O- density at late four simulating times, (a)  10 5 s , (b)  1.8 × 10 5 s , (c)  2.4 × 10 5 s , and (d)  3.2 × 10 5 s , by means of fluid model. The discharge conditions are the same as the Figure 1 and Figure 2.
Preprints 115954 g015
Figure 19. Simulated two-dimensional profiles of plasma potential at two simulating times, (a)  10 5 s (before self-coagulation) and (b)  10 4 s (after self-coagulation), in Ar/SF6 ICP plasma. The discharge conditions are the same as the Figure 4. The potential collapses along with the ambi-polar self-coagulation of ions.
Preprints 115954 g019
Figure 22. Simulated density peaks of all considered cation species in Ar/SF6 ICP plasma, by means of fluid model at a simulating time before the collapse happens. The discharge conditions are the same as the Figure 4. The self-coagulated density peaks of SF3+ and Ar+ are the closest to each other, hence treated as the point charge models (positive type) with equal charge amount. .
Preprints 115954 g022
Figure 23. Simulated density peaks of all considered anion species in Ar/SF6 ICP plasma, by means of fluid model at a simulating time before the collapse happens. The discharge conditions are the same as the Figure 4. The self-coagulated density peak of F- and the summed peak of SF6- and SF5- are the closest to each other, hence treated as the point charge models (negative type) with equal charge amount.
Preprints 115954 g023
Figure 24. (a) Formula of expelling and Coulomb force between two positive point-charge models. Herein, Q 1 and Q 2 are the charge amounts of two point-charges, and Q T is the total charge amount of them. ε 0 and l are the vacuum permittivity and the distance between them. (b) A function, f x , is deduced from panel (a) and its curve at assumed constant, Q T = 10 ( a . u . ) , is plotted. As seen, the extremum is gotten when the total charge amount is averaged among the two point-charges.
Preprints 115954 g024
Figure 25. Simulated axial profiles of net chemical source of electrons at three simulating times, 10 5 s , 10 4 s , and 10 3 s , given by fluid model in Ar/SF6 ICP plasma. The discharge conditions are the same as the Figure 4. At later times, 10 4 s , and 10 3 s , the negative chemical source and quasi- free diffusion (refer to the potential collapse in Figure 19) consist of its own monopolar self-coagulation in the yellow-high lightened periphery of semi-circle astro-structure. .
Preprints 115954 g025
Table 2. Ar/SF6 Surface reaction set considered in the model.
No. Surface reaction Sticking coefficient Ref.
1 SF x + + wall SF x x = 1 5 1 [26,27]
2 F + + wall F 1 [26,27]
3 F 2 + + wall F 2 1 [26,27]
4 S + + wall S 1 [26,27]
5 F + wall 1 / 2 F 2 0.02 [28]
6 Ar + + wall Ar 1 [26,27]
7 Ars + wall Ar 1 [26,27]
Table 3. Chemical reactions for Ar/O2 discharges included in the fluid model.
No. Reaction Rate coefficient(cm3/s) Threshold (eV) References
1 e + O 2 e + O 2 4.7 × 10 8 T e 0.5 3 T e m e / m n [29]
2 e + O 2 2 e + O 2 + 9.0 × 10 10 T e 0.5 exp 12.6 / T e 12.06 [29]
3 e + O 2 O + O 8.8 × 10 11 exp 4.4 / T e 3.637 [30]
4 e + O 2 e + O + O + 7.1 × 10 11 T e 0.5 exp 17.0 / T e 17 [29]
5 e + O 2 2 e + O + O + 5.3 × 10 10 T e 0.9 exp 20.0 / T e 20 [30]
6 e + O 2 e + O 2 * 1.7 × 10 9 exp 3.1 / T e 0.98 [29]
7 e + O 2 e + O * + O 5.0 × 10 8 exp 8.4 / T e 8.57 [30]
8 e + O 2 e + 2 O 4.2 × 10 9 exp 4.4 / T e 6.4 [30]
9 e + O 2 e + O + 9.0 × 10 9 T e 0.7 exp 13.0 / T e 13 [30]
10 e + O e + O * 4.2 × 10 9 exp 2.25 / T e 1.97 [30]
11 e + O * e + O 8.0 × 10 9 -1.97 [30]
12 e + O * 2 e + O + 9.0 × 10 9 T e 0.7 exp 11.6 / T e 11.6 [30]
13 e + O 2 e + O 2.0 × 10 7 exp 5.5 / T e 5.5 [30]
14 e + O 2 + 2 O 5.2 × 10 9 / T e -6.96 [30]
15 e + O 2 * e + O 2 5.6 × 10 9 exp 2.2 / T e -0.98 [29]
16 e + O 2 * O + O 2.28 × 10 10 exp 2.29 / T e 5.19 [31]
17 e + O 2 * 2 e + O 2 + 9.0 × 10 10 T e 2.0 exp 11.6 / T e 11.08 [30]
18 e + O 2 * e + 2 O 4.2 × 10 9 exp 4.6 / T e 5.42 [30]
19 e + O 2 * e + O * + O 2.04 × 10 8 exp 7.4 / T e 7.59 [31]
20 e + O 2 * 2 e + O + + O 5.3 × 10 10 T e 0.9 exp 19.0 / T e 17.7 [29]
21 e + Ar e + Ar Cross sectiona 15.6 [32]
22 e + Ar e + Ar * Cross section 11.50 [32]
23 e + Ar * e + Ar Cross section -11.50 [32]
24 e + Ar 2 e + Ar + Cross section 15.80 [32]
25 e + Ar * 2 e + Ar + Cross section 4.427 [32]
26 O + O 2 + O + O 2 1.0 × 10 7 [31]
27 O + O e + O 2 3.0 × 10 10 [33]
28 O + O + 2 O 2.7 × 10 7 300.0 / T n 0.5 [31]
29 O + O 2 + 3 O 1.0 × 10 7 [31]
30 O + + O 2 O + O 2 + 2.0 × 10 11 300.0 / T n 0.5 [33]
31 O 2 * + O 2 2 O 2 2.2 × 10 18 300.0 / T n [31]
32 O 2 * + O O 2 + O 2.0 × 10 16 [31]
33 O * + O 2 O 8.0 × 10 12 [33]
34 O * + O 2 O + O 2 * 1.0 × 10 12 [33]
35 O * + O 2 O + O 2 7.0 × 10 12 exp 67.0 / T n [33]
36 O + + O 2 * O + O 2 + 2.1 × 10 11 [31]
37 O + O 2 * O + O 2 + e 1.0 × 10 10 100.0 / T i 0.5 [31]
38 O 2 + Ar + O 2 + + Ar 1.1 × 10 10 [34]
39 O 2 * + Ar + O 2 + + Ar 1.1 × 10 10 [34]
40 O + Ar + O + + Ar 1.1 × 10 10 [34]
41 O * + Ar + O + + Ar 1.1 × 10 10 [34]
42 O + Ar + O + Ar 2.8 × 10 7 [31]
43 O 2 + + Ar O 2 + Ar + 5.5 × 10 11 [31]
44 O 2 + Ar * O + O + Ar 2.4 × 10 10 [35]
a The reaction rate is calculated based on related cross section and the Maxwellian electron energy distribution function. b T e is the electron temperature, in a unit of eV, and T n and T i are the neutrals and ions temperature, both equal to 300K. c * represent metastable species.
Table 4. Surface reactions for Ar/O2 discharges included in the fluid model.
No. Surface reactions Reference
1 O 2 + + wall O 2 [36]
2 O + + wall O [36]
3 O 2 * + wall O 2 [36]
4 O * + wall O [36]
5 O + wall O [36]
6 O + wall 1 / 2 O 2 [36]
7 O + wall 1 / 2 O 2 * [36]
8 Ar + + wall Ar [32]
9 Ar * + wall Ar [32]
Table 5. Reactions collection for O- generation.
No. Reaction
3 e + O 2 O + O
4 e + O 2 e + O + O +
16 e + O 2 * O + O
Table 6. Reactions collection for O- loss.
No. Reaction
13 e + O 2 e + O
26 O + O 2 + O + O 2
27 O + O e + O 2
28 O + O + 2 O
29 O + O 2 + 3 O
37 O + O 2 * O + O 2 + e
42 O + Ar + O + Ar
Disclaimer/Publisher’s Note: The statements, opinions and data contained in all publications are solely those of the individual author(s) and contributor(s) and not of MDPI and/or the editor(s). MDPI and/or the editor(s) disclaim responsibility for any injury to people or property resulting from any ideas, methods, instructions or products referred to in the content.
Copyright: This open access article is published under a Creative Commons CC BY 4.0 license, which permit the free download, distribution, and reuse, provided that the author and preprint are cited in any reuse.
Prerpints.org logo

Preprints.org is a free preprint server supported by MDPI in Basel, Switzerland.

Subscribe

© 2024 MDPI (Basel, Switzerland) unless otherwise stated