Submitted:
23 August 2024
Posted:
24 August 2024
You are already at the latest version
Abstract
Keywords:
Introduction
Materials and methods
Recombinant EcFtsZ
Extraction of EcFtsZ
Glutamate Polymerization Cycles
Turbidity Assay
GTPase Activity
Size-Exclusion Chromatography
V (nm3) = 1.212 x 10⁻³ (nm3/Da) x M (Da)
V = (1.212 x 10⁻³ x M) nm3
Chemical Crosslinking
Sedimentation Gradient
Determination of Hydrodynamic Parameters
Protein-Protein Interaction Prediction Program
Other Procedures
Results
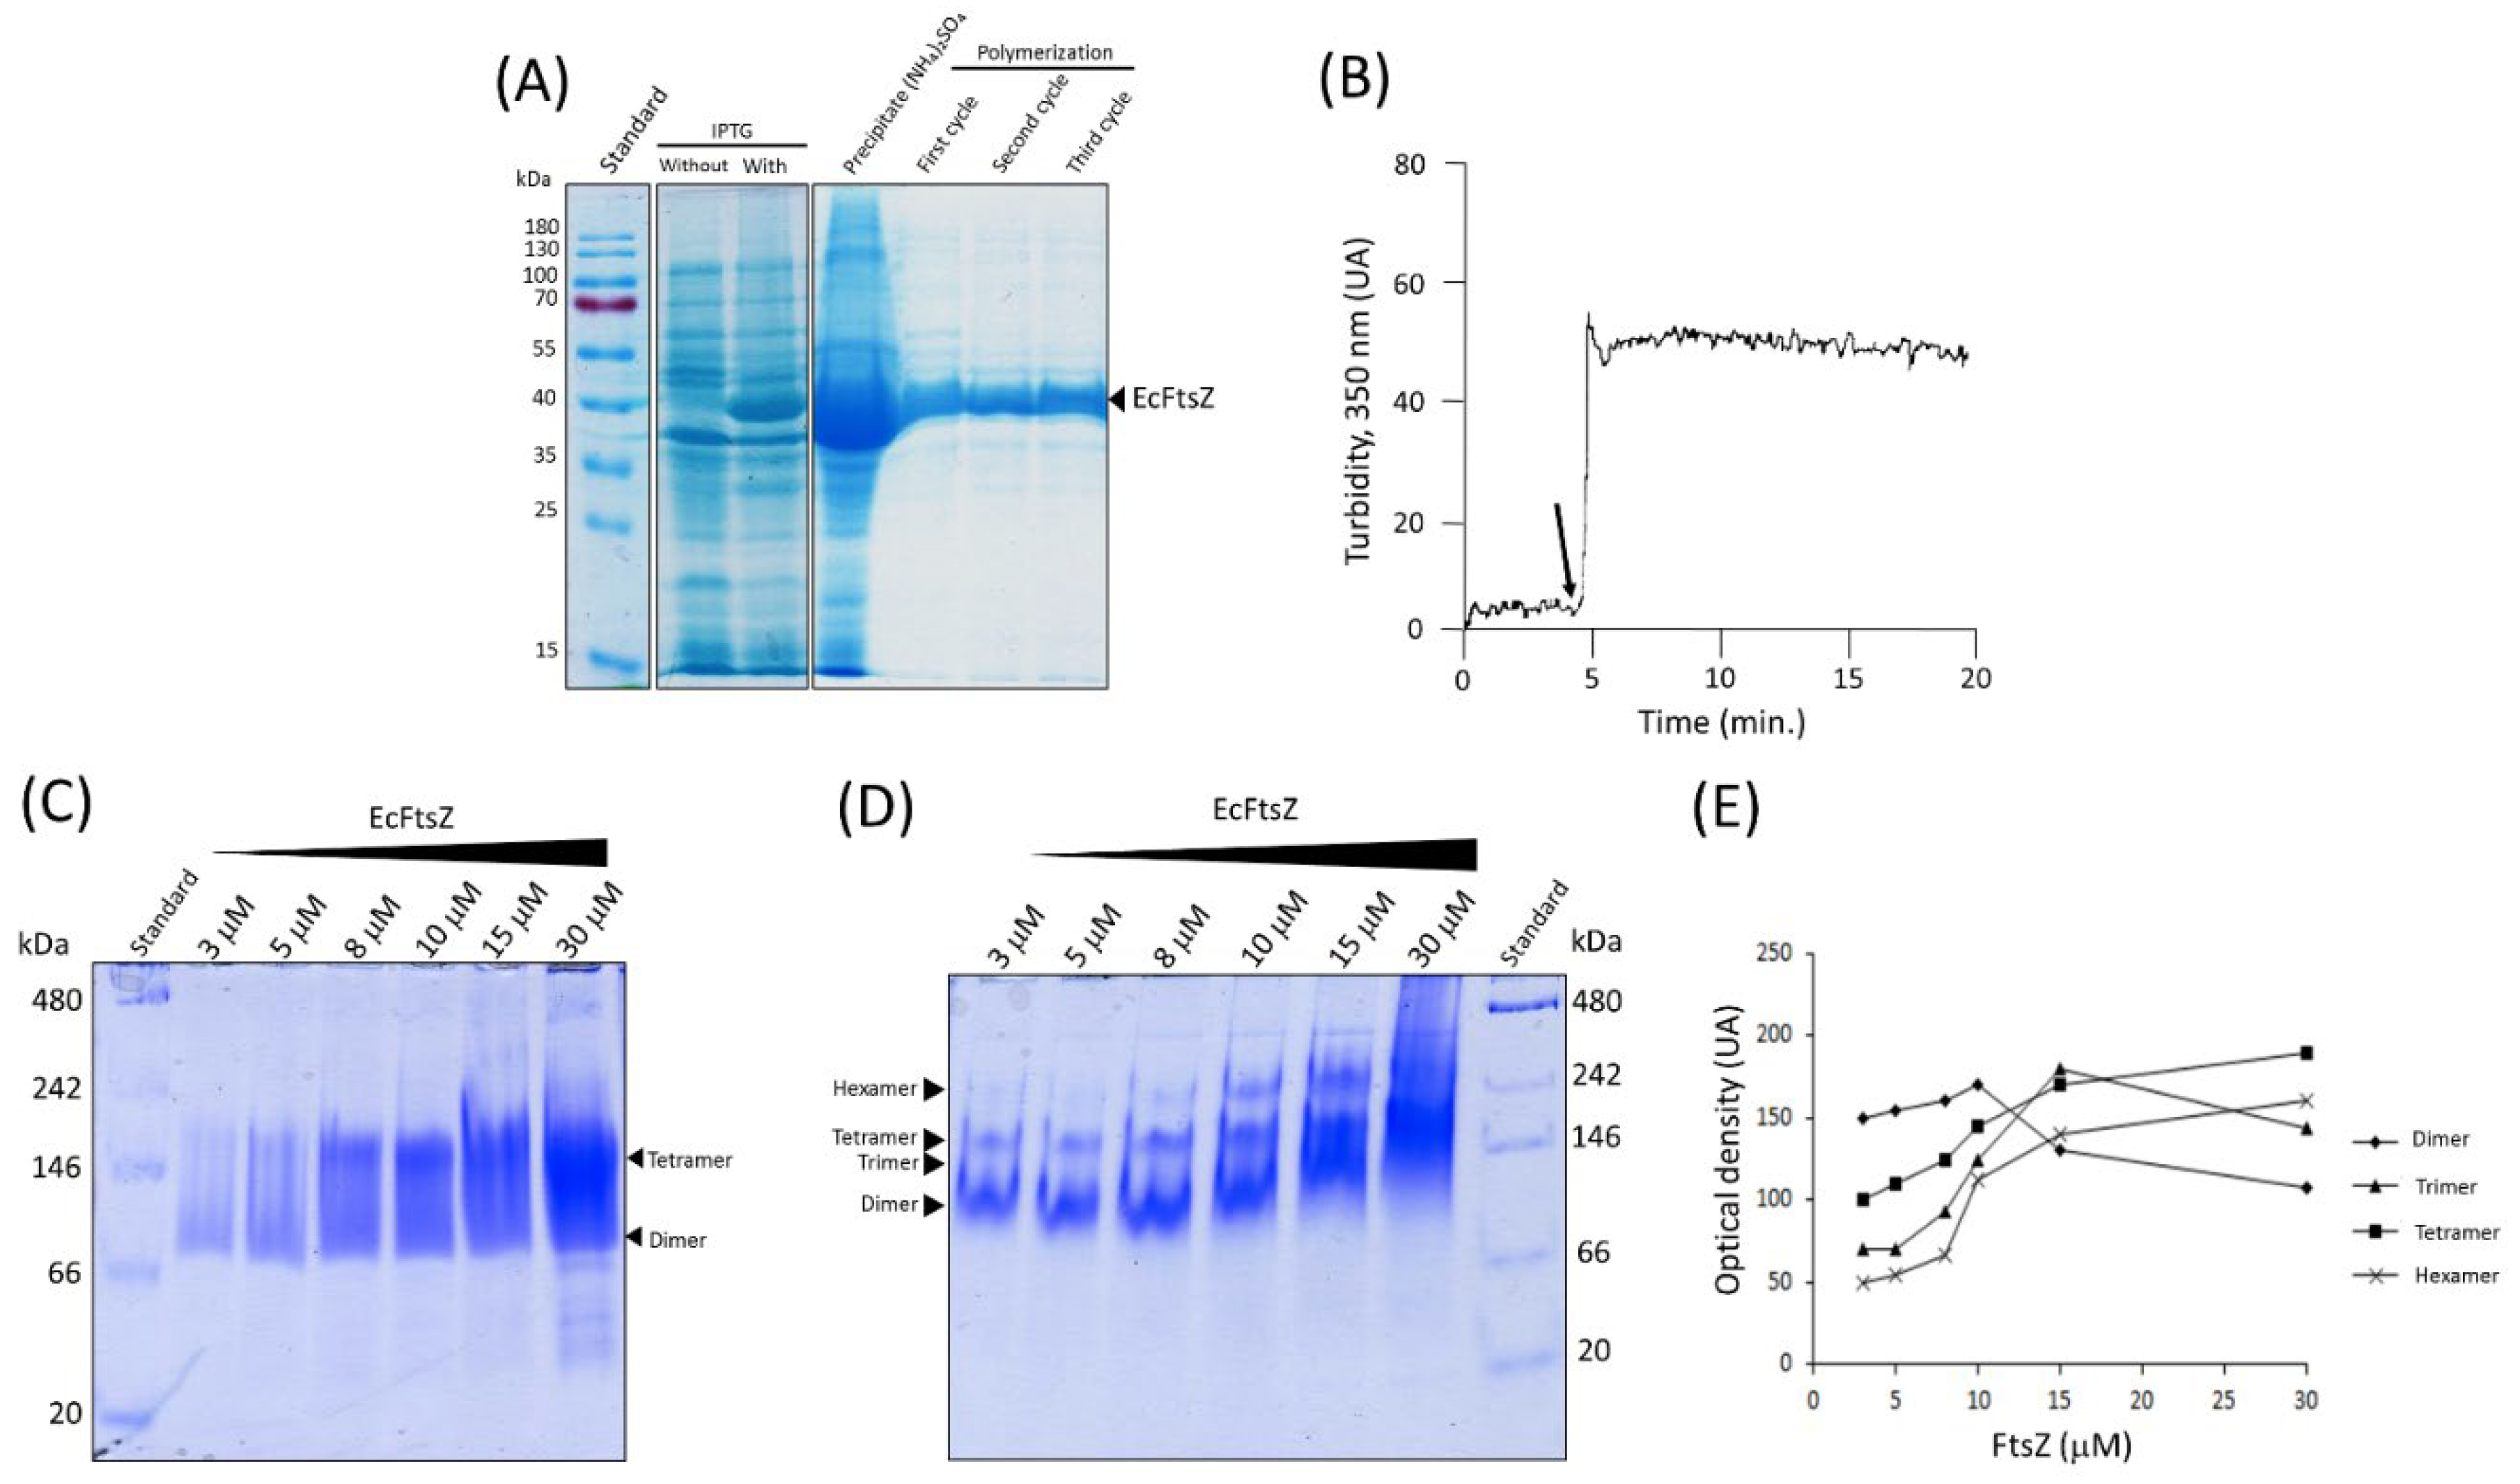
Functional Properties of Purified EcFtsZ
Native PAGE of Purified EcFtsZ
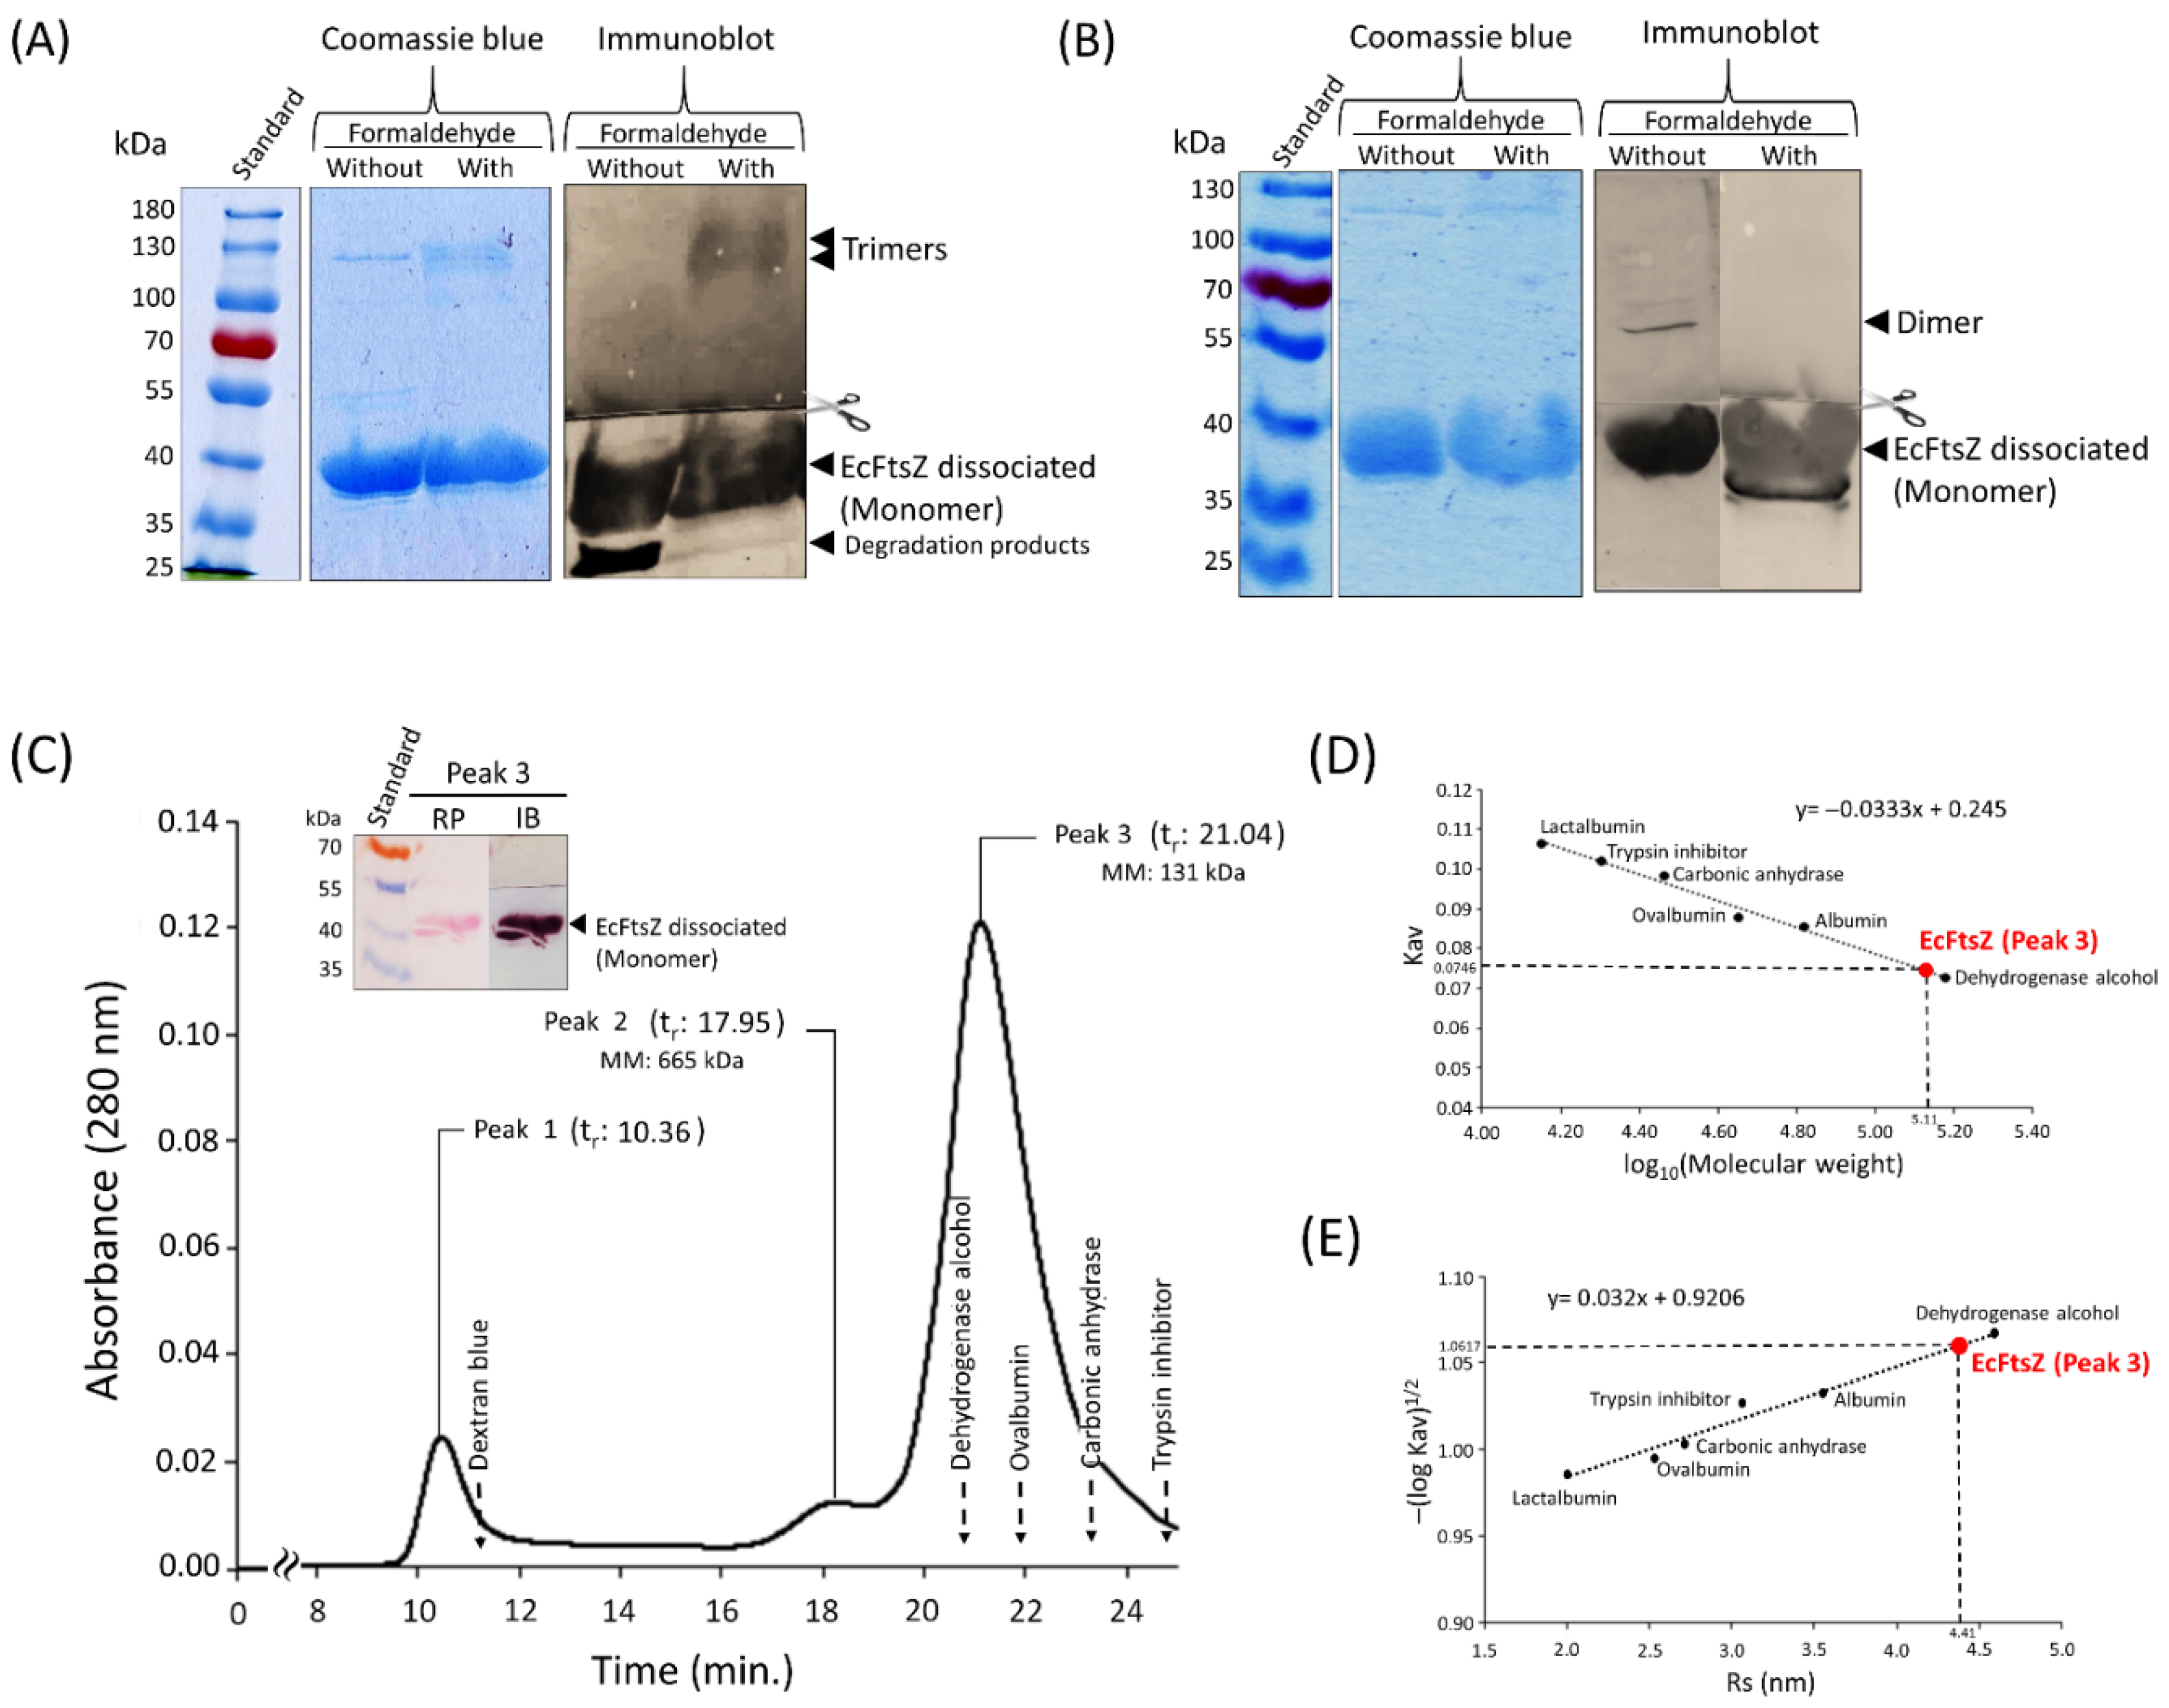
Chemical Cross-Linking
Size-Exclusion Chromatography
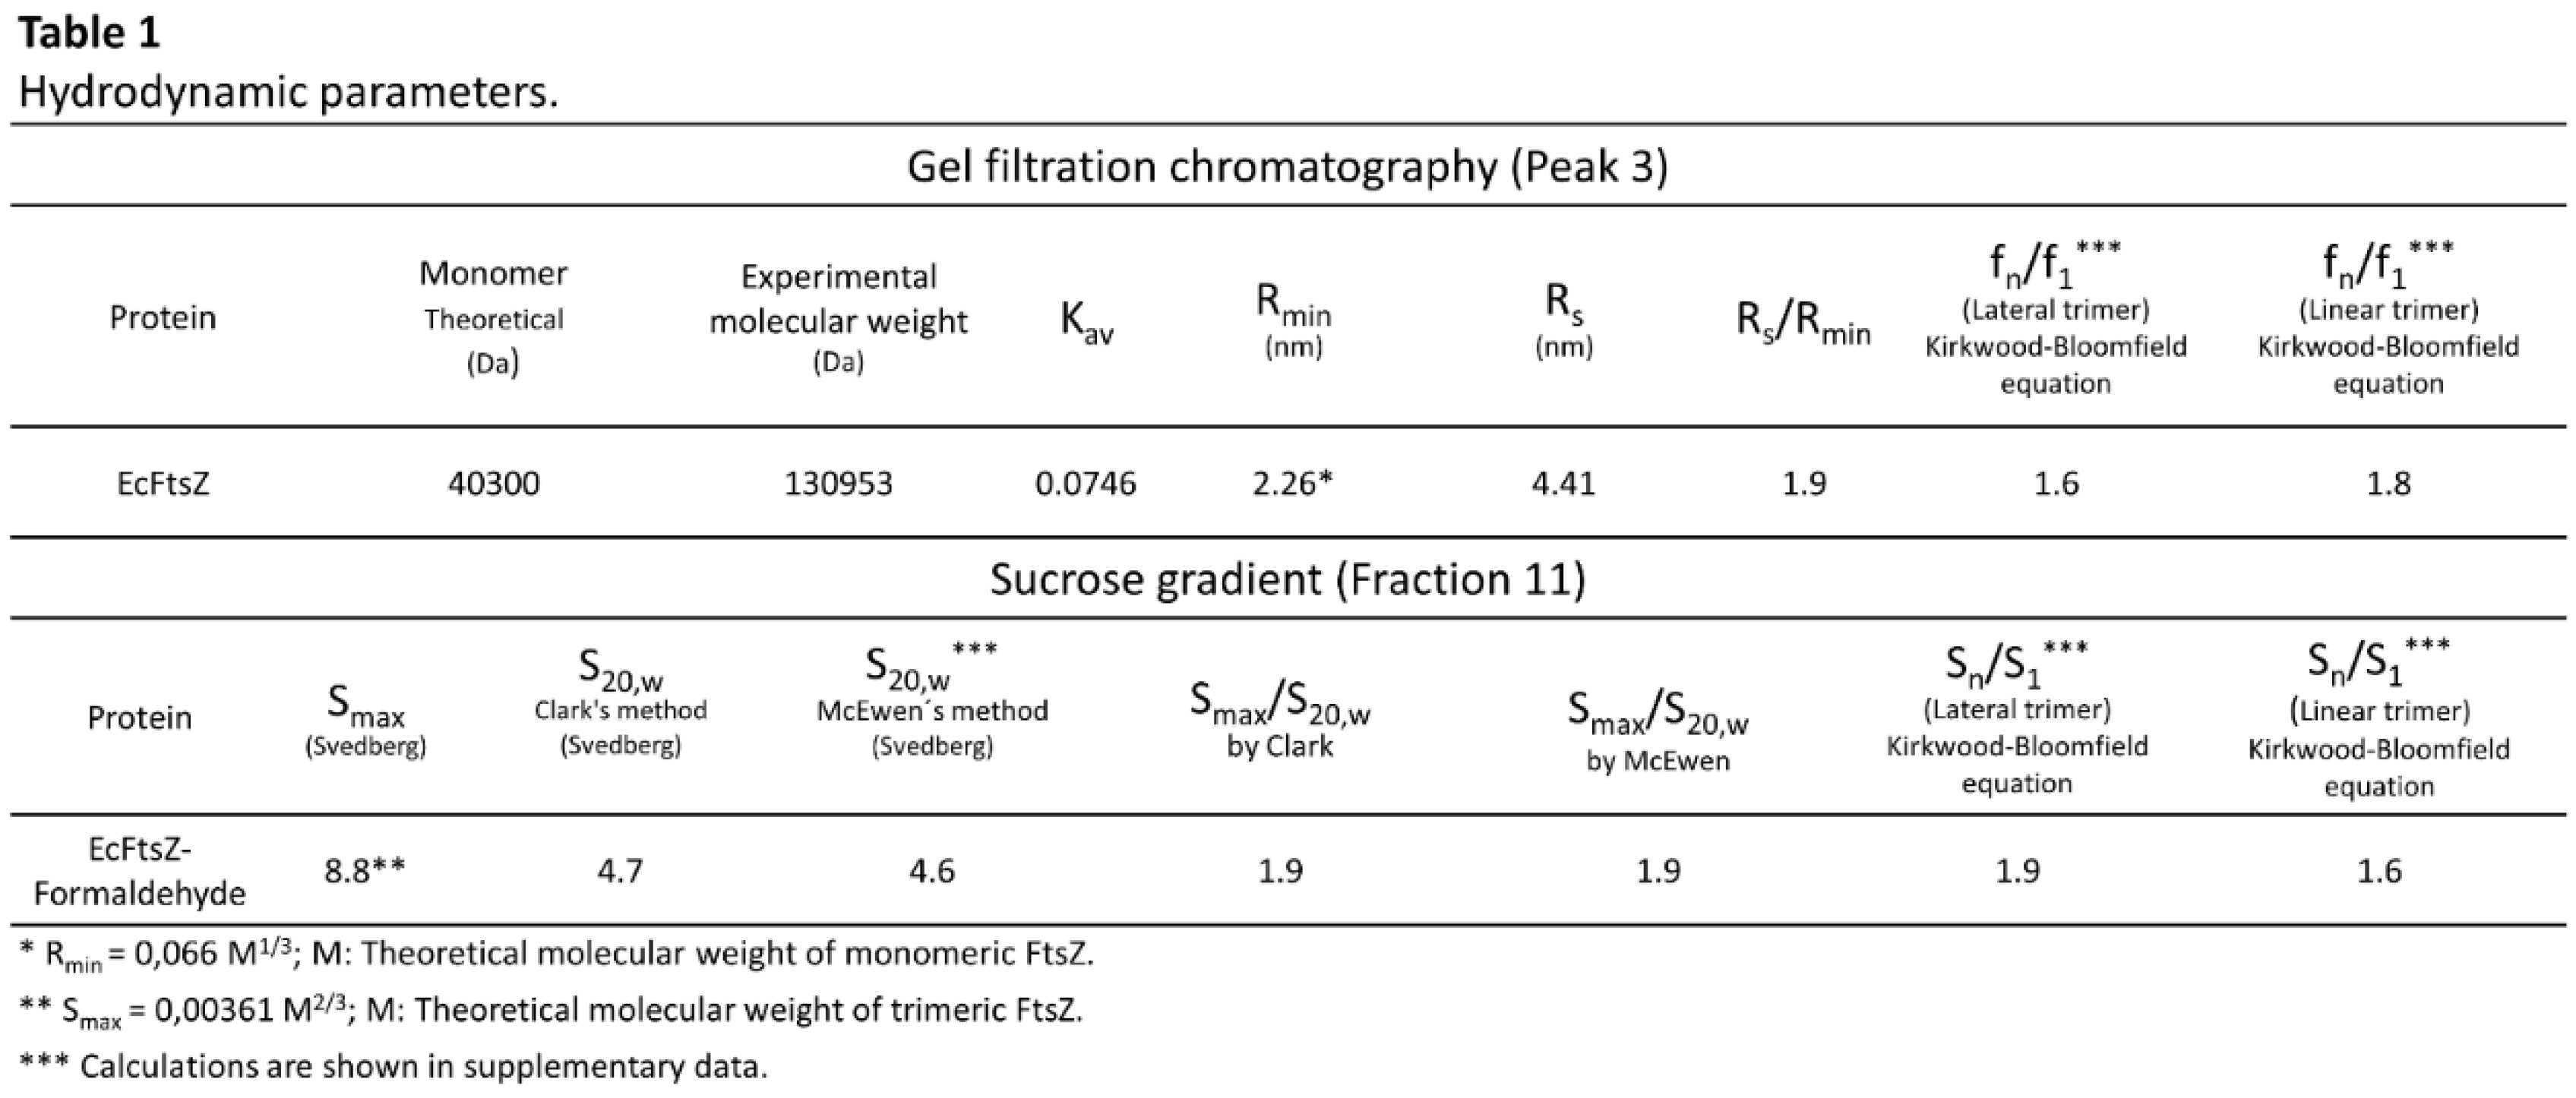
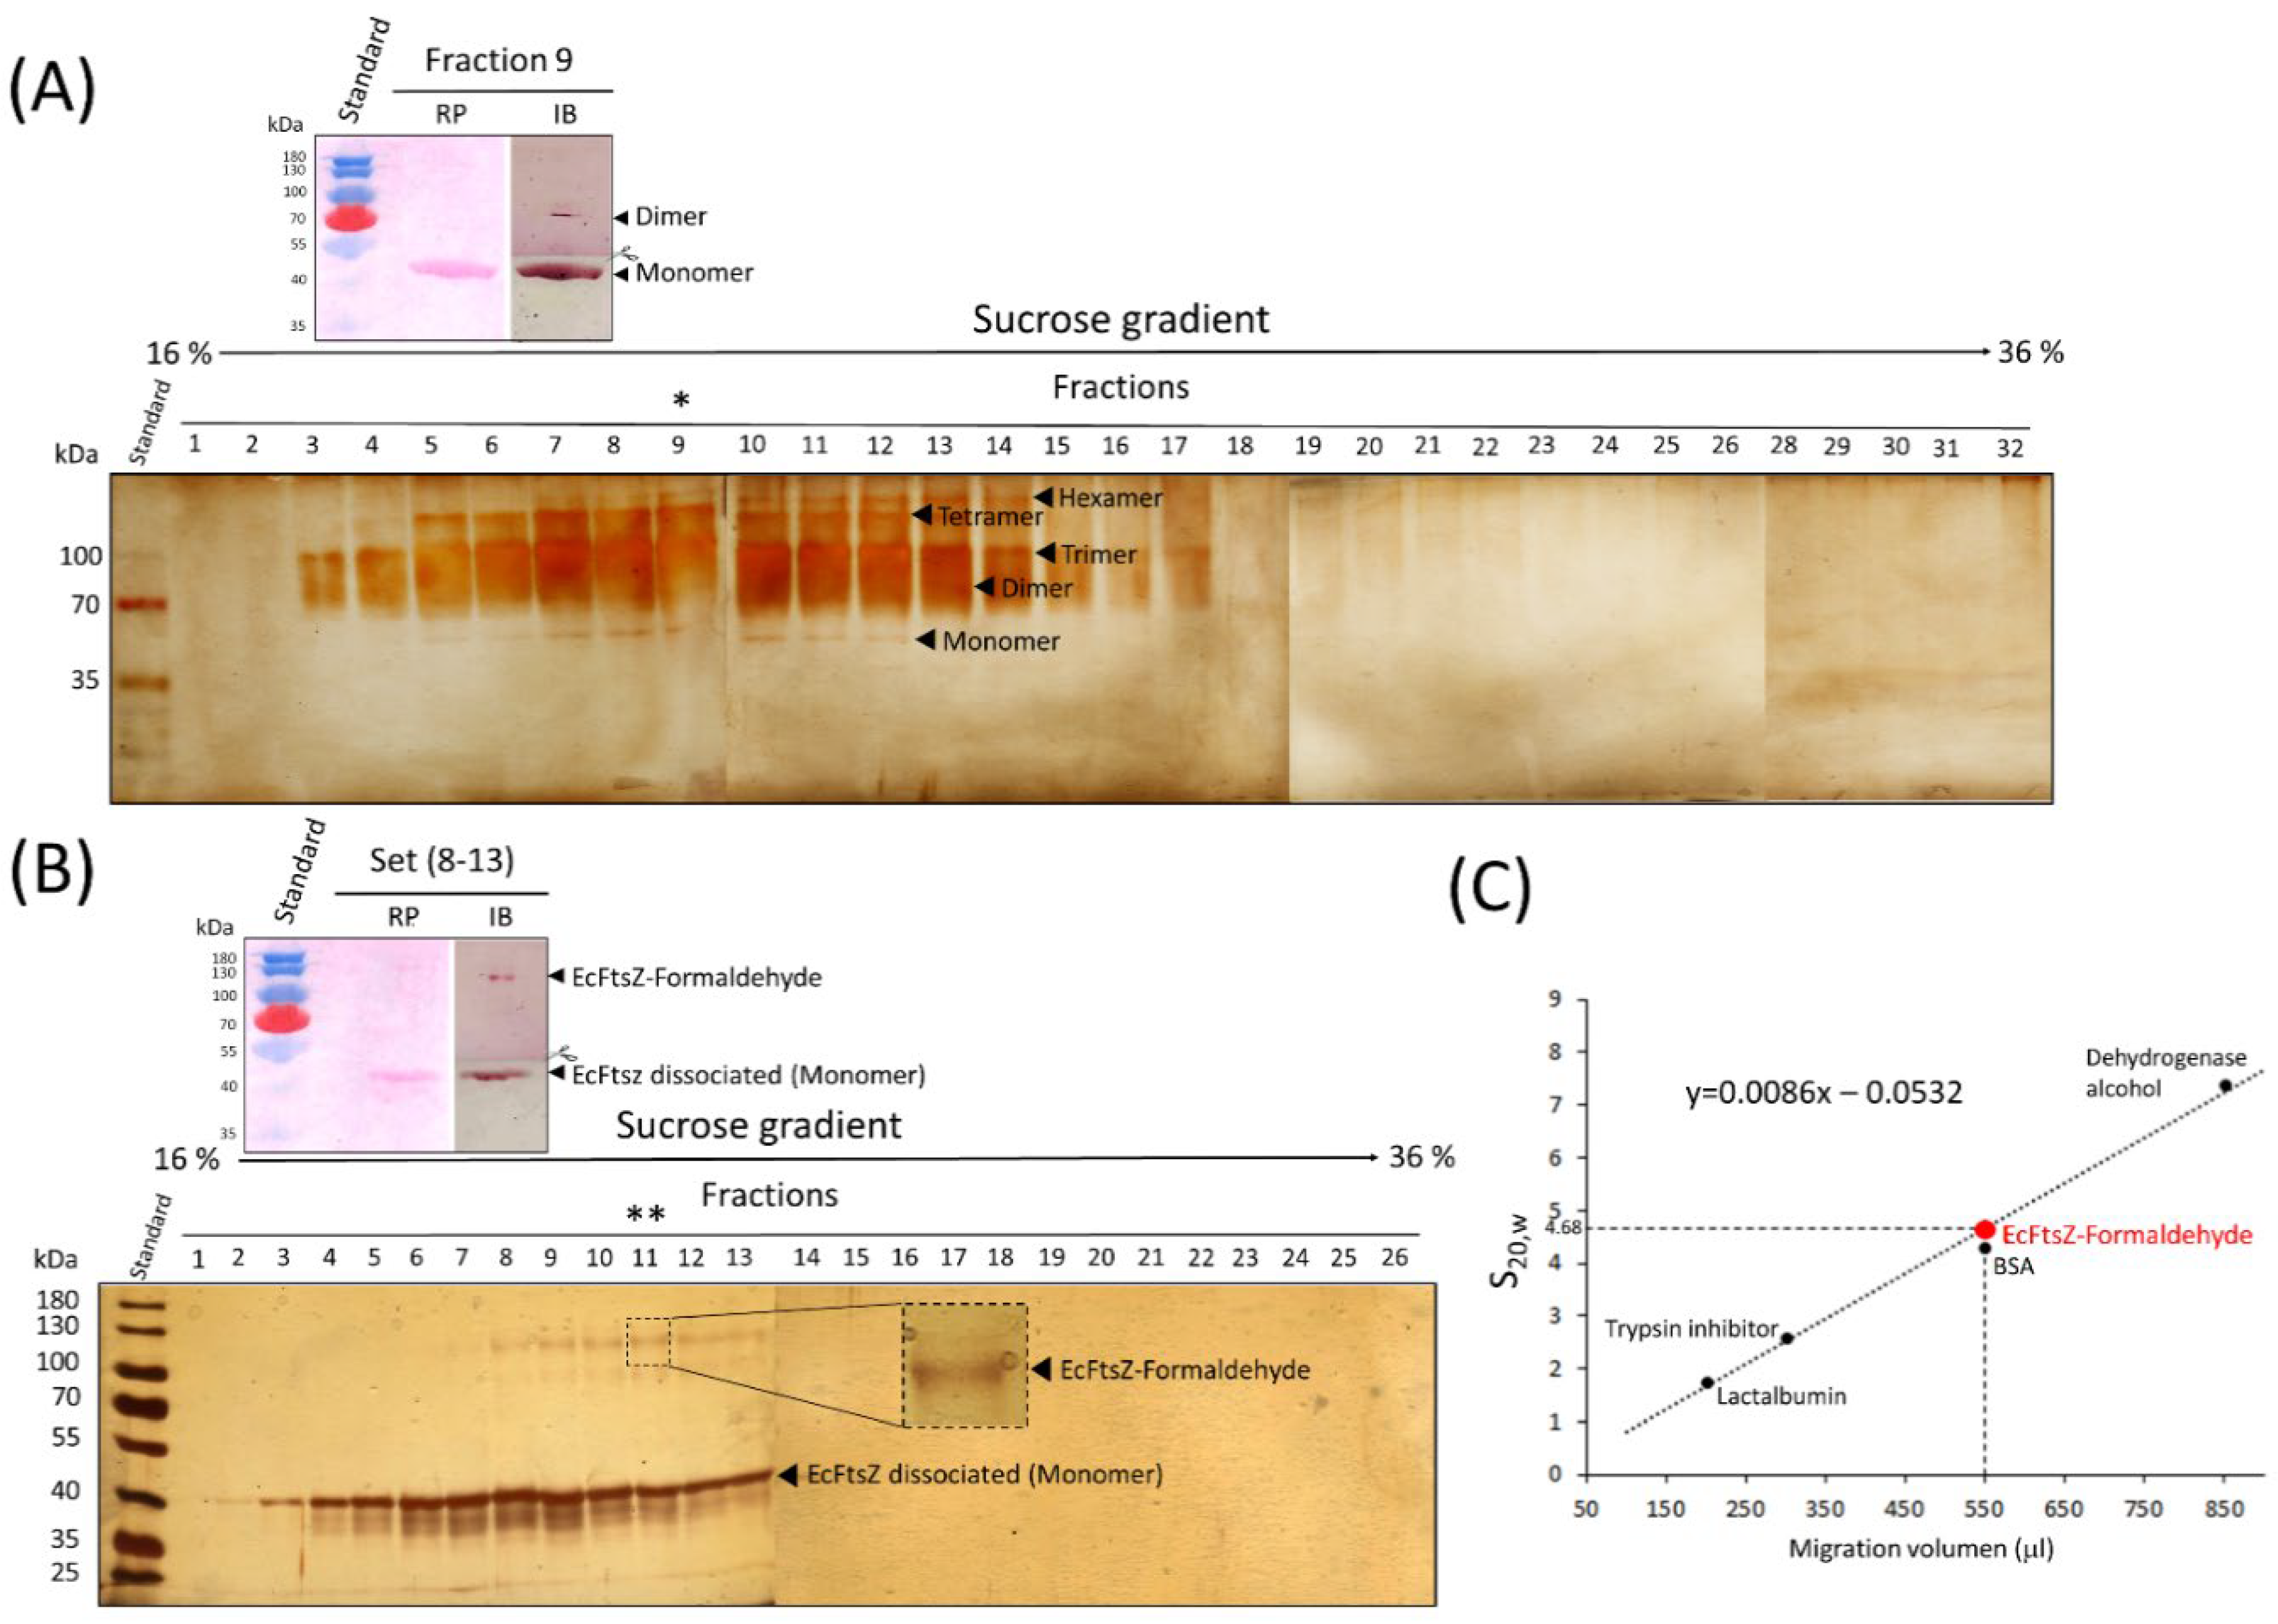
Sedimentation Gradient
Prediction of Protein-Protein Interactions
Discussion
Purified EcFtsZ
Native PAGE
Cross-Linking with Formaldehyde
Prediction of Protein-Protein Interactions
Supplementary Materials
Author Contributions
Acknowledgments
Conflicts of Interest
References
- Nogales, E.; Downing, K.H.; Amos, L.A.; Löwe, J. Tubulin and FtsZ form a distinct family of GTPases. 1998, Nat. Struct. Biol. 5. [CrossRef]
- Addinall, S.G.; Holland, B. The Tubulin Ancester, FtsZ, Draughtsman, Designer and Driving Force for Bacterial Cytokinesis. J. Mol. Biol. 2002, 318, 219–236. [Google Scholar] [CrossRef] [PubMed]
- D. Bramhill, Bacterial cell division, Annu. Rev. Cell. Dev. Biol. 1997. [CrossRef]
- Lutkenhaus, J.; Addinall, S.G. BACTERIAL CELL DIVISION AND THE Z RING. Annu. Rev. Biochem. 1997, 66, 93–116. [Google Scholar] [CrossRef] [PubMed]
- Ramírez-Aportela, E.; López-Blanco, J.R.; Andreu, J.M.; Chacón, P. Understanding Nucleotide-Regulated FtsZ Filament Dynamics and the Monomer Assembly Switch with Large-Scale Atomistic Simulations. Biophys. J. 2014, 107, 2164–2176. [Google Scholar] [CrossRef] [PubMed]
- Sossong, T.M.; Brigham-Burke, M.R.; Hensley, P.; Pearce, K.H. Self-Activation of Guanosine Triphosphatase Activity by Oligomerization of the Bacterial Cell Division Protein FtsZ. Biochemistry 1999, 38, 14843–14850. [Google Scholar] [CrossRef]
- Scheffers, D.-J.; de Wit, J.G.; Blaauwen, T.D.; Driessen, A.J.M. GTP Hydrolysis of Cell Division Protein FtsZ: Evidence that the Active Site Is Formed by the Association of Monomers. Biochemistry 2001, 41, 521–529. [Google Scholar] [CrossRef]
- den Blaauwen, T.; Andreu, J.M.; Monasterio, O. Bacterial cell division proteins as antibiotic targets. Bioorg. Chem. 2014, 55, 27–38. [Google Scholar] [CrossRef]
- Rivas, G.; López, A.; Mingorance, J.; Ferrándiz, M.J.; Zorrilla, S.; Minton, A.P.; Vicente, M.; Andreu, J.M. Magnesium-induced Linear Self-association of the FtsZ Bacterial Cell Division Protein Monomer. 275, 1174; 9. [Google Scholar] [CrossRef]
- Bowman, G.R.; Perez, A.M.; Ptacin, J.L.; Ighodaro, E.; Folta-Stogniew, E.; Comolli, L.R.; Shapiro, L. Oligomerization and higher-order assembly contribute to sub-cellular localization of a bacterial scaffold. Mol. Microbiol. 2013, 90, 776–795. [Google Scholar] [CrossRef]
- Irvine, G.B. Determination of Molecular Size by Size-Exclusion Chromatography (Gel Filtration). Curr. Protoc. Cell Biol. 2000, 6, 5–5. [Google Scholar] [CrossRef]
- Clark, R.W. Calculation of s20,w values using ultracentrifuge sedimentation data from linear sucrose gradients, an improved, simplified method. Biochim. et Biophys. Acta (BBA) - Gen. Subj. 1976, 428, 269–274. [Google Scholar] [CrossRef]
- McEwen, C. Tables for estimating sedimentation through linear concentration gradients of sucrose solution. Anal. Biochem. 1967, 20, 114–149. [Google Scholar] [CrossRef]
- Morris, G.A. The Self-Assembly and Structure of Caseins in Solution. Biotechnol. Genet. Eng. Rev. 2002, 19, 357–376. [Google Scholar] [CrossRef] [PubMed]
- Sheppard, E.; McLaren, A.D. Studies on Crystalline Trypsin, Soybean Trypsin Inhibitor and Inhibitor-Trypsin Compound with the Ultracentrifuge1,2. J. Am. Chem. Soc. 1953, 75, 2587–2591. [Google Scholar] [CrossRef]
- Siegel, L.M.; Monty, K.J. Determination of molecular weights and frictional ratios of proteins in impure systems by use of gel filtration and density gradient centrifugation. Application to crude preparations of sulfite and hydroxylamine reductases. Biochim. et Biophys. Acta (BBA) - Biophys. Incl. Photosynth. 1966, 112, 346–362. [Google Scholar] [CrossRef]
- Erickson, H.P. Size and Shape of Protein Molecules at the Nanometer Level Determined by Sedimentation, Gel Filtration, and Electron Microscopy. Biol. Proced. Online 2009, 11, 32–51. [Google Scholar] [CrossRef]
- Laemmli, U.K. Cleavage of Structural Proteins during the Assembly of the Head of Bacteriophage T4. Nature 1970, 227, 680–685. [Google Scholar] [CrossRef] [PubMed]
- Ahn, T.; Yim, S.-K.; Choi, H.-I.; Yun, C.-H. Polyacrylamide Gel Electrophoresis without a Stacking Gel: Use of Amino Acids as Electrolytes. Anal. Biochem. 2001, 291, 300–303. [Google Scholar] [CrossRef]
- M.M. Bradford, A rapid and sensitive method for the quantitation of microgram quantities of protein utilizing the principle of protein-dye binding, Anal. Biochem. 1976. [CrossRef]
- Towbin, H.; Staehelin, T.; Gordon, J. Electrophoretic transfer of proteins from polyacrylamide gels to nitrocellulose sheets: procedure and some applications. Proc. Natl. Acad. Sci. USA 1979, 76, 4350–4354. [Google Scholar] [CrossRef]
- Beuria, T.K.; Shah, J.H.; Santra, M.K.; Kumar, V.; Panda, D. Effects of pH and ionic strength on the assembly and bundling of FtsZ protofilaments: A possible role of electrostatic interactions in the bundling of protofilaments. Int. J. Biol. Macromol. 2006, 40, 30–39. [Google Scholar] [CrossRef]
- Chen, Y.; Anderson, D.E.; Rajagopalan, M.; Erickson, H.P. Assembly Dynamics of Mycobacterium tuberculosis FtsZ. 282, 2773. [Google Scholar] [CrossRef]
- Díaz-Espinoza, R.; Garcés, A.P.; Arbildua, J.J.; Montecinos, F.; Brunet, J.E.; Lagos, R.; Monasterio, O. Domain folding and flexibility of Escherichia coli FtsZ determined by tryptophan site-directed mutagenesis. Protein Sci. 2007, 16, 1543–1556. [Google Scholar] [CrossRef]
- T.C. Laurent, J.A. T.C. Laurent, J.A. Killander, Theory of gel filtration and its experimental verification, J. Chromatogr A. 1964. [Google Scholar]
- V. Bloomfield, W.O. V. Bloomfield, W.O. Dalton, K.E. van Holde, Friction coefficients of multisubunit structures, I. Theory, Biopolymers. 1967. [Google Scholar]
- Beuria, T.K.; Krishnakumar, S.S.; Sahar, S.; Singh, N.; Gupta, K.; Meshram, M.; Panda, D. Glutamate-induced Assembly of Bacterial Cell Division Protein FtsZ. J. Biol. Chem. 2003, 278, 3735–3741. [Google Scholar] [CrossRef]
- C.N. Gallagher, R.E. C.N. Gallagher, R.E. Huber, Monomer-Dimer Equilibrium of Uncomplemented M15 β-Galactosidase from Escherichia coli, Biochem. 1997. [Google Scholar]
- Wittig, I.; Schägger, H. Advantages and limitations of clear-native PAGE. Proteomics 2005, 5, 4338–4346. [Google Scholar] [CrossRef] [PubMed]
- Wittig, I.; Karas, M.; Schägger, H. High Resolution Clear Native Electrophoresis for In-gel Functional Assays and Fluorescence Studies of Membrane Protein Complexes. Mol. Cell. Proteom. 2007, 6, 1215–1225. [Google Scholar] [CrossRef]
- Smith, A.G.; Johnson, C.B.; Vitha, S.; Holzenburg, A. Oligomerization of plant FtsZ1 and FtsZ2 plastid division proteins. Arch. Biochem. Biophys. 2011, 513, 94–101. [Google Scholar] [CrossRef]
- Lebbink, J.H.G.; Fish, A.; Reumer, A.; Natrajan, G.; Winterwerp, H.H.K.; Sixma, T.K. Magnesium Coordination Controls the Molecular Switch Function of DNA Mismatch Repair Protein MutS. J. Biol. Chem. 2010, 285, 13131–13141. [Google Scholar] [CrossRef]
- Hu, Z.; Marti, J. Discovering and Targeting Dynamic Drugging Pockets of Oncogenic Proteins: The Role of Magnesium in Conformational Changes of the G12D Mutated Kirsten Rat Sarcoma-Guanosine Diphosphate Complex. Int. J. Mol. Sci. 2022, 23, 13865. [Google Scholar] [CrossRef]
- Trip, E.N.; Scheffers, D.-J. A 1 MDa protein complex containing critical components of the Escherichia coli divisome. Sci. Rep. 2015, 5, 18190–18190. [Google Scholar] [CrossRef] [PubMed]
- X. Tang, J.E. X. Tang, J.E. Bruce, Chemical Cross-Linking for Protein–Protein Interaction Studies. In: Lipton, M.S., Paša-Tolic, L. (eds) Mass Spectrometry of Proteins and Peptides. 2009. [Google Scholar] [CrossRef]
- Fraenkel-Conrat, H.; Olcott, H.S. The Reaction of Formaldehyde with Proteins. V. Cross-linking between Amino and Primary Amide or Guanidyl Groups. J. Am. Chem. Soc. 1948, 70, 2673–2684. [Google Scholar] [CrossRef] [PubMed]
- Hoffman, E.A.; Frey, B.L.; Smith, L.M.; Auble, D.T. Formaldehyde Crosslinking: A Tool for the Study of Chromatin Complexes. J. Biol. Chem. 2015, 290, 26404–26411. [Google Scholar] [CrossRef]
- Bell, E.W.; Schwartz, J.H.; Freddolino, P.L.; Zhang, Y. PEPPI: Whole-proteome Protein-protein Interaction Prediction through Structure and Sequence Similarity, Functional Association, and Machine Learning. J. Mol. Biol. 2022, 434, 167530–167530. [Google Scholar] [CrossRef]
- Huang, K.-H.; Mychack, A.; Tchorzewski, L.; Janakiraman, A. Characterization of the FtsZ C-Terminal Variable (CTV) Region in Z-Ring Assembly and Interaction with the Z-Ring Stabilizer ZapD in E. coli Cytokinesis. PLOS ONE 2016, 11, e0153337. [Google Scholar] [CrossRef]
- Muthukumar, V.C. Escherichia coli FtsZ molecular dynamics simulations. J. Biomol. Struct. Dyn. 2023, 42, 2653–2666. [Google Scholar] [CrossRef] [PubMed]
- Scheffers, D.-J.; de Wit, J.G.; Blaauwen, T.D.; Driessen, A.J.M. GTP Hydrolysis of Cell Division Protein FtsZ: Evidence that the Active Site Is Formed by the Association of Monomers. Biochemistry 2001, 41, 521–529. [Google Scholar] [CrossRef] [PubMed]
- A Oliva, M.; Cordell, S.C.; Löwe, J. Structural insights into FtsZ protofilament formation. Nat. Struct. Mol. Biol. 2004, 11, 1243–1250. [Google Scholar] [CrossRef] [PubMed]
- V.C. Muthukumar, Molecular Dynamics simulation of the E. 2802. [CrossRef]
- Muthukumar, V.C. The dynamics of Escherichia coli FtsZ dimer. J. Biomol. Struct. Dyn. 2023, 1–14. [Google Scholar] [CrossRef]
- Li, Y.; Hsin, J.; Zhao, L.; Cheng, Y.; Shang, W.; Huang, K.C.; Wang, H.-W.; Ye, S. FtsZ Protofilaments Use a Hinge-Opening Mechanism for Constrictive Force Generation. Science 2013, 341, 392–395. [Google Scholar] [CrossRef]
- Guan, F.; Yu, J.; Yu, J.; Liu, Y.; Li, Y.; Feng, X.-H.; Huang, K.C.; Chang, Z.; Ye, S. Lateral interactions between protofilaments of the bacterial tubulin homolog FtsZ are essential for cell division. eLife 2018, 7. [Google Scholar] [CrossRef]
- E.D. Levy, J.B. E.D. Levy, J.B. Pereira-Leal, C. Chothia, S.A. Teichmann, 3D complex: a structural classification of protein complexes. PLOS Comput Biol. 2006. [Google Scholar]
Disclaimer/Publisher’s Note: The statements, opinions and data contained in all publications are solely those of the individual author(s) and contributor(s) and not of MDPI and/or the editor(s). MDPI and/or the editor(s) disclaim responsibility for any injury to people or property resulting from any ideas, methods, instructions or products referred to in the content. |
© 2024 by the authors. Licensee MDPI, Basel, Switzerland. This article is an open access article distributed under the terms and conditions of the Creative Commons Attribution (CC BY) license (https://creativecommons.org/licenses/by/4.0/).


