Submitted:
27 August 2024
Posted:
27 August 2024
You are already at the latest version
Abstract
Keywords:
1. Introduction
2. Numerical PEMFC Model
2.1. Model Assumptions
- The operating pressure is low and hence ideal gas mixtures are assumed in the gas phase.
- The velocity of flow is low and laminar.
- The effect of gravity is neglected.
- In the porous region, immobile liquid saturation is neglected.
2.2. Governing Equations and Source Terms
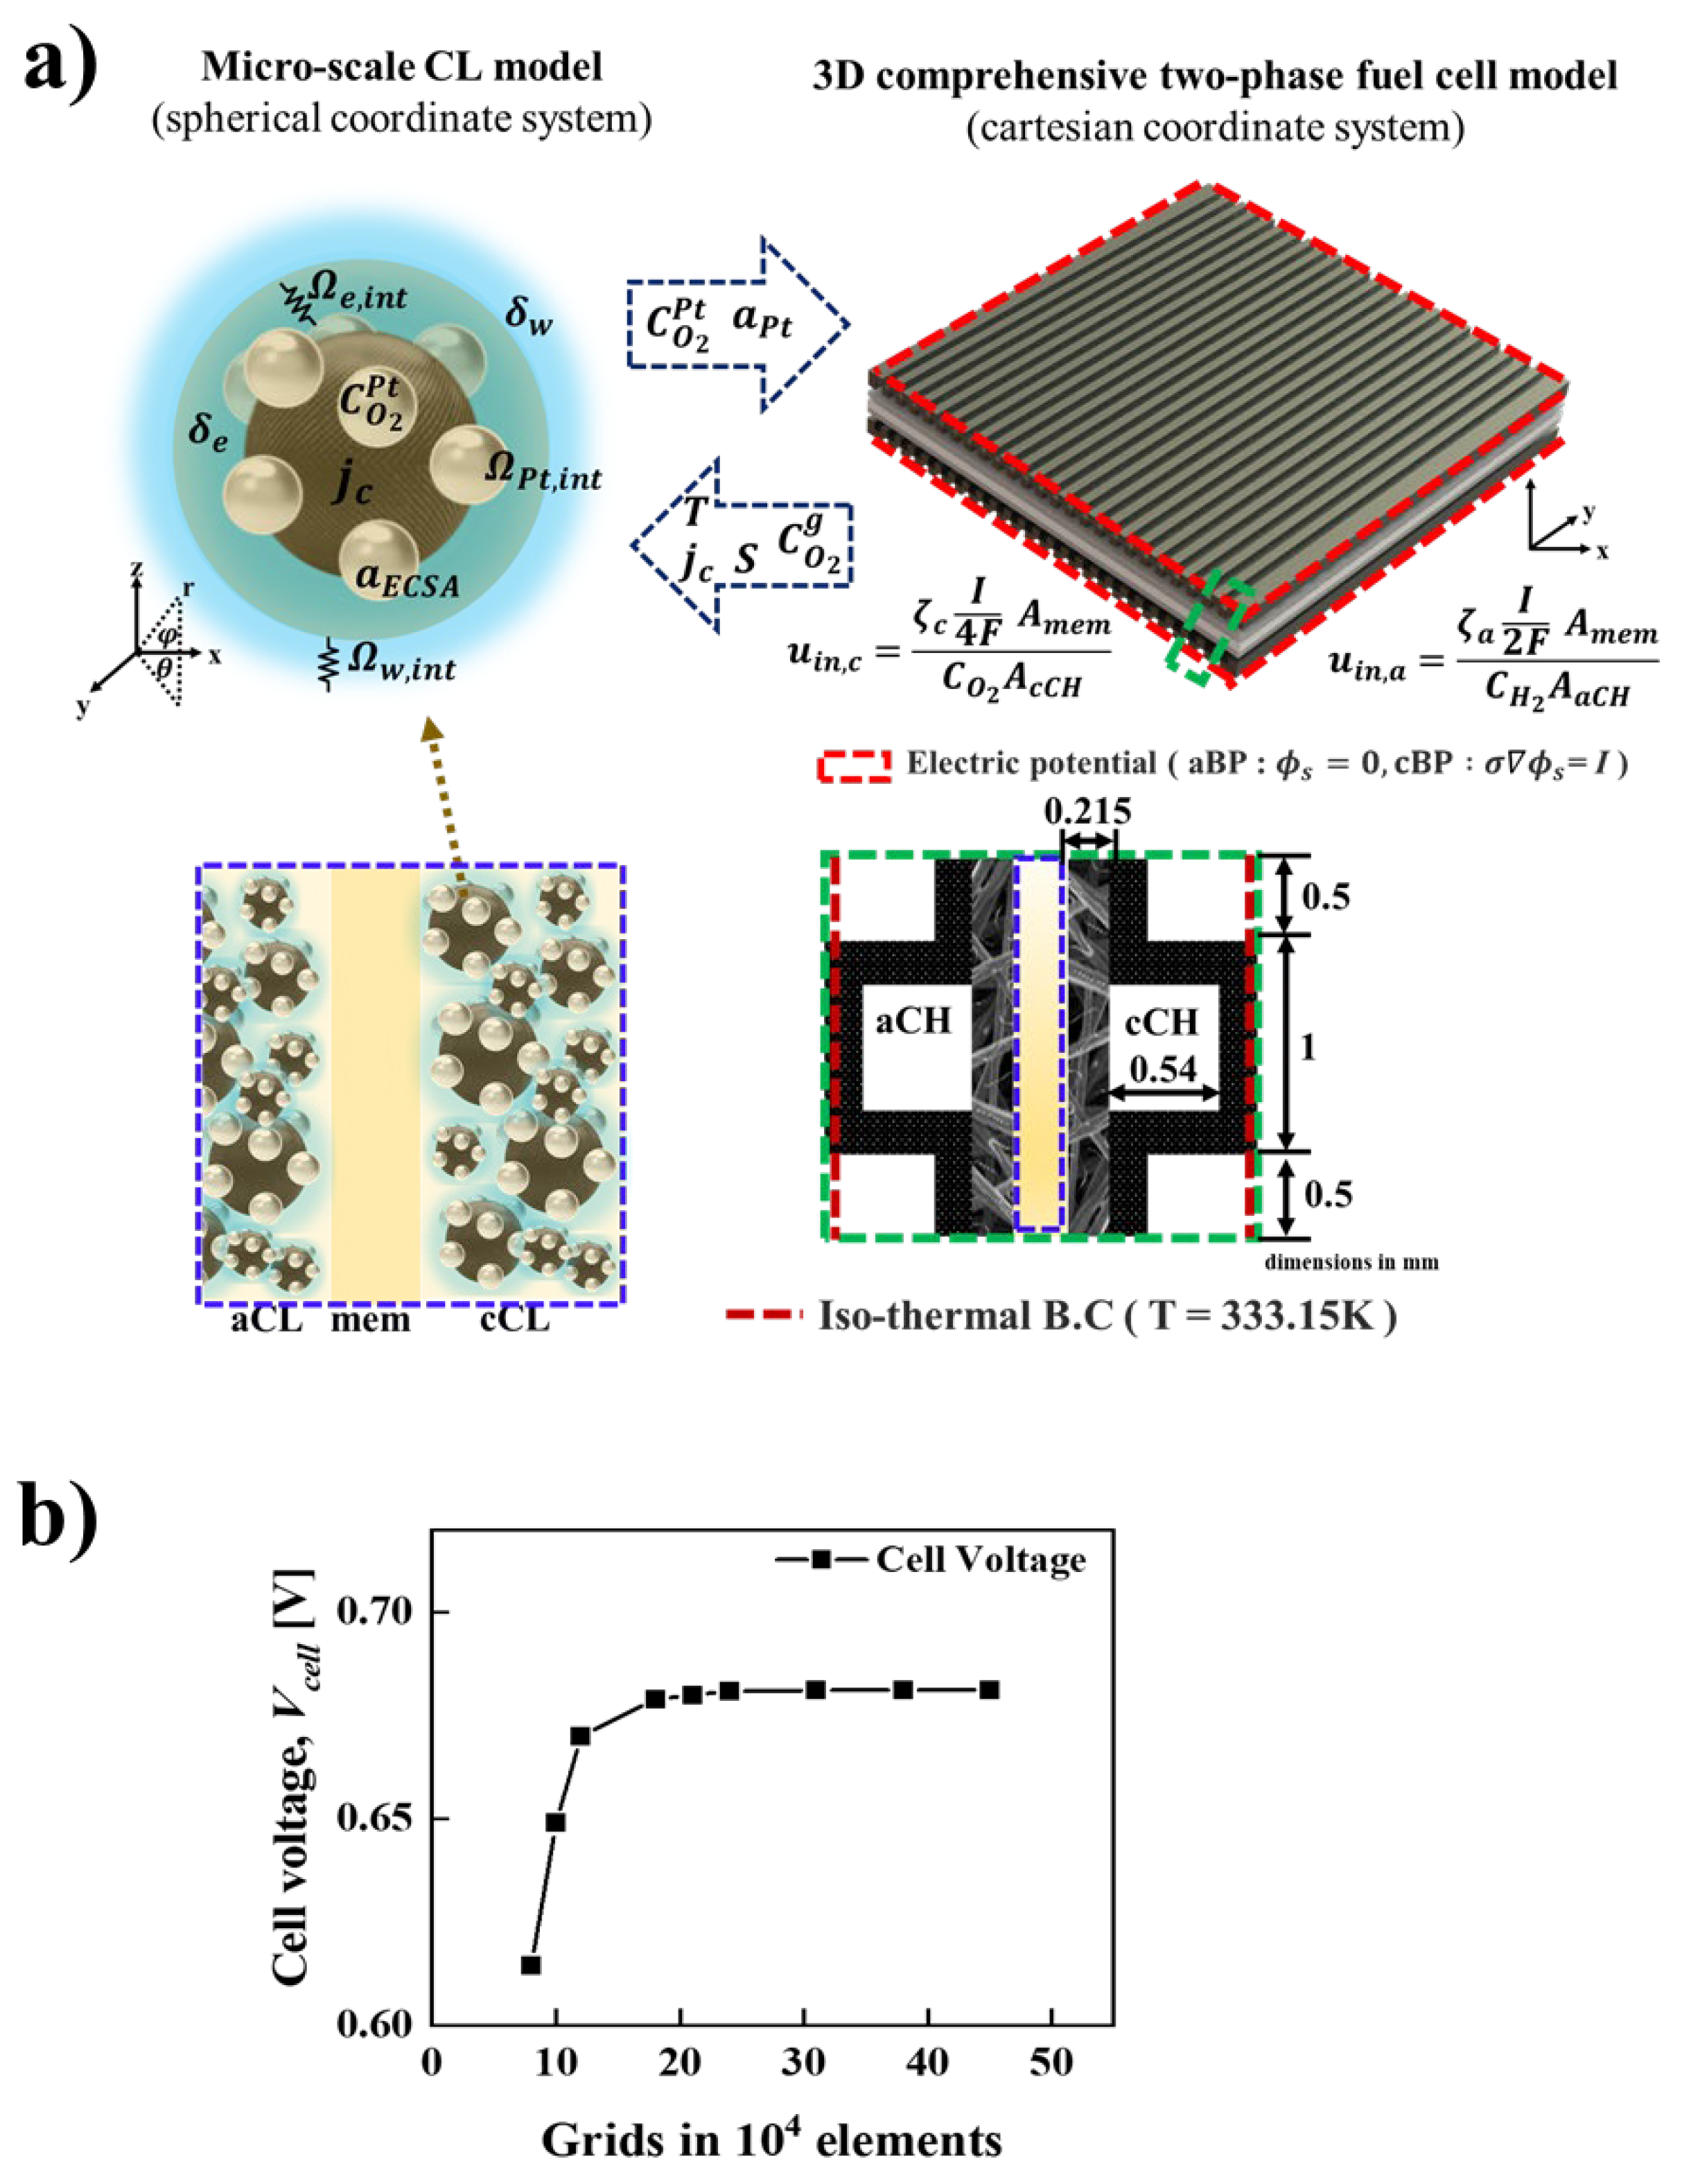
2.3. Boundary Conditions and Numerical Implementation
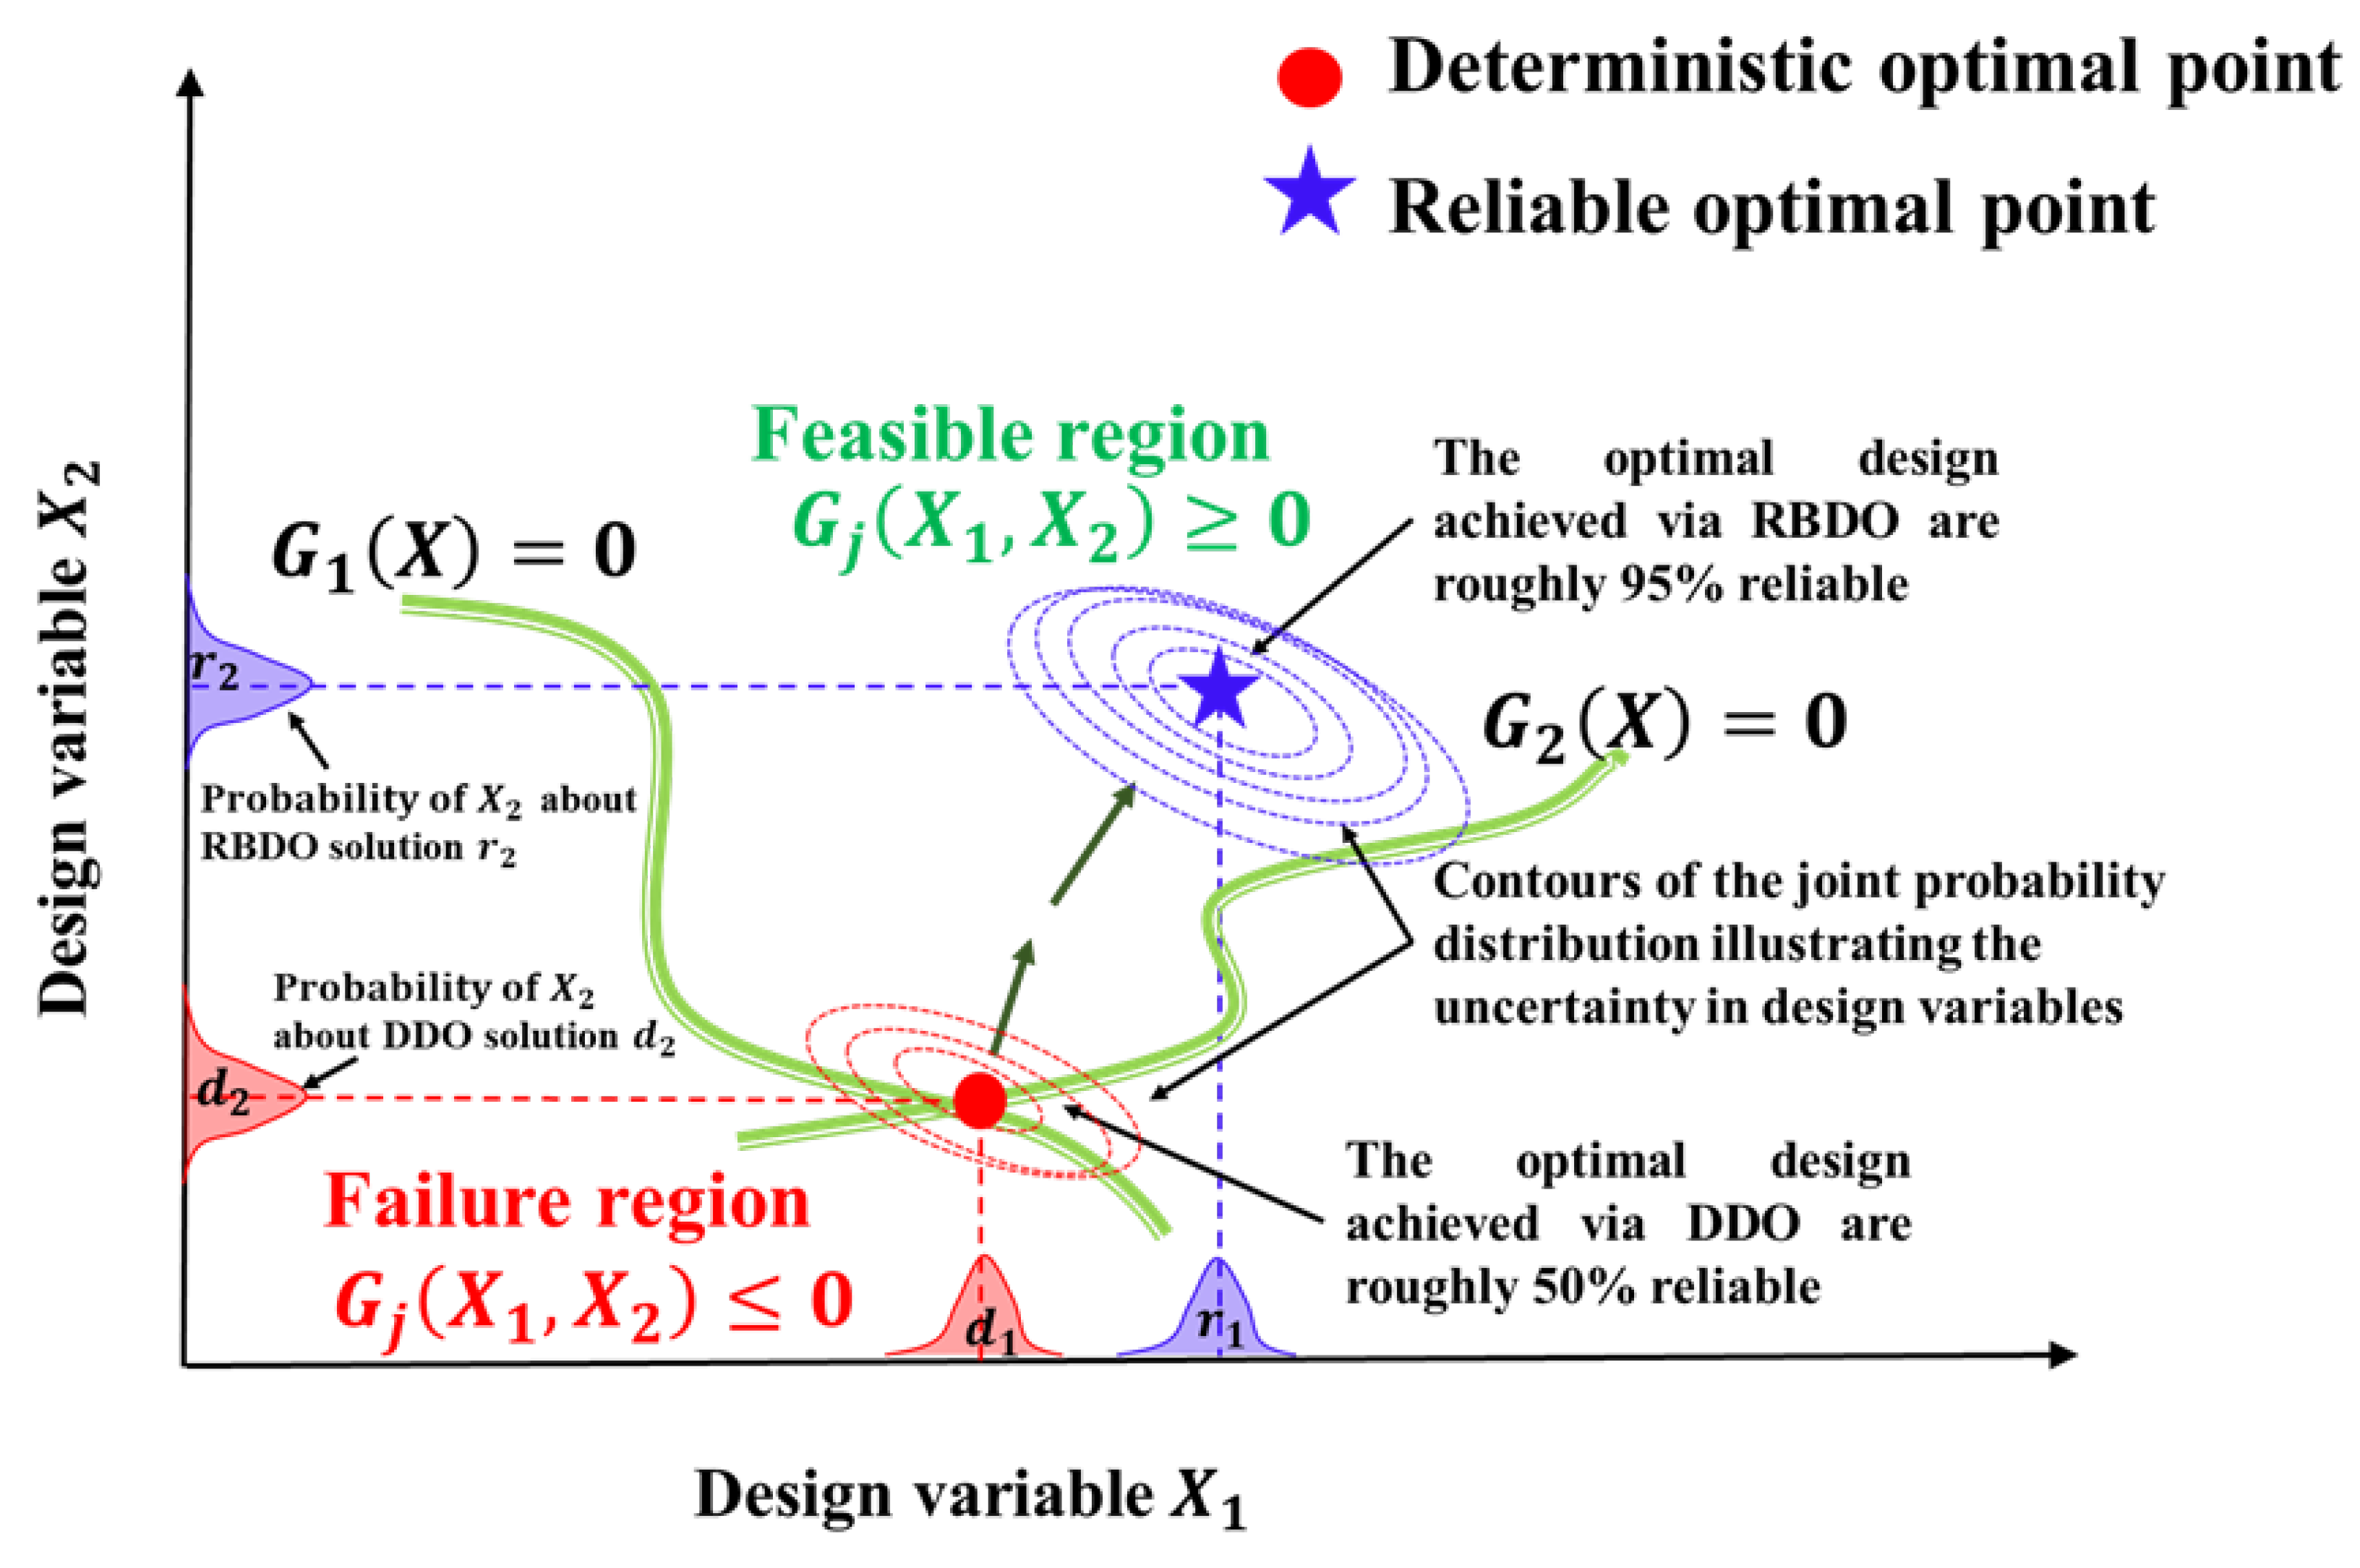
3. Overview of Design Optimization Strategies for Engineering Application
4. Estimating the Material Costs of the Cathode GDL and BP in PEMFCs
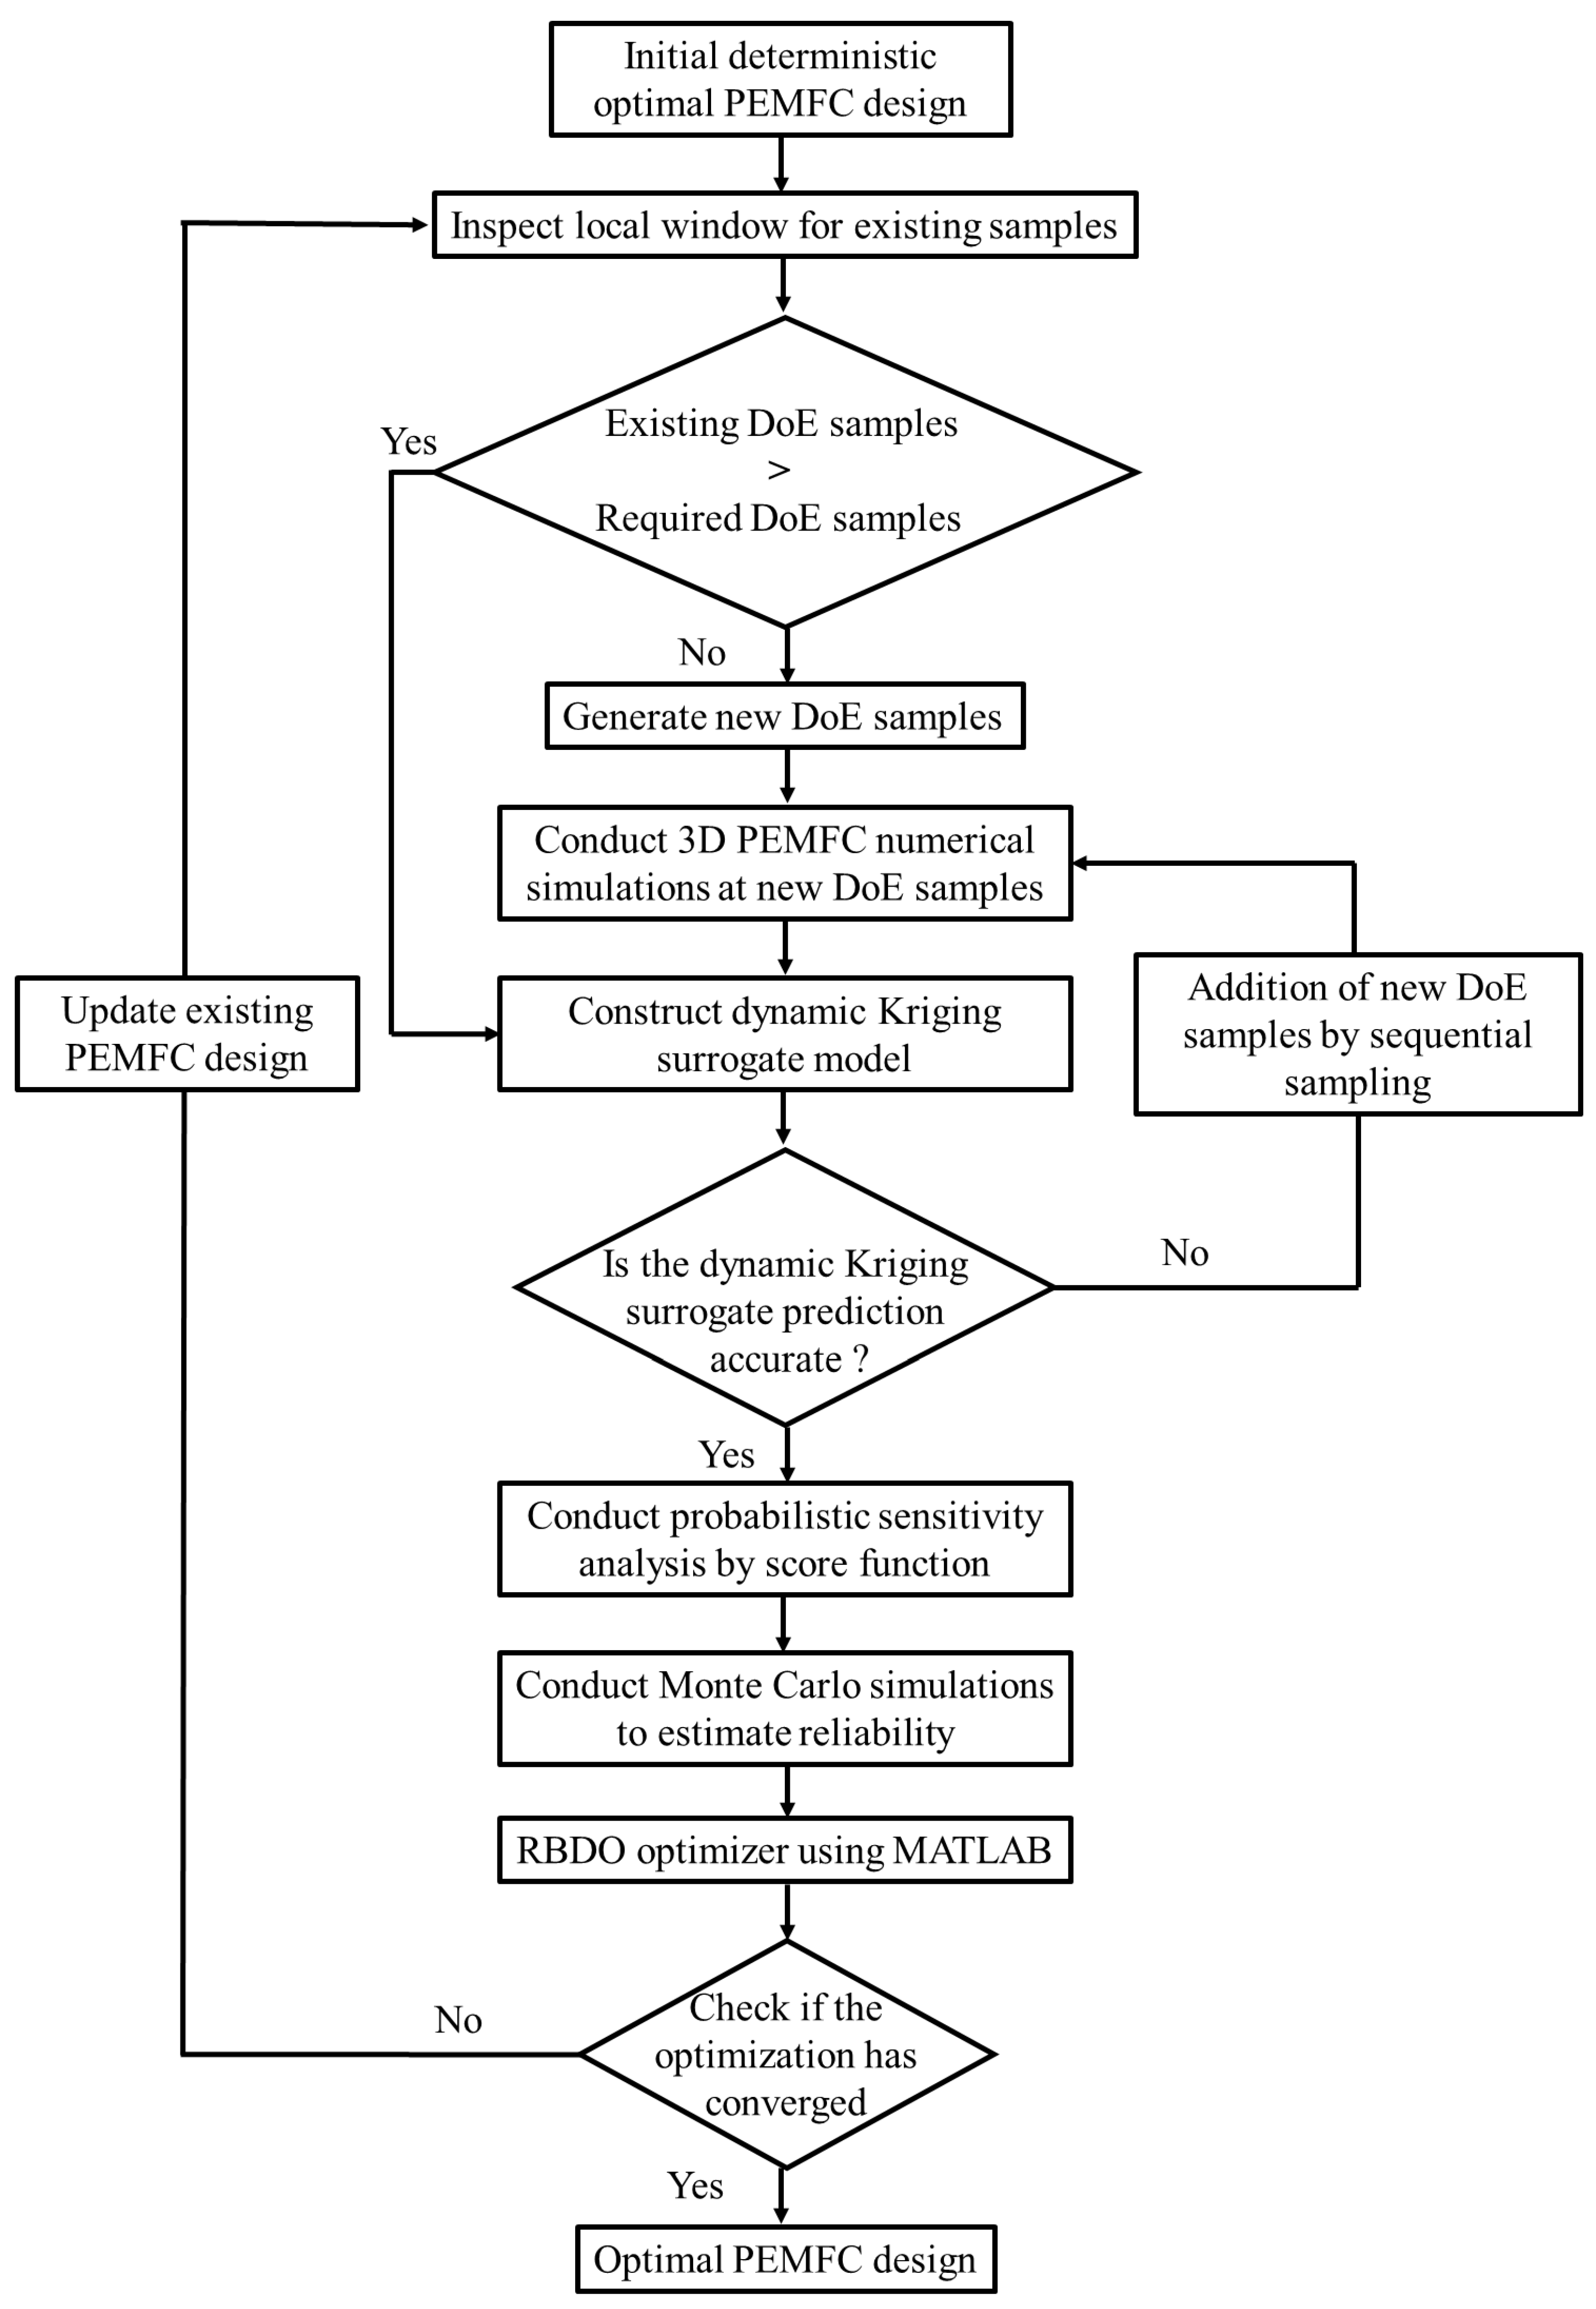
5. Formulation of the Optimization Problem
6. Results and Discussion
6.1. Evaluation of Predictive Capability of the MLP Surrogate
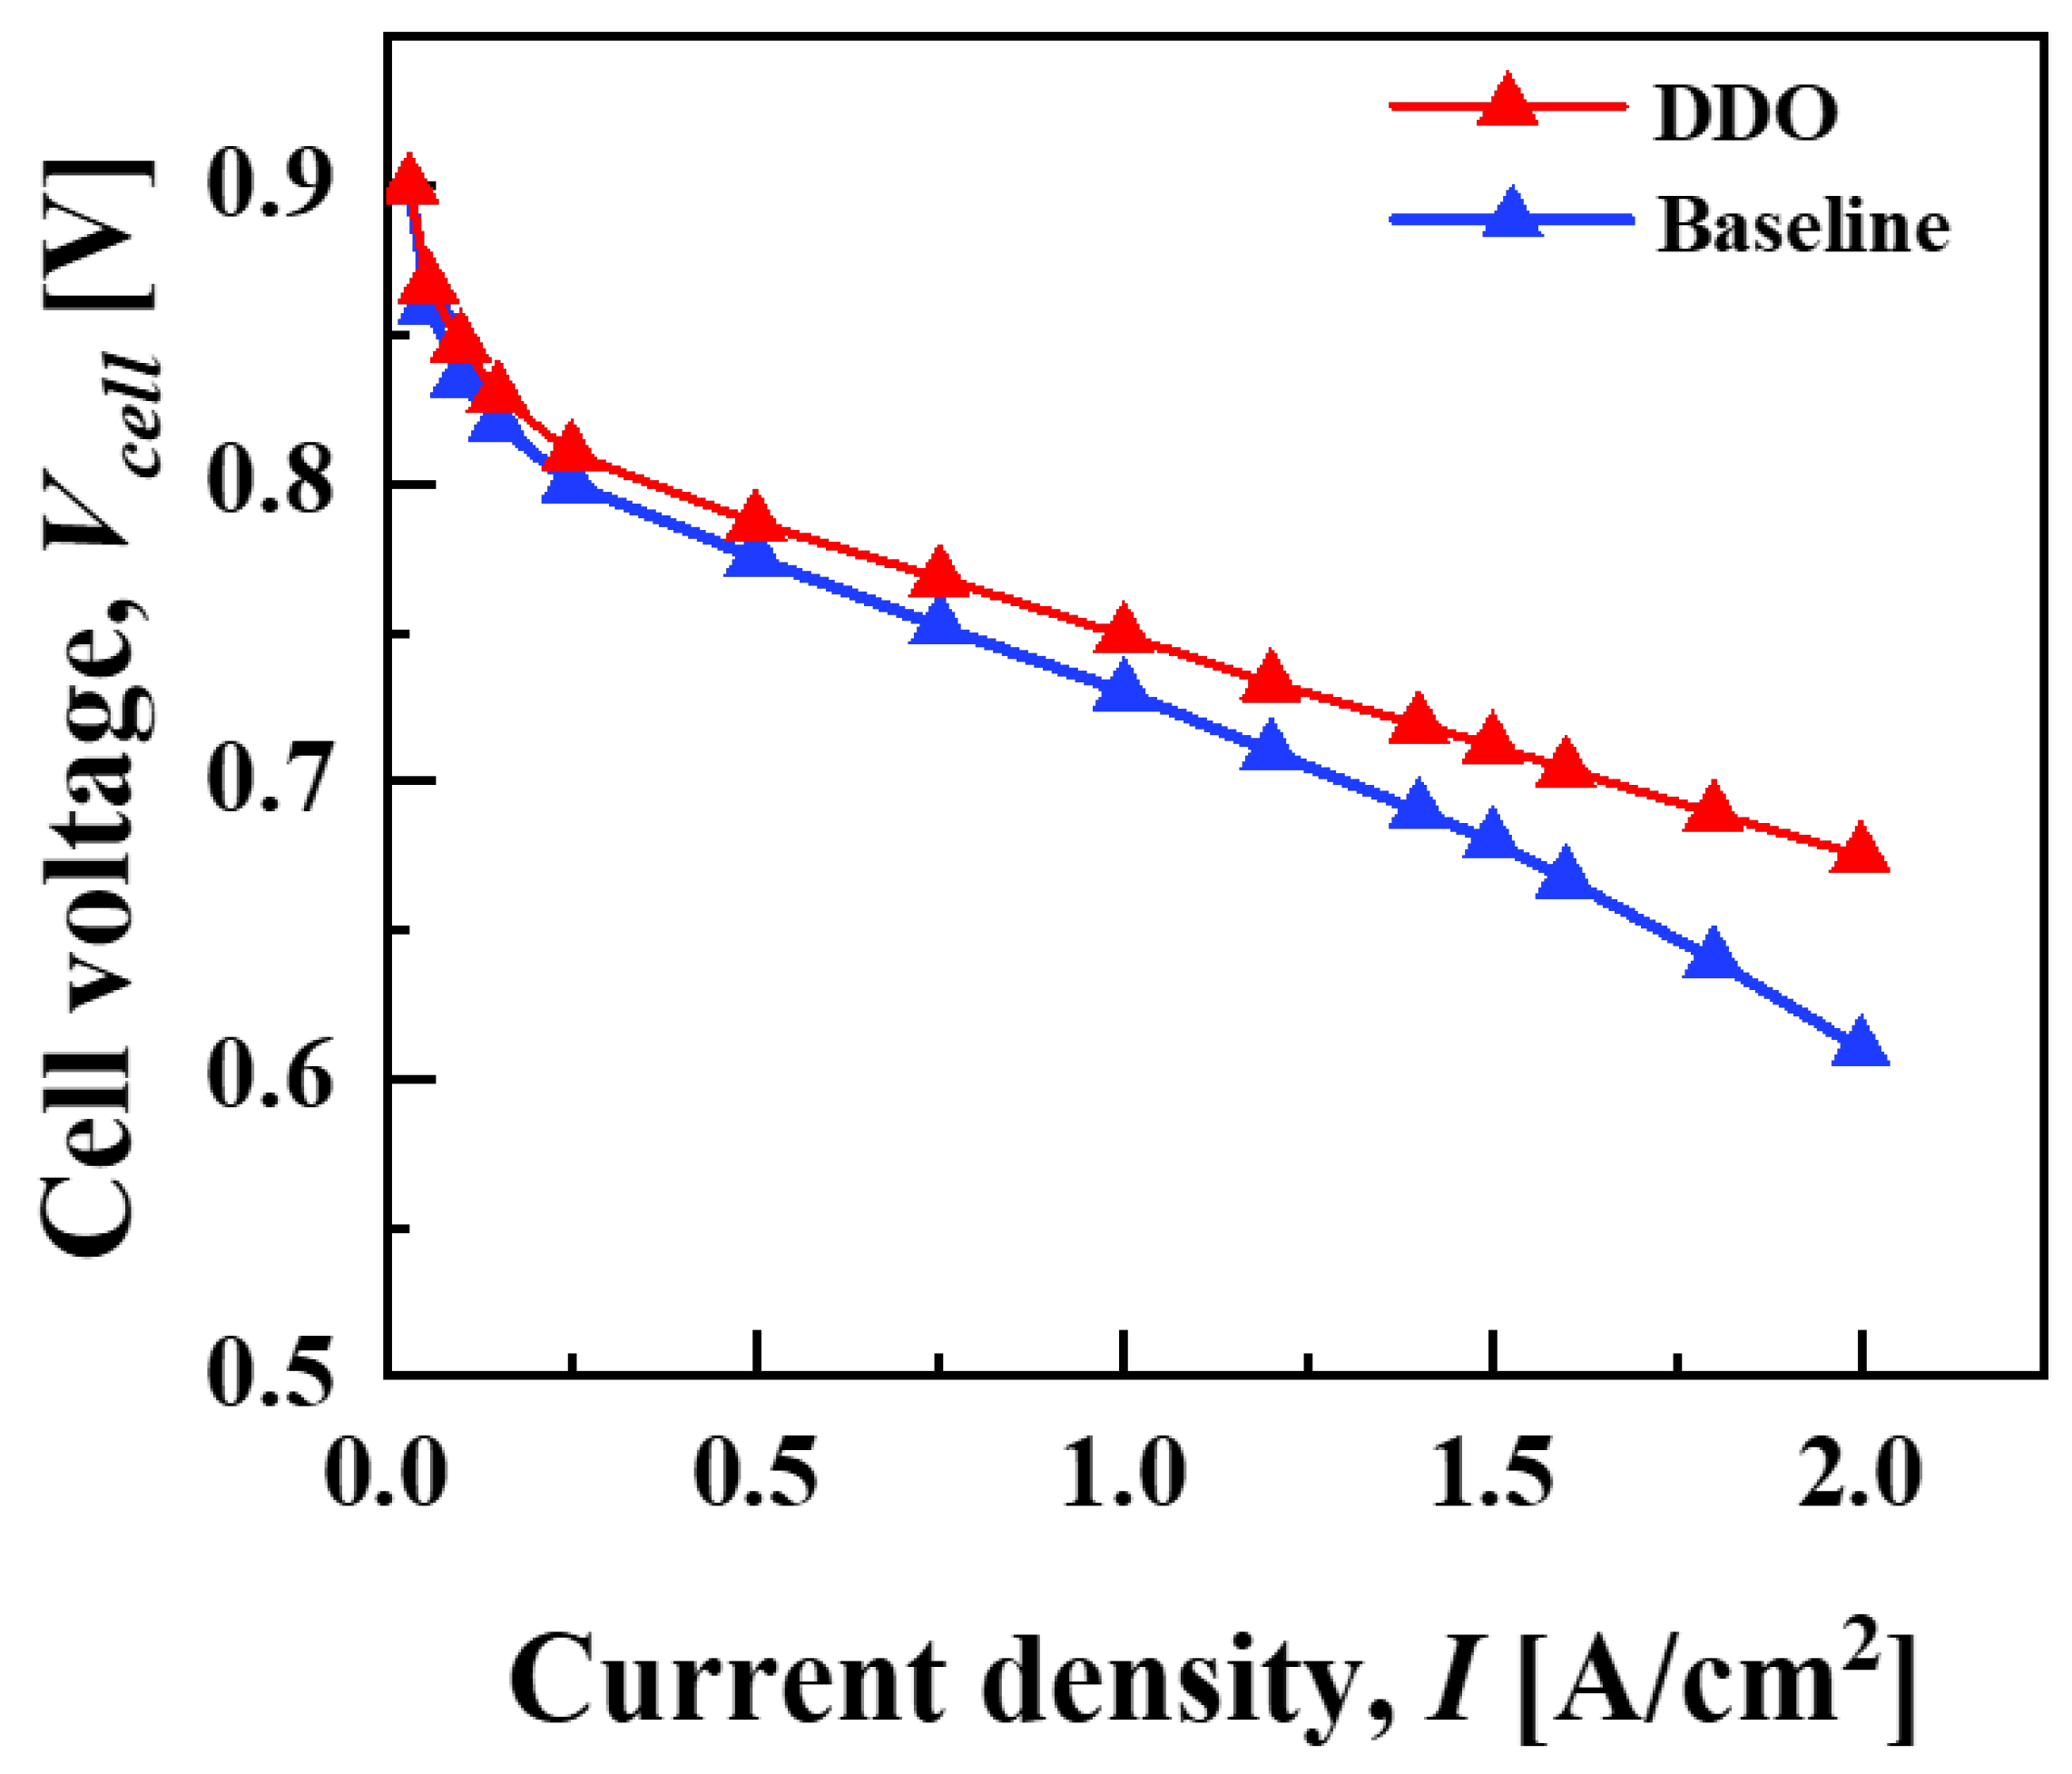
6.2. DDO to Access Superior PEMFC Performance
6.3. RBDO for Cathode, GDL and BP Material Costs
7. Conclusions
Acknowledgments
Conflicts of Interest
Nomenclature
| a | Ratio of active surface area per unit electrode volume, m2/m3 or water activity |
| A | Area, m2 |
| C | Molar concentration of species, mol/m3 |
| d | Vector of design variables or solution of a deterministic optimization problem |
| D | Species diffusivity, m2/s |
| E | Activation energy, kJ/mol |
| EW | Equivalent weight of a dry membrane, kg/mol |
| f | Objective function that needs to be minimized or maximized in the optimization problem |
| F | Faraday’s constant, 96,487 C/mol |
| G | Constraint condition for the -th constraint |
| i0 | Exchange current density, A/cm2 |
| id | Density estimation parameter |
| I | Operating current density, A/cm2 |
| j | Transfer current density, A/cm3, |
| Total number of constraint functions in the optimization problem | |
| k | Thermal conductivity, W/m·K, or Relative permeability, or index representing the specific objective function in the optimization problem |
| K | Hydraulic permeability, m2 |
| L | Amount of loading, |
| n | Number of electrons transferred in the electrode reaction |
| N | Number of design varaibles |
| MW | Molecular weight, kg/mol |
| MSE | Mean squared error |
| P | Pressure, Pa, |
| P | Probability |
| RMSE | Root mean squared error |
| s | Liquid saturation |
| S | Source term in the transport equation |
| t | time |
| T | Temperature, K |
| Fluid velocity and superficial velocity in a porous medium, m/s | |
| V | Voltage, V or Volume, |
| X | Vector of the design variables in the optimization problem |
| Lower or upper bound of the i-th design variable | |
| Input variable | |
| Observed response | |
| Predicted response | |
| Mean value of the observed data | |
| Z | Transport resistance coefficient |
| Greek symbols | |
| α | Transfer coefficient |
| Weight coefficient | |
| γ | Reaction order |
| δ | Thickness, m |
| ε | Volume fraction or error |
| η | Surface overpotential, V |
| Contact angle of the gas diffusion layer | |
| Water content | |
| Mean value of random design variables | |
| κ | Proton conductivity, S/m |
| Phase potential, V | |
| Ρ | Density, kg/m |
| σ | Electronic conductivity, S/m |
| τ | Viscous shear stress, N/m2 |
| ξ | Stoichiometry flow ratio |
| Ω | Oxygen transport resistance |
| Superscripts | |
| c | Catalyst coverage coefficient |
| eff | Effective |
| g | Gas |
| l | Liquid |
| L | Lower bound of a design variable |
| max | Maximum |
| mem | Membrane |
| min | Minimum |
| op | Operating |
| ref | Reference value |
| tar | Target |
| T | Transpose operation of a matrix |
| U | Upper bound of a design variable |
| Subscripts | |
| A | Anode |
| aCL | Anode catalyst layer |
| allw | Allowance |
| c | Cathode |
| C | Carbon |
| CL | Catalyst layer |
| cCL | Cathode catalyst layer |
| ch | Gas channel |
| e | Electrolyte |
| ECSA | Electro chemical active surface area |
| Gdl | Gas diffusion layer |
| Index representing the failure of the -th constraint | |
| I/C | Ionomer to carbon weight ratio |
| i | Species or index representing the lower or upper bound of the N-th design variable |
| in | Channel inlet |
| int | Interface |
| j | Index representing the specific constraint function in a problem with multiple constraints |
| k | Index representing the specific objective function in the optimization problem |
| MEA | Membrane electrode assembly |
| Mem | Membrane |
| min | Minimum |
| N | Number of design varaibles |
| nd | n-th random design variable |
| Pt/C | Weight ratio of Platinum to carbon |
| Pt | Platinum |
| s | Solid, surface |
| T | Temperature |
| U | Momentum equation |
| w | Water |
| 0 | Initial conditions or standard conditions, i.e., 298.15 K and 101.3 kPa (1 atm) |
References
- D. Parra, L. Valverde, F.J. Pino, M.K. Patel, A review on the role, cost and value of hydrogen energy systems for deep decarbonisation, Renew. Sustain. Energy Rev. 101 (2019) 279–294. [CrossRef]
- B. Sundén, Fuel cell types - overview, Hydrog. Batter. Fuel Cells. (2019) 123–144. [CrossRef]
- Y. Wang, H. Yuan, A. Martinez, P. Hong, H. Xu, F.R. Bockmiller, Polymer electrolyte membrane fuel cell and hydrogen station networks for automobiles: Status, technology, and perspectives, Adv. Appl. Energy. 2 (2021) 100011. [CrossRef]
- S. Chugh, C. Chaudhari, K. Sonkar, A. Sharma, G.S. Kapur, S.S.V. Ramakumar, Experimental and modelling studies of low temperature PEMFC performance, Int. J. Hydrogen Energy. 45 (2020) 8866–8874. [CrossRef]
- J.H. Wee, Applications of proton exchange membrane fuel cell systems, Renew. Sustain. Energy Rev. 11 (2007) 1720–1738. [CrossRef]
- P. Ponnusamy, B. Pullithadathil, M.K. Panthalingal, Technological risks and durability issues for the Proton Exchange Membrane Fuel Cell technology, PEM Fuel Cells Fundam. Adv. Technol. Pract. Appl. (2022) 279–314. [CrossRef]
- W.E. Mustain, M. Chatenet, M. Page, Y.S. Kim, Durability challenges of anion exchange membrane fuel cells, Energy Environ. Sci. 13 (2020) 2805–2838. [CrossRef]
- P. Müller, Simulation Based Optimal Design, Handb. Stat. 25 (2005) 509–518. [CrossRef]
- D. Song, Q. Wang, Z. Liu, T. Navessin, M. Eikerling, S. Holdcroft, Numerical optimization study of the catalyst layer of PEM fuel cell cathode, J. Power Sources. 126 (2004) 104–111. [CrossRef]
- S.A. Grigoriev, A.A. Kalinnikov, N. V. Kuleshov, P. Millet, Numerical optimization of bipolar plates and gas diffusion electrodes for PBI-based PEM fuel cells, Int. J. Hydrogen Energy. 38 (2013) 8557–8567. [CrossRef]
- A.R. Kim, H.M. Jung, S. Um, An engineering approach to optimal metallic bipolar plate designs reflecting gas diffusion layer compression effects, Energy. 66 (2014) 50–55. [CrossRef]
- J. Tu, K.K. Choi, Y.H. Park, A new study on reliability- based design optimization, J. Mech. Des. Trans. ASME. 121 (1999) 557–564. [CrossRef]
- C. Ling, W. Kuo, M. Xie, An Overview of Adaptive-Surrogate-Model-Assisted Methods for Reliability-Based Design Optimization, IEEE Trans. Reliab. (2022) 1–22. [CrossRef]
- H. Cho, K.K. Choi, I. Lee, D. Lamb, Design Sensitivity Method for Sampling-Based RBDO with Varying Standard Deviation, J. Mech. Des. Trans. ASME. 138 (2016) 1–10. [CrossRef]
- D.O.E. Managers, N. Garland, J. Adams, Final Technical Report: Metrology for Fuel Cell Manufacturing, (n.d.).
- E. Morse, J.Y. Dantan, N. Anwer, R. Söderberg, G. Moroni, A. Qureshi, X. Jiang, L. Mathieu, Tolerancing: Managing uncertainty from conceptual design to final product, CIRP Ann. 67 (2018) 695–717. [CrossRef]
- S. Hoffenson, R. Söderberg, Systems thinking in tolerance and quality-related design decision-making, Procedia CIRP. 27 (2015) 59–64. [CrossRef]
- L. Peng, Y. Wan, D. Qiu, P. Yi, X. Lai, Dimensional tolerance analysis of proton exchange membrane fuel cells with metallic bipolar plates, J. Power Sources. 481 (2021) 228927. [CrossRef]
- Mukherjee, S. Hwang, S.C. Lee, O. Kwon, G.H. Choi, S. Park, Simulation and experimental analysis of the clamping pressure distribution in a PEM fuel cell stack, Int. J. Hydrogen Energy. 38 (2013) 6481–6493. [CrossRef]
- D. Qiu, L. Peng, X. Lai, M. Ni, W. Lehnert, Mechanical failure and mitigation strategies for the membrane in a proton exchange membrane fuel cell, Renew. Sustain. Energy Rev. 113 (2019) 109289. [CrossRef]
- P. Irmscher, D. Qui, H. Janßen, W. Lehnert, D. Stolten, Impact of gas diffusion layer mechanics on PEM fuel cell performance, Int. J. Hydrogen Energy. 44 (2019) 23406–23415. [CrossRef]
- Tang, L. Crisci, L. Bonville, J. Jankovic, An overview of bipolar plates in proton exchange membrane fuel cells, J. Renew. Sustain. Energy. 13 (2021). [CrossRef]
- S. Porstmann, T. Wannemacher, W.G. Drossel, A comprehensive comparison of state-of-the-art manufacturing methods for fuel cell bipolar plates including anticipated future industry trends, J. Manuf. Process. 60 (2020) 366–383. [CrossRef]
- C. Turan, Ö.N. Cora, M. Koç, Effect of manufacturing processes on contact resistance characteristics of metallic bipolar plates in PEM fuel cells, Int. J. Hydrogen Energy. 36 (2011) 12370–12380. [CrossRef]
- M.M. Barzegari, F.A. Khatir, Study of thickness distribution and dimensional accuracy of stamped metallic bipolar plates, Int. J. Hydrogen Energy. 44 (2019) 31360–31371. [CrossRef]
- D. Liu, L. Peng, X. Lai, Effect of assembly error of bipolar plate on the contact pressure distribution and stress failure of membrane electrode assembly in proton exchange membrane fuel cell, J. Power Sources. 195 (2010) 4213–4221. [CrossRef]
- M.F. Chinannai, J. Lee, H. Ju, Numerical study for diagnosing various malfunctioning modes in PEM fuel cell systems, Int. J. Hydrogen Energy. (2019). [CrossRef]
- Jo, H. Ju, Numerical study on applicability of metal foam as flow distributor in polymer electrolyte fuel cells (PEFCs), Int. J. Hydrogen Energy. 43 (2018) 14012–14026. [CrossRef]
- Jo, S. Ahn, K. Oh, W. Kim, H. Ju, Effects of metal foam properties on flow and water distribution in polymer electrolyte fuel cells (PEFCs), Int. J. Hydrogen Energy. 43 (2018) 14034–14046. [CrossRef]
- C.Y. Wang, P. Cheng, Multiphase Flow and Heat Transfer in Porous Media, Adv. Heat Transf. 30 (1997) 93–196. [CrossRef]
- Jo, H. Ju, Numerical study on applicability of metal foam as flow distributor in polymer electrolyte fuel cells (PEFCs), Int. J. Hydrogen Energy. 43 (2018) 14012–14026. [CrossRef]
- K. Lim, N. Vaz, J. Lee, H. Ju, Advantages and disadvantages of various cathode flow field designs for a polymer electrolyte membrane fuel cell, Int. J. Heat Mass Transf. 163 (2020) 120497. [CrossRef]
- P. Chippar, K. Oh, D. Kim, T.W. Hong, W. Kim, H. Ju, Coupled mechanical stress and multi-dimensional CFD analysis for high temperature proton exchange membrane fuel cells (HT-PEMFCs), Int. J. Hydrogen Energy. 38 (2013) 7715–7724. [CrossRef]
- C.Y. Wang, P. Cheng, A multiphase mixture model for multiphase, multicomponent transport in capillary porous media - I. Model development, Int. J. Heat Mass Transf. 39 (1996) 3607–3618. [CrossRef]
- T.E. Springer, Polymer Electrolyte Fuel Cell Model, J. Electrochem. Soc. 138 (1991) 2334. [CrossRef]
- K. Kang, H. Ju, Numerical modeling and analysis of micro-porous layer effects in polymer electrolyte fuel cells, J. Power Sources. (2009). [CrossRef]
- S. Basu, C.Y. Wang, K.S. Chen, Analytical model of flow maldistribution in polymer electrolyte fuel cell channels, Chem. Eng. Sci. 65 (2010) 6145–6154. [CrossRef]
- H. Ju, H. Meng, C.Y. Wang, A single-phase, non-isothermal model for PEM fuel cells, Int. J. Heat Mass Transf. 48 (2005) 1303–1315. [CrossRef]
- Jo, S. Ahn, K. Oh, W. Kim, H. Ju, Effects of metal foam properties on flow and water distribution in polymer electrolyte fuel cells (PEFCs), Int. J. Hydrogen Energy. 43 (2018) 14034–14046. [CrossRef]
- L. Zhao, K.K. Choi, I. Lee, Metamodeling method using dynamic kriging for design optimization, AIAA J. 49 (2011) 2034–2046. [CrossRef]
- Lee, K.K. Choi, L. Zhao, Sampling-based RBDO using the stochastic sensitivity analysis and Dynamic Kriging method, Struct. Multidiscip. Optim. 44 (2011) 299–317. [CrossRef]
- J. Marcinkoski, J. Spendelow, A. Wilson, D. Papageorgopoulos, DOE Hydrogen and Fuel Cells Program Record - Fuel Cell System Cost - 2017, J. Mech. Robot. 9 (2017) 1–9. Available online: http://mechanismsrobotics.asmedigitalcollection.asme.org/article.aspx?doi=10.1115/1.4036738.
- S.T. Thompson, B.D. James, J.M. Huya-Kouadio, C. Houchins, D.A. DeSantis, R. Ahluwalia, A.R. Wilson, G. Kleen, D. Papageorgopoulos, Direct hydrogen fuel cell electric vehicle cost analysis: System and high-volume manufacturing description, validation, and outlook, J. Power Sources. 399 (2018) 304–313. [CrossRef]
- B.D. James, D.A. DeSantis, Manufacturing Cost and Installed Price Analysis of Stationary Fuel Cell Systems, Strateg. Anal. (2015) 1–143. Available online: https://www.sainc.com/assets/site_18/files/publications/sa-2015-manufacturing-cost-and-installed-price-of-stationary-fuel-cell-systems_rev3.pdf.
- J. Sinha, S. Lasher, Y. Yang, P. Kopf, Direct Hydrogen PEMFC Manufacturing Cost Estimation for Automotive Applications Fuel Cell Tech Team Review Acknowledgement and Disclaimer, (2008). Available online: www.TIAXLLC.com.
- B.D. James, J.M. Moton, W.G. Colella, Mass Production Cost Estimation of Direct H2 PEM Fuel Cell Systems for Transportation Applications: 2013 Update, ASME 2014 12th Int. Conf. Fuel Cell Sci. Eng. Technol. Collocated with ASME 2014 8th Int. Conf. Energy Sustain. (2014) V001T07A002–V001T07A002.
| Governing equations | ||
|---|---|---|
| Mass | (1) | |
| Momentum | (2) | |
| Species | Flow channels and porous media: |
(3) |
| Water transport in membrane: |
(4) | |
| Charge | Proton transport: |
(5) |
| Electron transport: |
(6) | |
| Energy | (7) | |
| Description | Expressions | |||
|---|---|---|---|---|
| Momentum | Porous media | |||
| Species | H2 in anode CL | |||
| O2 in cathode CL | ||||
| Water in anode CL | ||||
| Water in cathode CL | ||||
| Energy | In anode CL | |||
| In cathode CL | ||||
| In membrane | ||||
| Charge | In CLs: | |||
| Electrochemical reactions HOR on the anode side: ORR on the cathode side: |
||||
| Transfer current density, |
HOR in anode CL: |
(8) | ||
| ORR in cathode CL: |
(9) | |||
| Overpotential |
where |
(10) | ||
| Description | Value/ Expression | |
|---|---|---|
| Exchange current density of HOR × ECSA per unit CL volume, | 1.2 × 10¹⁰ A/m3 | [36] |
| Exchange current density for ORR, | 2.0 × 10⁻⁴ A/cm2-Pt | |
| Activation energy of anode, | 10.0 kJ/mol | [36] |
| Activation energy of cathode, | 70.0 kJ/mol | [36] |
| Transfer coefficient of HOR, | 1 | [37] |
| Transfer coefficient of ORR, | 1 | [37] |
| Reference H2/O2 molar concentration, | 40.88 mol/m3 | [36] |
| Permeability of GDL/CL, | 1.0 × 10⁻¹²/1.0 × 10−13 m2 | [38] |
| Equivalent weight of electrolyte in the membrane, | 1.1 kg/mol | [39] |
| Youngs modulus of GDL | 6.16MPa | [40] |
| Poisson ratio of GDL | 0.09 | [35] |
| Faraday’s constant, | 96,485 C/mol | |
| Universal gas constant, | 8.314 | |
| H2 diffusivity in the anode gas channel, | 1.1028 × 10⁻⁴ m2/s | [41] |
| H2O diffusivity in the anode gas channel, | 1.1028 × 10⁻⁴ m2/s | [41] |
| O2 diffusivity in the cathode gas channel, | 3.2348 × 10⁻⁴ m2/s | [41] |
| H2O diffusivity in the cathode gas channel, | 7.35 × 10⁻⁵ m2/s | [41] |
| Binary gas diffusivity ( | For nonporous regions |
(11) |
| Effective diffusivity ( | For porous regions |
(12) |
| Description | Expression | |
|---|---|---|
| Mixture density ( | (13) | |
| Gas mixture density | (14) | |
| Mixture velocity ( | (15) | |
| Mixture mass fraction | (16) | |
| Relative permeability | (17) (18) |
|
| Kinematic viscosity of the two-phase mixture | (19) | |
| Kinematic viscosity of the gas mixture |
where and , T in kelvin |
(20) (21) (22) |
| Relative mobility | (23) (24) |
|
| Diffusive mass flux | (25) | |
| Capillary pressure Pc | (26) | |
| Leverett function J(s) | (27) |
| Description | Expression | |
|---|---|---|
| Membrane water content (λ) |
Water activity, [00] |
(28) (29) |
| Electro-osmotic drag (EOD) coefficient of water | (30) | |
| Proton conductivity () | (31) | |
| Water diffusion coefficient () | (32) | |
| Interfacial resistance of the water film | (33) |
| Parameters | Baseline design | Optimization approach | ||
|---|---|---|---|---|
| DDO | ||||
| , [mm] | 0.215 | 0.188 | 0.139 | 0.172 |
| , [mm] | 0.54 | 0.300 | 0.382 | 0.349 |
| , [mm] | 1 | 0.614 | 0.855 | 0.687 |
| , [mm] | 1 | 0.310 | 0.300 | 0.300 |
| 0.681 | 0.712 | 0.710 | 0.711 | |
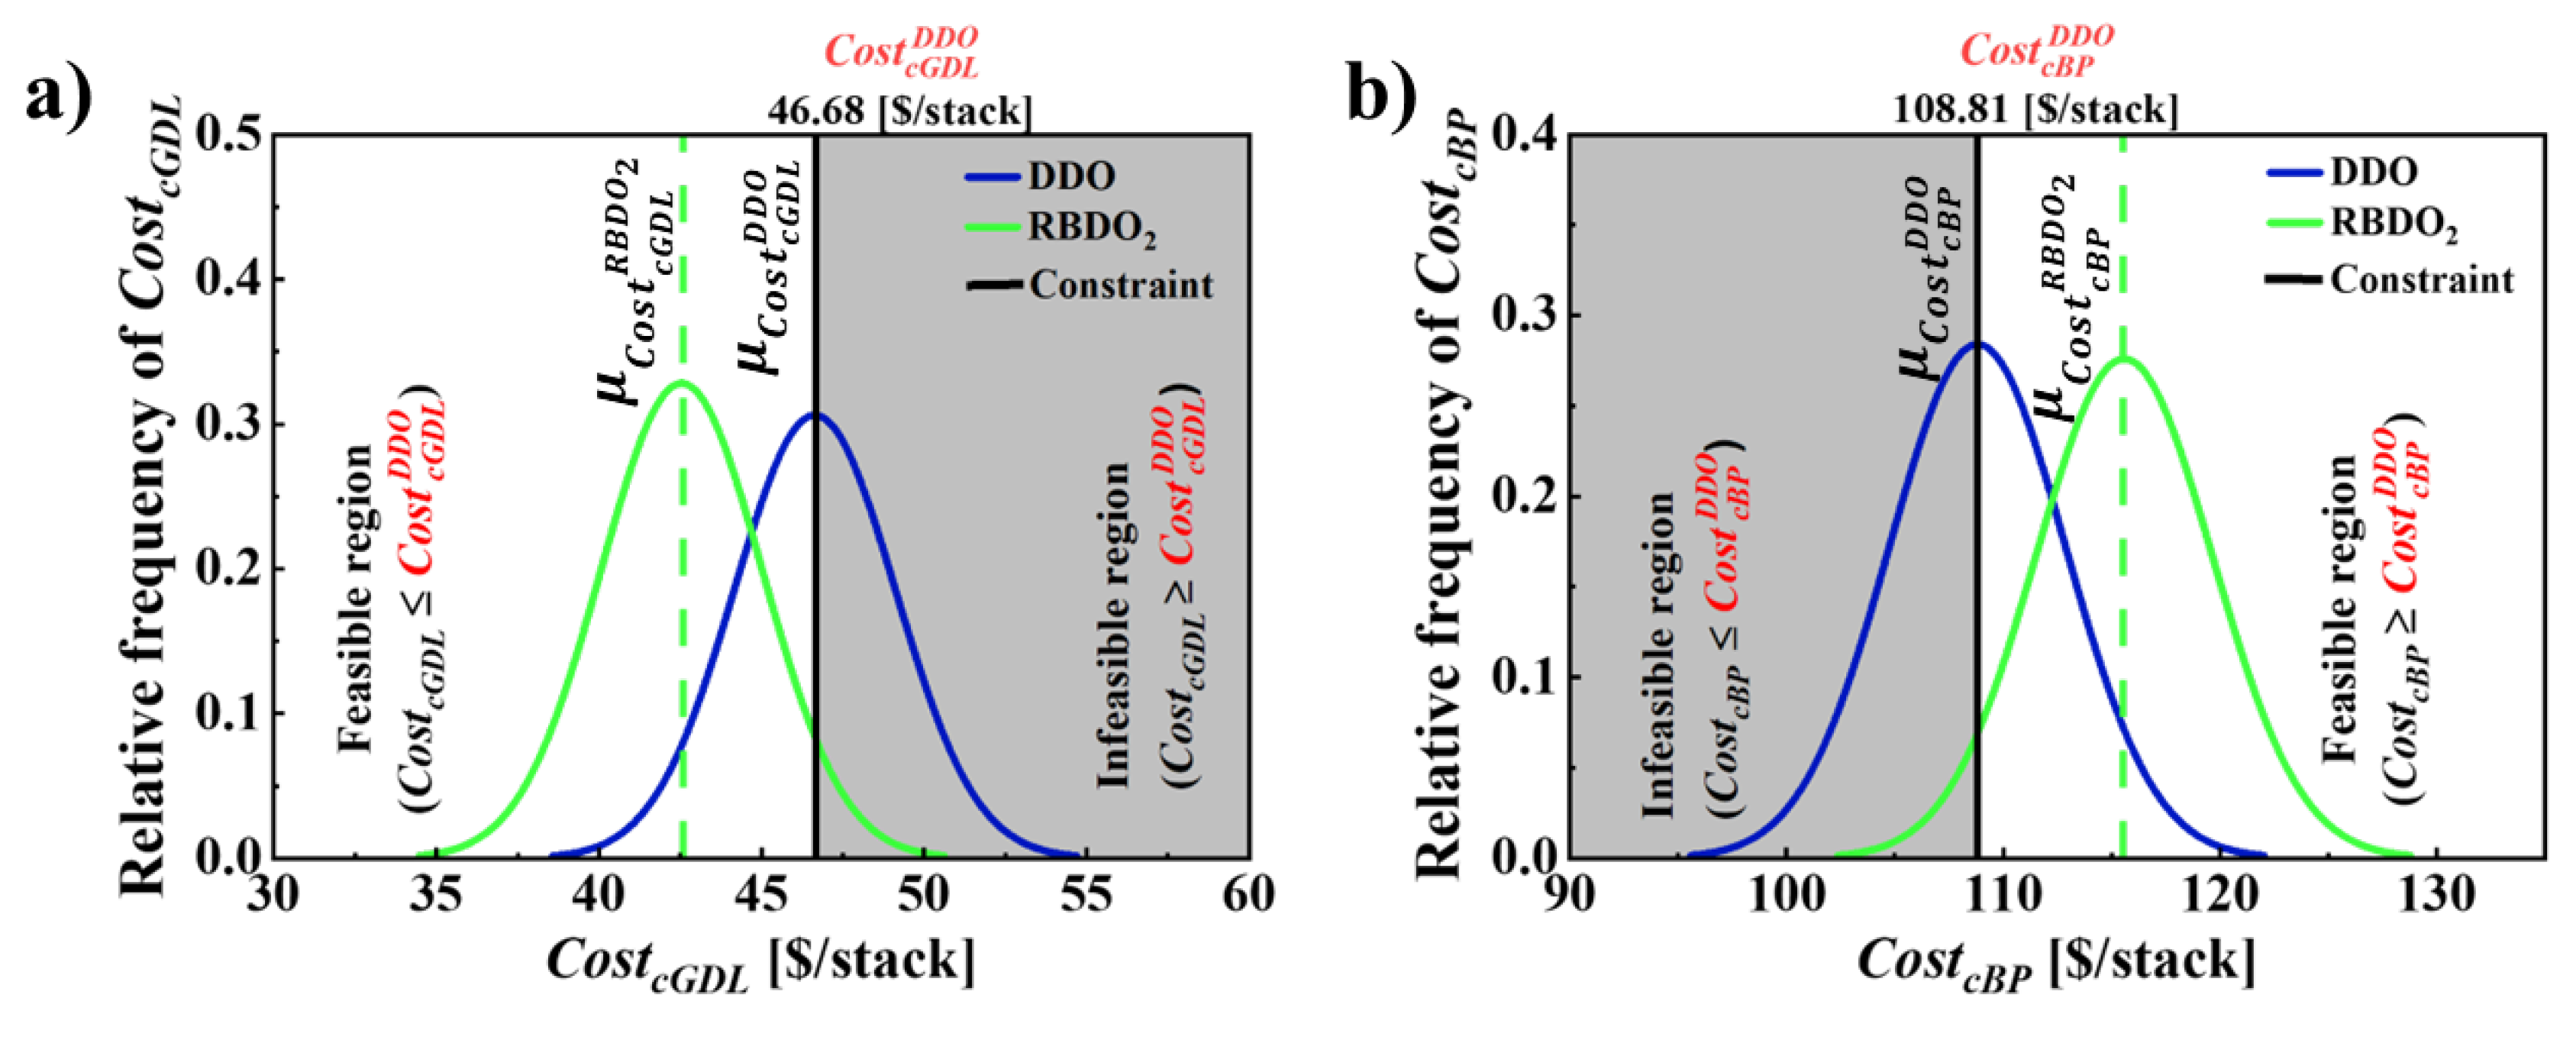
| [$/stack] | 53.38 | 46.68 | 34.43 | 42.59 |
| [$/stack] | 141.45 | 108.81 | 119.99 | 115.52 |
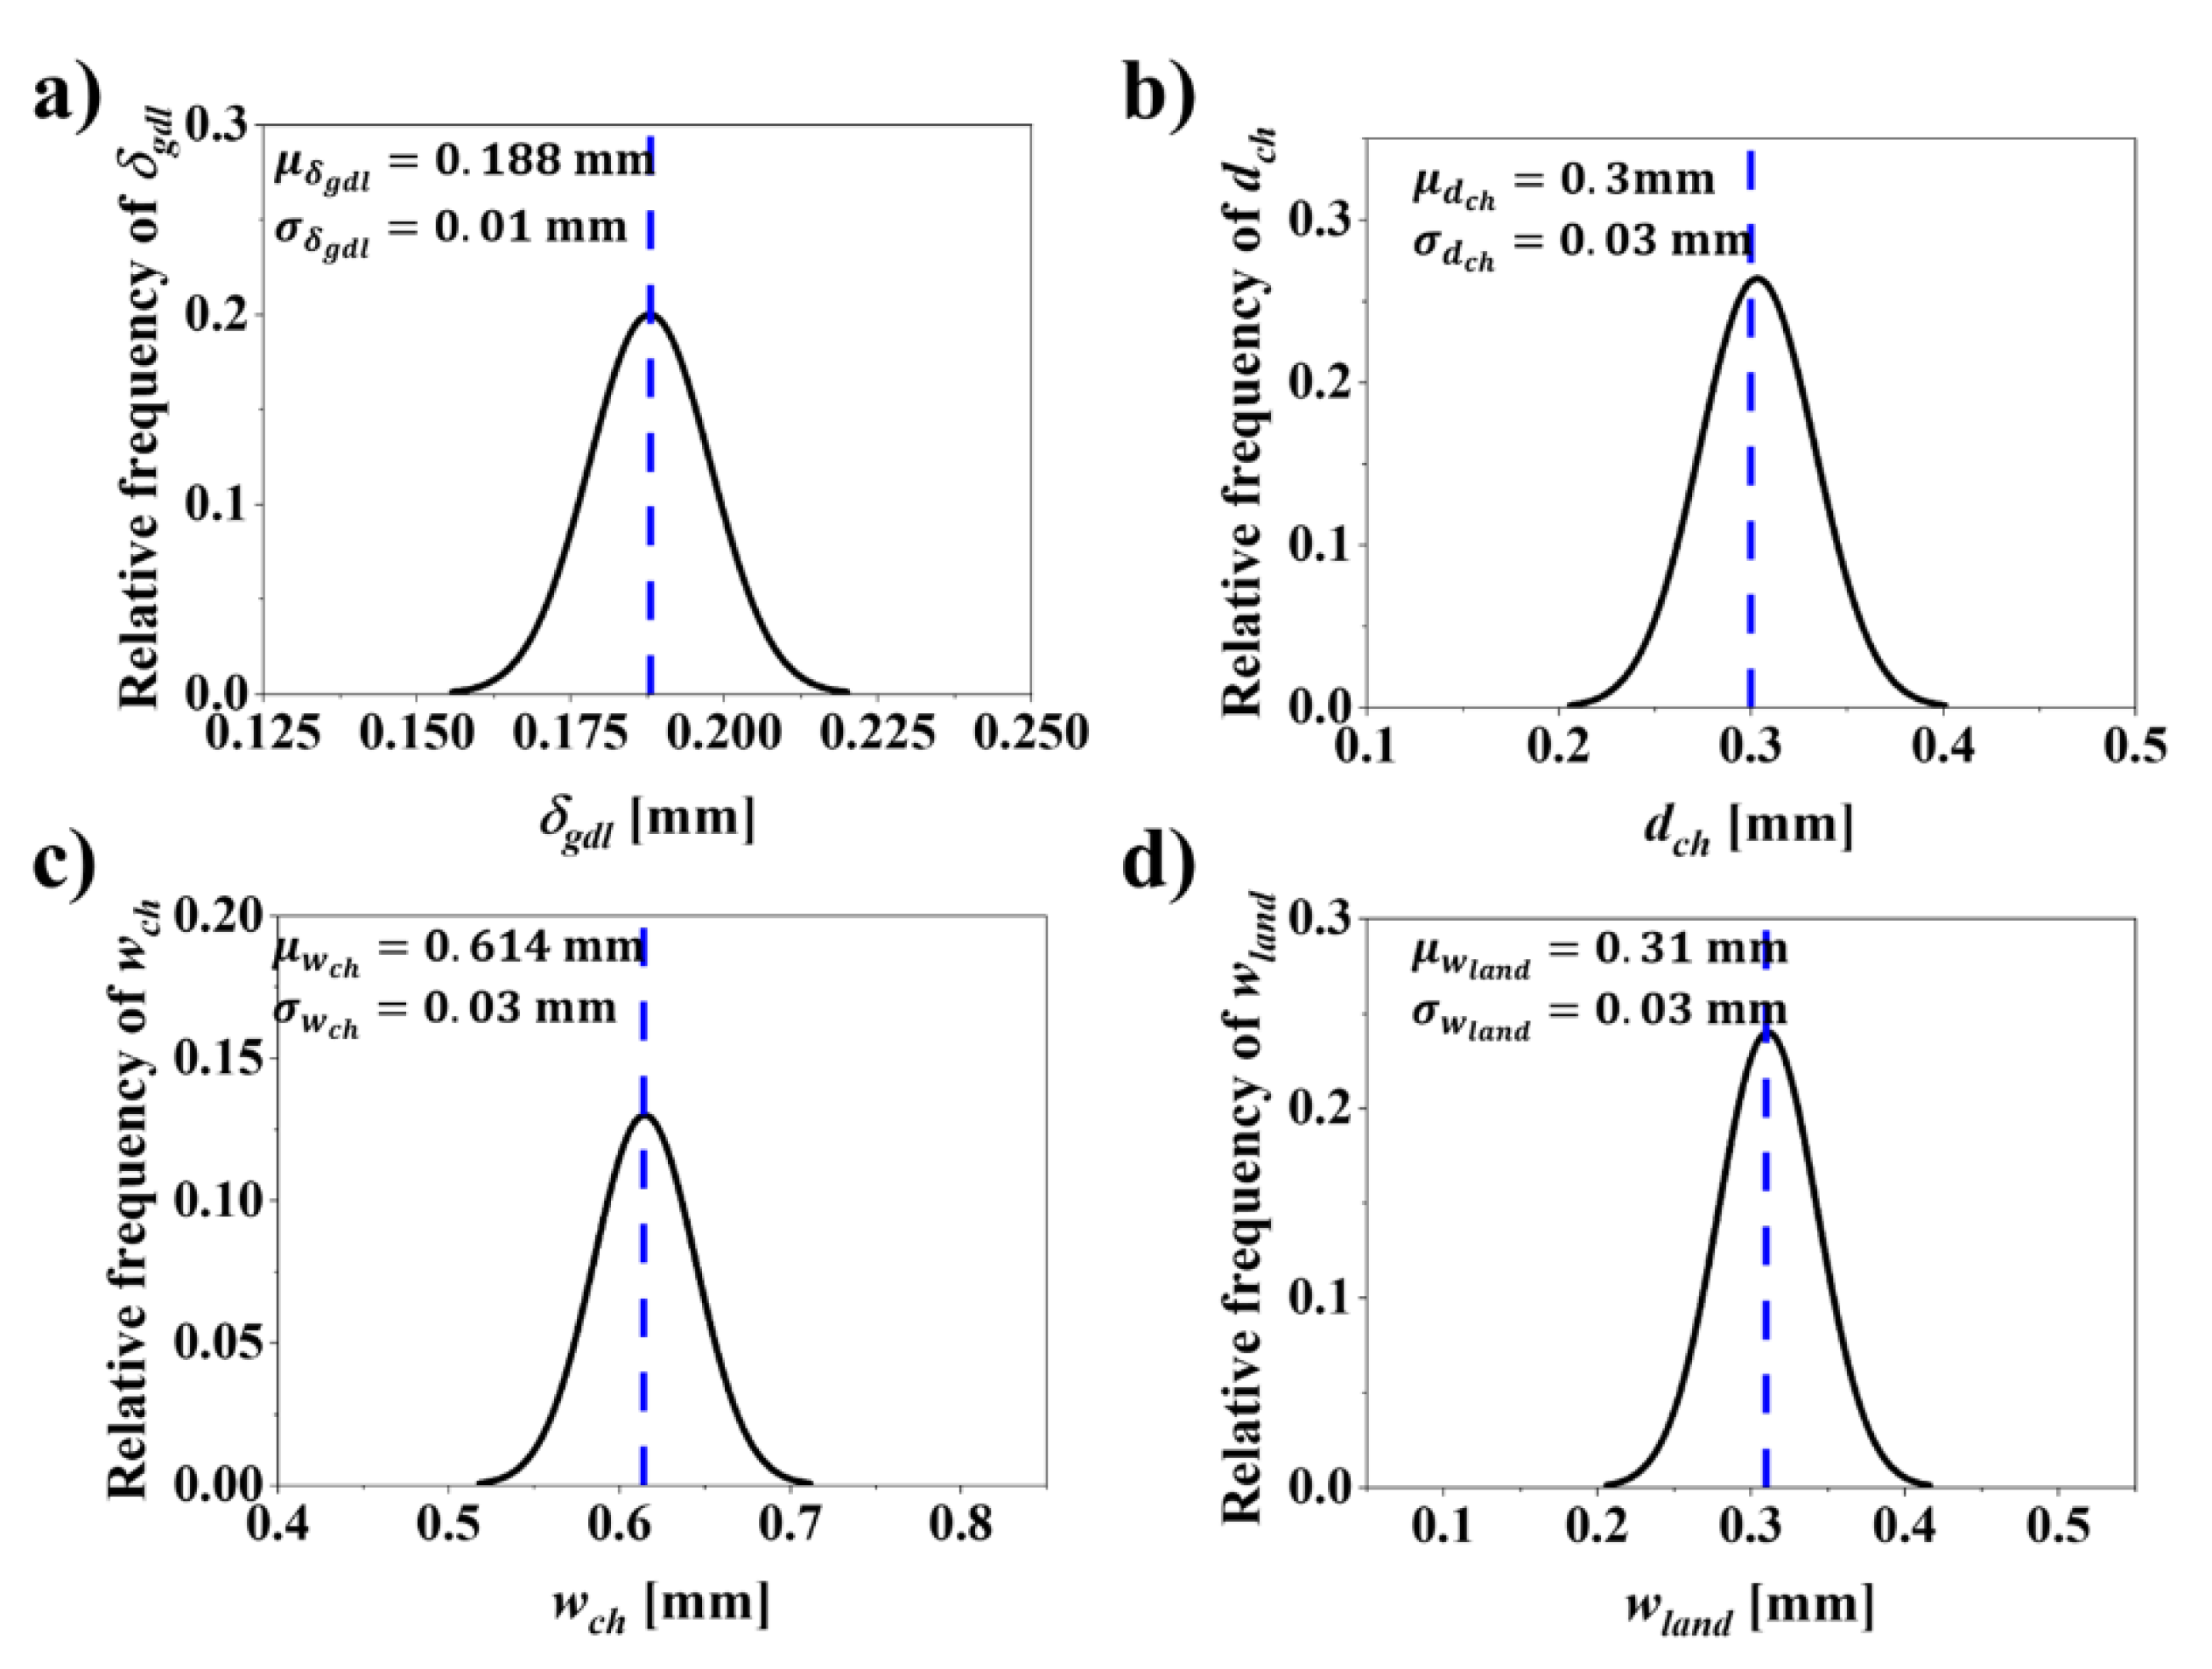
| Design variables | Distribution | Mean (μ) [mm] | Standard deviation ), [mm] | |
|---|---|---|---|---|
| DDO | ||||
| GDL thickness (), [mm] | Normal | 0.188 | 0.03 | 0.01 |
| Channel depth (), [mm] | Normal | 0.3 | 0.05 | 0.03 |
| Channel width (), [mm] | Normal | 0.614 | 0.05 | 0.03 |
| Land width (), [mm] | Normal | 0.310 | 0.05 | 0.03 |
| Case | Parameter | Optimization approach | |||||||
|---|---|---|---|---|---|---|---|---|---|
| RBDO | |||||||||
| Reliability [%] |
Nominal value [$/stack] | Mean value () [$/stack] | Standard deviation () [$/stack] | Reliability [%] | Nominal value [$/stack] | Mean value () [$/stack] | Standard deviation () [$/stack] | ||
| 1 | [$/stack] | 49.87 | 46.68 | 46.68 | 7.45 | 95.00 | 34.43 | 34.42 | 7.44 |
|
[$/stack] |
50.00 | 108.81 | 108.81 | 6.78 | 94.99 | 119.99 | 120.0 | 6.80 | |
| 2 |
[$/stack] |
49.87 | 46.68 | 46.68 | 2.48 | 95.02 | 42.59 | 42.58 | 2.48 |
|
[$/stack] |
50.00 | 108.81 | 108.81 | 4.07 | 94.99 | 115.52 | 115.51 | 4.08 | |
Disclaimer/Publisher’s Note: The statements, opinions and data contained in all publications are solely those of the individual author(s) and contributor(s) and not of MDPI and/or the editor(s). MDPI and/or the editor(s) disclaim responsibility for any injury to people or property resulting from any ideas, methods, instructions or products referred to in the content. |
© 2024 by the authors. Licensee MDPI, Basel, Switzerland. This article is an open access article distributed under the terms and conditions of the Creative Commons Attribution (CC BY) license (http://creativecommons.org/licenses/by/4.0/).


