1. Introduction
The methods of chloride ion determination in aqueous solutions usually bases on volumetric [
1], potentiometric – Ion Selective Electrode, [
1,
4], liquid chromatography [
1,
2,
3] and spectrophotometry techniques [
1]. All of them gives reliable results in media with low or moderate ion strength (diluted solutions of accompanying agents) and preferably neutral pH. The methods are effective in determination of Cl
- ions in variety of waters, such as sea water, tap waters and selected waste waters [
1]. Application of listed above methods are difficult or even impossible for samples containing high concentration of other ionic substances especially acids or complexation agents. In this case analyzed samples must be specifically adapted to technical requirements of applied techniques (titration, potentiometric or liquid chromatography) [
4,
5]. Those specific requirements usually eliminate above listed methods as a direct analytical method for determination of chloride ions in electroplating baths. It is especially difficult in the case of analyzing acidic copper plating baths. Commonly used in this case Mohr titration procedure [
6] requires pretreatment of analyzed solution and often gives results seriously differ from real value. Those reasons induced our efforts to develop simple direct method for determination of Cl
- ions in the range of 10 to 100 ppm in highly acidic media containing high concentration of copper sulfate. The natural simple solution of the problem is applying of voltammetric method. Chloride ion – gaseous chorine is a red-ox couple of standard potential of 1.36 V [
7], what means that signal of oxidation of Cl
- ion should be noticeable in acidic aqueous solution. Described in this paper method of chloride determination adopted linear scan and cyclic voltammetry [
8] as reliable analytical procedures efficient in determination of chlorine in acidic media of high ionic strength.
2. Materials and Methods
2.1. Apparatus
Electrochemical measurements and depositions were carried out with the electrochemical workstation OrigaFlex-OGF01A, (OrigaLys ElectroChem SAS, France). The temperature of the measured bath was kept at 25 ± 1.0 °C.
Cyclic voltammetry was chosen as an electrochemical method for determining the content of chloride ions in acid copper sulfate plating baths used for the production of Printed Circuit Boards (PCBs).
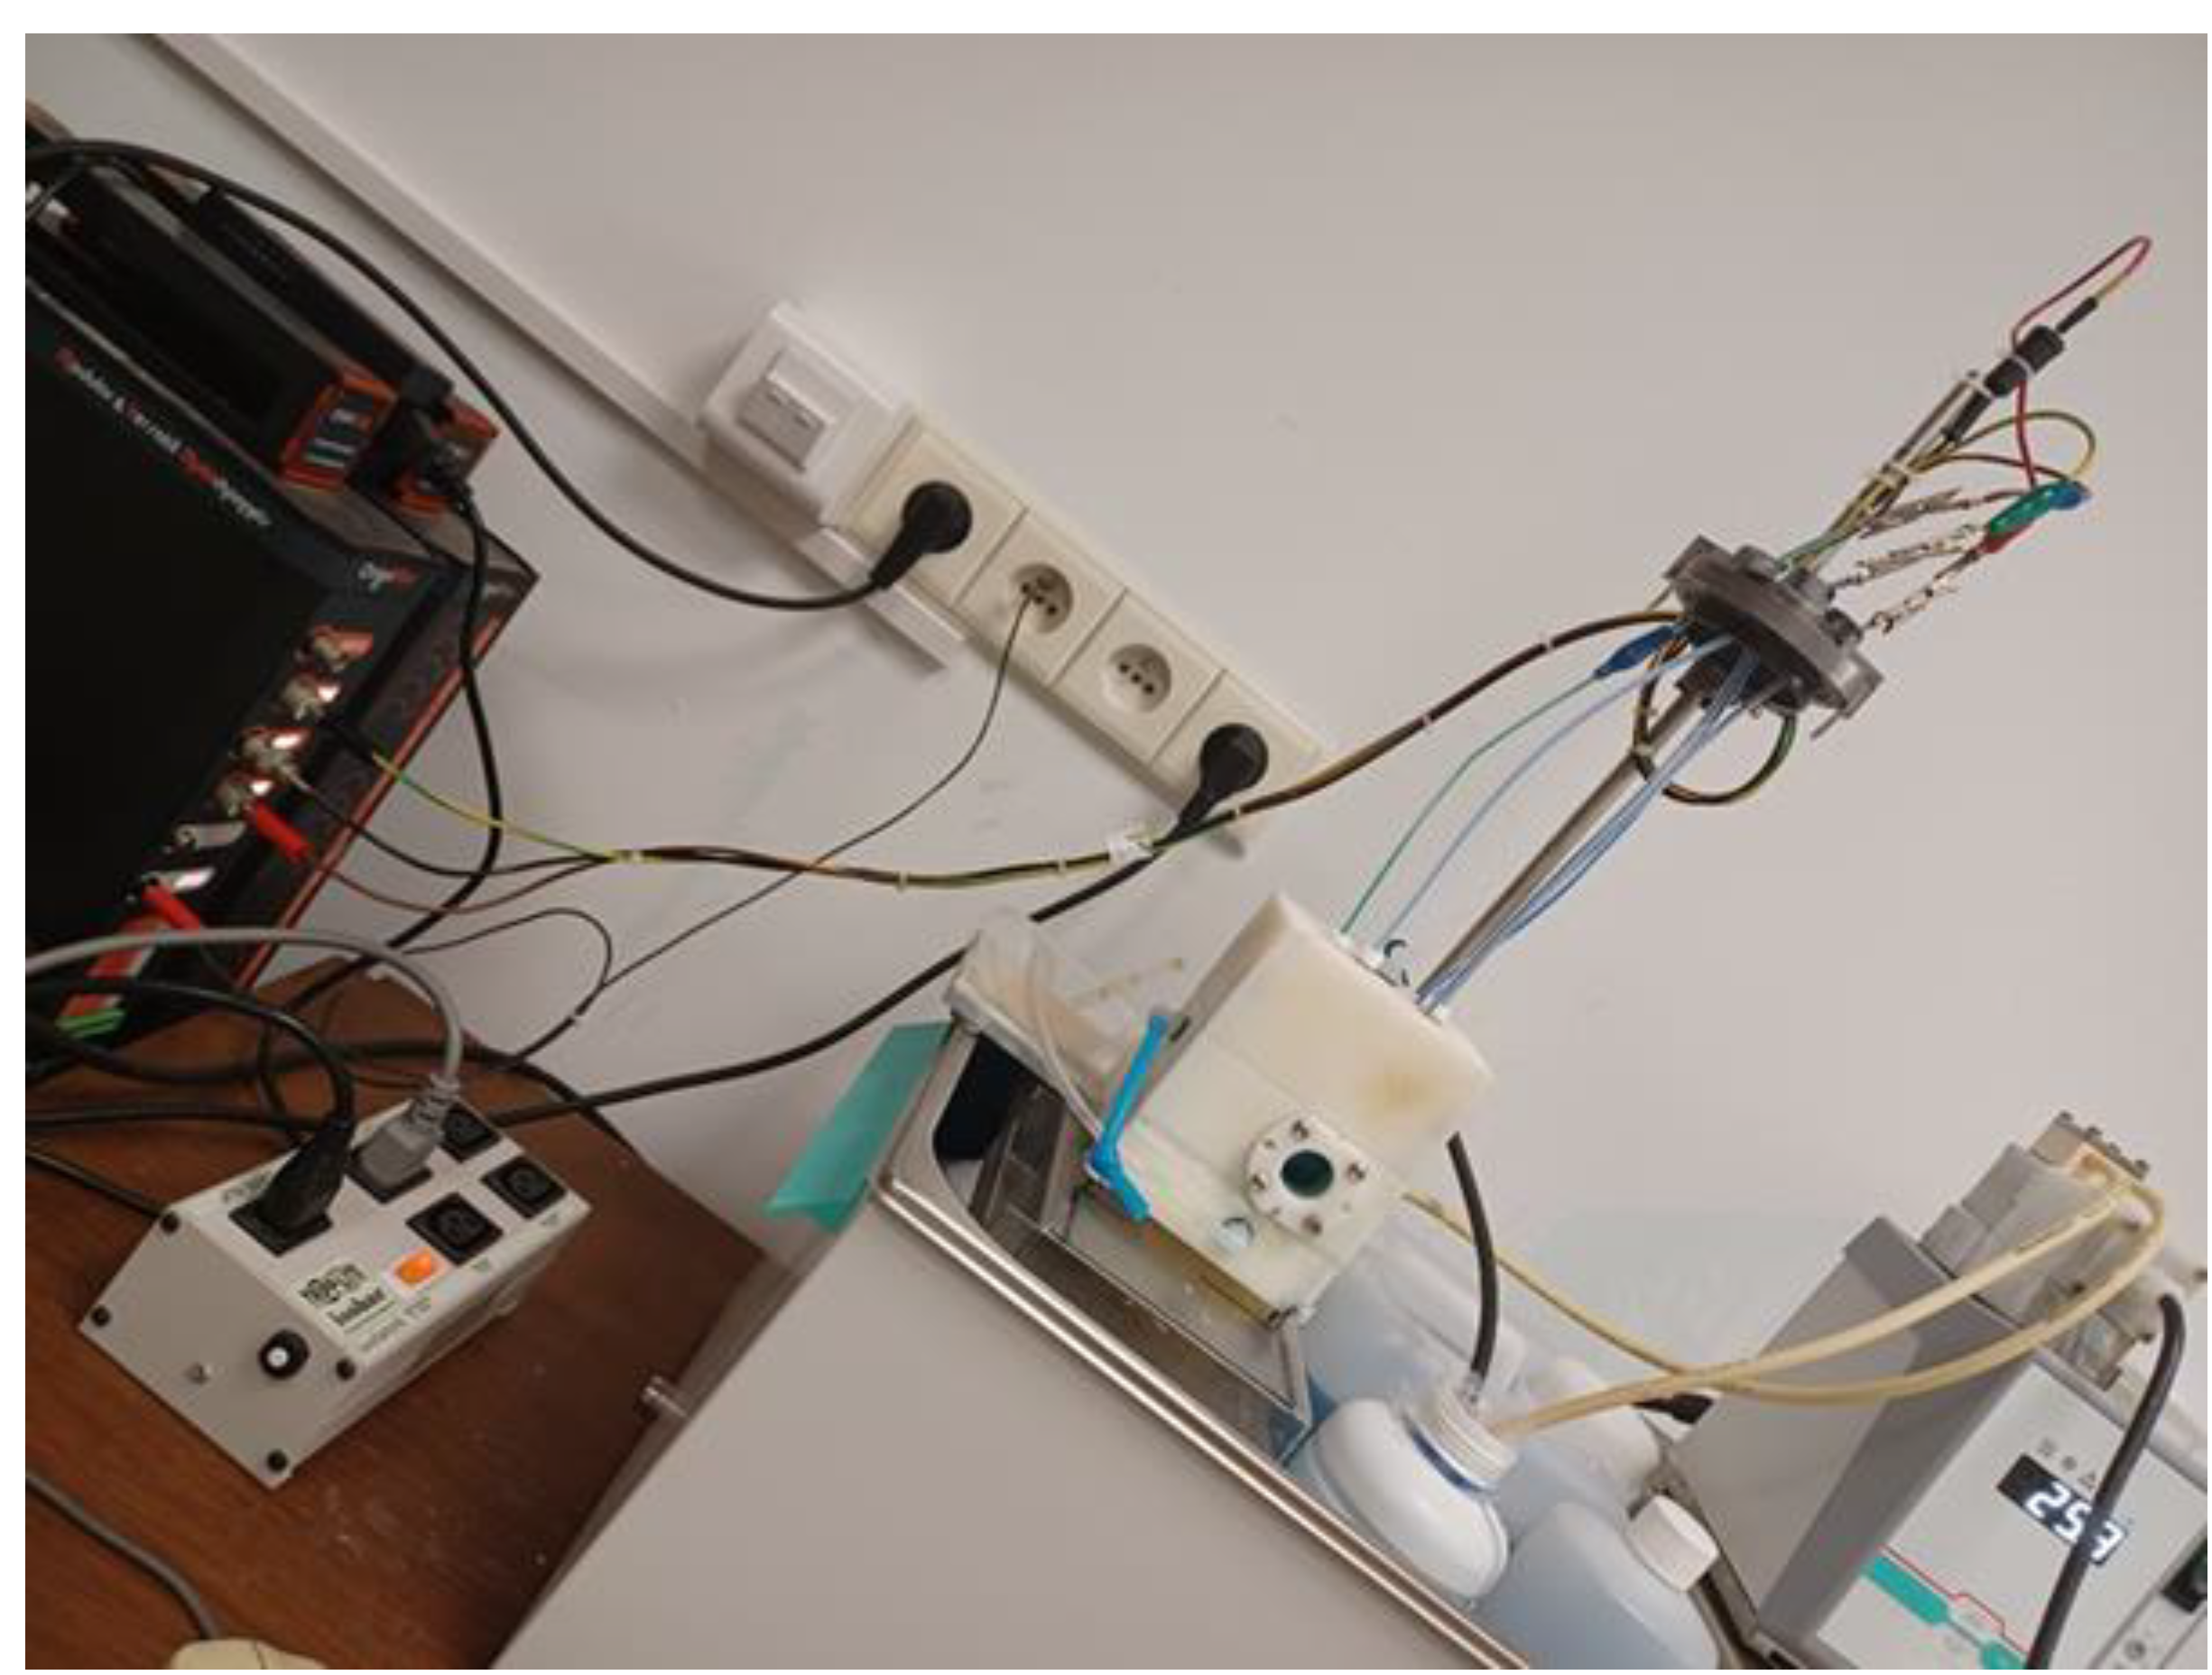
The chloride determination process was carried out in a special designed voltammeric cell. Design, manufacture and testing of a measuring cell was done in-house. A prototype of the voltammetric cell is illustrated in
Figure 1. The working volume of the above measuring cell is approximately 70 cm
3. Commercially available completely inert plastic was selected as the building material for the production of a dedicated measuring cell. The reference electrode is prepared in this cell. In addition, this cell is also used to perform analytical measurements of the tested sample of the electroplating solution.
Cylindrical polycrystalline platinum electrode with a surface about 0.38 cm2 (dimensions - length 12 mm, diameter 1 mm) was employed as a working electrode (WE). The counter electrode (CE) was a polycrystalline platinum pipe-shaped foil, the surface of which was approximately 20 times larger than the surface of the working electrode. As a reference electrode (RE), cylindrical polycrystalline platinum electrode with a surface about 0.38 cm2 covered with a copper layer (called as copper reference electrode (Cu2+/Cu)). The copper film was produced by electrodeposition at a cathodic current density of 1.5 A/dm2. During the electrodeposition of a copper layer on the surface of a polycrystalline platinum electrode, efficient mechanical agitation of the plating bath was used.
Cathodic current density was controlled by OrigaFlex-OGF01A galvanostat/potentiostat. Deposition time was fixed at 5 min, which resulted in about 1.3 µm thick layers. Two anodes are used in the system. This option was used to obtain a copper layer of the most uniform thickness for the entire surface of the platinum cylindrical cathode.
All the potentials recorded in this study were related to this reference electrode (Cu2+/Cu). For all cyclic voltammetry (CV) measurements a three - electrode system was used. CV measurements of chloride content were performed between 0.6 V and 1.35 V at a scan rate of 100 mV/s.
2.2. Analytical Measurement Procedure
A special analytical procedure has been developed for chlorides as a component of the acid copper sulfate plating baths. Quantitative measurements of chlorides were carried out using the cyclic voltammetry (CV) technique.
The procedure for quantitative determination of chlorides consists of the following steps:
Quasi - Reference Electrode (Cu2+/Cu) Preparing
Preparation of the working electrode surface in order to obtain constant and repeatable measurement conditions (electrochemical treatment by application of a potential of +1.8 V vs. Cu2+/Cu for 20 s)
Quantitative measurement scan preparing (Circulation period of the tested sample for 20 s, Rest period of the tested sample for 20s, application of 4 voltametric cycles in the range 0.6/1.35 V)
Performing a quantitative measurement of chlorides (application of one voltametric cycle in the range 0.6 /1.35 V vs Cu2+/Cu at 100 mV/s).
Ending of the measuring sequence (electrochemical treatment by application of a potential of +1.8 V vs. Cu2+/Cu for 20 s)
2.3. Chemicals
Copper Sulfate pentahydrate concentrate solution semiconductor grade (Moses Lake Industries) and H2SO4 (analytical reagent grade) were used for preparing the Virgin Makeup Solution. The additives used were ELECTROPOSIT™ M Additive (suppressor) and ELECTROPOSIT 1300 S (accelerator) from DuPont formerly Dow) and Cl− was sourced from HCl (standard solution 1 mol/dm3, Chempur).
The ELECTRODEPOSITION
TM 1300 Acid Copper For PWB Metallization Applications plating process is designed for reliable through - hole plating of multilayer and double-sided printed circuit boards (PCBs). Deionized water (resistivity around 18 MΩ-cm, Millipore, MiliQ™) was used in preparation of all solutions. The tested electrolyte composition was obtained from industry recommended values (*). The compositions of the additive - containing plating bath are presented in
Table 1.
3. Results
3.1. Reference Electrode Selection (Prerparation) and Testing Its Potential Stability
Tri-electrode system was used in the development of the voltammetric method of chloride determination. The system requires a reference electrode. The use of commercially available reference electrodes (silver chloride or saturated calomel electrode) in chloride determination in acidic sulphate baths (used in printed circuit board production) proved cumbersome. The commercial electrodes may contaminate the analyte with chloride ions; additionally, the electrode needs topping up periodically.
The need to maintain the concentrations of all working components of the acid copper plating bath in a very narrow working range, including the concentration of copper sulphate (within ± 5% of the optimal value), makes it possible to use a system consisting of a cylindrical platinum electrode covered with a copper layer as the quasi - reference electrode [
9].
The copper film was produced by electrodeposition at a cathodic current density of 1.5 A/dm
2. Two anodes are used in the system. This solution was to obtain a copper layer of the most uniform thickness for the entire surface of the cylindrical cathode. The acid copper plating bath constituents for quasi-reference electrode and the plating parameters are given in
Table 2.
Three deposition times were selected: 2 min., 5 min. and 15 min.. The average thickness of the layers increased in proportion to the electrolysis time. For 2 minutes, it was approximately 0.5 micrometers. However, for 5 minutes it was about 1.3 microns, and for 15 minutes it was about 4 microns. Quasi- reference electrodes generated for 5 minutes were selected for OCP tests.
The quasi - reference electrode (Cu
2+/Cu) potentila stability was quantified using open circuit cell potential [
10] measured against silver chloride electrode (with saturated KCl solution) with a salt bridge at 298 K (25 °C).
Two types of copper plating solutions were tested. The first was a newly prepared acid copper plating bath containing optimal concentrations of organic and inorganic components and and free from any organic or non-organic contamination. The second solution type was a production bath, where component concentrations were within the range specified for a given technology (ELECTRODEPOSITION
TM 1300 Acid Copper For PWB Metallization Applications). The second type type consists of two samples. The sample marked No. 1 was less contaminated by breakdown products. The sample marked no. 2 was taken from the production plating bath after aging increased by 150 Ah/L compared to the sample marked no. 1. Chemical composition of the samples of the acidcopper baths used for the OCP potential stability measurements are presented in
Table 3.
This selection of acid copper plating bath samples used in industrial conditions resulted from the fact that with the process of electroplating, the accumulation of a series of by-products of plating solution additives will directly affect the hole filling ability and deep plating ability of the plating solution and the uniformity of copper coating thickness. Improper growth control process will directly lead to lose, rough, porous or broken of copper coating surface crystals, resulting in excessive hole filling depression value, insufficient deep plating, and decreased uniformity of copper coating thickness [
11].
To conduct studies on the stability of the quasi-reference electrode potential using the OCP method, the following procedure was proposed. In the first stage of the study, a quasi-reference electrode was made for each bath sample (described in table aaa), and then its stability was tested in a freshly prepared plating bath (describe in table aaa as bbb). In the second stage, the quasi-reference electrode was re-manufactured for each tested sample of the plating bath. This time, the OCP method measurement was conducted in the same solution from which the quasi-reference electrode was made.
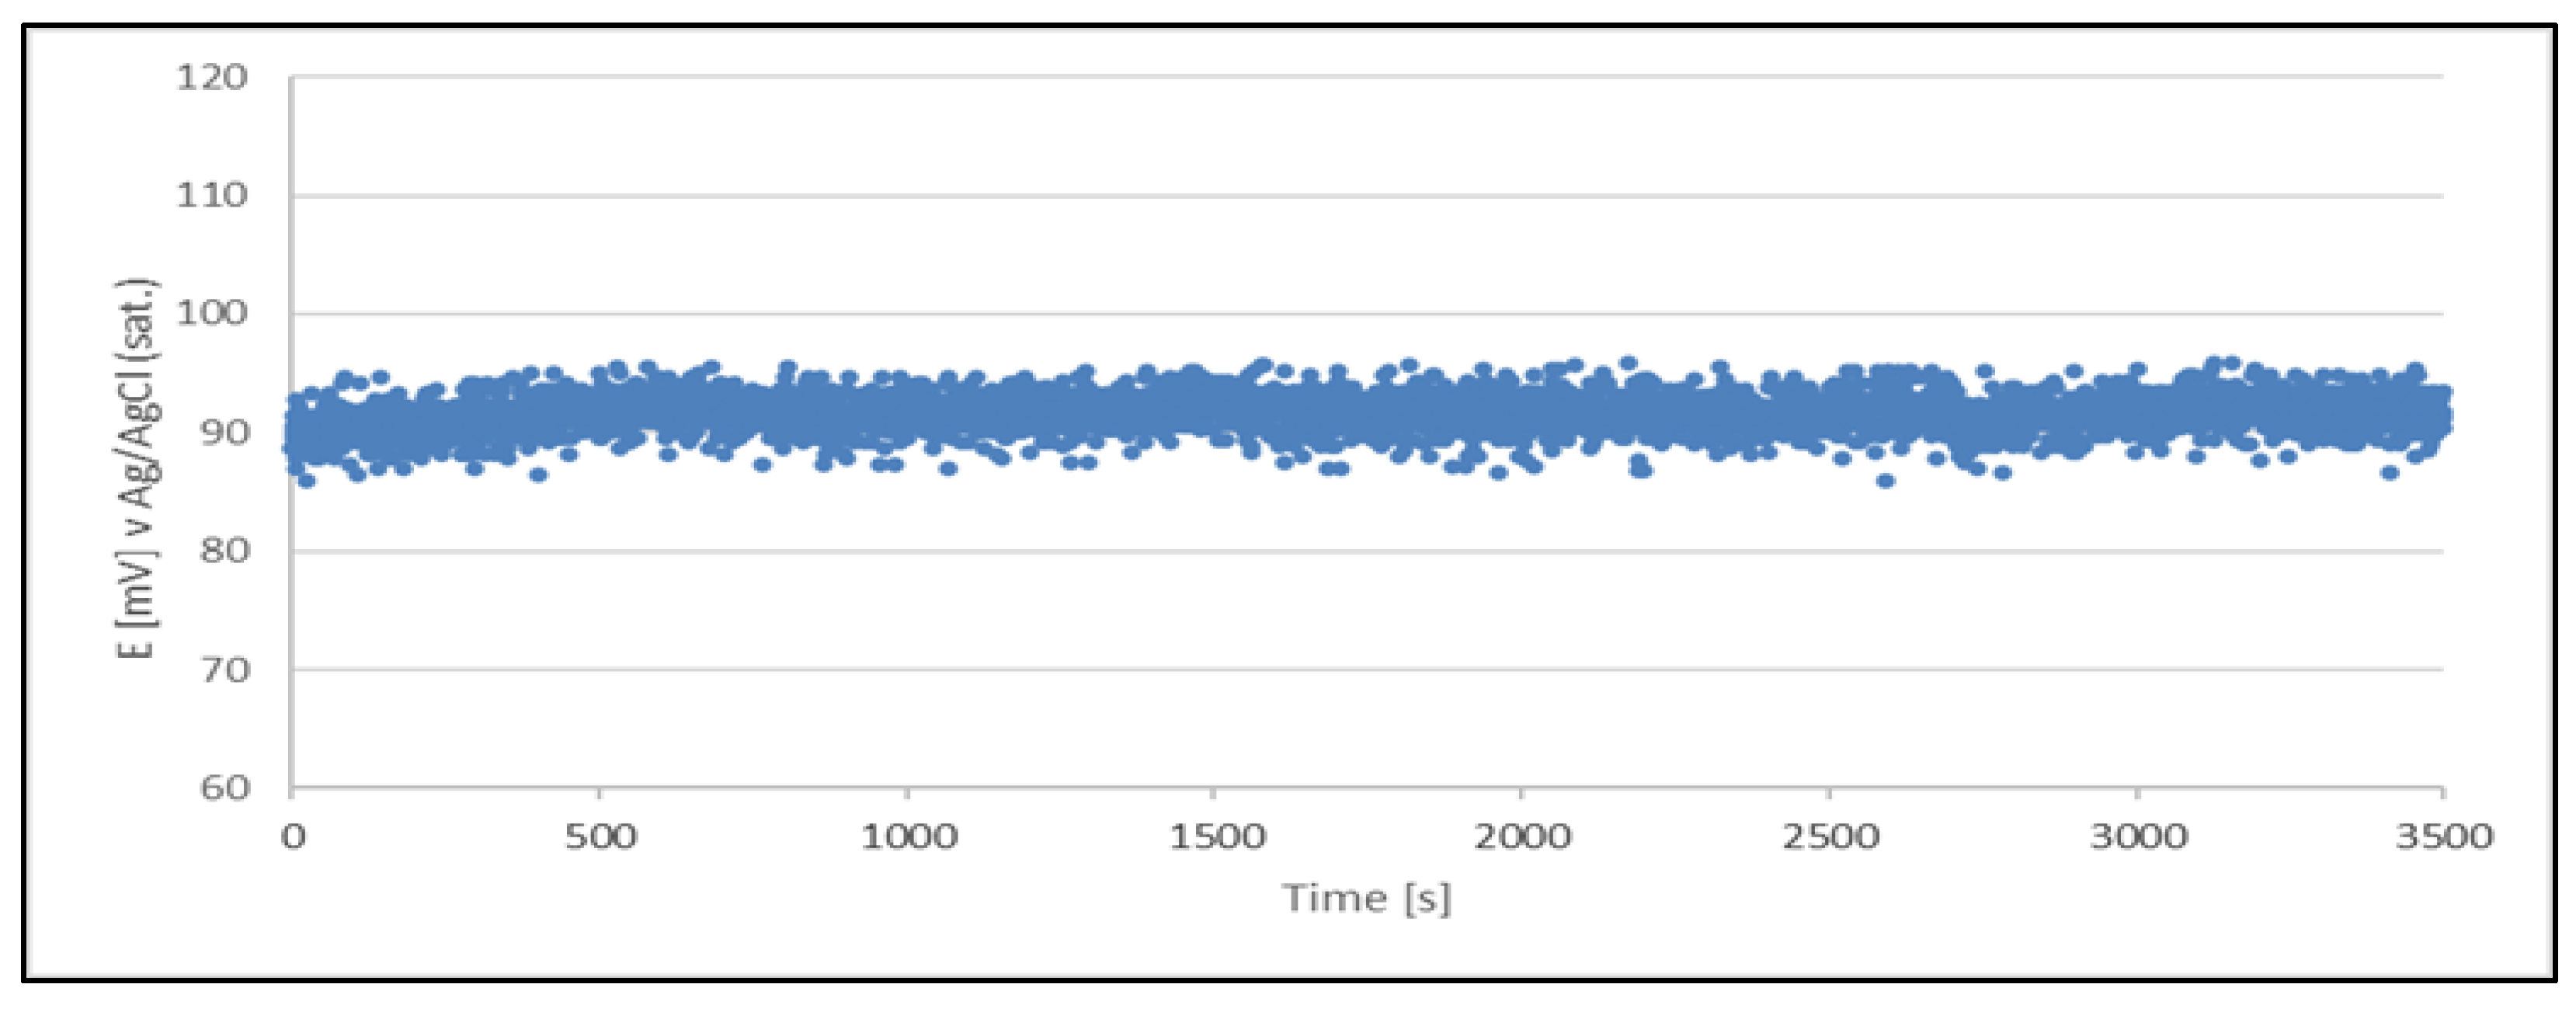
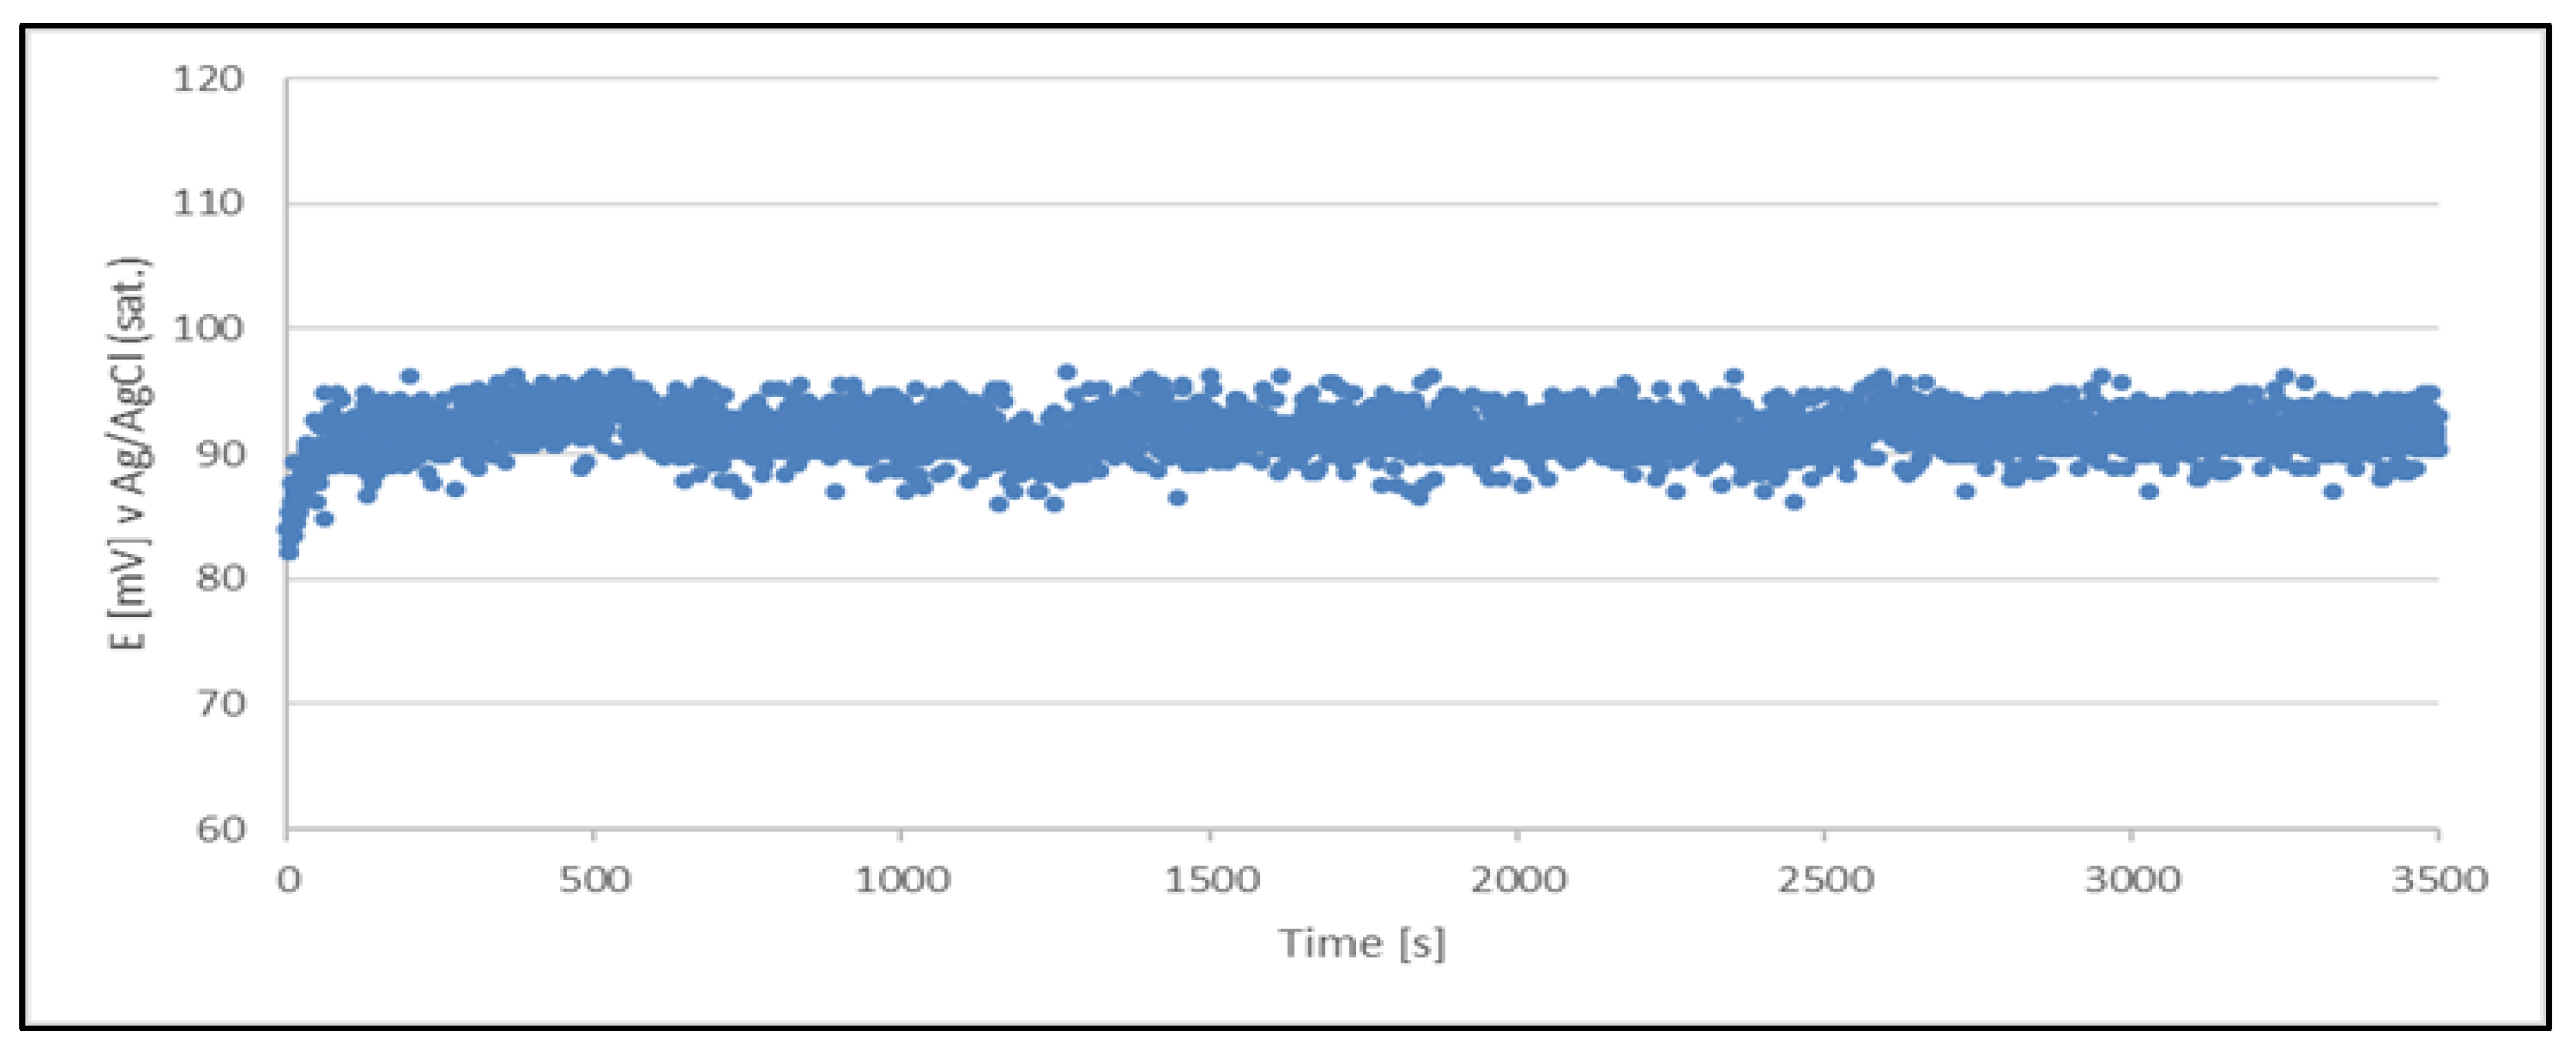
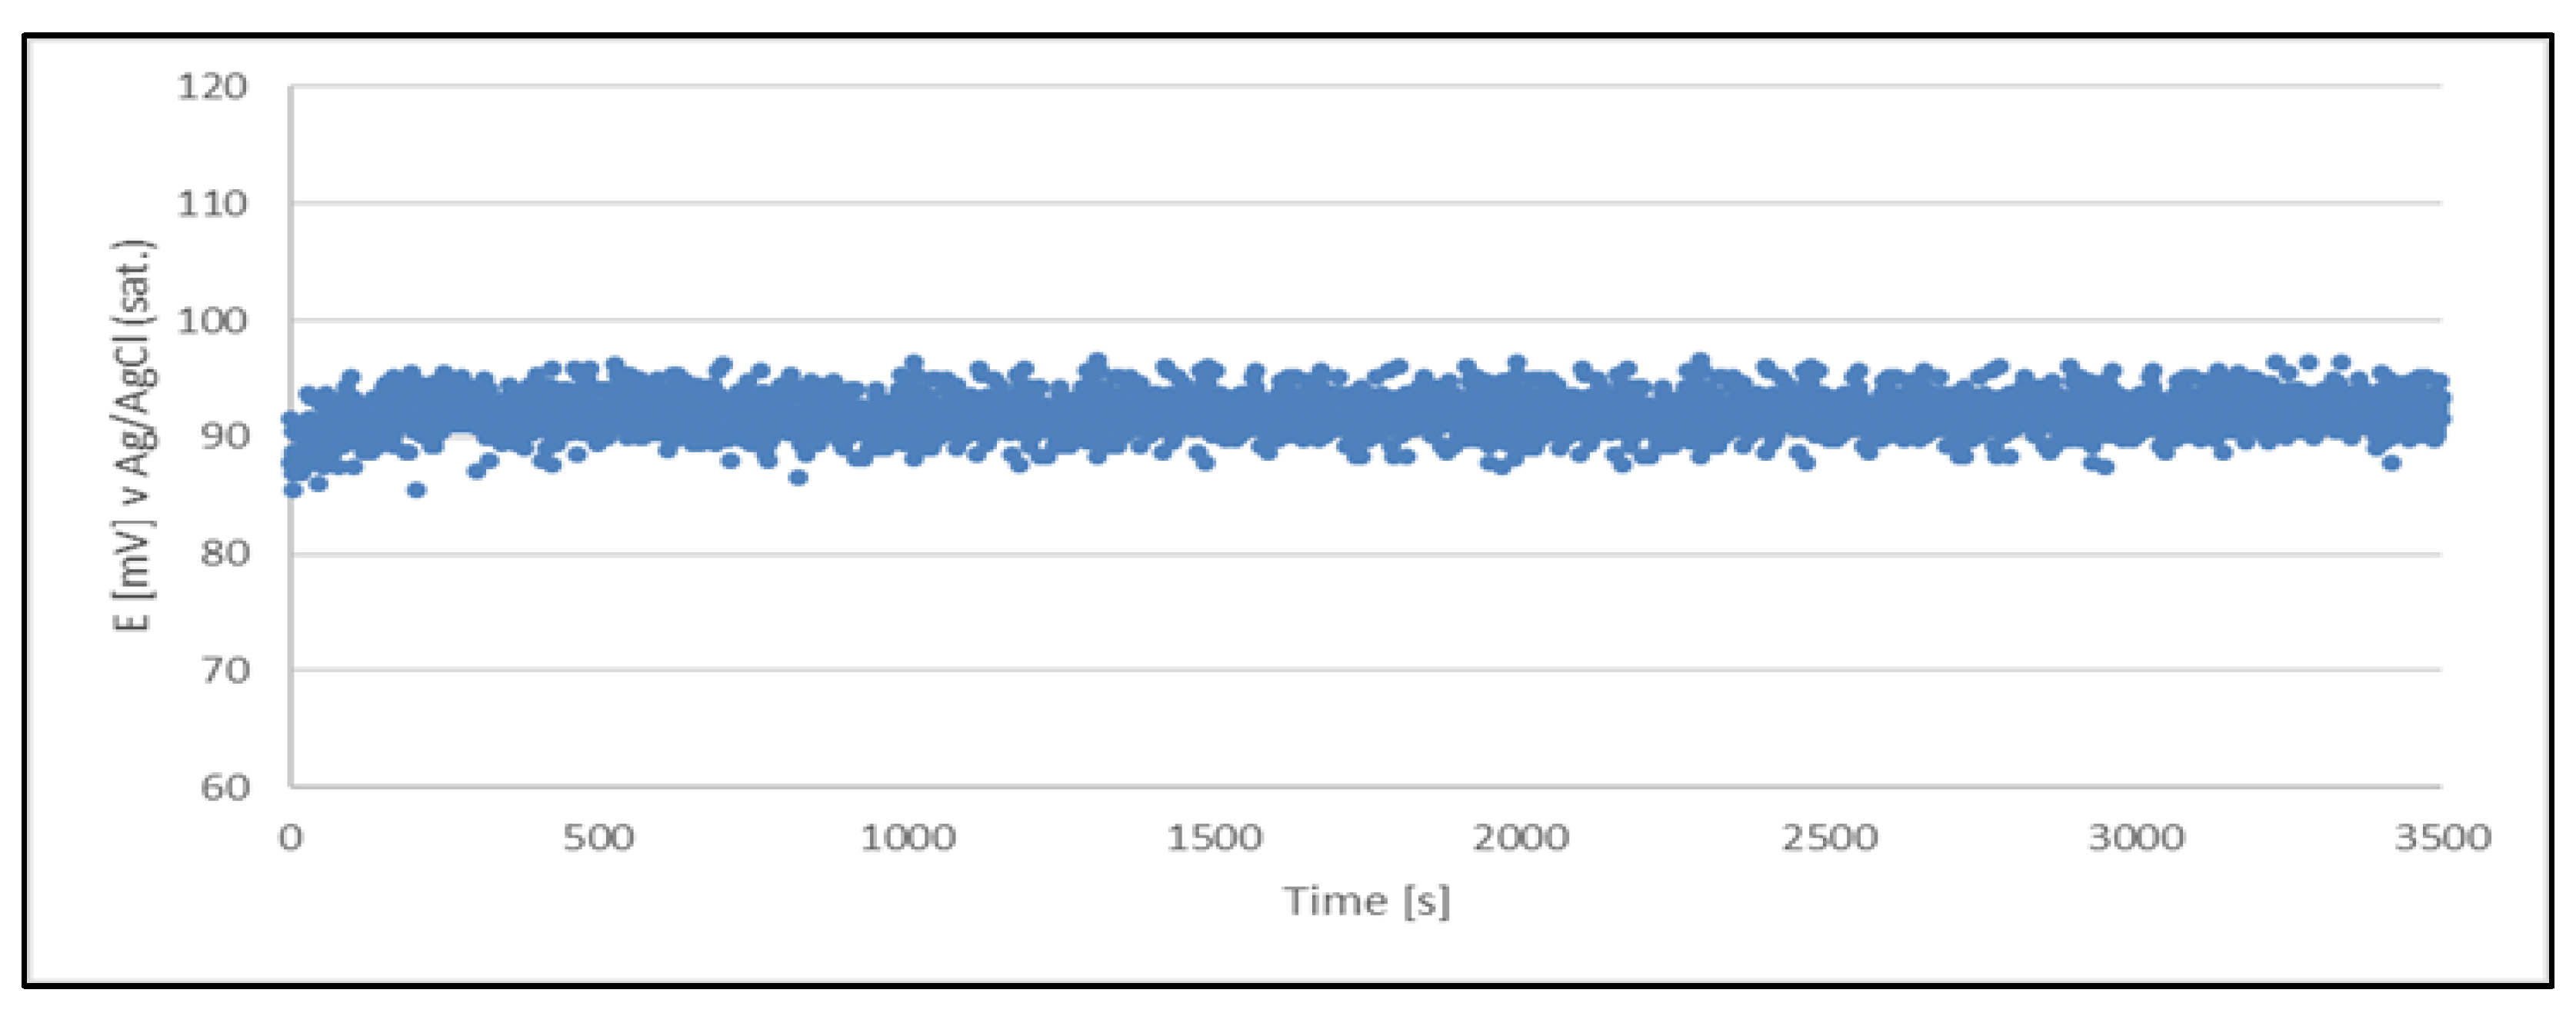
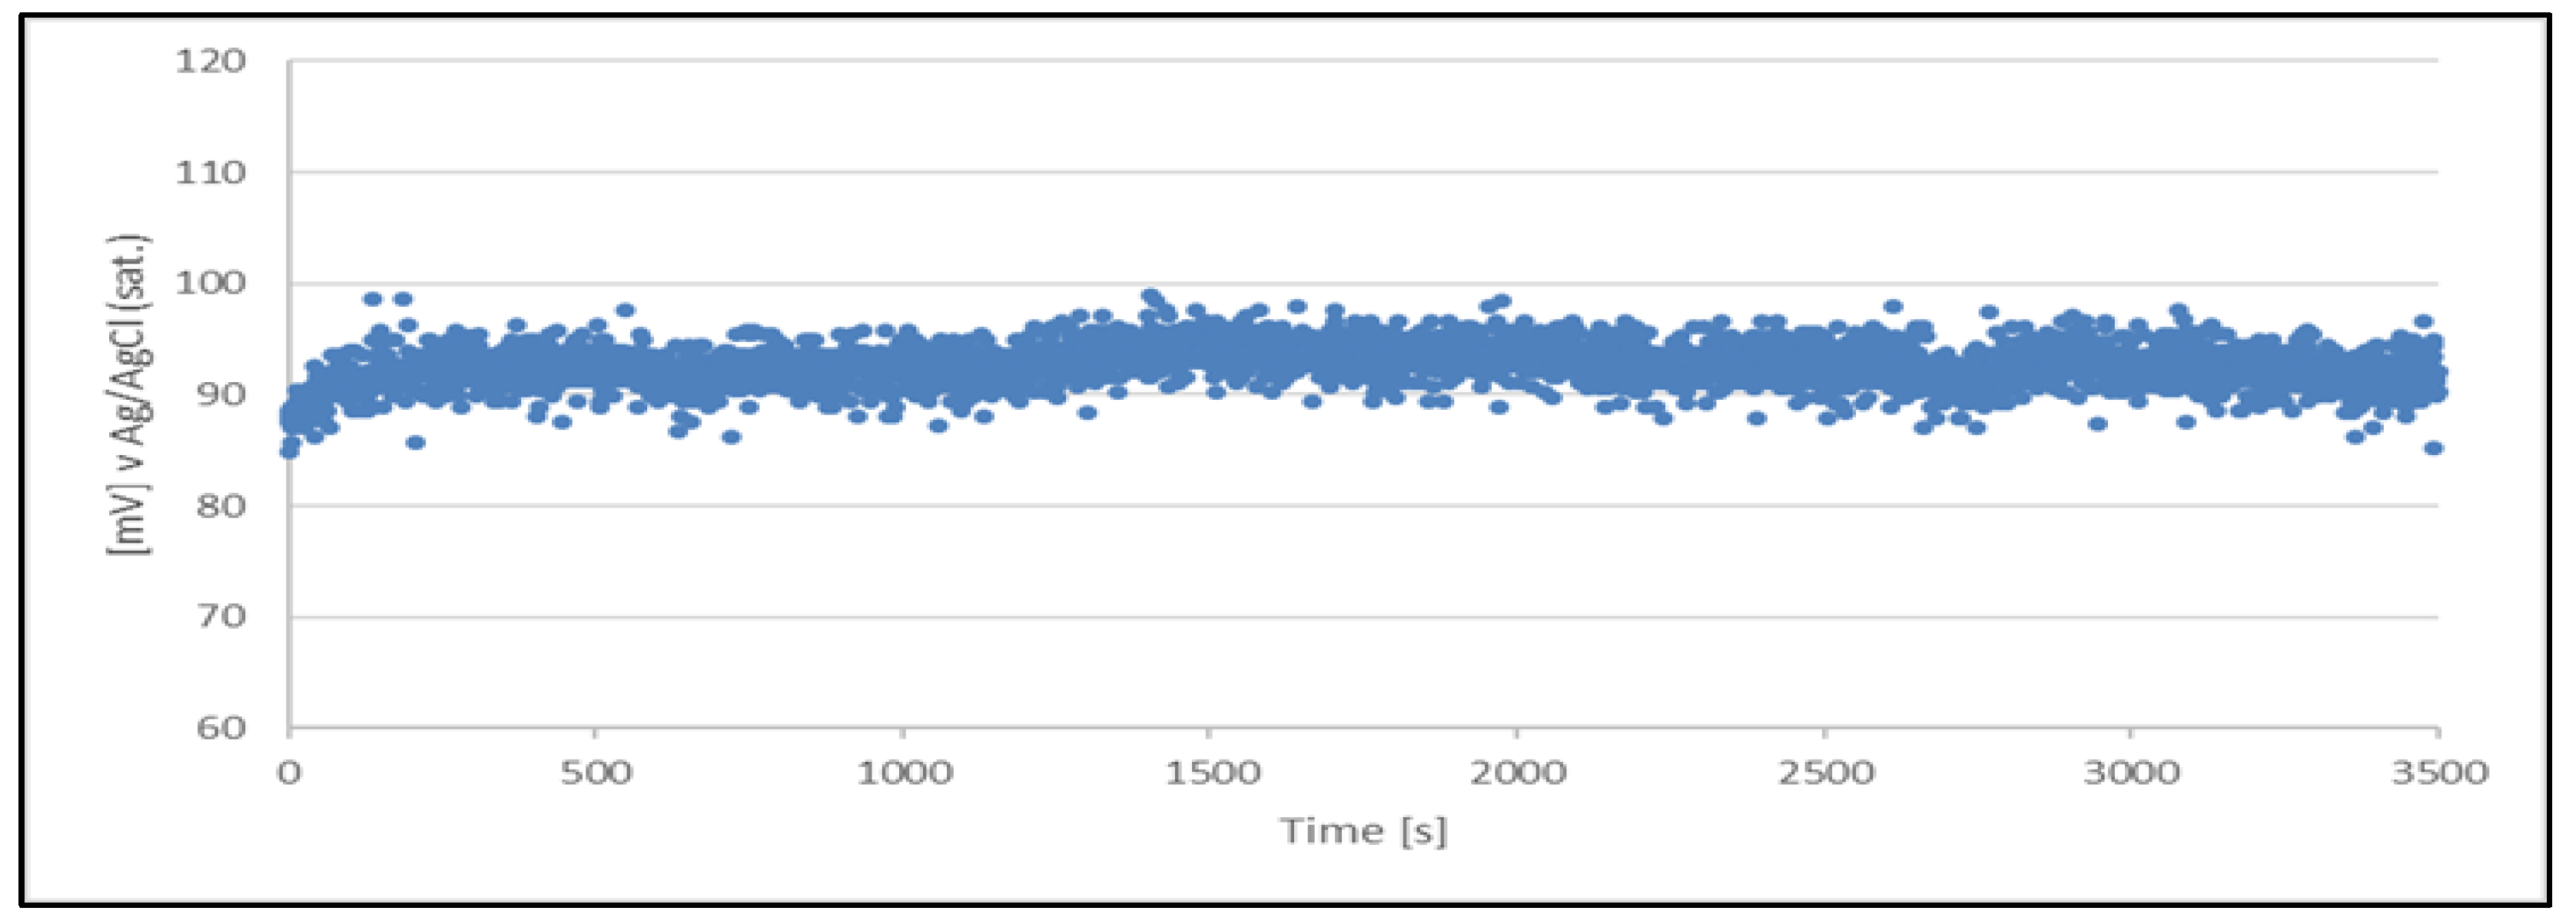
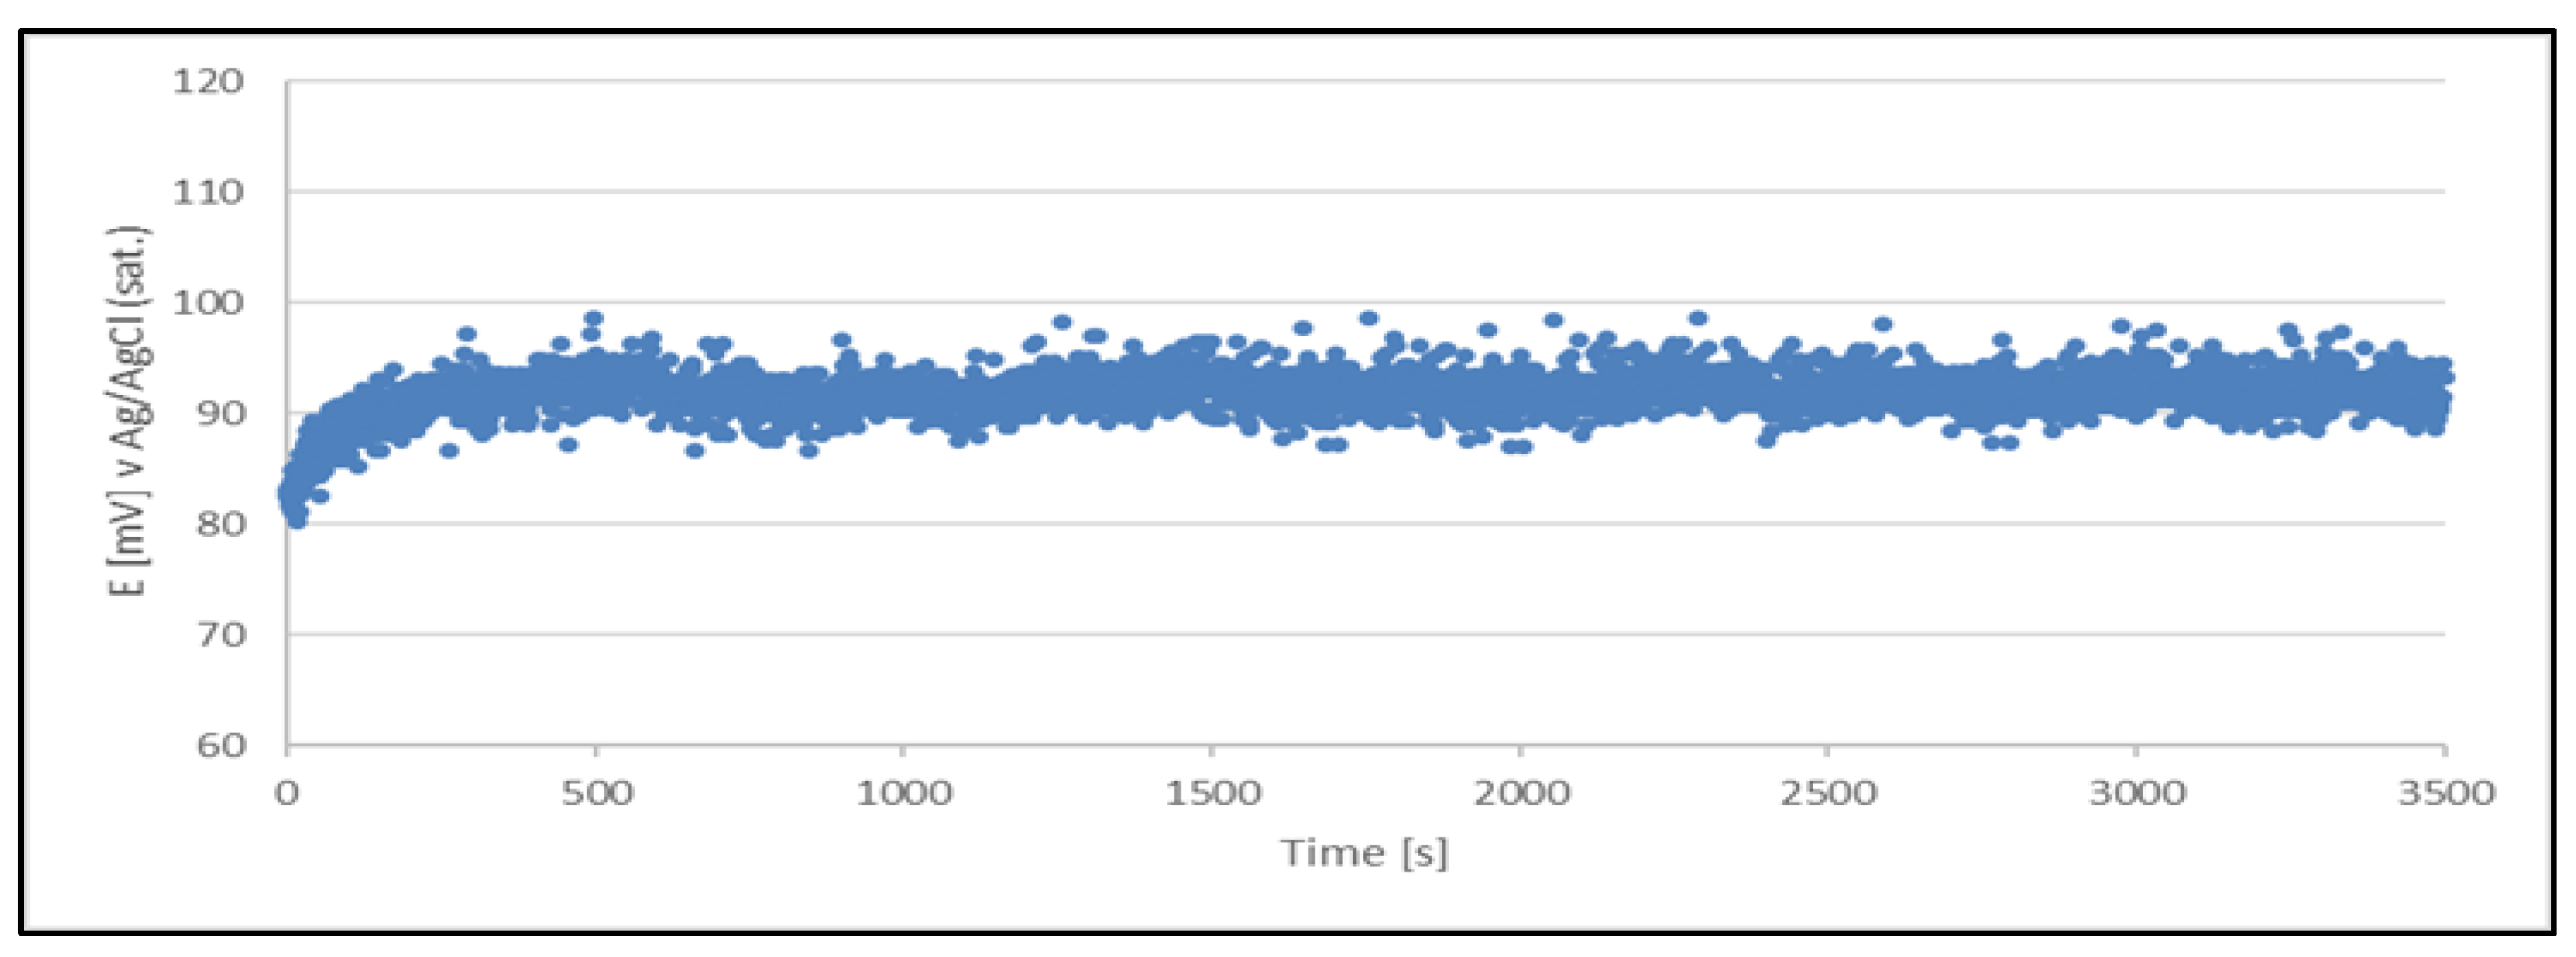
The following figures, from
Figure 2,
Figure 3,
Figure 4,
Figure 5 and
Figure 6, show the results of stability tests of the quasi-reference electrode potential (C
2+/Cu) produced from an acid copper plating bath at different stages of the bath life.
The results clearly indicate the potential raise over initial 80 - 100 s, which then remains stable until the end of the measurement period (1 hour). The stability was found within about 11 mV range. This data is collected in
Table 4.
The quasi-reference electrode (Cu2+/Cu) stability studies have demonstrated its suitability. The electrode delivers a stable potential over a period required for chloride determination (approximately 5 minutes). Additionally, each measurement can be performed using a freshly prepared quasi-reference electrode.
3.2. Characterization of the Method
The proposed method of determination of Cl
- concentration is based on the electrochemical behavior of red-ox couple chlorine/chloride ion. The standard potential of this system in aqueous media is determined as 1.36 V vs NHE and does not depend on pH of solution. The “working potential window” of Pt electrode covers the potential in acidic solution [
9,
10]. Thus, the voltammetric method can be applied at low pH of the analyte. Also, the method is not interfered by high concentration of many ions which cannot be oxidized or reduced at similar to Cl
2/Cl
- red-ox couple potentials. This is substantial advantage of the procedure because other ones, such as titration, ion chromatography, ion selective potentiometry, and even coulometry are strongly affected by pH and ion strength of the analyte. So, the listed methods cannot be directly applied for example in analyses of acid copper electroplating baths. In the developed procedure, chloride ions concentration can be determined directly from oxidation current of Cl
-, observed at very positive potentials, or reduction current of gaseous chlorine, generated during oxidation of Cl
- ions. Both signals are potentially useful for analysis. At the potential range from 0.4 V to oxygen evolution, no other significant current signals can be observed.
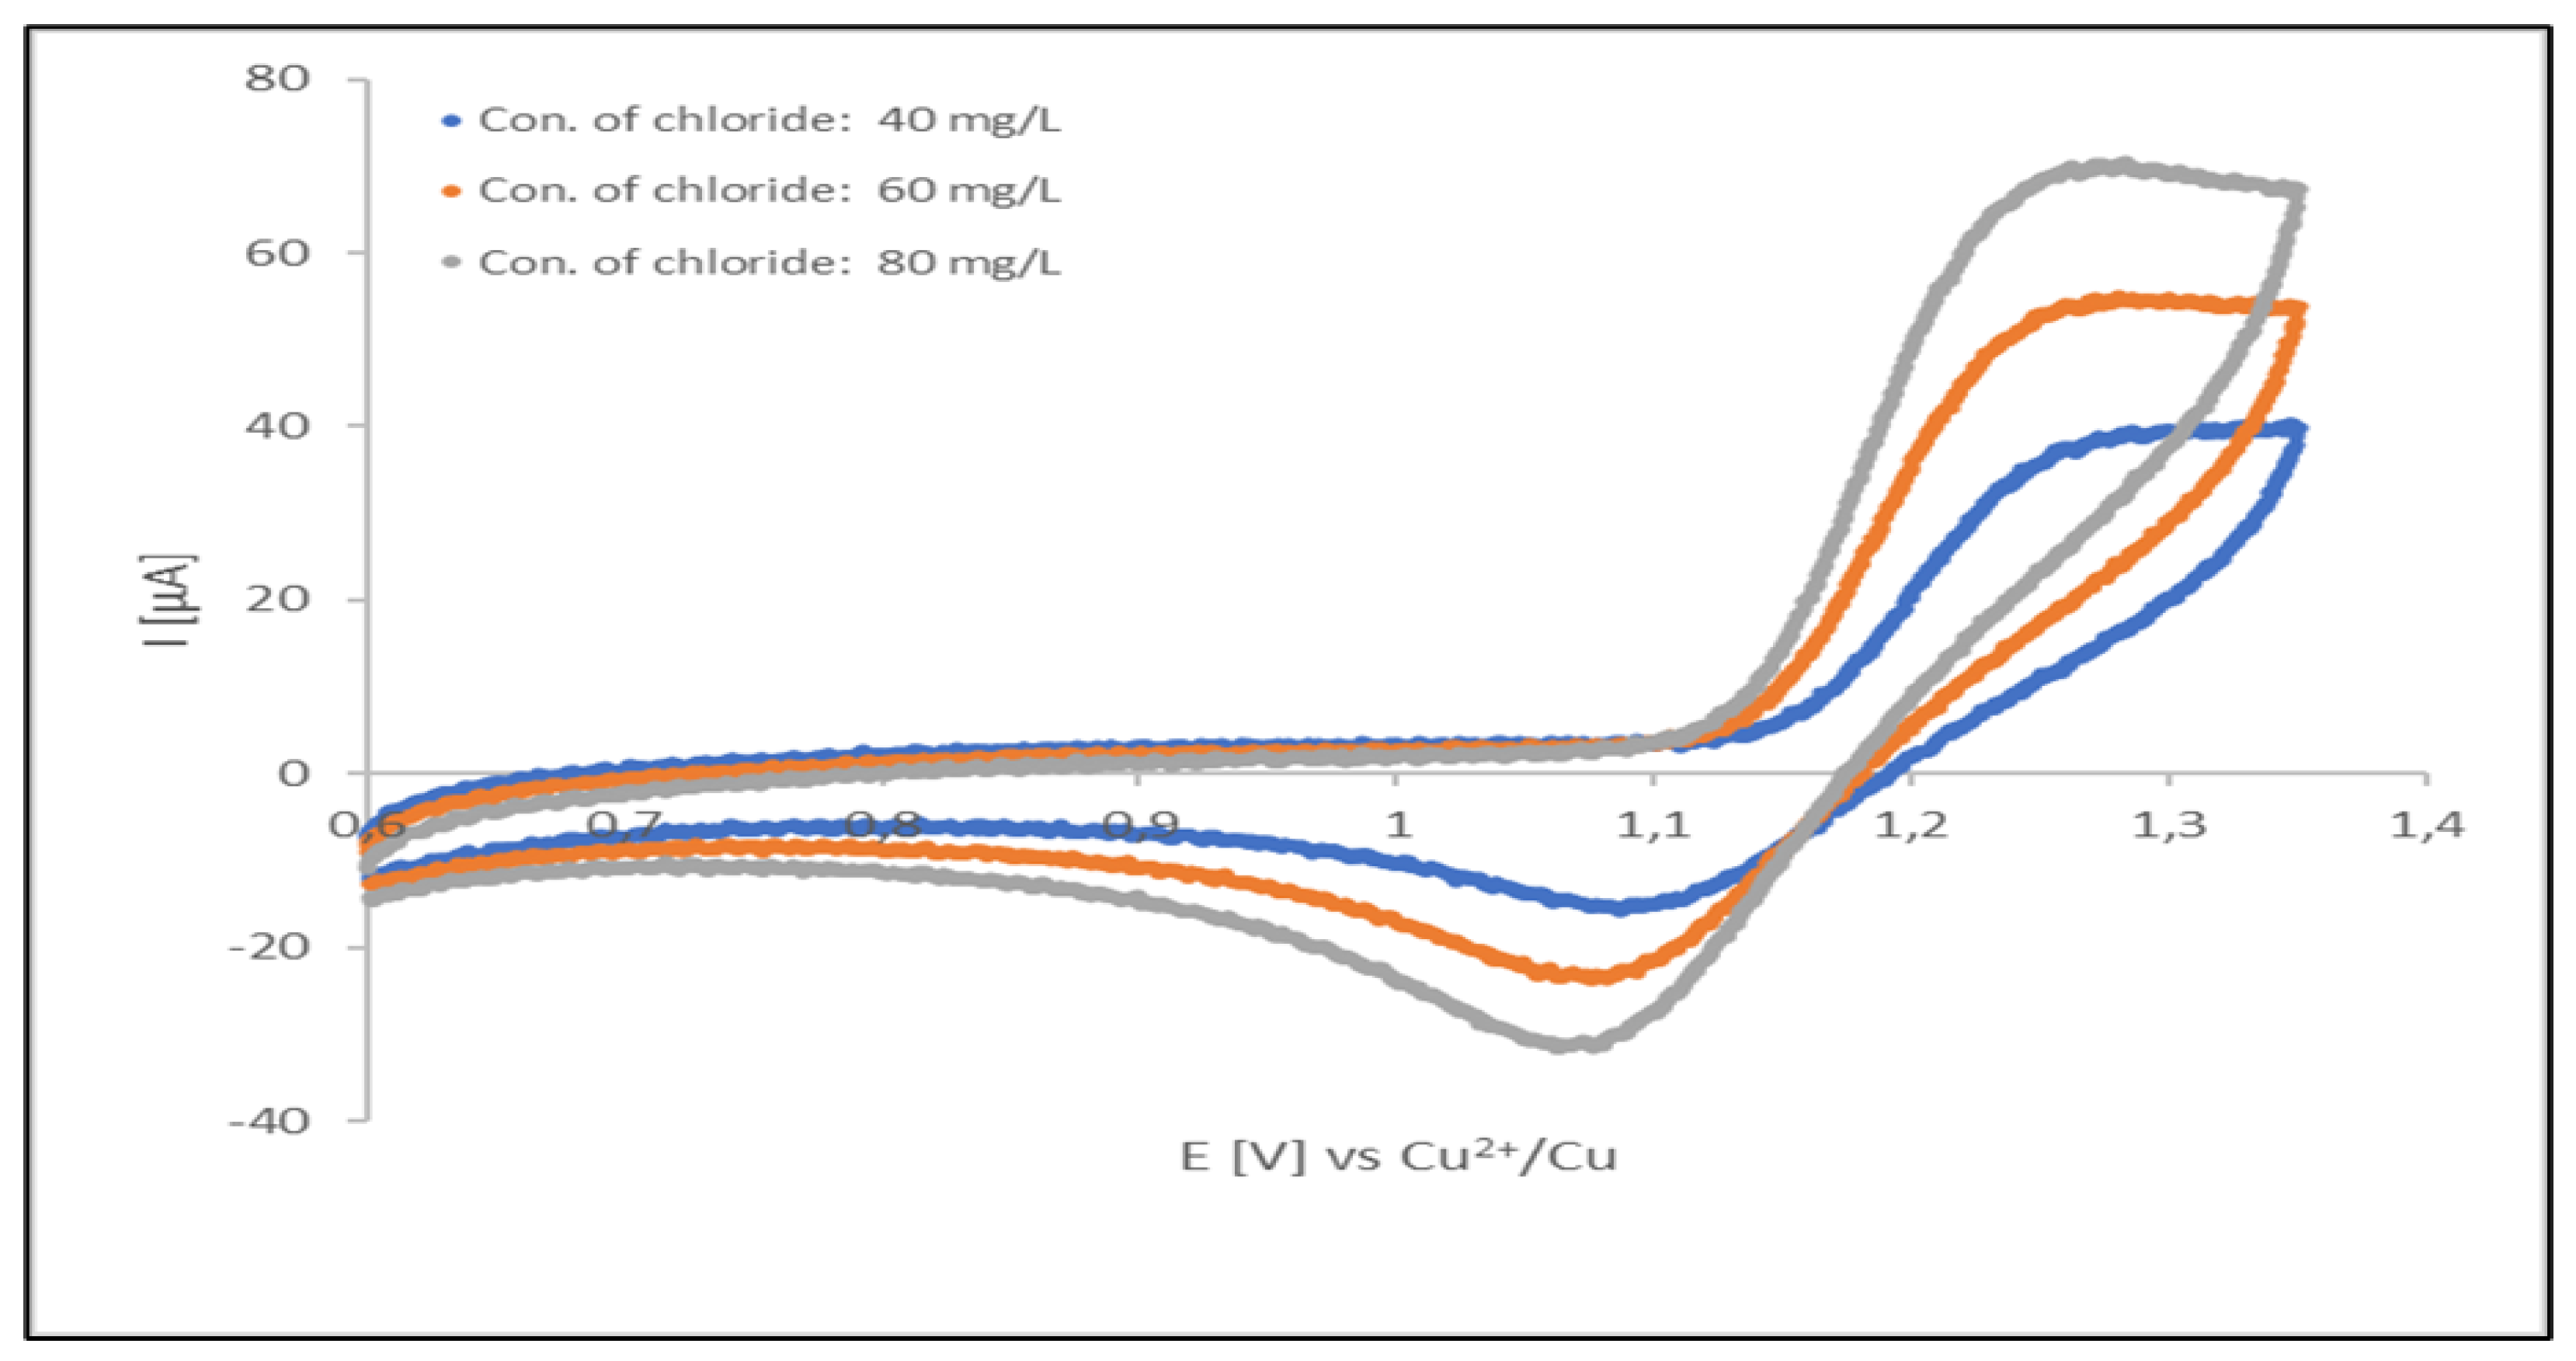
Figure 7 displays cyclic voltammograms for chloride oxidation/chlorine reduction. These cyclic voltammograms were recorded for a freshly prepared (unused) acid copper plating electrolyte (containing organic additives at optimal concentration levels). During the initial forward scan (from 0.6 to 1.35 V) an increasingly oxidation potential was applied.
Intensity (current) of both of the signals depend on concentration of chloride ions presented in analyzed solution. The linearity of the oxidation current vs. concentration dependence apparent, however the signal can be disturbed by oxidation current of organic additives and contaminants of the plating solution. Thus, the oxidation signal can be used only in uncontaminated solutions and is not very reliable in production baths. In such a situation, the analyses can be performed by measuring of the reduction current of gaseous chlorine in the reverse half-cycle. Stabilization of this signal can be done by repeating oxidation reduction cycle up to obtaining a steady-state conditions. In our experimental case, the cycling was performed in a potential range from of 0.60 to 1.35 V, with scan rate of 0.1 V/s. The 5th cycle was taken for the measurement.
3.2. Calibration of the Method
The calibration plot was done for solutions identical with acid copper plating solution used for PCB fabrication (composition reported in
Table 1).
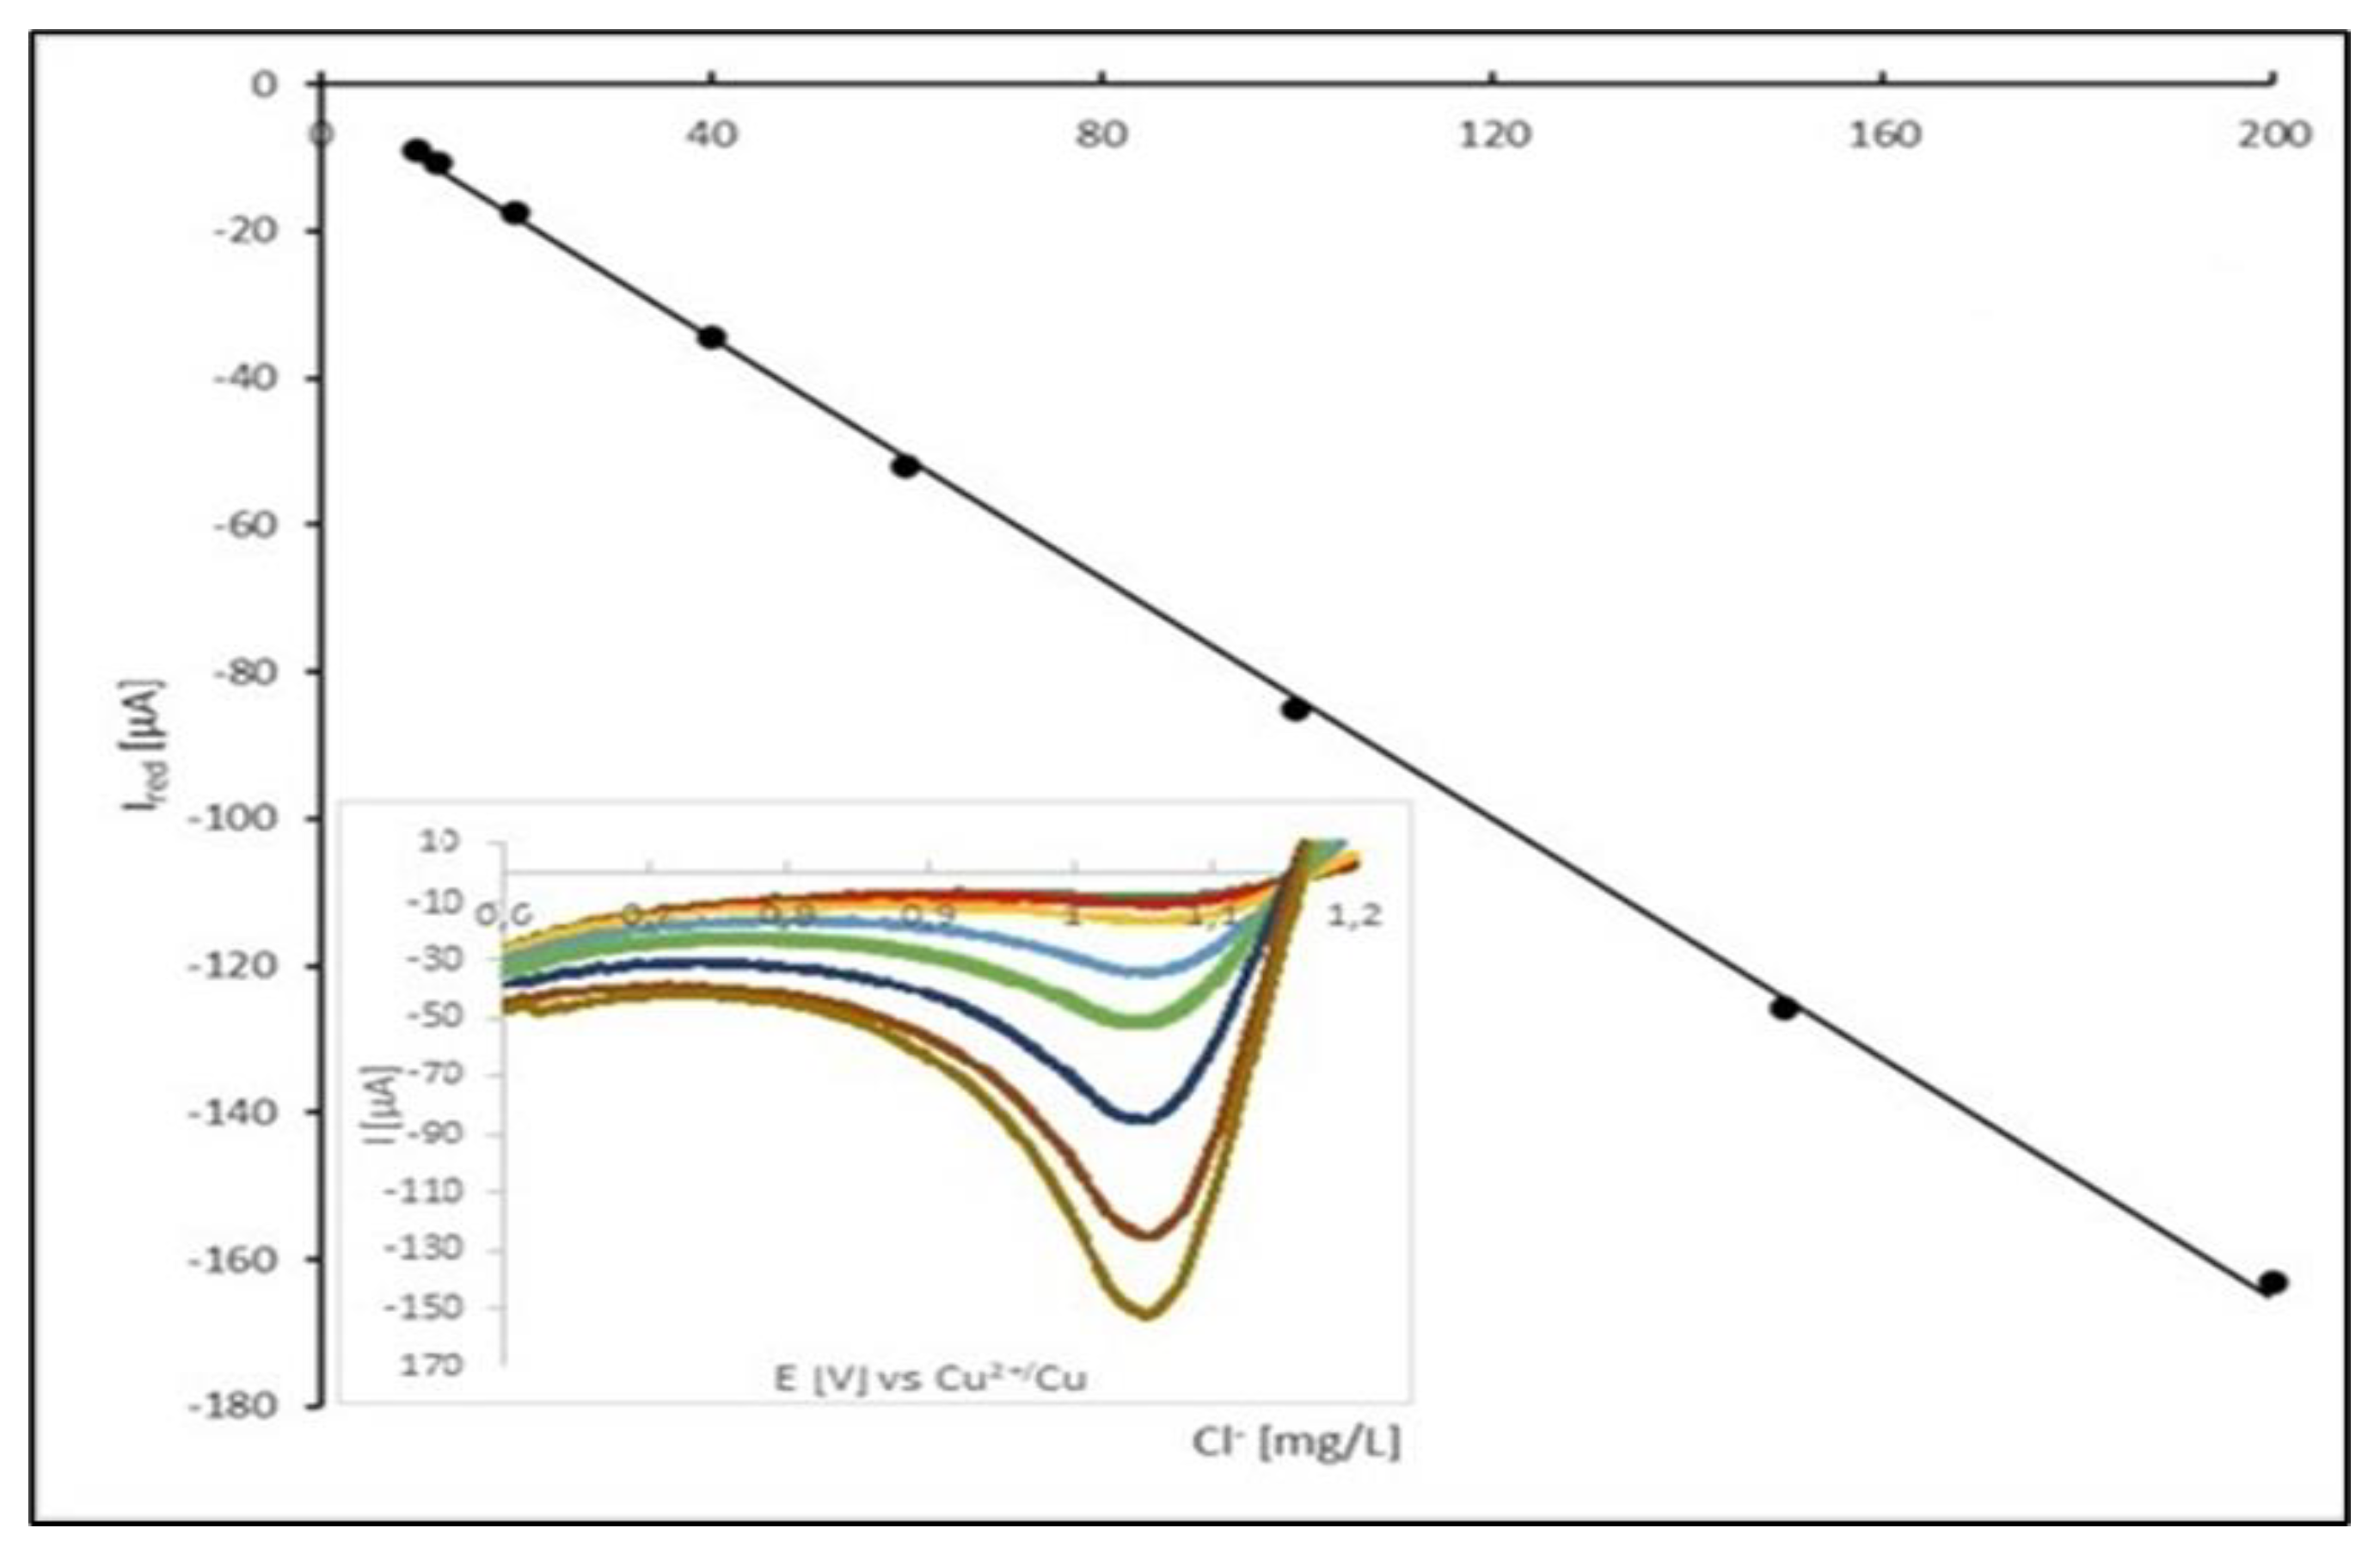
Figure 8 displays calibration plot of peak current vs. Cl
- concentration.
In the proposed method of Cl
- ion determination, the top limit of its suitability determined by solubility of gaseous Cl
2 in analyzed solution. According to literature data, the limit of chlorine concentration in the analyzed bath is circa 48 mmol/dm
3 [
14,
15]. Above this limit, calibration plot should be reaching a plateau. At the reported experimental conditions, the calibration plot was linear up to concentration of Cl
- of 200 mg/dm
3, which is satisfying for the operational range of the chloride ion concentration in the acid copper electroplating bath. Modification of the experimental condition, particularly scan rate, should shift the range of linearity of calibration plot to the higher or lower values.
Calibration is a crucial stage in developing an analytical method for the quantification of chloride ions in acidic media. It results in the construction of a linear relationship between directly measured voltammetric signals – the limiting currents of the Cl2 reduction process (Ired) – and the corresponding chloride concentrations (cCl) in the prepared matrix samples spiked with known amount of chloride ions standard. Since both correlated variables are affected by various measurement errors, their experimental values are associated with standard uncertainties. In the case of the dependent variable (voltammetric current), the standard uncertainty (u(Ired)) was estimated using the A method, i.e., based on the magnitude of the random dispersion (repeatability) of the measurement results (four replicated independent voltammetric measurements). In the case of an independent variable (chloride concentration), the estimated standard uncertainties (u(cCl)) are combinations of several independent sources of uncertainty resulting from the adopted sample preparation scheme, i.e., dilution of the certified reference material (CRM – hydrochloric acid). At least three sources of uncertainty can be distinguished: concentration of the CRM analyte, volume of the CRM sample (pipette limiting error), and the total volume of the system (volumetric flask limiting error). The combination of these uncertainty sources yields the combined relative uncertainty in the chloride concentration at the level of 1%.
Table 5 presents a complete list of the numeric data employed for the construction of the calibration curve. In the calculation process a linear relationship I
red = ac
Cl- + b, where a and b are the slope and the intercept of the straight line, was assumed. To obtain the most representative estimates of the values of coefficients a and b and their standard uncertainties (u(a) and u(b)) it is required to employ a general weighted linear regression scheme for calculations, taking the uncertainties of both scales into account and the significant heterogeneity of uncertainties in the measured values of the dependent variable. In the weighted regression calculation scheme the extent to which a given experimental point determines the course of the calibration line is quantified by its weight coefficient. Uncertainties of both correlated variables contribute to the weight coefficient in the following form (Equation (1)):
where
i numbers experimental points employed for the regression calculation.
The calculated values of weights are listed in
Table 2.
Under the proposed experimental conditions (described in the previous section) the obtained regression model for the concentration dependence of the voltammetric current can be represented by the following equation (Equation (2)):
with the correlation coefficient
r = -0.9998.
We have found that the linear dependence between the Cl2 reduction current and the chloride ions concentration is valid for the concentration of chlorides ranging from 10 to 200 mg/dm-3. The upper level of the proposed concentration range is considerably above the typical Cl- concentration found in electroplating baths. It is also important to note that any change in the voltammetric conditions (e.g., scan rate, the type of reference electrode etc.) requires recalibration of the developed analytical method.
A calibration curve is also a convenient tool for the estimation of the method quantification limit (LOQ) according to the following formula (Equation (3)):
where u(b) is the standard uncertainty of the intercept and p represents a multiplication constant (usually set to 10).
The LOQ parameter for the proposed method was found to be 2 ppm.
3.3. Calibration of the Method
Proposed method was used for determination of chloride concentration in copper plating bath used for fabrication of printed circuit boards (PCB). In this case, there is no simple direct method for determination of Cl
- level in the bath solution. Our effort was turned to determine this component in a range usually expected in the copper plating bath solution, which is 10 to 100 ppm (mg/dm
3) [
16,
17]. Commonly applied argentometric titration is time consuming, and required modification of the sample [
4] thus cannot be considered as a procedure for continuous monitoring of the chloride ion in the Cu plating process. Additionally, the procedure generates significant amount of waste, which must be utilized. Our voltammetric method requires collection only of a small portion of the bath solution, performing analytical procedure, and returning it into the monitored plating bath. Such a proceeding can be applied because the sample of the solution used for analysis is not modified during the determination process.
A newly developed electrochemical method (cyclic voltammetry based) of chloride ion determination in acid copper plating bath and commonly used for copper plating bath analysis chloride titration method were compared.
The determination of Cl
- ion concentration was performed for two solutions. The first one was a newly prepared bath sample of recommended composition shown in
Table 6. The bath was prepared using 0.1 M hydrochloric acid standard solution as a chloride source, which was transferred using automatic micropipette into a 1 L A-class volumetric flask. The second sample was collected from the plating bath that was working for a significantly long time. The bath, was operating properly, but wasn’t strictly controlled for the concentration of the constituents, especially organic additives.
The comparison results of analyses performed by voltammetric and titration technique is shown in the
Table 7. The voltammetricaly determined Cl
- ion contents indicate significant differences as compared to the modified argentometric titration results. However, reliability of the data was confirmed by additional analyses performed for intentionally spiked bath solutions. For both of them, concentration of chlorides was increased two times, by two consecutive spikes, each of 25 ppm (mg/dm
3). Proportional response observed for the implemented method proves its reliability and shows, beyond doubt, that can be applied not only in the form of comparison result with calibration plot but also using standard addition method (single or multiple). It means that the developed chloride ion determination method may be directly used for working plating line (continuous monitoring) and for electrolyte samples (analyses done in offline mode), as well.
4. Discussion
The described voltammetric method of determination of chloride ion content in aqueous solutions may be attractive alternative for commonly used methods as application of ion selective electrodes and argentometric titration. The advantage of voltammetric determination of concentration of Cl- ion is its good performance in solutions of high ionic strength and high concentration of acid. In such an experimental condition usage of ISE is impossible and titration is not reliable due to problems with detection of the titration end point. Thus, presented method can be applied in determination of concentration of chloride ion in acidic copper plating baths.
The analytical procedure was fitted to conditions and the range of concentration of analyte in commercially used electrolytes i.e., 10 - 200 ppm, however the range of determined concentration may be changed by modification of experimental parameters e.g., scan rate. Performed investigation indicated that the method gives reliable results in newly prepared and heavily used solutions. Additional advantage of the method is possibility of its automation integration with industrial copper plating process. We found the method as also stabile for off-line analyses based on standard addition (simple or multiple). Summarizing: proposed analytical method is competitive to other methods commonly used in analysis of chloride ion and additionally gives good results in aggressive media as acid copper plating baths.
Author Contributions
Conceptualization, review and supervision, M.D.; experimental work and writing, R.M. All authors have read and agreed to the published version of the manuscript.
Funding
This research was funded by Polish Ministry of Science and Higher Education, grant number DWD/3/4/2019.
Institutional Review Board Statement
Not applicable.
Informed Consent Statement
Not applicable.
Data Availability Statement
The original contributions presented in the study are included in the article; further inquiries can be directed to the corresponding author.
Acknowledgments
The authors would like to thank Kazimierz Wikiel (Technic Inc.) for valuable substantive comments.
Conflicts of Interest
The authors declare no conflicts of interest.
References
- Dan Wu, Yinglu Hu, Ying Liu and Runyu Zhang Review of Chloride Ion Detection Technology in Water, Appl. Sci. 2021, 11, 11137. [CrossRef]
- DJ Pillion, E Meezan, Liquid-chromatographic determination of chloride in sweat from cystic fibrosis patients and normal persons. Clinical Chemistry, Volume 31, Issue 7, 1 July 1985, Pages 1155–1157. [CrossRef]
- B. Newton, “Analysis of copper plating baths,” Twenty Third IEEE/CPMT International Electronics Manufacturing Technology Symposium (Cat. No.98CH36205), Austin, TX, USA, 1998, pp. 358-361. [CrossRef]
- Jawed Mustafa, M. M. Abdullah, Shahid Husain, Hasan M. H. Muhaisen, Khalid Umar, and Mohammad Luqman, Development of a Highly Selective Chloride Ion Potentiometric Sensor Utilizing a Novel N, N-Ethylene-bis-(Salicylideneaminato) Zinc (II) Molecule for Clean Environment, April 2024 Science of Advanced Materials 16(4):450-458. [CrossRef]
- Ed Kaiser and Jeff Rohrer, Determination of Chloride in Acid Copper Plating Bath, THE APPLICATION NOTEBOOK — February 2002, https://cdn.sanity.io/files/0vv8moc6/chroma/d625fd1620ad91a70511337796727e89487afd08.pdf/article-11767.pdf.
- Braun, T. , Bujdosó, E. and Schubert, A., 2019. Literature of Analytical Chemistry: A Scientometric Evaluation. CRC Press.
- Jerry J. Kaczur, Oxidation Chemistry of Chloric Acid in NOx/SOx and Air Toxic Metal Removal from Gas Streams, December 1996 Environmental Progress 15(4):245 – 254. [CrossRef]
- Linear Sweep and Cyclic Voltametry: The Principles, https://www.google.com/url?sa=t&source=web&rct=j&opi=89978449&url=https://www.ceb.cam.ac.uk/research/groups/rg-eme/Edu/linear-sweep-and-cyclic-voltametry-the-principles&ved=2ahUKEwjjooyC2fGHAxWQa_EDHTrNJZIQFnoECBsQAQ&usg=AOvVaw12UEtiq5rwsmJOUk8OpGqr.
- Heike Kahlert Handbook of Reference Electrodes (pp.291-308). [CrossRef]
- Overview of Reference Electrodes and Alternative Reference Electrodes Brief Discussion about Standard and Pseudo Reference Electrodes, Document #: DRK10053 (REV001 | APR 2016), https://www.google.com/url?sa=t&source=web&rct=j&opi=89978449&url=https://www.pineresearch.com/shop/wp-content/uploads/sites/2/2016/10/DRK10053-Overview-of-Reference-Electrode-Operation-and-Alternative-Reference-Electrodes-REV001.pdf&ved=2ahUKEwiQ3NCFyIuIAxXsgP0HHVNAJRsQFnoECBkQAQ&usg=AOvVaw0frOpN-TZ4CSpDWMwm-BLB.
- Z Sun, G He, Z Zhao, X He, H Zhao Research Progress of Electroplated Micropore for Interconnection Technology, Journal of Physics: Conference Series 2430 (2023) 012011. [CrossRef]
- Yuko Yokoyama, Tomokazu Fukutsuka, Kohei Miyazaki, and Takeshi Abe, Origin of the Electrochemical Stability of Aqueous Concentrated Electrolyte Solutions, Journal of The Electrochemical Society, 165 (14) A3299-A3303 (2018). [CrossRef]
- J Barón-Jaimez, M R Joya and J Barba-Ortega, Bismuth electrodes, an alternative in stripping voltammetry, Journal of Physics: Conference Series 466 (2013) 012025. [CrossRef]
- C. L. Young, Sulfur Dioxide, Chlorine, Fluorine and Chlorine SOLUBILITY DATA SERIES Volume 12 1st Edition - January 1, 1983 eBook ISBN: 9781483156675.
- Density of sulfuric acid and sulfur trioxide, https://wissen.science-and-fun.de/chemistry/chemistry/density-tables/density-of-sulfuric-acid-and-sulfur-trioxide/.
- Jürgen Barthelmes, Acid Copper Plating with Insoluble Anodes -A Novel Technology in PCB Manufacturing, J. Barthelmes, Trans. IMF. 2000, 78(4), 135. [CrossRef]
- Wei-Ping Dow, Ming-Yao Yen, Cheng-Wei Liu, Chen-Chia Huang, Enhancement of filling performance of a copper plating formula at low chloride concentration, Electrochimica Acta 53 (2008) 3610–3619. [CrossRef]
Figure 1.
A prototype of the voltammetric cell.
Figure 1.
A prototype of the voltammetric cell.
Figure 2.
Open circuit potential variation with time for a quasi - reference electrode (Cu2+/Cu) made from a sample of a newly prepared acid copper plating bath The quasi - reference electrode tested in a newly prepared acid copper plating bath.
Figure 2.
Open circuit potential variation with time for a quasi - reference electrode (Cu2+/Cu) made from a sample of a newly prepared acid copper plating bath The quasi - reference electrode tested in a newly prepared acid copper plating bath.
Figure 3.
Open circuit potential variation with time for a quasi-reference electrode (Cu2+/Cu) made from a sample of a production solution no. 1. The quasi-reference electrode tested in a newly prepared acid copper plating bath.
Figure 3.
Open circuit potential variation with time for a quasi-reference electrode (Cu2+/Cu) made from a sample of a production solution no. 1. The quasi-reference electrode tested in a newly prepared acid copper plating bath.
Figure 4.
Open circuit potential variation with time for a quasi-reference electrode (Cu2+/Cu) made from a sample of a production solution no. 1. The quasi-reference electrode tested in the production solution no. 1.
Figure 4.
Open circuit potential variation with time for a quasi-reference electrode (Cu2+/Cu) made from a sample of a production solution no. 1. The quasi-reference electrode tested in the production solution no. 1.
Figure 5.
Open circuit potential variation with time for quasi-reference electrode (Cu2+/Cu) made from a sample of a working solution no. 2. The quasi-reference electrode tested in a newly prepared acid copper plating bath.
Figure 5.
Open circuit potential variation with time for quasi-reference electrode (Cu2+/Cu) made from a sample of a working solution no. 2. The quasi-reference electrode tested in a newly prepared acid copper plating bath.
Figure 6.
Open circuit potential variation with time for a quasi-reference electrode (Cu2+/Cu) made from a sample of a production solution no. 2. The quasi-reference electrode tested in the production solution no. 2.
Figure 6.
Open circuit potential variation with time for a quasi-reference electrode (Cu2+/Cu) made from a sample of a production solution no. 2. The quasi-reference electrode tested in the production solution no. 2.
Figure 7.
Cyclic voltammograms recorded at acid copper plating bath. Signals at about 1.28 V correspond to Cl-oxidation signals at about 1.08 V corresponds to Cl2 reduction. All three CV voltammograms were registered at sweep rates of 100 mv/s for each direction of potential sweep. These voltammograms were recorded at a polycrystalline Pt electrode (temperature 298 K).
Figure 8.
The calibration curve for chloride concentration ranging from 10 to 200 mg/dm3.
Figure 8.
The calibration curve for chloride concentration ranging from 10 to 200 mg/dm3.
Table 1.
Chemical composition of the tested copper plating bath.
Table 1.
Chemical composition of the tested copper plating bath.
| Component |
Range |
| Copper (as CuSO4x5H2O) |
0.18 – 0.22 M (45.0 – 55.0 g/dm3) |
| Sulphuric Acid |
2.45 – 2.65 M (240.0 – 260.0 g/dm3) |
| Chloride |
1.13 – 1.69 mM (40.0 – 60.0 mg/dm3) |
| ELECTROPOSIT™ M Additive |
40 mL/dm3
|
| ELECTROPOSIT 1300 S |
1 mL/dm3
|
Table 2.
Chemical composition and plating parameters of the copper acid sulfate bath called ELECTRODEPOSITIONTM 1300 Acid Copper For PWB Metallization Applications by DuPont, used for the production of electrical contacts in PCBs.
Table 2.
Chemical composition and plating parameters of the copper acid sulfate bath called ELECTRODEPOSITIONTM 1300 Acid Copper For PWB Metallization Applications by DuPont, used for the production of electrical contacts in PCBs.
| Component |
Range |
| Copper (as CuSO4x5H2O) |
0.18 – 0.22 M (45.0 – 55.0 g/dm3) |
| Sulphuric Acid |
2.45 – 2.65 M (240.0 – 260.0 g/dm3) |
| Chloride |
1.13 – 1.69 mM (40.0 – 60.0 mg/dm3) |
| ELECTROPOSIT™ M Additive |
40 mL/dm3
|
| ELECTROPOSIT 1300 S |
1 mL/dm3
|
| Temperature |
298 K (25 °C) |
| Cathodic Current Density (DC) |
1.7 A/dm2
|
Table 3.
Chemical composition of the samples of the copper acid sulfate bath called ELECTRODEPOSITIONTM 1300 Acid Copper (For PWB Metallization Applications) by DuPont, used for the OCP potential stability measurements.
Table 3.
Chemical composition of the samples of the copper acid sulfate bath called ELECTRODEPOSITIONTM 1300 Acid Copper (For PWB Metallization Applications) by DuPont, used for the OCP potential stability measurements.
| 0 |
Concentration of components of the acid copper plating baths used for Open Circuit Potential measurements |
Components of the acid
copper plating bath |
A newly prepared acid
copper plating bath |
A production acid copper plating bath no. 1 |
A production acid copper plating bath
no. 2 |
| CuSO4x5H2O |
0.20 M
(51,0 g/dm3) |
0.20 M
(50.0 g/dm3) |
0.21M
(52.4 g/dm3] |
| H2SO4
|
2.60 M
(255.0 g/dm3) |
2.55 M
(250.0 g/dm3) |
2.55 M
(250.0 g/dm3) |
| Cl-
|
1.41 mM
(50 mg/dm3) |
1.38 mM
(48 mg/dm3) |
1.30 mM
(46 mg/dm3) |
| ELECTROPOSIT™ M Additive |
40 mL/dm3
|
Unknown** |
Unknown** |
| ELECTROPOSIT™ 1300 S |
1 mL/dm3
|
Unknown** |
Unknown** |
Table 4.
Recorded range of potential changes during OCP measurements for the produced quasi reference electrodes.
Table 4.
Recorded range of potential changes during OCP measurements for the produced quasi reference electrodes.
| Type of acid copper bath used for preparing quasi-reference electrode |
OCP measurements for
a newly prepared acid
copper plating bath
Potential range
[mV] |
OCP measurements for
A production acid copper plating bath
Potential range
[mV] |
A newly prepared acid
copper plating bath |
85.9 – 95.3 |
N/A |
| A production acid copper plating bath no. 1 |
85.1 – 96.2 |
86.1 – 96.7 |
| A production acid copper plating bath no. 2 |
85.5 – 98.1 |
85.7 – 98.3 |
Table 5.
Experimental results for the construction of the calibration curve.
Table 5.
Experimental results for the construction of the calibration curve.
| No. |
cCl-
[mg/dm3] |
u(cCl-) [mg/dm3] |
Ired
[µA] |
u(Ired) [µA] |
weight, W |
| 1 |
10 |
0.10 |
-9.10 |
0.058 |
97.3 |
| 2 |
12 |
0.12 |
-10.733 |
0.088 |
56.2 |
| 3 |
20 |
0.20 |
-17.50 |
0.32 |
7.63 |
| 4 |
40 |
0.40 |
-34.66 |
0.47 |
3.04 |
| 5 |
60 |
0.60 |
-51.85 |
0.55 |
1.82 |
| 6 |
100 |
1.0 |
-85.13 |
0.93 |
0.644 |
| 7 |
150 |
1.5 |
-126.9 |
1.1 |
0.355 |
| 8 |
200 |
2.0 |
-163.53 |
0.19 |
0.355 |
Table 6.
Composition of copper plating solutions utilized for verifying the new method of chloride determination.
Table 6.
Composition of copper plating solutions utilized for verifying the new method of chloride determination.
| |
Concentration of components of the acid copper plating baths |
Components of the acid
copper plating bath |
A newly prepared acid
copper plating bath |
A production acid copper plating bath |
| CuSO4x5H2O |
0.21 M (52.3 g/dm3) |
0.22 M (54.9 g/dm3) *** |
| H2SO4
|
2.60 M (255.0 g/dm3) |
2.55 M (250.0 g/dm3) *** |
| Cl-
|
1.41 mM (50 mg/dm3) |
1.11 mM (39 mg/dm3) *** |
| ELECTROPOSIT™ M Additive |
40 mL/dm3
|
unknown |
| ELECTROPOSIT™ 1300 S |
1 mL/dm3
|
unknown |
Table 7.
Chloride content for two different acid copper plating baths obtained by two different analytical methods.
Table 7.
Chloride content for two different acid copper plating baths obtained by two different analytical methods.
| C |
Chloride concentrations in the tested acid copper plating baths |
| |
|---|
| |
Parameters |
Results |
P1
[mg/dm3] |
P2
[mg/dm3] |
P3
[mg/dm3] |
R1
[mg/dm3] |
R2
[mg/dm3] |
R3
[mg/dm3] |
R4
[mg/dm3] |
| A |
50 |
+25 |
+25 |
55 |
77 |
105 |
32 |
| B |
unknown |
+25 |
+25 |
24 |
47 |
76 |
39 |
|
Disclaimer/Publisher’s Note: The statements, opinions and data contained in all publications are solely those of the individual author(s) and contributor(s) and not of MDPI and/or the editor(s). MDPI and/or the editor(s) disclaim responsibility for any injury to people or property resulting from any ideas, methods, instructions or products referred to in the content. |
© 2024 by the authors. Licensee MDPI, Basel, Switzerland. This article is an open access article distributed under the terms and conditions of the Creative Commons Attribution (CC BY) license (http://creativecommons.org/licenses/by/4.0/).
