Preprint
Article

Application of Pyroligneous Acid as a Plant Growth Stimulant can Improve the Nutritional Value of Soybean Seed

Altmetrics

Downloads

70

Views

29

Comments

0

A peer-reviewed article of this preprint also exists.

Submitted:

27 August 2024

Posted:

28 August 2024

You are already at the latest version

Alerts
Abstract
Farmers today are using biochemical treatments to improve their crop yields. Commercialized organic biostimulants exist in the form of pyroligneous acid generated by burning agricultural waste products. During the 2023 growing season we demonstrated that soil treatment with a commercial pyroligneous acid product, Coriphol™, manufactured by Corigin Solutions, Inc., stimulated plant growth and significantly improved yield with an optimal treatment dose of 2 gal./acre. In the present work we examined the effect of this treatment on soybean nutritional content using seed harvested from the 2023 season. Total mean seed protein content for untreated control plants was 32.26 ± 0.49% of dry mass and increased 10.8% to 35.64 ± 0.64% with treatment. This increase resulted in a net reduction in total free amino acid content although levels of the es-sential dietary amino acid, lysine, were boosted 6-fold. Total lipid content was unaffected by treatment with mean levels of 21.61 ± 0.70% of dry mass noted. Treatment, however, reduced saturated fatty acid content by roughly 40% while reducing the polyunsaturated content of linoleic acid in favor of the monounsaturated fatty acid, oleic acid. Finally, Coriphol™ treatment did not impact seed content of eight essential micronutrients including Na, Mg, K, Ca, Fe, Ni, Cu and Mo, but did significantly boost Zn and Mn levels. Altogether, these results demonstrate that soil treat-ment with the growth stimulant Coriphol™ has the potential to improve the dietary nutritional value of soybean.
Keywords: 
Subject: Biology and Life Sciences  -   Agricultural Science and Agronomy

1. Introduction

Over the last several years soybean [Glycine max (L.) Merr.] has become one of the principal crop plants supporting human and animal diets [1]. Soybeans are among the few complete protein vegetable-based foods that contain nine essential amino acids supporting healthy diets [1,2,3]. For this reason, the soybean has become an important source of human and animal protein, with 85% of its cultivation destined for animal feed and the remaining destined for direct human consumption [4,5,6].
Globally soybean production has increased from 233 million tons in 2008 to 397 million tons in 2023 with projections of reaching 422 million tons in 2024 [7,8,9]. Demand for soybeans is projected to continue growing over the coming years, due to a variety of factors. On the one hand, consumption of meat and soy-based health products is on the rise due to rising global population figures. Projections indicate that feeding a world population of 9.77 billion people by 2050 [10], coupled with the need to improve not just caloric intake, but nutritional content of animal and human diets, will require significant increases in food production of high nutritional value of more than 60 percent [11]. Furthermore, policymakers are more supportive of the use of biodiesels as a fuel alternative to fossil fuel [12,13,14,15] increasing their demand in the world market.
Pyroligneous acid is a name synonymous with products that are made from the condensation of vapors produced during the high-temperature oxygen-free pyrolysis of agricultural and forestry biomass [16,17,18,19]. These products typically comprise complex mixtures of organic substrates and can vary in composition depending on the nature of the biomass feedstock used in the process [20]. Recent years have seen an increase in the use of pyroligneous acid as a stimulant in farm management practices to promote plant growth and improve crop yields [21,22,23,24,25,26].
In a recent study we partnered with Corigin Solutions, Inc. (Merced, CA, USA) a manufacturer of a pyroligneous acid product known as Coriphol™. This product is manufactured by condensing the smoke produced from the dry pyrolysis of spent almond shells that normally are treated as agricultural waste generated from California’s large almond nut industry. In that earlier study, we examined the effect of applying different doses of Coriphol™ to soil in outdoor potted plant studies where soybeans were grown [27]. During the 2023 growing season beneficial effects of treatments were noted relative to growth performance and fitness for applied doses equivalent to 1-2 gal./acre in the field. Most importantly, we observed a 1.4-fold improvement in the soybean crop yield with treatment.
The present work reflects an extension of our earlier growth performance studies where we wanted to examine whether treatments with Coriphol™ improved the nutritional value of the soybean seeds. Using seeds acquired from our 2023 soybean harvest, we subjected seeds to rigorous assays to examine effects of Coriphol™ treatments on total protein content, the distribution of essential and non-essential ‘free’ amino acids, the fatty acid content, phytic acid content, metal micronutrient content and iron oxidation state distribution.

2. Materials and Methods

2.1. Plant Growth and Soybean Crop Harvest

During the 2023 growing season soybean seeds (MorSoy variety 4812E, MFA Inc., Columbia, MO, USA) were sown into a 2.7-gallon pots filled with ProMix (Premier Tech Horticulture, Inc., Salt Lake City, UT, USA) to which 1.2 g of Osmocote™ smart-release fertilizer (Smart-Release Plant Food Flower & Vegetable., The Scotts Company, Marysville, OH, USA) was mixed into the ProMix before sowing. Fertilizer was reapplied to pots 30 days after germination and again on day 60. Pots were connected to a drip irrigation system providing 2 L water per pot daily. In this study, four cohorts of plants were grown in replicate including untreated control plants and plants treated with 100 mL doses of Coriphol™ equivalent to 0.5, 1.0, and 2.0 gal./acre. Treatments were applied to the ProMix at germination and reapplied after 5- and 10-weeks of growth. At harvest, mature bean pods were collected, bagged according to plant number and treatment type, and stored in a -80 °C freezer until needed.

2.2. Protein Analysis

For protein extraction, whole beans were placed in a freeze dryer (FreezeZone 1 Dryer, Labconco Corp., Kansas City, MO, USA) and lyophilized for 5-days. Once dried these beans were ground to a fine powder using a mortar and pestle, weighed in 100 mg amounts (± 1 mg) and placed into 1.5 mL Eppendorf™ tubes. Pigments and other confounding metabolites were first removed by extracting samples using 1 mL cold acetone (5% trichloroacetic acid, w/v) following published procedures [28]. Samples were then sonicated for 15-min and centrifuged at 14,000 × g for 10-min to separate the protein pellet. Once the supernatant was removed, the pellet was washed three more times with cold acetone to remove lingering trichloroacetic acid. Samples were dried at ambient temperature under vacuum. Once dried, total proteins were extracted in 1 mL of 50 mM Tris–Cl buffer (pH 8.8) containing (1% v/v) plant protease inhibitors (Plant Protease Inhibitor Cocktail, Sigma Aldrich, St. Louis, Inc., MO, USA). Liquefied tissues were clarified with centrifugation at 14,000 × g for 10 min, and supernatant was removed and placed into a clean tube for analysis.
Following published procedures for the Bradford Assay (Sigma Aldrich Technical Report B6916) 100 µL aliquots of protein extract were removed from each sample tube and mixed with 3 mL of Bradford Reagent (Sigma Aldrich, Inc., St. Louis, MO, USA) in 10 mL glass vials [29]. Samples were incubated at room temperature for 45-min then transferred to optical cuvettes for measuring their absorbance at 595 nm using an Evolution 201 UV/VIS spectrophotometer (ThermoFisher Scientific Inc., Waltham, MA, USA). Absorbances were correlated with a standard curve created from measurements using a commercial protein standard (1 mg mL−1) of bovine serum albumin (Sigma Aldrich, Inc., St. Louis, MO, USA).

2.3. ‘Free’ Amino Acid Analysis

Dried and ground seeds were weighed (10 mg) and extracted in 0.5 mL methanol: water (60:40 v/v). After centrifugation at 14,000 x g, 100 µL of supernatant was mixed with an equal volume of o-phthalaldehyde (OPA) reagent (Sigma Aldrich, Inc. St. Louis, MO, USA). OPA-derivatized amino acids were analyzed following our published procedures [30] using high-performance liquid chromatography (Sonntek, Inc. Upper Saddle River, NJ 07458, USA) and a 300 mm x 3.9 mm i.d. Waters 10µm µBondapak C18 column (Phenomenex, Inc. Torrance, CA, USA) operated at room temperature. The mobile phase was comprised of Solvent A (deionized water, pH 5.75), Solvent B (0.01M NaH2PO4, pH 6.8) and solvent C (methanol) starting at 75:25 of A:B at injection and increasing to 20:80 of B:C over 30-min at a flow rate of 1.0 mL min−1. On-line fluorescence detection (340 nm excitation, 450 nm emission; Hitachi LaChrom Elite L-2485; Sonntek, Inc.) was used for quantification of the OPA-derivatized amino acids. Data was acquired using PeakSimple chromatography software v4.88 (SRI, Inc., Torrance, CA 90503, USA). Peaks were identified according to retention times established using authentic standards and integrated peaks were normalized for slight differences in the fluorescence detector response to each derivatized amino acid. Integrated normalized peaks were summed from each analyzed sample providing a total amino acid response and used to calculate a relative distribution of individual amino acids.

2.4. Fatty Acid Analysis

Fatty acid derivatization to their respective methyl esters followed prior published procedures [31]. Here, concentrated HCl (Sigma Aldrich, Inc., St. Louis, MO, USA; 35%, w/w; 9.7 mL) was diluted with 41.5 mL of methanol (Sigma Aldrich, Inc. St. Louis, MO, USA) to make 50 mL of 8.0% (w/v) HCl. This HCl reagent contained 85% (v/v) methanol and 15% (v/v) water that was derived from conc. HCl and was stored in a refrigerator. Dried and ground seeds whose preparation was described in Section 2.1 for protein analysis were weighed (10 mg) into 1.5 mL Eppendorf™ vials. To each vial we added 200 µL toluene followed by 300 µL of the HCl/methanol reagent. Tubes were vortexed mixed for 3-min then heated at 100 °C for 1-h. After cooling to room temperature, 1 mL of hexane was added for extraction of the fatty acid methyl esters (FAMEs). Tubes were vortexed mixed for 3-min then centrifuged at 14,000 × g for 10 min to facilitate phase separation. Aliquots of the hexane layer were then analyzed by gas chromatography. Here 1 µL aliquots were injected into a flame-ionization Hewlett Packard 5890A gas chromatograph equipped with a 30-m long capillary column, 0.53 mm i.d., 0.25 µm thick film of Rtx®-Wax (Restek, Inc., Bellefonte, PA, USA) with a 10 mL min−1 helium flowrate and a 1:50 sample split. At injection the initial column temperature was maintained at 80 °C and was programmed to increase to 230 °C 5-min after injection at a 15 °C min−1 rate. The sample injector was maintained at 250 °C and the flame ionization detector at 350 °C. Chromatographic peaks for methyl esters of palmitic acid (PA), stearic acid (SA), oleic acid (OA), linoleic acid (LA) and α-linolenic acid (α-LA) were recorded using PeakSimple™ chromatography software v4.88 (SRI, Inc., Torrance, CA, USA) and quantified against commercial standards (Sigma Aldrich, Inc., St. Louis, MO, USA).

2.5. Elemental Analysis

Inductively Coupled Plasma-Mass Spectrometry (ICP-MS) analysis was used to measure bean elemental metal concentrations. Here, seeds were air-dried in an oven at 70 °C, ground to a powder using a mortar and pestle, then weighed (~200 mg portions) into digestion vessels and finally digested in 2.5 mL of concentrated nitric acid at 190 °C in a Milestone Ethos Plus (Milestone SRL, Sorisole, Italy) microwave digestion system. Digestates were diluted to 50 mL with ultrapure water and gravimetrically diluted by a factor of 10 with 0.45 N nitric acid. Samples were analyzed via Perkin-Elmer NexION ICP-MS in Kinetic Energy Discrimination mode. Elemental ion counts were measured for 23Na, 24Mg, 39K, 44Ca, 55Mn, 56Fe, 60Ni, 63Cu, 66Zn and 95Mo, and normalized using the internal standards Be, Sc, In, Tl. Calibration standards for each analyte were prepared from commercial stock solutions (High Purity Standards, North Charleston, SC, USA).

2.6. Iron Oxidation State Analysis

While ICP-MS analysis provides quantitative information on seed total iron concentrations it cannot distinguish between ferric iron (Fe3+) or ferrous iron (Fe2+) oxidation states. Here we used a spectrophotometric assay that is specific for Fe2+ iron following published procedures [32]. Once measured, Fe3+ was reduced to Fe2+ and the measurements repeated to provide a measure of total ‘free’ iron ions.
The following reagents were prepared as follows: a 0.3% o-phenanthroline solution was prepared using 0.6 grams dissolved in 200 mL DI water; a 10% hydroxylamine hydrochloride solution was prepared by dissolving 20 grams in 200 mL of DI water; a 10% sodium acetate solution was prepared by dissolving 20 grams in 200 mL DI water; and a dilute sulfuric acid solution was prepared by adding 0.5 mL of concentrated sulfuric acid to 200 mL DI water. All chemicals were purchased from Sigma Aldrich (Sigma Aldrich, Inc., St. Louis, MO, USA).
Approximately 300 mg of frozen beans (2 beans) were ground to a paste in 2 mL dil. sulfuric acid using a mortar and pestle. Two 0.5 mL aliquots of liquid extract were dispensed into two 15 mL Falcon tubes. To the first tube, 5 mL of 0.3% o-phenanthroline solution was added to complex Fe2+ followed by 4 mL of the sodium acetate solution to adjust pH. The mixture was vortex mixed for 3-min and then centrifuged at 14,000 × g for 15-min. A 2 mL aliquot of the supernatant solution was transferred to an optical cell for UV absorption measurement at 508 nm using an Evolution 201 UV/VIS spectrophotometer (ThermoFisher Scientific Inc., Waltham, MA, USA).
To the second Falcon tube we added 1 mL of the 10% hydroxylamine hydrochloride reducing agent. The solution was initially vortex mixed for 1-min. and after 15-min of reaction it was vortexed mixed again. To this solution 5 mL of 0.3% o-phenanthroline solution was added to complex all the Fe2+ (including the now reduced Fe3+ ions) followed by 4 mL of the sodium acetate solution to adjust pH. The mixture was vortex mixed for 3-min. and then centrifuged at 14,000 × g for 15-min. A 2 mL aliquot of the supernatant solution was transferred to an optical cell for UV absorption measurement at 508 nm (Fe Abs. 508). The relative ratio (R) of Fe3+/Fe2+ was calculated using Equation 1:
R Fe 3 + / Fe 2 + = T o t a l   F e   A b s . 508 / 0.895 F e 2 +   A b s . 508 F e 2 +   A b s . 508
The factor 0.895 accounts for sample dilution due to the addition of the reducing agent.

2.7. Phytic Acid Analysis

Phytic acid content in seeds was measured using published procedures [33,34]. Here, 2-3 dried beans were weighed (~300 mg), ground to a powder using a mortar and pestle and added to 10 mL of 3 M HCl in a 15 mL Falcon Tube. Tubes were placed in boiling water for 10 min. The mixture was allowed to cool to room temperature, and centrifuged at 14,000 x g for 15-min. The supernatant was collected and diluted to 50 mL volume using deionized water. To a 3 mL aliquot of this diluted solution was added 1 mL of Wade Reagent (prepared by mixing 30 mg FeCl3 hexahydrate with 300 mg sulfosalicylic acid in 100 mL deionized water). The resultant solution was vortex mixed for 3-min. Chemicals for preparing the Wade Reagent were acquired from Sigma Aldrich (Sigma Aldrich, Inc., St. Louis, MO, USA). An optical cell was filled with this solution for absorbance measurement at 500 nm.
A standard for phytic acid was prepared by dissolving a few milligrams of authentic sample in 1 mL deionized water (Sigma Aldrich, Inc., St. Louis, MO, USA). A response curve was generated by repetitively adding 10 µL aliquots of the standard to a 3 mL sample of Wade reagent. The increased amount of phytic acid caused decolorization of the Wade reagent resulting in increasingly negative absorbances on the spectrophotometer. Data from a standard curve was fitted to a polynomial in Excel and used to calculate the microgram amounts of phytic acid in the biological samples.

2.8. Statistical Analysis

Data were subjected to one-way analysis of variance (ANOVA) using SigmaPlot 14.5. Tukey’s HSD test was used for post hoc correction of comparisons of treatments to untreated control plants. Significance was set at a level of p < 0.05.

3. Results

Total mean seed protein levels (Figure 1) for untreated control plants were 32.26 ± 0.49% of dry mass. This level seemed typical of prior published values [35,36,37,38]. However, treatment of soil with Coriphol™ systematically increased seed protein content to 33.99 ± 0.81% with 0.5 gal./acre treatments, 35.22 ± 0.94% with 1.0 gal./acre treatments and finally to 35.64 ± 0.64% with 2.0 gal./acre treatments producing an overall 10.8% boost in protein content that was significant (P = 0.0023).
Results in Table 1 summarize our findings on the effects of Coriphol™ treatment on seed ‘free’ amino acid content. Individual Peak Area Units (PAUs) for each identified amino acid are listed. These values were normalized to a fixed tissue mass that went into preparing each analysis sample. Levels of individual amino acids were also presented as a relative distribution based on 100%. Altogether, our analyses showed that Coriphol™ treatments significantly reduced the ‘free’ acid content from 13,666v± 1976 PAUs in untreated plants to 10270 ± 170 PAUs with 0.5 gal./acre treatment and to 4544 ± 313 PAUs for 1.0 gal./acre treatment and 5937 ± 756 PAUs for 2.0 gal./acre treatment for an average 45% reduction in ‘free’ amino acid content. Even so, the level of the essential dietary amino acid lysine increased from 13 ± 3 PAUs in untreated plants to 94 ± 21 PAUs for 0.5 gal./acretreatment, and to 53 ± 13 PAUs for 1.0 gal./acre treatment and 85 ± 17 PAUs for 2.0 gal./acre treatment reflecting roughly a 6-fold increase in lysine content.
Results in Table 2 summarize our findings on the effects of Coriphol™ treatment on seed fatty acid (FA) content. Here we found that in untreated control plants, the seed mean FA content was 21.61 ± 0.70% of dry mass. This level correlated well with prior published values [39,40]. The relative distributions of five major FAs found in soybean are also listed in Table 2 along with typical ranges of distributions found in the literature [41]. In untreated control plants, LA was the major seed FA with a relative mean distribution of 44.82 ± 5.33%. Furthermore, our measured level of saturated FAs was 19.96 ± 1.96% which also correlated well with a published range of distributions [39,40]. Several observations were made from studies where increasing treatments with Coriphol™ were used. Firstly, treatments did not affect the total seed FA content. However, these treatments did significantly alter the relative distributions of individual FAs. Most notably, LA levels significantly decreased from 44.82 ± 5.33% in untreated control plants to levels of 34.39 ± 4.58 with 1.0 gal./acre treatments and to 21.54 ± 3.51% with 2.0 gal./acre treatments. Treatments at 0.5 gal./acre were not effective at altering FA distributions. Commensurate with the decreases in seed LA content, we observed increases in OA levels from 25.72 ± 3.26% in untreated control plants to 45.85 ± 4.24% with 1.0 gal./acre treatments and 57.31 ± 3.69% with 2.0 gal./acre treatments. Secondly, we observed significant decreases in the saturated FA content, reflected by changes in PA and SA levels, with Coriphol™ treatments where levels were 19.96 ± 1.96% in untreated control plants and dropped systematically to 15.36 ± 1.04% with 0.5 gal./acre treatments, and to 10.96 ± 1.22% and 13.33 ± 0.74% with 1.0 and 2.0 gal./acre treatments, respectively. Thirdly, we observed that the ratio of polyunsaturated FAs to monounsaturated FAs significantly decreased from mean values of 2.39 ± 0.45 for untreated control plants to values of 1.03 ± 0.32 and 0.54 ± 0.10 for 1.0 and 2.0 gal./acre treatments, respectively. Treatments at 0.5 gal./acre did not significantly change this ratio.
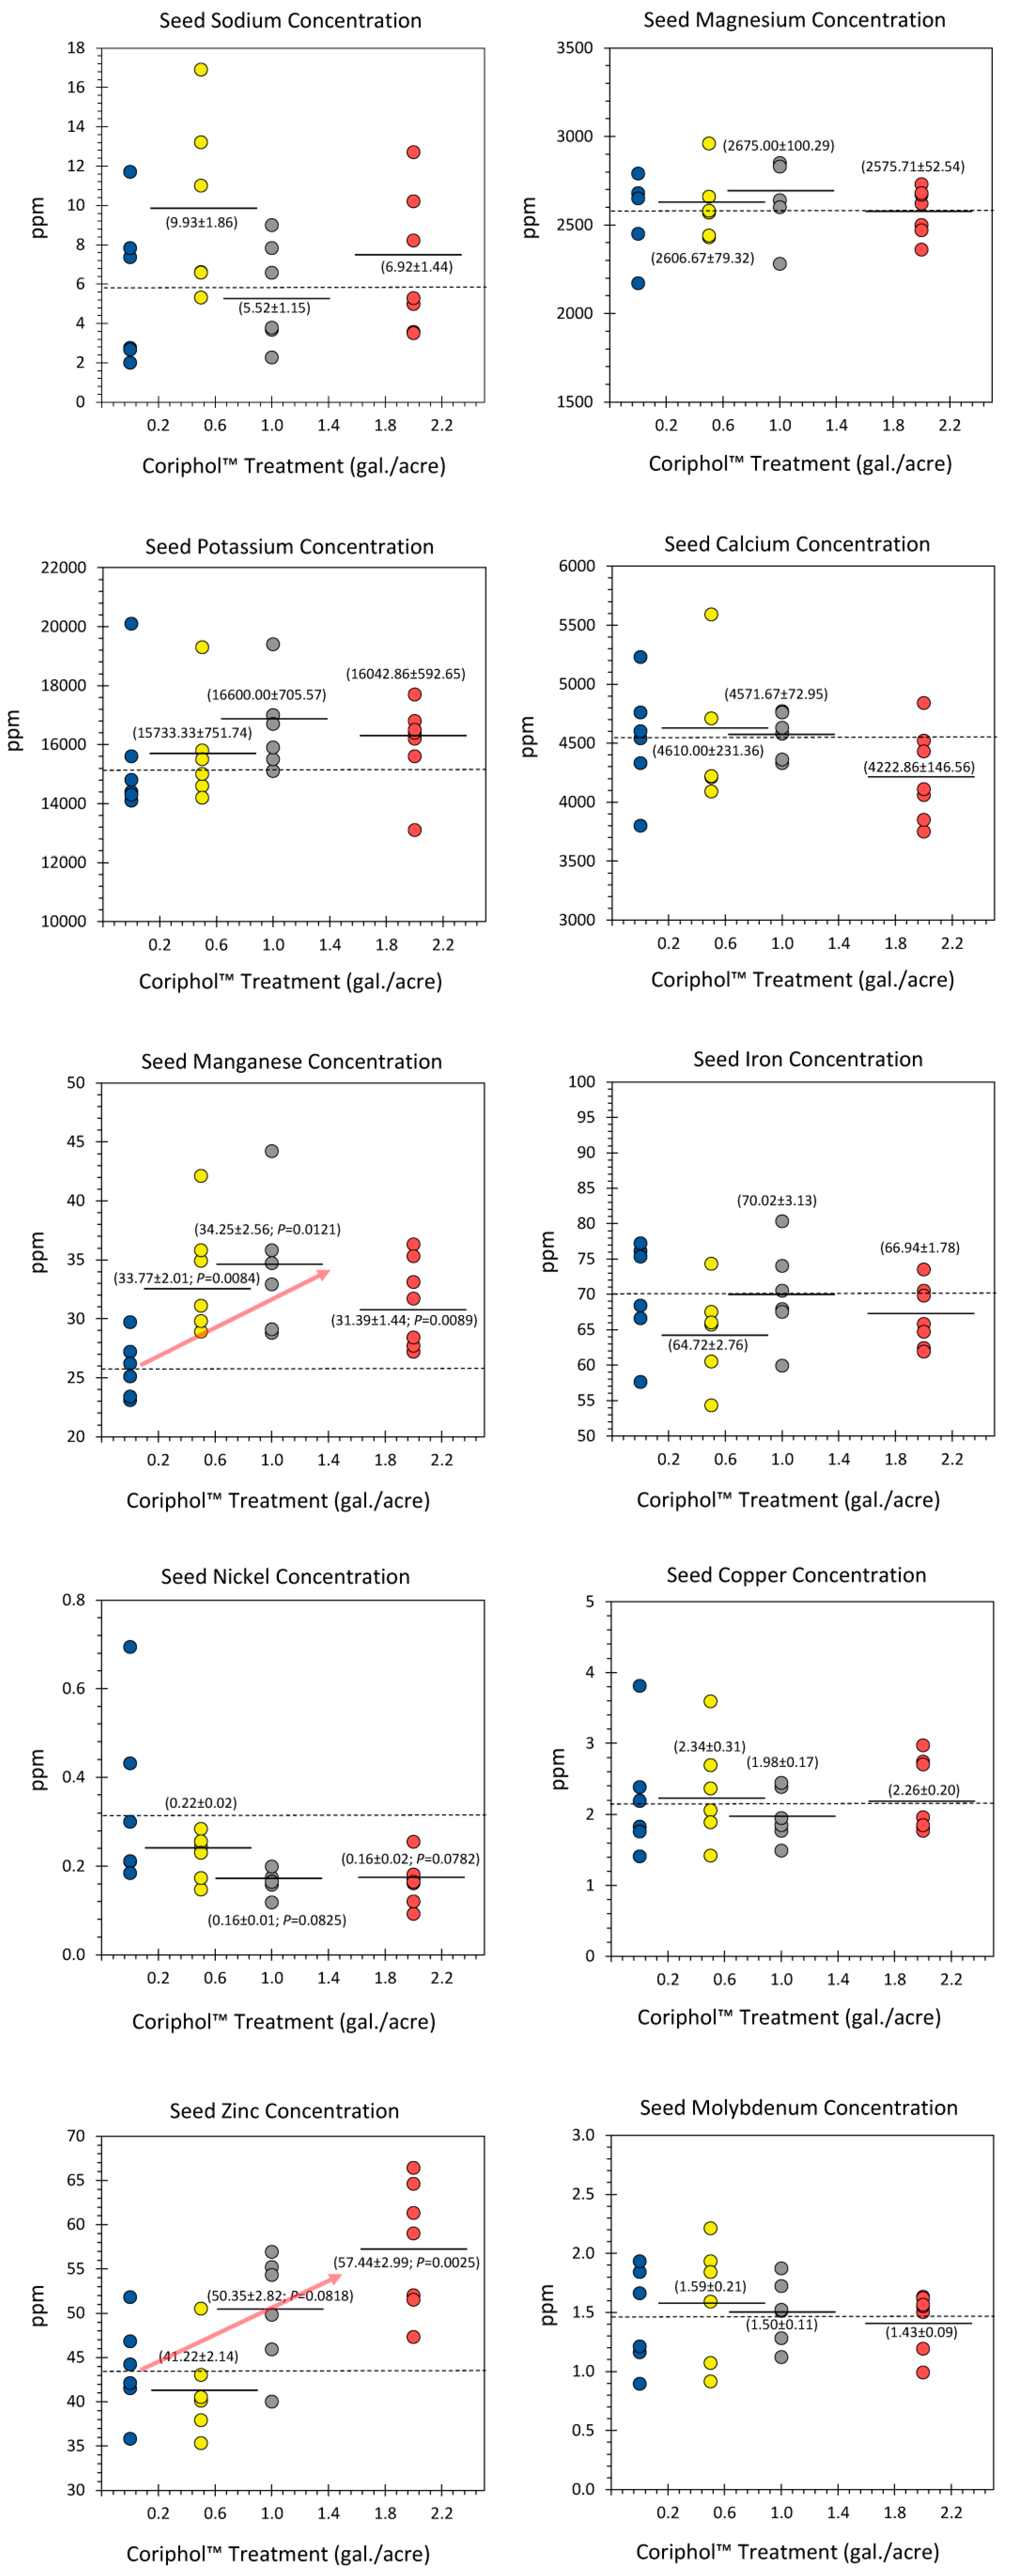
Results from analyses of seed content for seed metal micronutrient content are shown in Figure 2. Here we measured the part-per-million (ppm) concentrations of ten essential metal micronutrients including sodium (Na), magnesium (Mg), potassium (K0, calcium (Ca), manganese (Mn), iron (Fe), nickel (Ni), copper, (Cu), zinc (Zn) and molybdenum (Mo). With the exception of Mn and Zn, all of the remaining micronutrient levels were unaffected by Coriphol™ treatments where mean values of 5.71 ± 1.58 ppm for Na, 2570.00 ± 91.91 ppm for Mg, 15550.00 ± 935.50 ppm for K, 4543.33 ± 193.20 ppm for Ca, 70.20 ± 3.09 ppm for Fe, 0.34 ± 0.08 ppm for Ni, 2.23 ± 0.35 ppm for Cu and 1.45 ± 0.17 ppm for Mo. Levels of seed Ni appeared to decrease slightly with treatment but this change was not statistically significant. Contrary to these trends, the levels of micronutrients Mn and Zn were observed to increase significantly with treatments. Here, we observed changes in seed Mn levels from 25.78 ± 1.01 ppm in untreated plants to 33.77 ± 2.01 ppm for 0.5 gal./acre treatment, to 34.25 ± 2.56 ppm for 1.0 gal./acre treatment, and to 31.39 ± 1.44 ppm for 2.0 gal./acre treatment. Additionally, we observed changes in seed Zn levels from 43.70 ± 2.20 ppm for untreated plants, to 41.22 ± 2.14 ppm for 0.5 gal./acre treatment, to 50.35 ± 2.82 ppm for 1.0 gal./acre treatment, and to 57.44 ± 2.99 ppm for 2.0 gal./acre treatment.
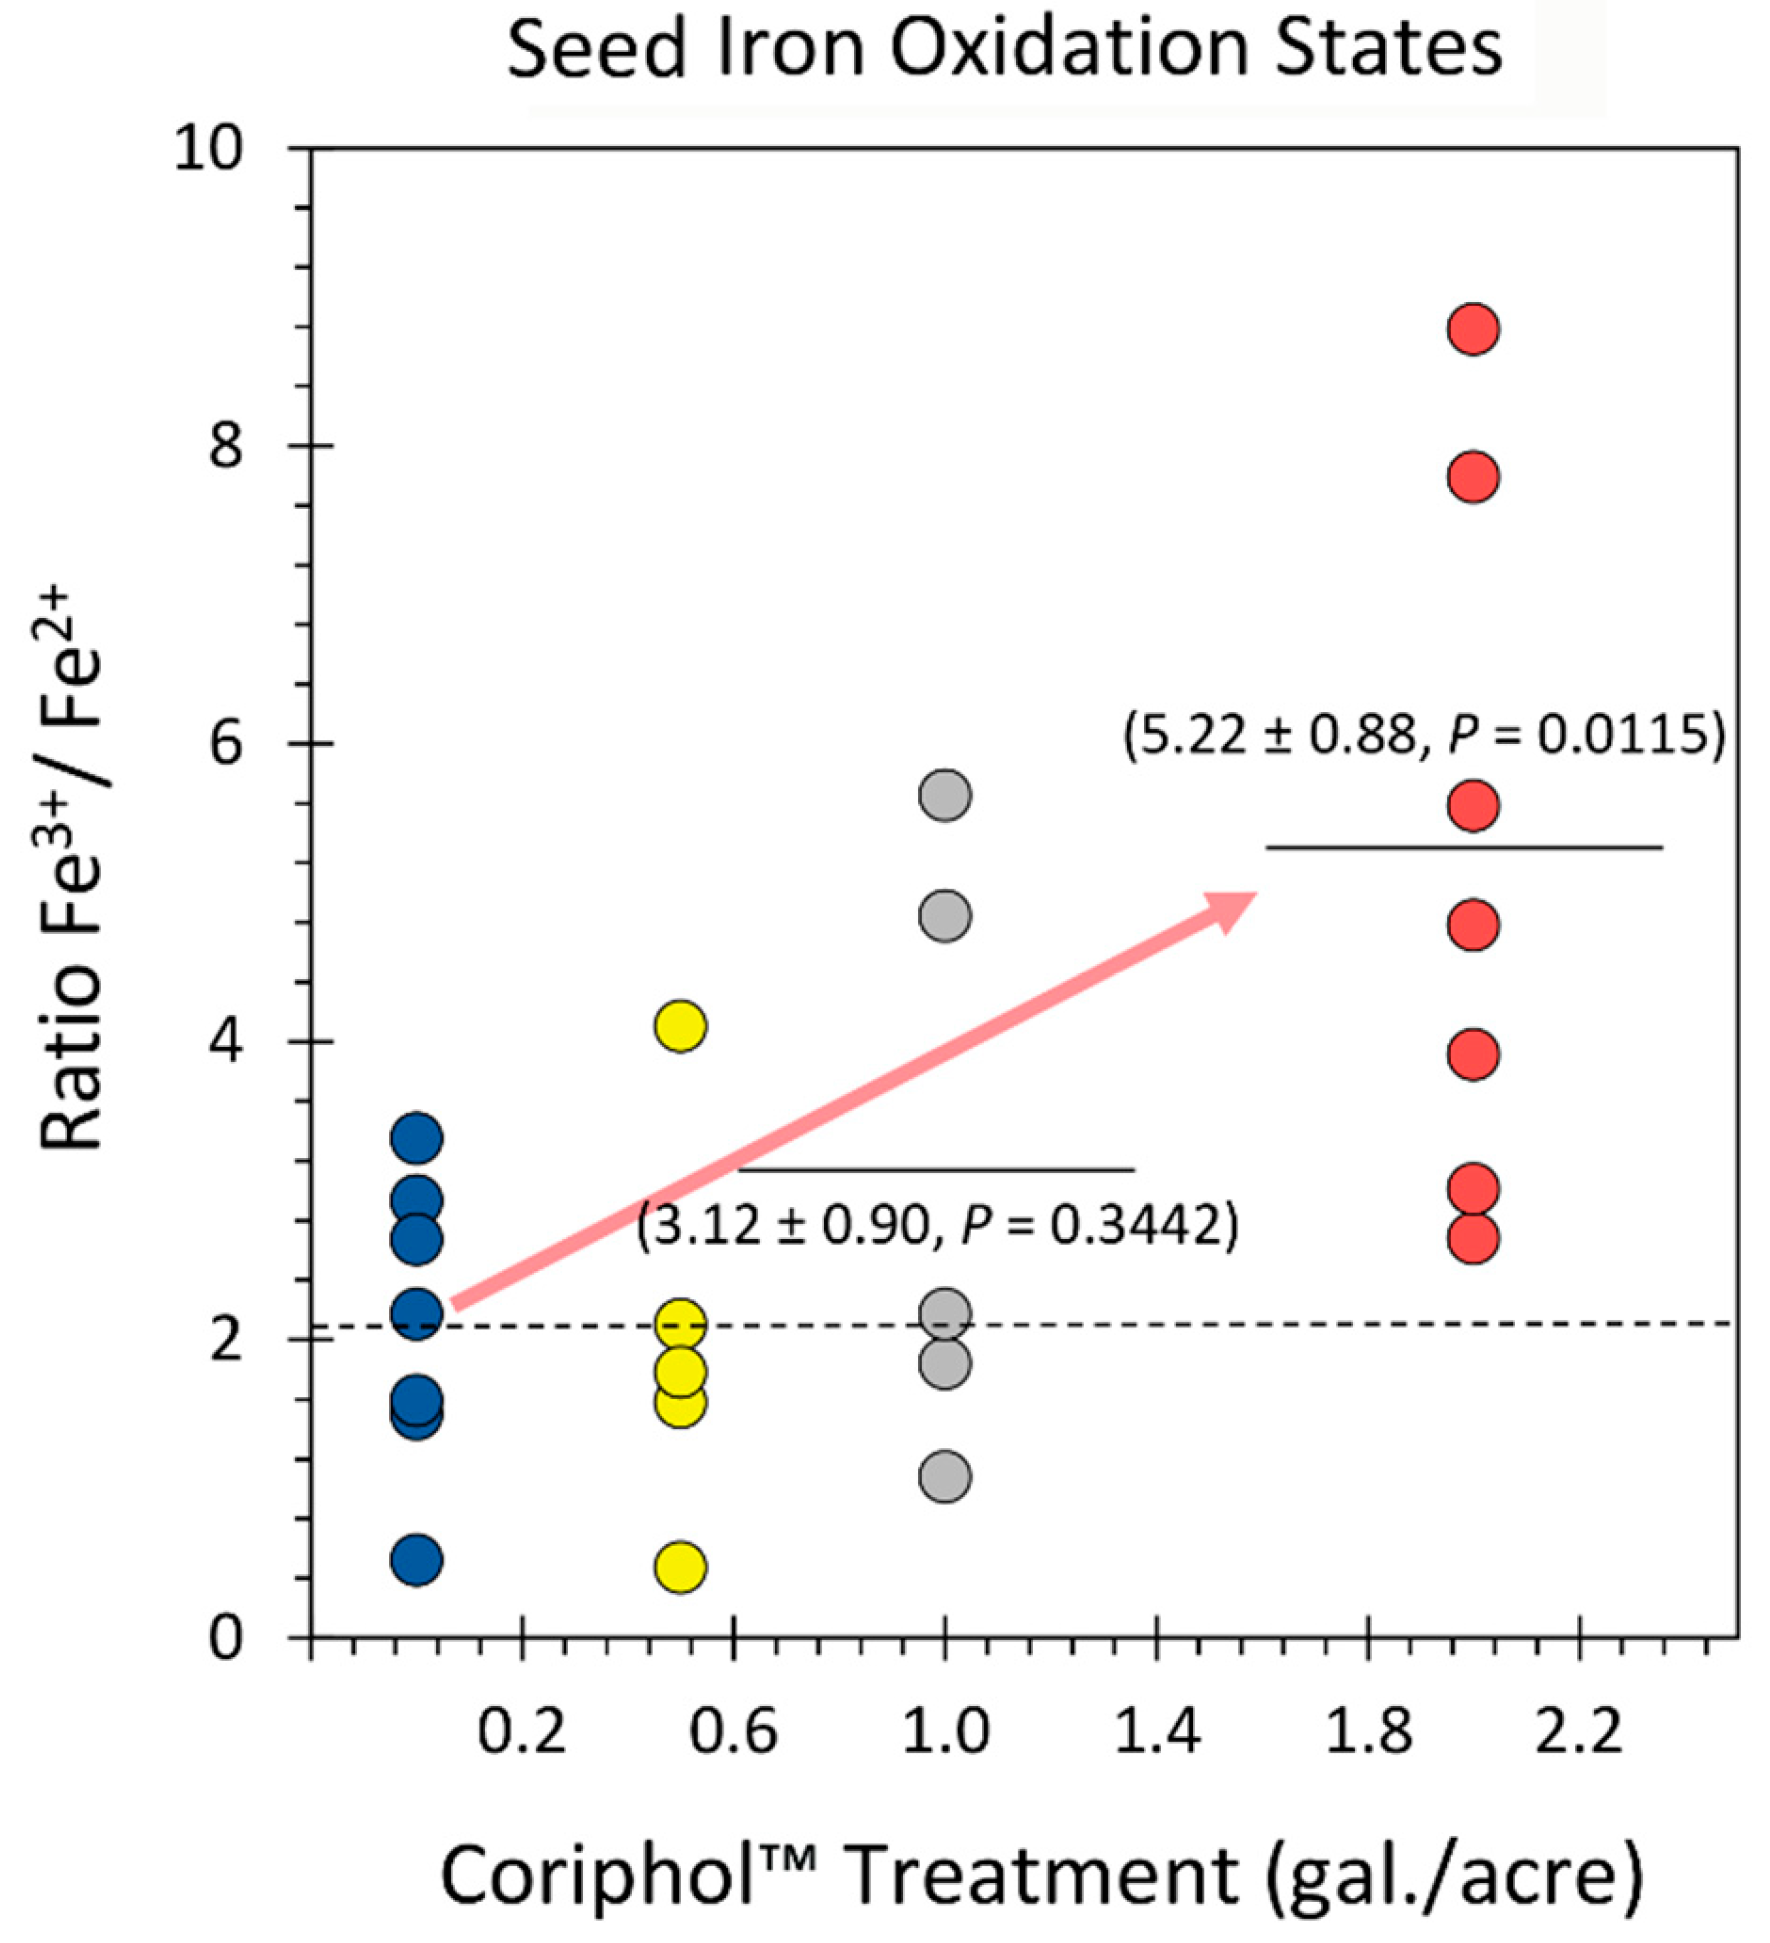
Results from follow-up studies designed to measure the ‘free’ iron ion oxidation state distribution in soybean seeds as a function of Coriphol™ treatments are presented in Figure 3. Here, we observed that 2.0 gal./acre treatments significantly increased the ratio Fe3+/Fe2+ from a mean value of 2.10 ± 0.37 in untreated control plants to 5.22 ± 0.88. Lesser doses of Coriphol™ were ineffective at changing this ratio.
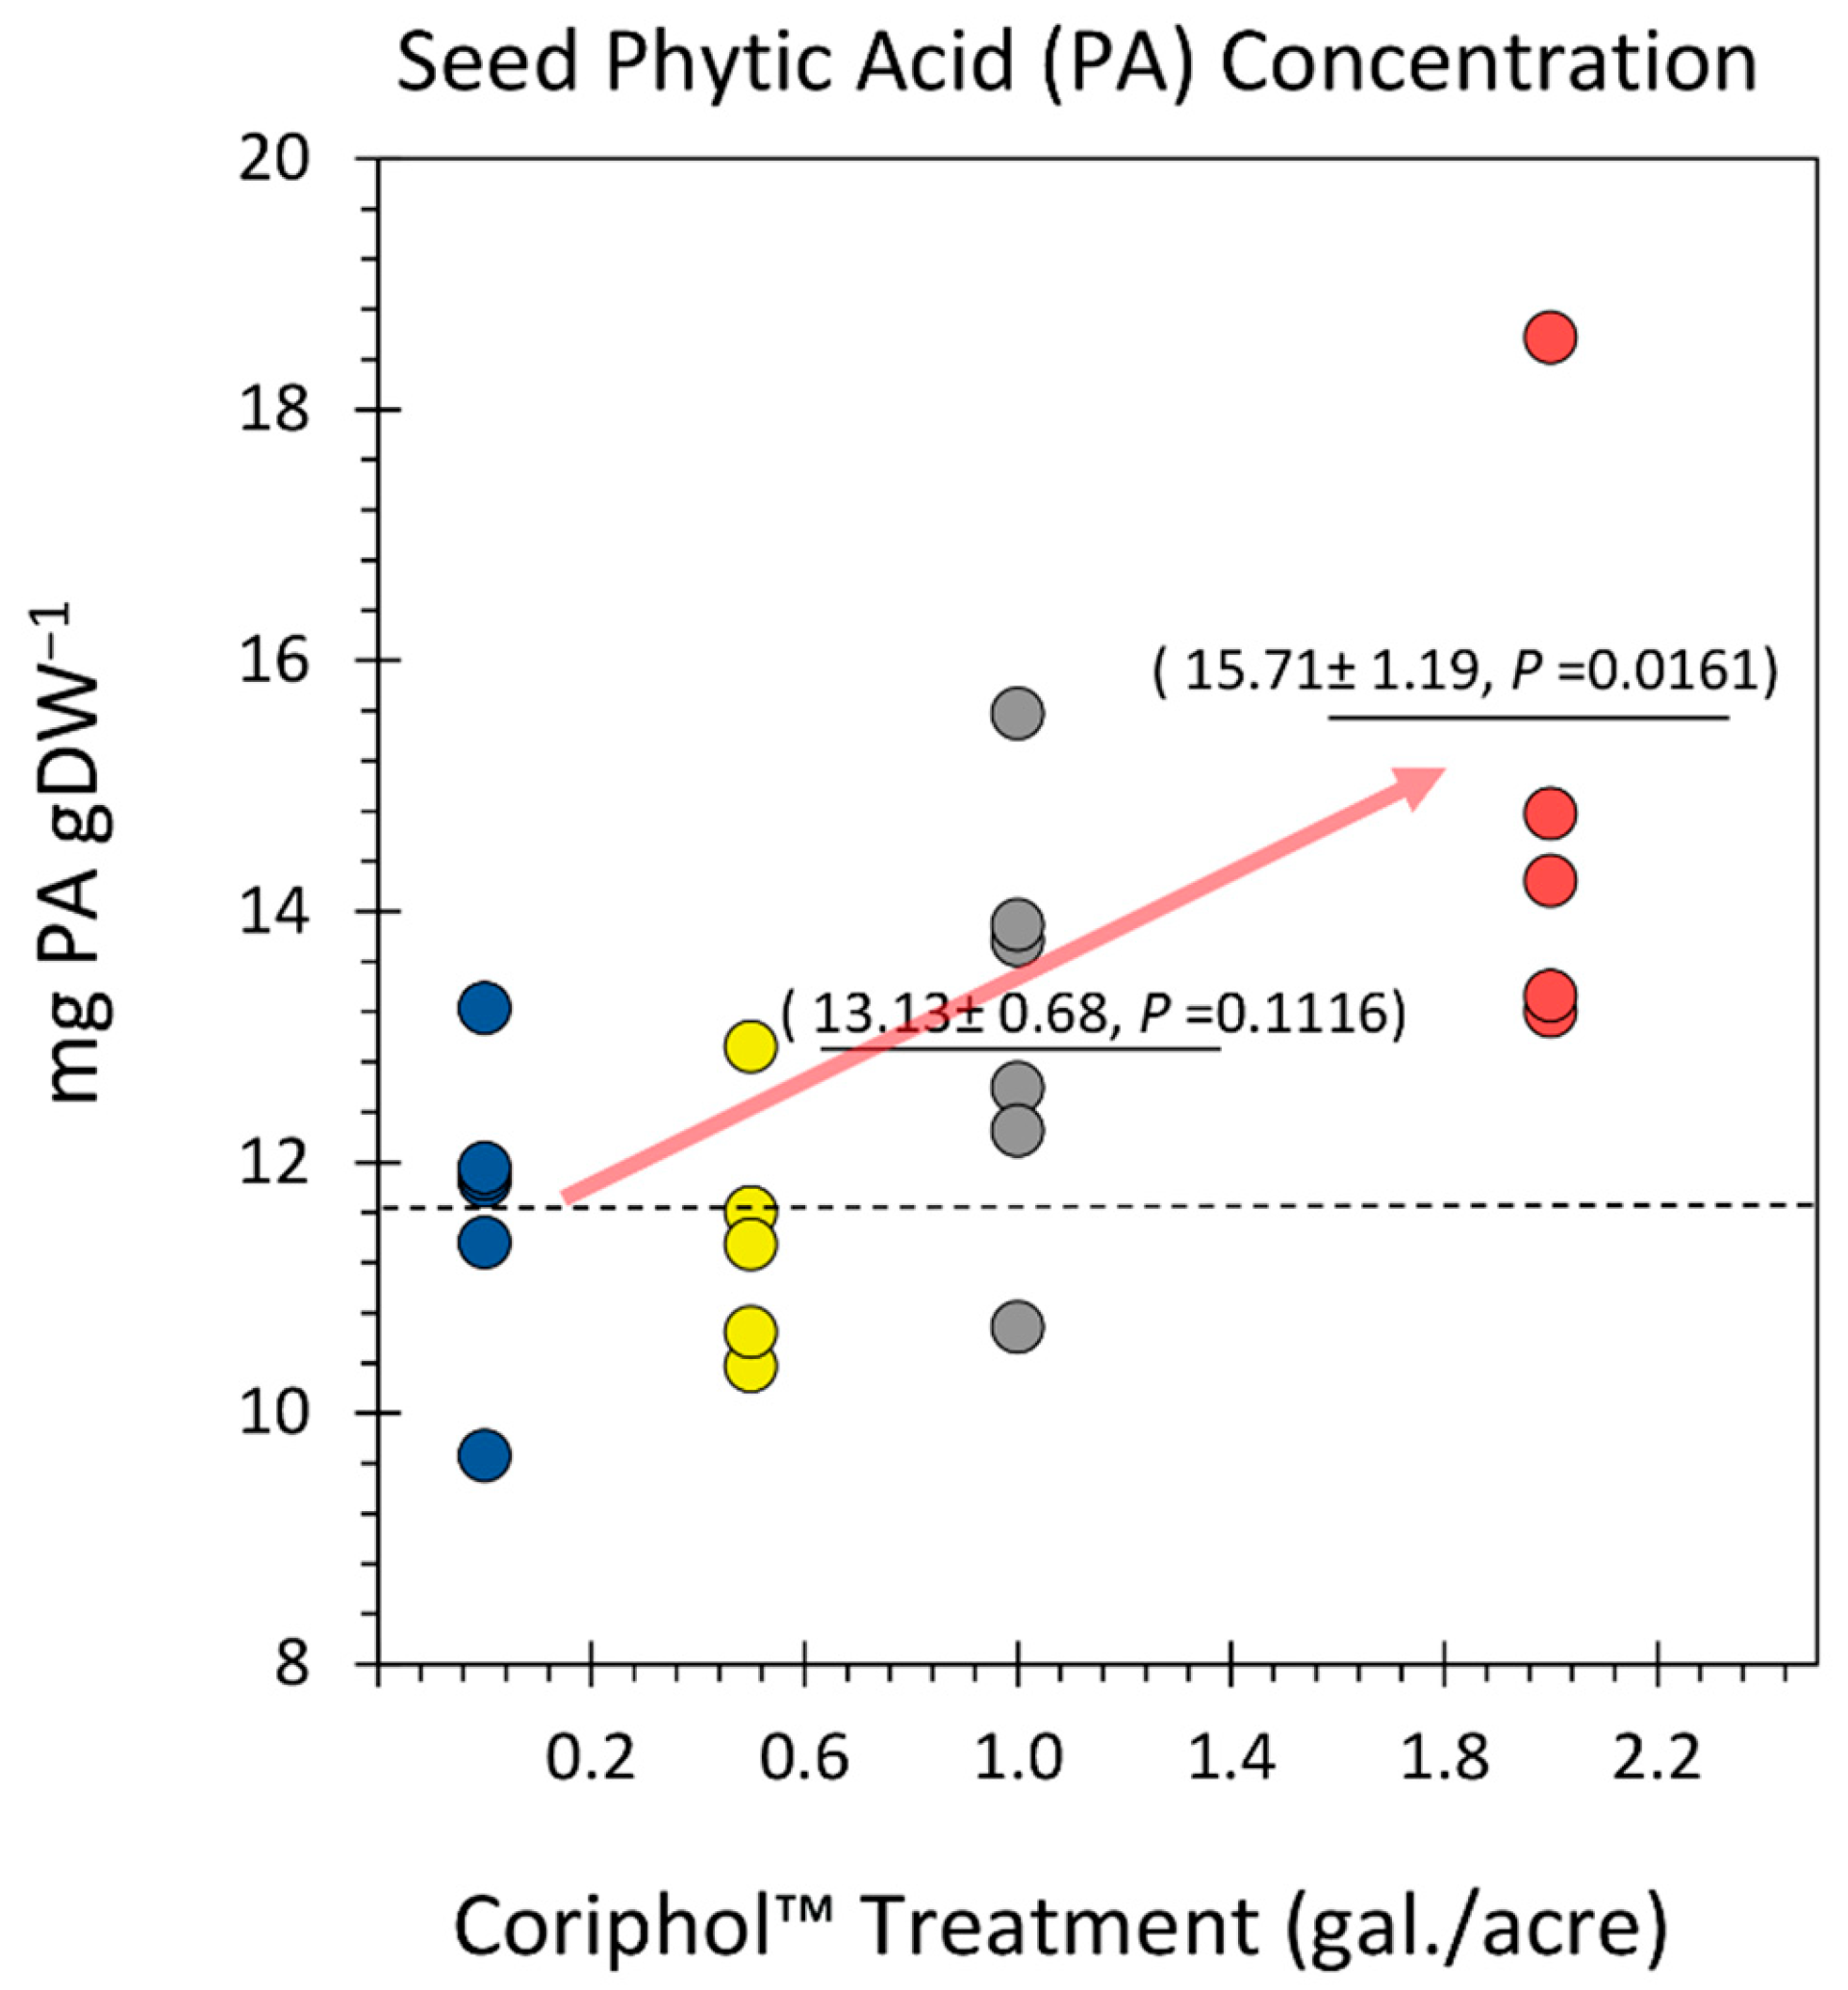
Results in Figure 4 showed the effects of treatments with Coriphol™ on seed phytic acid (PA) content. Untreated control plants exhibited a mean value of 11.66 ± 0.47 mg PA gDW−1 reflecting a level of 3.57 ± 0.31% of seed mass. This level of PA corresponds well with published values where levels from 1-5% have been noted [42]. Treatments equivalent to 2.0 gal./acre of Coriphol™ increased seed PA content slightly but significantly to a mean value of 15.71 ± 1.19 mg gDW−1 reflecting a level of 4.80 ± 0.62% of seed mass. Lesser doses of Coriphol™ did not elicit a significant change in the seed PA content.

4. Discussion

Amino acids play vital roles in the central metabolism of seeds. They are primarily utilized for the synthesis of seed-storage proteins, but also serve as precursors for the biosynthesis of secondary metabolites and as a source of energy [43,44,45]. Several amino acids essential to protein synthesis are typically found only in low levels in seeds (e.g., Lys, Met, Thr, Val, Leu, Ile and His). Others that are not directly involved in protein synthesis, such as asparagine (Asn) or γ-aminobutyrate (GABA), can be just as important in regulating protein synthesis and controlling stages of seed development [46,47].
Humans and farm animals are unable to synthesize several essential amino acids necessitating augmentation of their diets to balance nutritional intake. Typically, these essential amino acids are acquired from the dietary utilization of farm animals, and their products (particularly meat, eggs and milk), as well as from a variety of cereals and legumes. However, in underdeveloped countries where populations rely solely on crop plants as their major food source, many suffer from particular deficiencies [48]. Here, lysine and sulfur-containing methionine are noted to be the most limiting essential amino acids in the food chain [49,50,51] where inadequate dietary levels can result in severe protein deficiencies, disease and even death [52].
Results in our present work clearly demonstrated that the ‘free’ amino acid pool in soybean seed was significantly reduced by as much as 45% under the growth conditions where Coriphol™ treatments caused a significant 10.8% increase in the seed protein content. However, we suggest that the increase in seed protein synthesis was not sufficient to deplete the ‘free’ amino acid pool to this extent. An additional reason for the reduction in “free” amino acids may lie in the fact that Coriphol™ treatments also increased seed phytic acid content, by as much as 35% with 2 gal./acre treatments.
Phytic acid, or inositol hexaphosphate and its salt, phytate are a type of organophosphorous compound produced by terrestrial plants as a mechanism to store cellular phorphorous. Typically, phytates can account for 60-80% of total phosphorous stored in developed seeds [53]. Soybean phytates range between 1-3% of seed dry mass. A key feature of phytate reactivity is its polyanionic property enabling facile chelation with many positively charged metal cations including zinc, magnesium, iron and copper. For decades diets high in phytate were originally thought to be unhealthy as these salts were thought to reduce bioavailability of many essential micronutrients [54]. More recently, however, phytates have been shown to possess certain anticancer properties [55,56] and because of numerous clinical studies, phytates thought to lack the ability to permeate the lipid bilayer of plasma membranes were in fact observed in human plasma [57]. Another point worth noting is phytates can interact with amino acids due to the affinity of their phosphate groups for cationic amino acids [58]. Thus, our observation that Coriphol™ treatments increased seed phytates may also be the reason for our observed depletion of seed ‘free’ amino acid pool.
Regardless of what mechanism is responsible for this overall depletion of the ‘free’ amino acid pool, it is important to note that the seed Lys content in Coriphol™ treated plants was increased 6-fold. Hence, two benefits seen by treatment were an improvement in protein content and an improvement in the content of this essential dietary amino acid.
Another important feature in soybean production is the lipid content. Vegetable oils constitute one of the world’s most important plant commodities, with current annual production of more than 605 million tons [59]. Since 1970 consumption of vegetable oils has increased steadily at an average annual rate of 4%—about twice the rate of growth in world population. The major use of plant oils can be found both in human and animal diets accounting for approximately 35% of caloric intake [60]. Seed oils are composed almost entirely of triacylglycerols which are formed by ester linkages of fatty acids with glycerol. Here different fatty acid structures are known to exist in nature [61,62], but just five account for >90% of the food oils produced: palmitic acid (PA, 16:0), stearic acid (SA,18:0), oleic acid (OA, 18:1), linoleic acid (LA, 18:2), and α-linolenic acid (α-LA, 18:3) acids. These fatty acids are mostly found in membrane lipids of plant cells [63].
Unfortunately, most vegetable oils exhibit fatty acid compositions that make them less than ideal for human nutrition and the requirements of the food industry. Traditional soybean oils typically contain very high levels of LA [40] that can threaten the shelf life of products made from them due to their ease of oxidation [64,65]. Our present work demonstrated that treatments with Coriphol™ reduced the LA content in soybean seed favoring a high OA content. Oils with higher OA content are less susceptible to oxidation providing a benefit to oil functionality with improved shelf life of food products and they are capable of withstanding higher frying temperatures in food preparation. This change in FA content with treatment was also noted to shift away from saturated FAs. A recent review on dietary FAs discussed concerns over increased plasma non-esterified fatty acids linking obesity with insulin resistance and type 2 diabetes [66]. Most specifically, it was noted that while diets rich in saturated FAs like PA are unhealthy, diets rich in monounsaturated OA were found to elicit beneficial effects on insulin sensitivity [67]. Thus, diets high in OA and low in PA can impact diabetes risk in humans.
There are other benefits to note with high OA content. Improvements in breeding programs over the years have resulted in increased availability of soybean cultivars (Plenish beans) possessing a high OA content. Dairy farmers have capitalized on opportunities to improve their profit by adopting new feeding technologies in the dairy industry noting that cows supplemented with soybean diets high in OA produced more milk [68]. Altogether, the nutritional benefits seen here from Coriphol™ treatments were two-fold: (i) saturated FA content in seed was significantly decreased; (ii) the OA content in seed was significantly increased.
Dietary needs also require a well-balanced uptake of essential micronutrients [69]. For example, Ca builds bones and teeth; activates enzymes throughout the body; helps regulate blood pressure; and helps muscles to contract, nerves to send messages, and blood to clot. Copper assists with metabolizing fuel, making red blood cells, regulating neurotransmitters, and mopping up free radicals. Iron helps make hemoglobin (the oxygen-carrying chemical in the body’s red blood cells) and myoglobin (a protein in muscle cells). Iron is essential for activating certain enzymes and for making amino acids, collagen, neurotransmitters, and hormones. Magnesium, like calcium, builds bones and teeth. It also helps to regulate blood pressure and blood sugar and enables muscles to contract, nerves to send messages, blood to clot, and enzymes to work. Manganese helps form bones and helps metabolize amino acids, cholesterol, and carbohydrates. Nickel helps increase hormonal activity and is involved in lipid metabolism. Molybdenum activates several enzymes that break down toxins and prevents buildup of harmful sulfites in the body. Potassium balances fluids in the body, helps to maintain a steady heartbeat and to make muscles contract, and may benefit bones and blood pressure. Sodium balances fluids in the body, helps send nerve impulses, and helps make muscles contract. Zinc helps blood clot, helps make proteins and DNA, bolsters the immune system, and helps with wound healing and cell division.
In years past there had been considerable nutritional interest in iron due to its role in hemoglobin formation and oxygen transport [70]. More recently, researchers have observed that while human diets low in iron are responsible for most anemia cases reported in industrialized countries, they only account for half of those cases reported in developing countries [71] where infectious and inflammatory diseases (especially malaria), blood loss from parasitic infections, and other nutrient deficiencies (vitamin A, riboflavin, folic acid, vitamin K, and vitamin B12) are also important contributing factors [72]. In those countries, deficiencies stemming from inadequate dietary zinc and/or manganese in the diet have been associated with reduced immune function, increased risk of stunting growth in children, and increased adverse pregnancy outcomes in women [73,74,75,76].
Our rigorous analysis of soybean seeds by ICP-MS revealed that Coriphol™ treatments did not affect the levels of many essential micronutrients including Na, Mg, K, Ca, Fe, Ni, Cu, and Mo, but did significantly increase the content of Mn and Zn. Hence, treatment improves soybean nutritional value regarding these elements.
Finally, our spectrophometric analysis of the ‘free’ iron oxidation state distribution in seeds revealed that Coriphol™ treatment significantly increased the Ratio Fe3+/Fe2+. We note that past proton nuclear magnetic resonance (1H NMR) measurements revealed that the kinetic rate constants for formation of ferric (Fe3+) and ferrous (Fe2+) phytates were 4.21 x 10⁻⁶ s−1 and 3.95 x 10⁻⁶ s−1, respectively, while the equilibrium rate constants (kd) for the dissociation of ferric and ferrous phytates were 1.11 and 1.19, respectively [77]. Hence, ferrous-phytate forms more rapidly in solution and tends to be more stable. Thus, it is reasonable to expect that the Ratio Fe3+/Fe2+ should increase with Coriphol™ treatments, as observed, since seed phytic acid content also increased with treatments which can favorably sequester Fe2+ from the seed pool.

Conclusions

To summarize, our previous studies have shown that soil treatment using the commercial biostimulant, Coriphol™ improved soybean crop yields 1.4-fold [27]. The present study also demonstrates that this treatment will improve soybean seed nutritional value. Specifically, we showed that soybean seeds from Coriphol™ treated plants had higher protein content and while the net content of seed ‘free’ amino acids was reduced the level of lysine was increased 6-fold. Additionally, while the fatty acid content remained unaffected by treatment, the distribution of saturated fatty acids was reduced as was the distribution of the polyunsaturated fatty acid, linoleic acid reduced and compensated by a higher oleic acid content. Finally, our study showed that while many essential seed micronutrients were unaffected by Coriphol™ there was significant improvement in zinc and manganese content helping to meet critical dietary needs.

Supplementary Materials

There are no supplemental materials.

Author Contributions

Conceptualization, R.A.F.; methodology, R.A.F. and J.G.; formal analysis, R.A.F., R.N. and M.J.S.; investigation, R.A.F, J.G., R.N. and M.J.S.; data curation, R.A.F. and M.J.S.; writing—original draft preparation, R.A.F.; writing—review and editing, R.A.F., R.N., M.J.S. and J.G.; supervision, R.A.F.; funding acquisition, R.N. and R.A.F. All authors have read and agreed to the published version of the manuscript.

Funding

This research was funded internally through the University of Missouri, MizzouForward Undergraduate Research Training Grant in support of R.N. Additionally, award BCS-0922374 from the National Science Foundation to the University of Missouri funded the ICP-MS equipment used in this research.

Institutional Review Board Statement

Not applicable.

Informed Consent Statement

Not applicable.

Data Availability Statement

All data needed to evaluate the conclusions in the paper are present in the main text.

Acknowledgments

We would like to thank Corigin Solutions, Inc. for providing their product Coriphol™ for testing. Additionally, we would also like to thank the leadership team and support staff of the Missouri Research Reactor Center for providing infrastructure support for this research.

Conflicts of Interest

The authors declare no conflicts of interest.

References

  1. Soybeans: chemistry, production, processing, and utilization; Edited by Johnson, L.A.; White P.J.; Galloway, R. AOCS Press, Urbana, Illinois, USA, 2008.
  2. Michelfelder, A.J. Soy: A complete source of protein. American Family Physician, 2009, 79(1), 43–47.
  3. Living, O. Enjoy soy: Plant protein complete with all 9 essential amino acids. HuffPost. 2015. Available online: https://www.huffpost.com/entry/enjoy-soy-plant-protein-c_b_6509712 (accessed on 18 July 2024).
  4. Thrane, M.; Paulsen, P.V.; Orcutt, M.W.; Krieger, T.M. Soy protein: Impacts, production, and applications (Ch. 2). in Sustainable Protein Sources, (Edited by Nadathur, S.R.; Wanasundara, J.P.D.; L. Scanlin), Academic Press, Cambridge, MA, USA, 2017, p. 23-45.
  5. Messina, M.J. Legumes and soybeans: Overview of their nutritional profiles and health effects. American Journal of Clinical Nutrition 1999, 70, 439s–450s. [Google Scholar] [CrossRef] [PubMed]
  6. Rizzo, G.; Baroni, L. Soy, soy foods and their role in vegetarian diets. Nutrients 2018, 10(1), 43. [Google Scholar] [CrossRef]
  7. “Global soybean production forecast to reach record levels in 2023/2024.” in Oils and Fats International News, Global soyabean production forecast to reach record levels in 2023/24 (ofimagazine.com) (accessed on 20 July 2024).
  8. Lernoud, J.; Potts, J.; Sampson, G.; Schlatter, B.; Huppe, G.; Voora, V.; Willer, H.; Wozniak, J.; Dang, D. The state of sustainable markets 2018: Statistics and emerging trends. 2018, International Trade Centre., Geneva, Switzerland, http://www. intracen.org/uploadedFiles/intracenorg/Content/Publications/Sustainibility%202018%20layout-FIN-web2.pdf (accessed 17 July 2024).
  9. Meier, C.; Sampson, G.; Larrea, C.; Schlatter, B.; Voora, V.; Dang, D.; Bermudez, S.; Wozniak, J.; Willer, H. The State of Sustainable Markets 2020: Statistics and emerging trends. 2020, International Trade Centre, Geneva, Switzerland. Available online: https://api.pageplace.de/preview/DT0400.9789210054065_A42152460/preview-9789210054065_A42152460.pdf (accessed on 17 July 2024).
  10. United Nations. DESA Report 2017. World Population Prospects; United Nations: New York, NY, USA, 2017. [Google Scholar]
  11. Baldwin, I.T.; Benning, C.; Burke, A.; Caicedo, A.; Carpita, N.; Dilworth, M.; Horsch, R.; Kutchan, T.; Last, R.; Mackenzie, S.; et al.; Unleashing a Decade of Innovation in Plant Science—A Vision for 2015–2025 Plant Science Research Summit Held 2013 at the Howard Hughe Medical Institute and Sponsored by the American Society of Plant Biology the Howard Hughes Medical Institute, the National Science Foundation, the U.S. Department of Agriculture, and the U.S. Department of Energy. Available online: https://aspb.org/wp-content/uploads/2016/05/plantsciencedecadalvision10-18-13.pdf (accessed on 4 March 2024).
  12. Transparency Market Research. Soybean market size, share, trends, growth, export value, volume & trade, sales, pricing forecast. 2018. Available online: https://www.transparencymarketresearch.com/soybean-market.html (accessed on 17 July 2024).
  13. Ritchie, H.; Roser, M. Meat and seafood production & consumption. Our World in Data. 2018. Available online: https://ourworldindata.org/meat-and-seafood-production-consumption (accessed on 17 July 2024).
  14. Transparency Market Research. Food & beverages (Section 7.2.1). In Soybean Market. 2017, p. 235. Available online: https://www.transparencymarketresearch.com/soybean-market.html (accessed on 18 July 2024).
  15. Chatham House. Agricultural commodity supply chains: Trade, consumption and deforestation. 2016. Available online: https://www.chathamhouse.org/publication/agricultural-commodity-supply-chains-trade-consumption-and-deforestation (accessed on 15 July 2024).
  16. Grewal, A.; Abbey, L.; Gunupuru, L.R. Production, prospects, and potential application of pyroligneous acid in agriculture. J. Anal. Appl. Pyrolysis 2018, 135, 152–159. [Google Scholar] [CrossRef]
  17. da Silva Porto, F.G.; Campos, A.D.; Garcia, I.T.S. Distilled pyroligneous liquor obtained from Eucalyptus grandis and chitosan: Physicochemical properties of the solution and films. Environ. Sci. Pollut. Res. 2019, 26, 672–683. [Google Scholar] [CrossRef]
  18. Luo, X.; Wang, Z.; Meki, K.; Wang, X.; Liu, B.; Zheng, H.; You, X.; Li, F. Effect of co-application of wood vinegar and biochar on seed germination and seedling growth. J. Soils Sediments 2019, 19, 3934–3944. [Google Scholar] [CrossRef]
  19. Cândido, N.R.; Duarte Pasa, V.M.; de Oliveira Vilela, A.; Campos, A.D.; de Fátima, A.; Modolo, L.V. Understanding the multifunctionality of pyroligneous acid from waste biomass and the potential applications in agriculture. Sci. Total Environ. 2023, 881, 163519. [Google Scholar] [CrossRef] [PubMed]
  20. Mun, S.P.; Ku, C.S. Pyrolysis GC-MS analysis of tars formed during the aging of wood and bamboo crude vinegars. J. Wood Sci. 2009, 56, 47–52. [Google Scholar] [CrossRef]
  21. Mungkunkamchao, T.; Kesmala, T.; Pimratch, S.; Toomsan, B.; Jothityangkoon, D. Wood vinegar and fermented bioextracts: Natural products to enhance growth and yield of tomato (Solanum lycopersicum L.). Sci. Hortic. 2013, 154, 66–72. [Google Scholar] [CrossRef]
  22. Ofoe, R.; Gunupuru, L.R.; Qin, D.; Thomas, R.H.; Abbey, L. Pyroligneous acid increases productivity and nutritional quality of greenhouse tomato. Plants 2022, 11, 1650. [Google Scholar] [CrossRef]
  23. Ofoe, R.; Mousavi, S.M.N.; Thomas, R.H.; Lord, A. Foliar application of pyroligneous acid acts synergistically with fertilizer to improve the productivity and phytochemical properties of greenhouse-grown tomato. Sci. Rep. 2024, 14, 1934. [Google Scholar] [CrossRef]
  24. Zhu, K.; Liu, J.; Luo, T.; Zhang, K.; Khan, Z.; Zhou, Y.; Cheng, T.; Yuan, B.; Peng, X.; Hu, L. Wood vinegar impact on the growth and low-temperature tolerance of rapeseed seedlings. Agronomy 2022, 12, 2453. [Google Scholar] [CrossRef]
  25. Zeng, L.; Sun, X.; Zhou, W.; Li, J.; Guo, Y.; Liu, X.; Cui, D. Combined treatment of a pyroligneous solution and soluble calcium enhances cotton growth through improving soil quality in saline-alkali soils. J. Soil Sci. Plant Nutr. 2022, 22, 25–35. [Google Scholar] [CrossRef]
  26. Fedeli, R.; Vannini, A.; Guarnieri, M.; Monaci, F.; Loppi, S. Bio-based solutions for agriculture: Foliar application of wood distillate alone and in combination with other plant-derived corroborants results in different effects on lettuce (Lactuca sativa L.). Biology 2022, 11, 404. [Google Scholar] [CrossRef]
  27. Noel, R.; Schueller, M.J.; Ferrieri, R.A. Radiocarbon flux measurements provide insight into why a pyroligneous acid product stimulates plant growth. Int. J. Mol. Sci. 2024, 25, 4207. [Google Scholar] [CrossRef]
  28. Wu, X.; Xiong, E.; Wang, W.; Scali, M.; Cresti, M. Universal sample preparation method integrating trichloroacetic acid/acetone precipitation with phenol extraction for crop proteomic analysis. Nature Protocols 2014, 9, 363–374. [Google Scholar] [CrossRef] [PubMed]
  29. Bradford, M.M. A rapid and sensitive method for the quantitation of microgram quantities of protein utilizing the principle of protein–dye binding. Anal. Biochem. 1976, 72, 248–254. [Google Scholar] [CrossRef]
  30. Qu, W.; Robert, C.A.M.; Erb, M.; Hibbard, B.E.; Paven, M.; Gleede, T. Dynamic precision phenotyping reveals mechanisms of crop tolerance to root herbivory. Plant Physiology 2016, 172, 776–788. [Google Scholar] [CrossRef]
  31. Ichihara, K.; Fukubayashi, Y. Preparation of fatty acid methyl esters for gas-liquid chromatography. Journal of Lipid Research 2010, 51, 635–640. [Google Scholar] [CrossRef]
  32. Atkins, R.C. Colorimetric determination of iron in vitamin supplement tablets. A general chemistry experiment. J Chem. Educ. 1975, 52(8), 550. [Google Scholar] [CrossRef]
  33. Vaintraub, A.; Lapteva, N. A. Colorimetric determination of phytate in unpurified extracts of seeds and the products of their processing. Anal. Chem. 1988, 175, 227–230. [Google Scholar] [CrossRef]
  34. Agostinho, A.J.; de Souza Oliveira, W.; Anunciação, D.S.; Santos, J.C.C. Simple and sensitive spectrophotometric method for phytic acid determination in grains. Food Anal. Methods 2016, 9, 2087–2096. [Google Scholar] [CrossRef]
  35. Wolf, W.J. Soybean protein nomenclature: A progress report. Cereal Science Today. Number 3. 1969, 14, 75–129. [Google Scholar]
  36. Meinke, D.W.; Chen, J.; Beachy, R.N. Expression of storage-protein genes during soybean seed development. Planta 1981, 153, 130–139. [Google Scholar] [CrossRef] [PubMed]
  37. Takahashi, M.; Uematsu, Y.; Kashiwaba, K.; Yagasaki, K.; Hajika, M.; Matsunaga, R. Accumulation of high levels of free amino acids in soybean seeds through integration of mutations conferring seed protein deficiency. Planta. 2003, 217(4), 577–586. [Google Scholar] [CrossRef] [PubMed]
  38. Singer, W.M.; Zhang, B.; Rouf Mian, M.A.; Huang, H. “Soybean Amino Acids in Health, Genetics, and Evaluation.” published in Soybean for Human Consumption and Animal Feed (Aleksandra Sudarić, ed.), 2020, IntechOpen. [CrossRef]
  39. Wallis, J.G.; Bengtsson, J.D.; Browse, J. Molecular approaches reduce saturates and eliminate trans fats in food oils. Front. Plant Sci. 2022, 13, 908608. [Google Scholar] [CrossRef]
  40. Hoekman, S.K.; Broch, A.; Robbins, C.; Ceniceros, E.; Natarajan, M. Review of biodiesel composition, properties, and specifications. Renewable and Sustainable Energy Reviews, 2012, 16, 143–169. [Google Scholar] [CrossRef]
  41. Abdelghany, A.M.; Zhang, S.; Azam, M.; Shaibu, A.S.; Feng, Y.; Li, Y.; Tian, Y.; Hong, H.; Li, B.; Sun, J. Profiling of seed fatty acid composition in 1025 Chinese soybean accessions from diverse ecoregions. The Crop Journal 2020, 8, 635–644. [Google Scholar] [CrossRef]
  42. Gupta, R.K.; Gangoliya, S.S.; Singh, N.K. Reduction of phytic acid and enhancement of bioavailable micronutrients in food grains. J Food Sci Technol. 2015, 52(2), 676–84. [Google Scholar] [CrossRef]
  43. Galili, G.; Amir, R.; Fernie, A.R. The regulation of essential amino acid synthesis and accumulation in plants Annu. Rev. Plant Biol. 2016, 67, 153–178. [Google Scholar] [CrossRef]
  44. Angelovici, R.; Fait, A.; Fernie, A.R.; Galili, G. A seed high-lysine trait is negatively associated with the TCA cycle and slows down Arabidopsis seed germination. New Phytol., 2011, 189, 148–159. [Google Scholar] [CrossRef]
  45. Xing, A.; Last, R.L. A regulatory hierarchy of the Arabidopsis branched-chain amino acid metabolic network. Plant Cell 2017, 29, 1480–1499. [Google Scholar] [CrossRef]
  46. Fait, A.; Fromm, H.; Walter, D.; Galili, G.; Fernie, A.R. Highway or byway: the metabolic role of the GABA shunt in plants. Trends Plant Sci. 2008, 13, 14–19. [Google Scholar] [CrossRef] [PubMed]
  47. Hernandez-Sebastia, C.; Marsolais, F.; Saravitz, C.; Israel, D.; Dewey, R.E.; Huber, S.C. Free amino acid profiles suggest a possible role for asparagine in the control of storage-product accumulation in developing seeds of low- and high-protein soybean lines. J. Exp. Bot. 2005, 56, 1951–1963. [Google Scholar] [CrossRef]
  48. Galili, G.; Amir, R. Fortifying plants with the essential amino acids lysine and methionine to improve nutritional quality. Plant Biotechnol. J. 2013, 11, 211–222. [Google Scholar] [CrossRef]
  49. Galili, G.; Amir, R.; Hoefgen, R.; Hesse, H. Improving the levels of essential amino acids and sulfur metabolites in plants. Biol. Chem. 2005, 386, 817–831. [Google Scholar] [CrossRef]
  50. Ufaz, S.; Galili, G. Improving the content of essential amino acids in crop plants: goals and opportunities. Plant Physiol. 2008, 147, 954–961. [Google Scholar] [CrossRef] [PubMed]
  51. Wenefrida, I.; Utomo, H.S.; Blanche, S.B.; Linscombe, S.D. Enhancing essential amino acids and health benefit components in grain crops for improved nutritional values. Recent Patents on DNA & Gene Sequencing 2009, 3, 219–225. [Google Scholar]
  52. World Health Organization (WHO), Protein and amino acid requirements in human nutrition. In: Report of a joint WHO/FAO/UNU. 2007, WHO Press, Geneva, Switzerland. http://whqlibdoc.who.int/trs/WHO_TRS_935_eng.pdf. (accessed on 23 July 2024).
  53. Pires, S.M.G.; Reis, R.S.; Cardoso, S.M.; Pezzani, R.; Paredes-Osses, E.; Seilkhan, A. Phytates as a natural source for health promotion: A critical evaluation of clinical trials. Front. Chem. 2023, 11, 1174109. [Google Scholar] [CrossRef]
  54. Nahapetian, A.; Young, V.R. Metabolism of 14C-phytate in rats: Effect of low and high dietary calcium intakes. J. Nutr. 1980, 110, 1458–1472. [Google Scholar] [CrossRef]
  55. Vucenik, I.; Shamsuddin, A.M. Cancer inhibition by inositol hexaphosphate (IP6) and inositol: From laboratory to clinic. J. Nutr. 2003, 133, 3778s–3784s. [Google Scholar] [CrossRef]
  56. Vucenik, I.; Shamsuddin, A.M. Protection against cancer by dietary IP6 and inositol. Nutr. Cancer 2006, 55, 109–125. [Google Scholar] [CrossRef] [PubMed]
  57. Grases, F.; Simonet, B.M.; Vucenik, I.; Prieto, R.M.; Costa-Bauzá, A.; March, J.G. Absorption and excretion of orally administered inositol hexaphosphate (IP(6) or phytate) in humans. Biofactors 2001, 15, 53–61. [Google Scholar] [CrossRef] [PubMed]
  58. Lee, S.-H.; Park, H.-J.; Chun, H.-K.; Cho, S.-Y.; Cho, S.-M.; Lillehoj, H.S. Dietary phytic acid lowers the blood glucose level in diabetic KK mice. Nutr. Res. 2006, 26, 474–479. [Google Scholar] [CrossRef]
  59. USDA Foreign Agricultural Service, 2024 World Production, Market and Trade Report, “Oilseeds: World Markets and Trade” (Washington DC: USDA FAS). Available online: https://apps.fas.usda.gov/psdonline/circulars/oilseeds.pdf (accessed on 23 July 2024).
  60. US Centers for Disease Control, “Health, United States 2020-2021”, CDC, Atlanta, USA. https://www.cdc.gov/nchs/hus/topics/nutrition.htm (accessed on 23 July 2024).
  61. Hilditch, T.P.; Williams, P.N. The Chemical Constitution of Natural Fats. (4th ed.), Chapman & Hall Publishing, London, England, 1964.
  62. Gunstone, F. Movements towards tailor-made fats. Prog. Lipid Res. 1998, 37, 277–305. [Google Scholar] [CrossRef] [PubMed]
  63. Ohlrogge, J.; Browse, J. Lipid biosynthesis. Plant Cell, 1995, 7, 957–970. [Google Scholar]
  64. Weiss, T.J. Food Oils and Their Uses. 2nd Edition. AVI Publishing, Westport, CT, USA, 1983.
  65. Gurr, M.I. Role of Fats in Food and Nutrition. Elsevier Applied Science, New York City, NY, USA, 1992.
  66. Palomer, X.; Pizarro-Delgado, J.; Emma Barroso, E.; Vázquez-Carrera, M. Palmitic and oleic acid: the Yin and Yang of fatty acids in Type 2 diabetes Mellitus. Trends in Endocrinology & Metabolism 2018, 29, 178–190. [Google Scholar]
  67. Vessby, B.; Uusitupa, M.; Hermansen, K.; Riccardi, G.; Rivellese, A.A.; Tapsell, L.C., et. al. Substituting dietary saturated for monounsaturated fat impairs insulin sensitivity in healthy men and women: The KANWU Study. Diabetologia, 2001, 44, 312–319. [Google Scholar] [CrossRef]
  68. “Carefully consider feeding dairy cattle high oleic soybeans,” Farm and Dairy News, 2023, https://www.farmanddairy.com/columns/carefully-consider-feeding-dairy-cattle-high-oleic-soybeans/794068.html (accessed on 19 July 2024).
  69. “Precious metals and other important minerals for health.” Harvard Medical School, Harvard Health Publishing, 2021, Cambridge, MA, USA, https://www.health.harvard.edu/staying-healthy/precious-metals-and-other-important-minerals-for-health (accessed on 3 August, 2024).
  70. Underwood, E.J.; Suttle, N.F. 3rd ed. “The Mineral Nutrition of Livestock.” CABI Publishing, Boston, MA, USA, 2022.
  71. Allen, L.; de Benoist, B.; Dary, O.; Hurrell, R., eds. “Guidelines on Food Fortification with Micronutrients,” 2006, WHO and FAO, Geneva, Switzerland. https://www.who.int/publications/i/item/9241594012 (accessed on 23 July 2024).
  72. Brabin, B.J.; Premji, Z.; Verhoeff, F. An analysis of anemia and child mortality. J Nutr. 2001, 131(2S-2), 604S-614S, discussion 614S-615S.
  73. Institute of Medicine. Food and Nutrition Board. “Dietary Reference Intakes for Vitamin A, Vitamin K, Arsenic, Boron, Chromium, Copper, Iodine, Iron, Manganese, Molybdenum, Nickel, Silicon, Vanadium, and Zinc. National Academy Press, Washington, DC, USA, 2001.
  74. Alloway, B.J. Soil factors associated with zinc deficiency in crops and humans. Environ. Geochem. Health 2009, 31, 537–548. [Google Scholar] [CrossRef]
  75. Hess, S.Y. National risk of zinc deficiency as estimated by national surveys. Food Nutr. Bull. 2017, 38, 3–17. [Google Scholar] [CrossRef]
  76. National Institutes of Health Office of Dietary Supplements: Manganese Fact Sheet for Health Professionals. https://ods.od.nih.gov/factsheets/Manganese-HealthProfessional/ (accessed on 22 July 2024).
  77. Heighton, L.; Schmidt, W.F.; Siefert, R.L. Kinetic and equilibrium constants of phytic acid and ferric and ferrous phytates derived from nuclear magnetic resonance spectroscopy. J. Agric. Food Chem., 2008, 56, 9543–9547. [Google Scholar] [CrossRef]
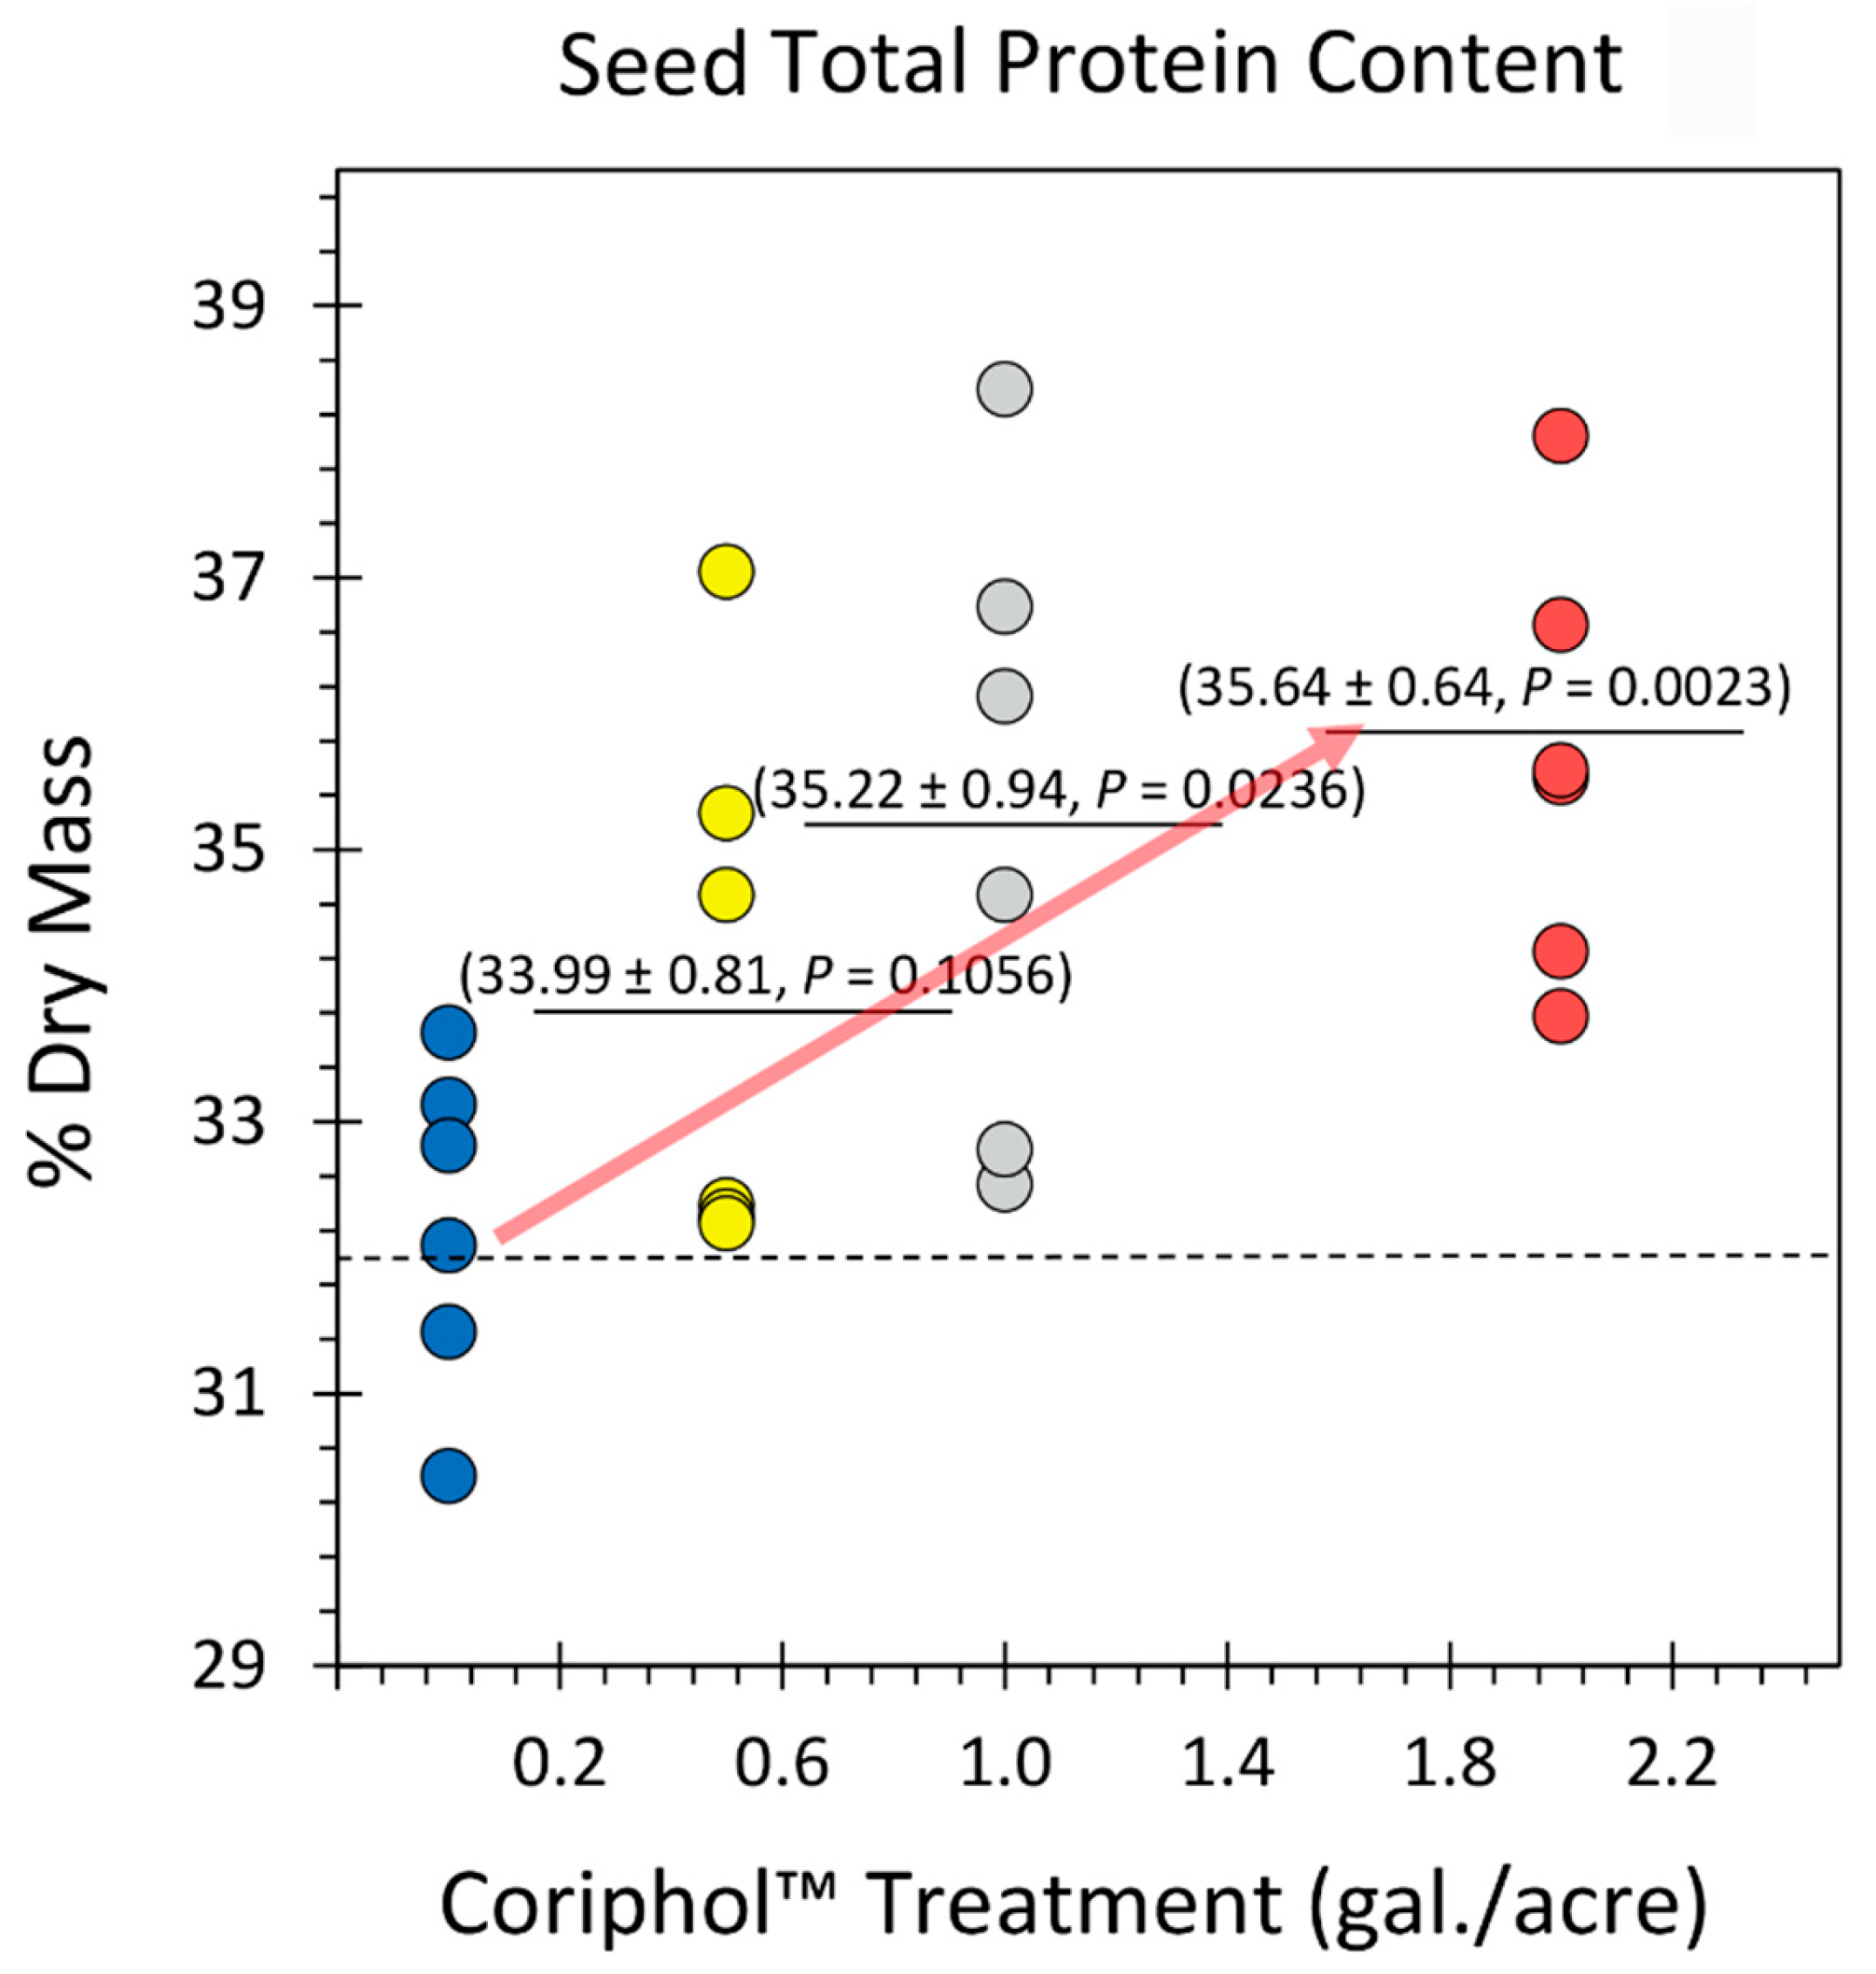
Figure 1. Effect of Coriphol™ treatment on total soybean seed protein content. All data points are shown in the figure as % dry mass. The dashed line reflects the mean protein content in untreated control plants. Solid bars reflect mean values for treated plants. Levels of significance are shown by the calculated P values where P < 0.05 was considered statistically significant.
Preprints 116459 g001
Figure 2. Effect of Coriphol™ treatment on soybean seed metal micronutrient content (presented in parts-per-million (ppm). Results for ten essential dietary micronutrients are presented including Na, Mg, K, Ca, Mn, Fe, Ni, Cu, Zn and Mo. All data points for each element analyzed are shown in the figure as separate panels. Dashed lines in each panel reflect the mean element value for untreated control plants. Solid bars reflect mean values for treated plants. Levels of significance are shown by the calculated P values where P < 0.05 was considered statistically significant.
Preprints 116459 g002
Figure 3. Changes in the ‘free’ iron oxidation state as a function of treatments with Coriphol™ were presented as Ratio Fe3+/Fe2+. All measurements were represented as individual data points. The dashed line reflects the mean value for untreated control plants while the solid horizontal bars reflect the mean values for treated plants. P-values <0.05 were considered statistically significant.
Preprints 116459 g003
Figure 4. Changes in the seed phytic acid (PA) content as a function of treatments with Coriphol™. All measurements were represented as individual data points. The dashed line reflects the mean value for untreated control plants while the solid horizontal bars reflect the mean values for treated plants. P-values <0.05 were considered statistically significant.
Preprints 116459 g004
Table 1. Effect of Coriphol™ Treatments on the Distribution of Soybean Seed ‘Free’ Amino Acids.
Amino Acid Control (N=4) 0.5 gal./acre (N=4) 1.0 gal/acre (N=4) 2.0 gal/acre (N=5)
Norm. Peak Areaa. %
Distribution
Norm.
Peak Areaa.
%
Distribution
Norm.
Peak Areaa.
% Distribution Norm.
Peak Areaa.
% Distribution
Asp 530±142 3.78±0.71 848±369 7.28±1.95 432±147 9.28±2.72 392±73 6.81±1.25
Glu 357±150 2.67±1.08 1178±169 11.86±2.35 283±46 6.28±0.96 312±73 5.21±0.75
GABA 346±72 2.72±0.44 207±59 2.28±0.72 136±32 3.15±0.84 139±36 2.32±0.48
Asn 2984±1011 22.16±5.60 936±181 9.39±2.11 295±97 6.63±2.23 515±106 8.51±1.02
Ser 1394±486 9.87±3.27 842±122 8.06±0.32 261±31 5.72±0.38 289±44 4.97±0.57
Gln 379±136 2.84±0.97 403±80 3.92±0.82 149±22 3.29±0.44 371±68 6.13±0.65
Thr 162±34 1.51±0.50 142±24 1.42±0.30 49±8 1.13±0.26 38±5 0.65±0.07
Gly 907±122 7.15±0.87 549±76 5.36±0.69 283±18 6.45±0.89 445±54 7.62±0.81
Cyc 342±46 2.81±0.57 229±39 2.16±0.07 85±25 1.82±0.45 142±26 2.35±0.18
Ala 2871±684 22.78±5.05 2766±790 25.16±3.81 1580±226 34.68±3.32 1684±361 27.69±4.04
Tyr 81±23 0.73±0.30 261±122 2.21±0.69 59±9 1.34±0.25 95±14 1.74±0.43
Val 114±267 16.95±2.42 877±276 9.12±3.11 218±32 4.80±0.49 469±111 7.93±1.62
Met 452±139 3.20±0.90 158±29 1.62±0.26 172±19 3.80±0.29 272±36 4.69±0.53
Trp 98±23 0.86±0.30 148±37 1.54±0.50 72±7 1.64±0.28 67±9 1.18±0.18
Phe 189±45 1.71±0.63 135±28 1.37±0.37 80±9 1.84±0.35 82±10 1.42±0.17
Lys 13±3 0.09±0.01 94±21 0.97±0.30 53±13 1.22±0.32 85±17 1.49±0.34
iLeu 81±10 0.72±0.19 120±33 1.08±0.12 39±13 0.83±0.24 45±12 0.84±0.24
Leu 365±147 2.65±1.05 379±33 5.45±2.13 299±30 6.76±0.98 496±83 8.45±1.05
Total 13666±1976 100.00 10270±170 100.00 4544±314 100.00 5937±756 100.00
Chromatographic peak areas were normalized to a fixed 6 mg of sample tissue mass.
Table 2. Effect of Coriphol™ Treatment on Soybean Total Fatty Acid Content and Distribution of Major Fatty Acids.
Treatment
Type
FA Content
(% Dry Mass)
FA Measured
Distribution
(%)
P-Value Literature
Range (%)
Measured
% Sat. FA
P-Value Literature
Range
(%)
Measured Ratio
Poly-to-Mono UnSat. FA
P-Value
Control
(N=6)
21.61 ± 0.70 PA 15.61 ± 2.03 - 10-15 19.96 ± 1.96 - 12-22 2.39 ± 0.45 -
SA 4.34 ± 0.28 - 2-7
OA 25.72 ± 3.26 - 13-26
LA 44.82 ± 5.33 - 40-64
α-LA 9.51 ± 1.37 - 4-13
0.5 gal./acre
(N=6)
20.41 ± 1.28 PA 12.59 ± 0.64 0.2054 - 15.36 ± 1.04 0.0703 - 3.09 ± 0.20 0.1953
SA 2.77 ± 0.38 0.0083 -
OA 20.27 ± 0.47 0.1587 -
LA 57.98 ± 1.25 0.0530 -
α-LA 6.40 ± 0.64 0.0789 -
1.0 gal./acre
(N=6)
20.71 ± 1.40 PA 8.86 ± 0.55 0.0184 - 10.96 ± 1.22 0.0040 - 1.03 ± 0.32 0.0309
SA 2.10 ± 0.39 0.0012 -
OA 45.85 ± 4.24 0.0044 -
LA 34.39 ± 4.58 0.1689 -
α-LA 8.14 ± 0.92 0.4274 -
2.0 gal./acre
(N=6)
20.26 ± 1.21 PA 11.36 ± 0.64 0.0924 - 13.33 ± 0.74 0.0194 - 0.54 ± 0.10 0.0104
SA 2.19 ± 0.21 0.0002 -
OA 57.31 ± 3.69 0.0001 -
LA 21.54 ± 3.51 0.0054 -
α-LA 7.61 ± 0.85 0.2723 -
FA: fatty acid, PA: palmitic acid (C16:0), SA: stearic acid (C18:0), OA: oleic acid (C18:1), LA: linoleic acid (C18:2), α-LA: α-linolenic acid (C18:3).
Disclaimer/Publisher’s Note: The statements, opinions and data contained in all publications are solely those of the individual author(s) and contributor(s) and not of MDPI and/or the editor(s). MDPI and/or the editor(s) disclaim responsibility for any injury to people or property resulting from any ideas, methods, instructions or products referred to in the content.
Copyright: This open access article is published under a Creative Commons CC BY 4.0 license, which permit the free download, distribution, and reuse, provided that the author and preprint are cited in any reuse.
Prerpints.org logo

Preprints.org is a free preprint server supported by MDPI in Basel, Switzerland.

Subscribe

© 2024 MDPI (Basel, Switzerland) unless otherwise stated