Submitted:
27 August 2024
Posted:
28 August 2024
You are already at the latest version
Abstract
Keywords:
1. Introduction
2. Preliminaries
2.1. Noisebergs – A Brief Review
-
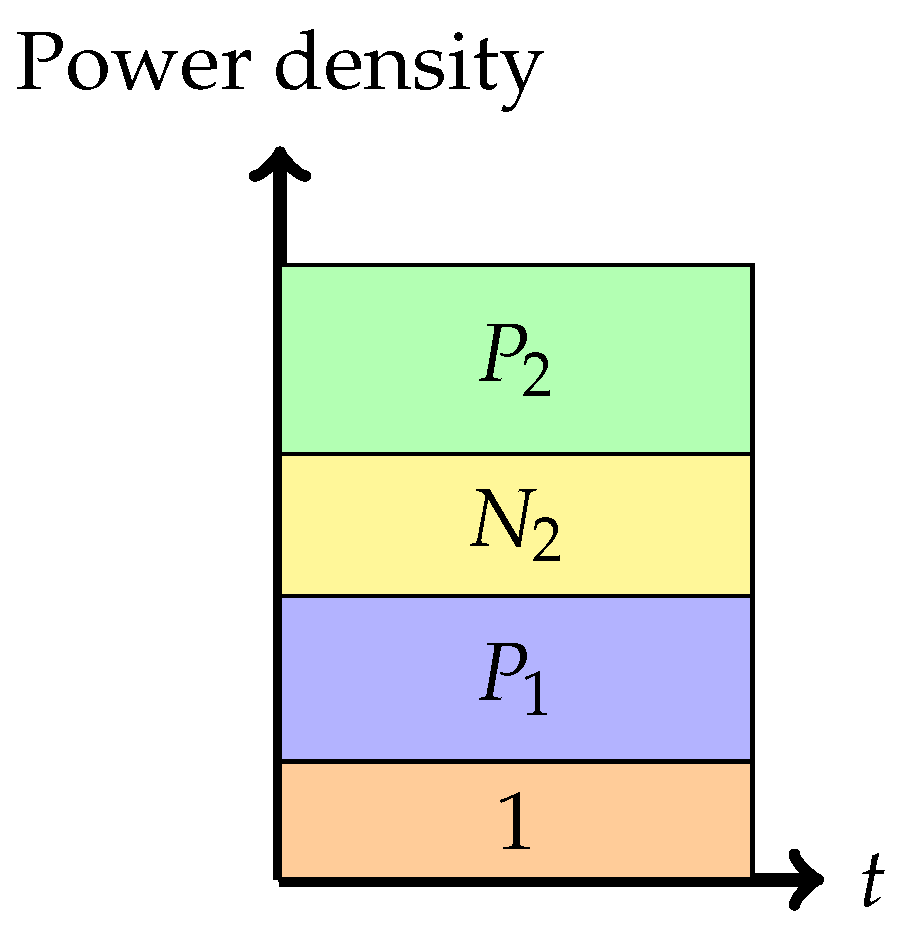
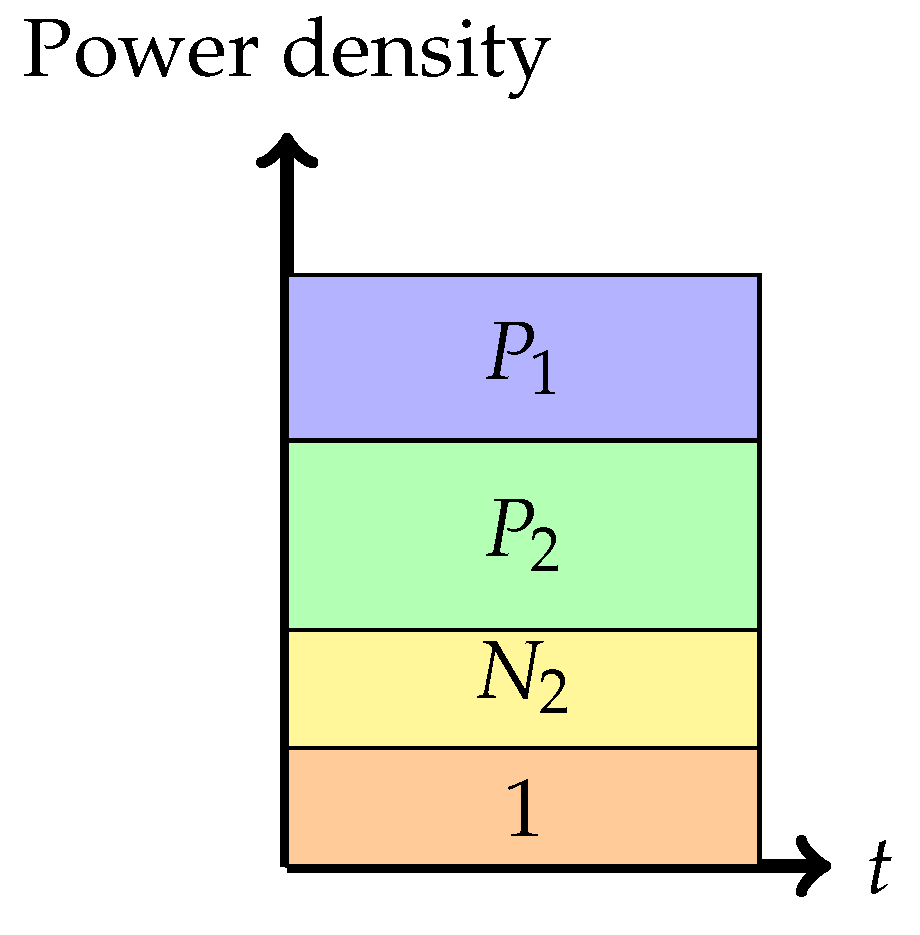
Phase 1: Treating interference to be noise at the weaker receiver (Sato’s corner point)In this phase, the weaker receiver, , decodes its message by treating as noise. This is depicted pictorially in Figure 4. The decoding order in the picture is assumed to go from top to bottom. Any receiver will decode all the messages on top of its message (including its message) in any band by treating those below it as noise. The rate pair achieved in this phase is
-
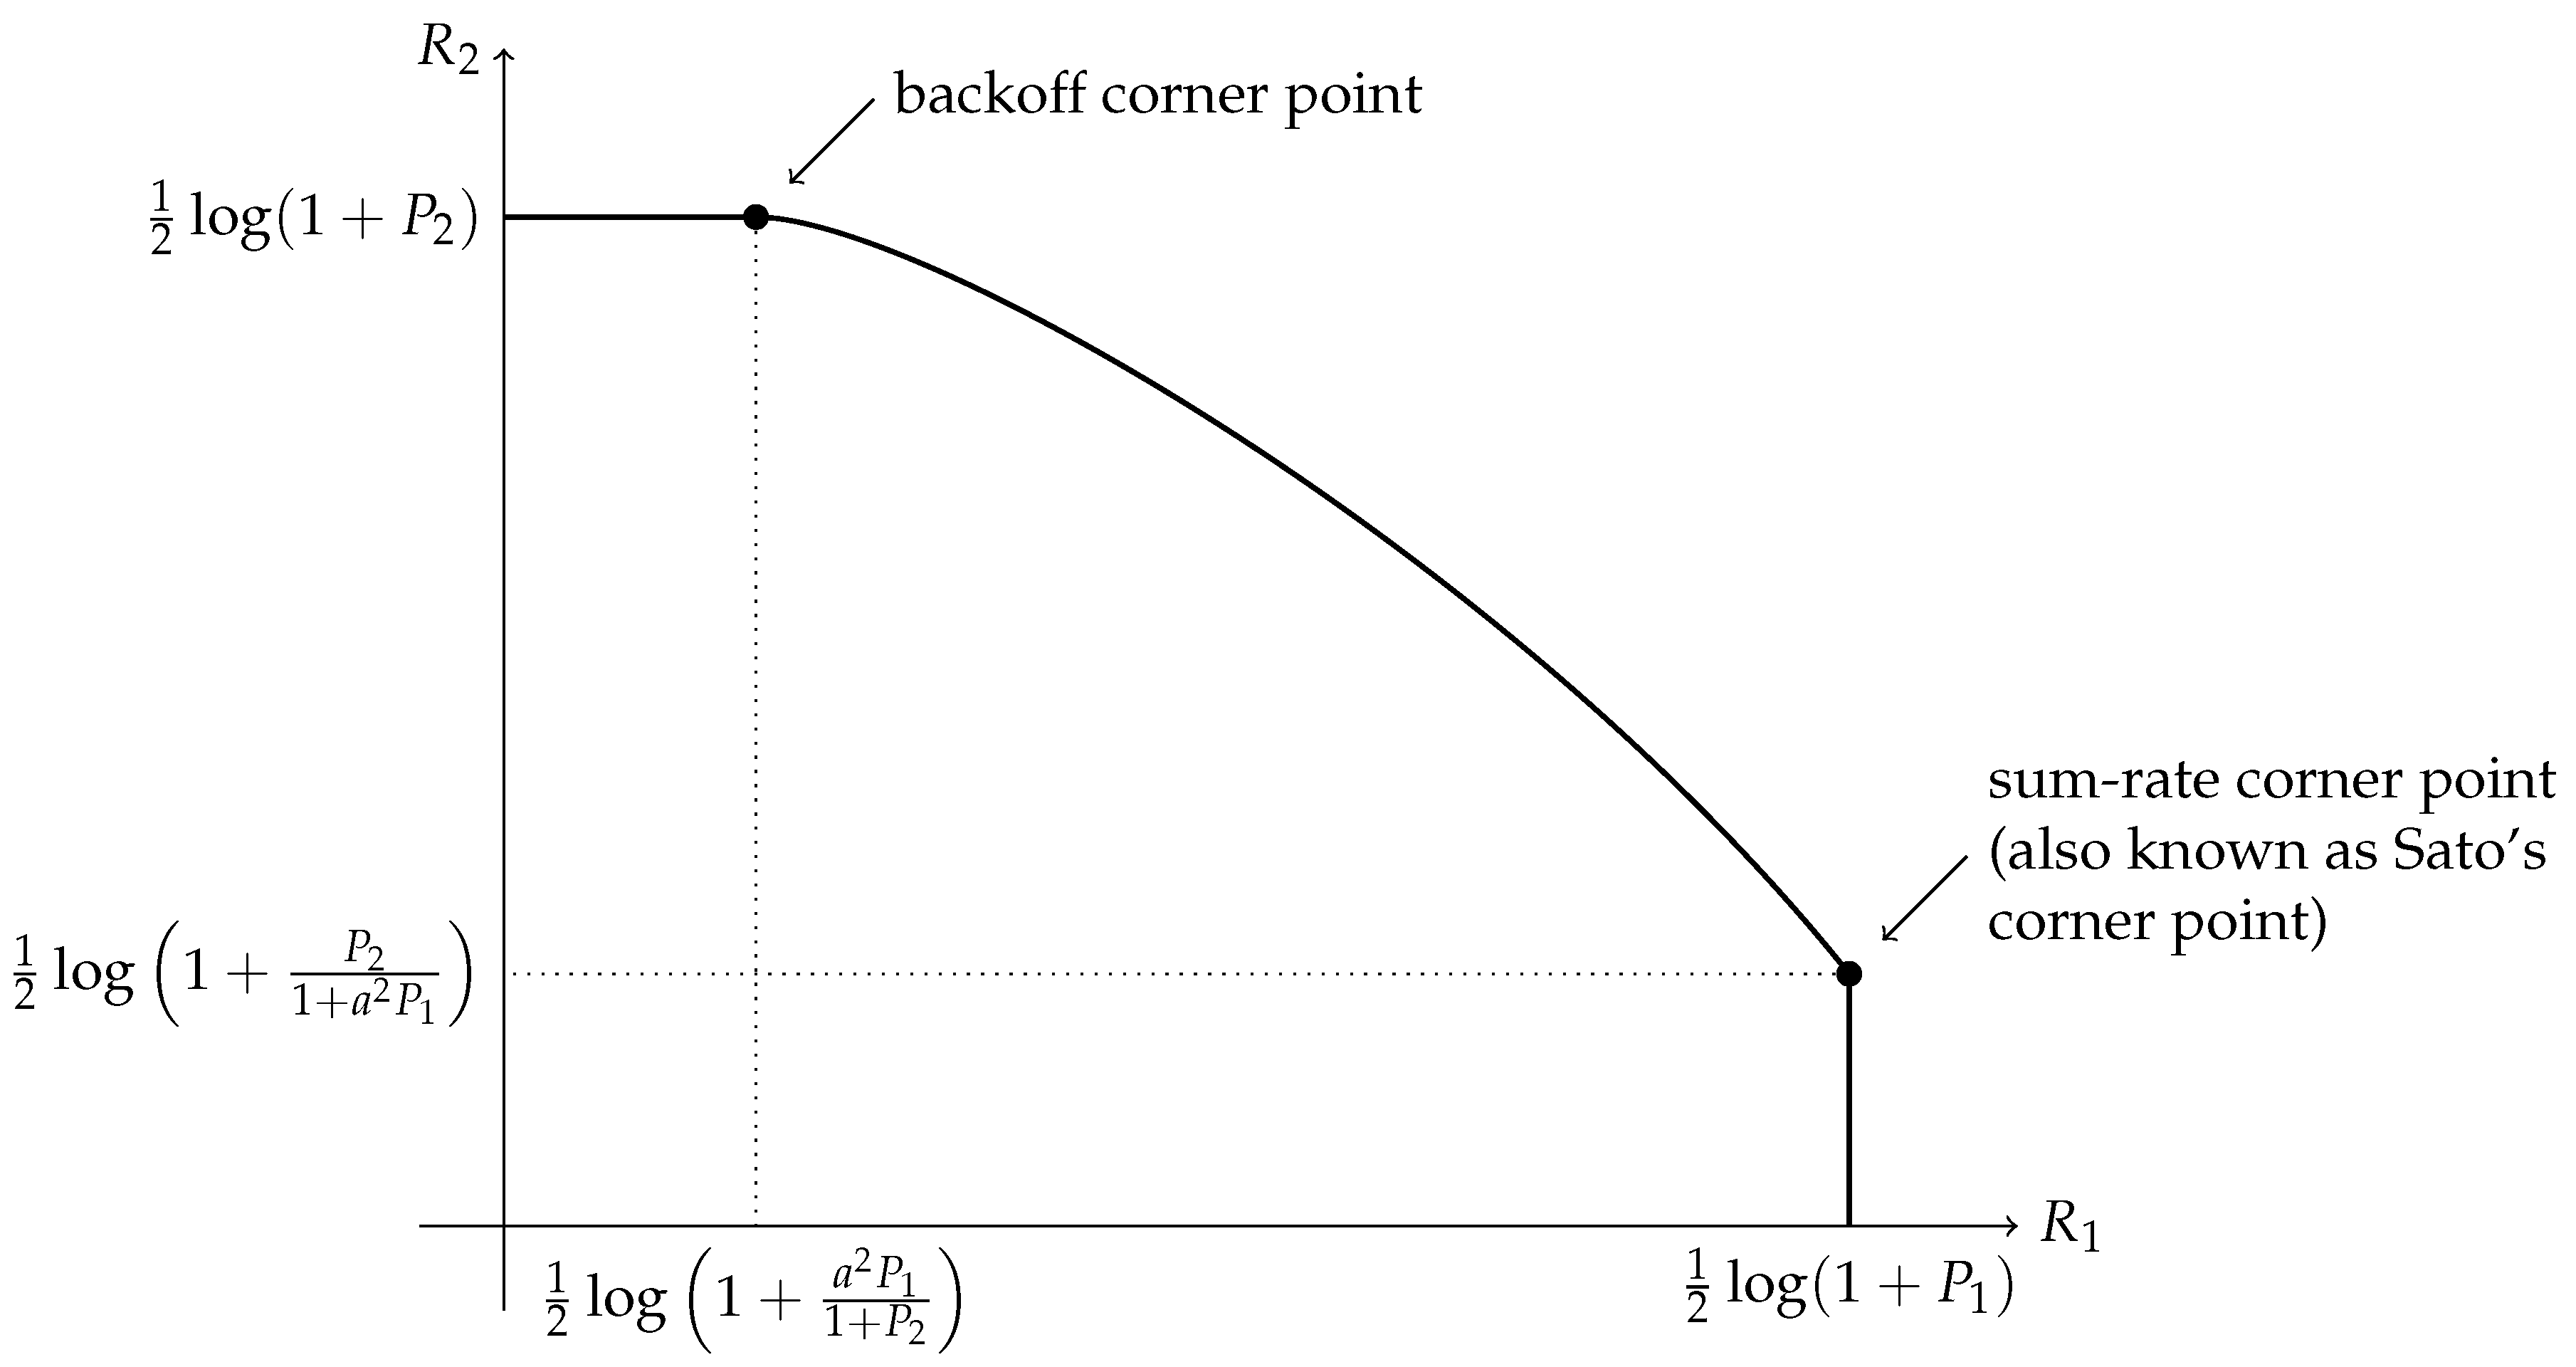
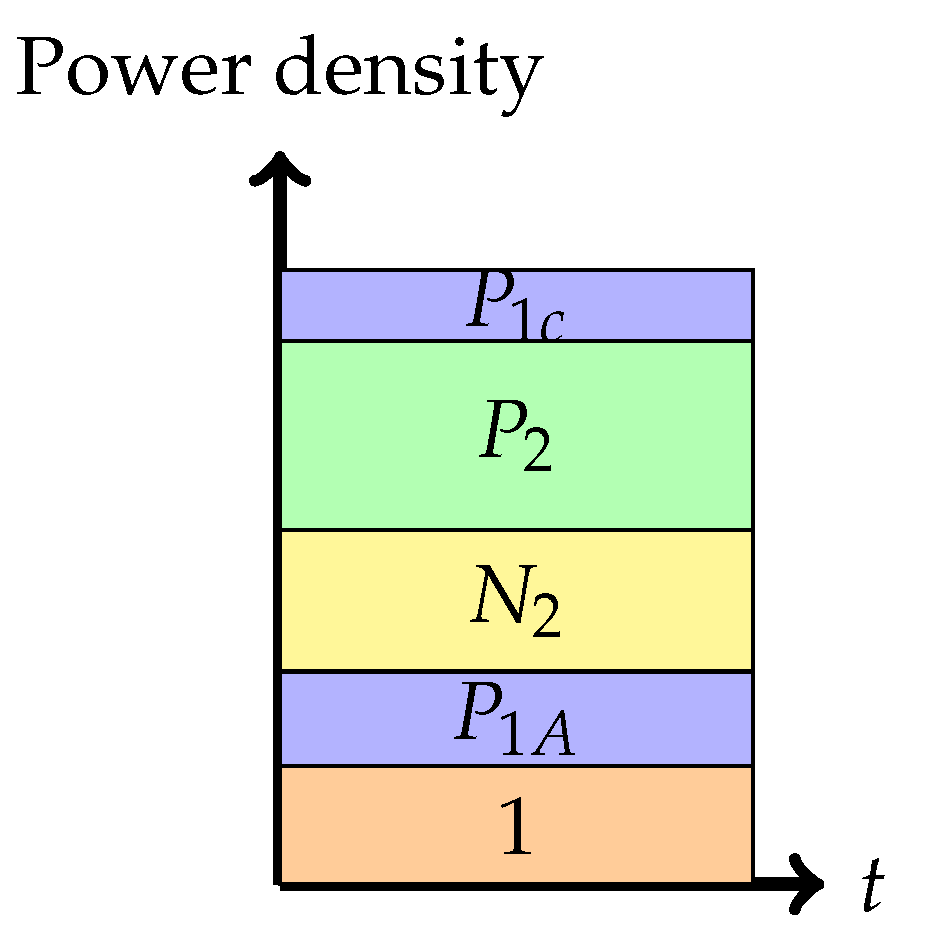
Phase 2: Partial interference cancellation at the weaker receiver (or pure superposition coding)In this phase, the weaker receiver, , decodes a part of first, subtracts this from the received signal, and then decodes its own signal . This is a mix of Phase 1 and Phase 3.The rate pair achieved in this phase isNote that .
-
Phase 3: Interference cancellation at the weaker receiver (the backoff corner point)In this phase, the weaker receiver, , decodes first and then subtracts this from the received signal, and then decodes its own signal . The rate pair achieved in this phase isNote that the rate for message 1 is solely determined by the ability of the weaker decoder to decode it.
-
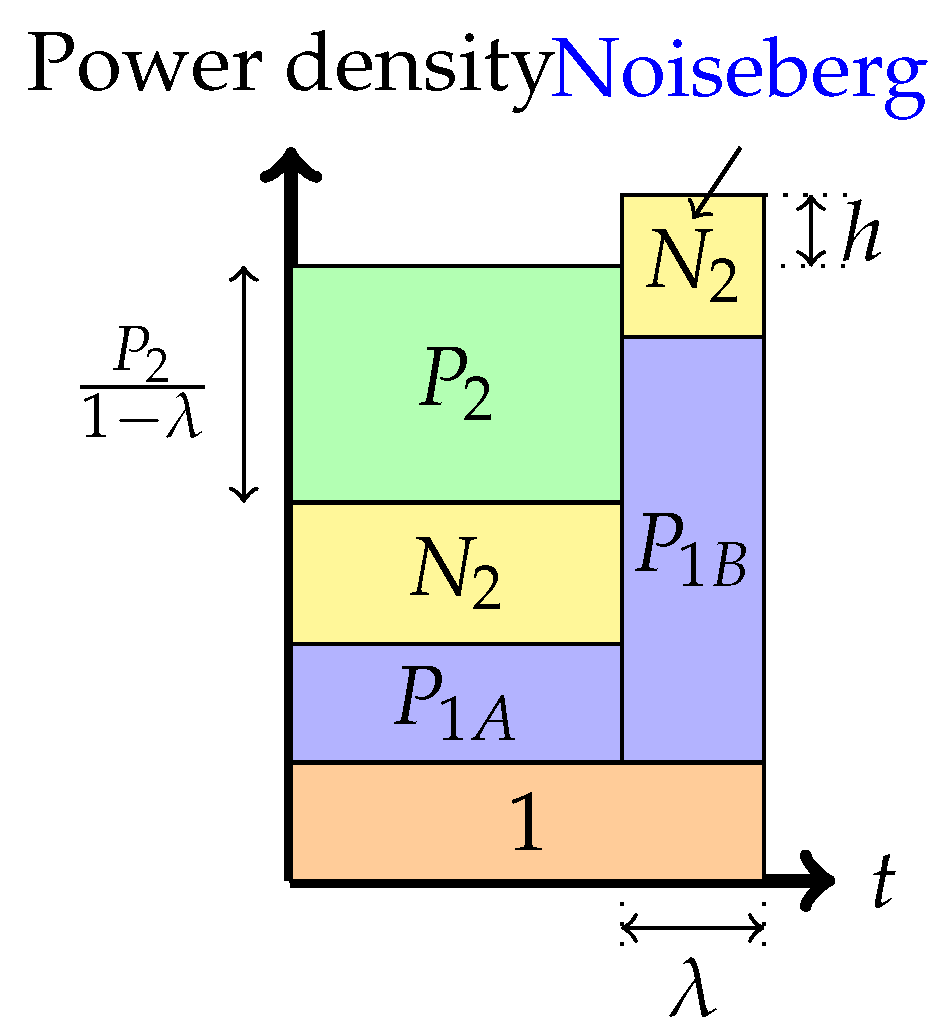
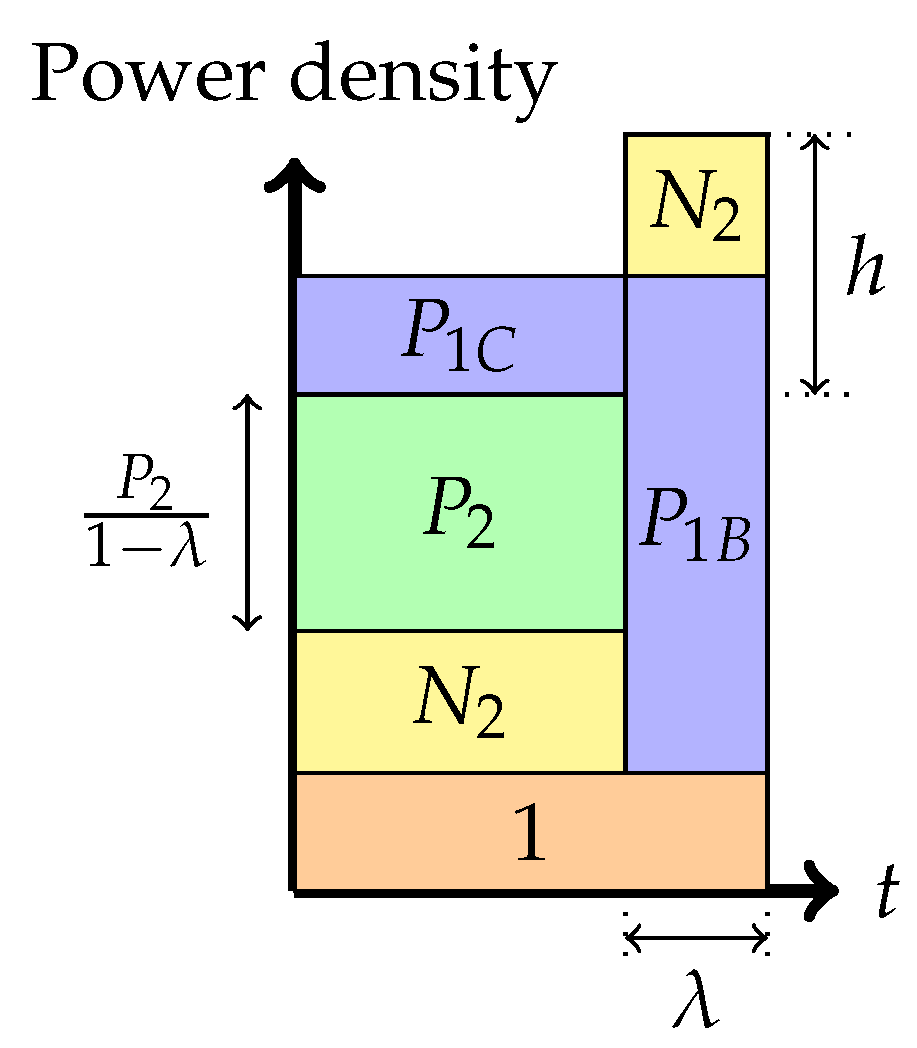
Phase 4: Time-sharing between the following two strategies: Treating interference to be noise at the weaker receiver and transmitting solely to the stronger receiver (or multiplex strategy)In this phase, there is a time-sharing between two communication schemes. The first scheme, employed for fraction of the time, employs the Phase 1 strategy, and the second scheme consists of transmission only to the stronger receiver. The total average power in each band is indicated in the figure. Therefore, one needs to divide the power by the band duration to get the height. It is this phase that led to the noiseberg nomenclature. We denote by h, the height difference between the slab in the second band and the power level of in the first band. This height difference comes from part of the noise spectrum of that floats above the signal level in the first band and characterizes what we call a noise-iceberg, or noiseberg. The flotation of the noise slab releases prime-rate space in the power × bandwidth plane, in a fashion that Archimedes would be sure to appreciate. In this phase, we get the following:The rate pairs achieved in this scheme are
-
Phase 5: Time-sharing between the following two strategies: Partial interference cancellation at the weaker receiver and transmitting solely to the stronger receiver (or overflow strategy)In this phase, as before, there is a time-sharing between two communication schemes. The first scheme, employed for fraction of the time, employs the Phase 2 strategy, and the second scheme consists of transmission only to the stronger receiver. The total average power in each band is indicated in the figure. We denote by h, the height difference between the top of the slab in the second band and the power level of in the first band. Again, as argued in [6,8], the total heights of the two bands must agree via a water-filling argument. In this phase, we get the following:
-
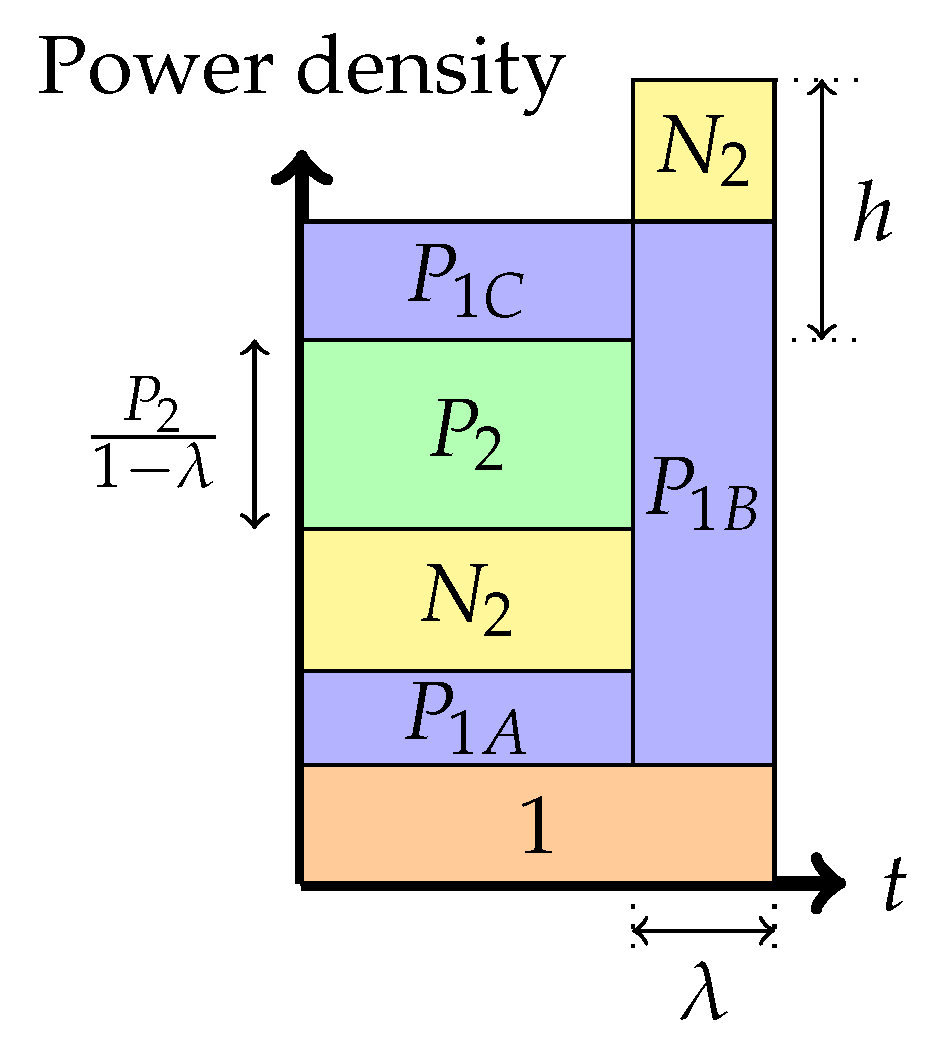
Phase 6: Time-sharing between the following two strategies: Interference cancellation at the weaker receiver and transmitting solely to the stronger receiver (boundary of the admissible region)In this phase, there is also a time-sharing between two communication schemes. The first scheme, employed for fraction of the time, employs the Phase 3 strategy, and the second scheme consists of transmission only to the stronger receiver. The total average power in each band is indicated in the figure. We denote by h, the height difference between the top of the slab in the second band and the power level of in the first band. As argued in [6,8], the total heights of the two bands must agree via a water-filling argument. In this phase, we get the following:
2.2. The Gaussian signaling region
2.2.1. Slopes at the corner points
2.2.2. The intermediate regime,
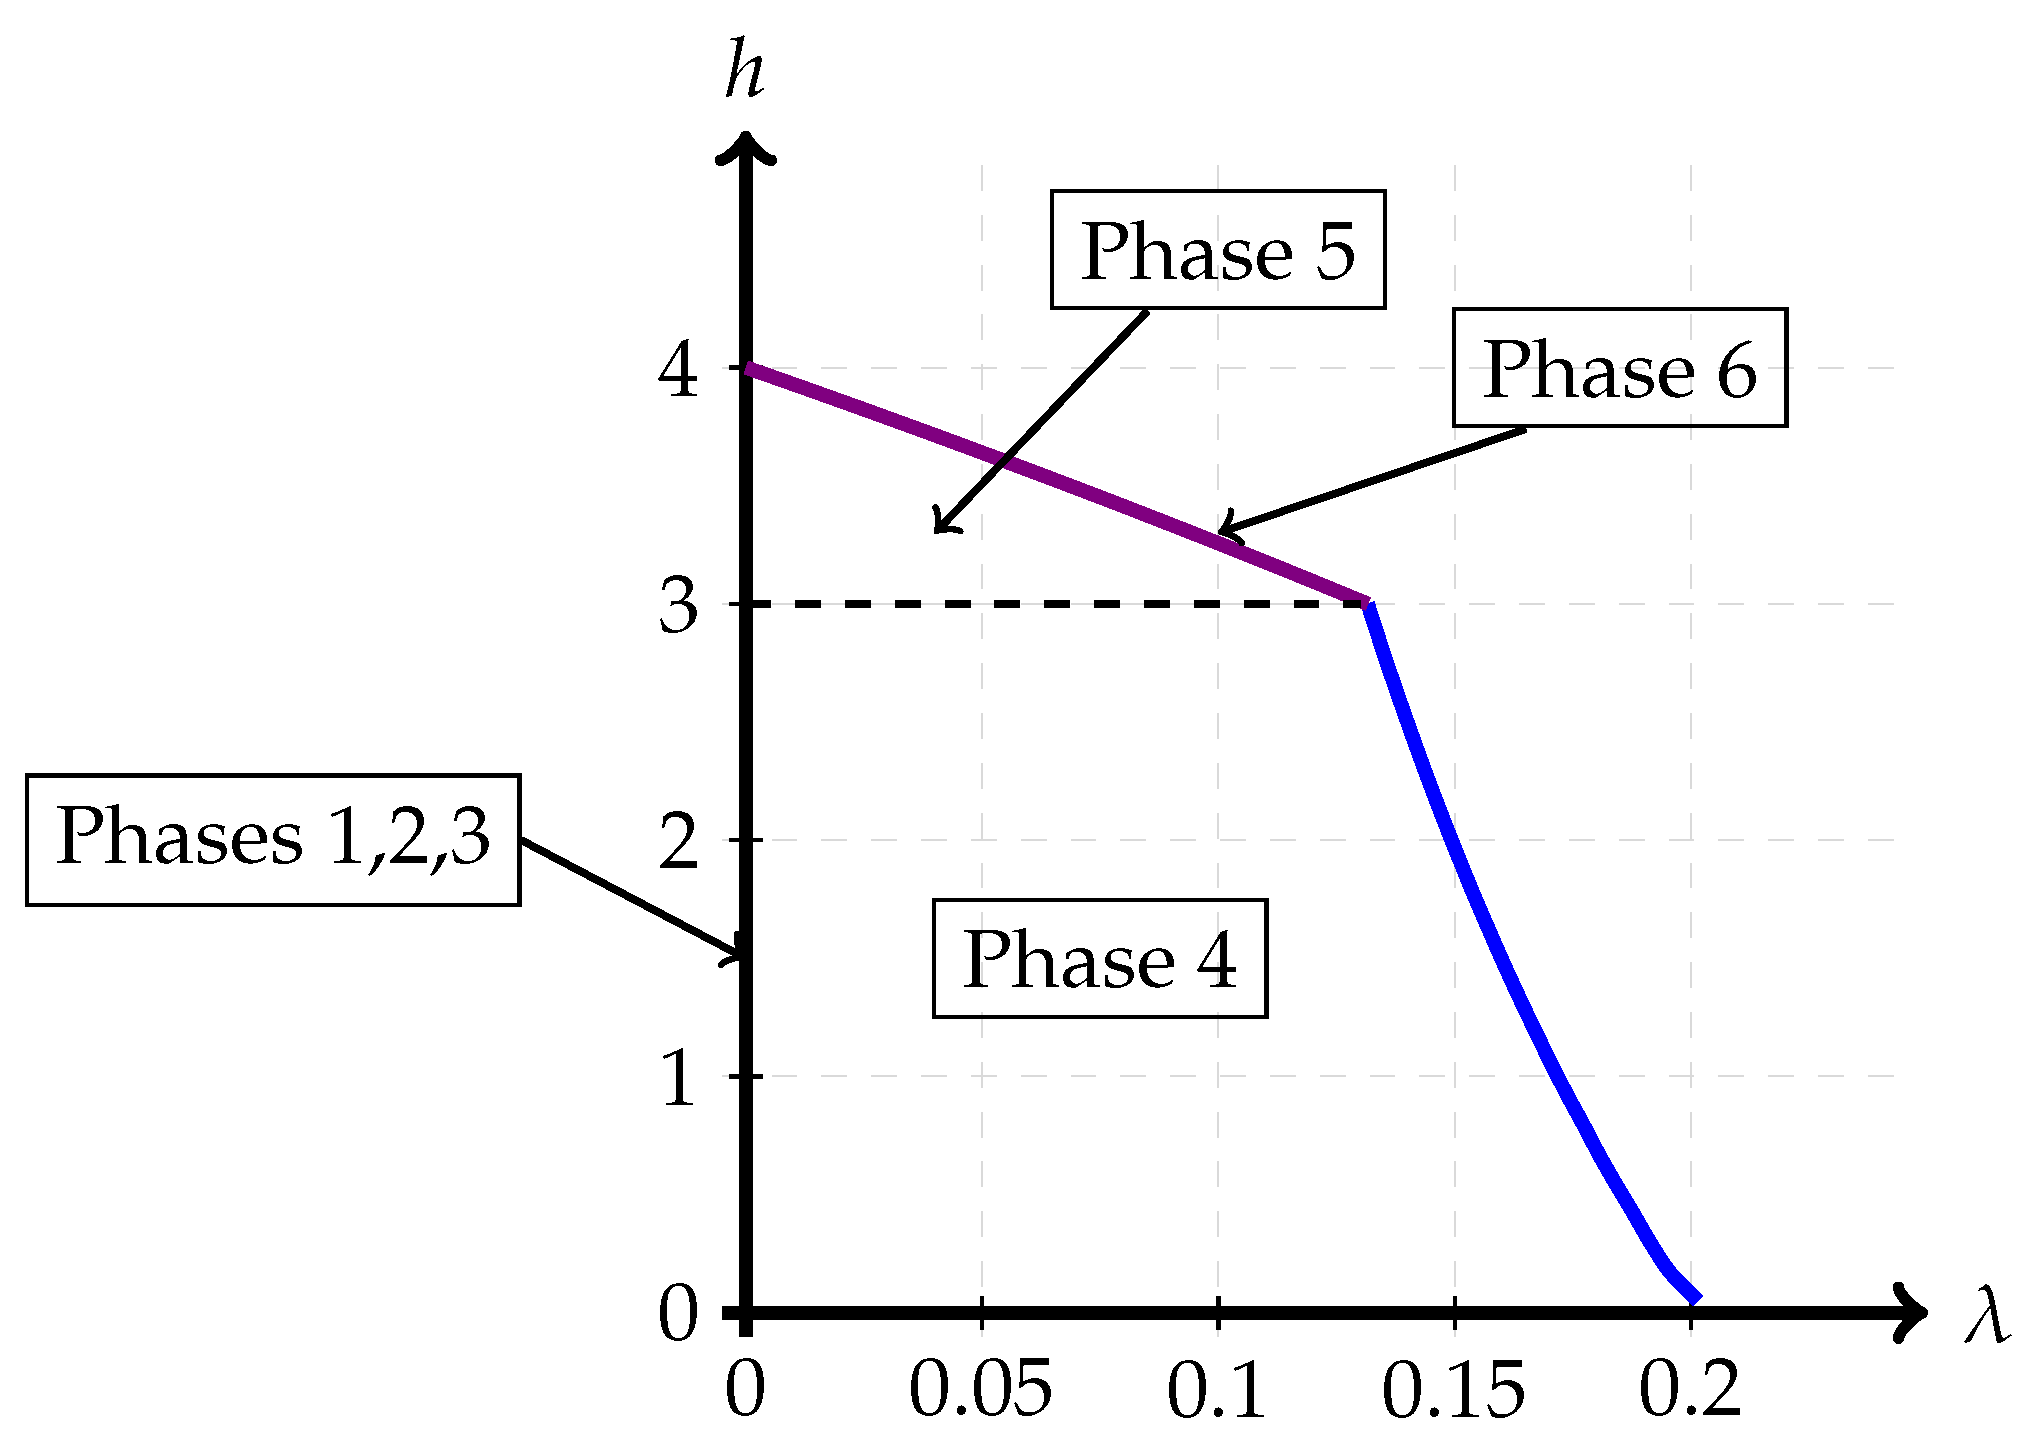
- Path 1: For some set of parameters (for example , with ) it appears that the optimal path is Phase 1 → Phase 2 → Phase 3. (This is the path of pure superposition evolution) and the locations of the phase transitions are and respectively. This implies that the trajectory in the admissible region is only along the h-axis, i.e., with .
-
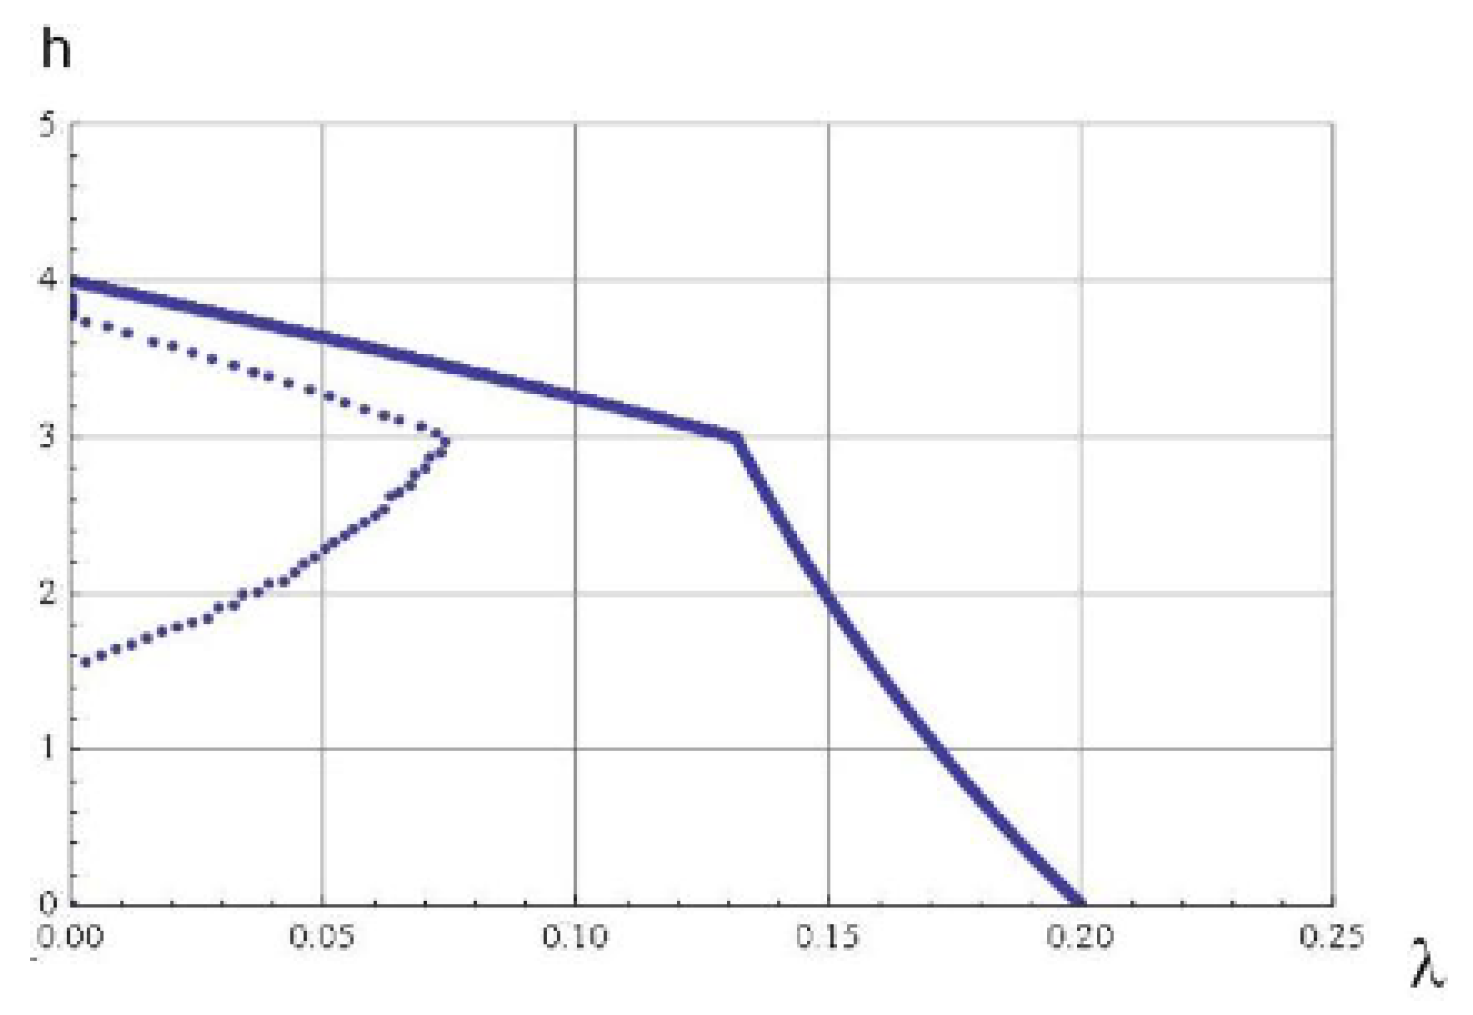
Path 2: For some set of parameters (for example , with ) the optimal path seems to be Phase 1 → Phase 4 → Phase 5 → Phase 2 → Phase 3. This path is depicted in Figure 11.As the figure illustrates, it leaves Phase 1 (Sato point) and moves into Phase 4. Then at , it moves from Phase 4 to Phase 5. Then, at , it moves from Phase 5 to Phase 2. Finally at , the trajectory reaches the other corner point.
-
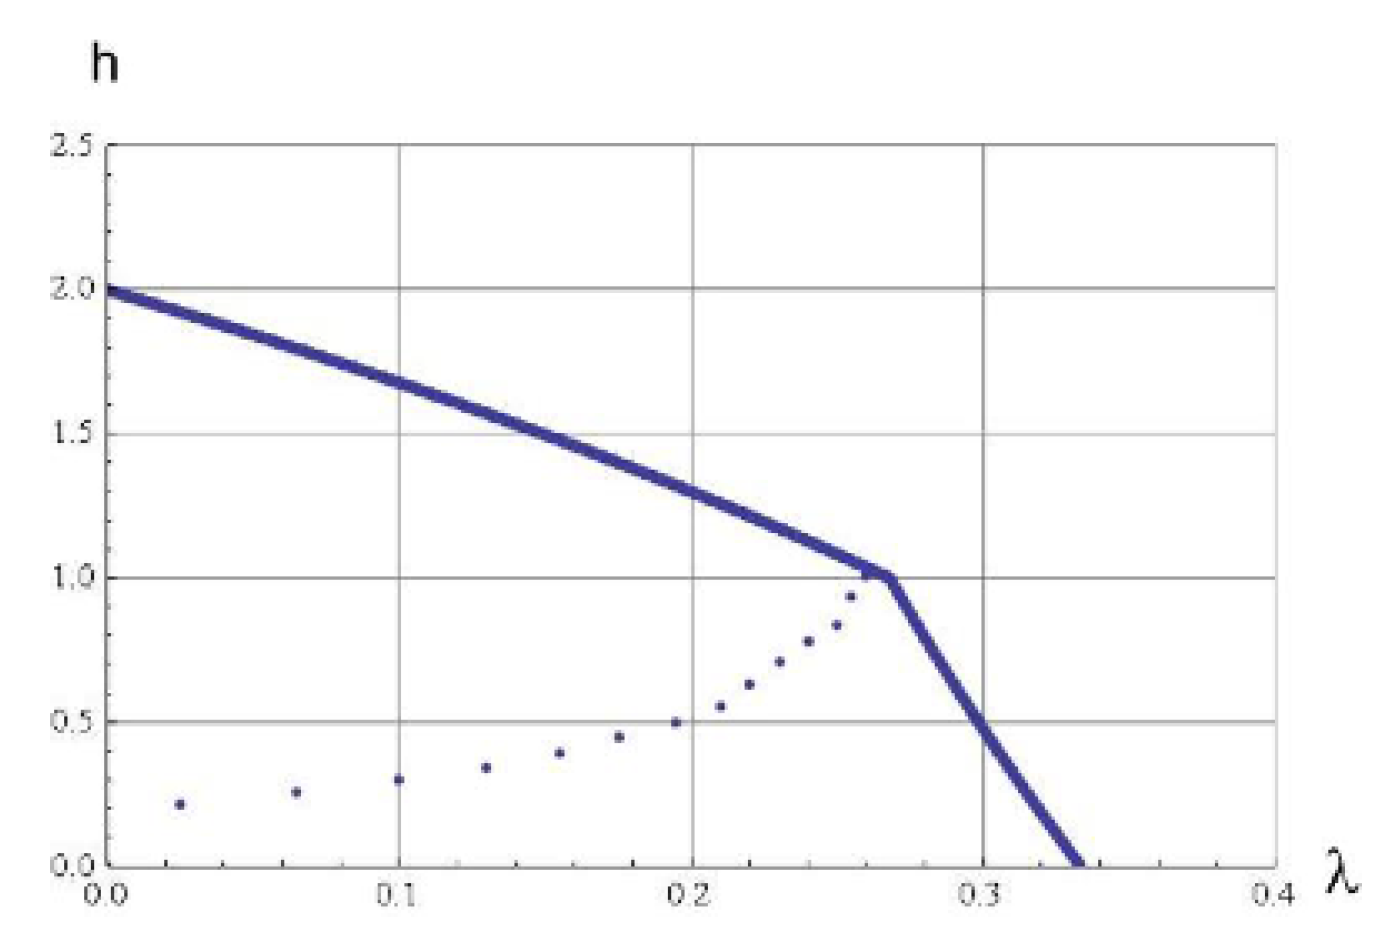
Path 3: For some set of parameters (for example , with ) the optimal path seems to be Phase 1 → Phase 4 → Phase 5 → Phase 6 → Phase 3. This path is depicted in Figure 12.As the figure illustrates, it leaves Phase 1 (Sato point) and moves into Phase 4. Then at , it moves from Phase 4 to Phase 5. Almost immediately, it enters into Phase 6 and remains there till it reaches the new corner point at Phase 3.
- : This corresponds to the at which is maximized when and . This corresponds to the transition between the multiplex and overflow regions (please see Section 2.4).
- : This corresponds to the at which is maximized when and . This corresponds to the transition from the overflow region to a pure superposition coding region.
- : This corresponds to the at which is maximized when and This corresponds to the transition from the interior of the admissible admissible region to the boundary of this region.
2.3. To Mux or Not to Mux
2.3.1. Multiplexing × Pure superposition
2.4. The Multiplex-Overflow Region Interface
2.5. The Overflow-Superposition Interface
3. Conclusions
4. Acknowledgement
References
- R. Ahlswede. The capacity region of a channel with two senders and two receivers. The Annals of Probability, 2(5):805 – 814, 1974. [CrossRef]
- V. Sreekanth Annapureddy and Venugopal V. Veeravalli. Gaussian interference networks: sum capacity in the low-interference regime and new outer bounds on the capacity region. IEEE Transactions on Information Theory, 55(7):3032–3050, 2009. [CrossRef]
- A. Carleial. A case where interference does not reduce capacity (corresp.). IEEE Transactions on Information Theory, 21(5):569–570, 1975. [CrossRef]
- A. Carleial. Interference channels. IEEE Transactions on Information Theory, 24(1):60–70, 1978. [CrossRef]
- Max H. m. Costa. On the Gaussian interference channel. IEEE Transactions on Information Theory, 31(5):607–615, 1985. [CrossRef]
- Max H. M. Costa. Noisebergs in Z Gaussian interference channels. In Proc. Information Theory and Applications Workshop (ITA), pages 1–6, 2011.
- Max H. M. Costa. A third critical point in the achievable region of the z-Gaussian interference channel. In Information Theory and Applications Workshop (ITA), 2014.
- Max H. M. Costa, Amin Gohari, Chandra Nair, and David Ng. A proof of the noiseberg conjecture for the Gaussian z-interference channel. In 2023 IEEE International Symposium on Information Theory (ISIT), pages 1824–1829, 2023.
- Max H. M. Costa and Chandra Nair. On the achievable rate sum for symmetric Gaussian interference channels. In Proc. Information Theory and Applications Workshop (ITA), 2012.
- Max H. M. Costa and Chandra Nair. Phase transitions in the achievable sum-rate of symmetric Gaussian interference channels. In Proc. Inf. Theory Appl. Workshop, pages 10–15, 2013.
- Max H. M. Costa and Chandra Nair. Gaussian Z-interference channel: around the corner. In Proc. Information Theory and Applications Workshop (ITA), pages 1–6, 2016.
- Max H. M. Costa, Chandra Nair, and David Ng. On the Gaussian Z-interference channel. In Proc. Information Theory and Applications Workshop (ITA), pages 1–15, 2017.
- Max H. M. Costa, Chandra Nair, David Ng, and Yan Nan Wang. On the structure of certain non-convex functionals and the Gaussian Z-interference channel. In Proc. IEEE International Symposium on Information Theory (ISIT), pages 1522–1527, 2020.
- Raul H. Etkin, David N. C. Tse, and Hua Wang. Gaussian interference channel capacity to within one bit. IEEE Transactions on Information Theory, 54(12):5534–5562, 2008. [CrossRef]
- Amin Gohari and Chandra Nair. Outer bounds for multiuser settings: the auxiliary receiver approach. IEEE Transactions on Information Theory, 68(2):701–736, 2022. [CrossRef]
- Amin Gohari, Chandra Nair, and David Ng. An information inequality motivated by the Gaussian Z-interference channel. In Proc. IEEE International Symposium on Information Theory (ISIT), 2021.
- Amin Gohari, Chandra Nair, and Jinpei Zhao. On the capacity region of some classes of interference channels. In 2024 IEEE International Symposium on Information Theory (ISIT), pages 3136–3141, 2024.
- Te Sun Han and Kingo Kobayashi. A new achievable rate region for the interference channel. IEEE Transactions on Information Theory, 27(1):49–60, 1981. [CrossRef]
- G. Kramer. Outer bounds on the capacity of gaussian interference channels. IEEE Transactions on Information Theory, 50(3):581–586, 2004. [CrossRef]
- G. Kramer. Review of rate regions for interference channels. In 2006 International Zurich Seminar on Communications, pages 162–165, 2006.
- Omar Mehanna, John Marcos, and Nihar Jindal. On achievable rates of the two-user symmetric gaussian interference channel. In 2010 48th Annual Allerton Conference on Communication, Control, and Computing (Allerton), pages 1273–1279, 2010.
- Abolfazl Seyed Motahari and Amir Keyvan Khandani. Capacity bounds for the Gaussian interference channel. IEEE Transactions on Information Theory, 55(2):620–643, 2009. [CrossRef]
- Yury Polyanskiy and Yihong Wu. Wasserstein continuity of entropy and outer bounds for interference channels. CoRR, abs/1504.04419, 2015. [CrossRef]
- I. Sason. On achievable rate regions for the Gaussian interference channel. IEEE Transactions on Information Theory, 50(6):1345–1356, 2004. [CrossRef]
- H. Sato. Two-user communication channels. IEEE Transactions on Information Theory, 23(3):295–304, 1977. [CrossRef]
- H. Sato. On degraded gaussian two-user channels (corresp.). IEEE Transactions on Information Theory, 24(5):637–640, 1978. [CrossRef]
- H. Sato. The capacity of the Gaussian interference channel under strong interference (corresp.). IEEE Transactions on Information Theory, 27(6):786–788, 1981. [CrossRef]
- Xiaohu Shang, Gerhard Kramer, and Biao Chen. A new outer bound and the noisy-interference sum-rate capacity for Gaussian interference channels. IEEE Transactions on Information Theory, 55(2):689–699, 2009. [CrossRef]
| 1 | Note that for will also pass through the same corner point, as this corresponds to the maximum value of . |
| 2 | At this corner point takes it maximum value. |
Disclaimer/Publisher’s Note: The statements, opinions and data contained in all publications are solely those of the individual author(s) and contributor(s) and not of MDPI and/or the editor(s). MDPI and/or the editor(s) disclaim responsibility for any injury to people or property resulting from any ideas, methods, instructions or products referred to in the content. |
© 2024 by the authors. Licensee MDPI, Basel, Switzerland. This article is an open access article distributed under the terms and conditions of the Creative Commons Attribution (CC BY) license (http://creativecommons.org/licenses/by/4.0/).


