Submitted:
27 August 2024
Posted:
28 August 2024
You are already at the latest version
Abstract
Keywords:
1. Introduction
2. Related Work on Artificial Embryogeny
3. Materials and Methods
3.1. In-Silico Evolutionary System for Bioelectrically-Regulating Morphological Behavior
3.1.1. Organisms
3.1.2. Cells
3.1.3. Development and Fitness
3.1.4. Evolution and Genetic Algorithm
3.1.5. Bioelectric Patterns
3.1.6. Parameters and Code Access
3.2. Material and Method for the Planaria SSRI Experiment
4. Simulation Results for the 3 Types of Bioelectric Patterns to Reach a Target Morphology: Direct, Indirect, and the Binary Trigger
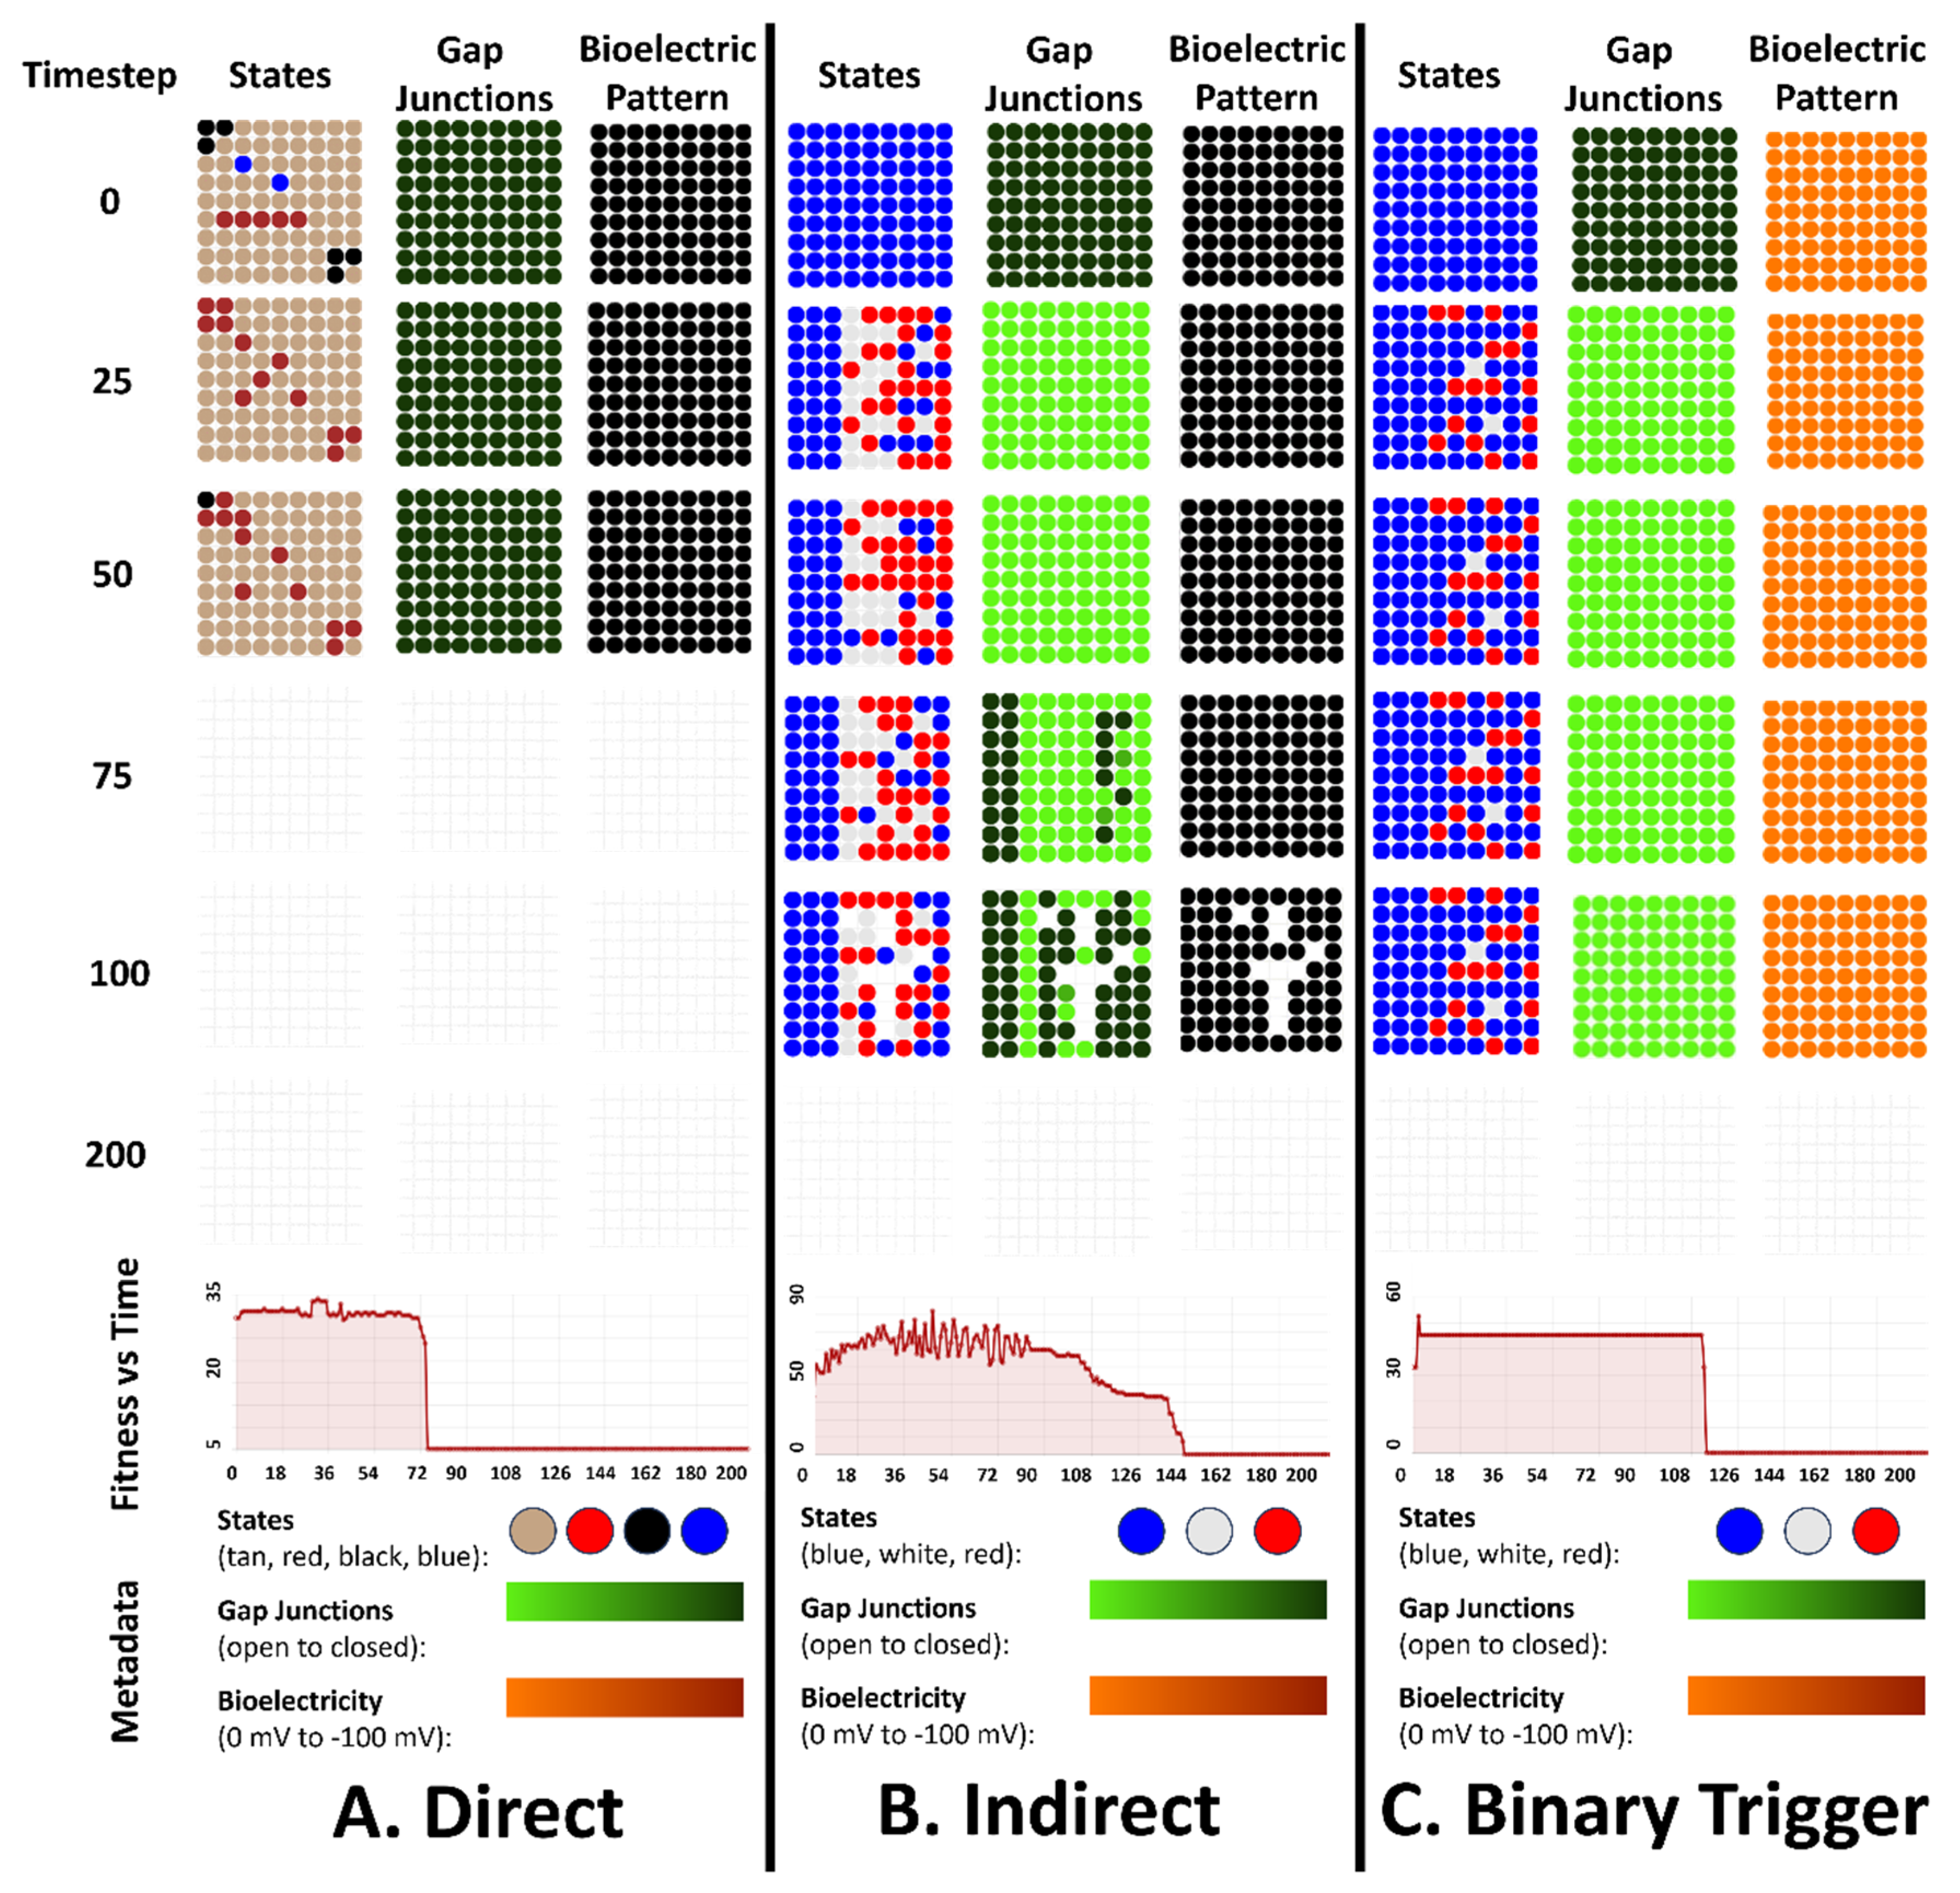
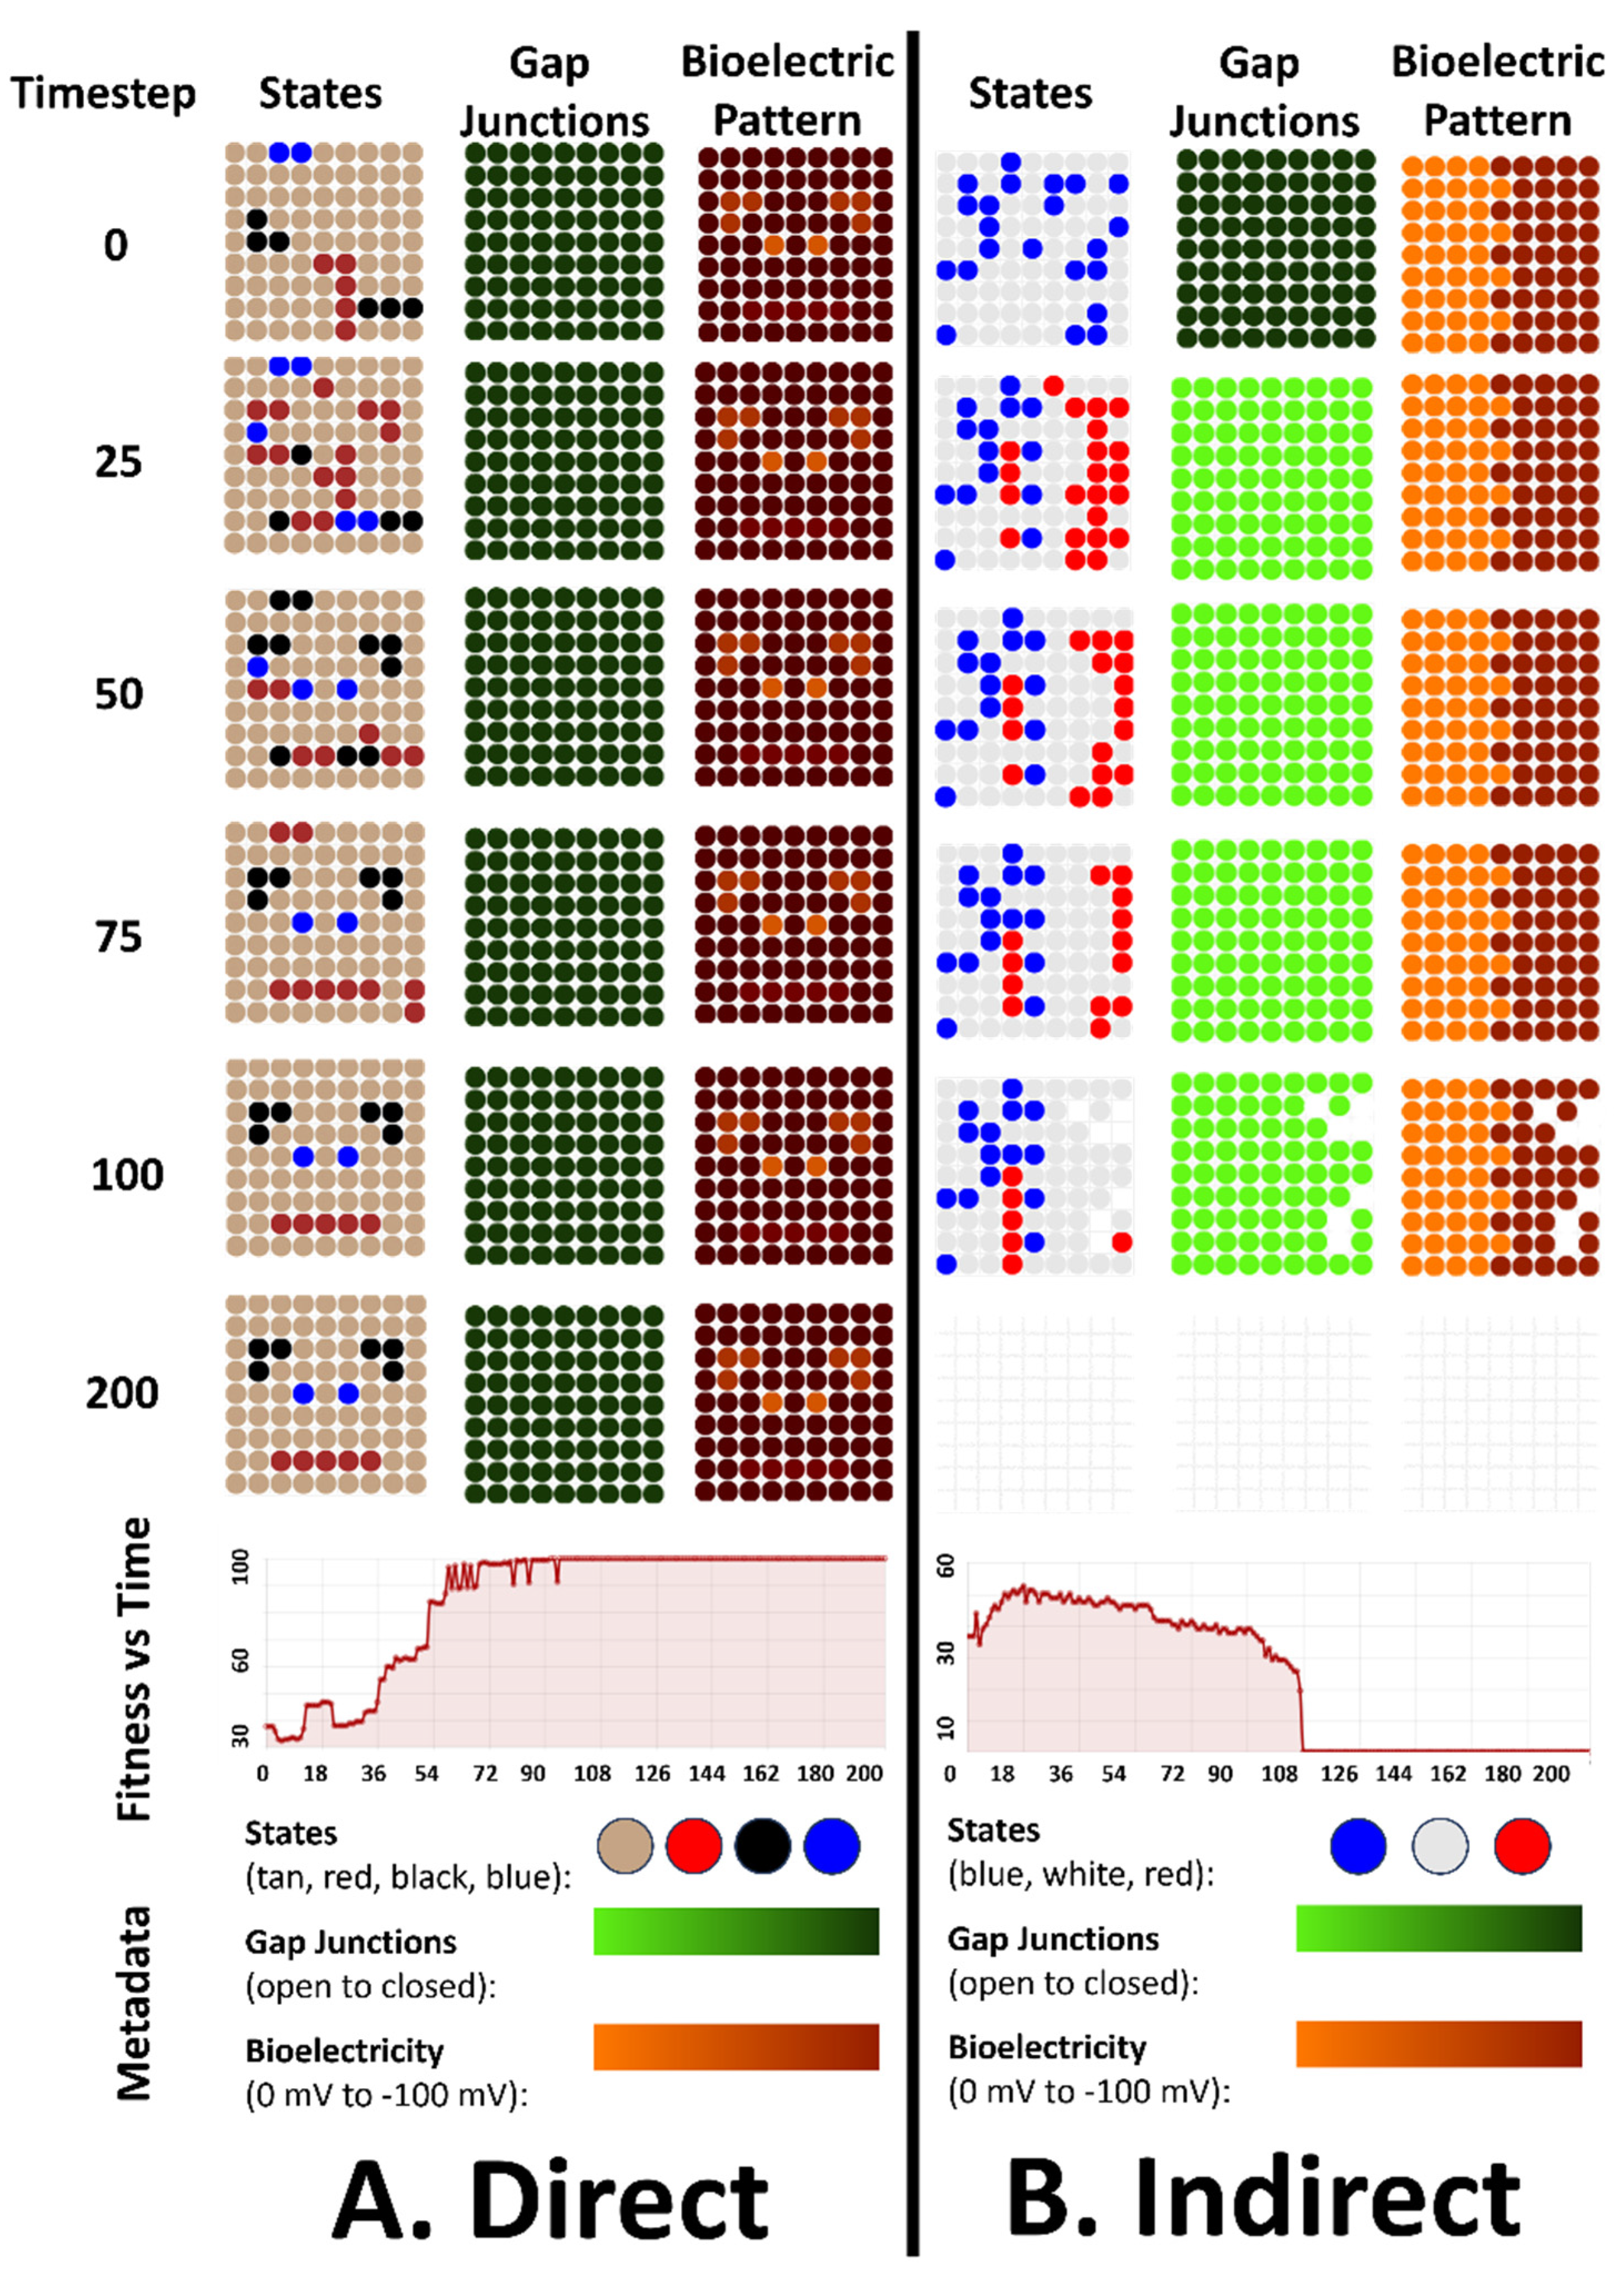
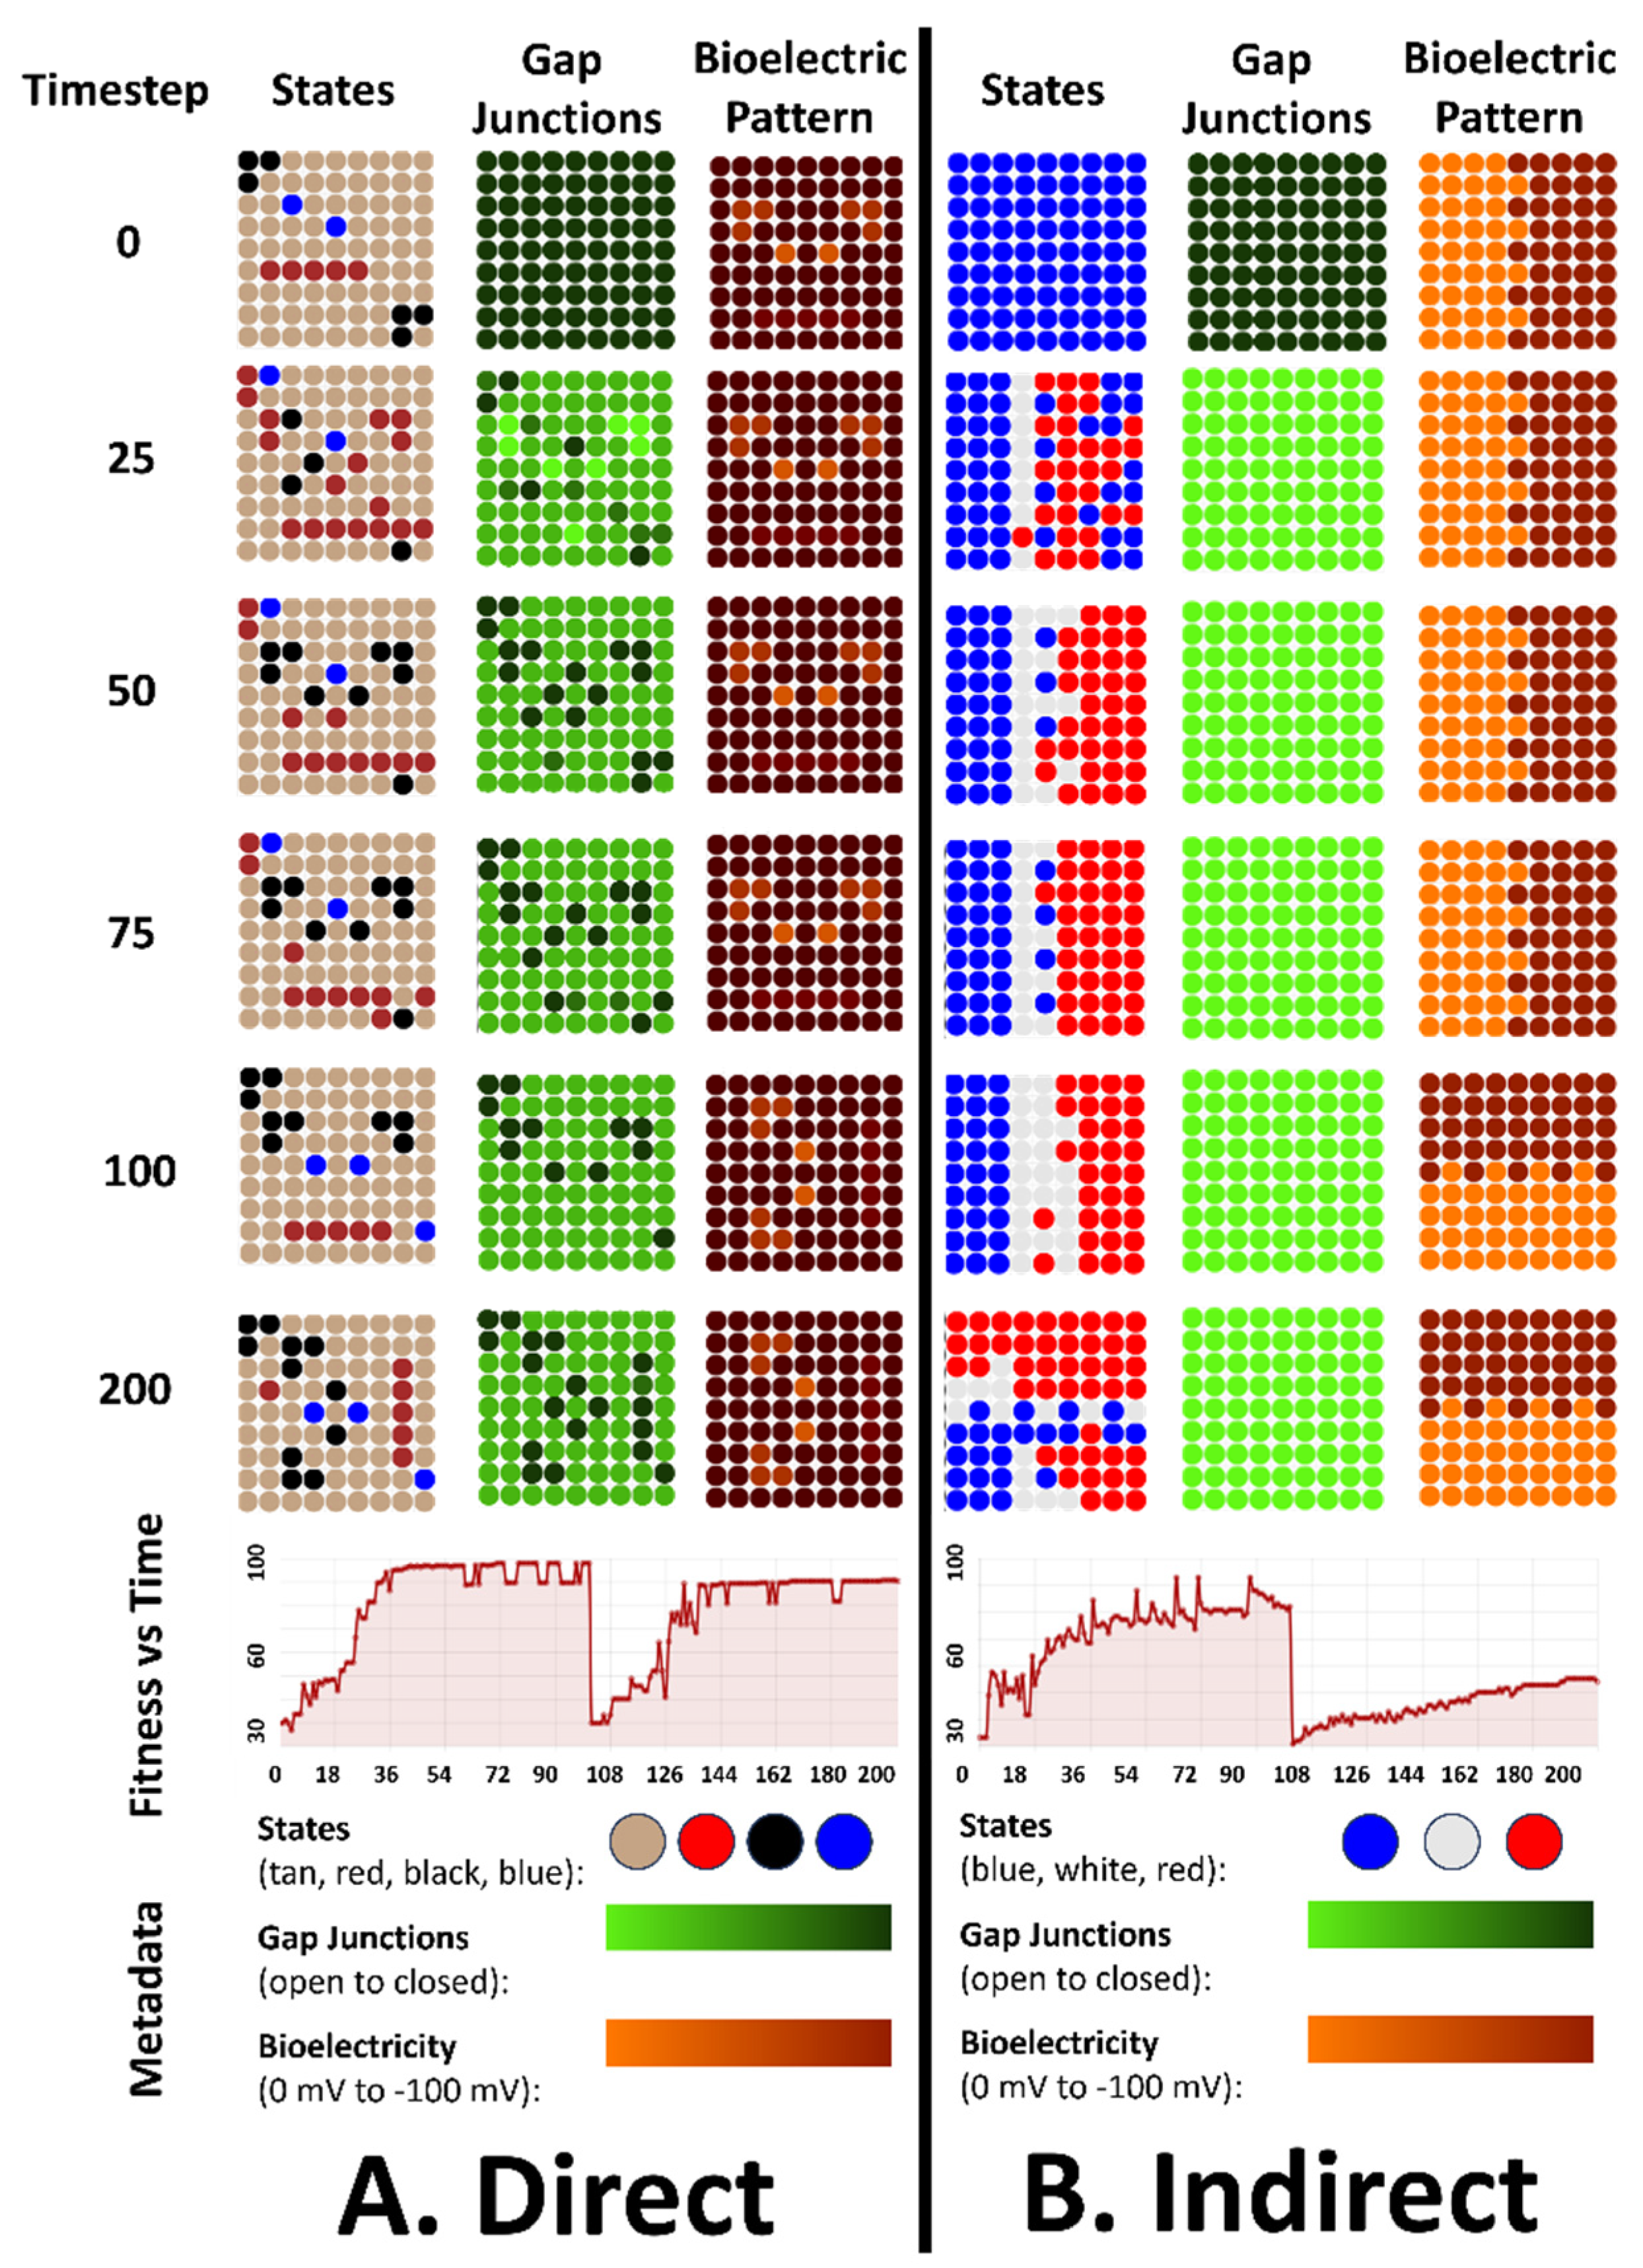
4.1. All Three Types of Bioelectrical Codes Allow the Reaching of Target Morphologies
4.2. Regulative Morphogenesis Depends Fully on the Direct Pattern, Partially for the Indirect Pattern, and Depends on the Duration of the Pattern for the Binary Trigger
4.3. An Emergent Robustness to Changes in Initial States Configurations for the Direct Pattern
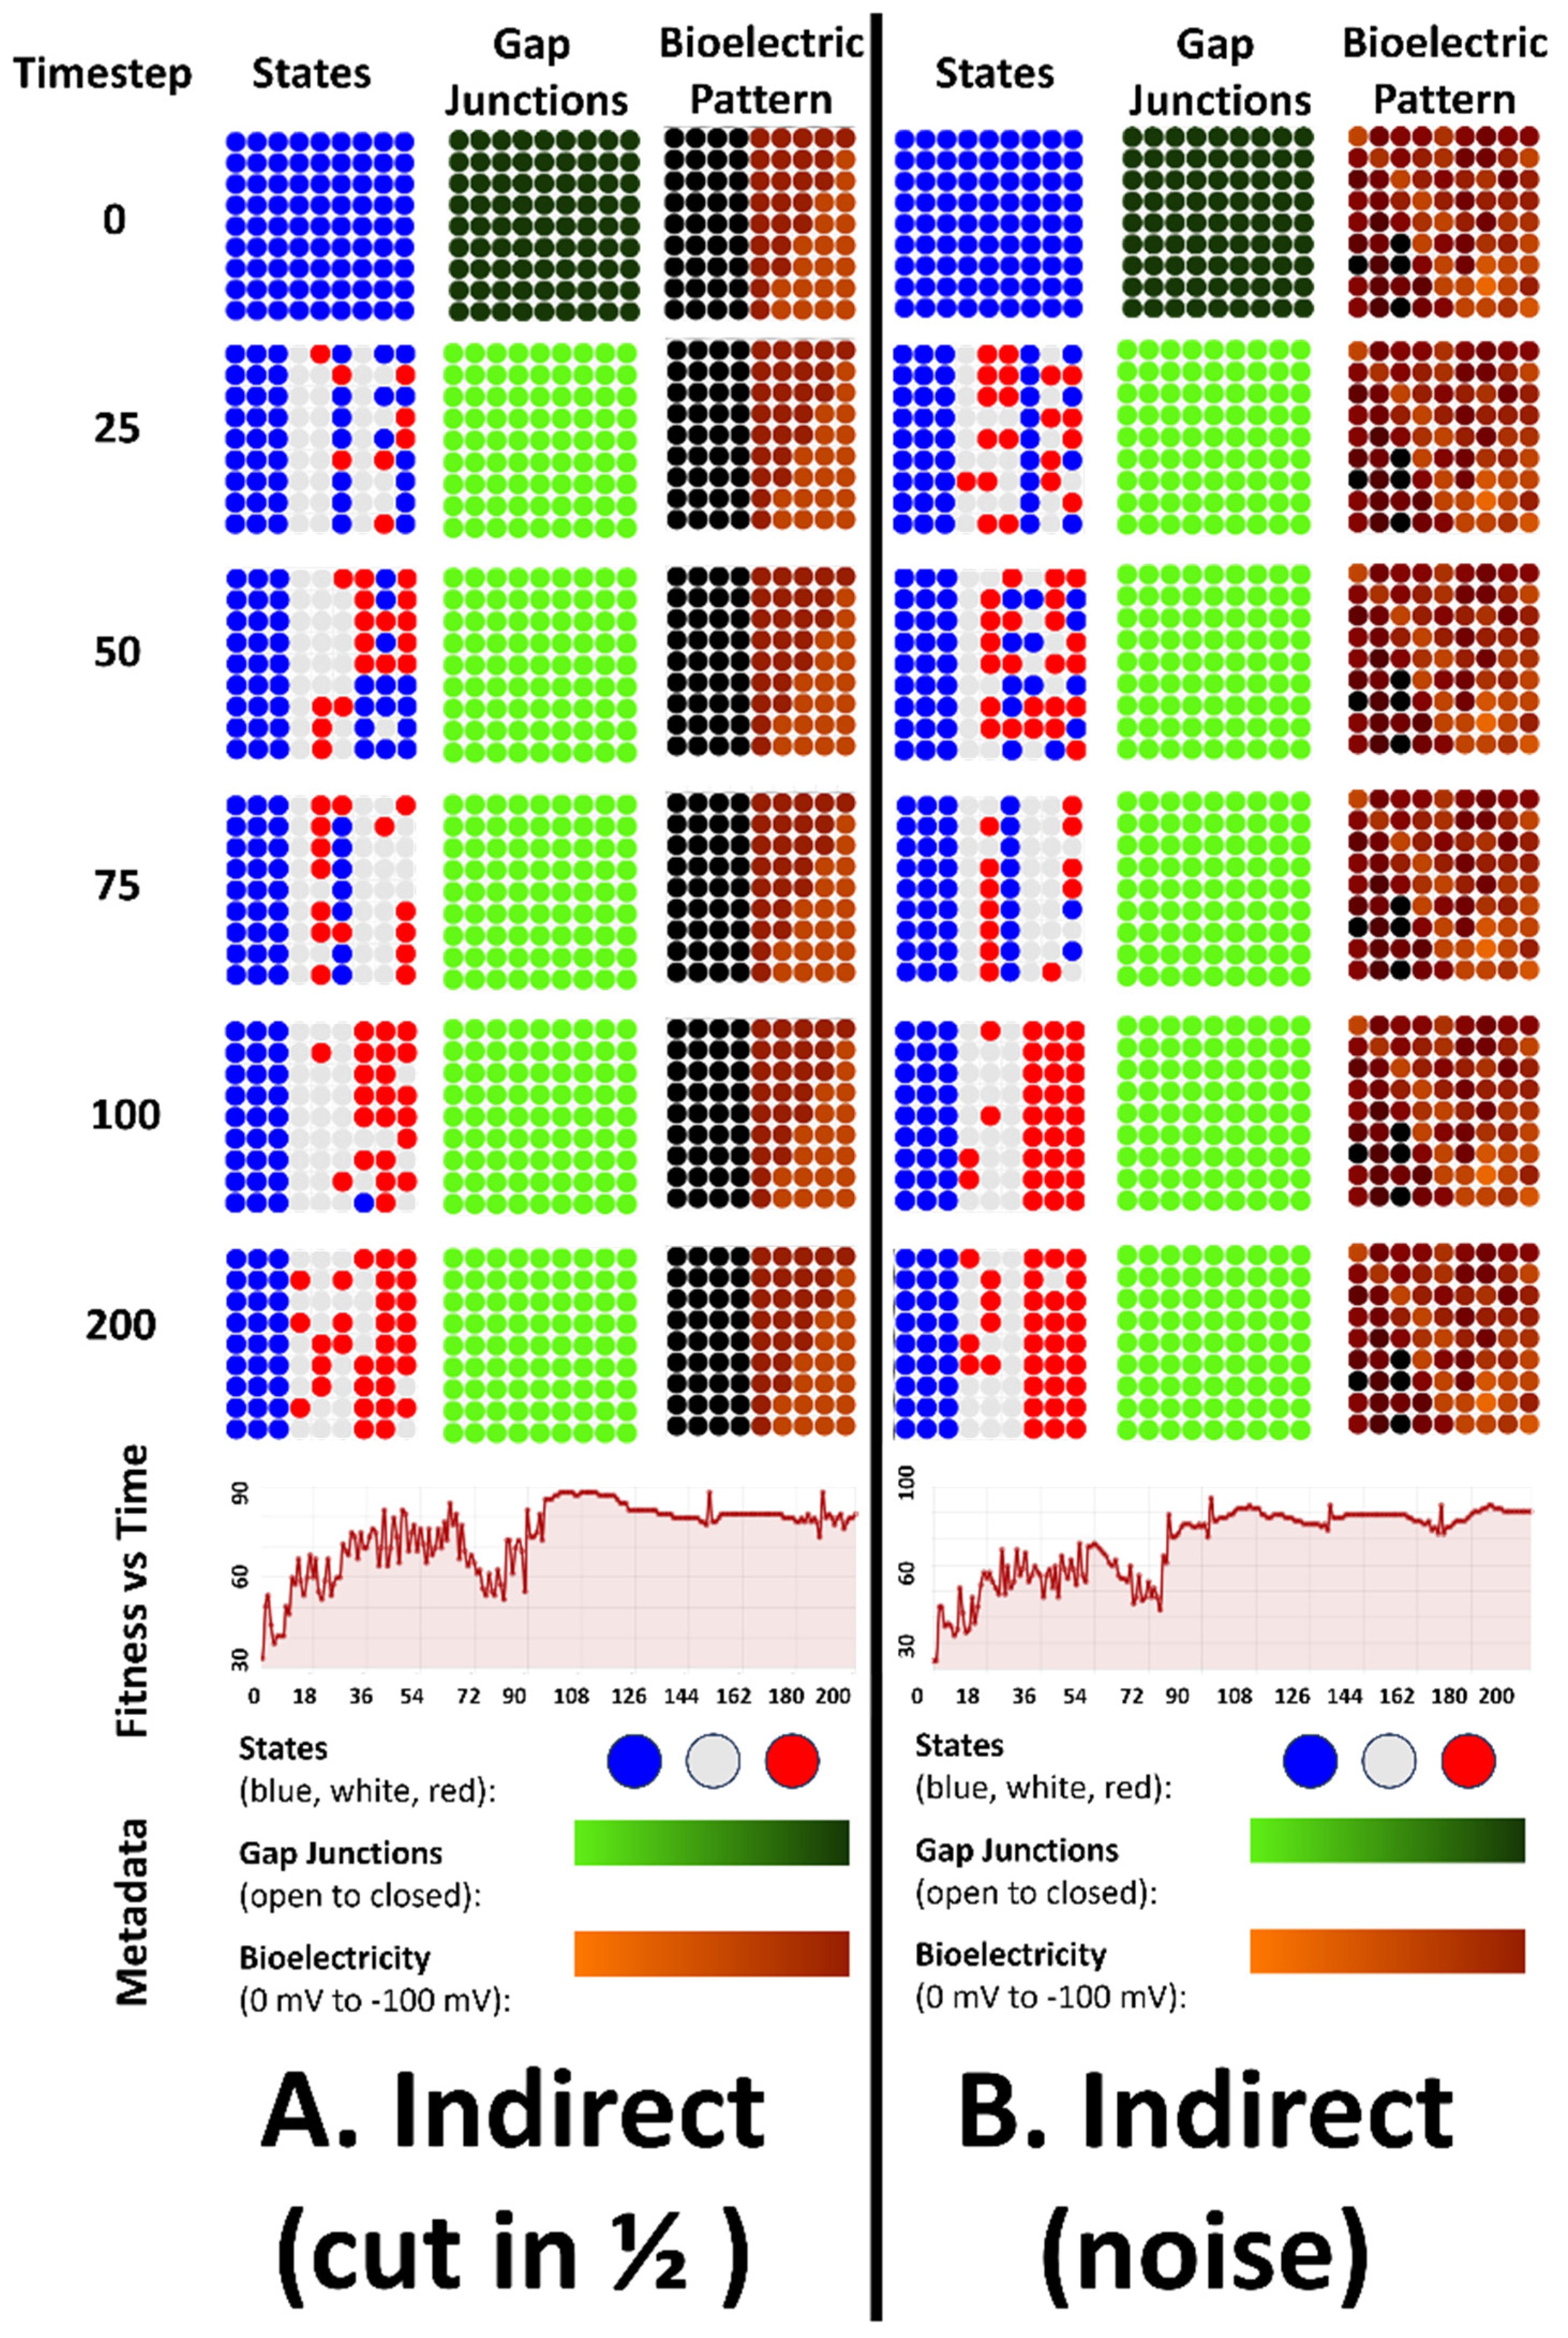
4.4. Emergent Robustness for the Organisms with Indirect Patterns to Bioelectrical Perturbation
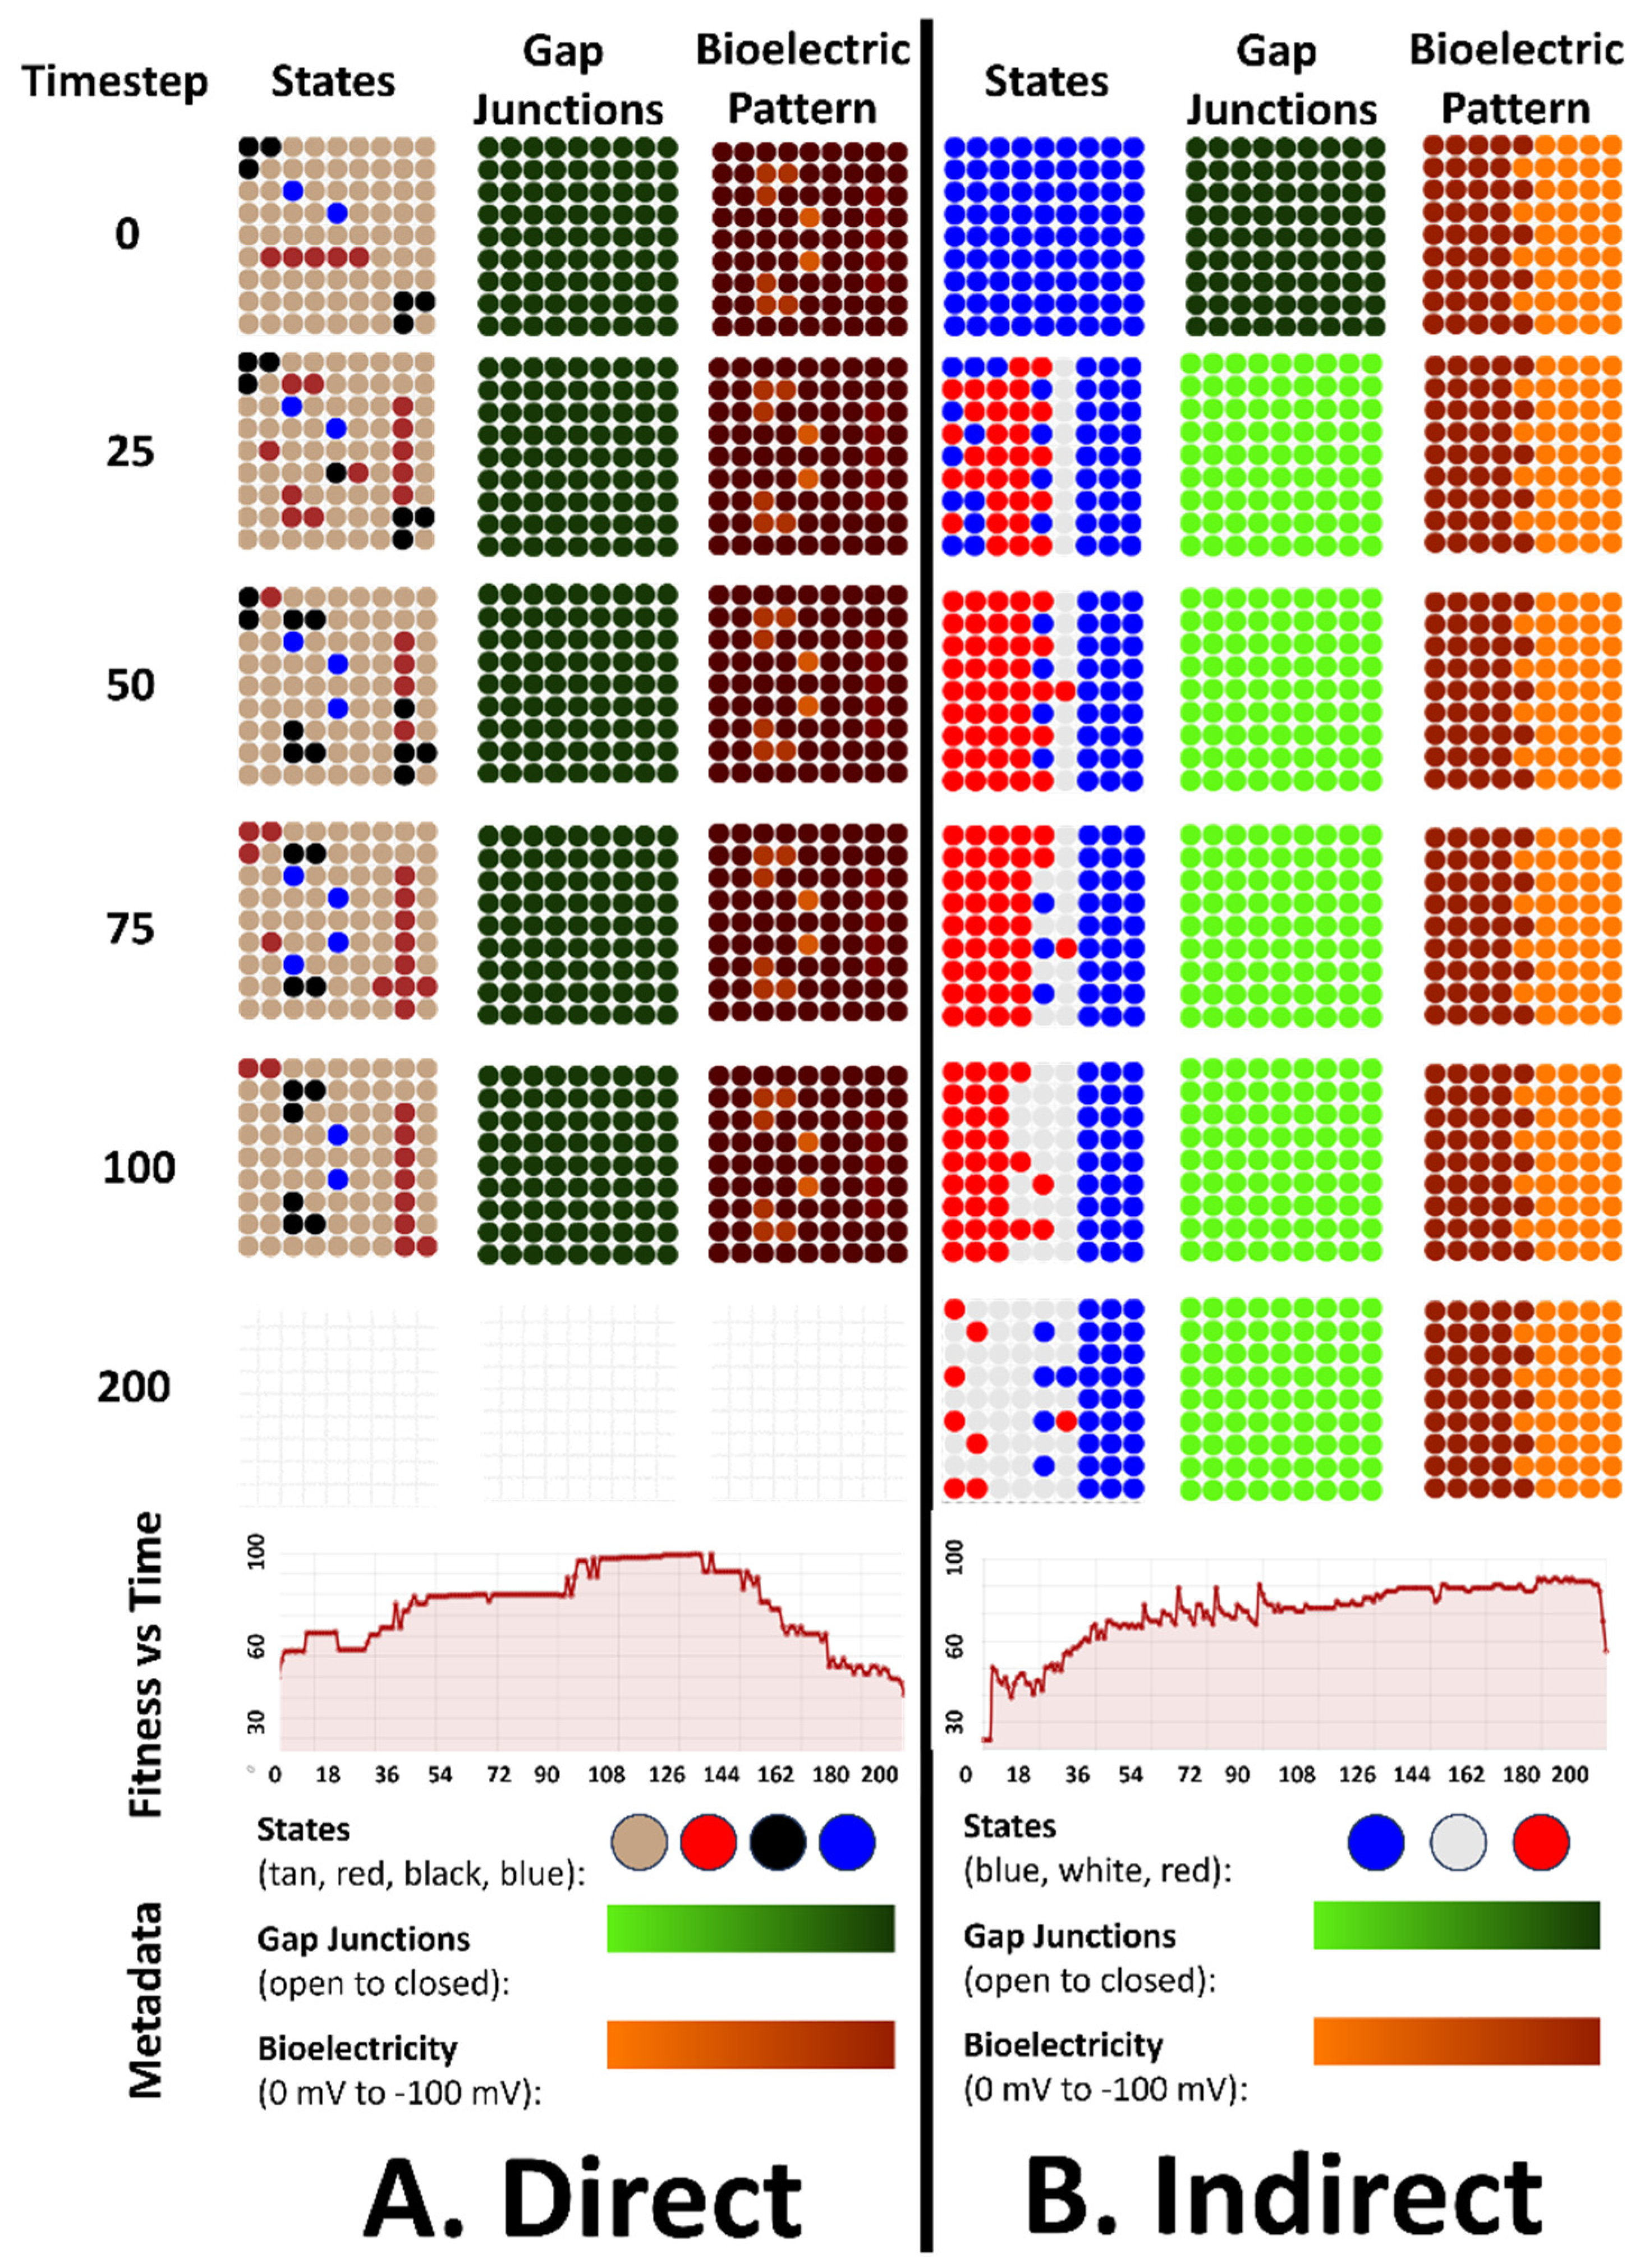
4.5. An Emergent Generalizability Competency to New Bioelectrical Pattern for the Direct and Indirect Patterns Organisms
4.6. An Emergent Repatterning Capabilities for Direct Pattern Organisms in Post-Developmental Phase
5. Selective Serotonin Reuptake Inhibitors (SSRI) Simulation and Experimental Results
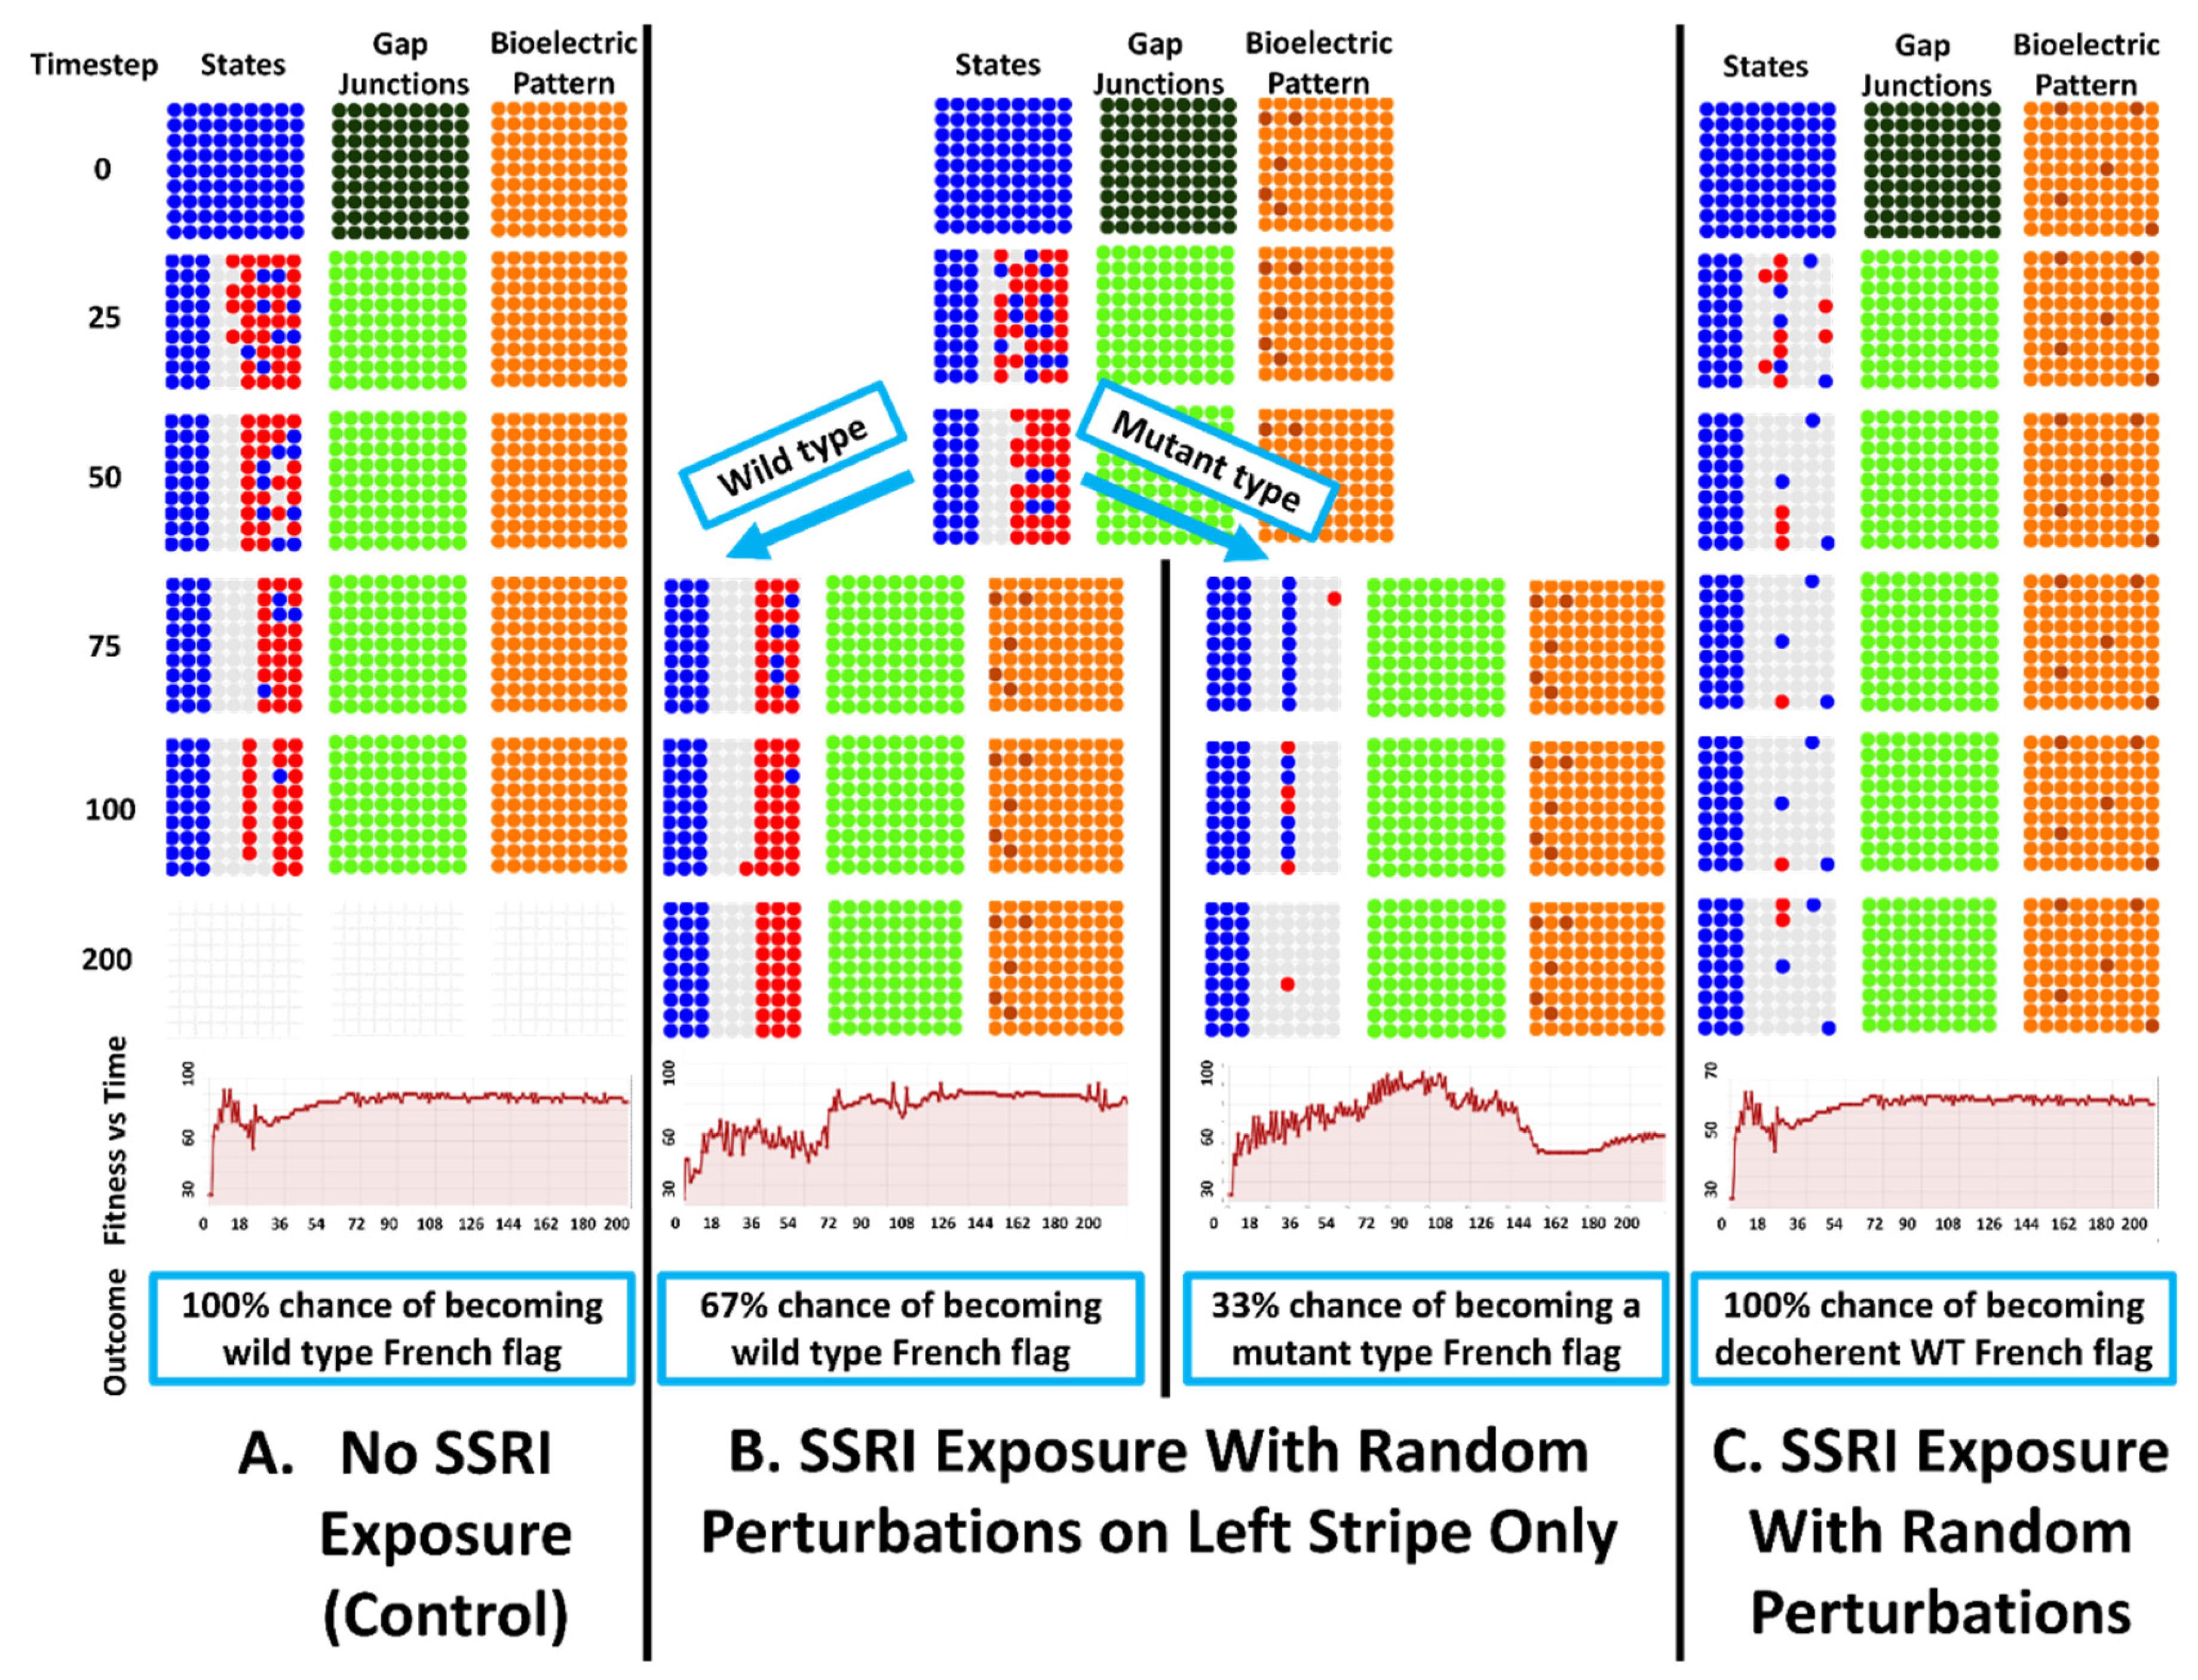
5.1. Simulated SSRI Induced Loss of Regenerative Precision and a Bistable Morphogenetic Process
5.1.1. SSRI Exposure Leads to Global Morphological
5.1.2. SSRI Exposure Leads to a Bistable Developmental Process
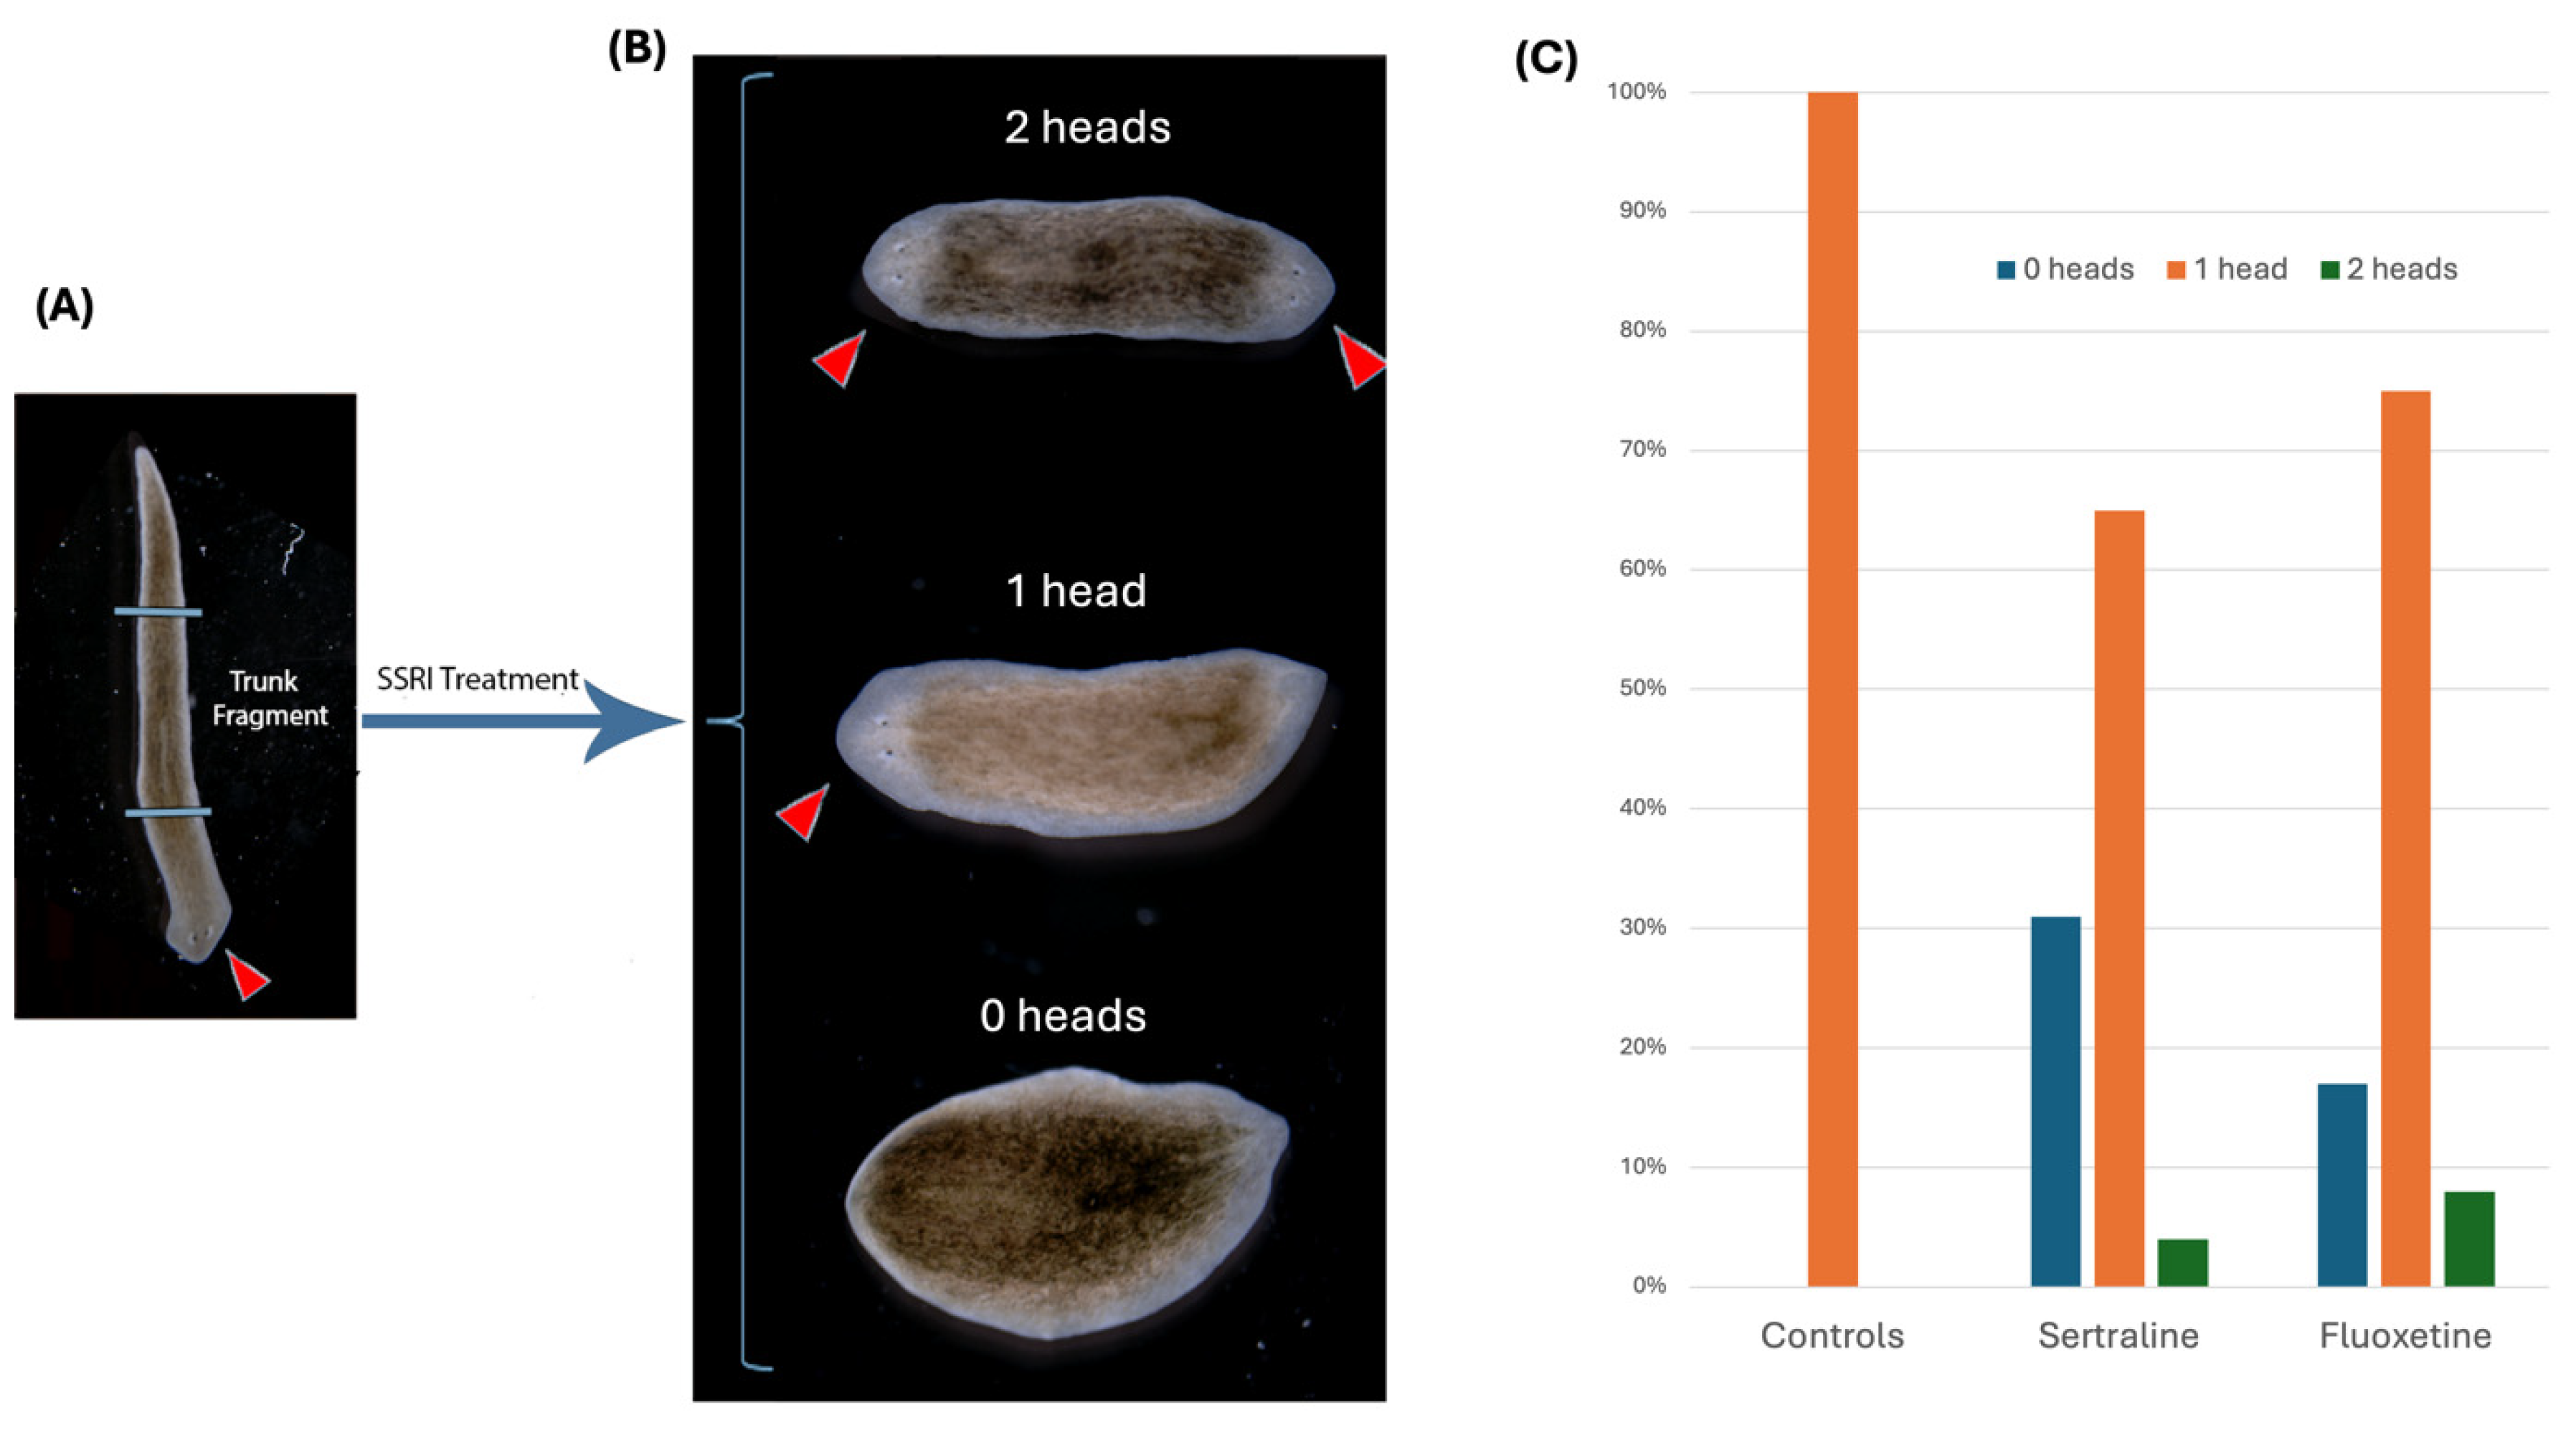
5.2. SSRI Experimental Results: Regenerating Planaria in Fluoxetine or Sertraline
6. Discussion
Supplementary Materials
Acknowledgements
Conflict of Interest Statement
References
- Levin, M. Bioelectric signaling: Reprogrammable circuits underlying embryogenesis, regeneration, and cancer. Cell 2021, 184, 1971–1989. [Google Scholar] [CrossRef] [PubMed]
- Pezzulo, G.; Levin, M. Re-membering the body: applications of computational neuroscience to the top-down control of regeneration of limbs and other complex organs. Integr Biol (Camb) 2015, 7, 1487–1517. [Google Scholar] [CrossRef] [PubMed]
- McCusker, C.; Gardiner, D.M. The axolotl model for regeneration and aging research: a mini-review. Gerontology 2011, 57, 565–571. [Google Scholar] [CrossRef]
- Levin, M. The Biophysics of Regenerative Repair Suggests New Perspectives on Biological Causation. BioEssays 2020, 42, e1900146. [Google Scholar] [CrossRef]
- Levin, M.; Pietak, A.M.; Bischof, J. Planarian regeneration as a model of anatomical homeostasis: Recent progress in biophysical and computational approaches. Seminars in Cell & Developmental Biology 2019, 87, 125–144. [Google Scholar] [CrossRef]
- Harris, A.K. The need for a concept of shape homeostasis. Biosystems 2018, 173, 65–72. [Google Scholar] [CrossRef] [PubMed]
- Fields, C.; Levin, M. Competency in Navigating Arbitrary Spaces as an Invariant for Analyzing Cognition in Diverse Embodiments. Entropy 2022, 24, 819. [Google Scholar] [CrossRef] [PubMed]
- Levin, M.; Selberg, J.; Rolandi, M. Endogenous Bioelectrics in Development, Cancer, and Regeneration: Drugs and Bioelectronic Devices as Electroceuticals for Regenerative Medicine. iScience 2019, 22, 519–533. [Google Scholar] [CrossRef]
- Harris, M.P. Bioelectric signaling as a unique regulator of development and regeneration. Development 2021, 148, dev180794. [Google Scholar] [CrossRef]
- George, L.F.; Bates, E.A. Mechanisms Underlying Influence of Bioelectricity in Development. Front Cell Dev Biol 2022, 10, 772230. [Google Scholar] [CrossRef]
- Bates, E. Ion Channels in Development and Cancer. Annu Rev Cell Dev Biol 2015, 31, 231–247. [Google Scholar] [CrossRef] [PubMed]
- Chernet, B.T.; Levin, M. Transmembrane voltage potential is an essential cellular parameter for the detection and control of tumor development in a Xenopus model. Disease models & mechanisms 2013, 6, 595–607. [Google Scholar] [CrossRef]
- Adams, D.S.; Levin, M. Endogenous voltage gradients as mediators of cell-cell communication: strategies for investigating bioelectrical signals during pattern formation. Cell Tissue Res. 2013, 352, 95–122. [Google Scholar] [CrossRef] [PubMed]
- Pezzulo, G.; Levin, M. Top-down models in biology: explanation and control of complex living systems above the molecular level. J R Soc Interface 2016, 13, 20160555. [Google Scholar] [CrossRef]
- Durant, F.; Morokuma, J.; Fields, C.; Williams, K.; Adams, D.S.; Levin, M. Long-Term, Stochastic Editing of Regenerative Anatomy via Targeting Endogenous Bioelectric Gradients. Biophys J 2017, 112, 2231–2243. [Google Scholar] [CrossRef]
- Nuccitelli, R. Endogenous electric fields in embryos during development, regeneration and wound healing. Radiat Prot Dosimetry 2003, 106, 375–383. [Google Scholar] [CrossRef]
- McMillen, P.; Levin, M. Optical Estimation of Bioelectric Patterns in Living Embryos. Methods Mol Biol 2024, 2745, 91–102. [Google Scholar] [CrossRef]
- Balasubramanian, S.; Weston, D.A.; Levin, M.; Davidian, D.C.C. Electroceuticals: emerging applications beyond the nervous system and excitable tissues. Trends Pharmacol Sci 2024, 45, 391–394. [Google Scholar] [CrossRef]
- Nanos, V.; Levin, M. Rewiring Endogenous Bioelectric Circuits in the Xenopus laevis Embryo Model. Methods Mol Biol 2021, 2258, 93–103. [Google Scholar] [CrossRef]
- Chernet, B.T.; Adams, D.S.; Lobikin, M.; Levin, M. Use of genetically encoded, light-gated ion translocators to control tumorigenesis. Oncotarget 2016, 7, 19575–19588. [Google Scholar] [CrossRef]
- Tseng, A.S.; Beane, W.S.; Lemire, J.M.; Masi, A.; Levin, M. Induction of vertebrate regeneration by a transient sodium current. J Neurosci 2010, 30, 13192–13200. [Google Scholar] [CrossRef] [PubMed]
- Ferreira, F.; Raghunathan, V.; Luxardi, G.; Zhu, K.; Zhao, M. Early redox activities modulate Xenopus tail regeneration. Nat Commun 2018, 9, 4296. [Google Scholar] [CrossRef]
- Ferreira, F.; Luxardi, G.; Reid, B.; Zhao, M. Early bioelectric activities mediate redox-modulated regeneration. Development 2016, 143, 4582–4594. [Google Scholar] [CrossRef]
- Reid, B.; Song, B.; Zhao, M. Electric currents in Xenopus tadpole tail regeneration. Dev Biol 2009, 335, 198–207. [Google Scholar] [CrossRef] [PubMed]
- Adams, D.S.; Tseng, A.-S.; Levin, M. Using Optogenetics In Vivo to Stimulate Regeneration in Xenopus laevis. Optogenetics: From Neuronal Function to Mapping and Disease Biology, 2017: p. 66. In Optogenetics: From Neuronal Function to Mapping and Disease Biology, Appasani, K., Ed.; Cambridge University Press: 2017; pp. 66-76.
- Tseng, A.; Levin, M. Cracking the bioelectric code: Probing endogenous ionic controls of pattern formation. Commun Integr Biol 2013, 6, e22595. [Google Scholar] [CrossRef]
- Pai, V.P.; Aw, S.; Shomrat, T.; Lemire, J.M.; Levin, M. Transmembrane voltage potential controls embryonic eye patterning in Xenopus laevis. Development 2012, 139, 313–323. [Google Scholar] [CrossRef]
- Pai, V.P.; Levin, M. HCN2 channel-induced rescue of brain, eye, heart and gut teratogenesis caused by nicotine, ethanol and aberrant notch signalling. Wound Repair Regen 2022, 30, 681–706. [Google Scholar] [CrossRef] [PubMed]
- Pai, V.P.; Cervera, J.; Mafe, S.; Willocq, V.; Lederer, E.K.; Levin, M. HCN2 Channel-Induced Rescue of Brain Teratogenesis via Local and Long-Range Bioelectric Repair. Front Cell Neurosci 2020, 14, 136. [Google Scholar] [CrossRef] [PubMed]
- Pai, V.P.; Pietak, A.; Willocq, V.; Ye, B.; Shi, N.Q.; Levin, M. HCN2 Rescues brain defects by enforcing endogenous voltage pre-patterns. Nat Commun 2018, 9, 998. [Google Scholar] [CrossRef]
- Pai, V.P.; Lemire, J.M.; Paré, J.F.; Lin, G.; Chen, Y.; Levin, M. Endogenous gradients of resting potential instructively pattern embryonic neural tissue via Notch signaling and regulation of proliferation. J Neurosci 2015, 35, 4366–4385. [Google Scholar] [CrossRef]
- Chernet, B.T.; Fields, C.; Levin, M. Long-range gap junctional signaling controls oncogene-mediated tumorigenesis in Xenopus laevis embryos. Front Physiol 2014, 5, 519. [Google Scholar] [CrossRef]
- Chernet, B.T.; Levin, M. Transmembrane voltage potential of somatic cells controls oncogene-mediated tumorigenesis at long-range. Oncotarget 2014, 5, 3287–3306. [Google Scholar] [CrossRef]
- Chernet, B.T.; Levin, M. Endogenous Voltage Potentials and the Microenvironment: Bioelectric Signals that Reveal, Induce and Normalize Cancer. J Clin Exp Oncol 2013, Suppl 1. [CrossRef]
- Pio-Lopez, L.; Levin, M. Morphoceuticals: Perspectives for discovery of drugs targeting anatomical control mechanisms in regenerative medicine, cancer and aging. Drug Discov Today 2023, 28, 103585. [Google Scholar] [CrossRef] [PubMed]
- Pio-Lopez, L.; Levin, M. Aging as a loss of morphostatic information: A developmental bioelectricity perspective. Ageing Res Rev 2024, 97, 102310. [Google Scholar] [CrossRef]
- Levin, M.; Martyniuk, C.J. The bioelectric code: An ancient computational medium for dynamic control of growth and form. Biosystems 2018, 164, 76–93. [Google Scholar] [CrossRef]
- Pai, V.P.; Martyniuk, C.J.; Echeverri, K.; Sundelacruz, S.; Kaplan, D.L.; Levin, M. Genome-wide analysis reveals conserved transcriptional responses downstream of resting potential change in Xenopus embryos, axolotl regeneration, and human mesenchymal cell differentiation. Regeneration (Oxf) 2016, 3, 3–25. [Google Scholar] [CrossRef] [PubMed]
- Bates, E.A. A potential molecular target for morphological defects of fetal alcohol syndrome: Kir2.1. Curr Opin Genet Dev 2013, 23, 324–329. [Google Scholar] [CrossRef]
- Dahal, G.R.; Rawson, J.; Gassaway, B.; Kwok, B.; Tong, Y.; Ptacek, L.J.; Bates, E. An inwardly rectifying K+ channel is required for patterning. Development 2012, 139, 3653–3664. [Google Scholar] [CrossRef] [PubMed]
- Levin, M.; Pezzulo, G.; Finkelstein, J.M. Endogenous Bioelectric Signaling Networks: Exploiting Voltage Gradients for Control of Growth and Form. Annu Rev Biomed Eng 2017, 19, 353–387. [Google Scholar] [CrossRef] [PubMed]
- Lanni, J.S.; Peal, D.; Ekstrom, L.; Chen, H.; Stanclift, C.; Bowen, M.E.; Mercado, A.; Gamba, G.; Kahle, K.T.; Harris, M.P. Integrated K+ channel and K+Cl- cotransporter functions are required for the coordination of size and proportion during development. Dev Biol 2019, 456, 164–178. [Google Scholar] [CrossRef]
- Parsons, K.J.; Son, Y.H.; Crespel, A.; Thambithurai, D.; Killen, S.; Harris, M.P.; Albertson, R.C. Conserved but flexible modularity in the zebrafish skull: implications for craniofacial evolvability. Proc Biol Sci 2018, 285. [Google Scholar] [CrossRef] [PubMed]
- Daane, J.M.; Lanni, J.; Rothenberg, I.; Seebohm, G.; Higdon, C.W.; Johnson, S.L.; Harris, M.P. Bioelectric-calcineurin signaling module regulates allometric growth and size of the zebrafish fin. Sci Rep 2018, 8, 10391. [Google Scholar] [CrossRef] [PubMed]
- Perathoner, S.; Daane, J.M.; Henrion, U.; Seebohm, G.; Higdon, C.W.; Johnson, S.L.; Nusslein-Volhard, C.; Harris, M.P. Bioelectric signaling regulates size in zebrafish fins. PLoS Genet 2014, 10, e1004080. [Google Scholar] [CrossRef] [PubMed]
- Yi, C.; Spitters, T.W.; Al-Far, E.A.A.; Wang, S.; Xiong, T.; Cai, S.; Yan, X.; Guan, K.; Wagner, M.; El-Armouche, A.; et al. A calcineurin-mediated scaling mechanism that controls a K(+)-leak channel to regulate morphogen and growth factor transcription. Elife 2021, 10. [Google Scholar] [CrossRef] [PubMed]
- Kujawski, S.; Lin, W.; Kitte, F.; Bormel, M.; Fuchs, S.; Arulmozhivarman, G.; Vogt, S.; Theil, D.; Zhang, Y.; Antos, C.L. Calcineurin regulates coordinated outgrowth of zebrafish regenerating fins. Dev Cell 2014, 28, 573–587. [Google Scholar] [CrossRef]
- Petsakou, A.; Perrimon, N. Bioelectric regulation of intestinal stem cells. Trends Cell Biol 2023, 33, 555–567. [Google Scholar] [CrossRef] [PubMed]
- Sundelacruz, S.; Moody, A.T.; Levin, M.; Kaplan, D.L. Membrane Potential Depolarization Alters Calcium Flux and Phosphate Signaling During Osteogenic Differentiation of Human Mesenchymal Stem Cells. Bioelectricity 2019, 1, 56–66. [Google Scholar] [CrossRef] [PubMed]
- Bautista, W.; Perez-Alvarez, V.; Burczynski, F.; Raouf, A.; Klonisch, T.; Minuk, G. Membrane potential differences and GABAA receptor expression in hepatic tumor and non-tumor stem cells. Can J Physiol Pharmacol 2014, 92, 85–91. [Google Scholar] [CrossRef] [PubMed]
- Sundelacruz, S.; Levin, M.; Kaplan, D.L. Depolarization alters phenotype, maintains plasticity of predifferentiated mesenchymal stem cells. Tissue Eng Part A 2013, 19, 1889–1908. [Google Scholar] [CrossRef] [PubMed]
- Sun, Y.; Dong, Z.; Jin, T.; Ang, K.H.; Huang, M.; Haston, K.M.; Peng, J.; Zhong, T.P.; Finkbeiner, S.; Weiss, W.A.; et al. Imaging-based chemical screening reveals activity-dependent neural differentiation of pluripotent stem cells. Elife 2013, 2, e00508. [Google Scholar] [CrossRef] [PubMed]
- Pai, V.; Levin, M. Bioelectric controls of stem cell function. In Stem Cells, Calegari, F., Waskow, C., Eds.; CRC Press: 2013; pp. 106-148.
- Mathews, J.; Levin, M. The body electric 2.0: recent advances in developmental bioelectricity for regenerative and synthetic bioengineering. Curr Opin Biotechnol 2018, 52, 134–144. [Google Scholar] [CrossRef] [PubMed]
- Davidian, D.; Levin, M. Inducing Vertebrate Limb Regeneration: A Review of Past Advances and Future Outlook. Cold Spring Harbor perspectives in biology 2022, 14. [Google Scholar] [CrossRef] [PubMed]
- Sullivan, K.G.; Emmons-Bell, M.; Levin, M. Physiological inputs regulate species-specific anatomy during embryogenesis and regeneration. Commun Integr Biol 2016, 9, e1192733. [Google Scholar] [CrossRef] [PubMed]
- Levin, M. Darwin's agential materials: evolutionary implications of multiscale competency in developmental biology. Cell Mol Life Sci 2023, 80, 142. [Google Scholar] [CrossRef]
- Barbieri, M. Biology with information and meaning. Hist Philos Life Sci 2003, 25, 243–254. [Google Scholar] [CrossRef]
- Barbieri, M. The organic codes. The basic mechanism of macroevolution. Riv Biol 1998, 91, 481–513. [Google Scholar]
- Barbieri, M. A general model on the origin of biological codes. Biosystems 2019, 181, 11–19. [Google Scholar] [CrossRef]
- Barbieri, M. What is code biology? Biosystems 2018, 164, 1–10. [Google Scholar] [CrossRef]
- Vandenberg, L.N.; Morrie, R.D.; Adams, D.S. V-ATPase-dependent ectodermal voltage and pH regionalization are required for craniofacial morphogenesis. Dev Dyn 2011, 240, 1889–1904. [Google Scholar] [CrossRef]
- Adams, D.S.; Masi, A.; Levin, M. H+ pump-dependent changes in membrane voltage are an early mechanism necessary and sufficient to induce Xenopus tail regeneration. Development 2007, 134, 1323–1335. [Google Scholar] [CrossRef]
- Beane, W.S.; Morokuma, J.; Lemire, J.M.; Levin, M. Bioelectric signaling regulates head and organ size during planarian regeneration. Development 2013, 140, 313–322. [Google Scholar] [CrossRef] [PubMed]
- Emmons-Bell, M.; Durant, F.; Hammelman, J.; Bessonov, N.; Volpert, V.; Morokuma, J.; Pinet, K.; Adams, D.S.; Pietak, A.; Lobo, D.; et al. Gap Junctional Blockade Stochastically Induces Different Species-Specific Head Anatomies in Genetically Wild-Type Girardia dorotocephala Flatworms. Int J Mol Sci 2015, 16, 27865–27896. [Google Scholar] [CrossRef] [PubMed]
- Carvalho, J. A computational model of cell membrane bioelectric polarization and depolarization, connected with cell proliferation, in different tissue geometries. J Theor Biol 2023, 557, 111338. [Google Scholar] [CrossRef] [PubMed]
- Pietak, A.; Levin, M. Bioelectric gene and reaction networks: computational modelling of genetic, biochemical and bioelectrical dynamics in pattern regulation. J R Soc Interface 2017, 14. [Google Scholar] [CrossRef]
- Pietak, A.; Levin, M. Exploring Instructive Physiological Signaling with the Bioelectric Tissue Simulation Engine. Front Bioeng Biotechnol 2016, 4, 55. [Google Scholar] [CrossRef]
- Cervera, J.; Manzanares, J.A.; Mafe, S.; Levin, M. Synchronization of Bioelectric Oscillations in Networks of Nonexcitable Cells: From Single-Cell to Multicellular States. J Phys Chem B 2019, 123, 3924–3934. [Google Scholar] [CrossRef]
- Cervera, J.; Pietak, A.; Levin, M.; Mafe, S. Bioelectrical coupling in multicellular domains regulated by gap junctions: A conceptual approach. Bioelectrochemistry 2018, 123, 45–61. [Google Scholar] [CrossRef]
- Cervera, J.; Meseguer, S.; Mafe, S. Intercellular Connectivity and Multicellular Bioelectric Oscillations in Nonexcitable Cells: A Biophysical Model. ACS Omega 2018, 3, 13567–13575. [Google Scholar] [CrossRef]
- Cervera, J.; Manzanares, J.A.; Mafe, S. Cell-cell bioelectrical interactions and local heterogeneities in genetic networks: a model for the stabilization of single-cell states and multicellular oscillations. Phys Chem Chem Phys 2018, 20, 9343–9354. [Google Scholar] [CrossRef]
- Mordvintsev, A.; Randazzo, E.; Niklasson, E.; Levin, M. Growing Neural Cellular Automata. Distill 2020, 5, e23. [Google Scholar] [CrossRef]
- Sharpe, J. Wolpert's French Flag: what's the problem? Development 2019, 146. [Google Scholar] [CrossRef] [PubMed]
- Wolpert, L. Positional information and the spatial pattern of cellular differentiation. J Theor Biol 1969, 25, 1–47. [Google Scholar] [CrossRef] [PubMed]
- Bowers, C.P. Formation of modules in a computational model of embryogeny. 2005 Ieee Congress on Evolutionary Computation, Vols 1-3, Proceedings 2005, 1, 537–542. [Google Scholar] [CrossRef]
- Hillenbrand, P.; Gerland, U.; Tkačik, G. Beyond the French Flag Model: Exploiting Spatial and Gene Regulatory Interactions for Positional Information. PLoS One 2016, 11, e0163628. [Google Scholar] [CrossRef]
- Ancona, B.; Bajwa, A.; Lynch, N.; Mallmann-Trenn, F. How to Color a French Flag. In Structural Information and Communication Complexity, Censor-Hillel, K., Flammini, M., Eds.; Lecture Notes in Computer Science; Springer: Cham, 2019; pp. 327–331. [Google Scholar]
- Kremser, S.; Vercelli, G.; Gerland, U. The French Flag Problem Revisited: Creating Robust and Tunable Axial Patterns Without Global Signaling. eLife 2024, 13, RP94699. [Google Scholar] [CrossRef]
- Chavoya, A.; Duthen, Y. Using a genetic algorithm to evolve cellular automata for 2D/3D computational development. 2006; pp. 231 - 232.
- Chavoya, A.; Duthen, Y. Use of a genetic algorithm to evolve an extended artificial regulatory network for cell pattern generation. 2007; p. 1062.
- Lee, H.C.; Hastings, C.; Oliveira, N.M.M.; Pérez-Carrasco, R.; Page, K.M.; Wolpert, L.; Stern, C.D. 'Neighbourhood watch' model: embryonic epiblast cells assess positional information in relation to their neighbours. Development 2022, 149, dev200295. [Google Scholar] [CrossRef]
- Grasso, C.; Bongard, J. Empowered Neural Cellular Automata. 2022; pp. 108-111.
- Hartl, B.; Risi, S.; Levin, M. Evolutionary Implications of Self-Assembling Cybernetic Materials with Collective Problem-Solving Intelligence at Multiple Scales. Entropy (Basel) 2024, 26, 532. [Google Scholar] [CrossRef]
- Pio-Lopez, L.; Bischof, J.; LaPalme, J.V.; Levin, M. The scaling of goals from cellular to anatomical homeostasis: an evolutionary simulation, experiment and analysis. Interface Focus 2023, 13, 20220072. [Google Scholar] [CrossRef]
- Ruiz, A.H.; Vilalta, A.; Moreno-Noguer, F. Neural cellular automata manifold. In Proceedings of the IEEE/CVF Conference on Computer Vision and Pattern Recognition (CVPR), Nashville, TN; 2021; pp. 10015–10023. [Google Scholar]
- Sudhakaran, S.; Grbic, D.; Li, S.; Katona, A.; Najarro, E.; Glanois, C.; Risi, S. , Growing 3d artefacts and functional machines with neural cellular automata. In Proceedings of the ALIFE 2021: The 2021 Conference on Artificial Life 2021. [Google Scholar]
- Pande, R.; Grattarola, D. Heirarchical neural cellular automata. In Proceedings of the ALIFE 2023: Ghost in the Machine; 2023. [Google Scholar]
- Manicka, S.; Levin, M. Modeling somatic computation with non-neural bioelectric networks. Sci Rep 2019, 9, 18612. [Google Scholar] [CrossRef]
- Manicka, S.; Pai, V.P.; Levin, M. Information integration during bioelectric regulation of morphogenesis of the embryonic frog brain. iScience 2023, 26, 108398. [Google Scholar] [CrossRef]
- Vandenberg, L.N.; Adams, D.S.; Levin, M. Normalized shape and location of perturbed craniofacial structures in the Xenopus tadpole reveal an innate ability to achieve correct morphology. Dev Dyn 2012, 241, 863–878. [Google Scholar] [CrossRef]
- Vohradsky, J. Neural model of the genetic network. J Biol Chem 2001, 276, 36168–36173. [Google Scholar] [CrossRef]
- Risi, S.; Stanley, K.O. An enhanced hypercube-based encoding for evolving the placement, density, and connectivity of neurons. Artif Life 2012, 18, 331–363. [Google Scholar] [CrossRef]
- Risi, S.; Lehman, J.; Stanley, K.O. Evolving the placement and density of neurons in the hyperneat substrate. In Proceedings of the GECCO '10: 12th annual conference on Genetic and evolutionary computation, Portland, Oregon; 2010; pp. 563–570. [Google Scholar]
- Stanley, K.O.; D'Ambrosio, D.B.; Gauci, J. A hypercube-based encoding for evolving large-scale neural networks. Artif Life 2009, 15, 185–212. [Google Scholar] [CrossRef] [PubMed]
- Kazil, J.; Masad, D.; Crooks, A. Utilizing Python for Agent-Based Modeling: The Mesa Framework. In Social, Cultural, and Behavioral Modeling, Thomson, R., Bisgin, H., Dancy, C., Hyder, A., Hussain, M., Eds.; Lecture Notes in Computer Science; Springer: Cham, 2020; pp. 308–317. [Google Scholar]
- Oviedo, N.J.; Nicolas, C.L.; Adams, D.S.; Levin, M. Establishing and maintaining a colony of planarians. CSH Protoc 2008, 2008, pdb prot5053. [Google Scholar] [CrossRef]
- Keller, E.F. Developmental robustness. Ann N Y Acad Sci 2002, 981, 189–201. [Google Scholar] [CrossRef]
- Mestek Boukhibar, L.; Barkoulas, M. The developmental genetics of biological robustness. Ann Bot 2016, 117, 699–707. [Google Scholar] [CrossRef]
- Beane, W.S.; Morokuma, J.; Adams, D.S.; Levin, M. A Chemical Genetics Approach Reveals H,K-ATPase-Mediated Membrane Voltage Is Required for Planarian Head Regeneration. Chemistry & Biology 2011, 18, 77–89. [Google Scholar] [CrossRef]
- Blackiston, D.J.; Levin, M. Ectopic eyes outside the head in Xenopus tadpoles provide sensory data for light-mediated learning. J Exp Biol 2013, 216, 1031–1040. [Google Scholar] [CrossRef] [PubMed]
- Yakushiji, N.; Yokoyama, H.; Tamura, K. Repatterning in amphibian limb regeneration: A model for study of genetic and epigenetic control of organ regeneration. Semin Cell Dev Biol 2009, 20, 565–574. [Google Scholar] [CrossRef]
- Wake, D.B.; Hanken, J. Direct development in the lungless salamanders: what are the consequences for developmental biology, evolution and phylogenesis? Int J Dev Biol 1996, 40, 859–869. [Google Scholar] [PubMed]
- Worley, M.I.; Hariharan, I.K. Imaginal Disc Regeneration: Something Old, Something New. Cold Spring Harb Perspect Biol 2022, 14. [Google Scholar] [CrossRef] [PubMed]
- Healy, D.; LaPalme, J.; Levin, M. Post-SSRI Sexual Dysfunction: A Bioelectric Mechanism? Bioelectricity 2019, 2, 7–13. [Google Scholar] [CrossRef]
- DeLucia, V.; Kelsberg, G.; Safranek, S. Which SSRIs most effectively treat depression in adolescents? J Fam Pract 2016, 65, 632–634. [Google Scholar]
- Blattner, M.; Levin, M. Long Range Communication via Gap Junctions and Stress in Planarian Morphogenesis: A Computational Study. Bioelectricity 2023, 5, 196–209. [Google Scholar] [CrossRef]
- Hernández-Díaz, S.; Levin, M. Alteration of bioelectrically-controlled processes in the embryo: a teratogenic mechanism for anticonvulsants. Reprod Toxicol 2014, 47, 111–114. [Google Scholar] [CrossRef] [PubMed]
- Fischer, A.G.; Ullsperger, M. An Update on the Role of Serotonin and its Interplay with Dopamine for Reward. Front Hum Neurosci 2017, 11, 484. [Google Scholar] [CrossRef]
- Kranz, G.S.; Kasper, S.; Lanzenberger, R. Reward and the serotonergic system. Neuroscience 2010, 166, 1023–1035. [Google Scholar] [CrossRef]
- Nakatani, Y.; Amano, T. Functional Modulation of Na(v)1.2 Voltage-Gated Sodium Channels Induced by Escitalopram. Biol Pharm Bull 2018, 41, 1471–1474. [Google Scholar] [CrossRef]
- Hong, D.H.; Li, H.; Kim, H.S.; Kim, H.W.; Shin, S.E.; Jung, W.K.; Na, S.H.; Choi, I.W.; Firth, A.L.; Park, W.S.; et al. The Effects of the Selective Serotonin Reuptake Inhibitor Fluvoxamine on Voltage-Dependent K(+) Channels in Rabbit Coronary Arterial Smooth Muscle Cells. Biol. Pharm. Bull. 2015, 38, 1208–1213. [Google Scholar] [CrossRef]
- Albert, R.a.R.R. Signaling Networks: Asynchronous Boolean Models, In Algebraic and Discrete Mathematical Methods for Modern Biology; Robeva, R.S., Ed. Academic Press: Boston, 2015; pp. 65–91. [Google Scholar]
- Pezzulo, G.; LaPalme, J.; Durant, F.; Levin, M. Bistability of somatic pattern memories: stochastic outcomes in bioelectric circuits underlying regeneration. Philos Trans R Soc Lond B Biol Sci 2021, 376, 20190765. [Google Scholar] [CrossRef] [PubMed]
- Lobikin, M.; Chernet, B.; Lobo, D.; Levin, M. Resting potential, oncogene-induced tumorigenesis, and metastasis: the bioelectric basis of cancer in vivo. Phys Biol 2012, 9, 065002. [Google Scholar] [CrossRef] [PubMed]
- Singer, M.L.; Oreschak, K.; Rhinehart, Z.; Robison, B.D. Anxiolytic effects of fluoxetine and nicotine exposure on exploratory behavior in zebrafish. PeerJ 2016, 4, e2352. [Google Scholar] [CrossRef] [PubMed]
- Marcon, M.; Herrmann, A.P.; Mocelin, R.; Rambo, C.L.; Koakoski, G.; Abreu, M.S.; Conterato, G.M.; Kist, L.W.; Bogo, M.R.; Zanatta, L.; et al. Prevention of unpredictable chronic stress-related phenomena in zebrafish exposed to bromazepam, fluoxetine and nortriptyline. Psychopharmacology (Berl) 2016, 233, 3815–3824. [Google Scholar] [CrossRef]
- Giacomini, A.C.V.V.; Abreu, M.S.; Giacomini, L.V.; Siebel, A.M.; Zimerman, F.F.; Rambo, C.L.; Mocelin, R.; Bonan, C.D.; Piato, A.L.; Barcellos, L.J.G. Fluoxetine and diazepam acutely modulate stress induced-behavior. Behav Brain Res 2016, 296, 301–310. [Google Scholar] [CrossRef]
- Al Shuraiqi, A.; Abed, R.M.M.; Al-Habsi, A.; Barry, M.J. Personality Affects Zebrafish Response to Sertraline. Environmental toxicology and chemistry / SETAC 2024, 43, 132–146. [Google Scholar] [CrossRef]
- Mahase, E. Sertraline is better at reducing anxiety than depressive symptoms. Bmj-British Medical Journal 2019, 366, l5655. [Google Scholar] [CrossRef]
- Hirschfeld, R.M. Sertraline in the treatment of anxiety disorders. Depress. Anxiety 2000, 11, 139–157. [Google Scholar] [CrossRef]
- Manassis, K.; Bradley, S. Fluoxetine in anxiety disorders. J. Am. Acad. Child Adolesc. Psychiatry 1994, 33, 761–762. [Google Scholar] [CrossRef]
- Ofoegbu, P.U.; Campos, D.; Soares, A.; Pestana, J.L.T. Combined effects of NaCl and fluoxetine on the freshwater planarian, Schmidtea mediterranea (Platyhelminthes: Dugesiidae). Environ Sci Pollut Res Int 2019, 26, 11326–11335. [Google Scholar] [CrossRef]
- Ofoegbu, P.U.; Lourenco, J.; Mendo, S.; Soares, A.; Pestana, J.L.T. Effects of low concentrations of psychiatric drugs (carbamazepine and fluoxetine) on the freshwater planarian, Schmidtea mediterranea. Chemosphere 2019, 217, 542–549. [Google Scholar] [CrossRef] [PubMed]
- Chan, J.D.; Agbedanu, P.N.; Zamanian, M.; Gruba, S.M.; Haynes, C.L.; Day, T.A.; Marchant, J.S. 'Death and axes': unexpected Ca(2)(+) entry phenologs predict new anti-schistosomal agents. PLoS Pathog 2014, 10, e1003942. [Google Scholar] [CrossRef]
- Montgomery, S.A.; McIntyre, A.; Osterheider, M.; Sarteschi, P.; Zitterl, W.; Zohar, J.; Birkett, M.; Wood, A.J. A double-blind, placebo-controlled study of fluoxetine in patients with DSM-III-R obsessive-compulsive disorder. The Lilly European OCD Study Group. Eur. Neuropsychopharmacol. 1993, 3, 143–152. [Google Scholar] [CrossRef]
- Puscian, A.; Winiarski, M.; Leski, S.; Charzewski, L.; Nikolaev, T.; Borowska, J.; Dzik, J.M.; Bijata, M.; Lipp, H.P.; Dziembowska, M.; et al. Chronic fluoxetine treatment impairs motivation and reward learning by affecting neuronal plasticity in the central amygdala. Br J Pharmacol 2021, 178, 672–688. [Google Scholar] [CrossRef]
- Menezes, E.C.; Shah, R.; Laughlin, L.; Vinod, K.Y.; Smiley, J.F.; Cunha, C.; Balla, A.; Sershen, H.; Castellanos, F.X.; Corvelo, A.; et al. Reduced Motivation in Perinatal Fluoxetine-Treated Mice: A Hypodopaminergic Phenotype. J Neurosci 2021, 41, 2723–2732. [Google Scholar] [CrossRef]
- Levin, M. Bioelectric networks: the cognitive glue enabling evolutionary scaling from physiology to mind. Anim Cogn 2023, 26, 1865–1891. [Google Scholar] [CrossRef] [PubMed]
- Wang, L.; Walker, B.L.; Iannaccone, S.; Bhatt, D.; Kennedy, P.J.; Tse, W.T. Bistable switches control memory and plasticity in cellular differentiation. Proc Natl Acad Sci U S A 2009, 106, 6638–6643. [Google Scholar] [CrossRef]
- Nishimura, K.; Kitamura, Y.; Inoue, T.; Umesono, Y.; Yoshimoto, K.; Takeuchi, K.; Taniguchi, T.; Agata, K. Identification and distribution of tryptophan hydroxylase (TPH)-positive neurons in the planarian Dugesia japonica. Neurosci Res 2007, 59, 101–106. [Google Scholar] [CrossRef] [PubMed]
- Saitoh, O.; Yuruzume, E.; Nakata, H. Identification of planarian serotonin receptor by ligand binding and PCR studies. Neuroreport 1996, 8, 173–178. [Google Scholar] [CrossRef]
- Creti, P.; Capasso, A.; Grasso, M.; Parisi, E. Identification of a 5-HT1A receptor positively coupled to planarian adenylate cyclase. Cell Biol Int Rep 1992, 16, 427–432. [Google Scholar] [CrossRef]
- Cho, M.; Nayak, S.U.; Jennings, T.; Tallarida, C.S.; Rawls, S.M. Predator odor produces anxiety-like behavioral phenotype in planarians that is counteracted by fluoxetine. Physiology & Behavior 2019, 206, 181–184. [Google Scholar] [CrossRef]
- Welsh, J.H.; Williams, L.D. Monoamine-containing neurons in planaria. J Comp Neurol 1970, 138, 103–115. [Google Scholar] [CrossRef] [PubMed]
- Umesono, Y.; Tasaki, J.; Nishimura, Y.; Hrouda, M.; Kawaguchi, E.; Yazawa, S.; Nishimura, O.; Hosoda, K.; Inoue, T.; Agata, K. The molecular logic for planarian regeneration along the anterior-posterior axis. Nature 2013, 500, 73–76. [Google Scholar] [CrossRef] [PubMed]
- Iglesias, M.; Gomez-Skarmeta, J.L.; Salo, E.; Adell, T. Silencing of Smed-betacatenin1 generates radial-like hypercephalized planarians. Development 2008, 135, 1215–1221. [Google Scholar] [CrossRef] [PubMed]
- Petersen, C.P.; Reddien, P.W. Smed-betacatenin-1 is required for anteroposterior blastema polarity in planarian regeneration. Science 2008, 319, 327–330. [Google Scholar] [CrossRef] [PubMed]
- Fields, C.; Bischof, J.; Levin, M. Morphological Coordination: A Common Ancestral Function Unifying Neural and Non-Neural Signaling. Physiology (Bethesda) 2020, 35, 16–30. [Google Scholar] [CrossRef]
- Lagasse, E.; Levin, M. Future medicine: from molecular pathways to the collective intelligence of the body. Trends Mol Med 2023, 29, 687–710. [Google Scholar] [CrossRef]

Disclaimer/Publisher’s Note: The statements, opinions and data contained in all publications are solely those of the individual author(s) and contributor(s) and not of MDPI and/or the editor(s). MDPI and/or the editor(s) disclaim responsibility for any injury to people or property resulting from any ideas, methods, instructions or products referred to in the content. |
© 2024 by the authors. Licensee MDPI, Basel, Switzerland. This article is an open access article distributed under the terms and conditions of the Creative Commons Attribution (CC BY) license (http://creativecommons.org/licenses/by/4.0/).


