1. Introduction
1.1. Background
The COVID-19 pandemic has led to widespread mental health issues, including depression, anxiety, and loneliness. Dubé et al. [
1] found a strong link between pandemic-induced social problems and negative emotional behaviors such as depression. As the pandemic eased, social media became a common way to seek comfort and connection, offering low-cost, flexible, and unrestricted interaction, thus significantly enhancing interpersonal connections [
2]. The World Health Organization (WHO) has designated October 10th each year as “World Mental Health Day” to emphasize the importance of mental health in shaping our thoughts, feelings, and behaviors. The day encourages people globally to foster positive, relaxed, and constructive emotions [
3].
As AI evolves, high-efficiency computing alone no longer meets user needs. Users increasingly seek machines that can understand emotions, driving demand for emotional sensing technology.
Affective computing, an interdisciplinary field involving physiology, sociology, cognitive science, mathematics, psychology, linguistics, and computer science, holds significant research value. It uses various electronic materials to sense and collect emotional data from voices, facial expressions, and behaviors, creating systems for emotion recognition [
4].
Collins [
5] proposes in his interaction ritual chains theory that rituals are normative behaviors that foster mutual attention and emotional resonance through rhythmic interactions. This theory demonstrates that both the content and context of interactions influence the overall experience. When combined with sociological theories, it reveals that interactions involve emotions, which subsequently generate a series of rituals [
6].
Users’ cognitive psychology influences their interaction behaviors, with emotional factors playing a significant role. Empathy and machines’ understanding of human emotions are becoming integral to modern life [
7]. Affective computing systems improve interaction experiences by understanding users’ psychological states, highlighting the need for a human-centered approach. MIT Media Lab research shows that affective computing enhances self-awareness, communication, and stress reduction [
8]. As an emerging technology, affective computing offers real-time status detection and personalized services. It is aimed in this study to integrate affective computing into interpersonal interactions, providing timely assistance and decision-making to enhance the quality of people’s life.
Machine sensing methods fall into three categories: (1) Facial image-based sensing, such as eye trackers, which distinguish facial features from noise; (2) Voice and brainwave recognition, enhancing the reliability of physiological information beyond visual data; and (3) Object detection sensors, like infrared sensors, which use multi-sensing approaches to optimize human-machine interaction and feedback [
9].
Affective computing analyzes human social behaviors and emotional information to provide appropriate feedback through human-machine interaction [
10]. People use gestures and language for daily communication, and combining these modes offers high usability. Gestures can convey commands that are difficult to express verbally, simplifying and enhancing remote human-machine collaboration [
11].
In summary, the aim of this study is to integrate affective computing with multi-sensing interactive interface technology to propose an emotion-aware interactive system characterized by pleasure, interactivity, and usability. The system will be tested in interpersonal interaction scenarios within smart living contexts to assess whether the criteria for usability, interactivity, and pleasantness are met.
1.2. Research Motivation
The COVID-19 pandemic has restricted global activities, boosting demand for online digitalization and shifting most interactions to virtual forms [
12]. This has accelerated the development of physical digitization and contactless methods, overcoming time and space limitations. As the post-pandemic situation stabilizes, new interaction models, both proximate and remote, have emerged. Mixed-reality multi-sensing interfaces are subtly transforming daily life experiences.
Advances in artificial intelligence have strengthened the link between humans and smart technology, highlighting the growing importance of affective computing. There is increasing focusing on ensuring interactions to be friendly and enjoyable, with human-machine collaboration aimed at delivering warmer, higher-quality services.
According to Coherent Market Insights [
13], the affective computing market, valued at
$36.32 billion in 2021, is projected to reach
$416.9 billion by 2030, with a compound annual growth rate of 31.5% from 2022 to 2030. The shift from rational to emotional user needs is driving leading technology companies to focus on the use of computational data for product design, a trend expected to continue.
Through interactions within specific contexts, novel situations and emotions can be evoked, creating fresh meanings. Human-machine interaction mechanisms are aimed to be established in this study using theories such as Interaction Ritual Chains and Situational Awareness. Leveraging the rise of affective computing technology, emotions are intended to be identified and recorded through interactions. Machine recognition of human emotions will be explored to enable diverse feedback tailored to different outcomes, enhancing personalized experiences and promoting greater self-awareness. It is noted that current designs of voice interaction systems utilizing multi-sensing technology are still limited.
Furthermore, it has been noted that emotional exchanges in Computer-Mediated Communication (CMC) environments are more frequent and clearer than in face-to-face (F2F) settings, with positive emotions being effectively amplified. Social media also enhances human interactions by offering low cost, flexible norms, and removing spatial and temporal constraints.
In summary, this study is aimed at developing a design system to enhance positive emotions in interpersonal interactions through the described mechanisms and to further investigate emotion transmission in communication. he integration of voice recognition into interaction patterns will also be explored to propose a novel system combining multi-sensing interactive interfaces with affective computing. The system will be applied to various smart living scenarios.
1.3. Research Problems and Purposes
In this study, the literature analysis has revealed that few interactive systems combine multi-sensing interaction with affective computing technologies. The issue of translating and reproducing users’ complex emotions by collecting emotional data from their interactions is to be explored. The goal is to help users better understand their own emotions through the system, making the experience more intuitive and relevant.
The questions studied in this research are as follows.
- (1)
How can the integration of multi-sensing interaction and affective computing technologies enhance interpersonal relationships?
- (2)
Does constructing an interactive system based on multi-sensing interaction and affective computing technologies strengthen positive interpersonal communication experiences and stimulate positive emotion transmission?
- (3)
Can the features of multi-sensing interaction and affective computing technologies improve the pleasantness of the interaction experience?
In this study, it is aimed to explore how to create pleasant interactive experiences for users through theoretical exploration and case analysis. An interactive system based on multi-sensing interfaces and affective computing technology is to be developed to enhance interpersonal interactions. Additionally, interaction mechanisms are to be investigated to promote positive emotional effects and examine emotion transmission in interpersonal interactions.
The research objectives are as follows.
- (1)
To analyze cases of multi-sensing interaction and affective computing, and summarize design principles for the proposed interactive system.
- (2)
To develop an emotion-aware interactive system that enhances positive interpersonal relationships.
- (3)
To evaluate whether the system effectively makes users feel pleasant and relaxed.
1.4. Research Scope and Limitations
In this study, the investigation will focus on interactive experiences using multi-sensing interfaces and affective computing. The scope and limitations are as follows:
- (1)
Voice recognition and Leap Motion gesture sensing are selected as the primary multi-sensing interfaces.
- (2)
Explore emotion recognition in interactive experiences will be explored, but the development of semantic analysis technologies will not be addressed.
- (3)
The designed multi-sensing system will be tested with users who have intact limbs, good auditory and visual abilities, and understand typical interpersonal interactions, specifically targeting active users aged 18 to 34.
1.5. Research Process
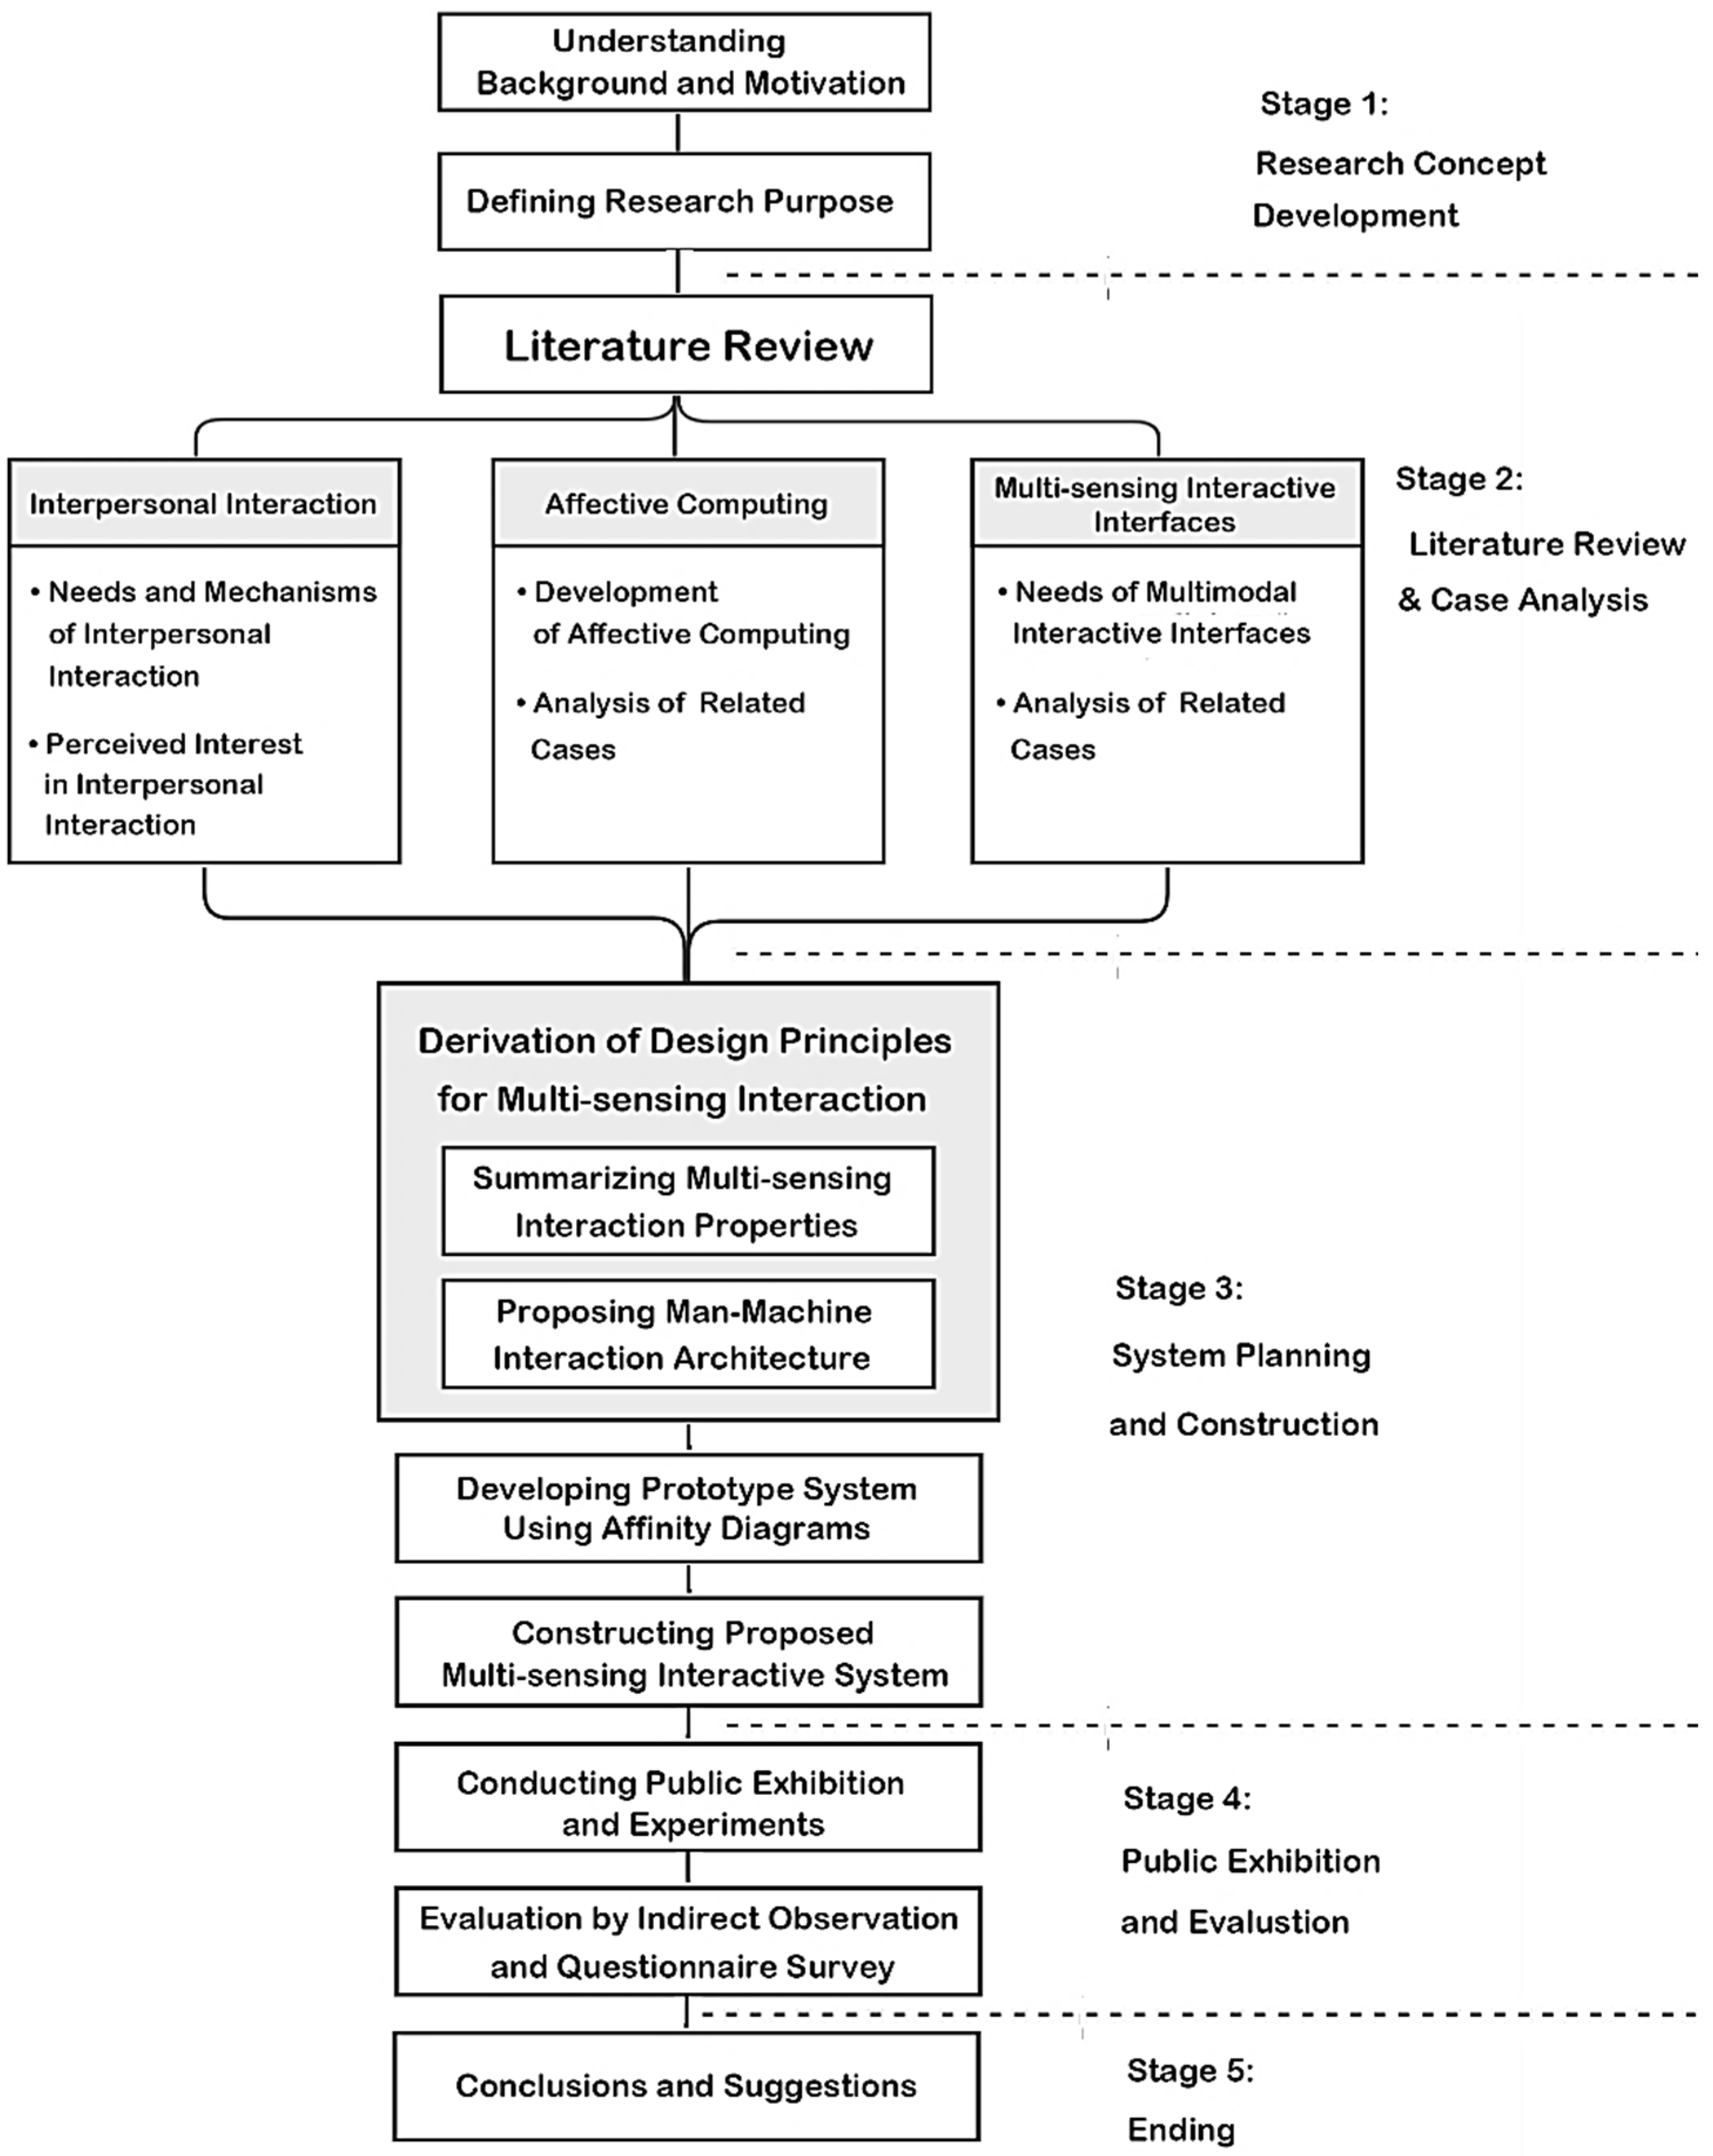
The research process, illustrated in
Figure 1, is divided into five stages, with each stage’s details described below.
Research process of this study -
- (1)
Stage 1 - Research concept development:
(1.1) Understanding the research background and motivation.
(1.2) Defining the research purpose.
- (2)
Stage 2 - Literature review and case analysis:
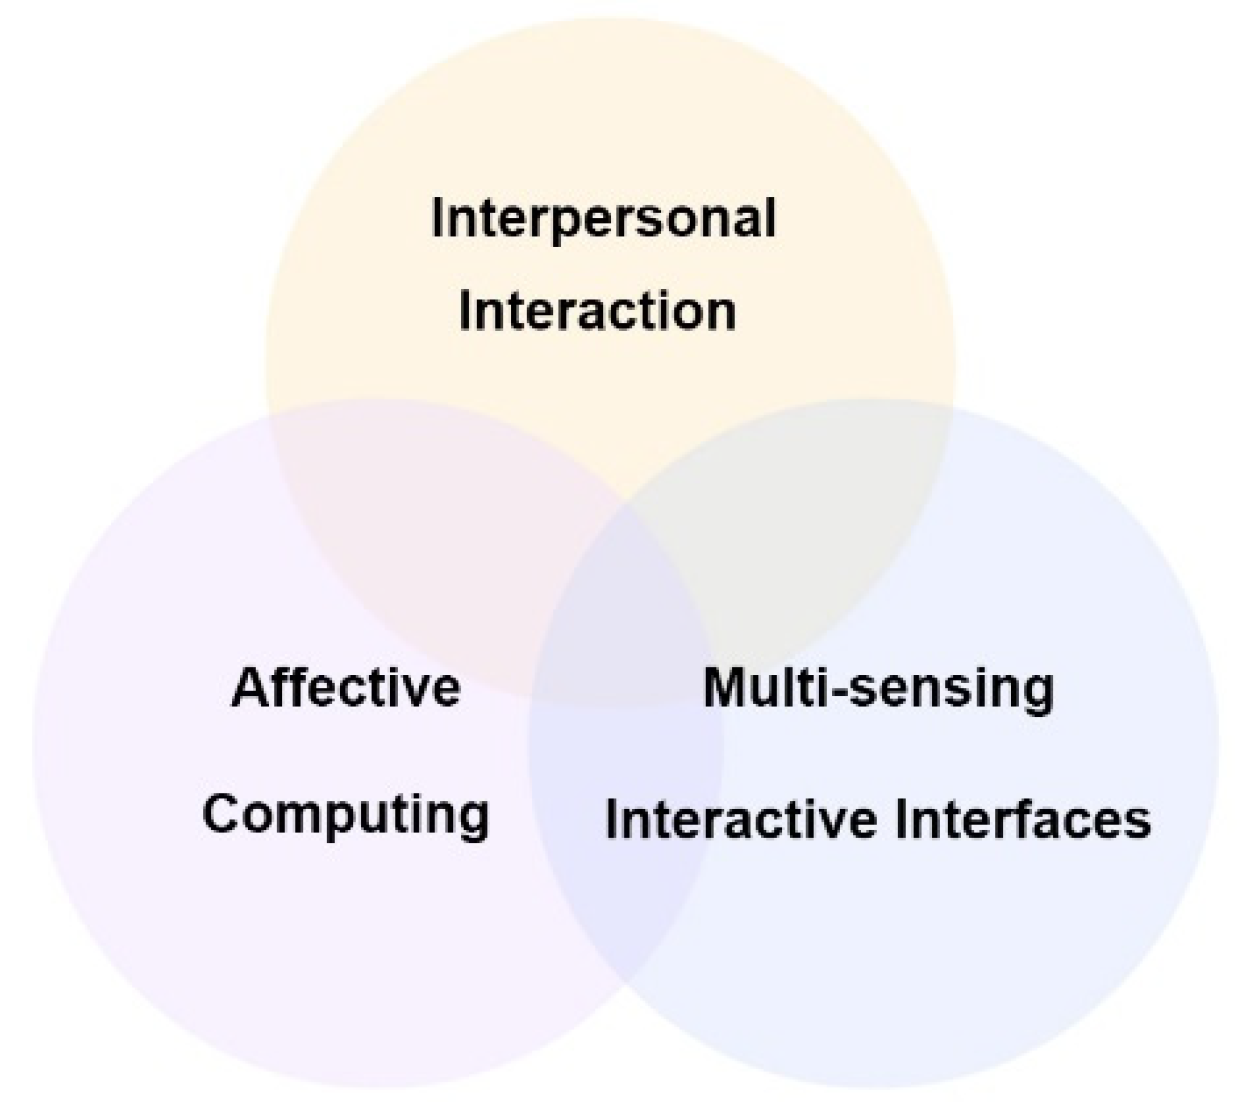
Conducting analysis in three main areas: interpersonal interaction, affective computing, and multi-sensing interactive interfaces, as shown in
Figure 2.
- (3)
Stage 3 – System planning and construction:
(3.1) Deriving design principles for multi-sensing interaction, including summarizing properties and proposing man-machine interaction architecture.
(3.2) Developing a prototype system using affinity diagrams.
(3.3) Constructing the final multi-sensing interactive system.
- (4)
Stage 4 – Exhibition and evaluation:
(4.1) Conducting public exhibition and experiments.
(4.2) Evaluating the proposed system by the methods of affinity diagrams and questionnaire survey.
- (5)
Stage 5 – Ending:
Drawing conclusions and making suggestions for future research.
Figure 2.
Main areas for the literature review and research in this study.
Figure 2.
Main areas for the literature review and research in this study.
3. Methodology
3.1. Selection of Research Methods
The research methods used in this study are the
affinity diagram method,
prototype development,
indirect observation, and
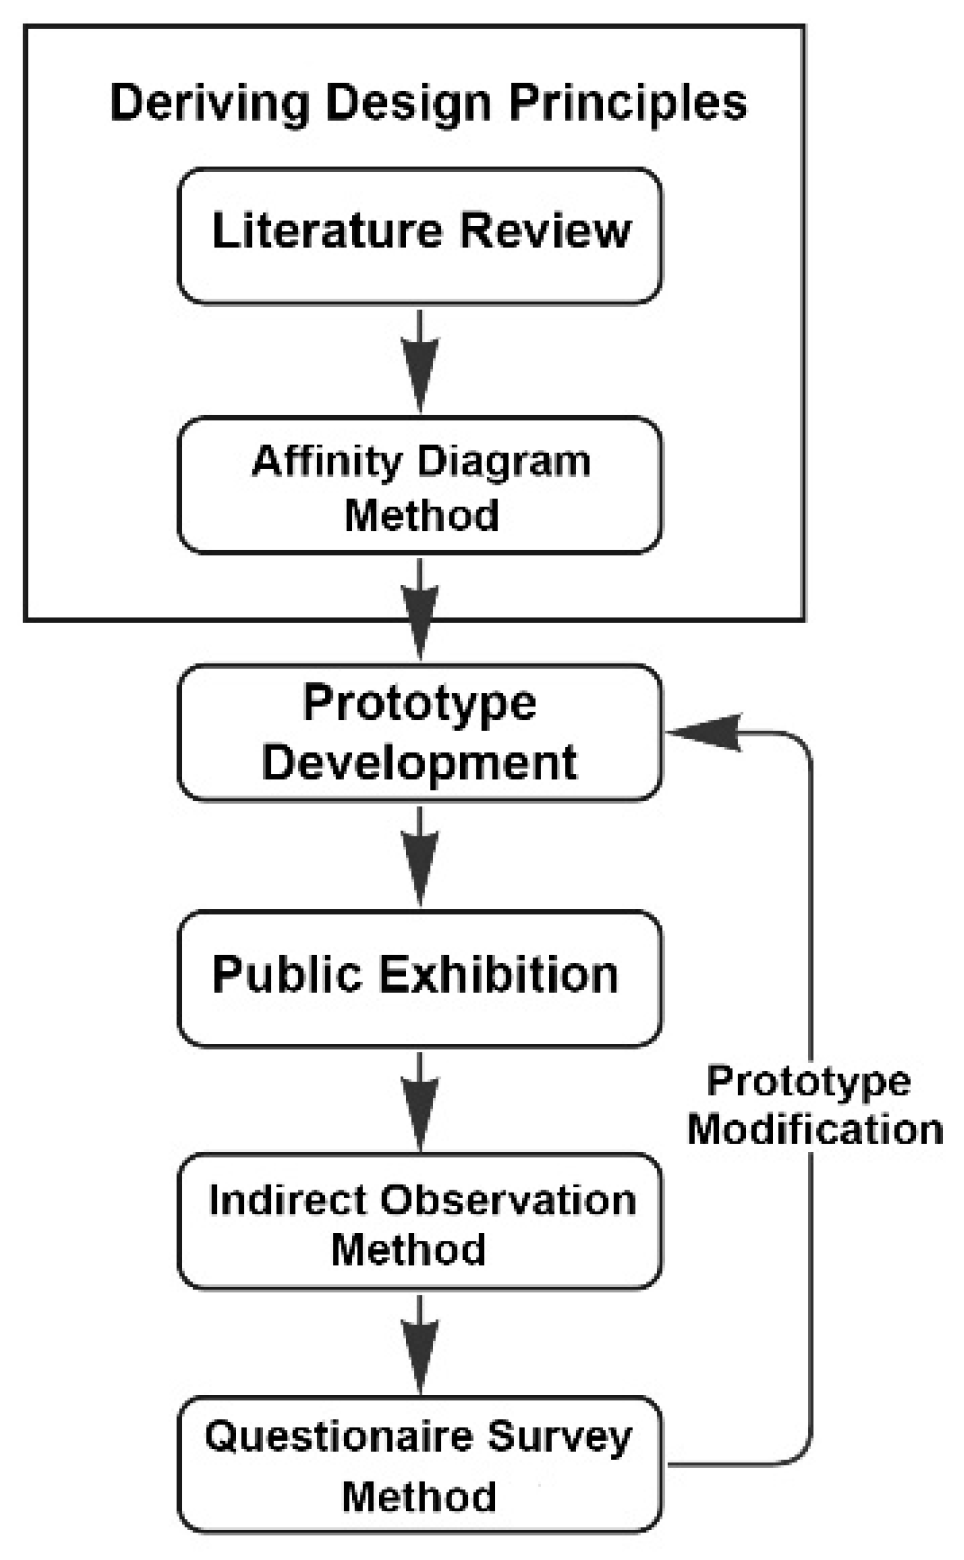
questionnaire surveys. The applications of these methods in this study are illustrated in
Figure 9.
The research process began with a literature review to analyze interpersonal interactions, affective computing, and multimodal interactive interfaces, which led to the formulation of the initial design principles for this study. The affinity diagram method was then applied to discuss and refine these principles based on user feedback. A prototype system was developed accordingly and tested through public demonstrations. Finally, the indirect observation and questionnaire survey methods were used to gather insights on user behavior and emotions, which informed further analysis and prototype refinement.
3.2. The Affinity Diagram Method
3.2.1. Idea of Using the Affinity Diagram Method
The affinity diagram method, or KJ Method, introduced by Japanese ethnologist Jiro Kawakita in 1960 [93], is widely used in human-computer interaction research. This technique organizes diverse and unstructured qualitative data related to products, processes, or complex issues by grouping observations based on similarities or dependencies [93,94,95]. Originally applied to synthesize field survey data and generate new hypotheses, the method is now commonly used to analyze contextual inquiry data and guide the design process, providing a qualitative foundation for decision-making [96,97].
The affinity diagram method, utilized primarily in the early stages of the design process, is employed in this study to define and analyze interactive prototypes. Initially, the target user group is identified, and user personas are developed to guide core research needs. Participants then generate descriptive attributes for the target user group on sticky notes, sharing their insights on these users [98,99].
Based on cutting-edge desktop research and literature, six target users utilized the AEIOU framework—focusing on the topics of Activity, Environment, Interaction, Object, and User [100]—to conduct “design thinking” and explore innovative solutions. The clustered data from this process is organized and presented in this study. Qualitative insights, including pain points and core needs of the target user profiles, were identified. Additionally, persona and empathy map design methods were employed to further structure the context and develop detailed user profiles and scenarios, as described in the following sections.
(1) Persona -
The persona concept, introduced by Cooper [101], involves creating virtual characters to represent user groups with specific attributes. Since then, many leading companies have adopted this method. Personas offer a user-centric view, bridging the gap between designers and users. Cooper and Reimann [102] highlighted three key benefits: (1) providing human-centered insights that reduce the designer-user gap, (2) fostering shared understanding and consensus in teams, and (3) enabling precise targeting of user groups, thus improving development efficiency.
(2) Empathy map -
The empathy map, a user-centered design (UCD) method, helps clearly understand user interactions and core needs by empathizing with their situations. It supports software development by validating features through user perspectives [103]. In the design thinking process, the empathy stage involves analyzing stakeholder perspectives to grasp pain points, needs, and expectations. This creates visual clues and application trends based on contextual data [104]. Ferreira et al. [105] noted that empathy maps are well-regarded in software engineering. The map includes six sections: (1) See: what the user observes; (2) Say & Do: user’s verbal expressions and behaviors; (3) Think & Feel: internal experiences and emotions; (4) Hear: environmental influences; (5) Pain: frustrations or difficulties; and (6) Gain: user goals. Empathy maps are effective for depicting and creating target user personas.
3.2.2. Application in This Study and Brainstorming Result
This study utilizes the Affinity Diagram Method to consolidate information from personas and empathy maps, integrating them with the “Job-to-be-Done” (JTBD) framework. The JTBD framework, originating from innovation and entrepreneurship, explores the cognitive psychology and emotional states that drive user behavior. Its goal is to uncover users’ primary motivations and core needs, which is essential for creating designs that are both appropriate and satisfying. By analyzing who (users), what (tasks), how (methods), why (motivation), when (timing), and where (context), the JTBD framework facilitates a thorough contextual investigation. JTBD focuses on three main indicators: (1) Functional: How users perform or approach tasks; (2) Social: The impact of user interactions with others; and (3) Emotional: Users’ feelings and experiences during tasks.
These indicators help in developing a North Star Metric to understand pain points deeply and identify innovative solutions. Overall, comprehending users’ basic needs and core tasks enables the creation of a user-centered design (UCD) experience that meets expectations [106,107,108,109,110,111,112]. In this study, the JTBD framework is used to categorize brainstorming data, while the affinity diagram method consolidates extensive research data for user journey mapping and scenario storytelling.
In this study, six target users formed a co-creation group to brainstorm and use the affinity diagram method for organizing data. This process aimed to gather diverse opinions, ideas, and experiences in a non-judgmental manner, fostering creative thinking and guiding collaborative actions toward consensus. Three core themes emerged from this investigation as described in the following.
(1) Daily life relevance: Ensuring shared understanding among users.
(2) Open and flexible discussion space: Stimulating user inspiration.
(3) Emotional resonance: Providing a comforting and relaxing experience.
The brainstorming results helped shape user profiles and scenarios, focusing on students aged 18 and above. By leveraging these core themes, the study aims to enhance interpersonal communication. The research introduces the theme “what superpowers users wish to have,” allowing users to freely express their opinions or address issues they want to solve with superpowers. The interactive system developed provides a platform for users to express emotions and explore emotional exchanges in interpersonal interactions.
3.3. The Prototype Development Method
Bernard (1984) defined prototype design as a modeling method that efficiently captures user feedback and defines strategies for user needs with minimal time and cost. This method supports iterative refinements, enhancing system development maturity. Hornbæk and Stage [113] highlighted user testing as a common method for evaluating early prototypes, where users interact with the system to provide feedback, guiding design improvements. According to Bernhaupt et al. [114], evaluation testing aims to gather user feedback on usability and experiences, facilitating iterative design refinements. Bernard [115] further noted that this approach improves system output accuracy and aids decision-making, thus supporting systematic prototype development [116].
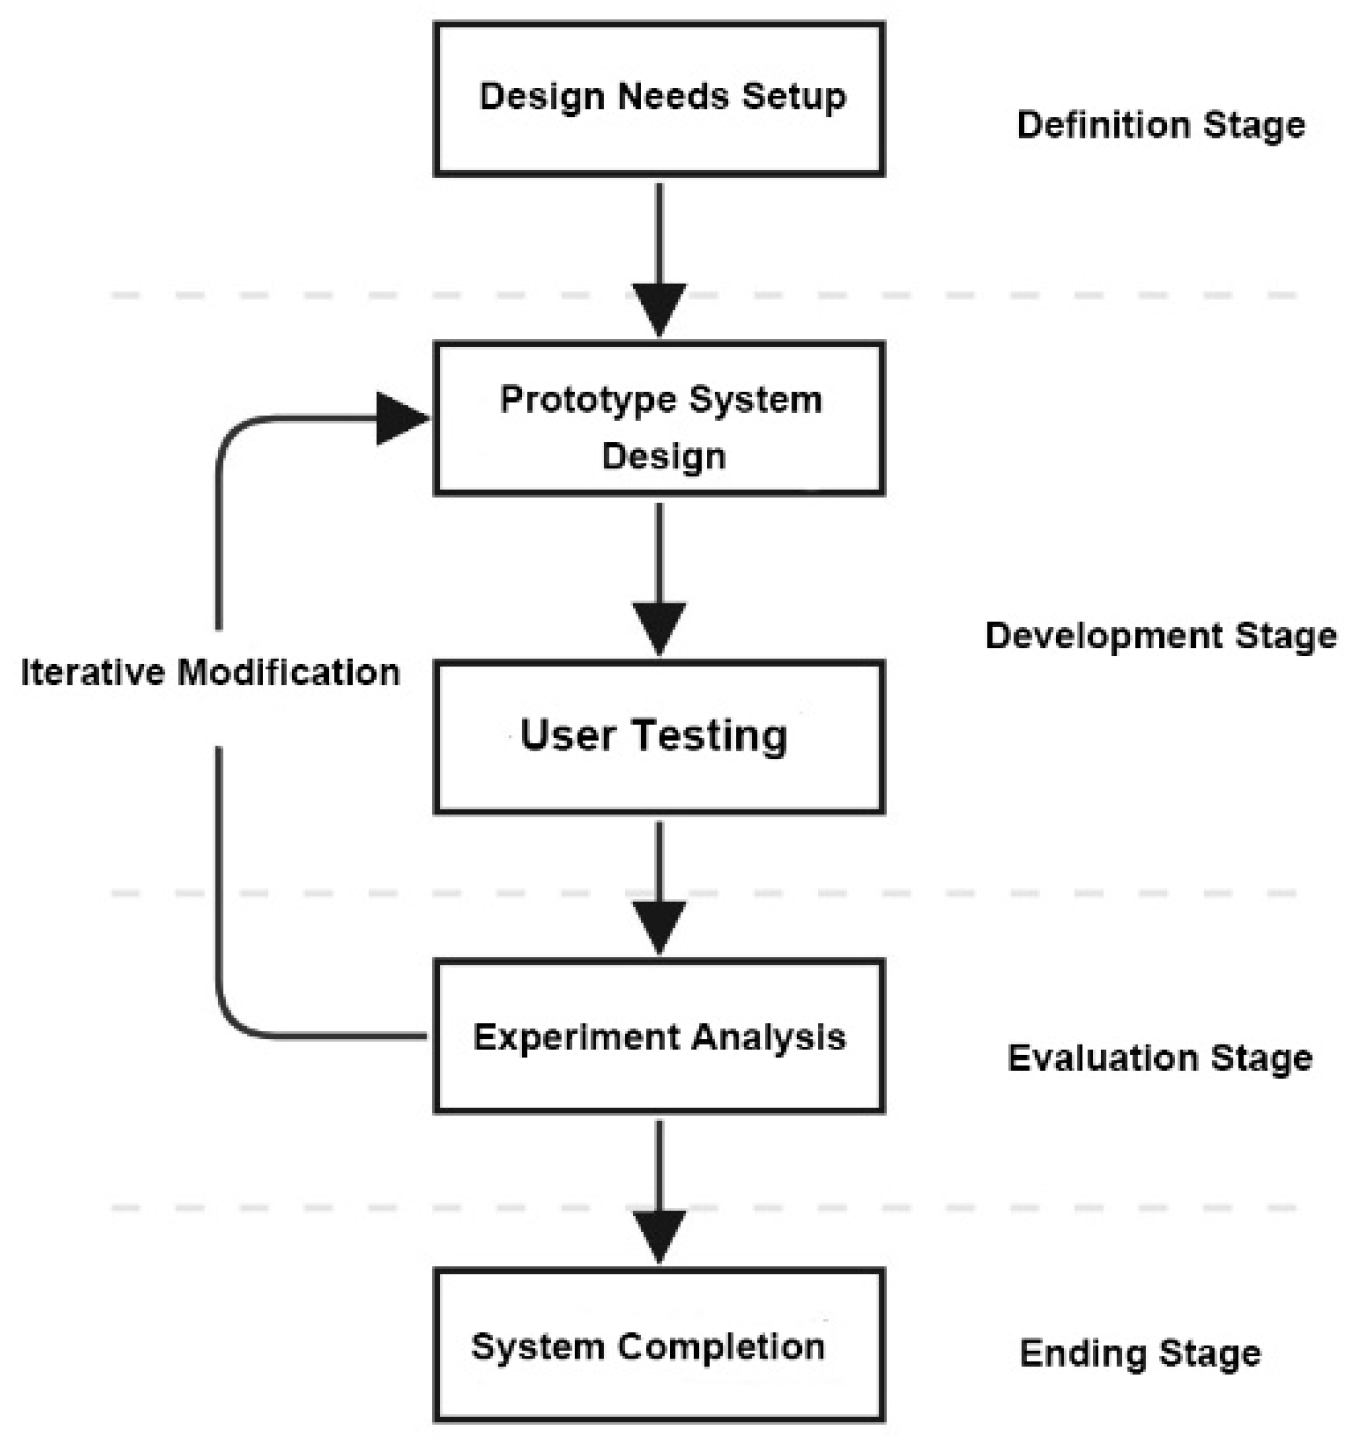
In this study, five steps based on multi-sensing interactive interfaces and affective computing are taken to develop a prototype system, as described in the following and shown in
Figure 10.
- (1)
Defining stage - Defining the design needs for the system to be constructed.
- (2)
-
Development stage –
- (2.1)
Designing a prototype system based on the techniques of multi-sensing interactive interfaces and affective computing.
- (2.2)
Conducting user testing of the prototype system.
- (3)
-
Evaluation stage –
- (3.1)
Conducting experiment analysis.
- (3.2)
Iterating to Step (2.1) to modify the system whenever necessary.
- (4)
Ending stage - Completing the system development
3.4. Indirect Observation Method
Turner [117] highlights that positivist theory, founded by Auguste Comte, emphasizes objective observation as a core research method. Williamson [118] describes observation as both a research method and a data collection technique, while Baker [119] notes its complexity due to the varied roles and techniques required from researchers. Regardless of their involvement level, researchers must uphold objectivity to ensure accurate data collection and analysis. Validity is categorized into descriptive, interpretive, and theoretical types, with theoretical validity assessing how well theoretical explanations align with the data.
Bernhaupt et al. [114] found that objective observation can lead to deeper analysis and iterative system refinements. Future research may leverage observational data (such as images and sounds) or physiological sensing (like eye-tracking, skin conductivity, and EEG) to validate study effectiveness. Advancements in technology enhance indirect observation by improving data recording, communication, and storage, thus providing a flexible and rigorous method for capturing user insights and validating hypotheses [120].
Indirect observation offers the advantage of capturing users’ natural states without the need for researchers to be present for extended periods or intervene directly. This approach yields authentic, reliable data and is suitable for collecting a wide range of information, providing a more objective, comprehensive, and diverse perspective.
Indirect observation is employed in this study as a method for data collection, using natural and non-intrusive sensing of users’ physiological emotional characteristics during system interactions. It involves collecting and analyzing physiological emotional data such as semantic and EEG information. This method not only aids in understanding emotional transmission trends in interpersonal interaction contexts but also strengthens and validates the research.
3.5. Questionnaire Survey Method
3.5.1. Ideas and Applications of the Method
The questionnaire survey method is widely used for its reliability and effectiveness in collecting key data and information [121]. Designing surveys requires clear, straightforward language and avoids ambiguous or leading questions to ensure validity [122]. This method helps explore users’ views and attitudes, guiding subsequent prototype revisions. In this study, a questionnaire will be administered during the public exhibition period, utilizing a five-point Likert scale for evaluation.
The System Usability Scale (SUS), developed by Brooke [123], is a flexible Likert-type scale with ten straightforward items. It assesses user satisfaction with systems based on agreement levels and can be used for minor adjustments or comparative analysis of different systems. The SUS provides a quick measure of usability, focusing on effectiveness and efficiency [124,125].
In human-computer interaction research, Zhang and Adipat [126] identified “effectiveness,” “simplicity,” and “enjoyment” as key usability metrics for evaluating user experience with systems. Davis [
27] highlighted a correlation between perceived usefulness and perceived enjoyment in the technology acceptance model. Additionally, Schrepp et al. [
34] linked experiences of pleasure, excitement, and novelty to perceived enjoyment, suggesting that emotions can reflect aspects such as system effectiveness, reliability, and interactivity.
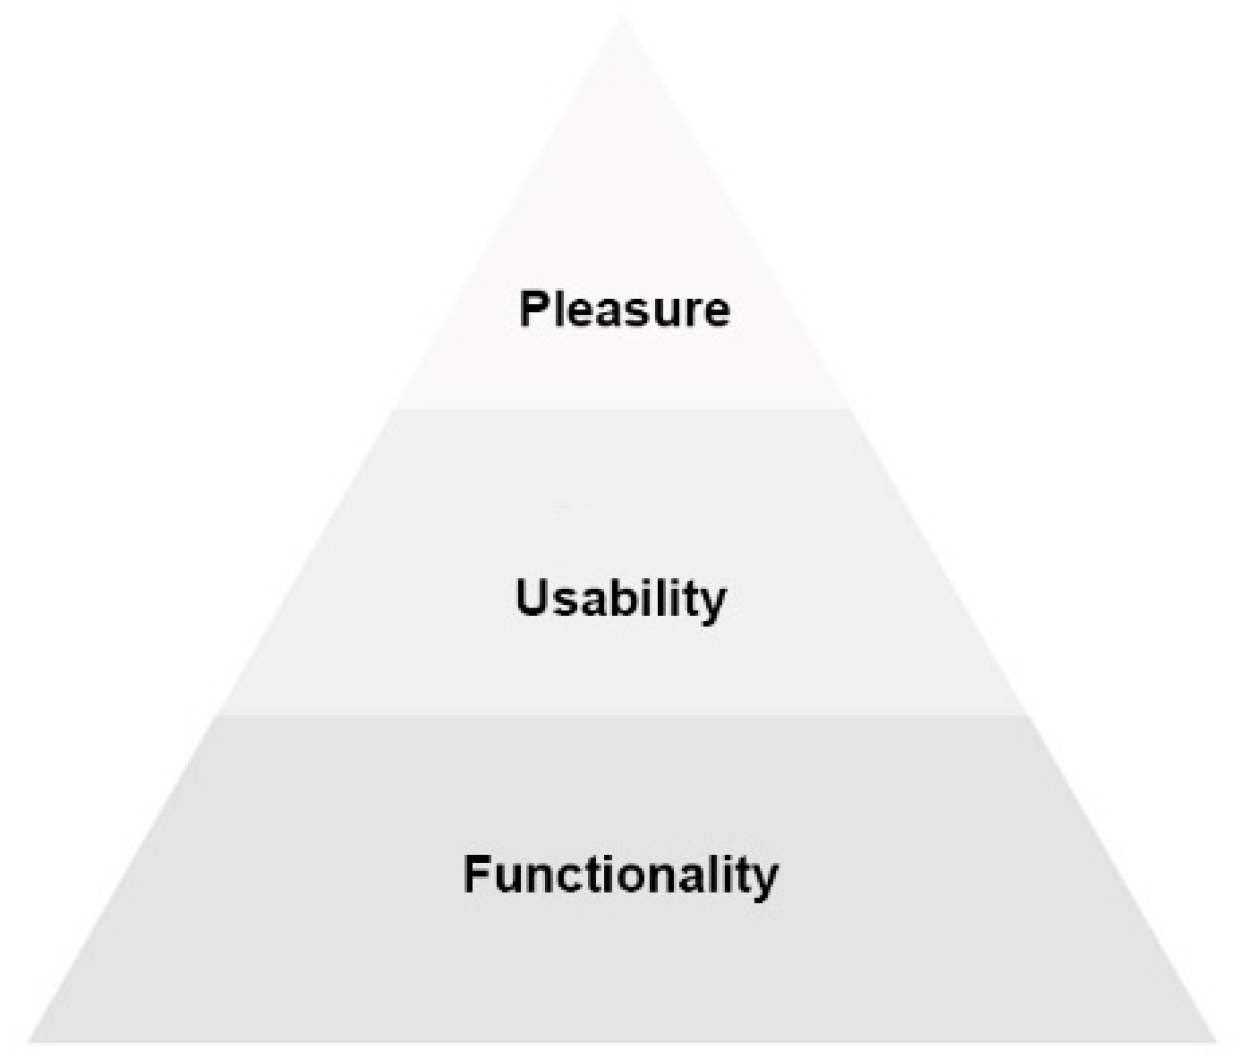
Tiger [127] identified four categories of pleasure derived from products: “physiological pleasure,” “social pleasure,” “psychological pleasure,” and “intellectual pleasure,” providing a nuanced framework for understanding different aspects of pleasurable experiences. Jordan [128] emphasized three challenges in studying pleasure: understanding users and their needs, linking product characteristics to pleasurable qualities, and developing quantifiable metrics for measuring pleasure. As shown in
Figure 11, Jordan [129] also proposed a hierarchical structure of user needs—functionality, usability, and pleasure—where functionality forms the base, usability is the next level, and pleasure represents the highest level, emerging once usability needs are met.
3.5.2. Purpose of Survey and Question Design
It is aimed in this study to assess through surveys how users enhance interpersonal interactions, contextual awareness, and emotional resonance with the system. Hassenzahl [130] proposed the Hedonic Quality Model, emphasizing that satisfaction arises from subjective experiences of design, with the relationship between usability and hedonic quality influenced by design and context. Hernández-Jorge et al. [131] analyzed emotional communication and found that creating a positive emotional atmosphere, caring about others’ feelings, and active listening are crucial for emotional interaction and communication. Expert validity may be employed to assess the survey’s effectiveness, focusing on content validity. This process involves selecting at least two knowledgeable experts, distributing the survey to them, collecting their feedback, and revising the survey based on their recommendations [132,133].
In summary, the dimensions of “system usability,” “interactive experience evaluation,” and “pleasure experience” are utilized for designing the questions used in the questionnaire survey in this study. The dimensions and questions of each dimension are detailed in
Table 7.
4. System Design
In this study, an interactive system called “Emotion Drift” is designed, utilizing multi-sensing interfaces and affective computing. This system explores emotional communication in interpersonal interactions by integrating inputs from various non-contact methods, including gestures and voice, extending beyond traditional input techniques. By combining affective computing technology, the system provides diverse audiovisual feedback based on the user’s emotional state. It offers a user experience that balances pleasure, interactivity, and usability through natural and intuitive interactions. Further details are provided in the following sections.
4.1. The Design Concept of the Proposed System
The COVID-19 pandemic has accelerated the global shift towards virtual social media interactions to minimize physical contact between individuals. As a result, digital interpersonal communication has become a primary mode of exchange in modern times. However, emotions are often conveyed alongside shared text and audio, leading to emotional resonance. To address and mitigate negative emotions that may arise during interactions, the proposed system has been designed with an emotional feedback mechanism, providing visualized outputs that empathize with users’ feelings.
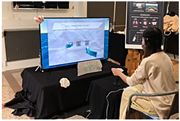
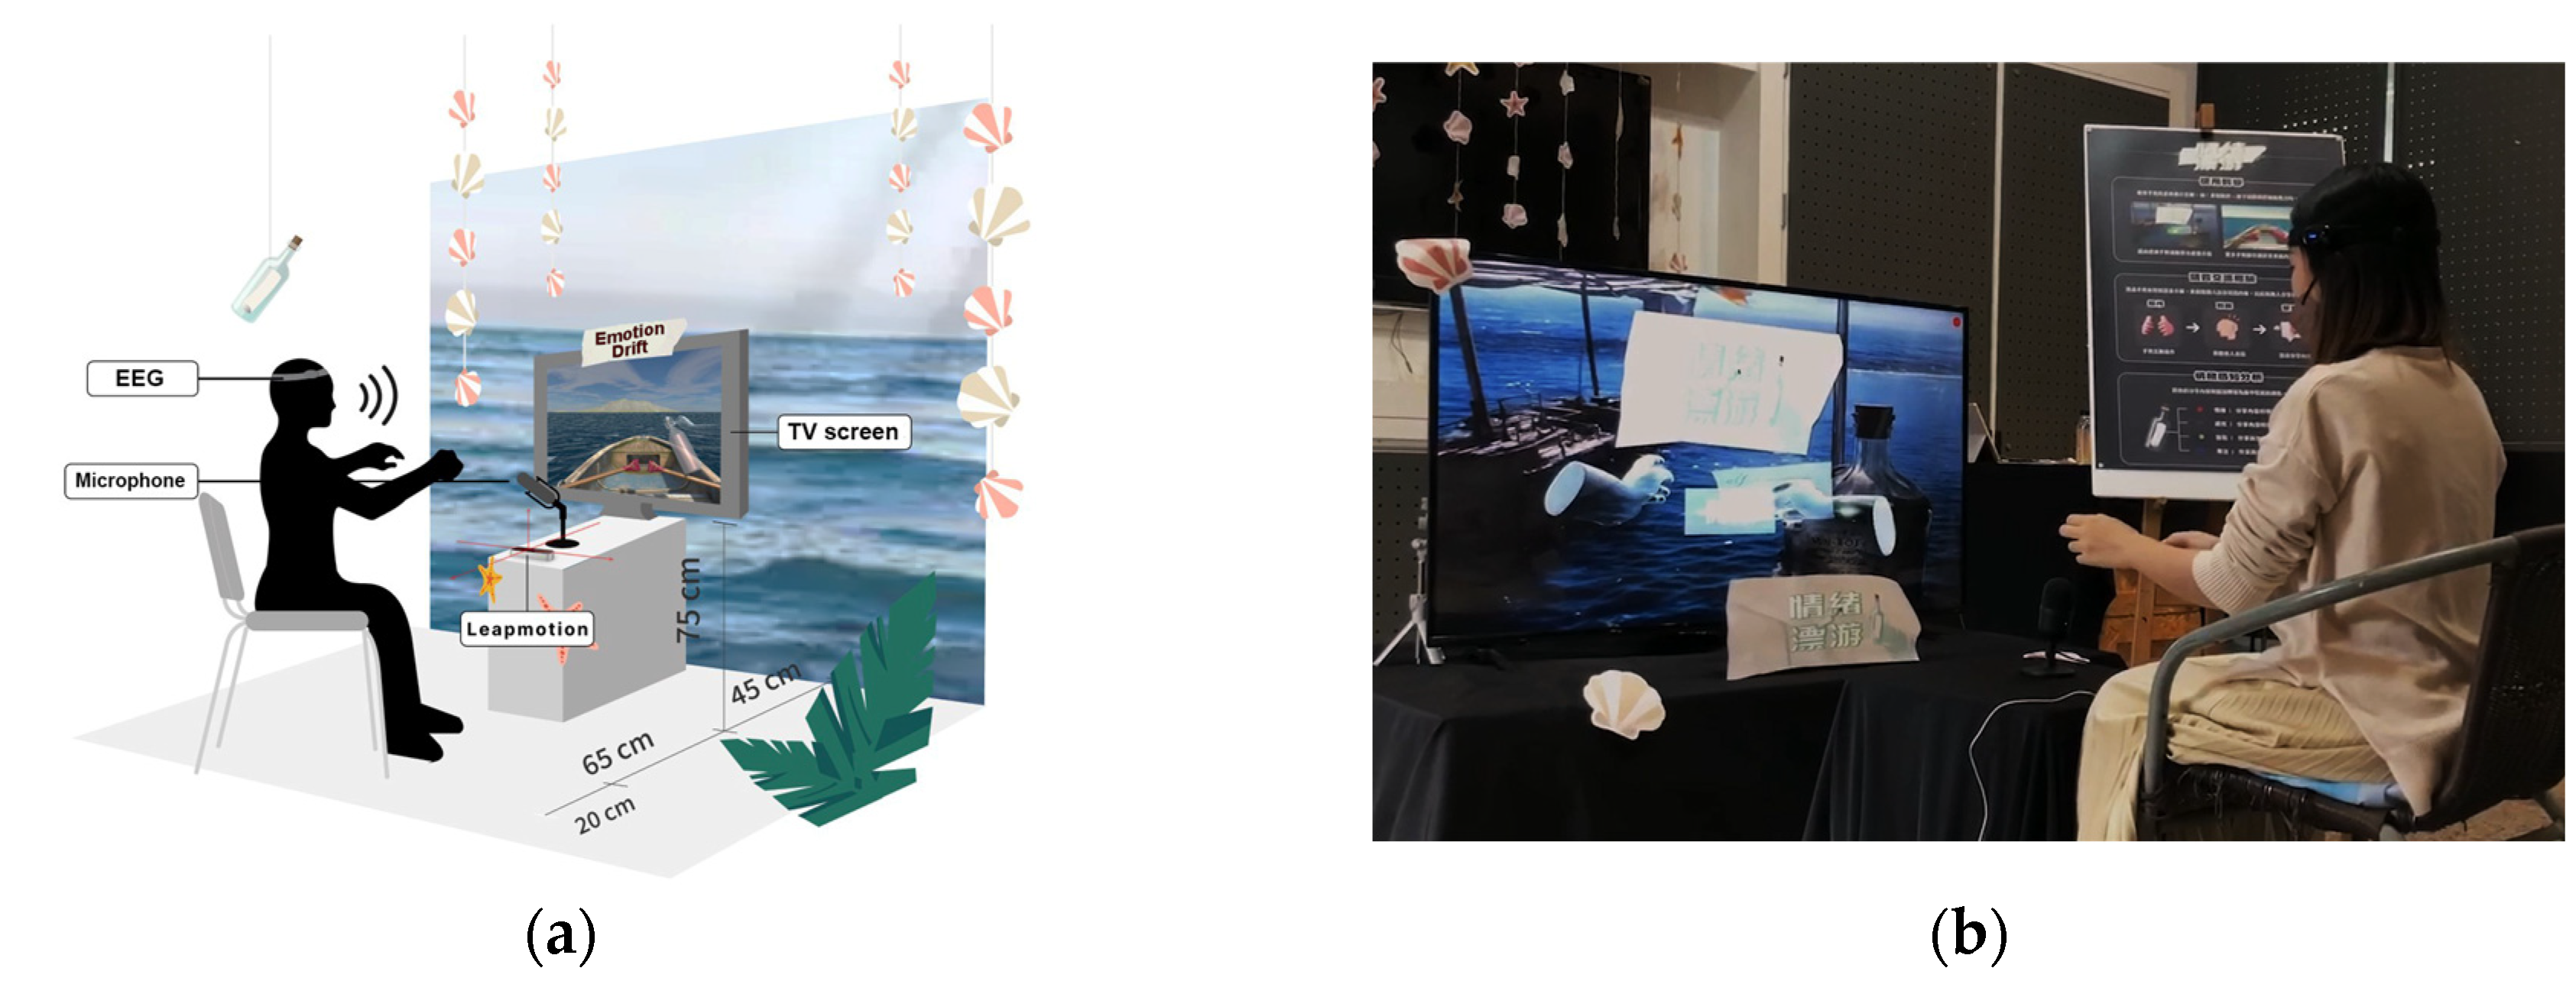
It is aimed in this study to offer timely emotional audiovisual feedback to users and observe emotional rendering phenomena during interactions. The goal is to improve social relationships by alleviating negative emotions through interpersonal sharing and communication, thereby enhancing emotional regulation, empathy, and strengthening relationships. The system “Emotion Drift” is designed to help users achieve these objectives, offering a high-quality and humane experience. An illustration of the proposed system and the performance environment is shown in
Figure 12.
The proposed Emotion Drift System constructs a world for asynchronous interpersonal communication, where emotions are thought to flow like “drifting bottles” — rising and falling with the intensity of winds and storms. Users can navigate imaginatively to isolated islands by “rowing” and pick up drifting bottles left by previous users to engage in deeper exchanges and interactions of emotions. These bottles symbolize a safe and private space for users to express their innermost thoughts.
However, because emotional communication should be fluid and historically recorded, the proposed Emotion Drift System is positioned as an emotional perception system. It invites users to enter others’ emotional worlds, sharing voices and expressing feelings together.
4.2. Design of the Multi-Sensing Interaction Process for the Proposed System
4.2.1. Idea of the Design
In this section, the interaction process using the proposed Emotion Drift System is explained. Users can awaken the system screen from standby mode through gestures, creating a pleasant and relaxing environment. While using the system, the user is imagined to be navigating a boat on a calm sea or river. The user controls the direction of the boat by rowing to explore the water space and pick up a drift bottle at indicated locations based on guidance.
Inside the bottle, the user finds four letters left by the previous user, each containing an answer to a question about “becoming a person with superpower.” The current user reads each letter, which is presented in both text and audio formats, and experiences the previous user’s thoughts on the question, as if interacting directly with the previous user. This process is repeated for all four letters.
Additionally, after listening to the previous user’s audio content, the current user can share his/her own thoughts with the drifting bottle, representing the previous user, to express understanding and empathy for the previous user’s feelings. The system also visualizes the current user’s emotional information, measured with an EEG device, creating graphic illustrations and textual meanings for review, thereby offering a user-centered interactive experience.
4.2.2. Detailed Description of the Interaction Process
More specifically, the interactive flow of the system is mainly divided into five stages: the guidance stage, the experience stage, the sharing input stage, the emotional review and output stage, and finally the ending stage, as illustrated by
Table 8 and described in detail in the following.
-
(1)
-
Guidance Stage:
- (1.1)
System Awakening - The user activates the proposed interactive system by approaching it. Audiovisual effects are used to bring the “emotional” drifting sailing journey to life on the TV screen through gesture control and interaction with objects.
- (1.2)
Instruction learning - The user reviews the interactive scene and process instructions.
-
(2)
-
Experience Stage:
- (2.1)
Sailing forward - The user rows the boat forward using guided gestures to explore the interactive experience.
- (2.2)
Finding a drafting bottle - The user locates a bottle drifting on the water, containing a letter presumably left by the previous user.
- (2.3)
Picking up the bottle – Using appropriate gestures, the user retrieves the bottle, which contains four letters. Each letter includes answers to questions about “becoming a person with superpowers,” provided by the previous user.
- (2.4)
Taking out a letter – The user imaginatively extracts one of the letters from the drift bottle and displays it on the interface.
- (2.5)
Reading the letter content - Through gesture-based operations on the interface, the user reads the letter’s content, listening to the spoken message to experience and empathize with the emotions expressed by the previous user.
- (2.6)
Repeating message reading four times – The user repeats Steps (2.4) and (2.5) until all four letters have been read.
-
(3)
-
Sharing Input Stage:
- (3.1)
Activating voice recording - The user presses a voice-control button on the interface using gestures to initiate the system’s recording mode.
- (3.2)
Answering a question and recording – The user verbally responds to each of the four questions, sharing their emotions interactively with the previous user. The system records these responses for playback.
- (3.3)
Transforming the message into text - The recorded voice is automatically converted into text in real time by speech-to-text technology, which is then displayed on the interface.
-
(4)
-
Emotional Review and Output Stage:
- (4.1)
Semantic analysis and emotion presentation - Using natural language processing, the system analyzes the text generated in the previous stage along with the brainwave data collected from the EEG. This analysis identifies the user’s emotions and related parameters, which are then displayed on the interface for review, including a text description and four parameter values.
- (4.2)
Repeating answer recording and analysis four times – The user repeats the tasks outlined in Steps (3.1) through (3.3) and (4.1) until all four questions are answered.
-
(5)
-
Ending Stage:
- (5.1)
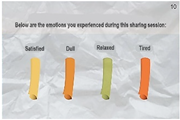
Showing the conclusion of emotion analysis – The system presents a summary of the user’s four emotional states through textual descriptions for review.
- (5.2)
Drafting a bottle with message letters – The user writes responses to the questions on letters, places them in a bottle, and releases it into the water for the next user.
Table 8.
The process of user interaction on the proposed “Emotion Drift System.
4.2.3. Questions to Answer as Messages for User Interactions
The previously-mentioned four questions to be answered by system users as messages for interactions (see Stage (3) above) are listed in
Table 9. The four questions are related as a sequence with continuity in meanings:
Introduction → Development → Turning → Conclusion.
Table 9.
Questions to answer as messages for user interactions.
Table 9.
Questions to answer as messages for user interactions.
| No. |
Property |
Question content |
| 1 |
Introduction |
What superpower did the previous person share? What are your thoughts on it? |
| 2 |
Development |
What do you think are the good and bad aspects of it? |
| 3 |
Turning |
What superpower would you want and why? |
| 4 |
Conclusion |
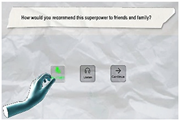
How would you recommend this superpower to friends and family? |
4.3. System Architecture and Employed Technologies
4.3.1. Overview of the Architecture
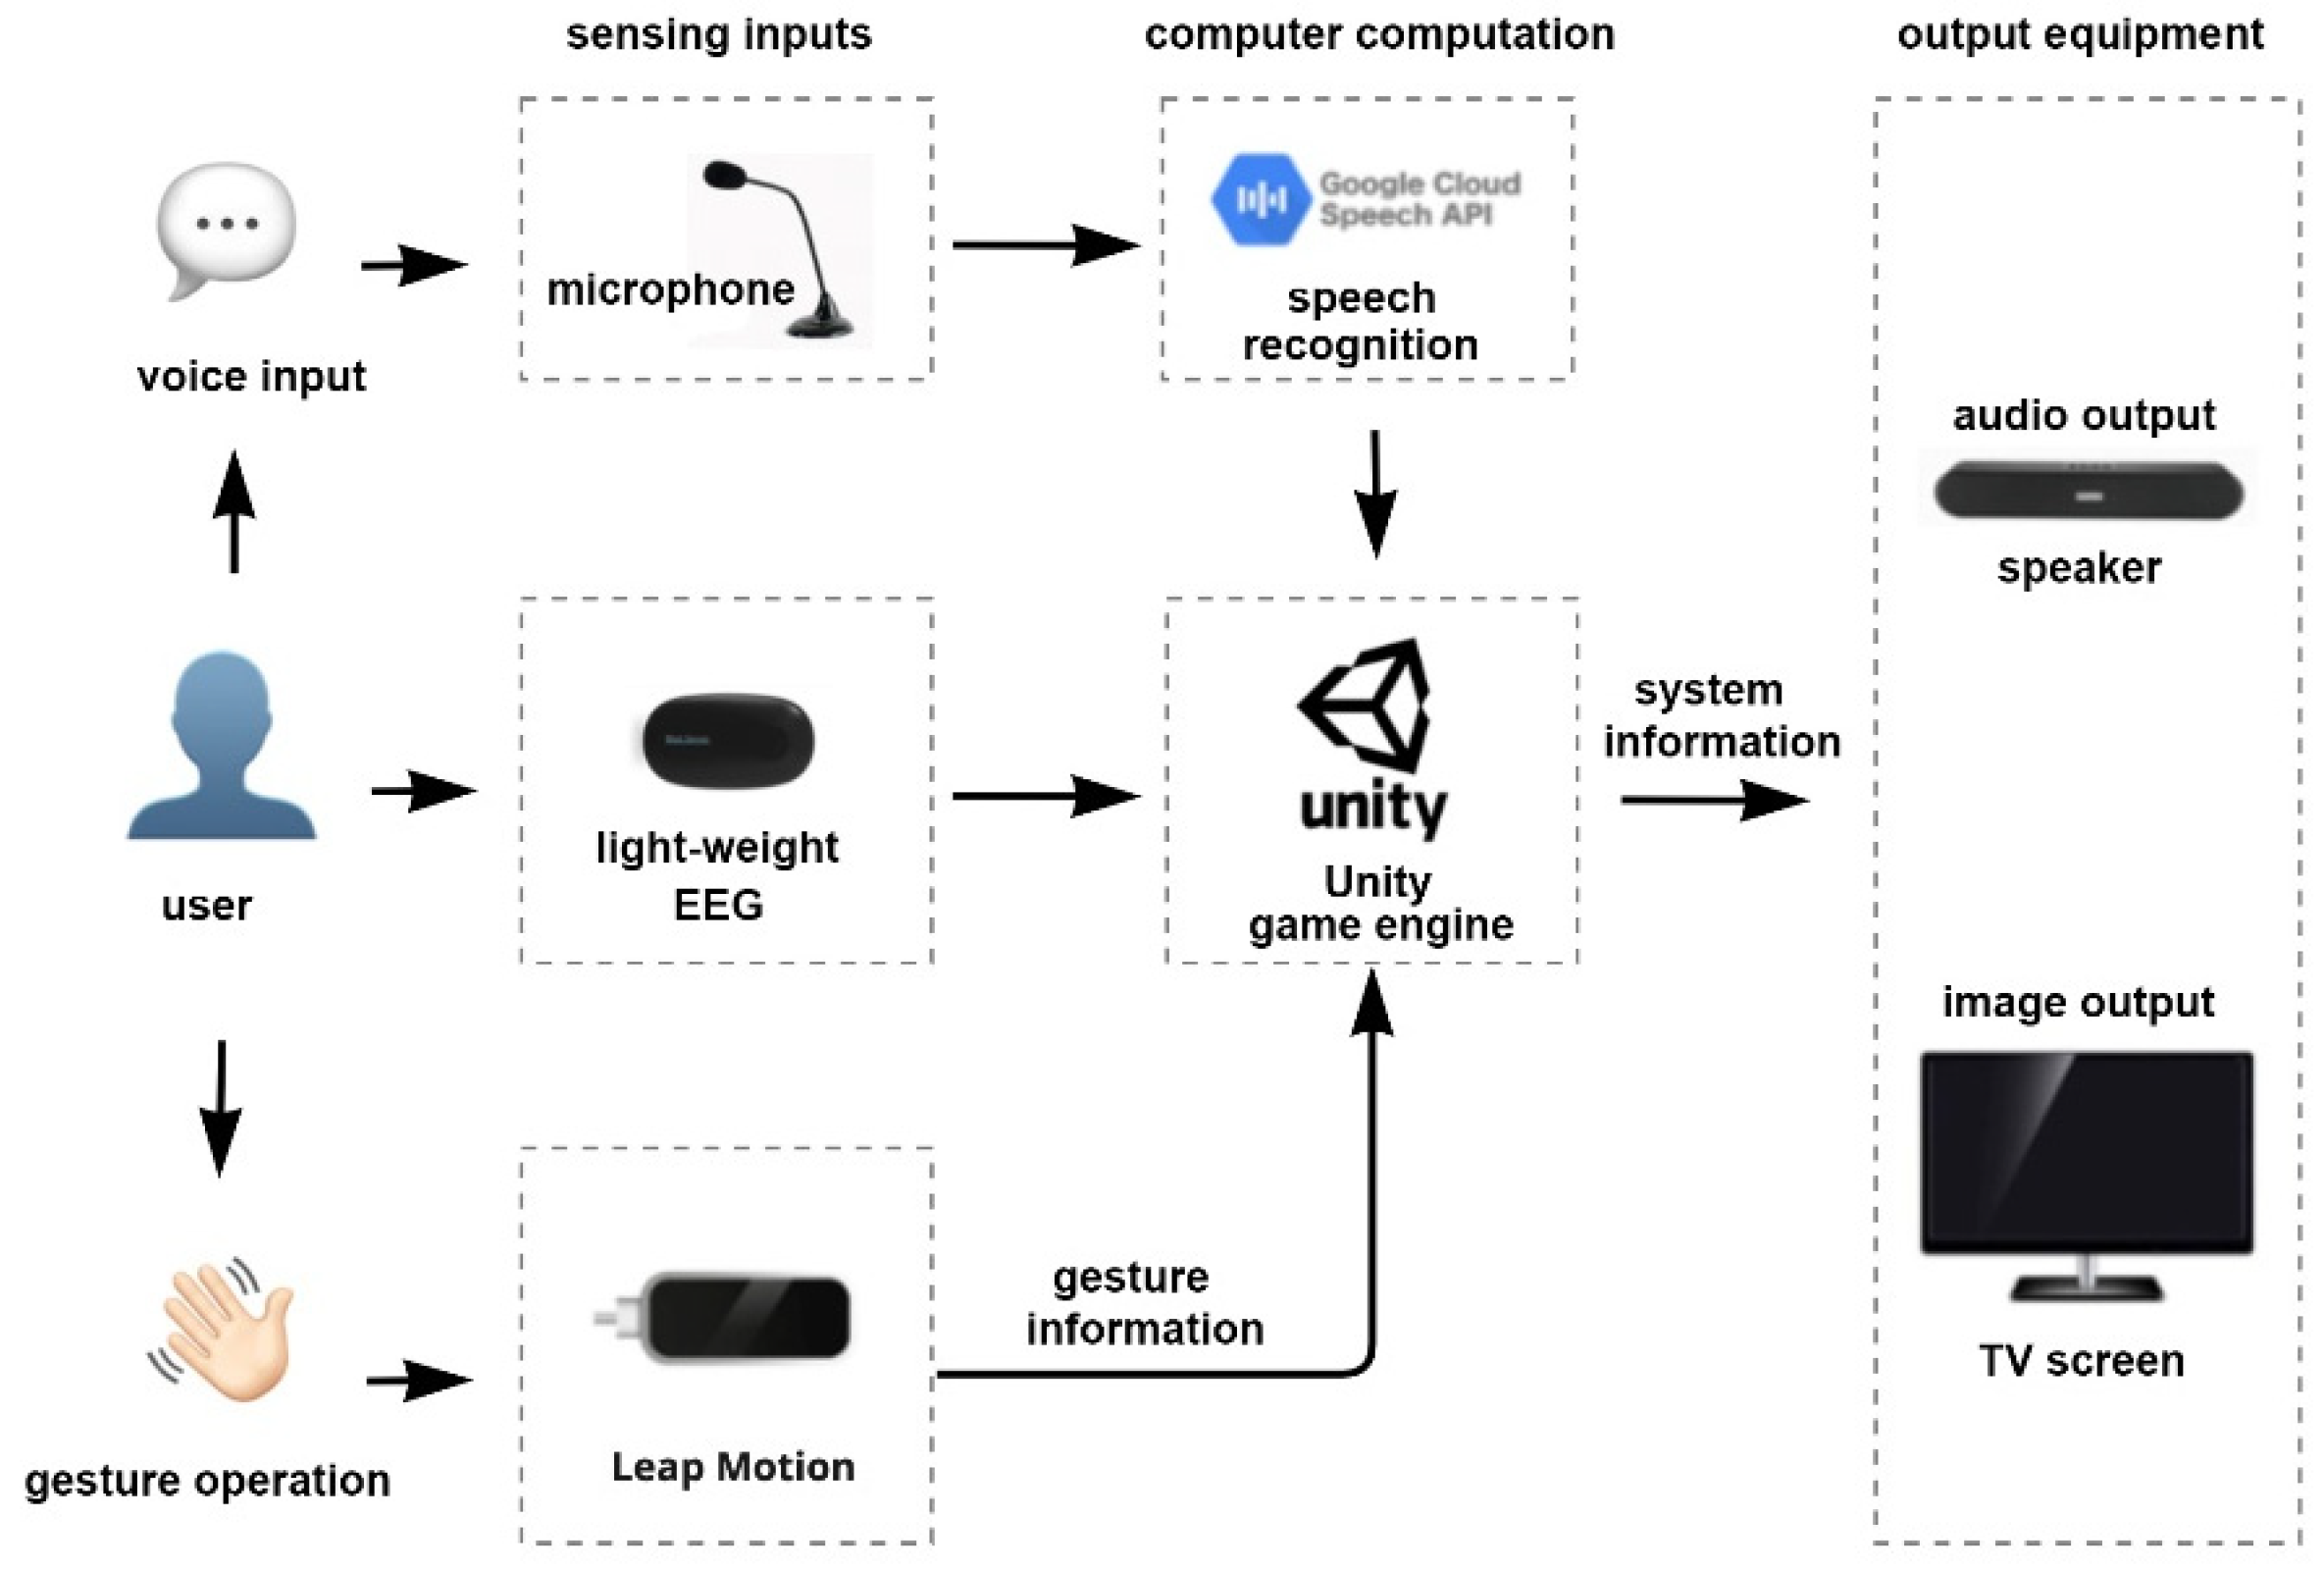
The affective computing functions of the Emotion Drift System rely on gesture and voice recognition for multi-sensing input, and use speech-to-text technology and brainwave analysis for emotion detection and visualization. The architecture for these functions is detailed in
Figure 13.
The computational process of the proposed system is divided into three main components:
Gesture Recognition: The Leap Motion sensor detects hand gestures to control objects within the virtual interface of the Leap Motion software.
Voice Recognition: The Google Speech API processes voice input, converting speech to text in real time (Speech-to-Text, STT). It also employs natural language processing (NLP) to extract semantic meanings and performs sentiment analysis to assess the emotional content of the user’s speech.
Brainwave Monitoring: The Mind Sensor EEG headset captures brainwave activity, providing data for observing and visualizing the user’s emotional state.
These components are integrated using the Unity game engine, which provides audiovisual feedback based on detected emotions, as shown in
Figure 13. More details will be described in the following sections.
4.3.2. Leap Motion Hand Gesture Sensor
The Leap Motion hand gesture sensor is a device designed specifically for gesture control and hand motion tracking. It uses a combination of infrared LEDs and cameras to detect and track hand movements with high accuracy. The sensor captures hand gestures and movements within a range of approximately 20 to 60 centimeters above the device. The real-time gesture data captured are then converted into information that the computer can interpret, providing users with a natural and intuitive interactive experience.
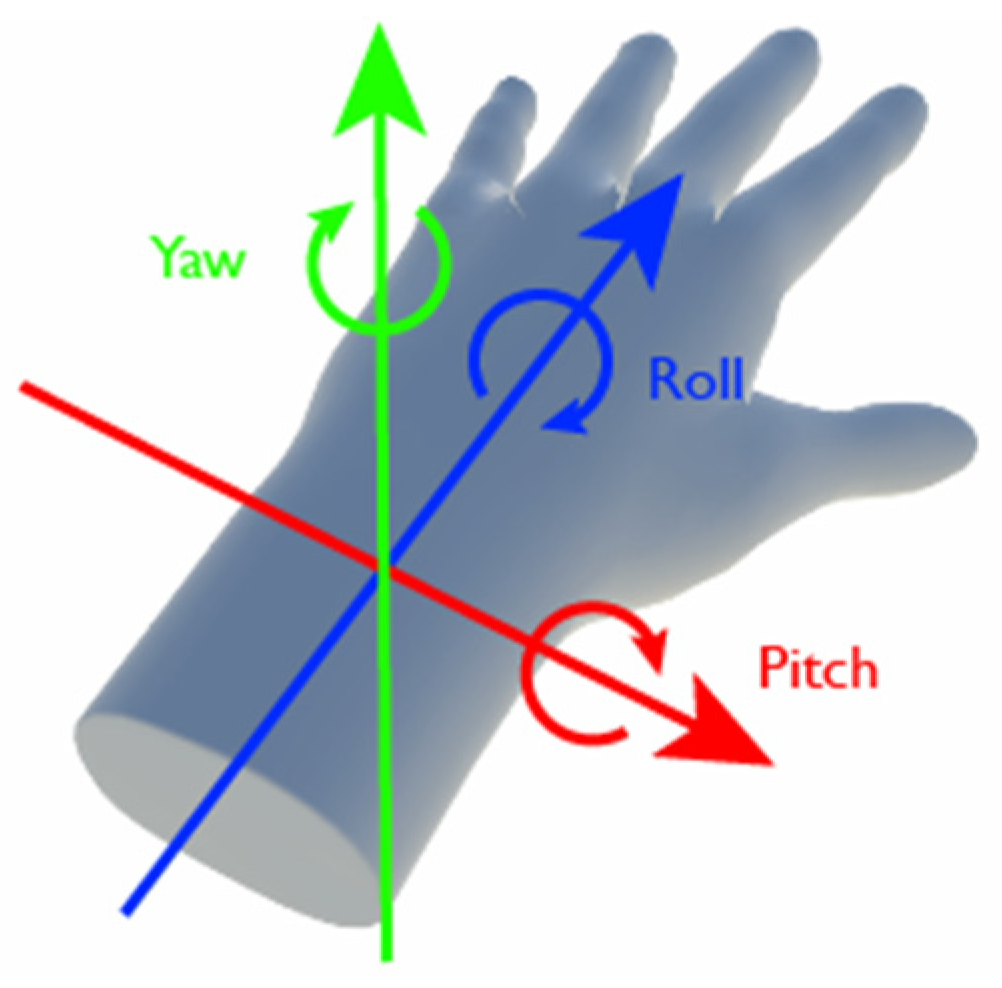
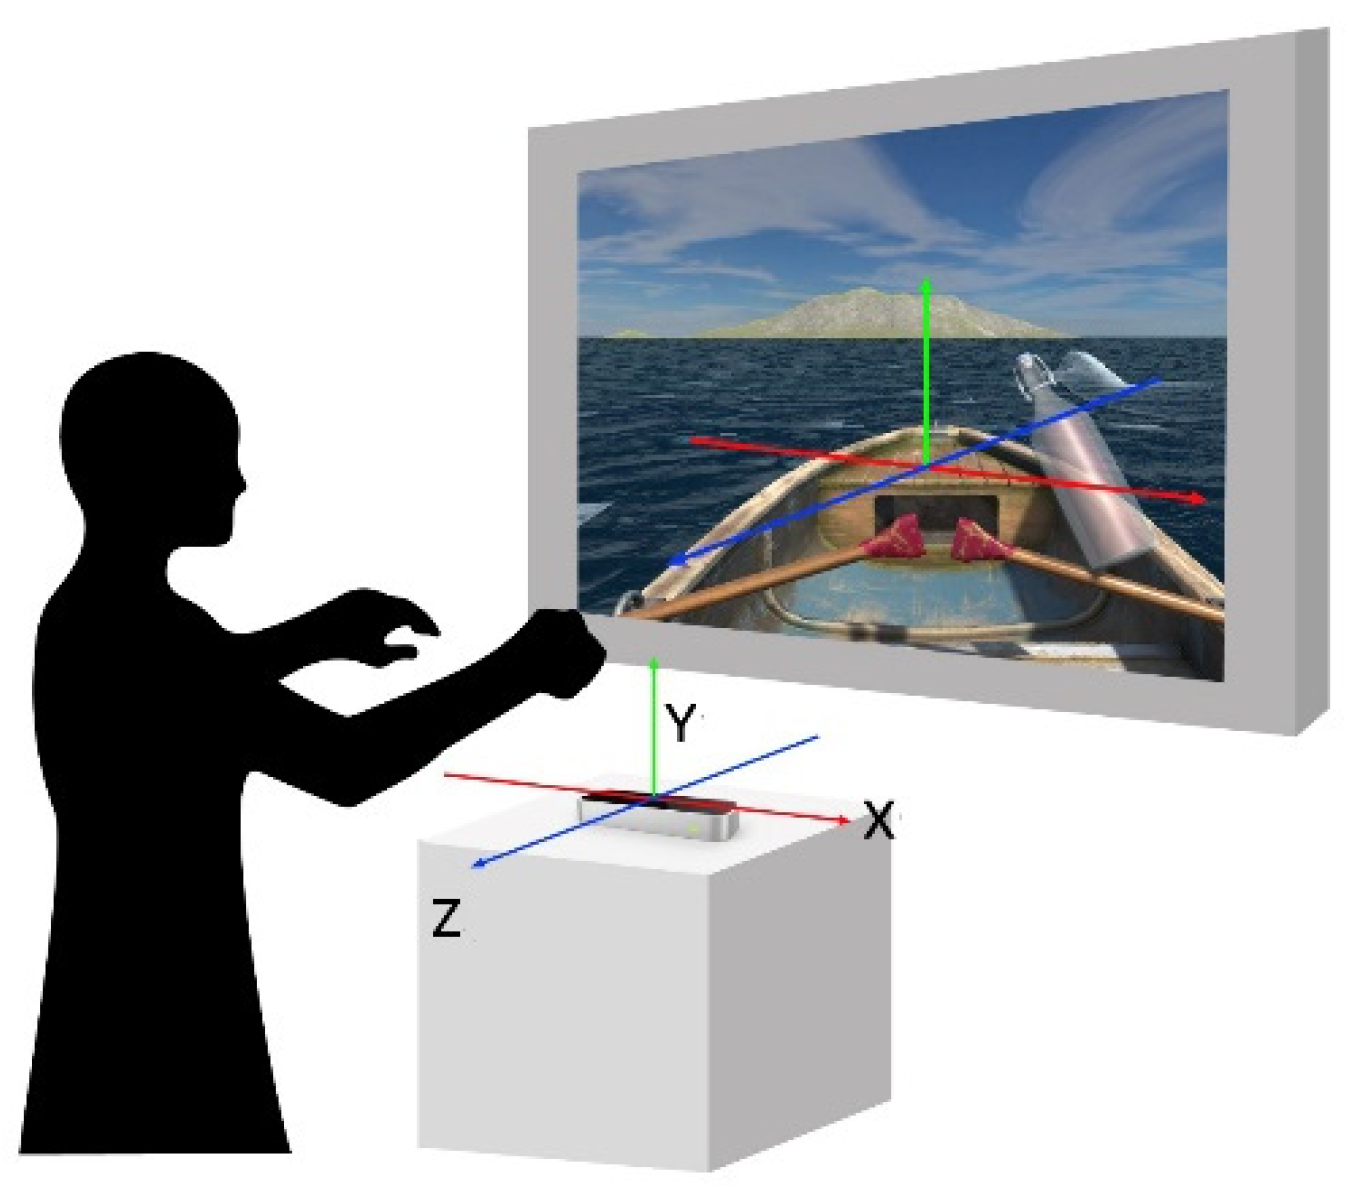
More specifically, the Leap Motion sensor detects gestures in spatial positions and movement states along three main axes: X, Y, and Z. The horizontal X-axis corresponds to lateral movements; moving the hand left or right changes the X-axis value accordingly. For example, moving the hand to the right increases the X-axis value, while moving it to the left decreases it. The vertical Y-axis is associated with up and down movements. The Z-axis represents depth, relating to forward and backward movements. When the hand moves closer to or farther from the sensor, the Z-axis value changes: moving the hand closer decreases the Z-axis value, and moving it farther away increases it, as illustrated in
Figure 14.
In summary, the Leap Motion sensor uses infrared cameras to detect hand gestures in real-time in the physical world (as shown by the green coordinate lines in
Figure 15). These gestures are then mapped to virtual world coordinates in the Unity game engine to control interactive objects (as shown by the red coordinate lines in
Figure 15).
The system design of this study categorizes gesture commands into five types: “Move Forward (both hands move back and forth),” “Move Left (right hand moves back and forth),” “Move Right (left hand moves back and forth),” “Select Click (extend the index finger to touch the object),” and “Grab Object (open the palm to close the fist towards the object).” These gestures are detailed in
Table 10. The development design and judgment logic of the Leap Motion sensor will be further elaborated in later sections.
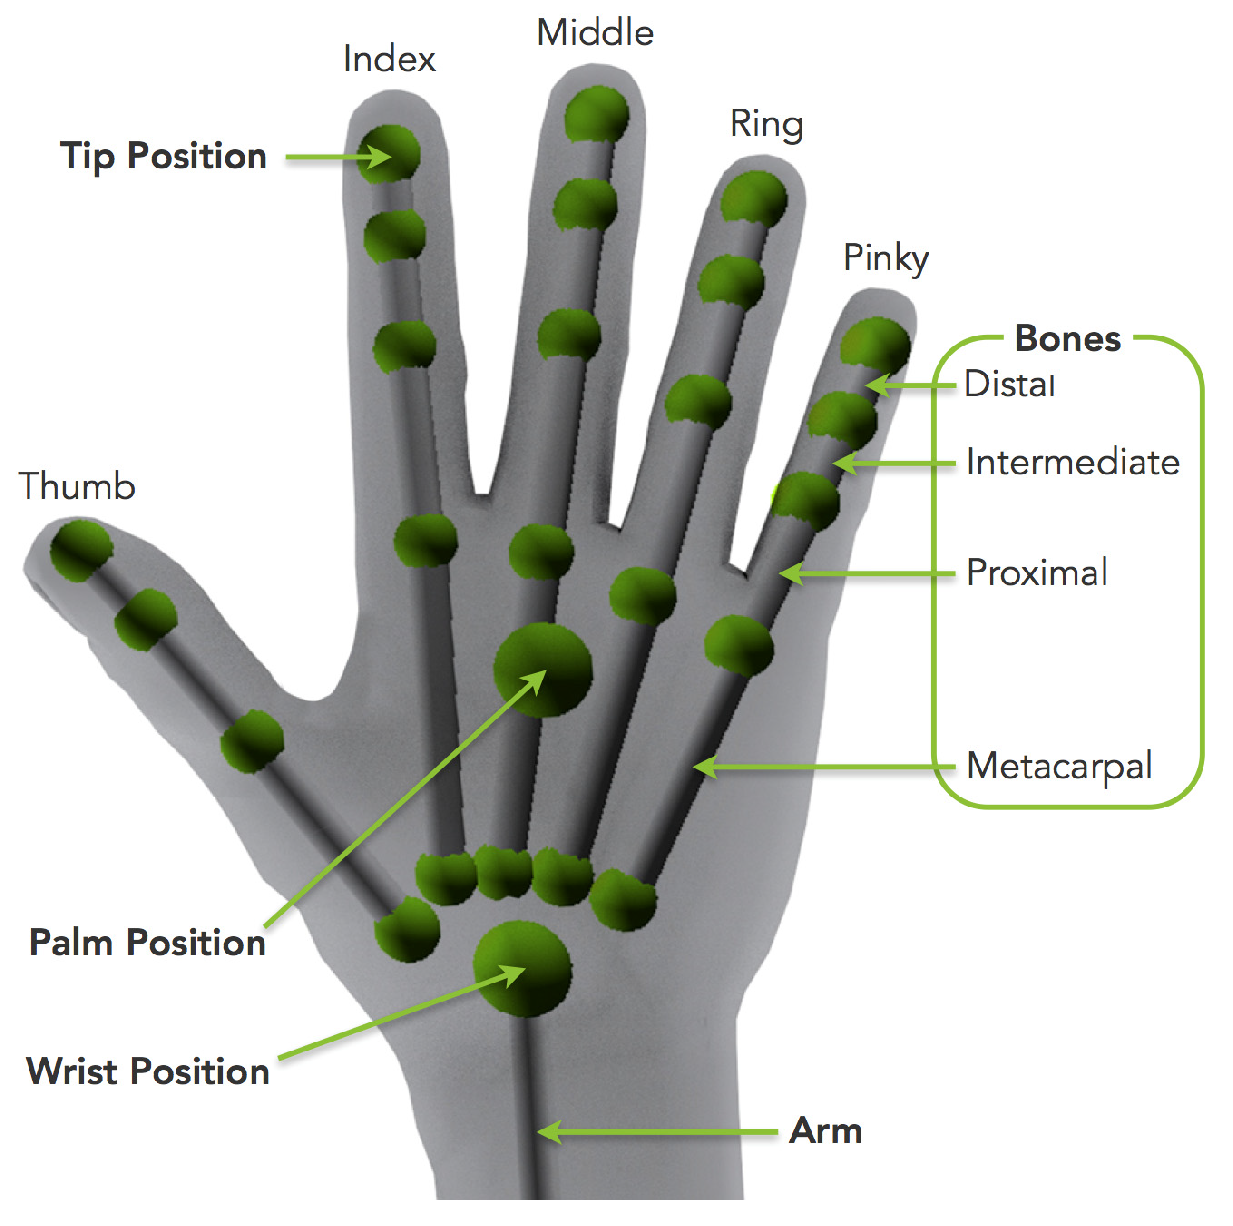
Obviously, the determination of gesture commands depends on the recognition of the palm shape of the hand, whose skeleton consists of five fingers as shown in
Figure 16. By calculating the distance between the fingertip position and the palm position, the current bend of a single finger can be determined. A threshold is set to indicate whether the finger is currently in a straight or bent state. The program developed in this study makes decisions in the aspect in the following way.
- (1)
If four fingers on one hand are bent, it indicates a fist gesture.
- (2)
If four fingers are straight, it indicates an open-hand gesture.
- (3)
By using the codes of the OnTrigger collision event offered by Unity, when the arm is detected to contact with an interactive object, collision detection is activated.
- (4)
When the object is grabbable, making a fist will allow the object to be picked up, and an open hand will allow the object to be placed down.
- (5)
When the object is an interactive button, the button will be pressed and moved by the arm. This can be cross-referenced with the gesture command table (
Table 10) mentioned previously.
4.3.3. Google Speech API
Google Cloud’s NLP technology for sentiment analysis is utilized in this study, employing its open-source machine learning applications. The NLP analysis is performed via a REST API, which supports scalable, high-performance, and reliable communication while being easy to implement and modify. High levels of visualization and cross-platform transferability are provided. Data and service requests are sent to other applications by calling the API. The Google Cloud API service requires JSON data format for cloud requests, with sentiment parameters being extracted through the uploading of voice-related file formats.
The user’s speech is captured using a microphone and encoded for storage. The speech information is then converted into text data via the Google Cloud API service. Sentiment information from the text data is subsequently analyzed using the Natural Language Processing (NLP) technology provided by the same Google Cloud API service, as shown in
Figure 17. During this process, NLP techniques are used to analyze the text data to extract two sentiment parameters:
score and
magnitude. The score reflects the overall emotion expressed in the text, while the magnitude measures the intensity of the emotional content, which is often proportional to the length of the text.
The Natural Language Processing (NLP) technology for sentiment analysis, provided by Google Cloud’s open-source machine learning applications, is utilized in this study. The analysis is conducted using a Representational State Transfer (REST) API architecture, which supports large-scale, high-performance, and reliable communication while being easy to implement and modify. High levels of visualization and cross-platform transferability are supported. The API allows data and service requests to be sent to other applications. The Google Cloud API service requires JSON format for cloud requests, enabling sentiment parameters to be extracted from uploaded voice-related file formats.
The score value (hereafter referred to as the S value) ranges from −1.0 to +1.0, representing the overall emotional tone of the text data from the speech. An S value greater than 0 indicates a predominantly positive emotion, while a score less than 0 indicates a predominantly negative emotion. The magnitude value (hereinafter referred to as the M value) ranges from 0.0 to +∞ (positive infinity) and reflects the quantity of emotional content in the text. The presence of both positive and negative emotional words in the text increases the M value.
Table 11 presents examples of text-described emotional states along with their corresponding numerical S and M values, as obtained from the sentiment and semantics analyses shown in
Figure 17.
4.3.4. Mind Sensor EEG
In this study, the Mind Sensor lightweight EEG device, as shown in
Figure 18, is used to measure and record brain activity. This device is commonly employed in healthcare, wellness, gaming, education, and sports. It operates by using electrodes to detect electrical signals from the brain, reflecting various mental states such as concentration, relaxation, and excitement.
Before starting the interaction with the proposed Emotion Drift System, each participant was required to wear the EEG equipment described earlier. The equipment uses Bluetooth Low Energy (BLE) technology for wireless communication. Once the EEG device connects successfully to Unity, it provides several metrics: the “signal quality value” (denoted as sq) to indicate current signal stability, the “attention value” (denoted as a) to measure the participant’s level of focus, and the “meditation value” (denoted as m) to gauge the participant’s level of relaxation. The system not only records the user’s brainwave states but also quantifies the attention and meditation values, a and m, on a scale from 1 to 100 for emotional visualization purposes.
After experiencing the interaction on the proposed system, the current user will obtain the semantic values
M and
S as well as the EEG data values
m and
a. In this study, the EEG device outputs meditation and attention values
m and
a within the range of 0.0 to 100.0. The formula (1) is used to convert the output value
m or
a into a
scaled conversion value denoted as
conversion_x:
where
x =
m or
a,
output_
min and
output_
max represent the minimum and maximum values of the output values, respectively, and
conv_
max and
conv_
min denote the maximum and minimum values of the conversion value
conversion_
x, respectively. By the formula above, the output values
m and
a of the EEG device can be proportionally converted into the range of –1.0 to +1.0, with the converted meditation and attention values being denoted as
conversion_
m and
conversion_
a, respectively.
Furthermore, let
be the vector formed by the point
E at the coordinates (
conversion_
m and
conversion_
a) and the origin
O at (0, 0). Then, by calculating the angle between
and the
X-axis in an
X-
Y rectangular coordinate system, one of the 36 angular segments, each spanning 10 degrees, denoted as
G, within the 360-degree range that includes the vector
can be identified. Finally, according to Algorithm 1,
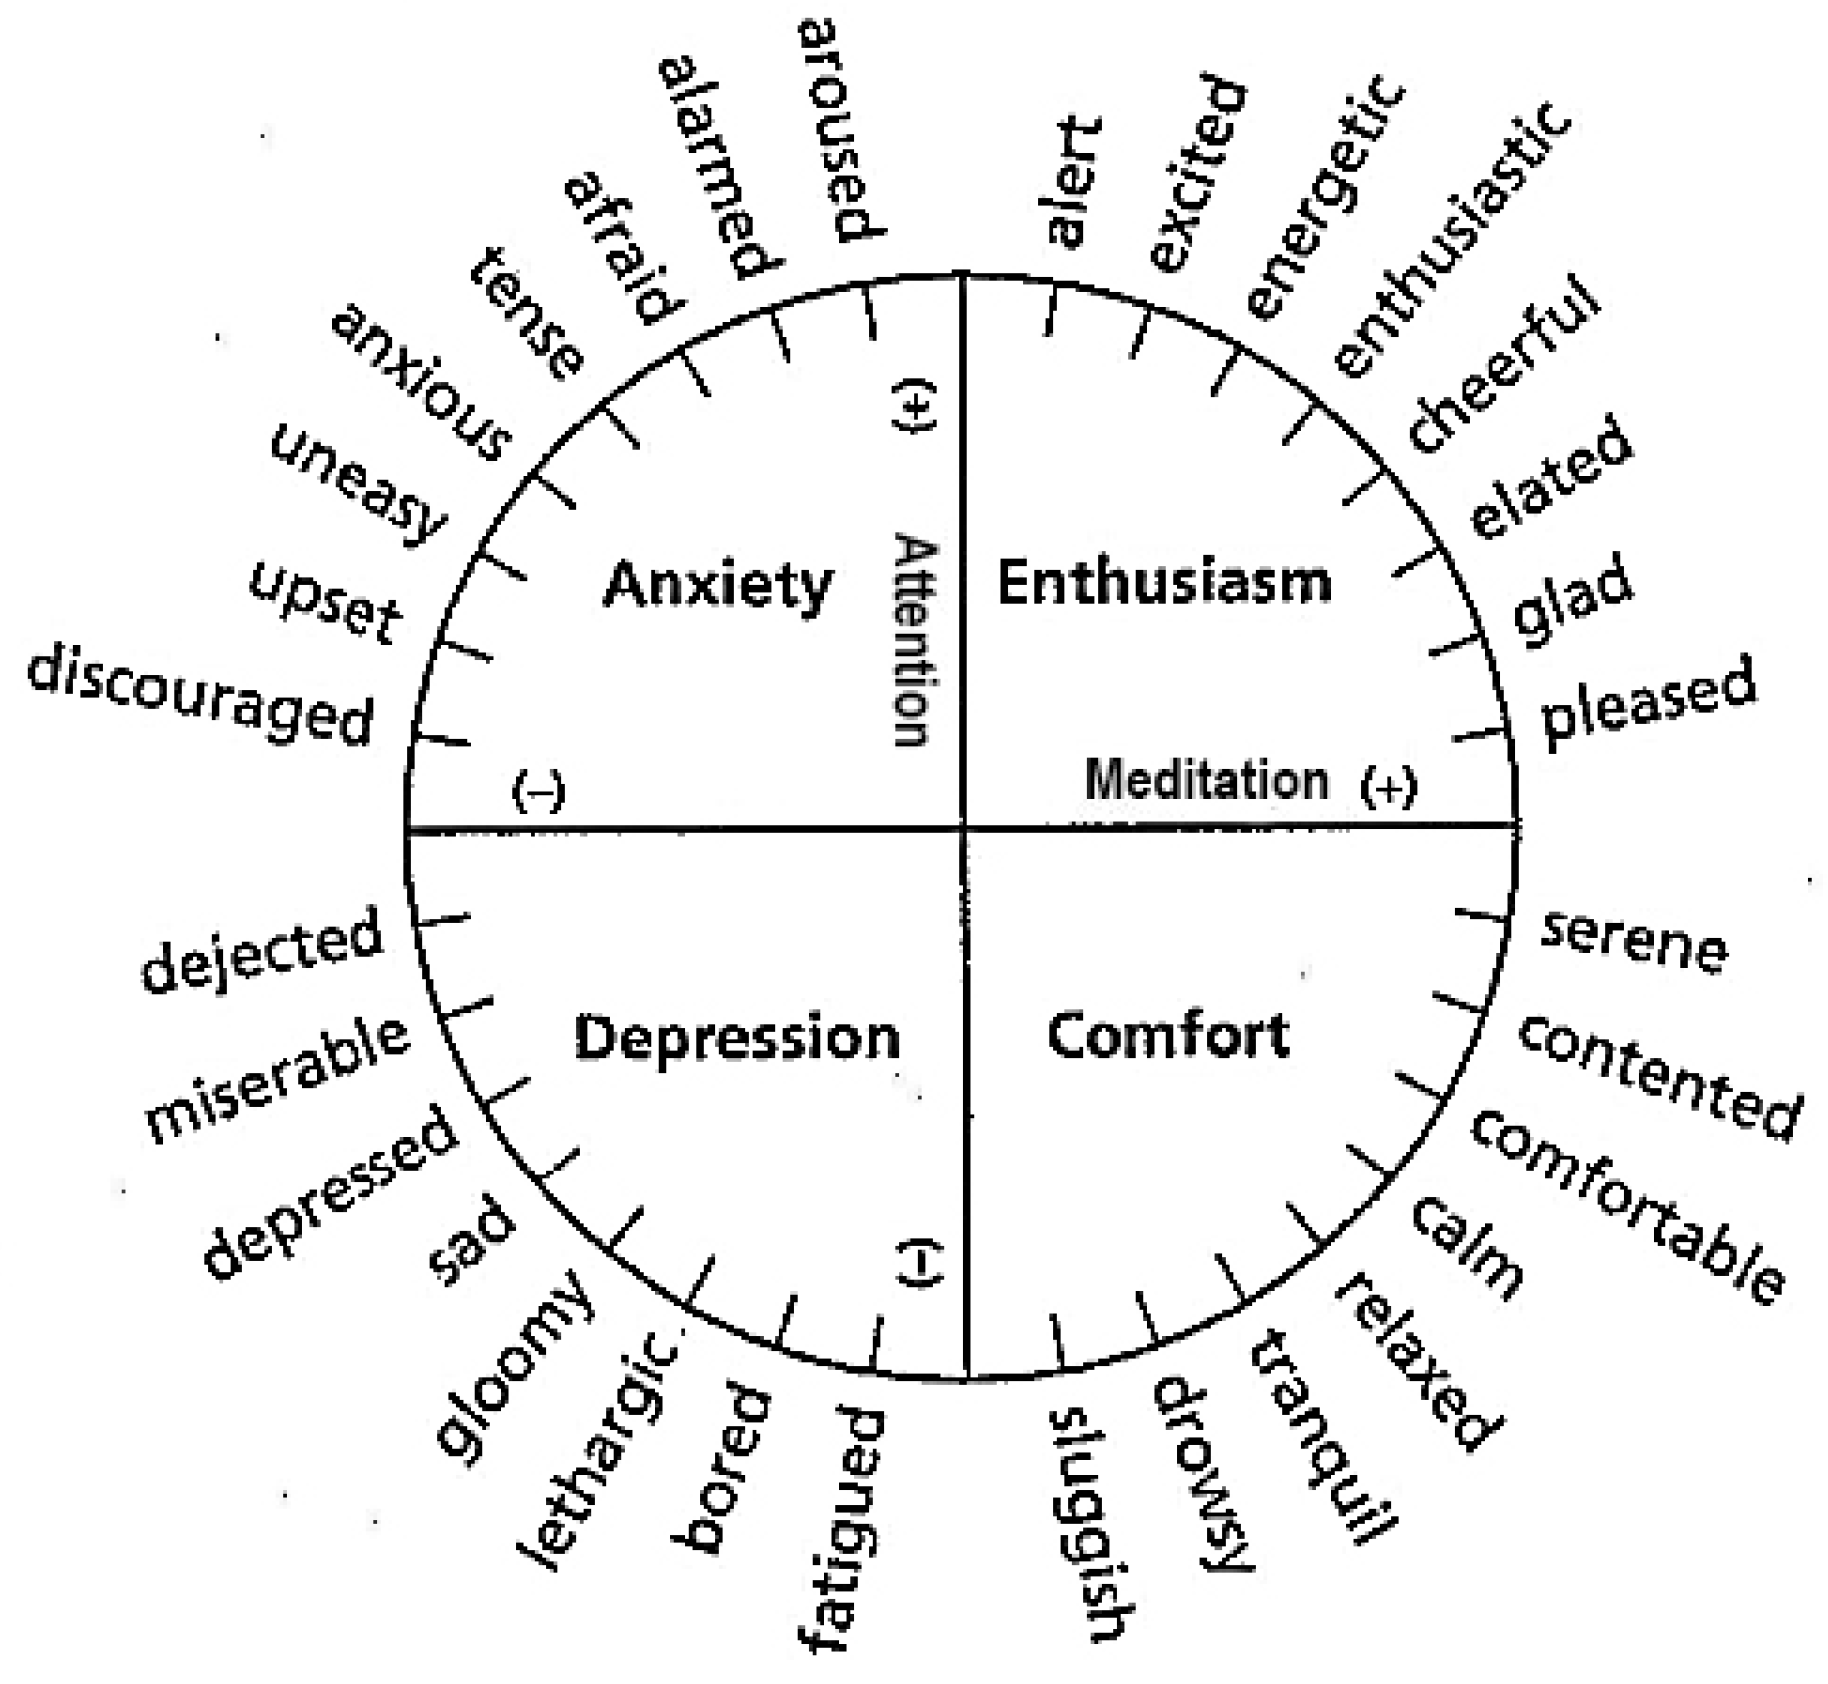
G can be used to identify one of 36 possible emotional states, as illustrated in
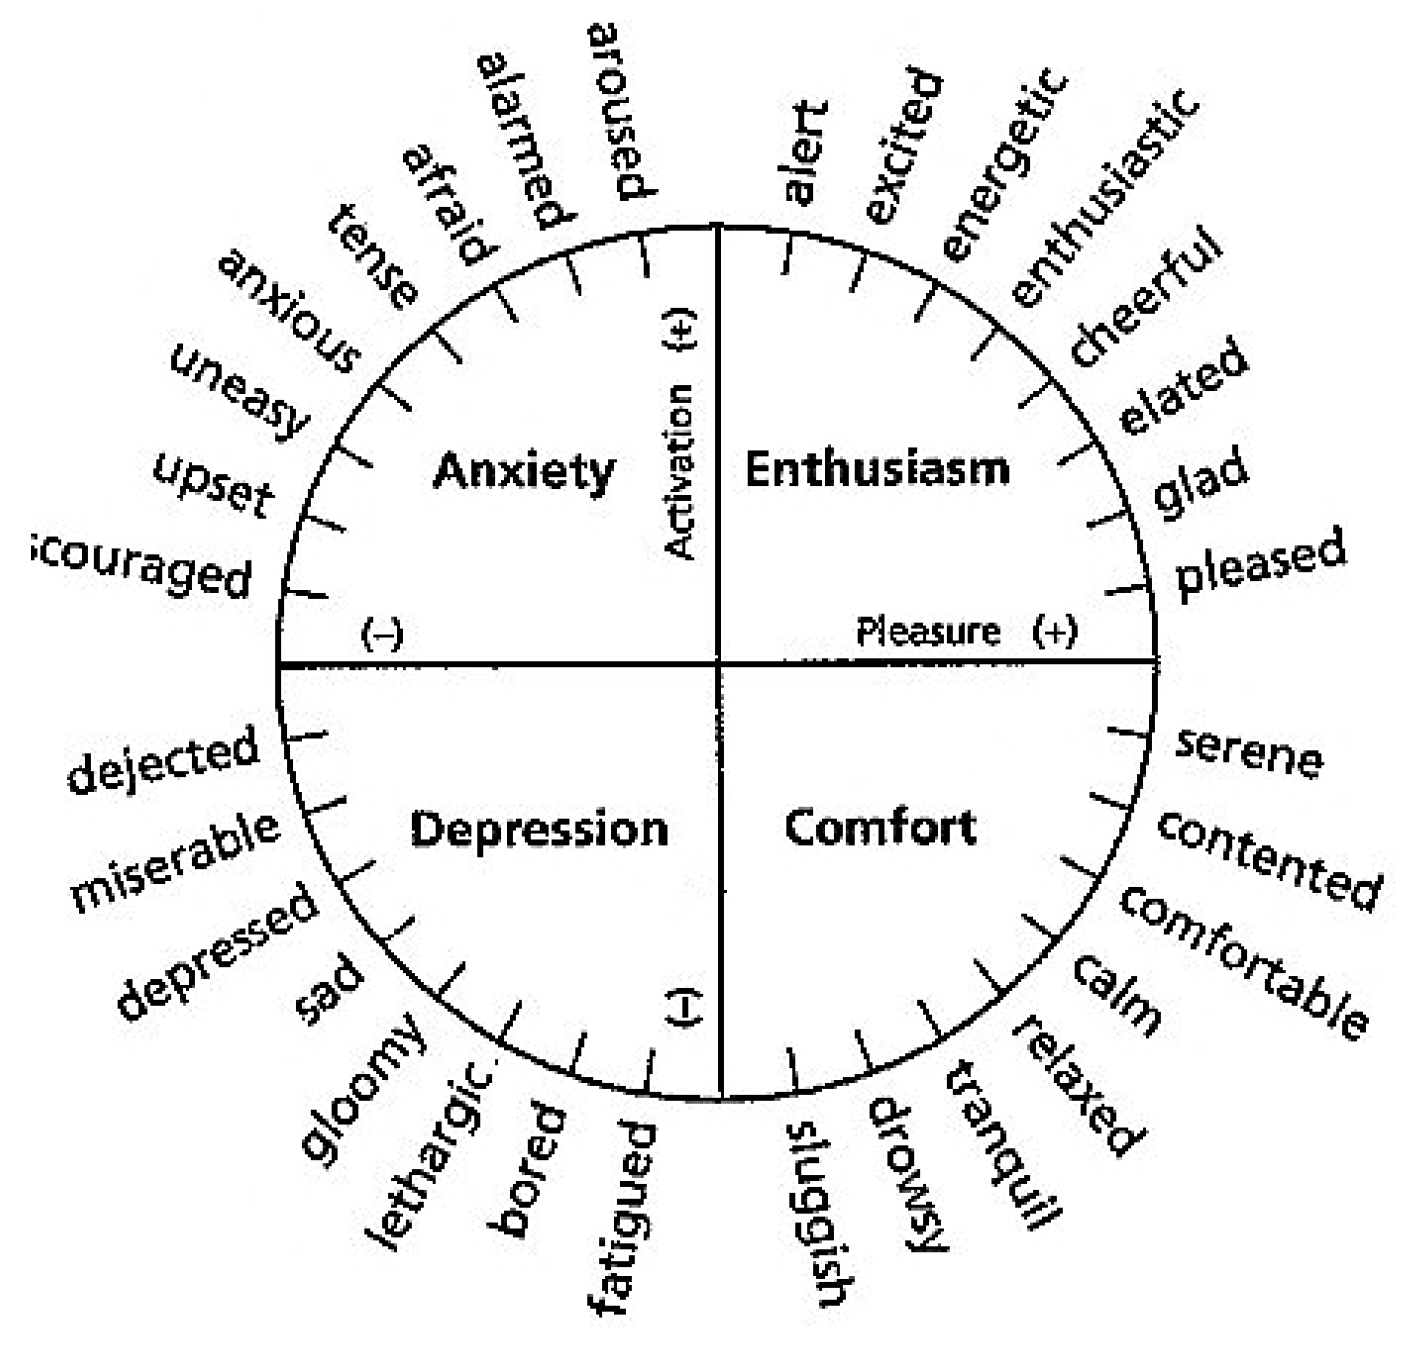
Figure 19. This figure replicates
Figure 6 but with the
X- and
Y-axes renamed to “meditation” and “attention,” respectively, for this study. Specifically, the horizontal axis in
Figure 6, originally representing “pleasure,” is now designated as the meditation value
m, while the vertical axis, originally representing “activation,” is now the attention value
a. It should also be noted that the
X-axis and
Y-axis in the affect circumplex of
Figure 6 have been alternatively considered to represent the parameters “valence” and “arousal,” respectively, in References [
52,
53].
For example, if
E = (0.5, 0.5), the angular direction of the vector
relative to the X-axis is 45°. According to Step 3 of Algorithm 1, 45/10 = 4.5 is calculated and rounded down to the integer
I = 5. This indicates that the 10-degree angular segment containing
is the 5th segment from the
X-axis in the counterclockwise direction, which corresponds to the emotional state “enthusiastic” according to the affect circumplex shown in
Figure 19.
Algorithm 1: computing the emotion state from the meditation and attention values.
Step 1: Define two vectors:
- Vector1: Created from the coordinate values (conversion_m, conversion_a) with respective to the origin (0, 0) of the X-Y coordinate system.
- Vector2: A fixed reference vector which is taken to be the X-axis.
Step 2: Calculate the angle between Vector1 and Vector2:
- Use a function to determine the angle θ between Vector1 and Vector2 in the counterclockwise direction with θ to fall in the range of 0 ≤ θ ≤ 360o.
Step 3: Categorize the angle:
- Divide the angle θ by 10 and round down to the nearest whole number I.
- This integer I represents one of 36 possible 10-degree segments.
Step 4: Decide the output emotion state:
- Find the
I-th emotion state counted from the X-axis in
Figure 19 in the counterclockwise direction as the desired output.
4.3.5. Visual Displays of System Data and Verbal Descriptions of Users’ Emotion States
As mentioned previously, the Google Cloud API service is used in this study for the analysis of the text data of the user’s speech, resulting in the sentiment-related values called score and magnitude denoted by S and M, respectively. And the Mind Sensor EEG used in this study for the analysis of the user’s brainwaves yields the emotion-related parameter values of attention and meditation, denoted as a and m.
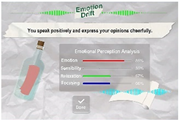
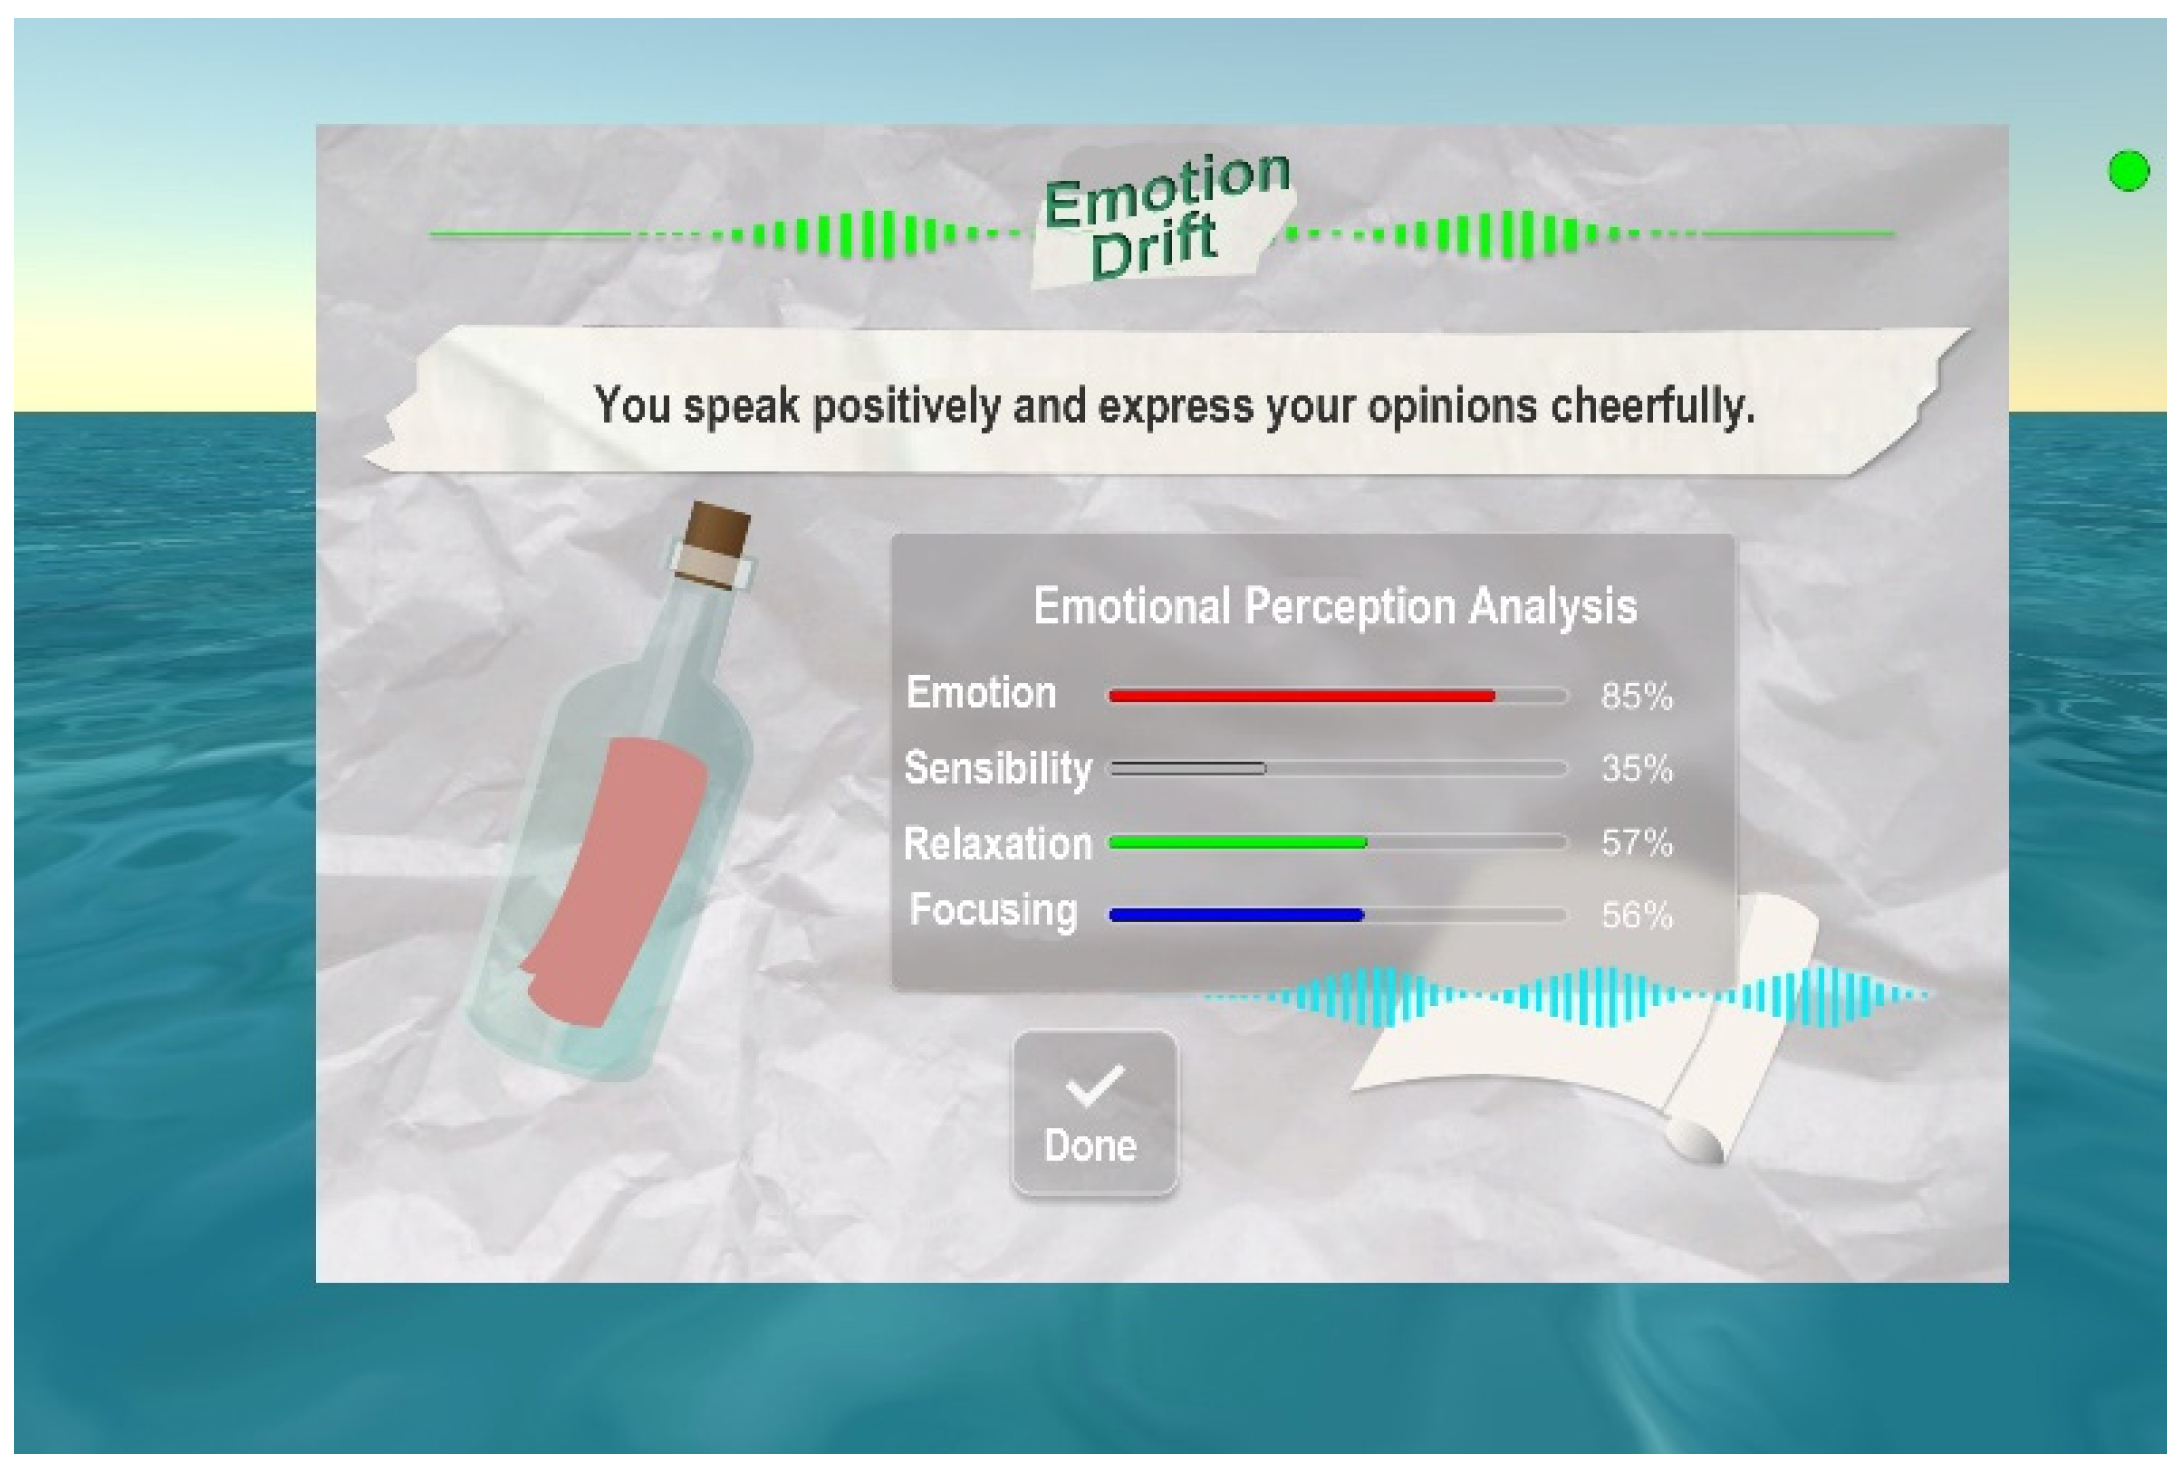
For the purpose of illustrating these data on the interface shown on the TV screen for the user to inspect as shown in
Figure 20 which is a copy of the illustration of Step 4.1 in
Table 8, the values of these four kinds of parameter data are converted to be in the range of 0.0~1.0, or equivalently, in the range of 0%~100%. Also, four colored scales are employed to indicate the percentages, respectively, with the respective colors being taken to be red, gray, green, and blue, as described in
Table 12. Finally, letter papers are also used to show the emotion state of the user, which are of the same colors of the percentage scales.
To illustrate these data on the TV screen interface, as depicted in
Figure 20 (a reproduction from Step 4.1 in
Table 8), the values of the four types of parameter data are normalized to a range of 0.0 to 1.0, or equivalently, 0% to 100%. Four colored scales—red, gray, green, and blue—are used to represent these percentages, as detailed in
Table 12. Additionally, letter papers displaying the user’s emotional state are presented in the same colors as the percentage scales.
Furthermore, the names of the four types of parameter data, namely, score, magnitude, meditation, and attention are renamed as emotion, sensibility, relaxation, and focusing, respectively, for the user to understand more easily.
Finally, both the result yielded by the speech analysis using the Google Cloud NLP API and that yielded by the brainwave analysis using the Mind Sensor EEG are combined to generate a sentence to give a verbal description of the overall emotion state of the user (appearing on top of the four scales in
Figure 20), accompanied with a bottle filled with a letter with the color of the emotion scale (“red” for the example shown in
Figure 20).
6. Conclusions and Suggestions
In this section, conclusions based on the findings of this study are drawn, followed by some suggestions for future studies are included.
6.1. Conclusions
In this study, the use of multi-sensing interactive interfaces for affective computing to evoke emotional resonance and enhance positive interpersonal interactions has been explored. A comprehensive review of cutting-edge literature and relevant case studies revealed that sharing and exchanging messages in interpersonal interactions conveys emotional information, with pleasure, enjoyment, and interest being crucial for sustaining engagement. The review also highlighted that multimodal interactive interfaces offer flexibility by removing constraints related to form, time, and space, and that systems with emotional functions can recognize human emotions in real-time.
Based on these findings, design principles were developed for creating a system to achieve these goals. A prototype emotion-perception system named “Emotion Drift” was constructed to address negative emotions in social relationships, promote empathetic communication, and provide a higher-quality, more human-centered experience to strengthen interpersonal interactions.
The system was tested through experiments involving 60 participants. Indirect observation and questionnaires were used to assess its effectiveness, and the collected data were statistically analyzed to draw the following conclusions.
-
(1)
Emotional transmission in interactions is confirmed, with overall positive user emotions and notable individual variations ?
Emotional transmission in interpersonal interactions is confirmed, with the proposed emotion-perception system “Emotion Drift” identifying 36 distinct emotions. Analysis showed that while users’ overall emotions tended to be positive, there were notable variations in individual emotional experiences.
-
(2)
The proposed emotional perception system “Emotion Drift” effectively stimulates positive emotions in users and strengthens interpersonal interactions ?
The incorporation of affective computing technology into interpersonal experiences validated that the system promotes positive, enjoyable emotional resonance among users, leading to high-quality interpersonal relationships.
-
(3)
A positive correlation was found to exist between semantic analysis and brainwave metrics of relaxation and concentration ?
Specifically, during the message interaction process, users exhibited relaxed emotions. However, during topic transition to the third message, both the listening and sharing processes effectively increased the user’s concentration and enhanced the quality of positive emotional interaction.
-
(4)
The interaction experience based on multimodal and affective computing provides users with pleasure and relaxation emotions ?
Analysis of emotional trends revealed that during listening, brainwave emotions were mainly in the Enthusiasm or Comfort quadrants, while sharing focused more on Comfort. The data confirm a shift from enthusiasm to comfort, demonstrating that the “Emotion Drift” system offers a pleasant and relaxing emotional experience.
6.2. Suggestions for Future Research
Due to the limitations of this study, there are several areas for improvement in the system design. The following directions are suggested for further research:
-
(1)
Exploring multi-sensing interaction and affective computing across different age groups?
This study’s sample mainly comprised individuals aged 18-25. Future research should explore emotional transmission trends across different age groups and examine individual users’ emotional data, which this study did not address.
-
(2)
Choosing a fixed, quiet, comfortable experimental environment ?
To accurately measure physiological emotional data, experiments should be conducted in a stable, serene, and comfortable environment. This setting will help users relax and exhibit natural emotional responses, leading to more reliable emotional data and improved understanding of emotion transmission.
-
(3)
Designing longer induction phases to better cultivate emotions ?
In this study, it was noted that the user’s relaxation feeling increases from the second to the fourth message during the listening phase. To enhance emotional engagement, it is suggested to extend the initial induction phase, giving users more time to fully engage and display emotional trends.
-
(4)
Using more intuitive and readable visualizations for emotional information ?
The current system only allows users to infer others’ emotions through voice and context. Future research should explore incorporating more intuitive and proactive visualizations to actively present emotional information to users.
-
(5)
Conducting experiments with diverse multi-sensing interaction interfaces and affective computing technologies ?
This study used voice and gesture recognition with Google Cloud semantic analysis and a lightweight EEG sensor. Future researchers should explore diverse interfaces and affective technologies to expand the scope of the study.
Figure 1.
The research process of this study.
Figure 1.
The research process of this study.
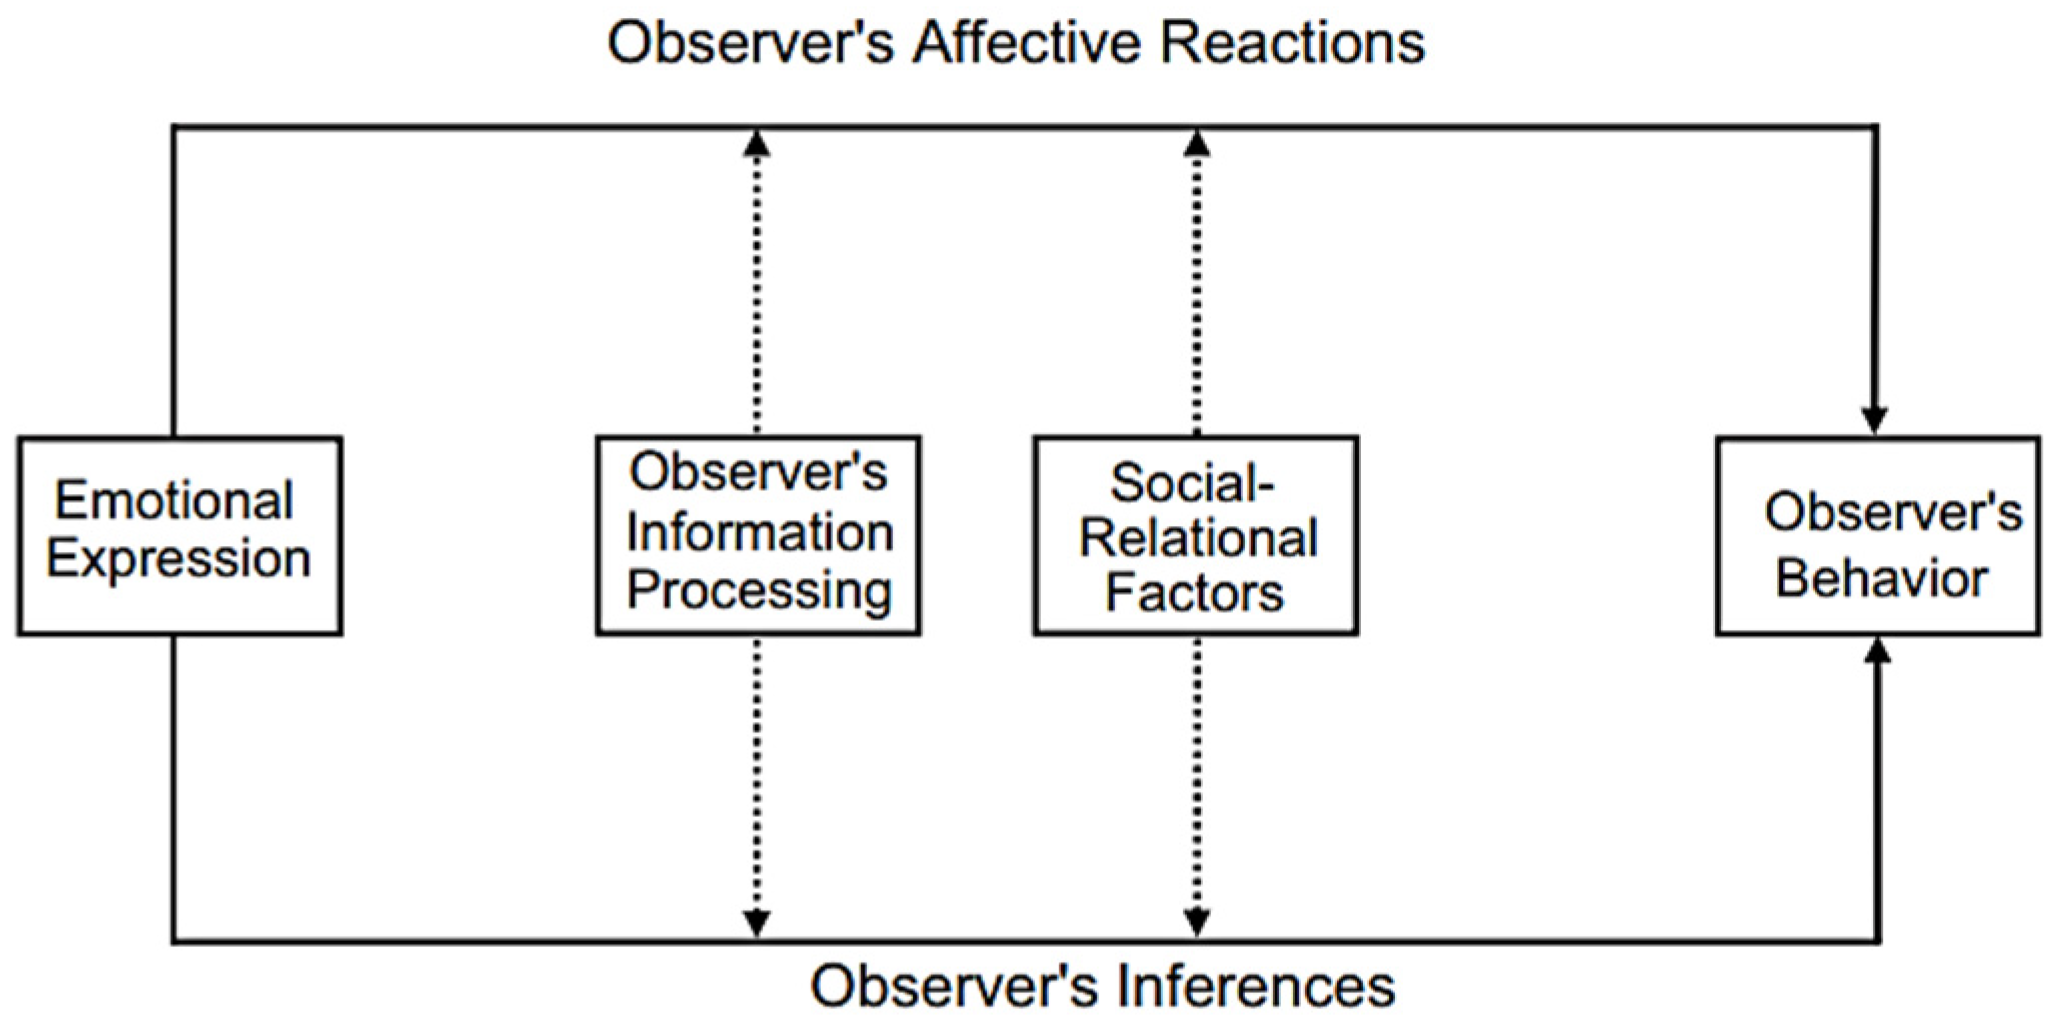
Figure 3.
The Emotions-as-Social-Information (EASI) model (Van Kleef [
40]).
Figure 3.
The Emotions-as-Social-Information (EASI) model (Van Kleef [
40]).
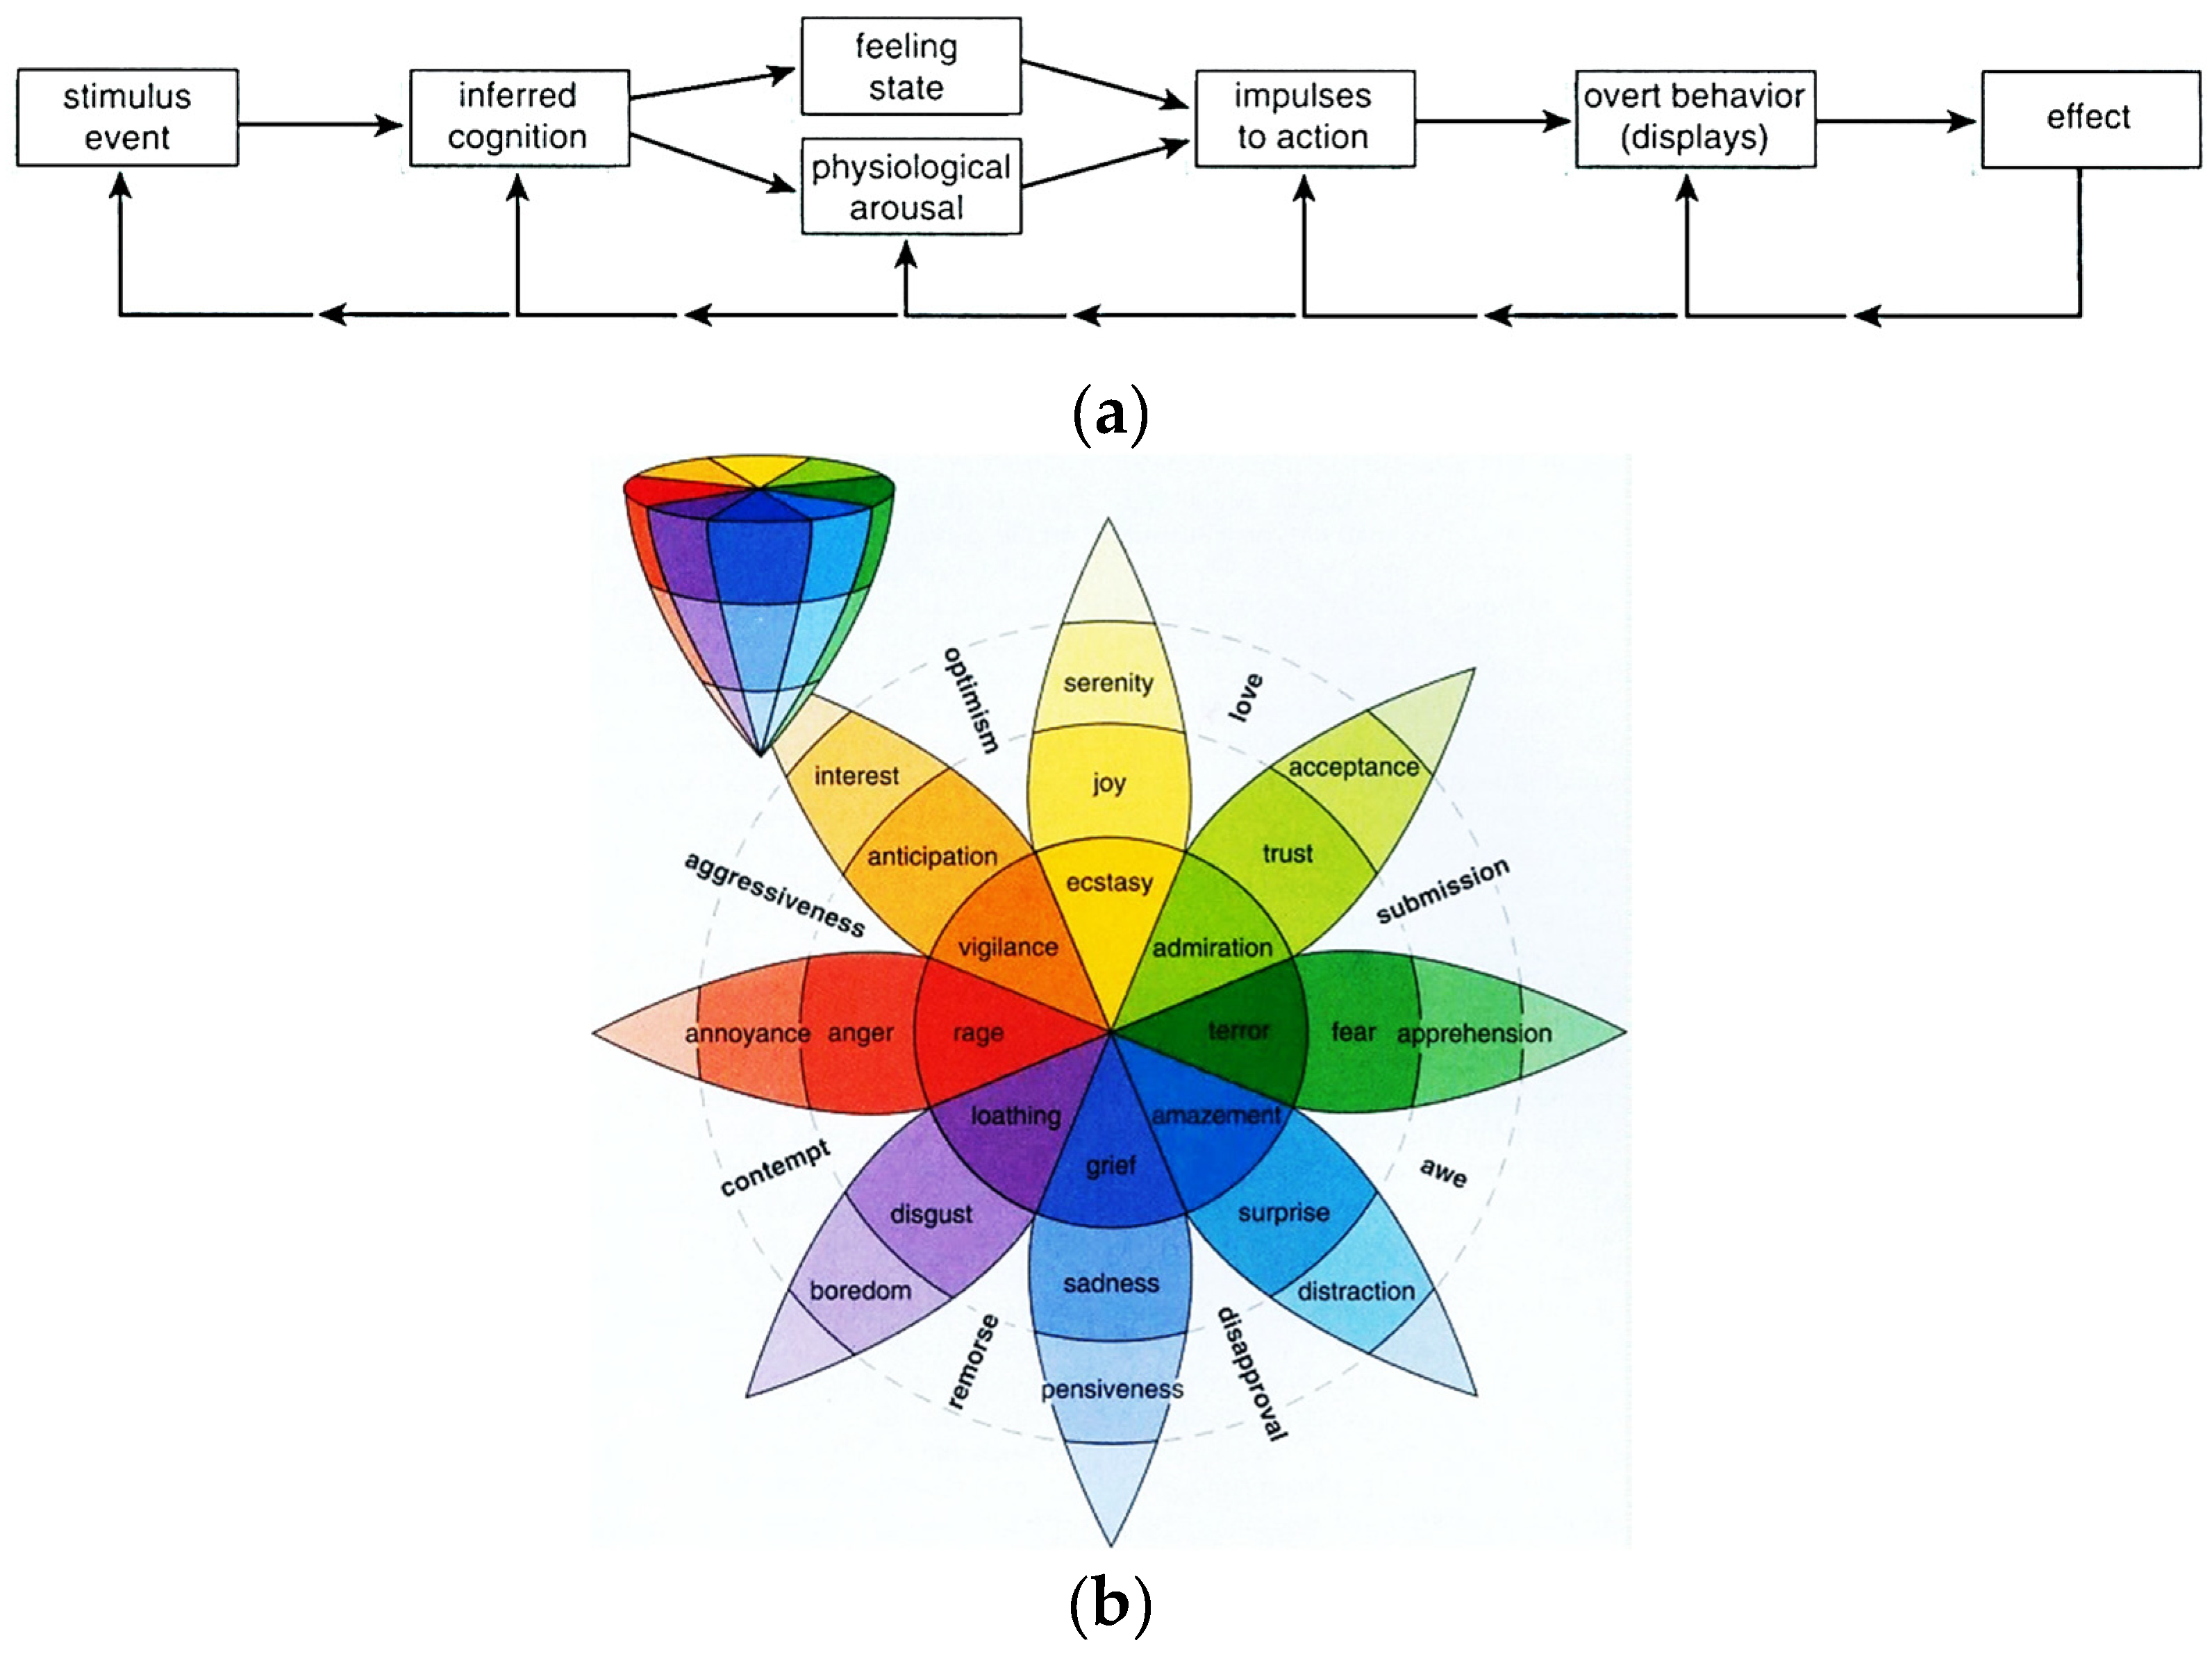
Figure 4.
The “Wheel of Emotion” model proposed by Plutchik [
50]. (
a) The evolution process of the model. (
b) The three-dimensional circumplex of the model.
Figure 4.
The “Wheel of Emotion” model proposed by Plutchik [
50]. (
a) The evolution process of the model. (
b) The three-dimensional circumplex of the model.
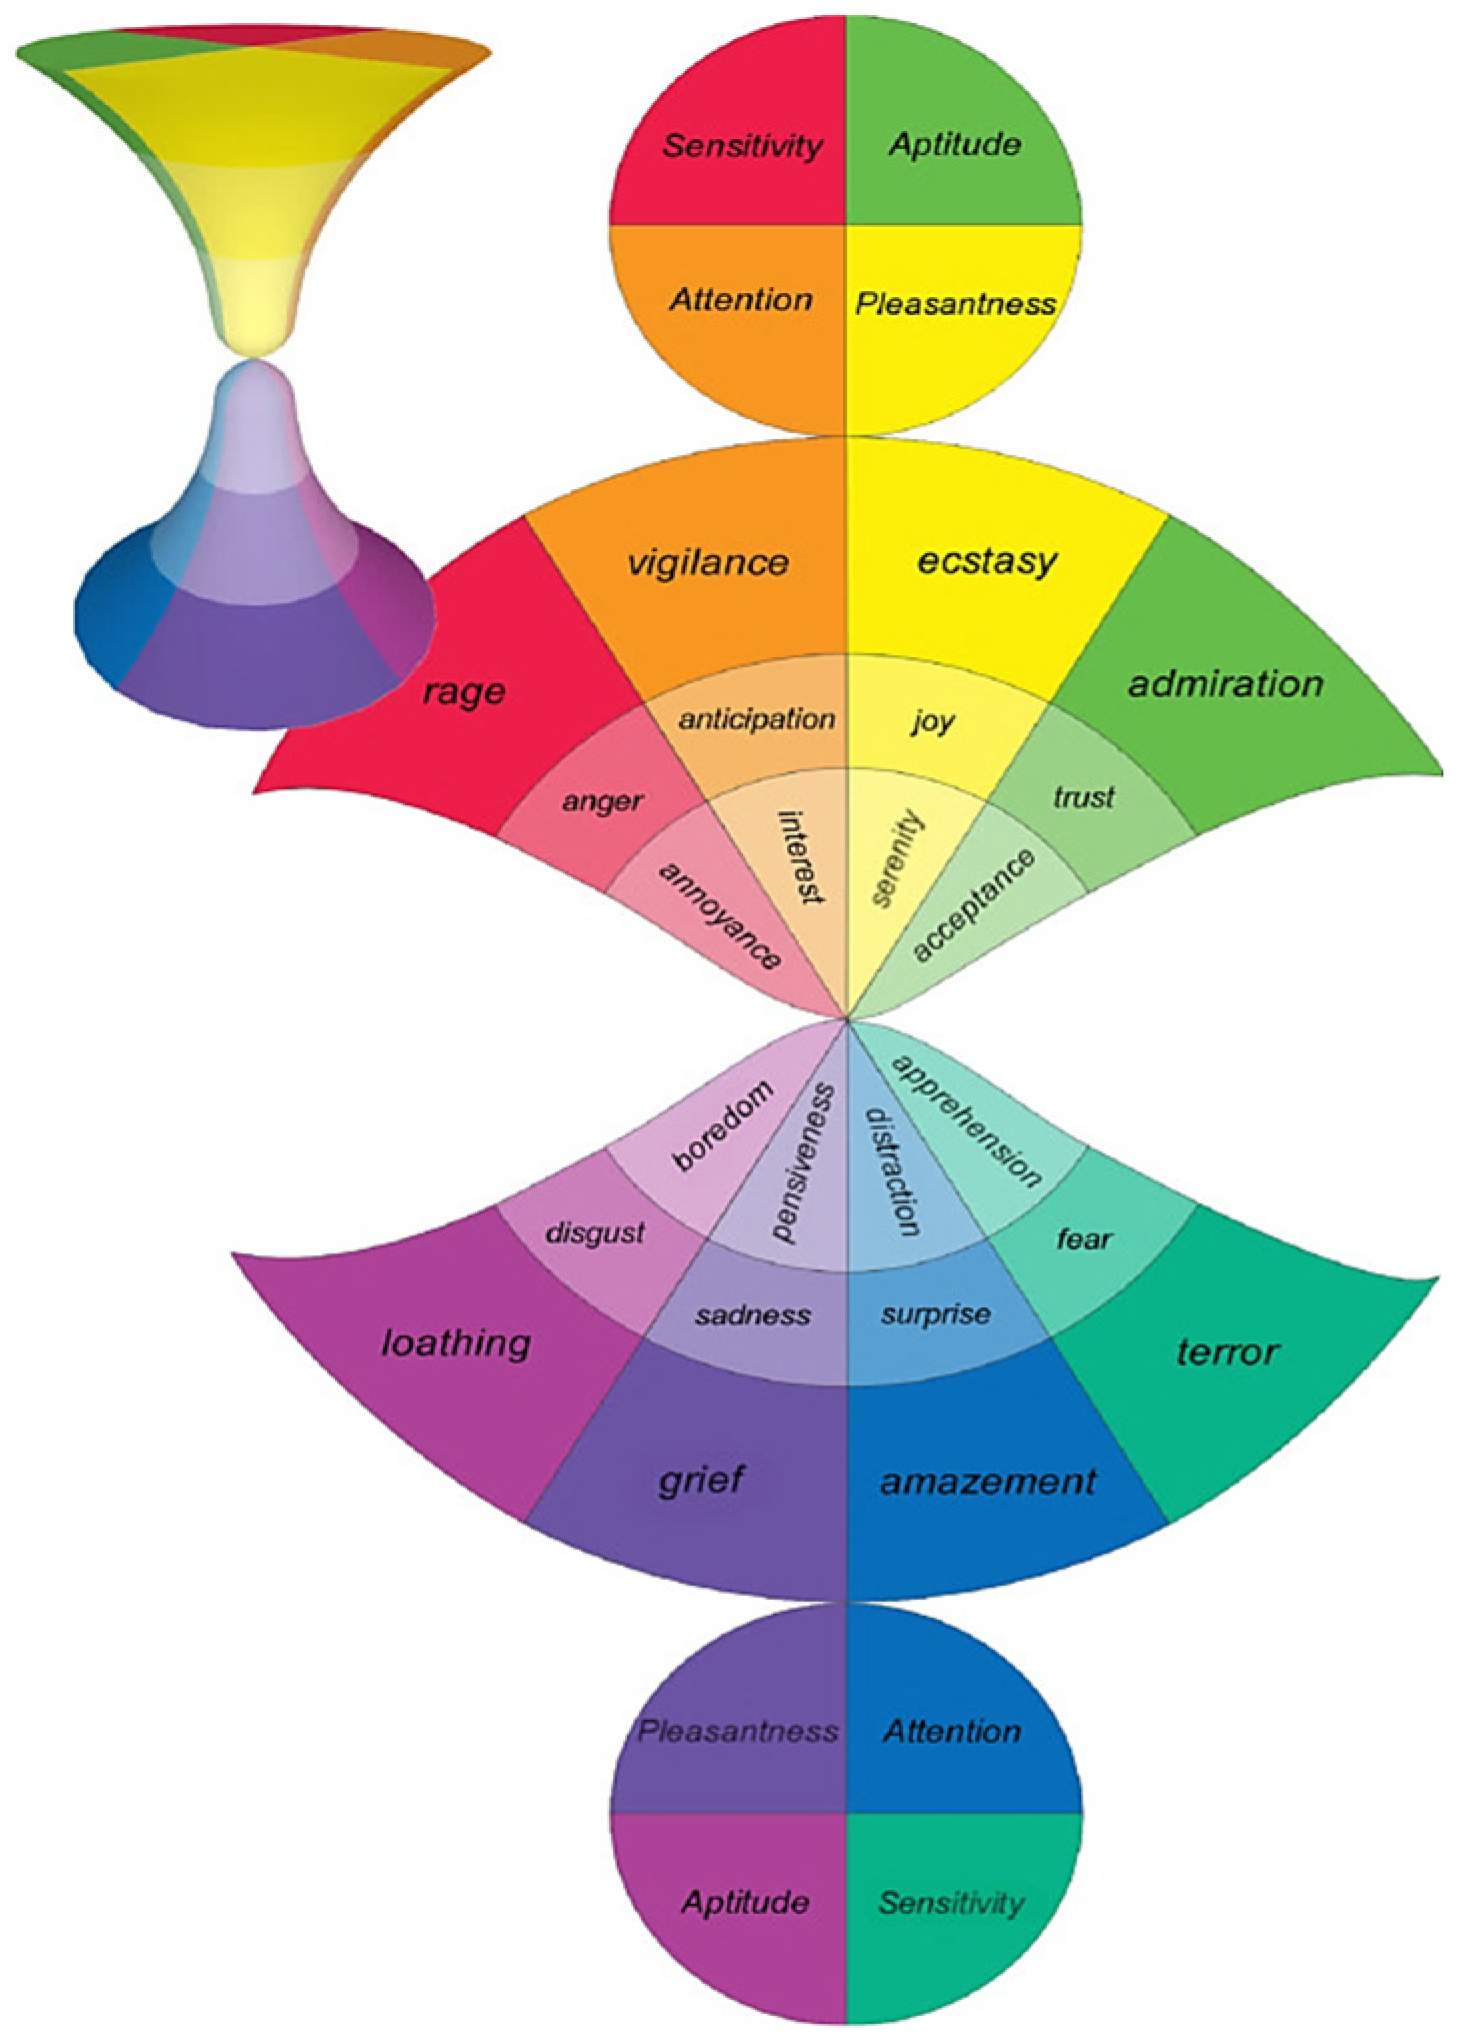
Figure 5.
The “Hourglass of Emotions” proposed by Cambria et al. [
51].
Figure 5.
The “Hourglass of Emotions” proposed by Cambria et al. [
51].
Figure 6.
Some feelings and their locations within the affect circumplex according to the factors of “pleasure” and “activation” (from Warr and Inceoglu [
55]) which may be regarded to be equivalent to “valence” and “arousal,” respectively, mentioned in [
52,
53].
Figure 6.
Some feelings and their locations within the affect circumplex according to the factors of “pleasure” and “activation” (from Warr and Inceoglu [
55]) which may be regarded to be equivalent to “valence” and “arousal,” respectively, mentioned in [
52,
53].
Figure 7.
Multimodal interaction framework with Four-layer modular design proposed by Jonell et al. [79].
Figure 7.
Multimodal interaction framework with Four-layer modular design proposed by Jonell et al. [79].
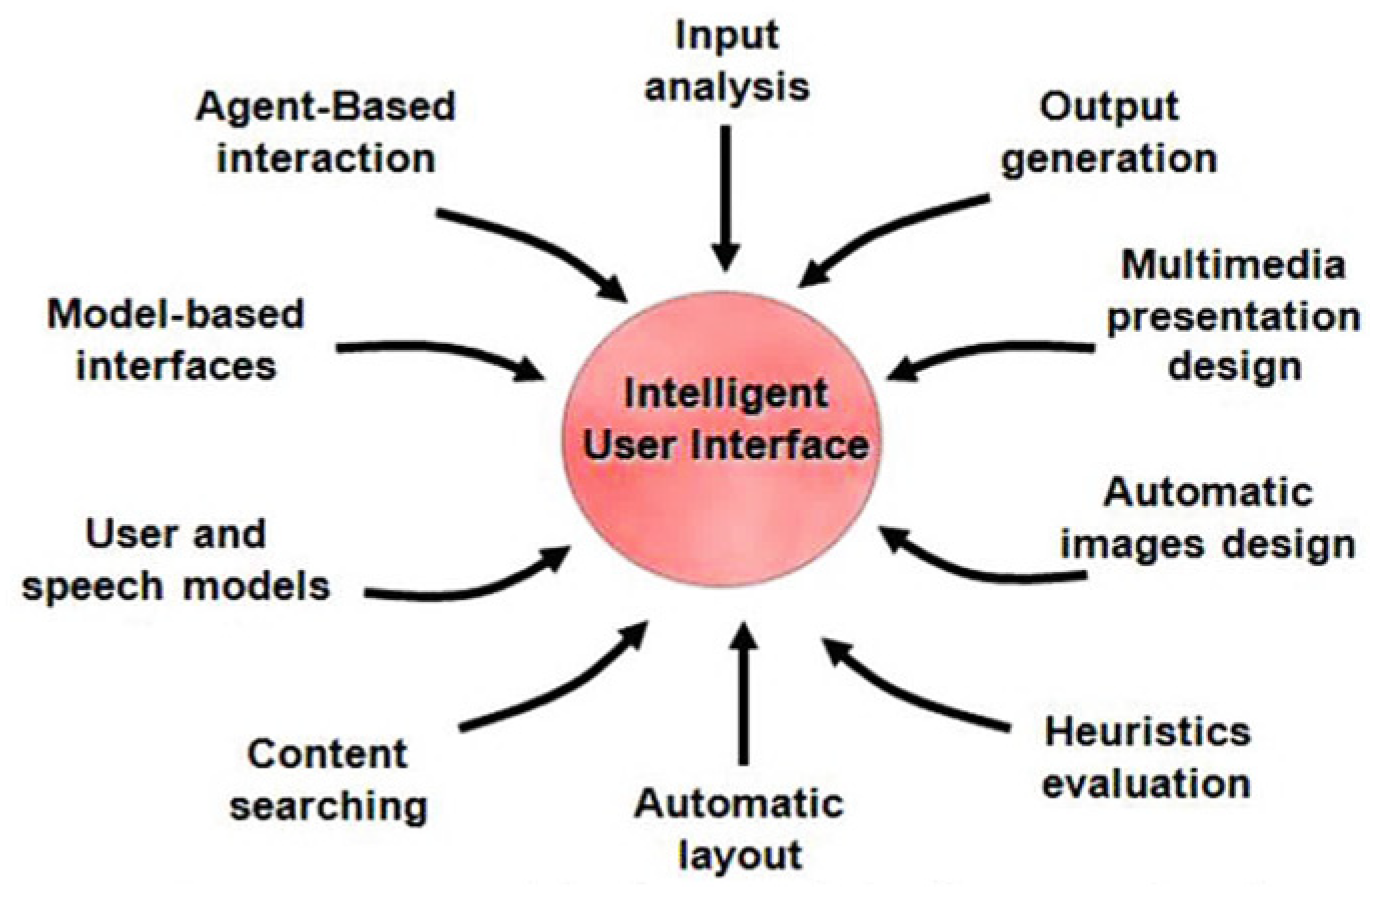
Figure 8.
Framework for intelligent user interfaces (Jalil [84]).
Figure 8.
Framework for intelligent user interfaces (Jalil [84]).
Figure 9.
The flow of research in this study.
Figure 9.
The flow of research in this study.
Figure 10.
The process of prototype system development in this study.
Figure 10.
The process of prototype system development in this study.
Figure 11.
Hierarchical Structure of User Needs.
Figure 11.
Hierarchical Structure of User Needs.
Figure 12.
Illustration of the proposed Emotion Drift System and its experiment environment. (a) An illustration. (b) The real experiment environment.
Figure 12.
Illustration of the proposed Emotion Drift System and its experiment environment. (a) An illustration. (b) The real experiment environment.
Figure 13.
Architecture of the proposed Emotion Drift System.
Figure 13.
Architecture of the proposed Emotion Drift System.
Figure 14.
The hand movement axes principle of the Leap Motion sensor.
Figure 14.
The hand movement axes principle of the Leap Motion sensor.
Figure 15.
The relative spatial coordinate diagram of the Leap Motion Sensor.
Figure 15.
The relative spatial coordinate diagram of the Leap Motion Sensor.
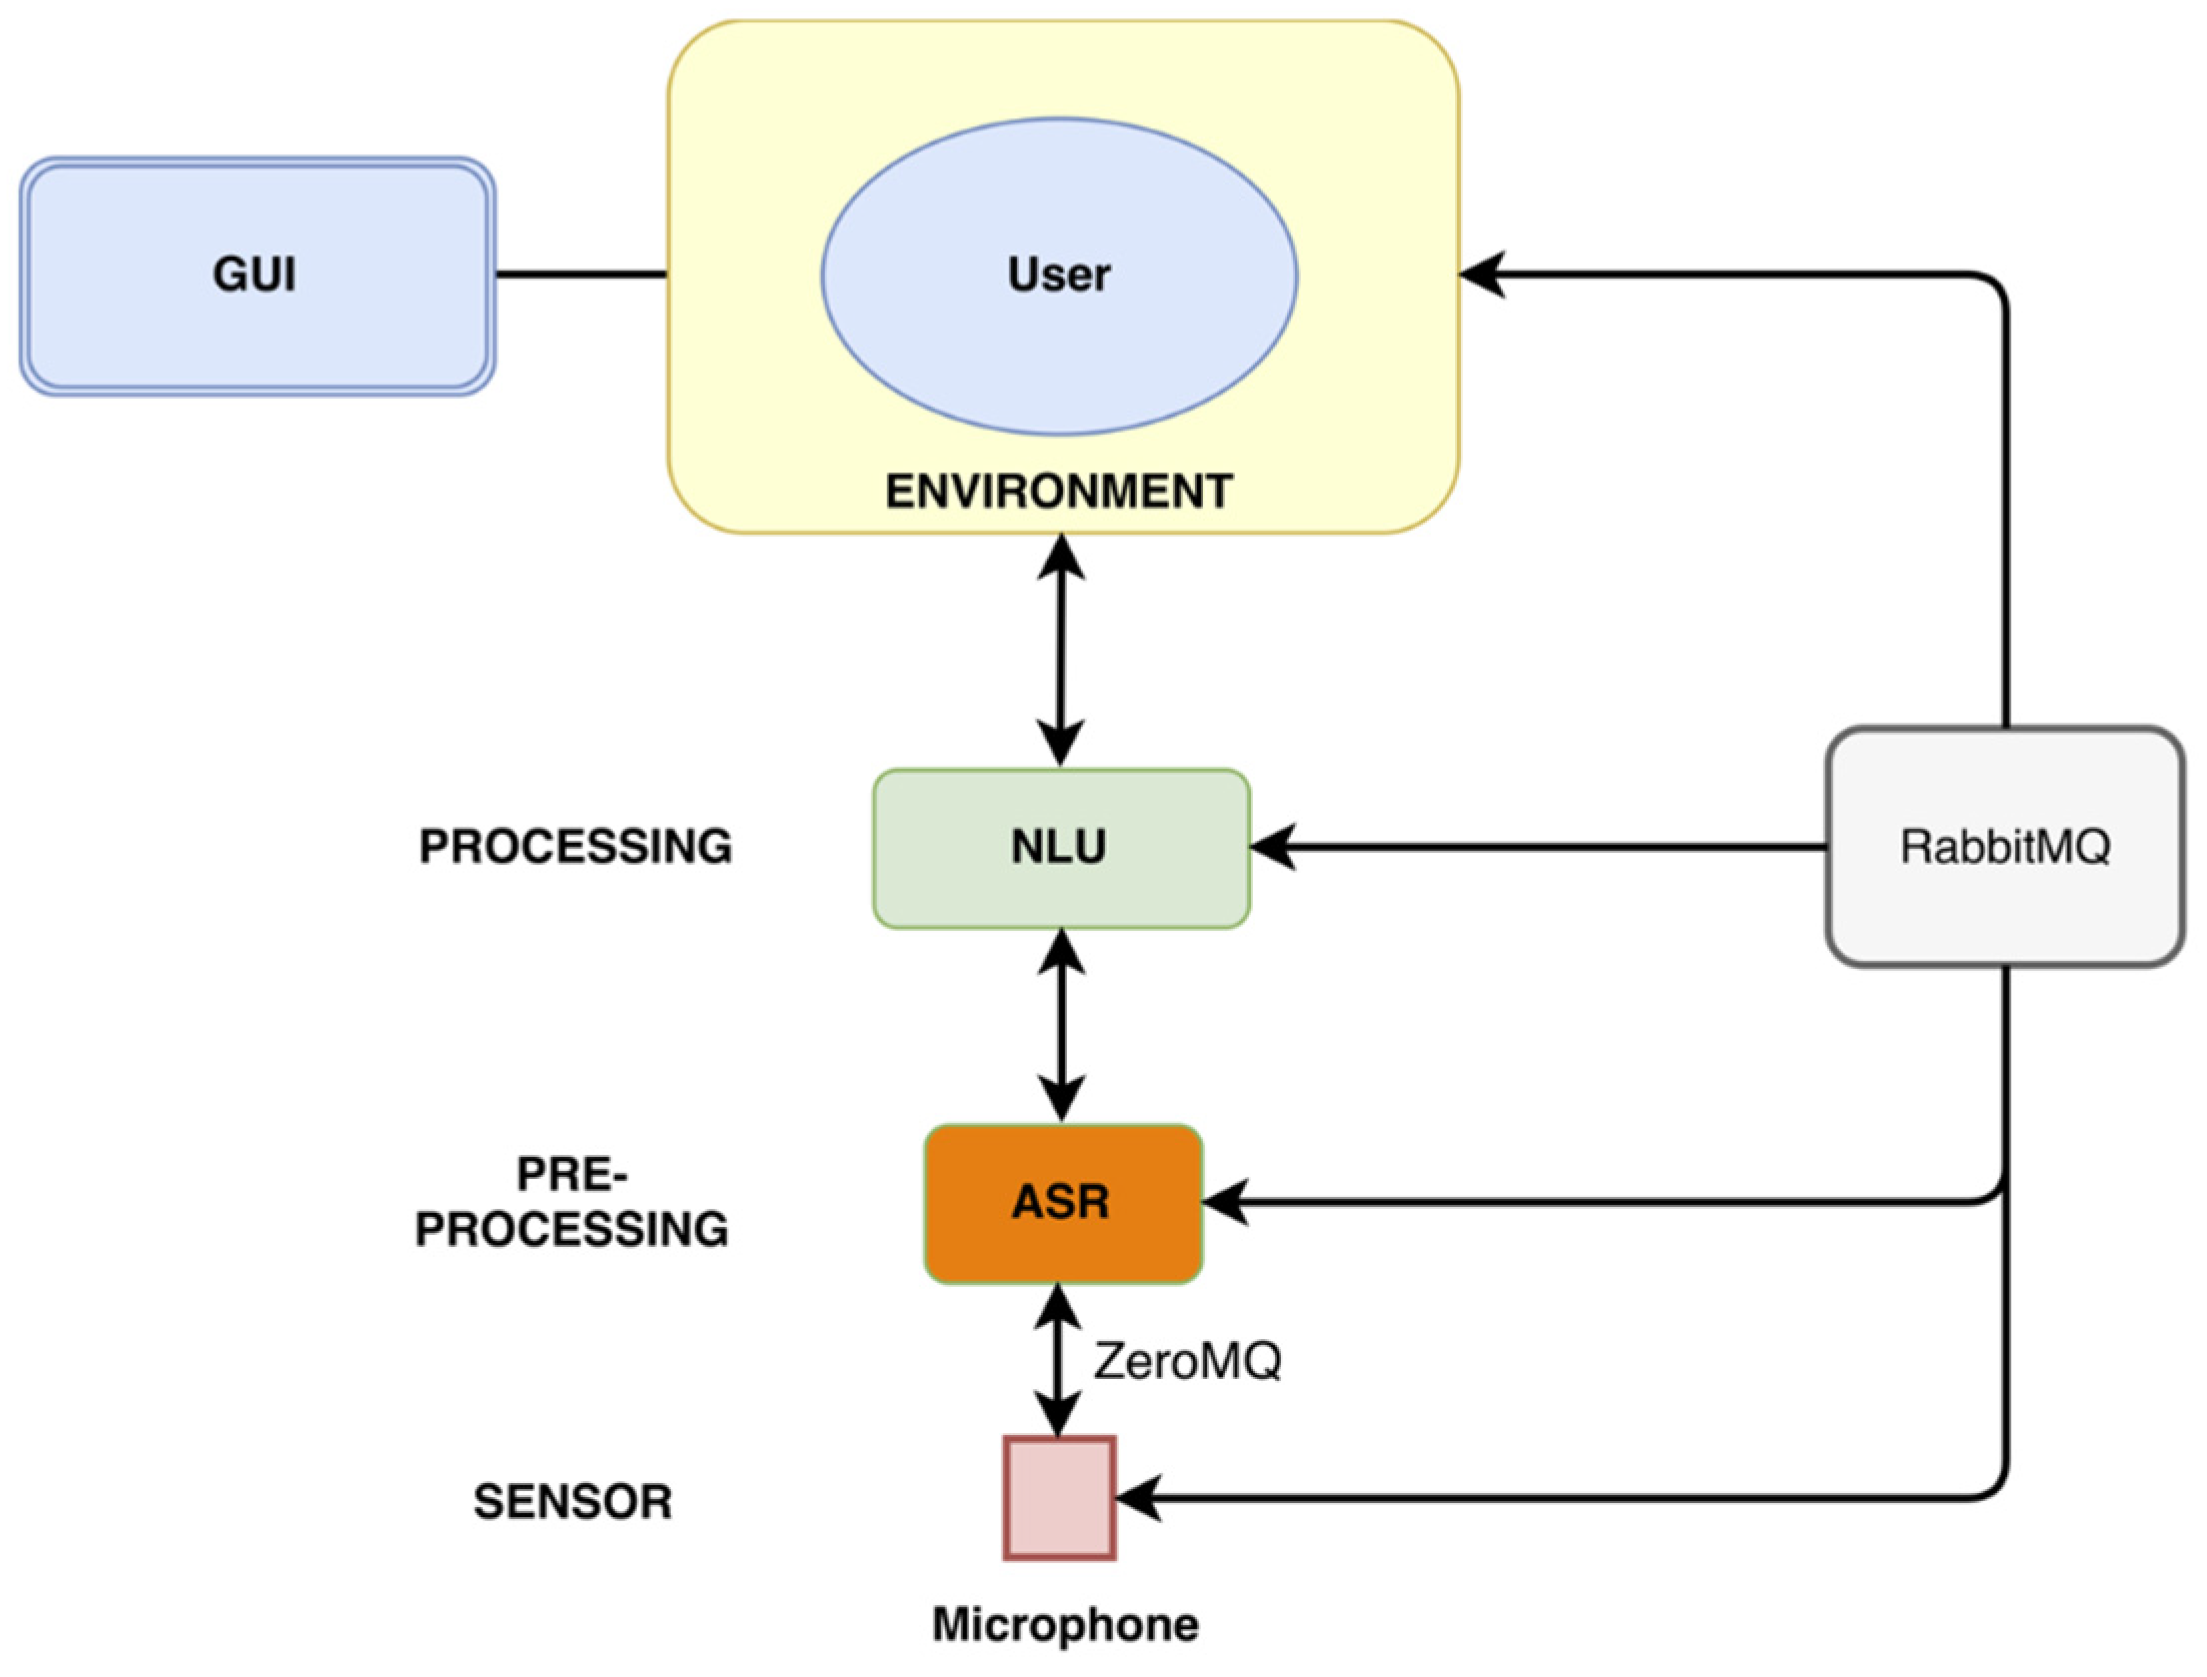
Figure 17.
Flowchart of semantics and sentiment analyses.
Figure 17.
Flowchart of semantics and sentiment analyses.
Figure 19.
Emotion states and their locations within the affect circumplex according to the factors of “meditation” and “attention” (a copy of
Figure 6 but with the
X- and
Y-axes being re-named as meditation and attention, respectively, for use in this study.).
Figure 19.
Emotion states and their locations within the affect circumplex according to the factors of “meditation” and “attention” (a copy of
Figure 6 but with the
X- and
Y-axes being re-named as meditation and attention, respectively, for use in this study.).
Figure 20.
User interface showing the scales of the four parameters of emotion, sensibility, relaxation, and focusing (a copy of the illustration shown in Step 4.1 of
Table 8).
Figure 20.
User interface showing the scales of the four parameters of emotion, sensibility, relaxation, and focusing (a copy of the illustration shown in Step 4.1 of
Table 8).
Figure 21.
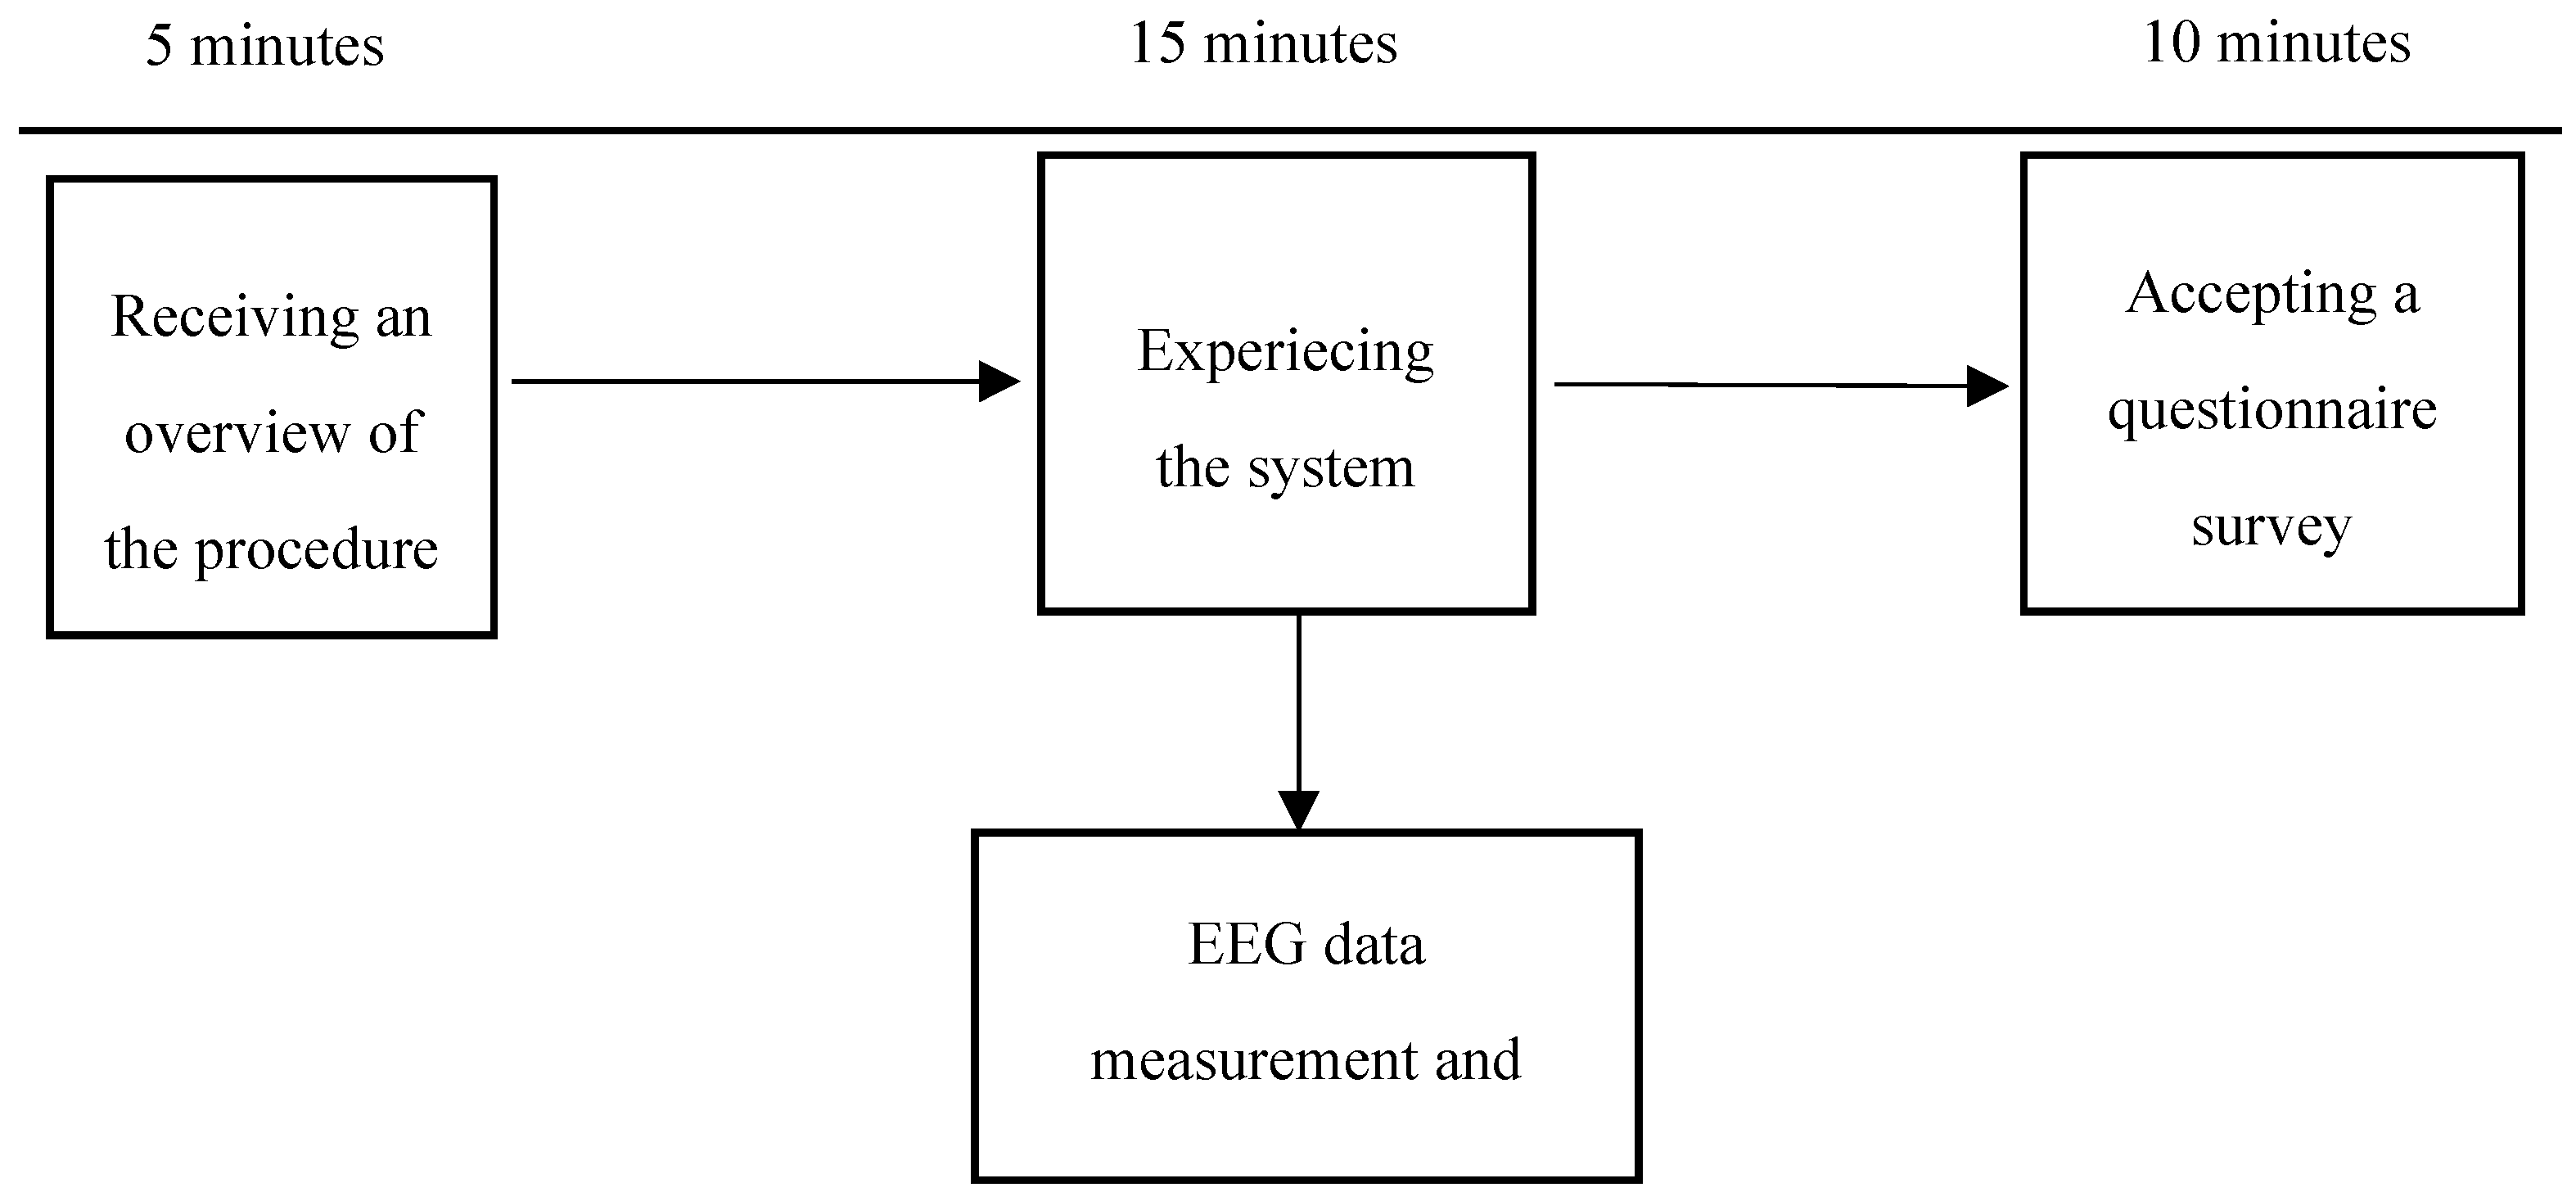
Experiment procedure of this study for the user to participate.
Figure 21.
Experiment procedure of this study for the user to participate.
Figure 22.
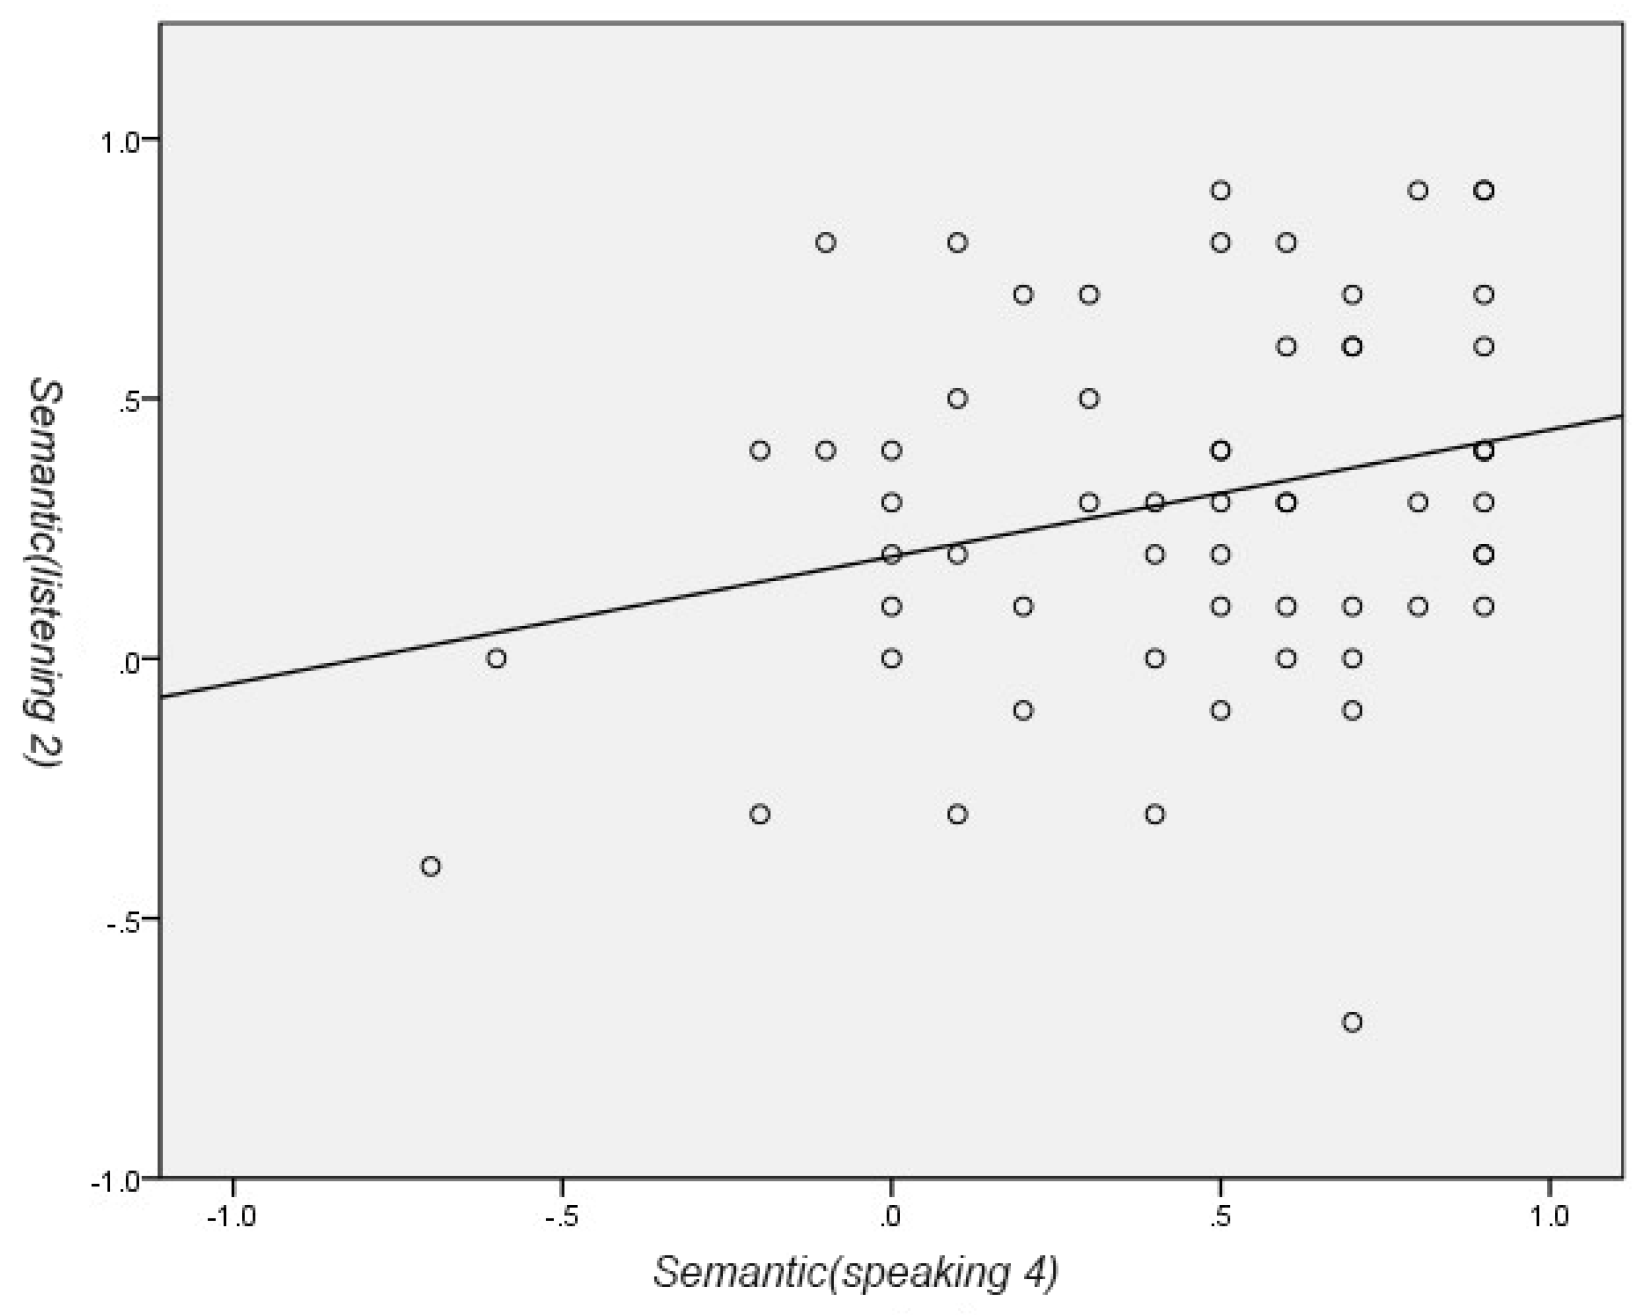
The distribution of the data pairs of semantic (listening 2) (the semantic scores for the second message shared by the previous user) as the Y-values and semantic (speaking 4) (the the semantic scores for the fourth message shared by the current user) as the X-values.
Figure 22.
The distribution of the data pairs of semantic (listening 2) (the semantic scores for the second message shared by the previous user) as the Y-values and semantic (speaking 4) (the the semantic scores for the fourth message shared by the current user) as the X-values.
Figure 23.
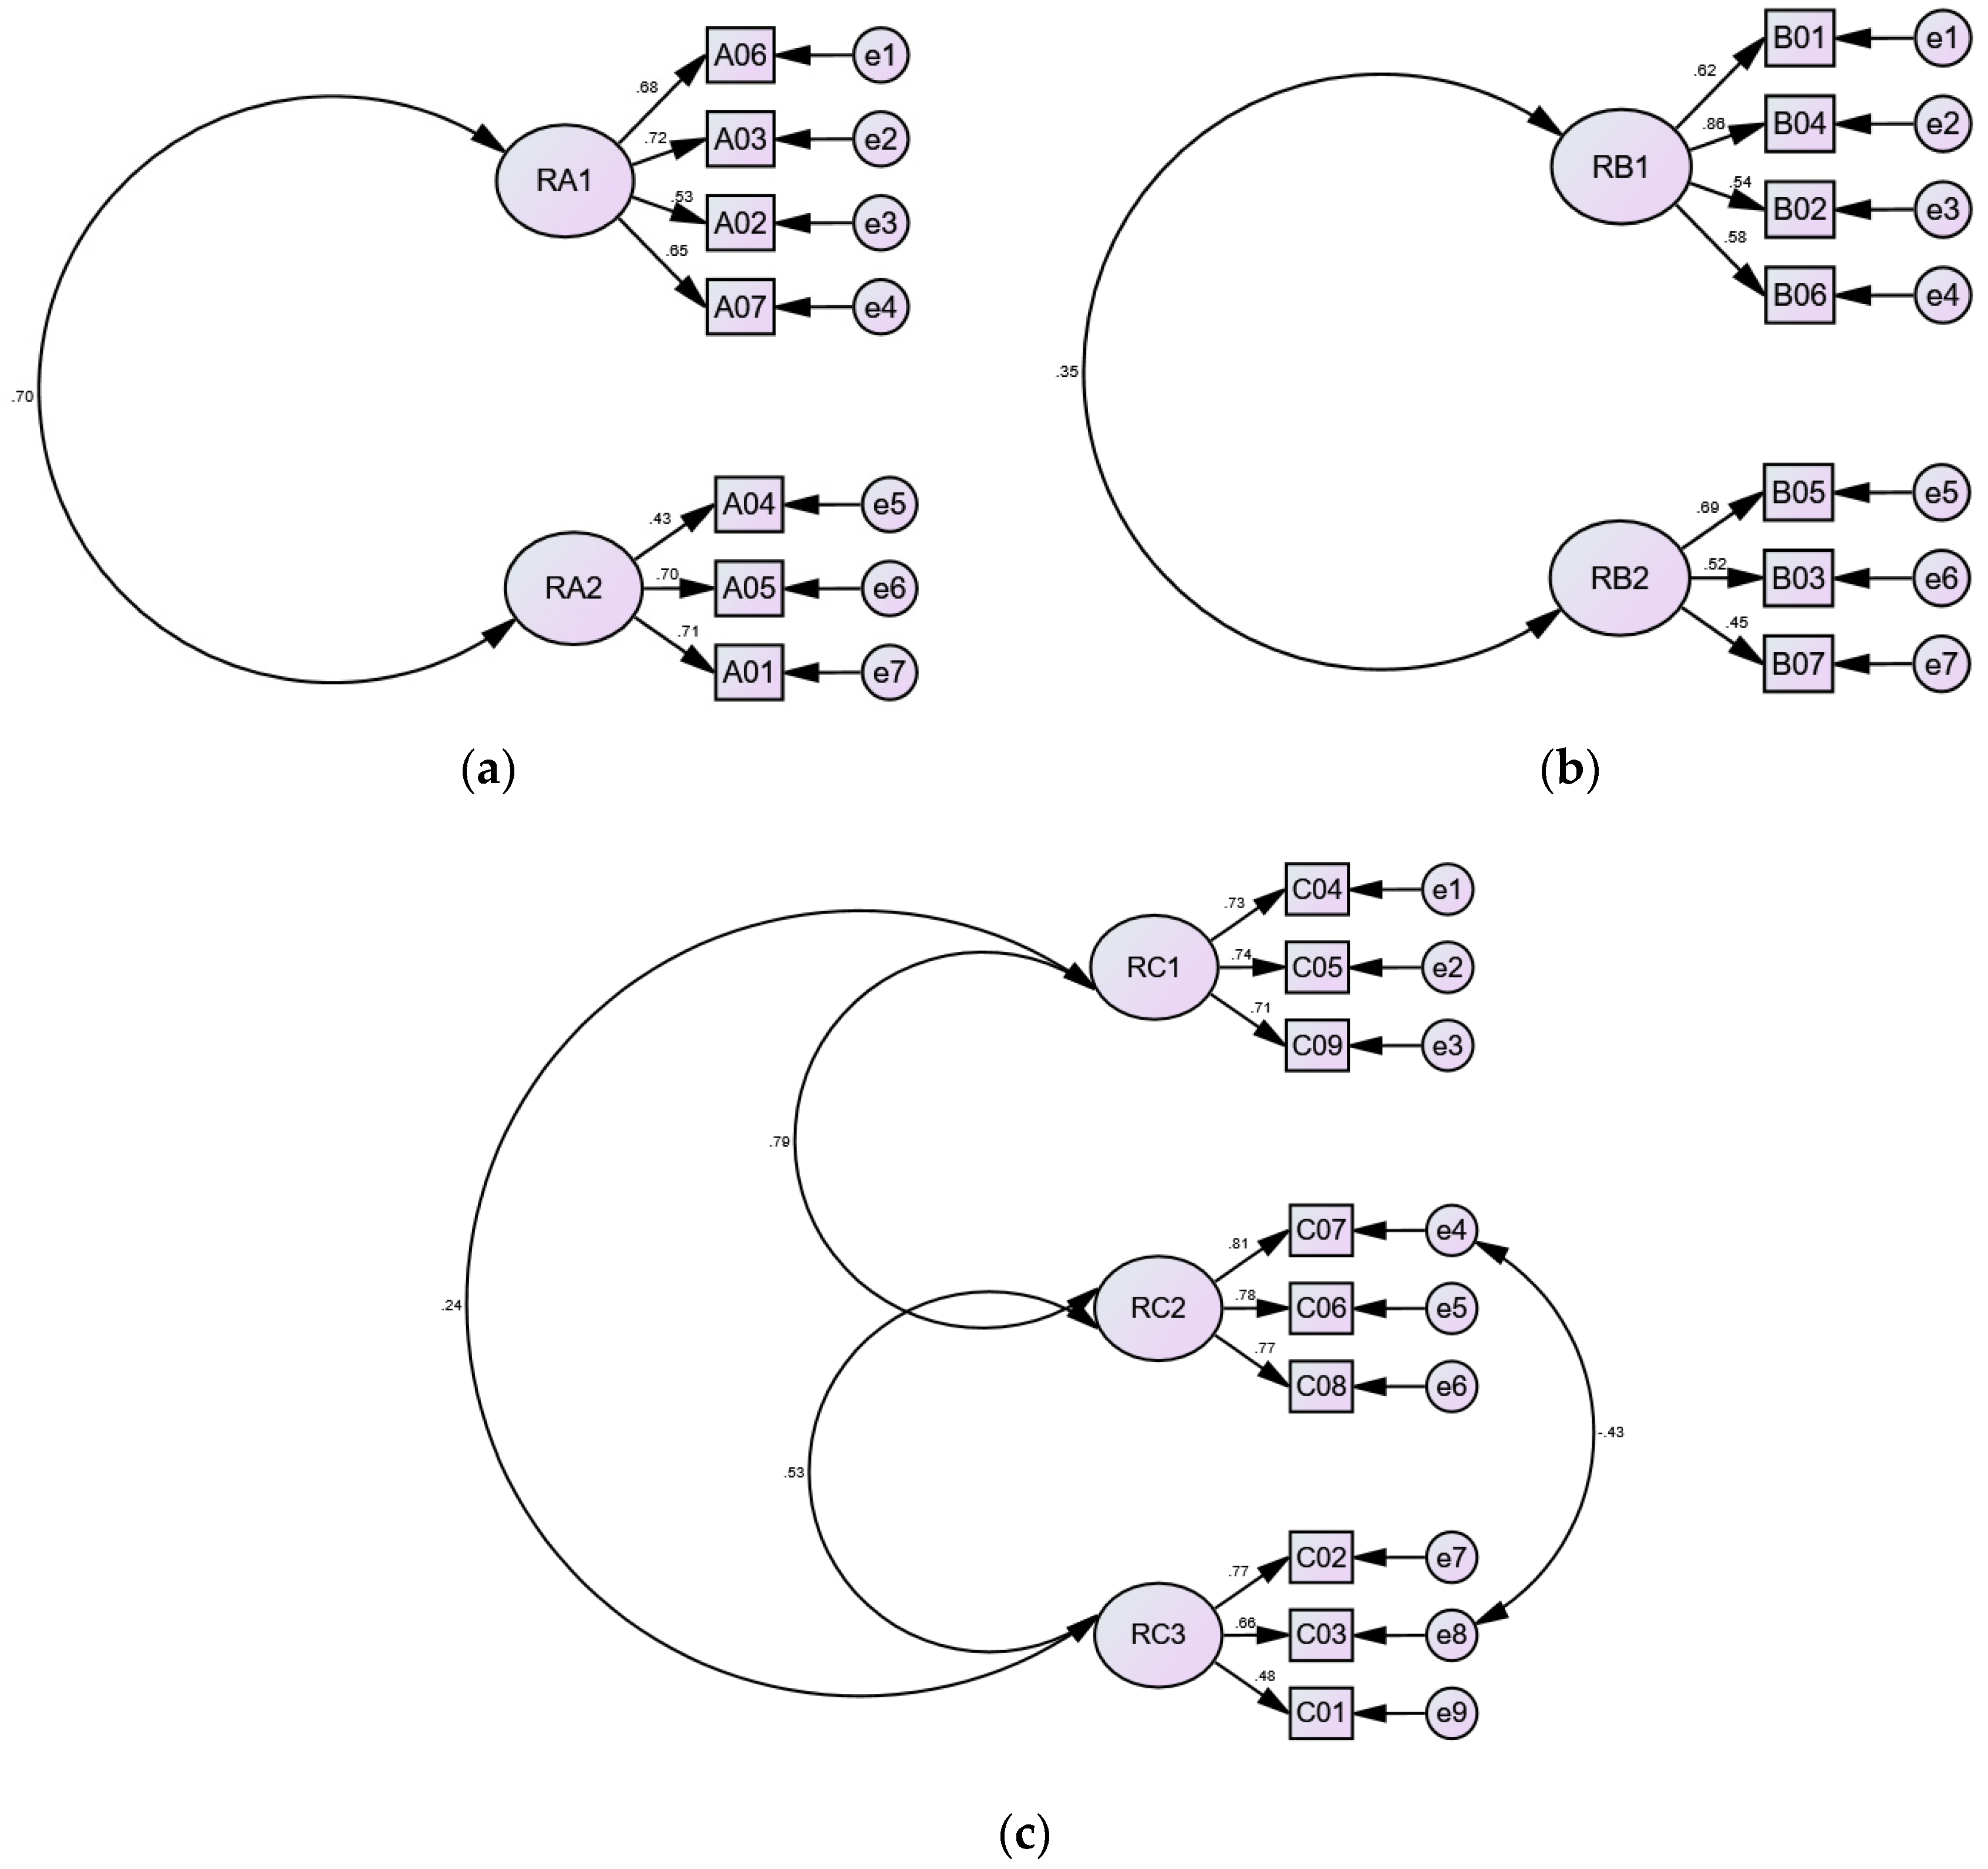
Results of confirmatory factor analysis (CFA) using the AMOS package. (a) Diagram of the structural model of the dimension of “system usability” generated through CFA; (b) Diagram of the structural model of the dimension of “interactive experience” generated Through CFA; (c) Diagram of the structural model of the dimension of “pleasure experience” generated Through CFA.
Table 1.
High-quality connections (HQCs) and related key mechanisms.
Table 1.
High-quality connections (HQCs) and related key mechanisms.
| Key Factor |
Mechanism |
Positive Behavior |
| Cognition |
Personal cognition is crucial for establishing interpersonal connections. Individuals process consciousness and impressions through psychological cognition, which adjusts relationship dynamics and influences final behaviors. |
attention, memory, perception, perspective-taking |
| Affection |
Emotions arise from interactions between individuals and their environment. Emotional reactions are triggered by issues in interpersonal interactions, aiding in the understanding of emotional tendencies in relationships. The affective mechanism regulates thoughts, body, and feelings. |
gratitude, empathy, compassion, concern for others |
| Behavior |
Behavior is a key factor in interpersonal communication, reflecting actual responses or actions towards people, events, and things. These actions, driven by internal intentions, manifest externally and can significantly influence interpersonal relationships. |
Respect, participation, interpersonal assistance, playful interaction |
Table 2.
Descriptions of Brainwave Types.
Table 2.
Descriptions of Brainwave Types.
| Brainwave Type |
Frequency |
Physiological State |
|
δ wave |
0–4 Hz |
Occurring during deep sleep |
|
θ wave. |
4–8 Hz |
Occurring during deep dreaming and deep meditation |
|
α wave |
8–13 Hz |
Occurring when the body is relaxed and at rest. |
|
β wave |
13–30 Hz |
Occurring during states of neurological alertness, focused thinking, and vigilance. |
Table 3.
Forms of Interaction and Applications in Affective Computing Related Cases.
Table 3.
Forms of Interaction and Applications in Affective Computing Related Cases.
| Name of the work |
Interaction Type |
Application Area |
| Kismet (1999) [45] |
Image Recognition, Semantic Analysis |
Interpersonal Communication |
| eMoto (2007) [65] |
Gesture Detection, Pressure Sensors |
Interpersonal Communication |
| MobiMood (2010) [66] |
Manual Input, Pressure Sensors |
Interpersonal Communication |
| Feel Emotion (2015) [67] |
Skin Conductance, Heart Rate Sensors |
Assistive Psychological Diagnosis |
| Moon Light (2015) [68] |
Skin Conductance, Heart Rate Sensors |
Assistive Psychological Diagnosis |
| Woebot (2017) [69] |
Semantic Analysis, Chatbots |
Assistive Psychological Diagnosis |
| What is your scent today? (2018) [70] |
Big Data Collection, Semantic Analysis |
Tech-Art Creation |
Table 4.
Motivations and outcomes of related affective computing cases.
Table 4.
Motivations and outcomes of related affective computing cases.
| Name of the Work |
Motivation of the Work |
Interaction Content |
Result of the Work |
| Kismet (1999) [45] |
Exploring social behaviors between infants and caregivers and the expression of emotions through perception. |
Waving and moving within the machine’s sight to provide emotional stimuli (happiness, sadness, anger, calmness, surprise, disgust, fatigue, and sleep). |
Responding similarly to an infant, showing sadness without stimulation and happiness during interaction. |
| eMoto (2007) [65] |
Starting from everyday communication scenarios and designing emotional experiences centered on the user. |
Interacting by pen pressure with emotional colors based on the Emotional Circumplex Model, allowing for the free pairing of emotional colors. |
Allowing users to observe and become aware of their own and others’ emotions in realtime, noting emotional shifts and changes throughout interactions. |
| MobiMood (2010) [66] |
Using emotions as a medium for communication, aiming at enhancing interpersonal relationships. |
Users can select and adjust the intensity of emotions (e.g., sadness, energy, tension, happiness, anger). |
Enabling personal expression and sharing, fostering positive social interactions. |
| Feel Emotion (2015) [67] |
Monitoring users’ physiological information to observe and adjust their emotional states. |
Employing wearable devices to monitor users’ physiological information. |
Sensing emotional changes in realtime to achieve proactive emotional management. |
| Moon Light (2015) [68] |
Understanding and cultivating self-awareness and control through physiological data. |
Controls the corresponding environmental light color based on the current physiological information. |
Exploring how feedback from biosensor data affects interpersonal interactions. |
| Woebot (2017) [69] |
Replacing traditional psychological counseling with digital resources. |
Offering cognitive behavioral therapy through conversations and chatbot-assisted functions. |
Regulating users’ emotions to counteract negative and irrational cognitive thinking and emotions. |
| What is your scent today? (2018) [70] |
Analyzing the emotions of information from social media using classifiers. |
Conducting text mining for emotions (anger, disgust, fear, happiness, sadness, surprise). |
Based on analyzed emotional information, adjusting fragrance blends to reflect emotional proportions and using scents to symbolize emotions. |
Table 5.
Design principles for multi-sensing interfaces.
Table 5.
Design principles for multi-sensing interfaces.
| Design Principle |
Description |
Notes |
| Sensitivity |
Improving the accuracy of information recognition and provide a seamless experience |
Integrating human sensory input and showing natural expression characteristics |
| Flexibility |
Avoiding similar commands and preprocess related function commands |
Conducting modular system design, including expressions and operations for commanding objects |
| Measurement Range |
Providing equipment or functions for distant control of physical or virtual objects |
Using depth cameras and non-contact sensing devices |
Table 6.
Related cases of existing systems with multi-sensing interactive interfaces.
Table 6.
Related cases of existing systems with multi-sensing interactive interfaces.
| Name of the Work |
Sensing Interface |
Interaction Style |
Application Domain |
Affective Computing |
| Speech, Gesture controlled wheelchair platform (2015) [87] |
Gesture Recognition, Voice Recognition, Physical Interfaces |
Integrating multimodal interfaces with visual feedback for remote control using physical devices. |
Intelligent life |
No |
| SimaRobot (2016) [88] |
Voice Recognition, Image Recognition |
Simulating, listening to, and empathizing with users’ emotions based on personal emotional information. |
Education & learning,
healthcare |
Yes |
| Gesto (2019) [89] |
Voice Recognition, Gesture Recognition |
Automatically executing customizable tasks. |
Intelligent life |
No |
| Emotion-based Music Composition System (2020) [90] |
Physical Interfaces, Tone Recognition |
Determining emotions through melody, pitch, volume, rhythm, etc. |
Art creation |
Yes |
| Industrial Robot (2020) [91] |
Voice Recognition, Gesture Recognition |
Using digital twin technology to achieve an integrated virtual and physical interactive experience. |
Intelligent life |
No |
| UAV multimodal interaction integration system (2022) [6] |
Voice Recognition, Gesture Recognition |
Controling drones and scenes within a virtual environment. |
Intelligent life |
No |
Table 7.
The dimensions and questions of the questionaire survey in this study.
Table 7.
The dimensions and questions of the questionaire survey in this study.
| Dimension |
Questions |
| System Usability |
- A1.
The interaction instructions help me quickly become familiar with the system. |
- A2.
I am able to understand and become familiar with each function of the system. |
- A3.
I find the system’s functionality intuitive. |
- A4.
The emotions output by the system seem accurate. |
- A5.
The process of picking up the message bottle and listening to the message is coherent. |
- A6.
The various functions of the system are well integrated. |
- A7.
I would like to use this system frequently. |
| Interactive Experience |
- B1.
The system helps me care more about others. |
- B2.
The system helps improve my mood when I am feeling down. |
- B3.
I feel uncomfortable with others hearing or seeing the content I use on the system. |
- B4.
The system enhances my empathy. |
- B5.
I feel lonely while using the system. |
- B6.
I feel relieved not to interact face-to-face with others when using the system. |
- B7.
Using the system is similar to using online social networks. |
| Pleasure Experience |
- C1.
I feel special when using the system. |
- C2.
I feel relaxed during the “rowing” interaction process. |
- C3.
The “sharing experiences” process makes me feel relieved. |
- C4.
I find the system’s interactive experience interesting. |
- C5.
I believe the system can enrich my life experience. |
- C6.
I am interested in actively using the system. |
- C7.
I enjoy using the system. |
- C8.
I easily immerse myself in the system. |
- C9.
Time seems to fly when I am using the system. |
Table 10.
Gesture Command Table.
Table 11.
Examples of emotions with corresponding numerical S and M values yielded by semantics and sentiment analyses [134].
Table 11.
Examples of emotions with corresponding numerical S and M values yielded by semantics and sentiment analyses [134].
| Emotion states |
Example values |
Explanation |
| Clearly positive |
score S: 0.8; magnitude M: 3.0 |
High positive emotion with a large amount of emotional vocabulary |
| Clearly nagative |
score S: -0.6; magnitude M: 4.0 |
High negative emotion with a large amount of emotional vocabulary |
| Neutral |
score S: 0.1; magnitude M: 0.0 |
Low positive emotion with relatively few emotional words |
Mixed
(lacking emotional expression) |
score S: 0.0; magnitude M: 4.0 |
No obvious trend of positive or negative emotions overall. (The text expresses both positive and negative emotional vocabulary sufficiently.) |
Table 12.
Colored scale visualization of the sentiment-related and emotion-related data.
Table 12.
Colored scale visualization of the sentiment-related and emotion-related data.
| Original values |
Value range |
Scale & letter color |
Color range |
Meaning |
| Score |
-1.0 ~ +1.0 |
red |
0 ~ 255 |
Emotion |
| Magnitude |
0.0 ~ +∞ |
transparent |
0 ~ 255 |
Sensibility |
| Meditation |
0 ~ 100 |
green |
0 ~ 255 |
Relaxation |
| Attention |
0 ~ 100 |
blue |
0 ~ 255 |
Focusing |
Table 13.
Determination of classes of correlation coefficients.
Table 13.
Determination of classes of correlation coefficients.
| Correlation class |
Low Correlation |
Moderate Correlation |
High Correlation |
| Decision threshold |
< 0.3 |
0.3 ~ 0.7 |
> 0.7 |
Table 14.
Determination of significance levels of correlation coefficients.
Table 14.
Determination of significance levels of correlation coefficients.
| Significance level |
Significant |
High significant |
Very significant |
| Decision threshold |
p < 0.05 |
p < 0.01 |
p < 0.001 |
| Coefficient c with asterisk(s) |
c* |
c** |
c*** |
Table 15.
The correlation parameters of the Pearson Test between the semantic of the 2nd message left by the previous user (and listened to by the current user) and the semantic of the 4th message spoken by the current user.
Table 15.
The correlation parameters of the Pearson Test between the semantic of the 2nd message left by the previous user (and listened to by the current user) and the semantic of the 4th message spoken by the current user.
| Pearson Correlation Analysis |
Correlation coefficient c
|
.266* |
| Significance value p
|
.040 |
| *When p < 0.05, the correlation is “significant.” |
Table 16.
The semantic scores of the 2nd message left by the previous user (and listened to by the current user) and the semantic of the 4th message spoken by the current user.
Table 16.
The semantic scores of the 2nd message left by the previous user (and listened to by the current user) and the semantic of the 4th message spoken by the current user.
| Interaction |
Average semantic score of 50 users |
Standard Deviation of semantic score of 50 users |
|
Semantic (listening 2) |
0.30 |
0.36 |
|
Semantic (speaking 4) |
0.44 |
0.39 |
Table 17.
Fifteen cases of four types of correlation of emotion data explored in this study.
Table 17.
Fifteen cases of four types of correlation of emotion data explored in this study.
| Case No. |
Type |
Emotion dataset 1 |
Emotion dataset 2 |
Correlation coefficient |
Signeficance value p
|
Significance level |
| 1 |
1 |
Semantic (listening 2) |
Semantic (speaking 4) |
.266* |
.040 |
significant |
| 2 |
2 |
Semantic (listening 3) |
Meditation (speaking 4) |
.397** |
.002 |
highly significant |
| 3 |
2 |
Semantic (listening 3) |
Meditation (speaking 1) |
.386** |
.002 |
highly significant |
| 4 |
2 |
Semantic (listening 4) |
Attention (speaking 1) |
.285* |
.027 |
significant |
| 5 |
3 |
Meditation (listening 2) |
Meditation (listening 3) |
.394** |
.002 |
highly significant |
| 6 |
3 |
Meditation (listening 3) |
Meditation (listening 4) |
.344** |
.007 |
highly significant |
| 7 |
3 |
Attention (listening 1) |
Attention (listening 2) |
.594*** |
.000 |
very significant |
| 8 |
3 |
Attention (listening 2) |
Attention (listening 3) |
.722*** |
.000 |
very significant |
| 9 |
3 |
Attention (listening 3) |
Attention (listening 4) |
.667*** |
.000 |
very significant |
| 10 |
4 |
Meditation (speaking 1) |
Meditation (speaking 2) |
.277* |
.032 |
significant |
| 11 |
4 |
Meditation (speaking 2) |
Meditation (speaking 3) |
.262* |
.043 |
significant |
| 12 |
4 |
Meditation (speaking 3) |
Meditation (speaking 4) |
.626*** |
.000 |
very significant |
| 13 |
4 |
Attention (speaking 1) |
Attention (speaking 2) |
.477*** |
.000 |
very significant |
| 14 |
4 |
Attention (speaking 2) |
Attention (speaking 3) |
.417** |
.001 |
highly significant |
| 15 |
4 |
Attention (speaking 3) |
Attention (speaking 4) |
.316* |
.014 |
significant |
Table 18.
Percentages of users’ emotions in the interaction phases of message listening.
Table 18.
Percentages of users’ emotions in the interaction phases of message listening.
| Interaction phase |
Enthusiasm quadrant |
Comfort quadrant |
Depression quadrant |
Anxiety qhadrant |
| Listening phase (I) |
40% |
20% |
15% |
25% |
| Listening phase (II) |
37% |
22% |
10% |
32% |
| Listening phase (III) |
32% |
37% |
13% |
18% |
| Listening phase (IV) |
27% |
37% |
12% |
25% |
Table 19.
Percentages of users’ emotions in the interaction phases of message sharing.
Table 19.
Percentages of users’ emotions in the interaction phases of message sharing.
| Interaction phase |
Enthusiasm quadrant |
Comfort quadrant |
Depression quadrant |
Anxiety qhadrant |
| Sharing phase (I) |
20% |
45% |
15% |
20% |
| Sharing phase (II) |
25% |
40% |
17% |
18% |
| Sharing phase (III) |
25% |
38% |
22% |
15% |
| Sharing phase (IV) |
30% |
40% |
13% |
17% |
Table 20.
Statistical summary of the basic information of the research sample.
Table 20.
Statistical summary of the basic information of the research sample.
| Basic information |
Category |
Number of samples |
Percentage |
| Sex |
Male |
22 |
37% |
| Female |
38 |
63% |
| Age |
18~25 |
46 |
77% |
| 26~35 |
13 |
22% |
| 36~45 |
1 |
2% |
| Sxperience of using dating software |
Yes |
47 |
78% |
| No |
13 |
22% |
Table 21.
Statistics of collected questionnaires according to the five-point Likert scale.
Table 21.
Statistics of collected questionnaires according to the five-point Likert scale.
| Dimension |
Lebel |
Min. |
Max. |
Mean |
Standard deviation |
Strongly agree (5) |
Agree (4) |
Average (3) |
Disagree (2) |
Strongly disagree (1) |
| System usability |
A01 |
3 |
5 |
4.23 |
0.62 |
33% |
57% |
10% |
0% |
0% |
| A02 |
3 |
5 |
4.23 |
0.62 |
33% |
57% |
10% |
0% |
0% |
| A03 |
2 |
5 |
4.28 |
0.86 |
50% |
33% |
12% |
5% |
0% |
| A04 |
2 |
5 |
4.00 |
0.75 |
27% |
48% |
23% |
2% |
0% |
| A05 |
3 |
5 |
4.38 |
0.61 |
45% |
48% |
7% |
0% |
0% |
| A06 |
5 |
5 |
4.43 |
0.59 |
48% |
47% |
5% |
0% |
0% |
| A07 |
2 |
5 |
4.00 |
0.78 |
25% |
55% |
15% |
5% |
0% |
| Interactive experience |
B01 |
1 |
5 |
4.01 |
0.91 |
32% |
47% |
15% |
5% |
1% |
| B02 |
2 |
5 |
3.9 |
0.83 |
25% |
45% |
25% |
5% |
0% |
| B03 |
1 |
5 |
3.43 |
1.19 |
22% |
30% |
25% |
17% |
6% |
| B04 |
2 |
5 |
4.0 |
0.80 |
30% |
47% |
20% |
3% |
0% |
| B05 |
1 |
5 |
4.06 |
0.93 |
35% |
45% |
15% |
2% |
3% |
| B06 |
1 |
5 |
3.97 |
1.13 |
40% |
33% |
15% |
7% |
5% |
| B07 |
1 |
5 |
3.2 |
1.29 |
10% |
48% |
10% |
15% |
17% |
| Pleasure experience |
C01 |
2 |
5 |
3.85 |
0.84 |
23% |
43% |
28% |
5% |
0% |
| C02 |
2 |
5 |
4.31 |
0.81 |
50% |
35% |
12% |
3% |
0% |
| C03 |
3 |
5 |
4.36 |
0.66 |
47% |
43% |
10% |
0% |
0% |
| C04 |
2 |
5 |
4.73 |
0.54 |
77% |
22% |
0% |
1% |
0% |
| C05 |
2 |
5 |
4.26 |
0.77 |
43% |
43% |
10% |
3% |
0% |
| C06 |
2 |
5 |
4.23 |
0.76 |
42% |
42% |
15% |
2% |
0% |
| C07 |
2 |
5 |
4.45 |
0.67 |
53% |
40% |
5% |
2% |
0% |
| C08 |
1 |
5 |
4.28 |
0.88 |
48% |
38% |
8% |
3% |
2% |
| C09 |
1 |
5 |
4.11 |
0.94 |
42% |
35% |
18% |
3% |
2% |
Table 22.
The KMO test measured values and the significance values of Bartlett’s test of the question answer data collected according to the three dimensions as listed in
Table 21.
Table 22.
The KMO test measured values and the significance values of Bartlett’s test of the question answer data collected according to the three dimensions as listed in
Table 21.
| Dimension |
Name of Measure or Test |
Value |
| System usability |
KMO measure of sampling adequacy |
.786 |
| Significance of Bartlett’s test of sphericity |
.000 |
| Interactive experience |
KMO measure of sampling adequacy |
.671 |
| Significance of Bartlett’s test of sphericity |
.000 |
| Pleasure experience |
KMO measure of sampling adequacy |
.778 |
| Significance of Bartlett’s test of sphericity |
.000 |
Table 23.
Rotated component matrix of the 1st dimension “system usability.”.
Table 23.
Rotated component matrix of the 1st dimension “system usability.”.
| Dimension: system usability |
|---|
| Question |
1 |
2 |
| A06 |
.744 |
.168 |
| A03 |
.738 |
.269 |
| A02 |
.733 |
-.004 |
| A07 |
.672 |
.303 |
| A04 |
-.004 |
.772 |
| A05 |
.244 |
.764 |
| A01 |
.369 |
.644 |
Table 24.
Rotated component matrix of the 2nd dimension “interactive experience.”.
Table 24.
Rotated component matrix of the 2nd dimension “interactive experience.”.
| Dimension: interactive experience |
|---|
| Question |
1 |
2 |
| B04 |
.819 |
.178 |
| B01 |
.771 |
-.033 |
| B02 |
.725 |
.068 |
| B06 |
.650 |
.190 |
| B05 |
.029 |
.813 |
| B03 |
.025 |
.740 |
| B07 |
.257 |
.578 |
Table 25.
Rotated component matrix of the 3rd dimension “pleasure experience.”.
Table 25.
Rotated component matrix of the 3rd dimension “pleasure experience.”.
| Dimension: pleasure experience |
|---|
| Question |
1 |
2 |
3 |
| C04 |
.812 |
.167 |
.087 |
| C05 |
.790 |
.195 |
.175 |
| C09 |
.734 |
.321 |
-.166 |
| C07 |
.173 |
.913 |
.167 |
| C06 |
.398 |
.696 |
.207 |
| C08 |
.565 |
.626 |
.107 |
| C02 |
-.077 |
.325 |
.785 |
| C03 |
.405 |
-.075 |
.759 |
| C01 |
-.024 |
.125 |
.702 |
Table 26.
Collection of the questions of the resulting latent dimensions of the three dimensions.
Table 26.
Collection of the questions of the resulting latent dimensions of the three dimensions.
| Dimension |
Category |
Latent dimension |
No. of questions |
Labels of questions |
| System usability |
RA1 |
Functionality |
4 |
A06, A03, A02, A07 |
| RA2 |
Effectiveness |
3 |
A04, A05, A01 |
| Interactive experience |
RB1 |
Empathy |
4 |
B04, B01, B02, B06 |
| RB2 |
Isolation |
3 |
B05, B03, B07 |
| Pleasure experience |
RC1 |
Satisfaction |
3 |
C04, C05, C09 |
| RC2 |
Immersion |
3 |
C07, C06, C08 |
| RC3 |
Relaxation |
3 |
C02, C03, C01 |
Table 27.
The questions of the three dimensions and the seven latent dimensions, as well as corresponding Cronbach’s α coefficient values computed by the SPSS.
Table 27.
The questions of the three dimensions and the seven latent dimensions, as well as corresponding Cronbach’s α coefficient values computed by the SPSS.
| Dimension |
Category |
Latent dimension |
Cronbach’s α Coefficient of the latent dimension |
Cronbach’s α Coefficient of the dimension |
| System usability |
RA1 |
Functionality |
.735 |
.786 |
| RA2 |
Effectiveness |
.604 |
| Interactive experience |
RB1 |
Empathy |
.711 |
.671 |
| RB2 |
Isolation |
.577 |
| Pleasure experience |
RC1 |
Satisfaction |
.694 |
.778 |
| RC2 |
Immersion |
.694 |
| RC3 |
Relaxation |
.638 |
Table 28.
Fitness indexes of the structural models of the three dimensions of questions generated by the CFA.
Table 28.
Fitness indexes of the structural models of the three dimensions of questions generated by the CFA.
| Dimension |
df |
χ2
|
χ2/df |
cfi |
RMSEA |
RMSEA (90% CI) |
| LO |
HI |
| System usability |
13 |
6.971 |
0.536 |
1.000 |
0.000 |
0.000 |
0.054 |
| Interactive experience |
13 |
11.170 |
0.859 |
1.000 |
0.000 |
0.000 |
0.113 |
| Pleasure experience |
23 |
31.726 |
1.379 |
0.951 |
0.080 |
0.000 |
0.143 |
|
a Meanings of symbols—df: degree of freedom; gfi: goodness-of-fit index; agfi: average gfi; cfi: comparative fit index; RMSEA: root mean square error of approximation; CI: confidence interval; LO: low; HI: high. |
Table 29.
The construct validity values of the latent dimensions of the three dimensions of “system usability,” “interactive experience,” and “pleasure experience” generated through CFA.
Table 29.
The construct validity values of the latent dimensions of the three dimensions of “system usability,” “interactive experience,” and “pleasure experience” generated through CFA.
| Dimension |
Category |
Group of Related Questions |
Construct Validity Value |
| System usability |
RA1 |
A06, A03, A02, A07 |
0.742 |
| RA2 |
A04, A05, A01 |
0.650 |
| Interactive experience |
RB1 |
B04, B01, B02, B06 |
0.750 |
| RB2 |
B05, B03, B07 |
0.573 |
| Pleasure experience |
RC1 |
C04, C05, C09 |
0.771 |
| RC2 |
C07, C06, C08 |
0.830 |
| RC3 |
C02, C03, C01 |
0.677 |
Table 30.
Analysis of the responses to the questions of the latent dimension of “functionality.”.
Table 30.
Analysis of the responses to the questions of the latent dimension of “functionality.”.
| Label |
Question |
Min. |
Max. |
Mean |
S. D. |
Strongly agree (5) |
Agree
(4) |
Average (3) |
Disagree (2) |
Strongly disagree (1) |
Agree or above |
| A06 |
The various functions of the system are well integrated. |
5 |
5 |
4.43 |
0.59 |
48% |
47% |
5% |
0% |
0% |
95% |
| A03 |
I find the system’s functionality intuitive. |
2 |
5 |
4.28 |
0.86 |
50% |
33% |
12% |
5% |
0% |
83% |
| A02 |
I am able to understand and become familiar with each function of the system. |
3 |
5 |
4.23 |
0.62 |
33% |
57% |
10% |
0% |
0% |
90% |
| A07 |
I would like to use this system frequently. |
2 |
5 |
4.00 |
0.78 |
25% |
55% |
15% |
5% |
0% |
80% |
Table 31.
Analysis of the responses to the questions of the latent dimension of “effectiveness.”.
Table 31.
Analysis of the responses to the questions of the latent dimension of “effectiveness.”.
| Label |
Question |
Min. |
Max. |
Mean |
S. D. |
Strongly agree (5) |
Agree
(4) |
Average (3) |
Disagree (2) |
Strongly disagree (1) |
Agree or above |
| A04 |
The emotions output by the system seem accurate. |
2 |
5 |
4.00 |
0.75 |
27% |
48% |
23% |
2% |
0% |
75% |
| A05 |
The process of picking up the message bottle and listening to the message is coherent. |
3 |
5 |
4.38 |
0.61 |
45% |
48% |
7% |
0% |
0% |
93% |
| A01 |
The interaction instructions help me quickly become familiar with the system. |
3 |
5 |
4.23 |
0.62 |
33% |
57% |
10% |
0% |
0% |
90% |
Table 32.
Analysis of the responses to the questions of the latent dimension of “empathy.”.
Table 32.
Analysis of the responses to the questions of the latent dimension of “empathy.”.
| Label |
Question |
Min. |
Max. |
Mean |
S. D. |
Strongly agree (5) |
Agree
(4) |
Average (3) |
Disagree (2) |
Strongly disagree (1) |
Agree or above |
| B04 |
The system enhances my empathy. |
2 |
5 |
4.0 |
0.80 |
30% |
47% |
20% |
3% |
0% |
77% |
| B01 |
The system helps me care more about others. |
1 |
5 |
4.01 |
0.91 |
32% |
47% |
15% |
5% |
1% |
79% |
| B02 |
The system helps improve my mood when I am feeling down. |
2 |
5 |
3.9 |
0.83 |
25% |
45% |
25% |
5% |
0% |
70% |
| B06 |
I feel relieved not to interact face-to-face with others when using the system. |
1 |
5 |
3.97 |
1.13 |
40% |
33% |
15% |
7% |
5% |
73% |
Table 33.
Analysis of the responses to the questions of the latent dimension of “isolation.”.
Table 33.
Analysis of the responses to the questions of the latent dimension of “isolation.”.
| Label |
Question |
Min. |
Max. |
Mean |
S. D. |
Strongly agree (5) |
Agree
(4) |
Average (3) |
Disagree (2) |
Strongly disagree (1) |
Agree or above |
| B05 |
I feel lonely while using the system. |
1 |
5 |
4.06 |
0.93 |
35% |
45% |
15% |
2% |
3% |
80% |
| B03 |
I feel uncomfortable with others hearing or seeing the content I use on the system. |
1 |
5 |
3.43 |
1.19 |
22% |
30% |
25% |
17% |
6% |
52% |
| B07 |
Using the system is similar to using online social networks. |
1 |
5 |
3.2 |
1.29 |
10% |
48% |
10% |
15% |
17% |
58% |
Table 34.
Analysis of the responses to the questions of the latent dimension of “satisfaction.”.
Table 34.
Analysis of the responses to the questions of the latent dimension of “satisfaction.”.
| Label |
Question |
Min. |
Max. |
Mean |
S. D. |
Strongly agree (5) |
Agree
(4) |
Average (3) |
Disagree (2) |
Strongly disagree (1) |
Agree or above |
| C04 |
I find the system’s interactive experience interesting. |
2 |
5 |
4.73 |
0.54 |
77% |
22% |
0% |
1% |
0% |
99% |
| C05 |
I believe the system can enrich my life experience. |
2 |
5 |
4.26 |
0.77 |
43% |
43% |
10% |
3% |
0% |
86% |
| C09 |
Time seems to fly when I am using the system. |
1 |
5 |
4.11 |
0.94 |
42% |
35% |
18% |
3% |
2% |
77% |
Table 35.
Analysis of the responses to the questions of the latent dimension of “immersion.”.
Table 35.
Analysis of the responses to the questions of the latent dimension of “immersion.”.
| Label |
Question |
Min. |
Max. |
Mean |
S. D. |
Strongly agree (5) |
Agree
(4) |
Average (3) |
Disagree (2) |
Strongly disagree (1) |
Agree or above |
| C07 |
I enjoy using the system. |
2 |
5 |
4.23 |
0.76 |
42% |
42% |
15% |
2% |
0% |
84% |
| C06 |
I am interested in actively using the system. |
2 |
5 |
4.45 |
0.67 |
53% |
40% |
5% |
2% |
0% |
93% |
| C08 |
I easily immerse myself in the system. |
1 |
5 |
4.28 |
0.88 |
48% |
38% |
8% |
3% |
2% |
86% |
Table 36.
Analysis of the responses to the questions of the latent dimension of “relaxation.”.
Table 36.
Analysis of the responses to the questions of the latent dimension of “relaxation.”.
| Label |
Question |
Min. |
Max. |
Mean |
S. D. |
Strongly agree (5) |
Agree
(4) |
Average (3) |
Disagree (2) |
Strongly disagree (1) |
Agree or above |
| C02 |
I feel relaxed during the “rowing” interaction process. |
2 |
5 |
4.31 |
0.81 |
50% |
35% |
12% |
3% |
0% |
85% |
| C03 |
The “sharing experiences” process makes me feel relieved. |
3 |
5 |
4.36 |
0.66 |
47% |
43% |
10% |
0% |
0% |
90% |
| C01 |
I feel special when using the system. |
2 |
5 |
3.85 |
0.84 |
23% |
43% |
28% |
5% |
0% |
66% |
