1. Introduction
Microcirculatory oscillations, called as flowmotion, are a well-recognized feature of blood flow. The mechanistic aspects of this phenomenon have been the subject of extensive research [
1,
2,
3,
4]. Flowmotion is regulated by the rhythmic oscillations of blood vessel diameter, known as vasomotion. This term is often used more specifically to characterize vascular tone, caused by oscillations of vascular smooth muscle, and can also be used to describe myogenic microcirculatory oscillations. The major physiological function of flowmotion is to secure the proper perfusion of tissues. Impaired flowmotion can result in vascular resistance and is observed in many diseases and disorders [
5,
6,
7,
8,
9,
10,
11,
12,
13].
So far, the major technique used for characterization of flowmotion has been Laser Doppler Flowmetry (LDF) [
14,
15]. LDF is predominantly used for the assessment of skin microcirculation. The cutaneous vascular function can also be regarded as an indicator of general vascular function [
16,
17]. Analysis of the LDF signal registered in the frequency domain reveals that microcirculatory oscillations in the low-frequency range (< 0.15 Hz) fit into several periodic activities, classified as endothelial (< 0.021 Hz), neurogenic (0.021 – 0.052 Hz), and myogenic (0.052 – 0.15 Hz) [
18,
19]. Due to the substantial noise associated with LDF measurement, quantitative analysis of the changes in flowmotion associated with different diseases and pathologies is not always possible.
Analysis of flowmotion in the frequency domain can provide fundamental information concerning changes in the blood flow dynamics caused by various diseases. Therefore, there is great demand for a simple and non-invasive diagnostic tool for measuring flowmotion accurately. The recently proposed Flow Mediated Skin Fluorescence (FMSF) technique appears to meet these requirements [
20,
21]. The FMSF technique is based on the measurement of nicotinamide adenine dinucleotide (NADH) fluorescence from human skin, predominantly from the epidermis. The epidermis is not vascularized and the red blood cells do not interfere with the measured NADH fluorescence. In addition, the FMSF technique combined with the post-occlusive reactive hyperemia (PORH) test enables measurement of the reaction of microcirculatory oscillations to hypoxia. This is important for understanding the function of the microcirculation in diseases associated with ischemia (hypoxia).
This review discusses exemplary cases of perturbed microcirculatory oscillations observed both in healthy individuals and seriously ill patients. Special attention is given to diagnostic aspects of the measured microcirculatory oscillations, in order to understand their role in preventing microvascular perfusion, which is necessary for proper tissue functioning. In some selected cases, the discussion also focuses on the effects of drugs for reversing impaired microvascular function due to disturbed flowmotion.
2. Precise Monitoring of Microcirculatory Oscillations Using the FMSF Technique
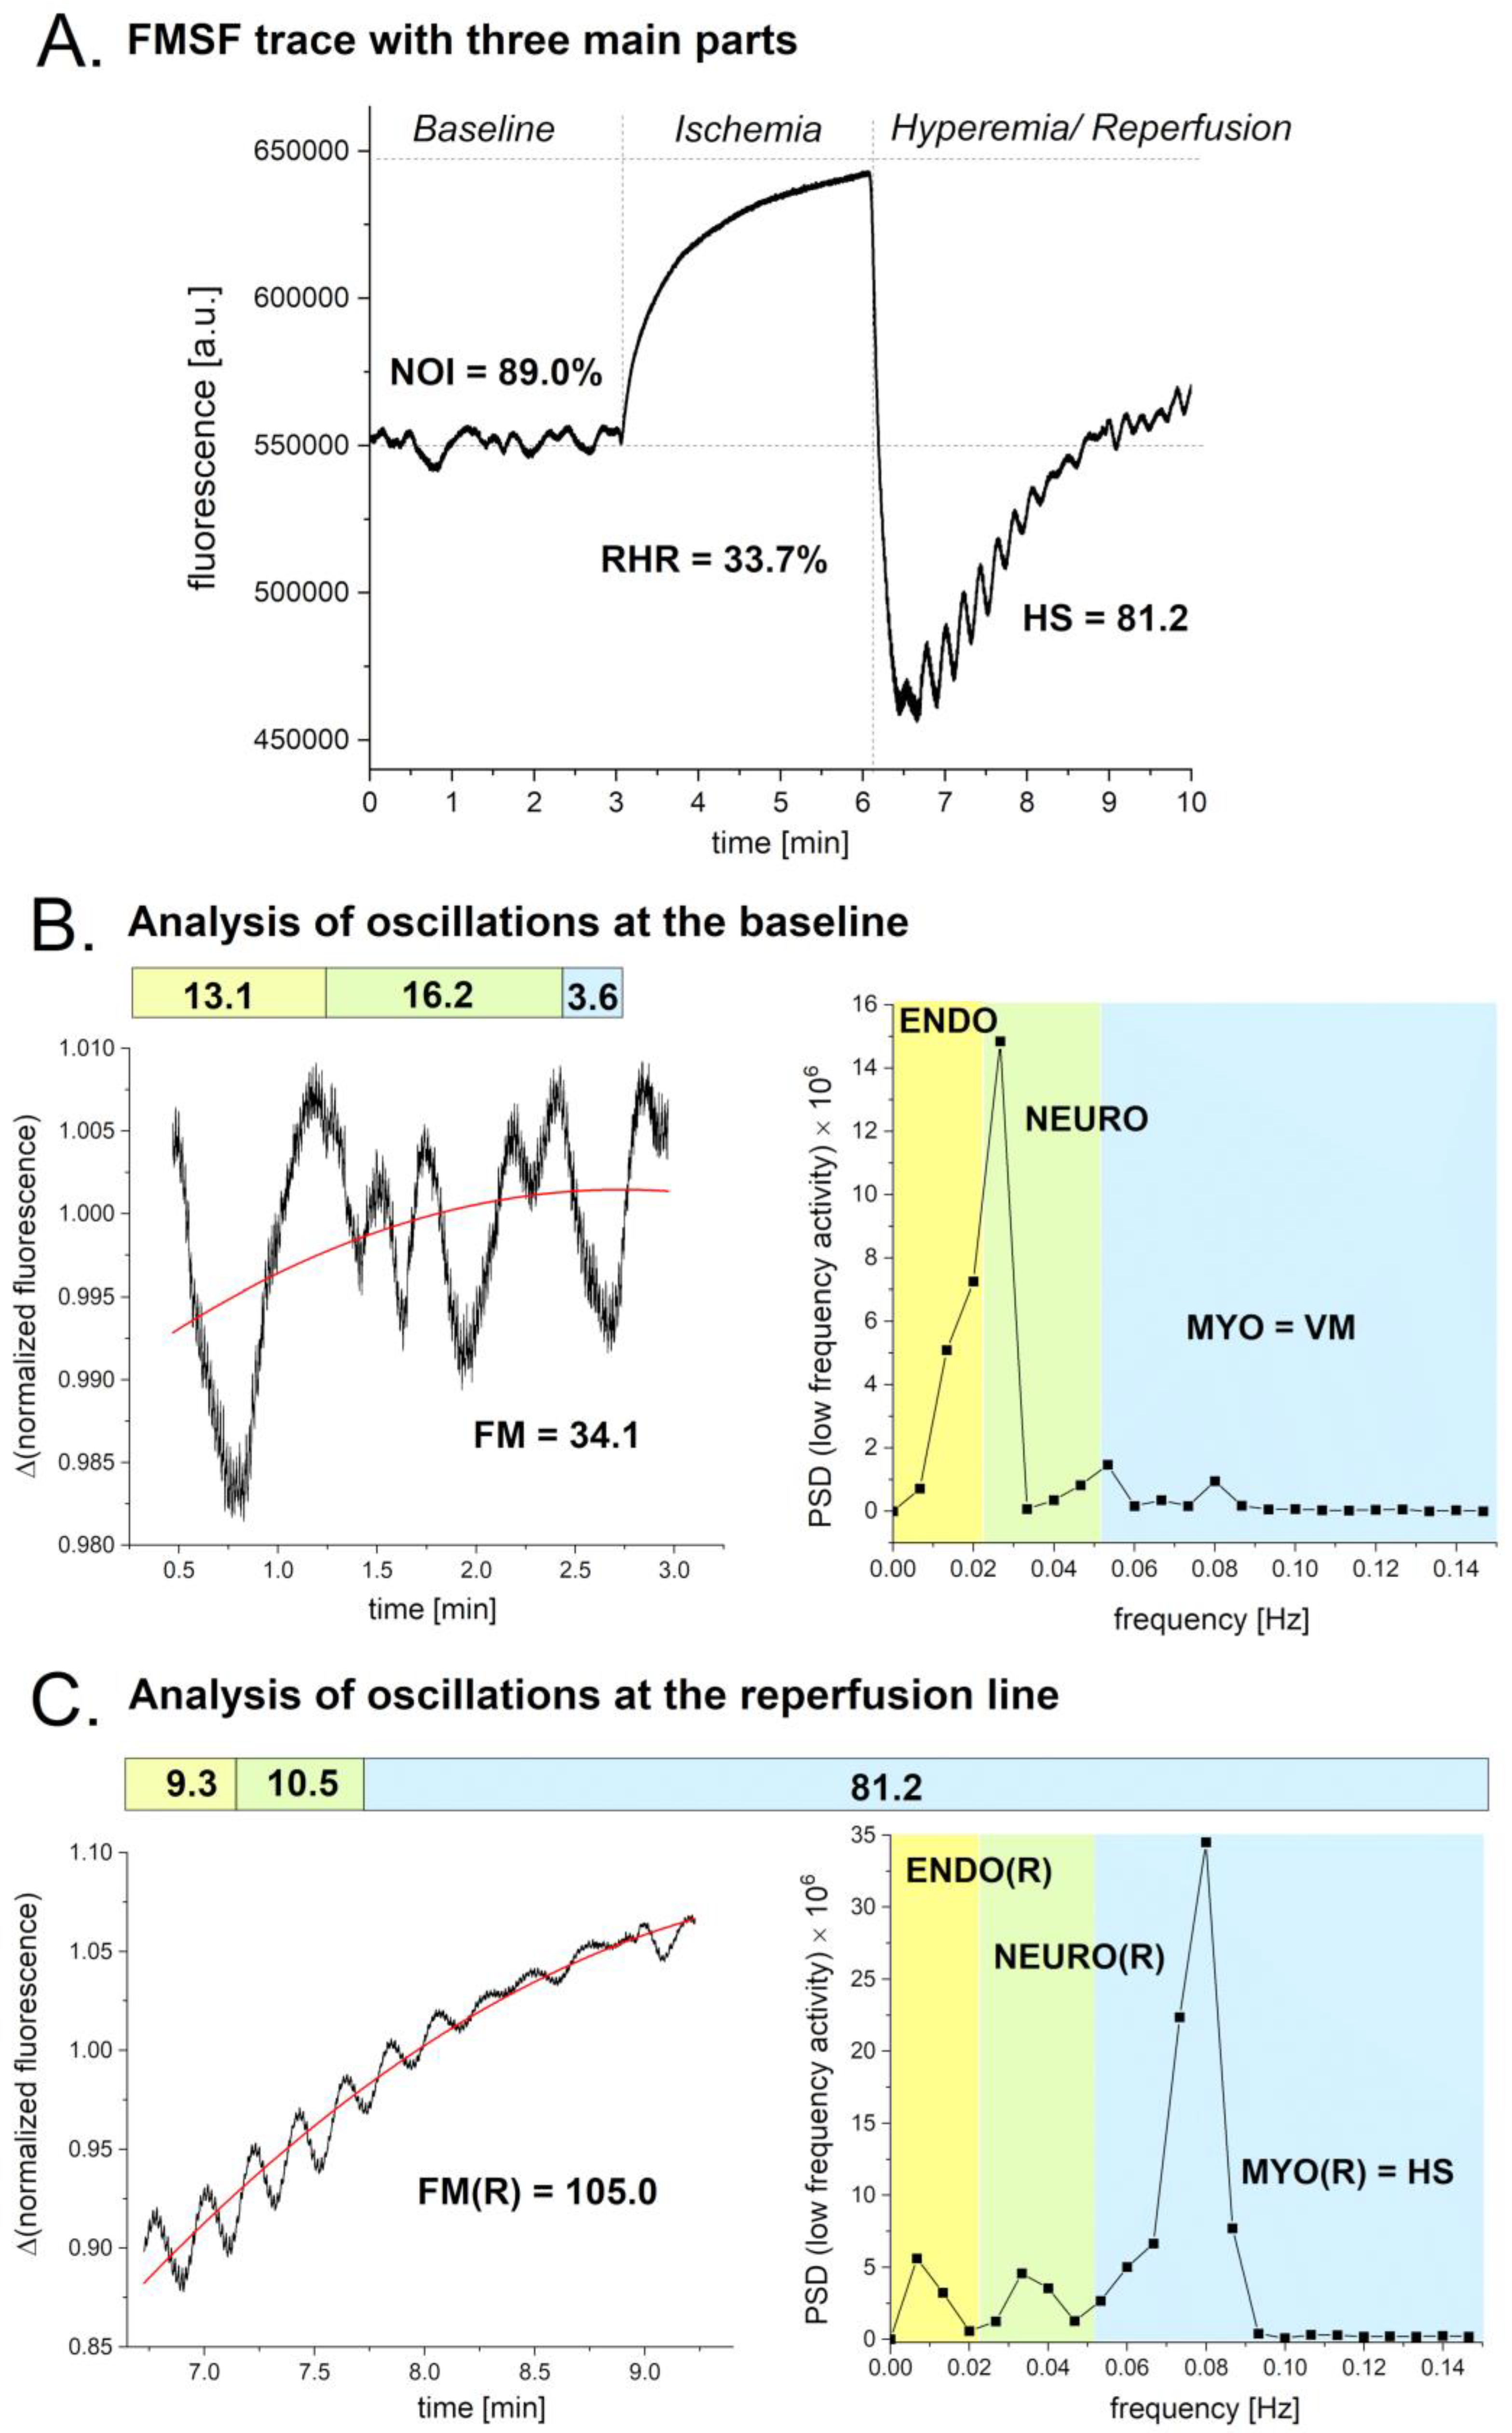
The FMSF technique is based on the measured changes in the intensity of NADH fluorescence from the skin on the forearm. These changes are generated by blocking and releasing blood flow in the brachial artery using an occlusion cuff. The measurements are performed on the AngioExpert, a diagnostic tool produced by Angionica Ltd. (Lodz, Poland). An exemplary FMSF trace is presented in
Figure 1A. The measurement is divided into three phases. The first phase measures NADH fluorescence at the baseline under normoxia conditions. The second phase, which lasts three minutes, measures ischemia. Finally, the hyperemia/reperfusion phase is initiated by abrupt release of the pressure in the occlusion cuff. Microcirculatory oscillations are visible on the baseline and the reperfusion line. During the ischemic phase, microcirculatory oscillations are not visible as blood flow in the forearm is completely blocked. Each part of the FMSF trace is represented by one key parameter. At the baseline, the key parameter is the Normoxia Oscillatory Index (NOI). For the ischemia/hyperemia phase, the key parameter is the Reactive Hyperemia Response (RHR). During the hyperemia/reperfusion phase, the key parameter is Hypoxia Sensitivity (HS). The procedure for conducting FMSF measurements and definitions of all parameters are described in detail elsewhere [
22,
23].
The observed microcirculatory oscillations are shown in
Figure 1B (baseline) and
Figure 1C (reperfusion line). The frequencies of the oscillations contained in the FMSF signal were analyzed using the Fast Fourier Transform (FFT) algorithm. Periodograms were derived from the FFT of the signal and the Power Spectral Density (PSD) calculated as a mean squared amplitude. The overall intensity of the microcirculatory oscillations observed in the low frequency domain (< 0.15 Hz) at baseline is described by the parameter FM (FlowMotion). The value of the FM parameter consists of three components, ENDO (endothelial), NEURO (neurogenic), and MYO (myogenic). Thus, FM = ENDO + NEURO + MYO. Myogenic microcirculatory oscillations are often called vasomotion (VM), thus VM = MYO. As the intensities of these parameters are age-dependent, we decided to introduce a new parameter, NOI (Normoxia Oscillatory Index). Thus, NOI = (ENDO + NEURO)/(ENDO + NEURO + MYO) x 100%, which is age-independent and nicely characterizes the relative distribution of the low frequency oscillations. Similarly, the intensity of the oscillations observed at the reperfusion line can be described as FM(R) = ENDO(R) + NEURO(R) + MYO(R). The intensity of the myogenic microcirculatory oscillations on the reperfusion line is called HS (Hypoxia Sensitivity). Thus, HS = MYO(R).
In this review, three parameters will be used for characterization of microcirculatory oscillations at baseline: FM, VM, and NOI. One parameter will be used for characterization of microcirculatory oscillations on the reperfusion line: HS. To secure a normal distribution, in the statistical analysis the FM, VM, and HS parameters will often be presented as a logarithm. As microcirculatory oscillations can be measured with very high precision by the FMSF technique, on both the baseline and the reperfusion line, their use for the assessment of microvascular function can be particularly beneficial.
3. Selected Examples of Impaired Microcirculatory Oscillations at Normoxia
3.1. Intense Physical Exercise
The FMSF technique has been applied for assessment of the vascular changes associated with intense physical exercise until exhaustion [
24,
25]. The test is only intended for highly trained athletes. It was used to verify the body’s reaction to excessive physical overload. As expected, remarkable changes in the FMSF trace were observed just after termination of the test. The baseline level of NADH fluorescence increased, whereas the relative ratio of ischemic to hyperemic responses decreased. These changes clearly demonstrate a shift of the NADH/NAD+ equilibrium towards reduction, indicating oxygen deficiency just after termination of the test. Changes in the microcirculatory oscillations have also been noticed on both the baseline (normoxia) and reperfusion line (hypoxia), but have not been analyzed quantitively.
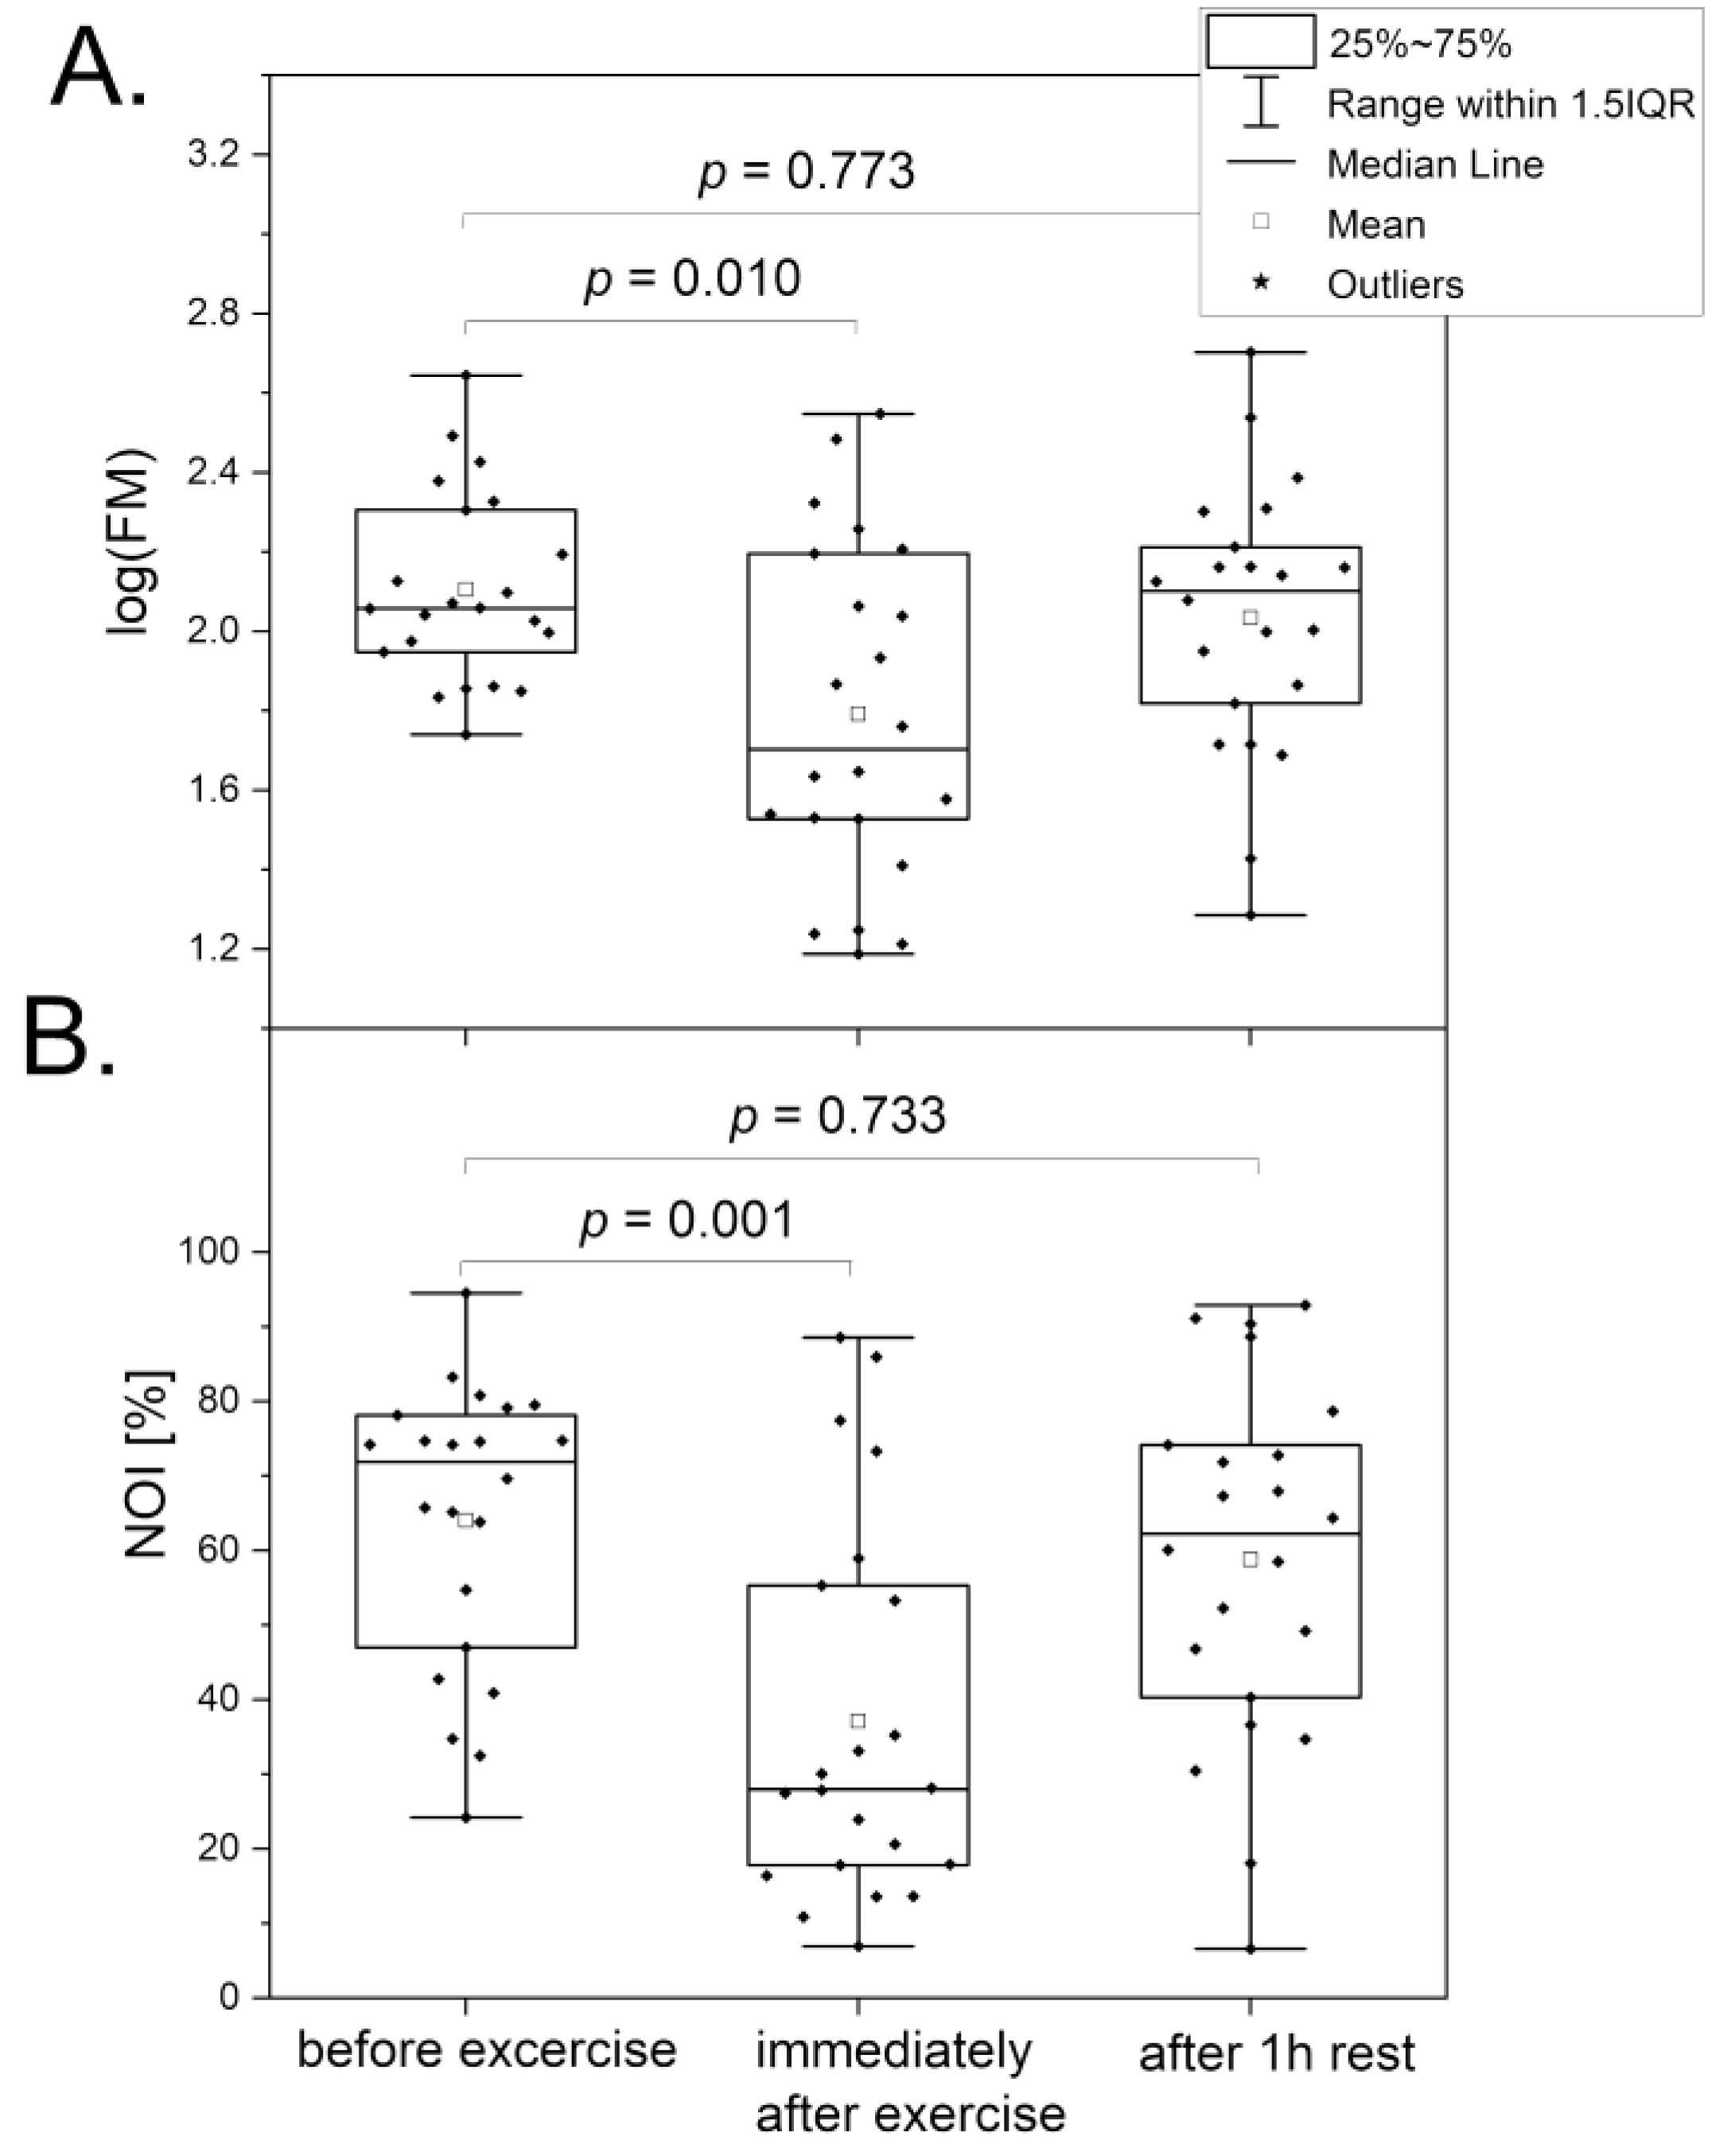
Figure 2 compares the changes in the key parameters (FM and NOI) related to microcirculatory oscillations observed at the baseline. A substantial decrease in the FM and NOI parameters was noted just after termination of the exercise test until exhaustion. Detailed analysis of the observed changes indicated that the intensities of endothelial (ENDO) and neurogenic (NEURO) oscillations were drastically diminished at relatively preserved intensity of myogenic oscillations (MYO). The FMSF measurements performed after 1 hour of rest indicated that in a majority of the athletes all oscillatory parameters returned to the values observed before initiation of the test. After 3 h of rest, the FMSF oscillatory parameters returned to normal for all tested participants. These observations are not surprising, as it is known that strenuous physical exercise can transiently modify calcium homeostasis and this effect is persistent until the late recovery phase [
26,
27]. It is also known that perturbation of calcium homeostasis strongly affects microcirculatory oscillations [
3,
4].
Use of the FMSF technique to detect changes in microcirculatory oscillations at baseline does not require the PORH test. Such measurements are fully non-invasive, fast, and accurate. The FMSF technique can be considered as a useful tool for monitoring training and to preparing athletes for sports competitions, avoiding overtraining.
3.2. Post-COVID Syndrome
Chronic fatigue associated with post-COVID syndrome has been studied using the FMSF technique [
28]. Both microcirculatory and macrocirculatory parameters were found to be substantially reduced in the post-COVID group compared with the healthy control.
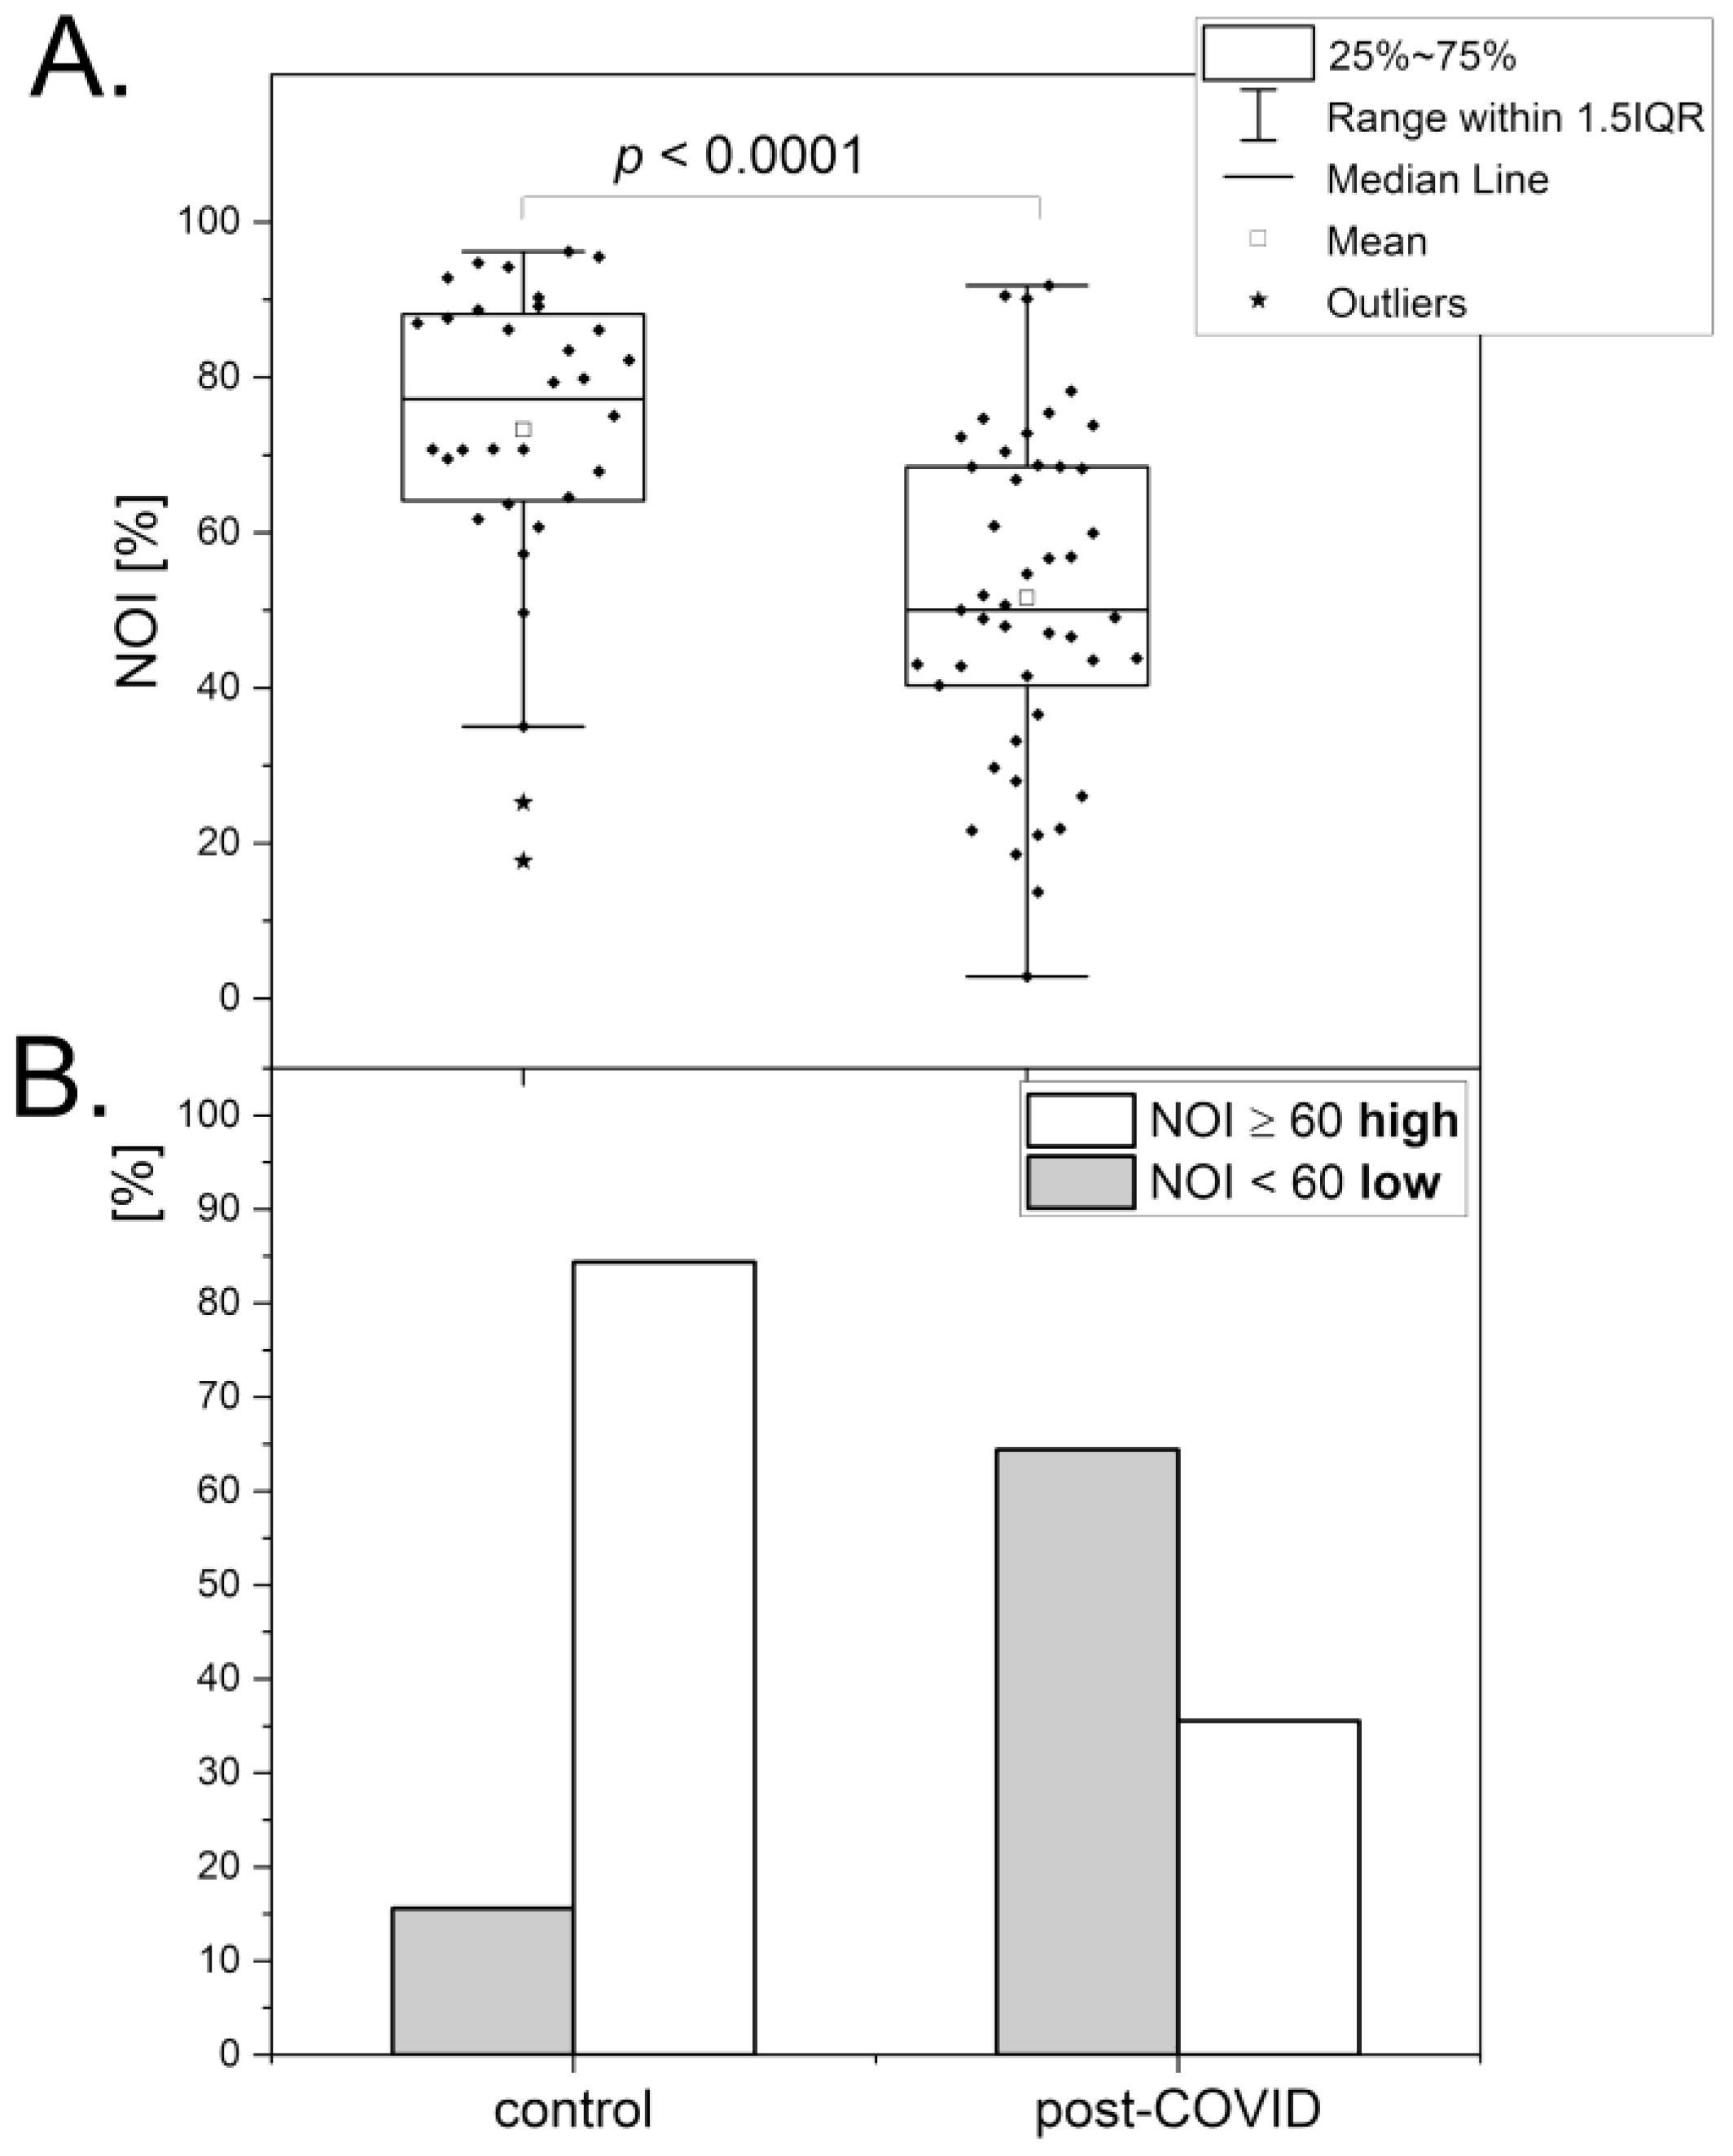
Figure 3 compares both these groups with respect to the NOI parameter and its relative distribution. In fact, the results are very close to those observed for transient fatigue caused by high-intensity exercise presented in the former section. The relative changes in microcirculatory oscillations observed for the post-COVID group vs. control group and for athletes after vs. before high-intensity exercise are quite similar. However, the mechanistic reasons responsible for the results seem to be quite different, as a full recovery after high-intensity exercise is fast, in contrast to long-lasting post-COVID syndrome. It is likely that the pathophysiology of chronic post-COVID fatigue also originates partly from calcium homeostasis modifications that lead to endothelial dysfunction [
29,
30]. However, the mechanistic aspects responsible for post-COVID syndrome seem much more complex. A very recent report suggests that post-COVID syndrome may be linked to dysregulation of metabolic processes in erythrocytes with associated endothelial and microvascular dysfunction, resulting in reduced oxygen delivery [
31].
The chronic fatigue associated with post-COVID syndrome can be evaluated based on microcirculatory oscillations measured by the FMSF technique. This diagnostic approach can be very helpful in monitoring the rehabilitation process. Use of the NOI parameter seems to be particularly appropriate, as it is sufficiently sensitive and also age-independent.
3.3. Psychological Stress
It is well known that prolonged psychological stress can be considered as a serious risk factor for function of the entire vascular system [
32]. Psychological stress can be associated with elevated levels of norepinephrine in the circulation, which can also affect peripheral microcirculation and cause microvascular vasoconstriction. We have recently reported that the effect of psychological stress on the microcirculation can be evaluated using the FMSF technique [
33].
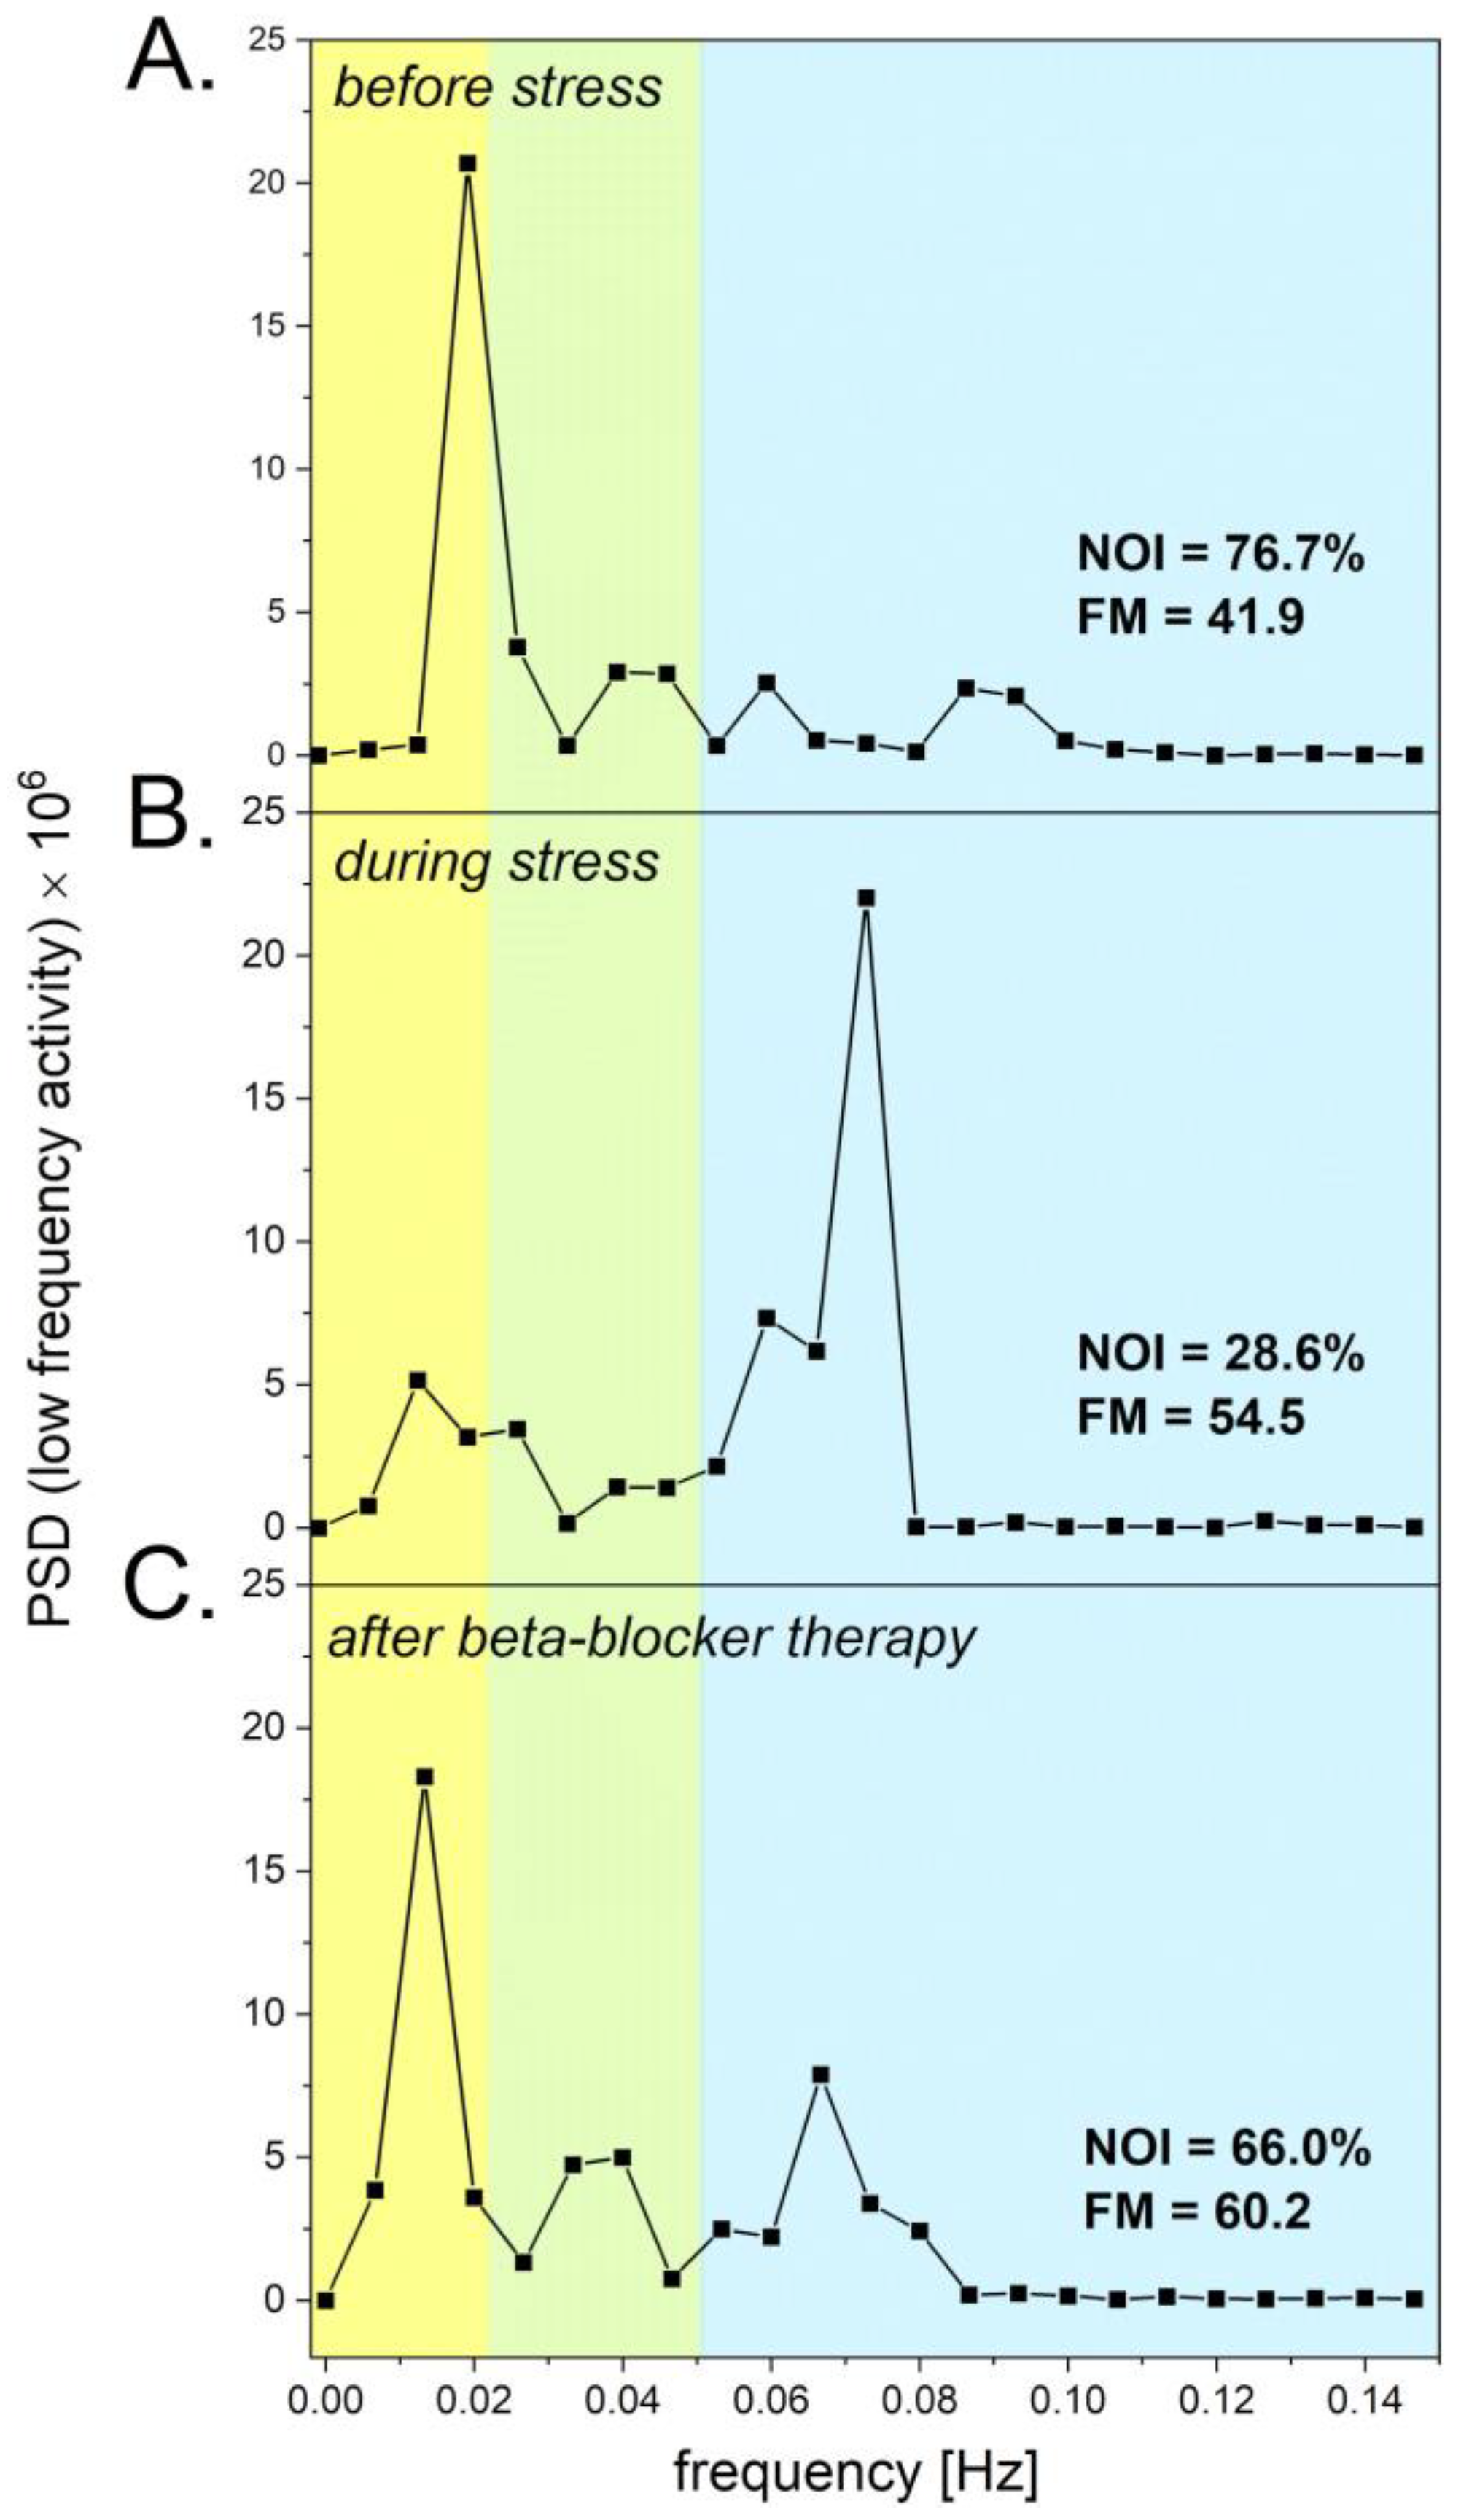
Figure 4 shows the Power Spectral Density (PSD) of the fluorescence signal recorded for a patient before stress (segment A), during stress (segment B), and after therapy (segment C). The NOI parameter decreased from 76.7% before stress to 28.6% during psychological stress. The increased level of norepinephrine due to psychological stress caused microvascular vasoconstriction, resulting in increased intensity of myogenic microcirculatory oscillations and consequently a drop in the NOI parameter is seen. After treatment with a low dose of beta-blocker, the NOI parameter returned to a value of 66.0%, which is close to the value observed before stress. The results presented in
Figure 4 clearly indicate that the NOI parameter seems to be suitable for assessment of psychological stress, and that a low dose of beta-blocker can be considered for treatment of mild psychological stress. It has already been suggested that beta-adrenergic blockade attenuates negative, high arousal emotions due to psychological stressors [
34]. The use of the FMSF technique for assessment of the vascular consequences due to psychological stress appears to be an attractive option, due to the non-invasive nature of the FMSF technique, particularly without use of the PORH test.
3.4. Erectile Dysfunction
Erectile dysfunction (ED) is often linked to vascular etiology and usually is the earliest symptom of vascular dysfunction [
35,
36]. There is increasing evidence suggesting an association between ED and cardiovascular diseases (CVD), as well as an increased prevalence of CVD in patients with ED [
37,
38]. It has been demonstrated that low testosterone levels negatively affect vascular circulation, causing its dysfunction [
39,
40].
Based on the rodent models, testosterone can affect myogenic microcirculatory oscillations in testicular arteriolar blood flow, also known as vasomotion (VM) [
41,
42]. An important hypothesis has been raised whether the effect of testosterone on VM can also be observed in peripheral microcirculation [
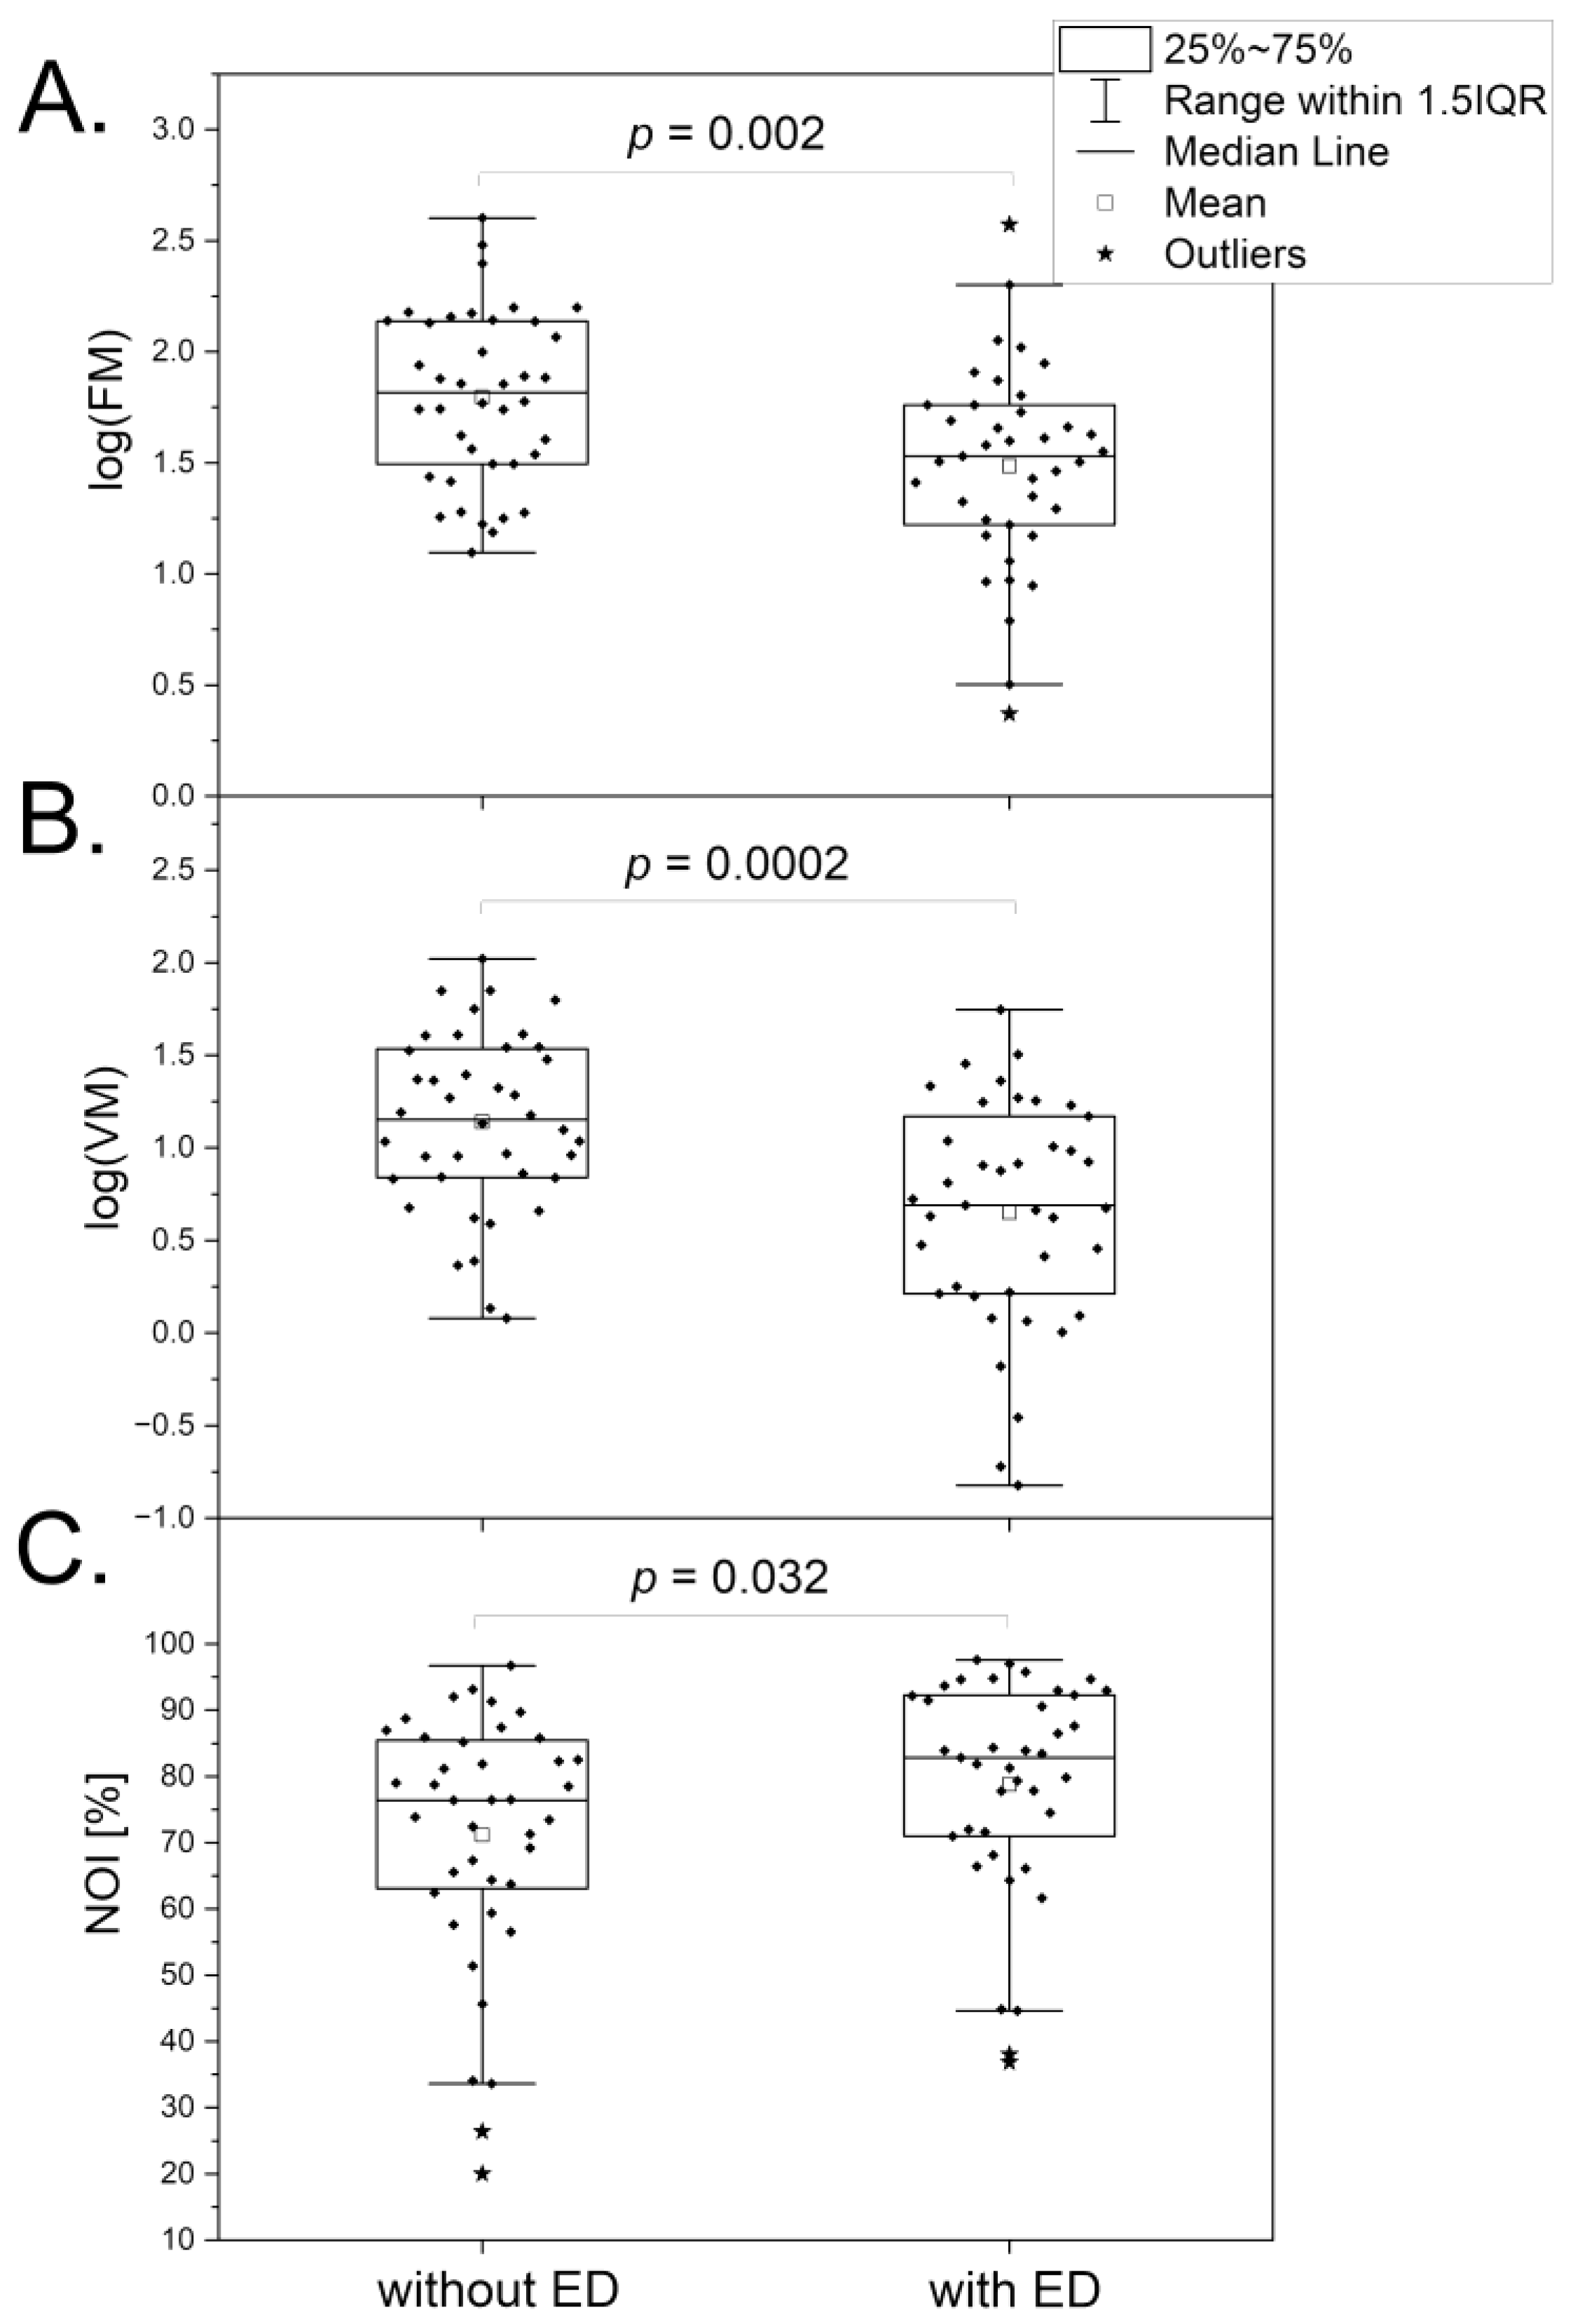
43]. The results summarized in
Figure 5 seem to confirm this hypothesis. It is clearly seen that the low testosterone level linked to ED caused a significant reduction in the FM (segment A) and VM (segment B) parameters and an increase in the value of the NOI parameter (segment C). These results can be interpreted taking into consideration the action of testosterone on endothelial function [
44] and calcium homeostasis [
45]. There is a known association between testosterone levels and mood disorders [
46]. However, this effect can be manifested by an increase in the NOI parameter, which is directly opposed to the observation made for psychological stress, where the NOI parameter decreased due to vasoconstriction caused by norepinephrine. Use of the FMSF technique for observation of microcirculatory oscillations thus allows for a clear differentiation of psychological stress and stress caused by androgen deficiency. Psychological stress seems to be compensated by an increase in VM in healthy individuals, whereas in individuals with androgen deficiency this compensatory mechanism may be impaired due to lower VM activity. This compensatory effect is particularly important as chronic psychological stress can result in the development of serious vascular circulatory disorders.
4. Evaluation of Microvascular Complications in Diabetes based on Response of Microcirculatory Oscillations to Hypoxia
The FMSF technique used with the PORH test is uniquely suitable for measuring the reaction of microcirculatory oscillations to hypoxia. This is especially important for understanding the function of the microcirculation in diseases associated with ischemia (hypoxia), including diabetes mellitus (DM). DM is a chronic, metabolic disease with numerous vascular complications. The most frequent are microvascular complications, including diabetic kidney disease (DKD) and diabetic foot ulceration (DFU). The latter complications are particularly challenging in terms of unambiguous assessment of impaired microvascular function. Both these microvascular complications are directly linked to adaptive responses to hypoxia, which are mediated by the hypoxia-inducible factor (HIF) [
47,
48,
49]. HIF-1α is directly responsible for up-regulation of vascular endothelial growth factor (VEGF) expression. VEGF expression is necessary for the preservation of glomerular physiology. VEGF imbalance is associated with an increased risk of developing DKD [
50]. VEGF is also an essential mediator of neovascularization, which is thought to be critical in diabetic wound healing [
51].
The FMSF technique has been used to assess microvascular function in patients with DKD [
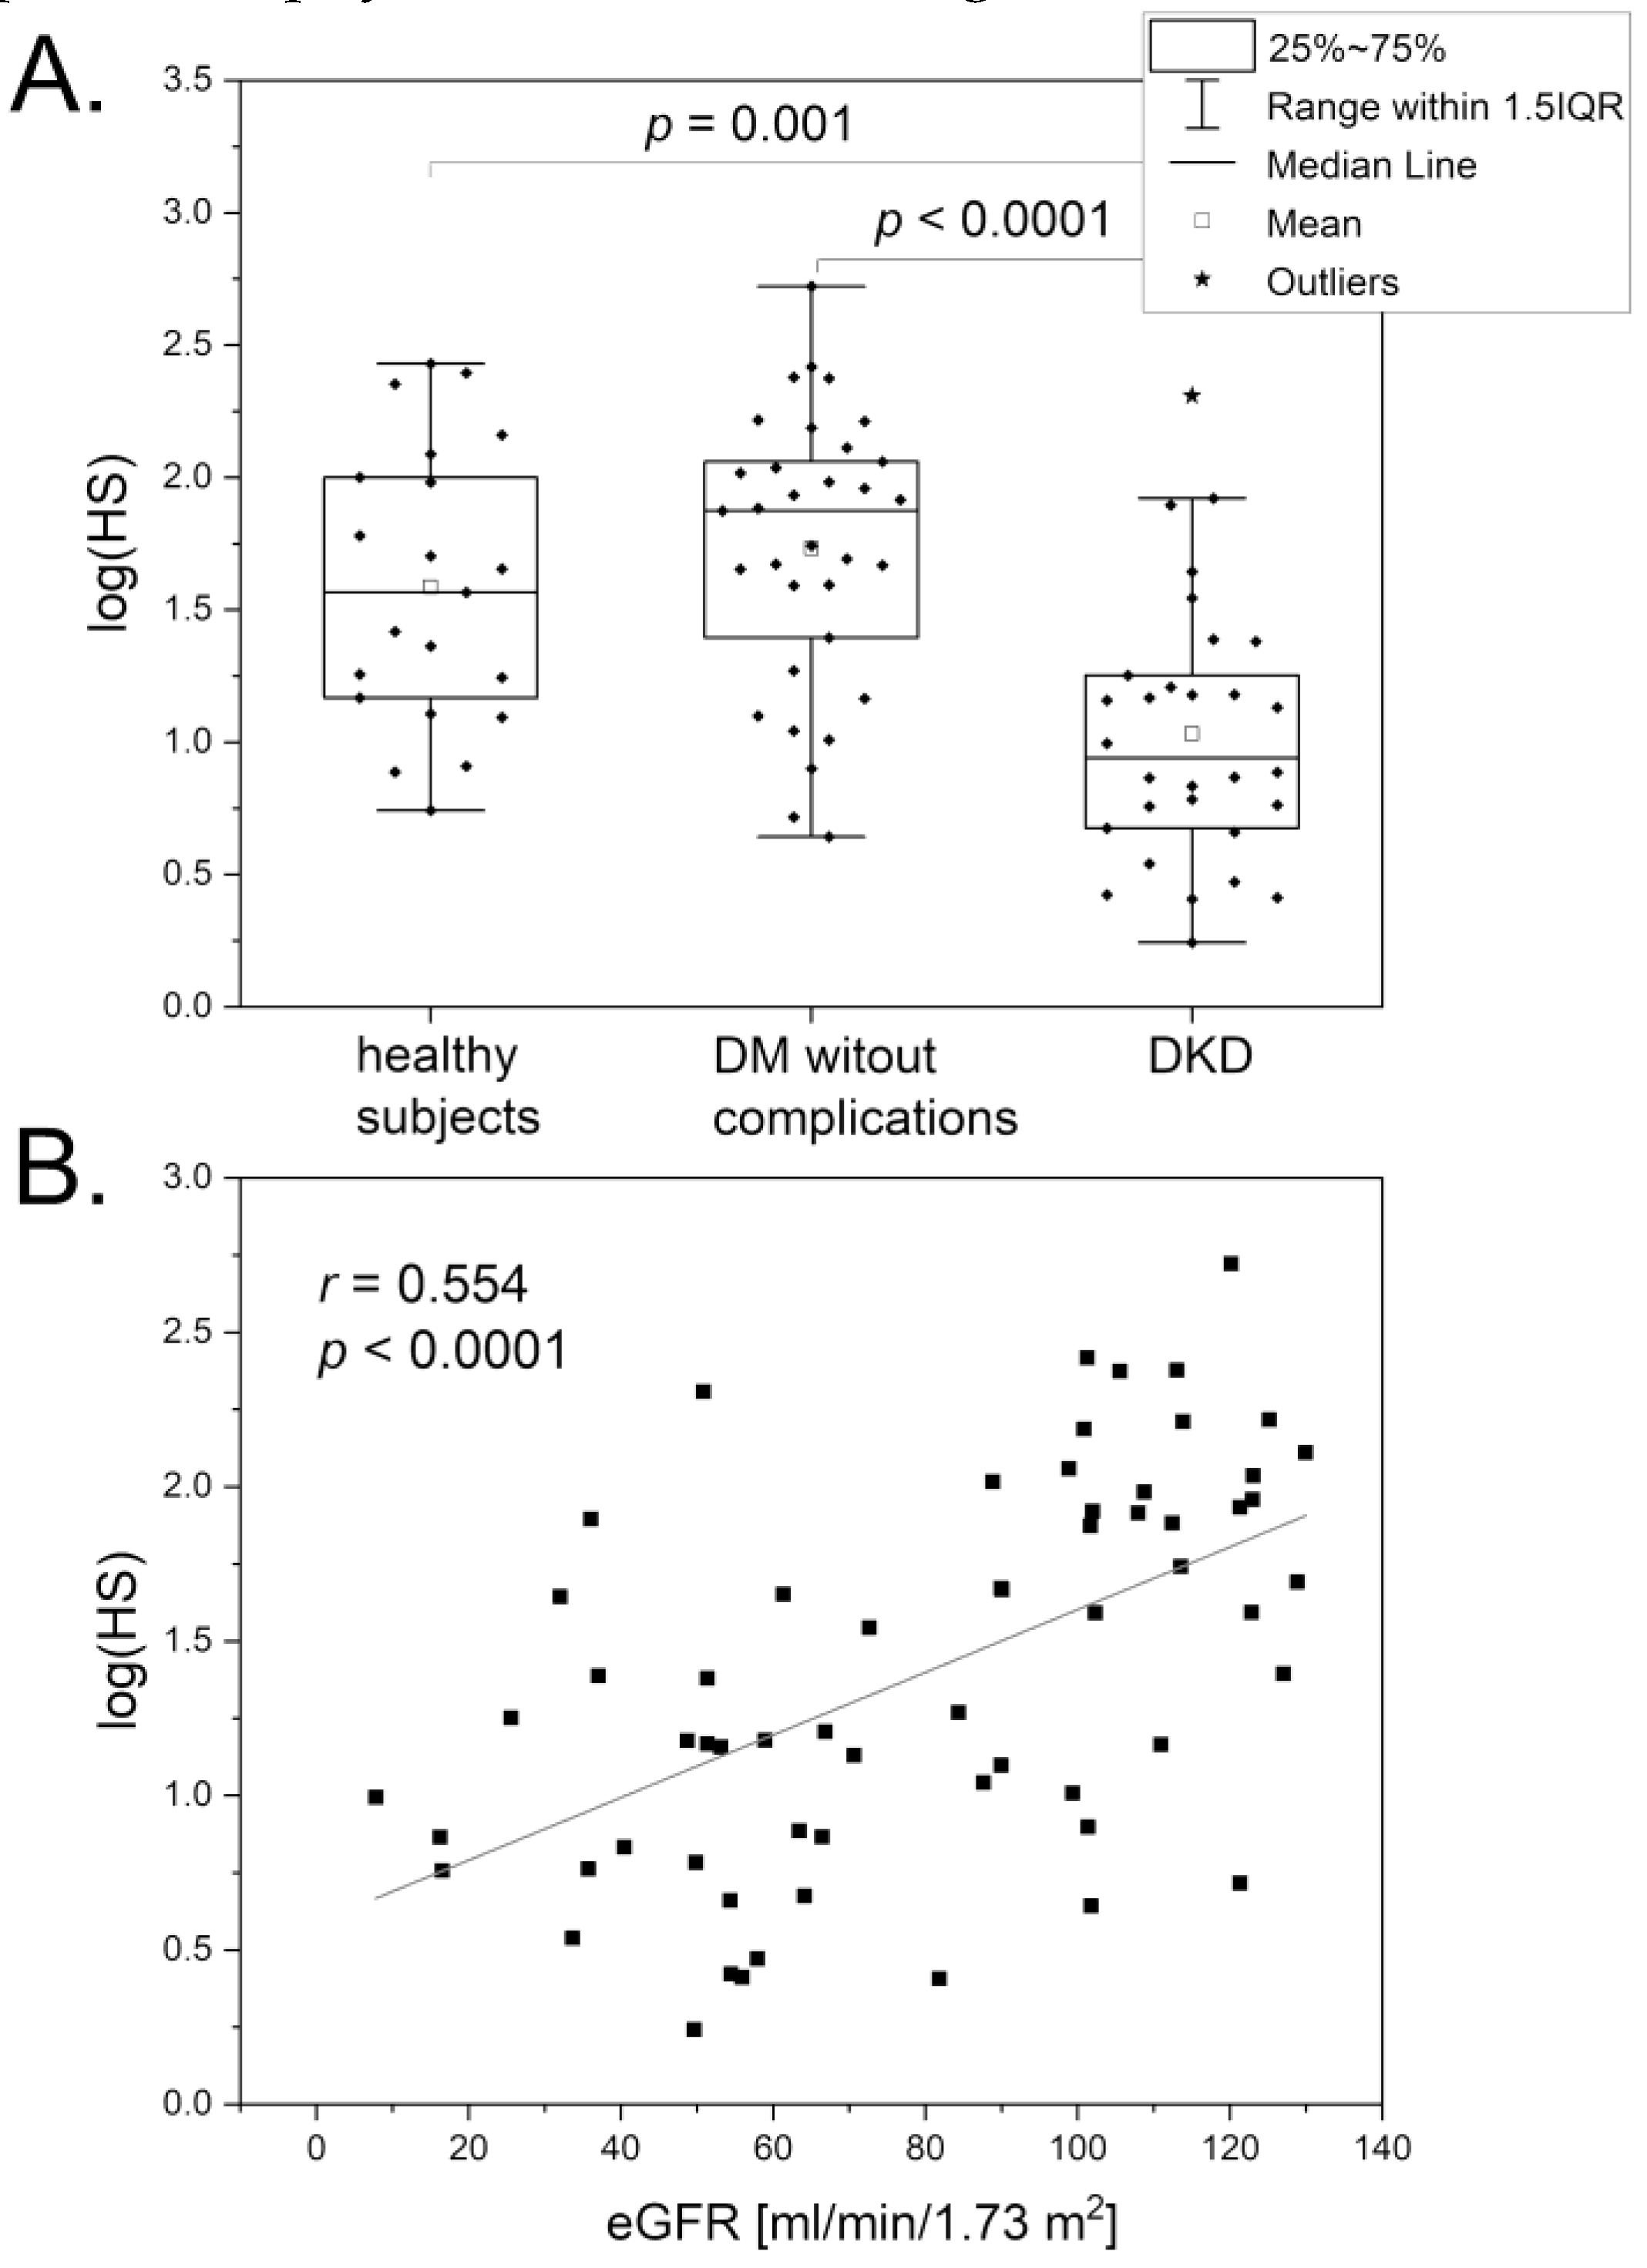
52]. Both key FMSF parameters (RHR and HS) were found to have predictive potential. The HS parameter, describing the reaction of myogenic microcirculatory oscillations to transient hypoxia induced by the PORH test, seems well suited for assessing microvascular dysfunction in DKD. As shown in
Figure 6A, the log(HS) parameter was significantly lower in the DKD group compared with the DM group without microvascular complications and also with the healthy group. The correlation between the log(HS) parameter and the estimated glomerular filtration rate (eGFR) is shown in
Figure 6B. The log(HS) also negatively correlates with the advanced glycation end products (AGEs) [
52]. These results clearly indicate that dysfunctional kidney function is associated with a low value for the HS parameter. Interestingly, patients with a very low value for the HS parameter (HS < 10) may also have impaired adaptation to physical exercise and high altitude.
The FMSF technique has also been used for differentiation of diabetic foot ulcer (DFU), based on stimulation of myogenic microcirculatory oscillations by transient ischemia [
53]. It was found that a very low value for the HS parameter (HS < 5) can be used to predict DFU with a low prognosis of healing. These patients frequently also suffered from nephropathy, neuropathy, or prevalent cardiovascular disease. Additionally, they showed poor results in the USG Doppler test and had a significant history of amputation.
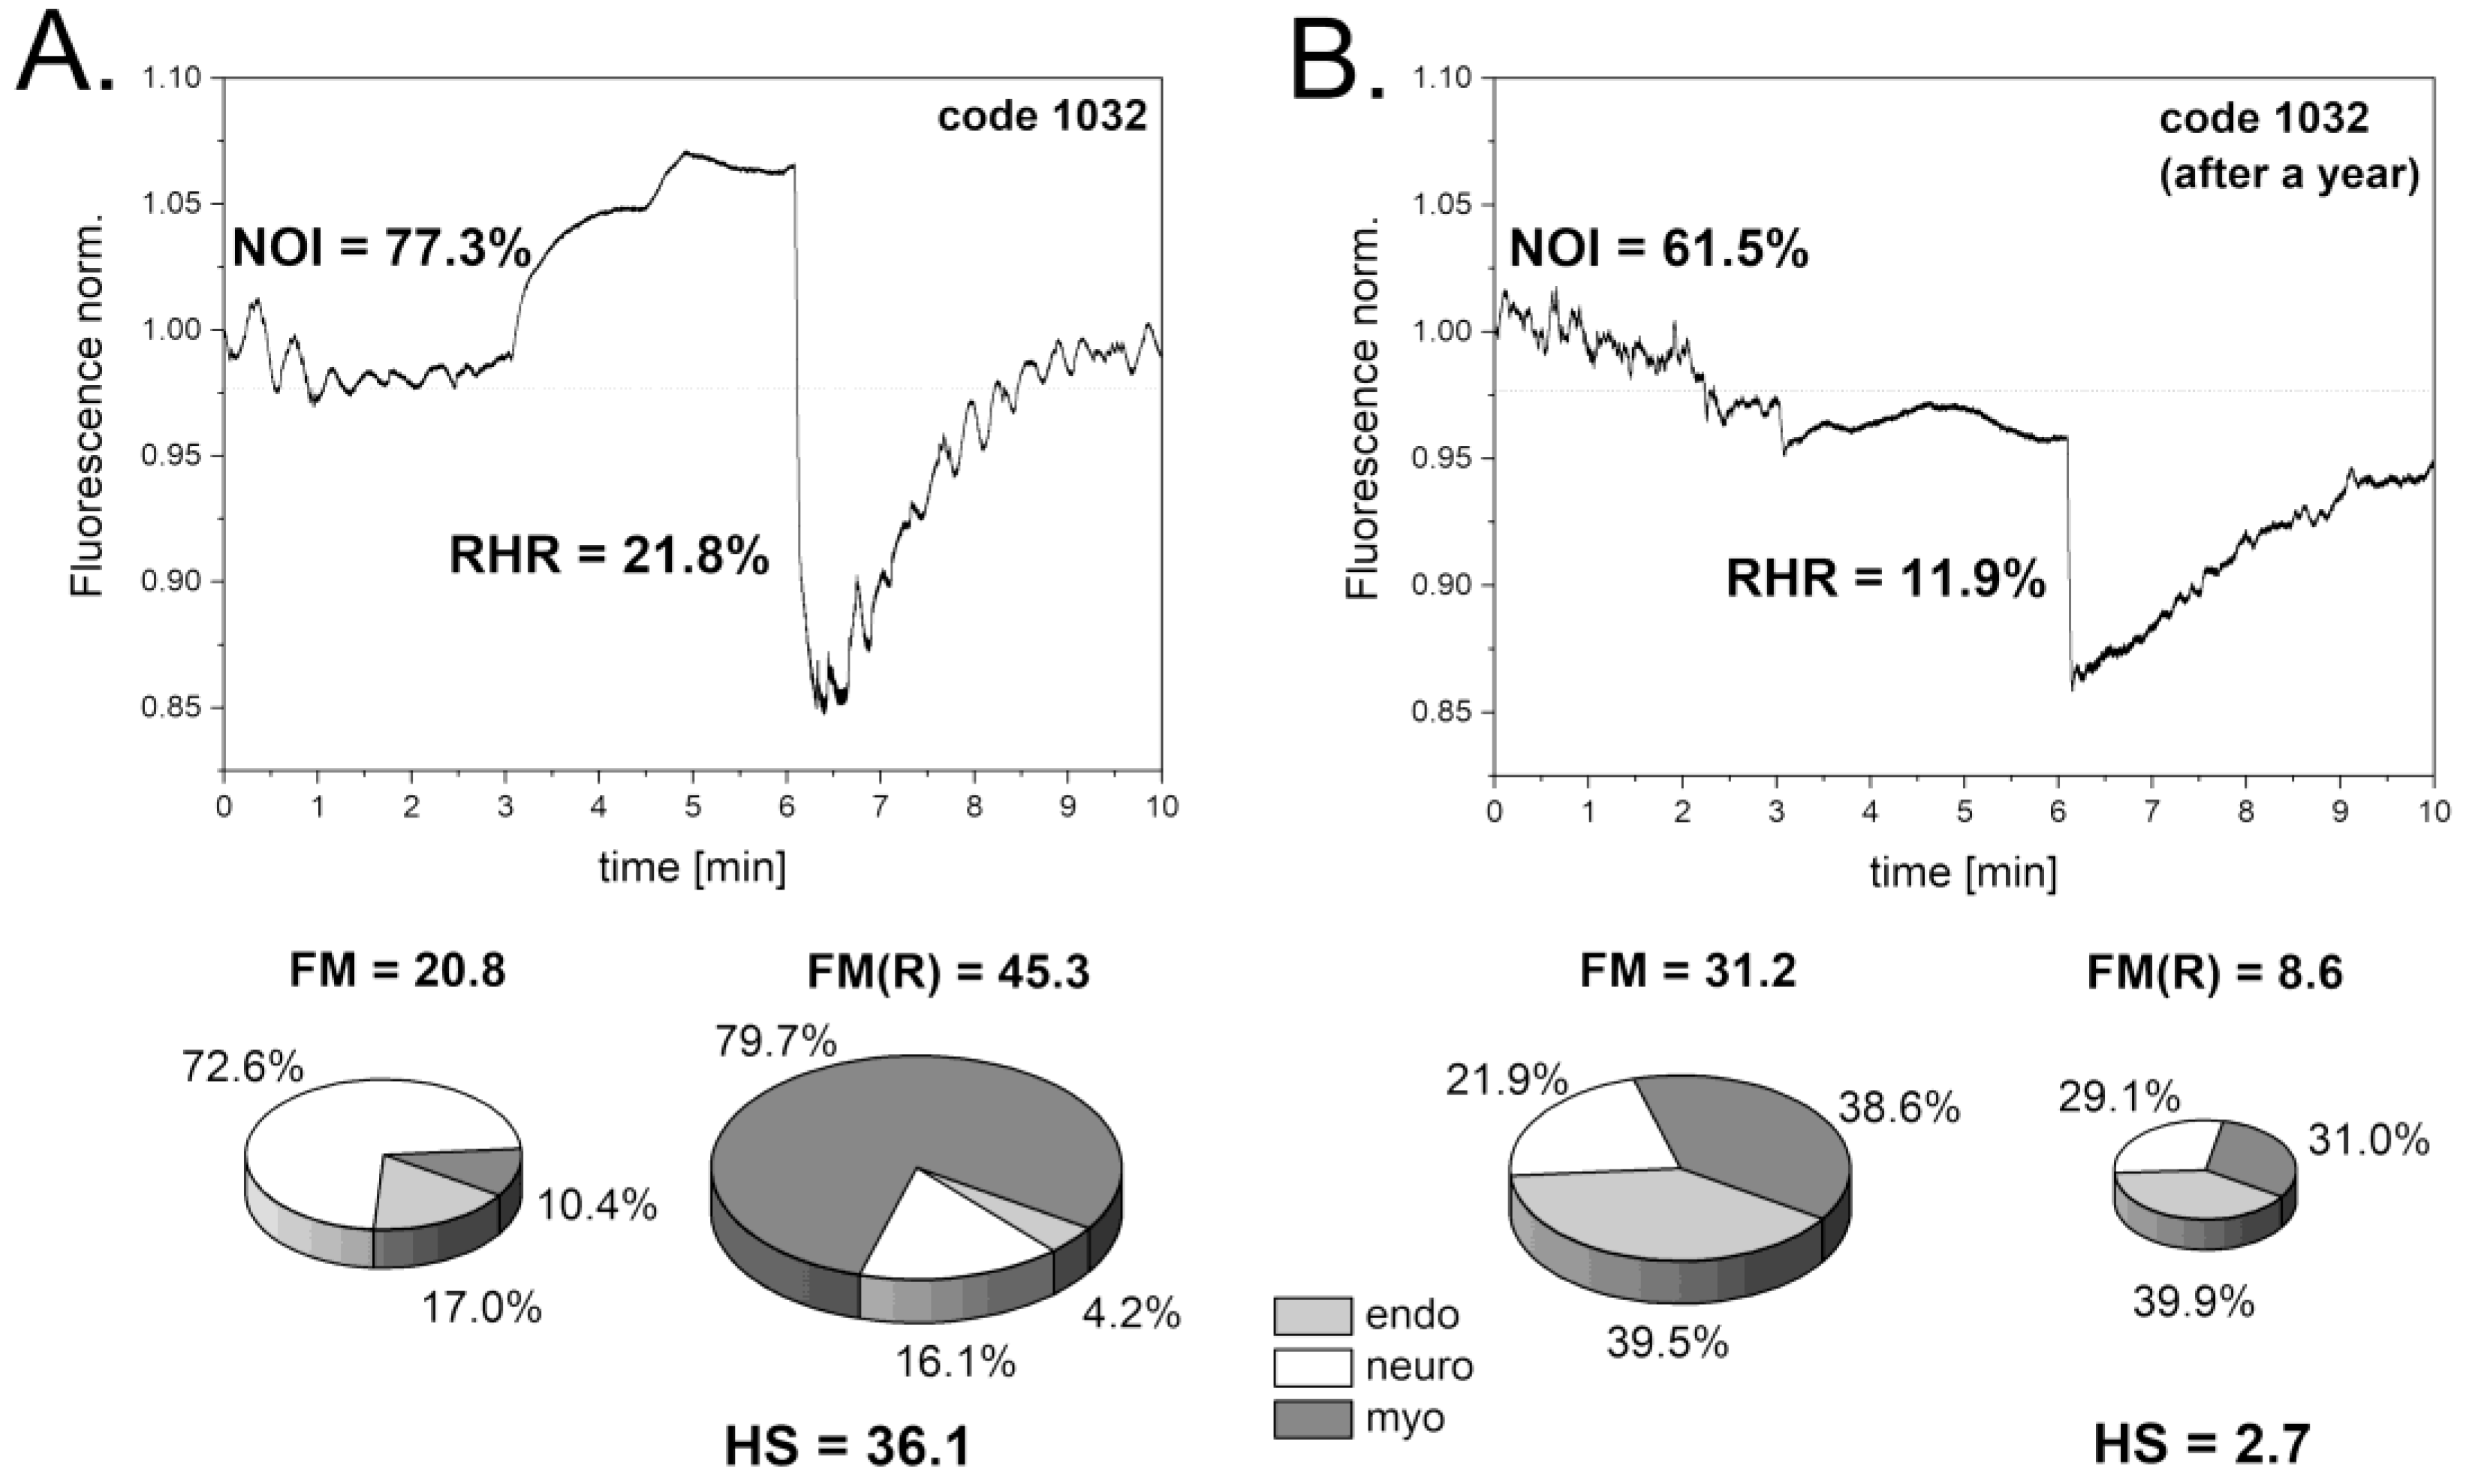
As shown in
Figure 7A, one patient with DFU had a satisfactory reaction to transient hypoxia, indicated by a moderate HS parameter value (HS = 36.1), suggesting potential DFU healing, though not guaranteed. A year later, the FMSF measurement showed a drastic decrease in the key FMSF parameters, indicating a severe worsening of the DM disease (
Figure 7B). The very low HS parameter value measured after a year (HS = 2.7) indicates the chronic status of DFU with a poor chance for healing. Observations of numerous cases of DFU patients with very low HS parameter values (HS < 5) showed no improvement in DFU status. This supports the conclusion that very low HS parameter values are indeed indicative of a poor prognosis for healing. This information is valuable for doctors in making decisions concerning further wound treatment.
5. Conclusions
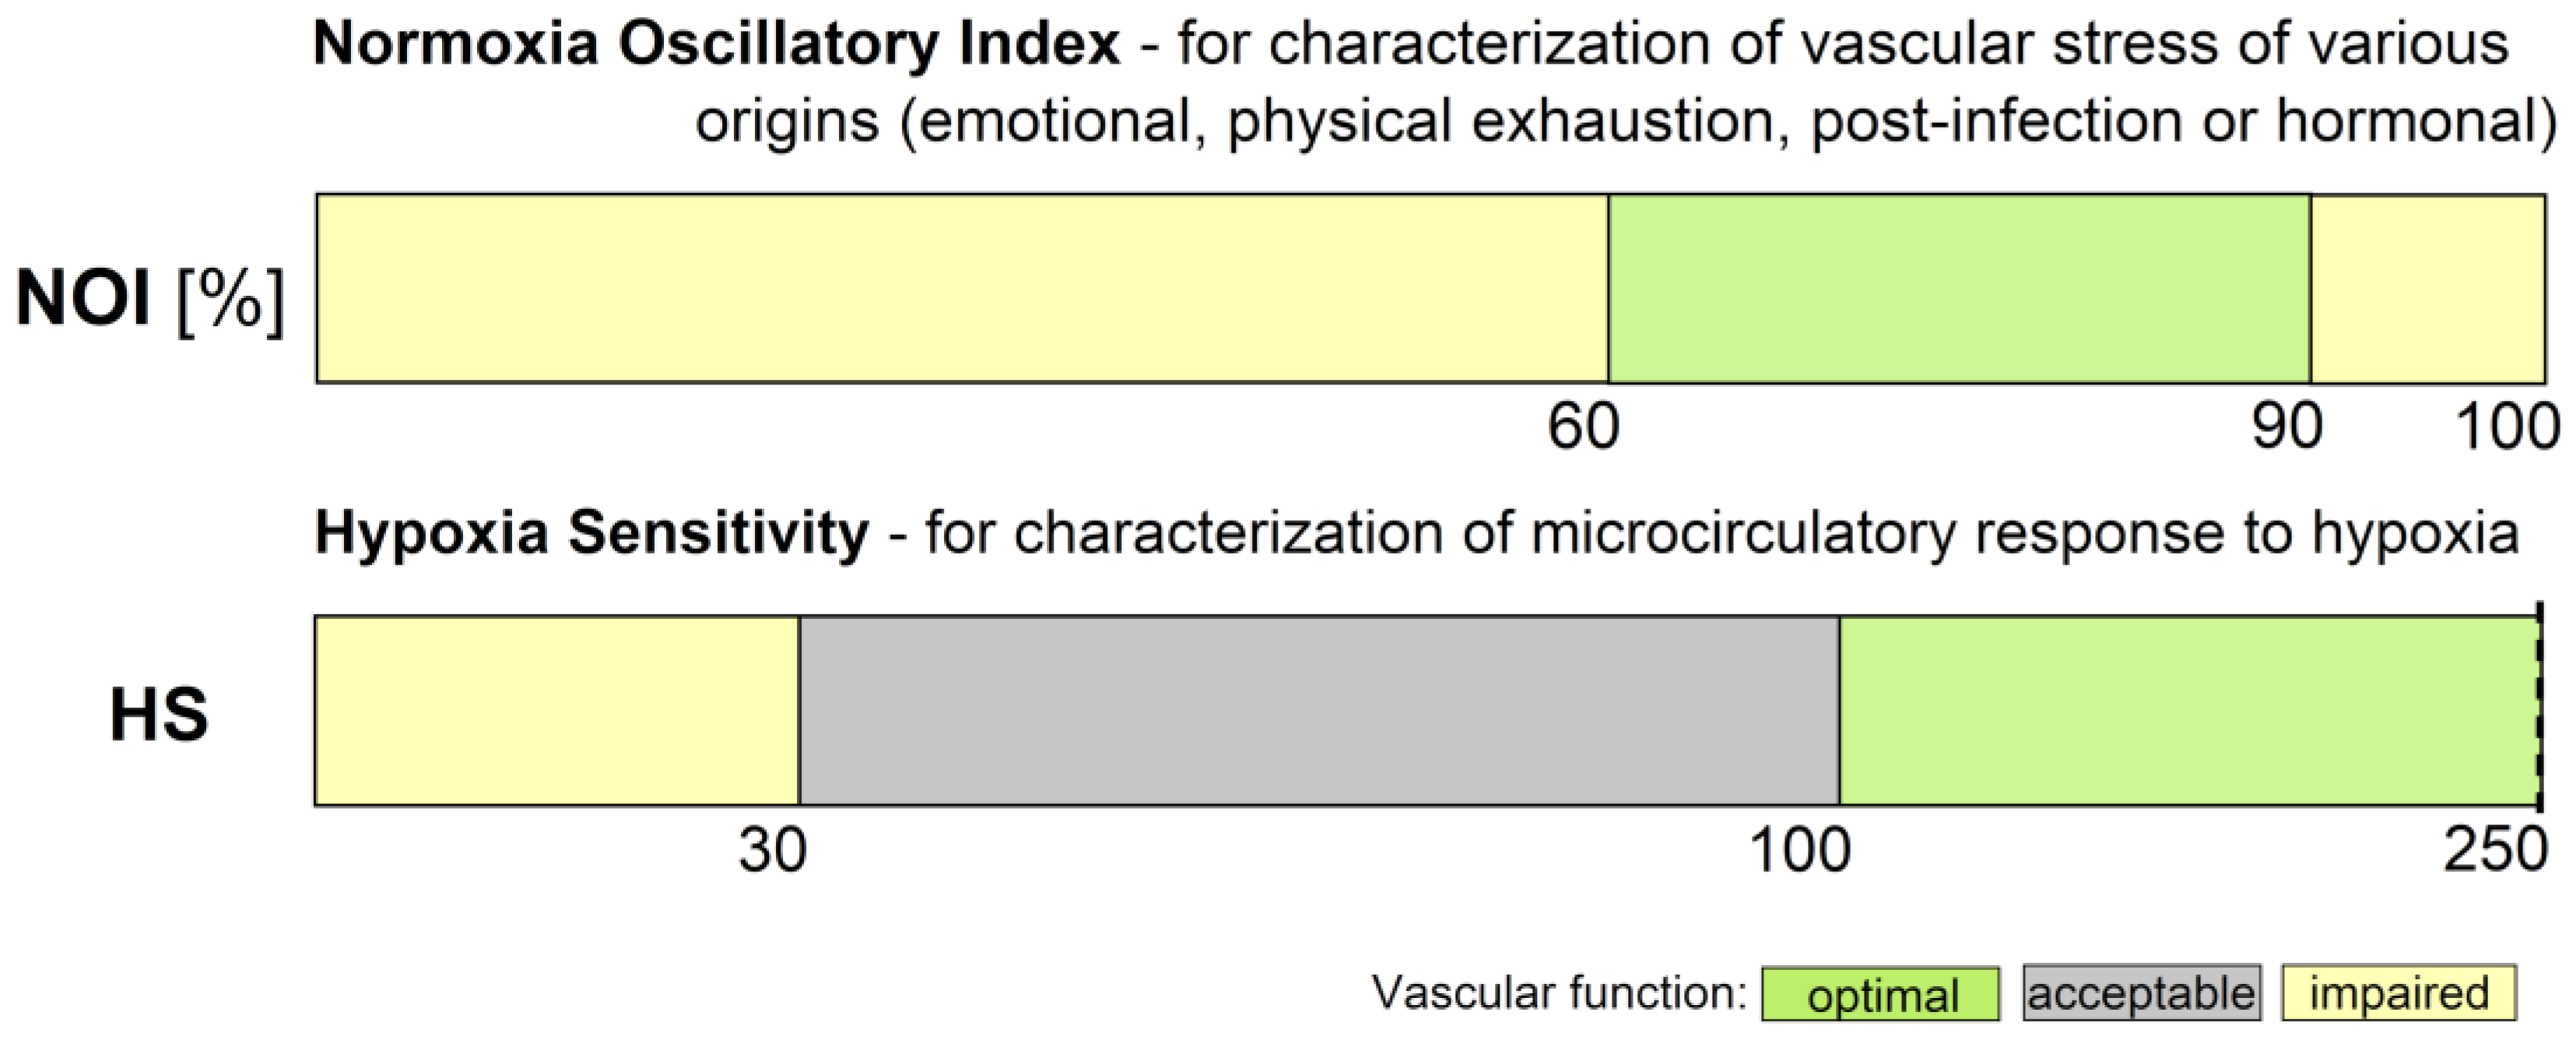
Diagnosing microvascular circulation is crucial for preventive medicine practitioners, as it allows for early identification of dysfunctional microvascular perfusion. However, there are very few diagnostic tools available for this purpose. The FMSF technique offers a powerful diagnostic tool for characterization of microvascular circulation, based on oscillatory parameters measured under conditions of both normoxia (NOI parameter) and hypoxia (HS parameter). Based on the cases discussed in this review, ranges of values for these parameters have been identified corresponding to optimal, acceptable, or impaired microvascular function (
Figure 8).
The FMSF technique can be used to predict microvascular perfusion and assess the risk of vascular-related complications, enabling earlier intervention and management strategies tailored to individual patient needs. The FMSF technique is particularly attractive due to its non-invasive nature and the possibility of its adaptation for use in wearable devices.
Author Contributions
Conceptualization: J.G. and A.M.; data selection: J.G., A.M., J.K., K.C., A.L-S, J.S-H., R.W-J. and J.Z.; discussion: J.G., A.M., J.K., K.C., A.L-S., J.S-H., R.W-J. and J.Z.; draft writing: J.G. All authors have read and agreed to the published version of the manuscript.
Funding
This work was supported by the European Union from the resources of the European Regional Development Fund under the Smart Growth Operational Program, Grant No. POIR. 01.01.01-00-0540/15-00.
Institutional Review Board Statement
This is a review article referring to the clinical trial results described in detail in the original articles. Relevant ethics committee approvals are detailed there.
Conflicts of Interest
JK is employed by Angionica Ltd. JG and AM are inventors of patents protecting the use of FMSF technology. The remaining authors declare that the research was conducted in the absence of any commercial or financial relationships that could be construed as a potential conflict of interest.
References
- Nilsson, H.; Aalkjaer, C. Vasomotion: Mechanisms and Physiological Importance. Mol. Interv. 2003, 3, 79–89. [Google Scholar] [CrossRef] [PubMed]
- Rossi, M.; Carpi, A.; Galetta, F.; Franzoni, F.; Santoro, G. The Investigation of Skin Blood Flowmotion: A New Approach to Study the Microcirculatory Impairment in Vascular Diseases? Biomed. Pharmacother. 2006, 60, 437–442. [Google Scholar] [CrossRef] [PubMed]
- Aalkjær, C.; Boedtkjer, D.; Matchkov, V. Vasomotion – What Is Currently Thought? Acta Physiol. 2011, 202, 253–269. [Google Scholar] [CrossRef] [PubMed]
- Kim, D. H.; Choi, J. Y.; Kim, S. M.; Son, S.-M.; Choi, S.-Y.; Koo, B.; Rah, C.-S.; Nam, J. H.; Ju, M. J.; Lee, J. S.; You, R. Y.; Hong, S. H.; Lee, J.; Bae, J.-W.; Kim, C. H.; Choi, W.; Kim, H. S.; Xu, W.-X.; Lee, S. J.; Kim, Y. C.; Yun, H.-Y. Vasomotion in Human Arteries and Their Regulations Based on Ion Channel Regulations: 10 Years Study. J. Cell. Physiol. 2023, 238 (9), 2076–2089. [CrossRef]
- Schmidt-Lucke, C.; Borgström, P.; Schmidt-Lucke, J. A. Low Frequency Flowmotion/(Vasomotion) during Patho-Physiological Conditions. Life Sci. 2002, 71, 2713–2728. [Google Scholar] [CrossRef] [PubMed]
- Bari, F.; Tóth-Szűki, V.; Domoki, F.; Kálmán, J. Flow Motion Pattern Differences in the Forehead and Forearm Skin: Age-Dependent Alterations Are Not Specific for Alzheimer’s Disease. Microvasc. Res. 2005, 70, 121–128. [Google Scholar] [CrossRef] [PubMed]
- Rossi, M.; Matteucci, E.; Pesce, M.; Consani, C.; Galetta, F.; Giampietro, O.; Santoro, G. Study of Skin Vasomotion in Type 1 Diabetic Patients and of Its Possible Relationship with Clinical and Laboratory Variables. Clin. Hemorheol. Microcirc. 2013, 53, 357–367. [Google Scholar] [CrossRef] [PubMed]
- Bruning, R. S.; Kenney, W. L.; Alexander, L. M. Altered Skin Flowmotion in Hypertensive Humans. Microvasc. Res. 2015, 97, 81–87. [Google Scholar] [CrossRef] [PubMed]
- Tikhonova, I. V; Kosyakova, N. I.; Tankanag, A. V; Chemeris, N. K. Oscillations of Skin Microvascular Blood Flow in Patients with Asthma. Microcirculation 2016, 23, 33–43. [Google Scholar] [CrossRef] [PubMed]
- Mizeva, I.; Makovik, I.; Dunaev, A.; M.D., A. K.; Meglinski, I. Analysis of Skin Blood Microflow Oscillations in Patients with Rheumatic Diseases. J. Biomed. Opt. 2017, 22 (7), 1–3. [CrossRef]
- Pedanekar, T.; Kedare, R.; Sengupta, A. Monitoring Tumor Progression by Mapping Skin Microcirculation with Laser Doppler Flowmetry. Lasers Med. Sci. 2019, 34, 61–77. [Google Scholar] [CrossRef]
- Sorelli, M.; Francia, P.; Bocchi, L.; De Bellis, A.; Anichini, R. Assessment of Cutaneous Microcirculation by Laser Doppler Flowmetry in Type 1 Diabetes. Microvasc. Res. 2019, 124, 91–96. [Google Scholar] [CrossRef]
- Li, J.; Zhang, Y.; Zhang, D.; Wang, W.; Xie, H.; Ruan, J.; Jin, Y.; Li, T.; Li, X.; Zhao, B.; Zhang, X.; Lin, J.; Shi, H.; Jia, J.-M. Ca2+ Oscillation in Vascular Smooth Muscle Cells Control Myogenic Spontaneous Vasomotion and Counteract Post-Ischemic No-Reflow. Commun. Biol. 2024, 7. [Google Scholar] [CrossRef] [PubMed]
- Stefanovska, A.; Bracic, M.; Kvernmo, H. D. Wavelet Analysis of Oscillations in the Peripheral Blood Circulation Measured by Laser Doppler Technique. IEEE Trans. Biomed. Eng. 1999, 46, 1230–1239. [Google Scholar] [CrossRef] [PubMed]
- Kvandal, P.; Landsverk, S. A.; Bernjak, A.; Stefanovska, A.; Kvernmo, H. D.; Kirkebøen, K. A. Low-Frequency Oscillations of the Laser Doppler Perfusion Signal in Human Skin. Microvasc. Res. 2006, 72, 120–127. [Google Scholar] [CrossRef]
- Holowatz, L. A.; Thompson-Torgerson, C. S.; Kenney, W. L. The Human Cutaneous Circulation as a Model of Generalized Microvascular Function. J. Appl. Physiol. 2008, 105, 370–372. [Google Scholar] [CrossRef] [PubMed]
- Hellmann, M.; Roustit, M.; Cracowski, J. L. Skin Microvascular Endothelial Function as a Biomarker in Cardiovascular Diseases? Pharmacol. Rep. 2015, 67, 803–810. [Google Scholar] [CrossRef]
- Bernjak, A.; Clarkson, P. B. M.; McClintock, P. V. E.; Stefanovska, A. Low-Frequency Blood Flow Oscillations in Congestive Heart Failure and after Beta1-Blockade Treatment. Microvasc. Res. 2008, 76, 224–232. [Google Scholar] [CrossRef] [PubMed]
- Clough, G. F.; Kuliga, K. Z.; Chipperfield, A. J. Flow Motion Dynamics of Microvascular Blood Flow and Oxygenation: Evidence of Adaptive Changes in Obesity and Type 2 Diabetes Mellitus/Insulin Resistance. Microcirculation 2017, 24, 1–13. [Google Scholar] [CrossRef] [PubMed]
- Marcinek, A.; Katarzynska, J.; Sieron, L.; Skokowski, R.; Zielinski, J.; Gebicki, J. Non-Invasive Assessment of Vascular Circulation Based on Flow Mediated Skin Fluorescence (FMSF). Biology 2023, 12, 385. [Google Scholar] [CrossRef]
- Marcinek, A.; Katarzynska, J.; Gebicki, J. A New Approach to Vascular Screening: Identification of Impaired Vascular Function Using the FMSF Technique. Sensors 2024, 24, 1721. [Google Scholar] [CrossRef]
- Gebicki, J.; Katarzynska, J.; Cholewinski, T.; Sieron, L.; Marcinek, A. Flowmotion Monitored by Flow Mediated Skin Fluorescence (FMSF): A Tool for Characterization of Microcirculatory Status. Front. Physiol. 2020, 11, 702. [Google Scholar] [CrossRef]
- Gebicki, J.; Marcinek, A.; Zielinski, J. Assessment of Microcirculatory Status Based on Stimulation of Myogenic Oscillations by Transient Ischemia: From Health to Disease. Vasc. Health Risk Manag. 2021, 17, 33–36. [Google Scholar] [CrossRef] [PubMed]
- Bugaj, O.; Zieliński, J.; Kusy, K.; Kantanista, A.; Wieliński, D.; Guzik, P. The Effect of Exercise on the Skin Content of the Reduced Form of NAD and Its Response to Transient Ischemia and Reperfusion in Highly Trained Athletes. Front. Physiol. 2019, 10, 1–11. [Google Scholar] [CrossRef]
- Bugaj, O.; Kusy, K.; Kantanista, A.; Korman, P.; Wieliński, D.; Zieliński, J. The Effect of a 7-Week Training Period on Changes in Skin NADH Fluorescence in Highly Trained Athletes. Appl. Sci. 2020, 10, 5133. [Google Scholar] [CrossRef]
- Henderson, S. A.; Graham, H. K.; Mollan, R. A. B.; Riddoch, C.; Sheridan, B.; Johnston, H. Calcium Homeostasis and Exercise. Int. Orthop. 1989, 13, 69–73. [Google Scholar] [CrossRef]
- Maïmoun, L.; Sultan, C. Effect of Physical Activity on Calcium Homeostasis and Calciotropic Hormones: A Review. Calcif. Tissue Int. 2009, 85, 277–286. [Google Scholar] [CrossRef]
- Chudzik, M.; Cender, A.; Mordaka, R.; Zieliński, J.; Katarzyńska, J.; Marcinek, A.; Gebicki, J. Chronic Fatigue Associated with Post-COVID Syndrome versus Transient Fatigue Caused by High-Intensity Exercise: Are They Comparable in Terms of Vascular Effects? Vasc. Health Risk Manag. 2022, 18, 711–719. [Google Scholar] [CrossRef]
- Wirth, K. J.; Scheibenbogen, C. Dyspnea in Post-COVID Syndrome Following Mild Acute COVID-19 Infections: Potential Causes and Consequences for a Therapeutic Approach. Medicina (Kaunas) 2022, 58. [Google Scholar] [CrossRef]
- Nguyen, T.; Johnston, S.; Clarke, L.; Smith, P.; Staines, D.; Marshall-Gradisnik, S. Impaired Calcium Mobilization in Natural Killer Cells from Chronic Fatigue Syndrome/Myalgic Encephalomyelitis Patients Is Associated with Transient Receptor Potential Melastatin 3 Ion Channels. Clin. Exp. Immunol. 2017, 187, 284–293. [Google Scholar] [CrossRef]
- Romanowska-Kocejko, M.; Jędrzejewska, A.; Braczko, A.; Stawarska, K.; Król, O.; Frańczak, M.; Harasim, G.; Smoleński, R. T.; Hellmann, M.; Kutryb-Zając, B. Red Blood Cell Adenylate Energetics Is Related to Endothelial and Microvascular Function in Long COVID. Biomedicines 2024, 12, 554. [Google Scholar] [CrossRef]
- Sara, J. D. S.; Toya, T.; Ahmad, A.; Clark, M. M.; Gilliam, W. P.; Lerman, L. O.; Lerman, A. Mental Stress and Its Effects on Vascular Health. Mayo Clin. Proc. 2022, 97, 951–990. [Google Scholar] [CrossRef] [PubMed]
- Gebicki, J.; Katarzynska, J.; Marcinek, A. Effect of Psychological Stress on Microcirculation Oscillations: Diagnostic Aspects. Vasc. Health Risk Manag. 2023, 19, 79–82. [Google Scholar] [CrossRef]
- MacCormack, J. K.; Armstrong-Carter, E. L.; Gaudier-Diaz, M. M.; Meltzer-Brody, S.; Sloan, E. K.; Lindquist, K. A.; Muscatell, K. A. β-Adrenergic Contributions to Emotion and Physiology During an Acute Psychosocial Stressor. Psychosom. Med. 2021, 83, 959–968. [Google Scholar] [CrossRef] [PubMed]
- Brotons, F. B.; Campos, J. C.; Gonzalez-Correales, R.; Martín-Morales, A.; Moncada, I.; Pomerol, J. M. Core Document on Erectile Dysfunction: Key Aspects in the Care of a Patient with Erectile Dysfunction. Int. J. Impot. Res. 2004, 16, S26–S39. [Google Scholar] [CrossRef]
- Montorsi, F.; Briganti, A.; Salonia, A.; Rigatti, P.; Margonato, A.; Macchi, A.; Galli, S.; Ravagnani, P. M.; Montorsi, P. Erectile Dysfunction Prevalence, Time of Onset and Association with Risk Factors in 300 Consecutive Patients with Acute Chest Pain and Angiographically Documented Coronary Artery Disease. Eur. Urol. 2003, 44, 360–365. [Google Scholar] [CrossRef] [PubMed]
- Guo, W.; Liao, C.; Zou, Y.; Li, F.; Li, T.; Zhou, Q.; Cao, Y.; Mao, X. Erectile Dysfunction and Risk of Clinical Cardiovascular Events: A Meta-Analysis of Seven Cohort Studies. J. Sex. Med. 2010, 7, 2805–2816. [Google Scholar] [CrossRef] [PubMed]
- Alberti, L.; Torlasco, C.; Lauretta, L.; Loffi, M.; Maranta, F.; Salonia, A.; Margonato, A.; Montorsi, F.; Fragasso, G. Erectile Dysfunction in Heart Failure Patients: A Critical Reappraisal. Andrology 2013, 1, 177–191. [Google Scholar] [CrossRef]
- Yannas, D.; Frizza, F.; Vignozzi, L.; Corona, G.; Maggi, M.; Rastrelli, G. Erectile Dysfunction Is a Hallmark of Cardiovascular Disease: Unavoidable Matter of Fact or Opportunity to Improve Men’s Health? J. Clin. Med. 2021, 10, 2221. [Google Scholar] [CrossRef]
- Corona, G.; Monami, M.; Boddi, V.; Cameron-Smith, M.; Fisher, A. D.; De Vita, G.; Melani, C.; Balzi, D.; Sforza, A.; Forti, G.; Mannucci, E.; Maggi, M. Low Testosterone Is Associated with an Increased Risk of MACE Lethality in Subjects with Erectile Dysfunction. J. Sex. Med. 2010, 7, 1557–1564. [Google Scholar] [CrossRef]
- Colin, O.; Bergh, A.; Damber, J.-E.; Widmark, A. Control of Testicular Vasomotion by Testosterone and Tubular Factors in Rats. J. Reprod. Fertil. 1993, 97, 115–121. [Google Scholar] [CrossRef]
- Welsh, M.; Sharpe, R. M.; Moffat, L.; Atanassova, N.; Saunders, P. T. K.; Kilter, S.; Bergh, A.; Smith, L. B. Androgen Action via Testicular Arteriole Smooth Muscle Cells Is Important for Leydig Cell Function, Vasomotion and Testicular Fluid Dynamics. PLoS One 2010, 5, e13632. [Google Scholar] [CrossRef]
- Slowikowska-Hilczer, J.; Walczak-Jedrzejowska, R.; Adamczewska, D.; Byczkiewicz, P.; Marchlewska, K.; Katarzynska, J.; Gebicki, J. A New Approach to the Assessment of Erectile Dysfunction Based on Vasomotion Monitored by the Flow-Mediated Skin Fluorescence (FMSF) Technique—A Preliminary Study. J. Clin. Med. 2024, 13, 3210. [Google Scholar] [CrossRef] [PubMed]
- Cai, J. J.; Wen, J.; Jiang, W. H.; Lin, J.; Hong, Y.; Zhu, Y. S. Androgen Actions on Endothelium Functions and Cardiovascular Diseases. J. Geriatr. Cardiol. 2016, 13, 183–196. [Google Scholar] [CrossRef] [PubMed]
- Er, F.; Michels, G.; Brandt, M. C.; Khan, I.; Haase, H.; Eicks, M.; Lindner, M.; Hoppe, U. C. Impact of Testosterone on Cardiac L-Type Calcium Channels and Ca2+ Sparks: Acute Actions Antagonize Chronic Effects. Cell Calcium 2007, 41, 467–477. [Google Scholar] [CrossRef] [PubMed]
- Zito, S.; Nosari, G.; Pigoni, A.; Moltrasio, C.; Delvecchio, G. Association between Testosterone Levels and Mood Disorders: A Minireview. J. Affect. Disord. 2023, 330, 48–56. [Google Scholar] [CrossRef] [PubMed]
- Liu, J.; Wei, Q.; Guo, C.; Dong, G.; Liu, Y.; Tang, C.; Dong, Z. Hypoxia, HIF, and Associated Signaling Networks in Chronic Kidney Disease. Int. J. Mol. Sci. 2017, 18. [Google Scholar] [CrossRef] [PubMed]
- Catrina, S.-B.; Zheng, X. Disturbed Hypoxic Responses as a Pathogenic Mechanism of Diabetic Foot Ulcers. Diabetes Metab. Res. Rev. 2016, 32, 179–185. [Google Scholar] [CrossRef]
- Catrina, S. B.; Zheng, X. Hypoxia and Hypoxia-Inducible Factors in Diabetes and Its Complications. Diabetologia 2021, 64, 709–716. [Google Scholar] [CrossRef]
- Dei Cas, A.; Gnudi, L. VEGF and Angiopoietins in Diabetic Glomerulopathy: How Far for a New Treatment? Metabolism 2012, 61, 1666–1673. [Google Scholar] [CrossRef]
- Thangarajah, H.; Yao, D.; Chang, E. I.; Shi, Y.; Jazayeri, L.; Vial, I. N.; Galiano, R. D.; Du, X.-L.; Grogan, R.; Galvez, M. G.; Januszyk, M.; Brownlee, M.; Gurtner, G. C. The Molecular Basis for Impaired Hypoxia-Induced VEGF Expression in Diabetic Tissues. Proc. Natl. Acad. Sci. U. S. A. 2009, 106, 13505–13510. [Google Scholar] [CrossRef]
- Los-Stegienta, A.; Borkowska, A.; Cypryk, K. Assessment of Microvascular Function Using a Novel Technique Flow Mediated Skin Fluorescence (FMSF) in Patients with Diabetic Kidney Disease: A Preliminary Study. Microvasc. Res. 2022, 144, 104417. [Google Scholar] [CrossRef]
- Los-Stegienta, A.; Katarzynska, J.; Borkowska, A.; Marcinek, A.; Cypryk, K.; Gebicki, J. Differentiation of Diabetic Foot Ulcers Based on Stimulation of Myogenic Oscillations by Transient Ischemia. Vasc. Health Risk Manag. 2021, 17, 145–152. [Google Scholar] [CrossRef] [PubMed]
Figure 1.
Exemplary FMSF trace recorded using the AngioExpert device. (A): Visualization of three main parts showing the key parameters (RHR, HS, NOI) for each part. (B): Analysis of oscillations at the baseline. (C): Analysis of oscillations at the reperfusion line.
Figure 1.
Exemplary FMSF trace recorded using the AngioExpert device. (A): Visualization of three main parts showing the key parameters (RHR, HS, NOI) for each part. (B): Analysis of oscillations at the baseline. (C): Analysis of oscillations at the reperfusion line.
Figure 2.
Comparison of the log(FM) (A) and NOI (B) parameters in a group of highly trained endurance athletes (triathletes – 16, long-distance runners – 6), n = 22, 15 males, 7 females, mean age 20.0 (16-40 y). Measurements were taken before exercise, after exercise until exhaustion, and after 1 hour of rest. Differences between the parameters of the compared groups were considered statistically significant when p < 0.05. The p-values were calculated by one-way ANOVA with the Tukey post hoc test.
Figure 3.
Comparison (A) and distribution (B) of the NOI parameter in the control group (n = 32, 19 males, 13 females, mean age 37.8 (30–50 y)) and post-COVID group (n = 45, 19 males, 26 females, mean age 41.5 (30–50 y)). Differences between the parameters of the compared groups were considered statistically significant when p < 0.05. The p-values were calculated from the Mann-Whitney test.
Figure 4.
Power Spectral Density (PSD) of the fluorescence signal recorded for a prediabetes patient (male, age 75 y) at the baseline in intervals of endothelial (< 0.021 Hz), neurogenic (0.021 – 0.052 Hz), and myogenic (0.052 – 0.15 Hz) activity. (A): Changes recorded before the appearance of psychological stress. (B): Changes observed under prolonged psychological stress. (C): changes observed after a week of therapy with a beta-blocker (nebivolol at a daily dose of 1.25 mg).
Figure 5.
Comparison of the log(FM) (A), log(VM) (B), and NOI (C) parameters for a group of men without erectile dysfunction (ED) (n = 40, mean age 41.2 (24–57 y)) and a group of men with ED (n = 39, mean age 53.3 (27–72 y)). Differences between the parameters of the compared groups were considered statistically significant when p < 0.05. The p-values were calculated from the two sample t-test for comparison (A and B) and the Mann-Whitney test for the comparison (C).
Figure 6.
(A): Comparison of the log(HS) parameter in healthy individuals (n = 21, 8 males, 13 females, mean age 46.2 (30–68 y)), DM patients without complications (n = 33, 13 males, 20 females, mean age 44.4 (21–74 y)), and DKD patients (n = 30, 7 males, 23 females, mean age 62.8 (29–88 y)). (B): Correlation between log(HS) parameter and nephrological parameter in the diabetic population (n = 63) (Pearson correlation). Differences between the parameters of the compared groups were considered statistically significant when p < 0.05. The p-values were calculated by one-way ANOVA with the Scheffe post hoc test.
Figure 7.
Significant changes in FMSF traces recorded at different time points for a patient with DFU (male, age 67 y, DM2). (A): First measurement. (B): Measurement performed after one year.
Figure 7.
Significant changes in FMSF traces recorded at different time points for a patient with DFU (male, age 67 y, DM2). (A): First measurement. (B): Measurement performed after one year.
Figure 8.
Ranges of FMSF parameters: NOI (Normoxia Oscillatory Index) and HS (Hypoxia Sensitivity).
Figure 8.
Ranges of FMSF parameters: NOI (Normoxia Oscillatory Index) and HS (Hypoxia Sensitivity).
|
Disclaimer/Publisher’s Note: The statements, opinions and data contained in all publications are solely those of the individual author(s) and contributor(s) and not of MDPI and/or the editor(s). MDPI and/or the editor(s) disclaim responsibility for any injury to people or property resulting from any ideas, methods, instructions or products referred to in the content. |
© 2024 by the authors. Licensee MDPI, Basel, Switzerland. This article is an open access article distributed under the terms and conditions of the Creative Commons Attribution (CC BY) license (http://creativecommons.org/licenses/by/4.0/).
