Preprint
Article

Phenomenological Modeling of TRIP Steels

Altmetrics

Downloads

93

Views

37

Comments

0

Submitted:

29 August 2024

Posted:

30 August 2024

You are already at the latest version

Alerts
Abstract
A constant effort is made in the physical metallurgy of transformation induced plasticity (TRIP) steels. These are multiphase steels, whose mechanical behavior depends on the different phases present, the intrinsic strength of each phase, the work hardening of each constituent and the austenite to martensite transformation, among others. Hard and soft phases can be distinguished in these steels and both stress and strain are distributed between them. The objective of this work was to simulate the stress-strain behavior for two TRIP steels. Bouquerel’s model was modified to account for the initial martensite, a moderate hard austenite and adjustable strain hardening parameters. The austenite fraction that transforms into martensite was computed through an Olson and Cohen model. The Mecking-Kocks model was used to evaluate the increment in the dislocation density and the Rodriguez-Gutierrez model, to compute the hardening of martensite. Ferrite is considered a soft phase, martensite and bainite, hard phases and austenite, a phase with a moderate hardness. The routine was implemented in MATLAB, and results were compared with those obtained experimentally in a tension test of two TRIP steels of the same composition but different heat treatments, obtaining in both cases a good agreement for the stress-strain-curves.
Keywords: 
Subject: Engineering  -   Metallurgy and Metallurgical Engineering

1. Introduction

Transformation Induced Plasticity (TRIP) steels belong to the Advanced High Strength Steels (AHSS) family [1]. These steels are made up of a mixture of phases: polygonal ferrite, bainitic ferrite, martensite and retained austenite with a high carbon content. The main characteristics of these steels are high mechanical strength and high ductility [2]. The mechanical behavior of these kind of AHSS steels is related to the TRIP effect, which results in plasticity induced to the steel by the transformation of retained austenite into martensite [3,4]. The microstructure of these steels can be understood as that of a composite material, where polygonal ferrite gives ductility while bainitic ferrite and martensite contribute with mechanical strength. These steels are characterized by a high strain hardening that delays the necking formation, thus increasing the ductility [5,6,7]. The transformation of retained austenite to martensite also increases the strength of the steel.
Two heat treatments can be followed to obtain a TRIP steel. The first one consists in heating to full austenization (T>A3), followed by an isothermal treatment (IT) at temperatures between 300 and 400°C. These steels contain Si and Al that suppress the carbides precipitation during IT, so, austenite partially transforms into sheaf-shaped carbide-free ferrite or bainitic ferrite (BF), rejecting C to the remaining austenite, which due to C enrichment becomes stable down to room temperature, and is consequently called “retained austenite”. Thus, with this treatment, the TRIP Bainitic Ferrite (TBF) steel results, which contains bainitic ferrite, retained austenite and residual martensite. In the second heat treatment, the original steel is soaked at an intercritical temperature (A1<T<A3), to obtain polygonal ferrite (PF) and austenite, followed by the same IT previously described. The resultant microstructure consists of polygonal ferrite, bainitic ferrite, retained austenite and martensite [8]. In this case, the TRIP steel may be called TPF (TRIP Polygonal Ferrite) [9].
Prediction of the mechanical properties of these types of steel is a permanent interest area. Several models have been proposed to account for the mechanical behavior of TRIP steels.
A complete introduction to modeling of TRIP steels can be found in the work of Turteltaub and Suiker [10], who proposed an structured procedure to carry up the modeling of these kind of steels, from meso scale to lattice scale. Iwamoto [11] analyzed the macroscopic deformation behavior of TRIP steel, studying the effects of configuration and homogeneity of martensite on the austenitic matrix. To do this, the author assumed that martensite could be represented as an ellipsoidal shape inside an austenite unit cell, solving the associated equations by means of Finite Element Method (FEM). Previously, Iwamoto and Tsuta [12] developed a model to describe the deformation behavior of CT (Compact Tension) fracture samples of TRIP steels during mode I loads applying FEM to resolve the equations of the model. Serri et al. [13] applied the model proposed by Iwamoto to a cup drawing test of TRIP steel, analyzing the contribution of the austenite to martensite transformation on the overall behavior of the steel, validating their results with experimental data from literature. A model for the plastic flow of TRIP-aided steel was developed by Delannay et al. [14], who took into account the difference between hard and soft constituents. They applied their results to different load states obtaining a good agreement between experimental and predicted results. Other research oriented to enhance the comprehension of the TRIP phenomena is the work of Sierra and Nemes [15], who developed a model based on finite elements in order to understand the influence of aspects such as the rate of the austenite to martensite transformation and the state of stress, among others. A multi-scale model describing the martensitic transformation and the plasticity associated has been developed by Kouznetsova et al. [16]. They used three levels in the description of the model: macro, meso and micro scale. The model considers the coupling between elastic and plastic deformation as well as the relationship between austenite to martensite transformation and applied stresses. When they applied the model to different situations such as transformation of mono and polycrystals, they obtained satisfactory results. A micromechanical model was developed by Lani et al. [17], in order to predict the austenite fraction that transforms to martensite, using parameters obtained from uniaxial tension tests. The model was validated applying it to different load configurations such as pure shear and biaxial loading. The effect of pre-strain applied to TRIP steels and its relationship with transformation induced plasticity was studied by Li et al.[18]. They used an anisotropic yield function and a mixture hardening law for the four phases, developing the numerical model in a commercial software. Liu et al. [19] developed a method to evaluate the influence of retained austenite grain size over austenite to martensite transformation in the context of a classical methodology similar to that used in this work, namely, an Olson and Cohen model for the austenite to martensite transformation and a law of mixtures. Results obtained with the model are in good agreement with experimental data. Meftah et al. [20] applied a micromechanical model for the martensitic transformation, developing the model in a commercial software. Results obtained are quite close to experimental data. Dan et al. [7,21] developed a method for the prediction of mechanical behavior of TRIP steels based on a model that considers an anisotropic yield function. The development of the model was carried with a commercial software, obtaining accurate results. A model for transformation behavior of a TRIP steel that exhibits Si and Mn partition, was developed by Minote et al. [22], finding that transformation kinetics above 350ºC obeys a diffusional mechanism, and below this temperature, a displacive mechanism. Valance et al. [23] developed an enhancement of the model first proposed by Leblond, which allows the original model to be applied to cooling stages, showing the importance of harder phases in plastic flowing. An evaluation of different models for austenite to martensite transformation, such as those proposed by Leblond and Tanaka, were carried out by Wolff [24]. Concerning strain hardening behavior, Yu [25] proposed a formal analysis in the context of continuous mechanical theory, in order to compute the strain hardening coefficient for TRIP steels. The author concluded that this coefficient is not constant during plastic strain.
Some research is oriented to use in the automotive industry and other industrial forming processes. Papatriantafillou et al. [26] developed a constitutive model for the prediction of mechanical behavior of TRIP steels, considering the steel as a composite material constituted by a matrix of ferrite plus bainitic ferrite and retained austenite. They used it satisfactorily to compute the limit deformation diagram. Shan et al. [27] plot the stress-strain curve from a finite element software that takes into account the multiphasic characteristic of TRIP steel and anisotropy behavior, finding that stress triaxiality has a great influence on the transformation rate. They applied these results to a stamp forging simulating the springback effect. Still in the context of the automotive industry, the work of Thibaud et al. [28] is worth noting because they designed and built a TRIP steel U-shaped energy absorber channel, analyzing the flow laws of the material. In the context of damage theory, Uthaisangsuk et al. [29] used the representative volume elements as a strategy to analyze the damage of multiphase steels, based on continuous damage mechanics.
Research related to TRIP steels and the austenite to martensite transformation is constantly carried out, such as the works of Benzing et al. [30], Jung et al. [31], Mulidran et al. [32], Polatidis et al. [33], Pruger et al. [34], Seupel et al. [35], Tzini et al. [36]. The latter includes an interesting analysis of the evolution on micro constituents during isothermal bainitic treatment. Also, research in alternating deformation of TRIP steels was recently published by Burgold et al. [37], or more recently by Gui et al. [38]. A machine learning combined with physical models was developed by Mu et al. [39], achieving a successful prediction of the mechanical properties of TRIP steels.
The aim of this work is to develop a model based on phenomenological equations to predict the mechanical properties of TRIP steels, validating it in two steels that show the TRIP effect. The model has been taken from that developed by Bouquerel et al. [40], but the main contributions are the modifications introduced to the model in order to consider the initial fraction of martensite present in the studied steels, the hardness of austenite and the adjustable parameters of Mecking-Kocks model. In a previous work, the authors modeled TRIP steels using these modifications [41].

2. Materials and Experimental Results

Chemical analysis of the steel was carried out by Optical Emission Spectrometry (OES) in a Spectro analyzer, model Spectromax (SPECTRO Analytical Instruments GmbH, Kleve, Germany) according to ASTM E415 standard [42]. Table 1 shows the chemical composition.
Optical microscopy (OM), scanning electronic microscopy (SEM), atomic force microscopy and X-Ray Diffraction (DRX) were used for microstructural characterization. OM was carried out in an Olympus BX-51 (Olympus, Tokyo, Japan), SEM was carried out in a JEOL JSM 6010-LA (JEOL, JSM 6010, Akishima, Japan), and for AFM analysis, a software Gwyddion was used (version 2.59, Czech Metrology Institute, Brno, Czech Republic). Tensile tests were carried out in a 50 KN Zwick-Roell (Zwick GmbH & Co. KG, Ulm, Germany) electromechanical machine, with a displacement control. A Rigaku MiniFlex (Rigaku, Tokyo, Japan) X-Ray diffractometer was used for phase analysis at a continuous scanning rate of 5°/s, between 30° and 140°, using Cr-K α radiation. The analysis of peaks 111 γ , 200 γ , 220 γ and 110 α , 200 α , following ASTM E-975 standard [43], allowed for the determination of retained austenite.
To compare the resultant microstructures, austenite stability and mechanical behavior, two sets of 15 mm thickness samples were submitted to different heat treatments (thermal cycles), Figure 1, designed with the goal of fabricating two steels of the same composition but different microstructures. Thus, the first set, labeled Steel A (TBF), was soaked during 1200 s at 910°C to obtain 100% austenite and then cooled down to an isothermal annealing at 400°C for 1500 s to obtain a TRIP steel containing bainitic ferrite, TBF. The treatment for the other set, labeled Steel D (TPF), was designed to get a TRIP steel containing polygonal ferrite, TPF, after an intercritical annealing at 760°C for 1200 s, forming 50% ferrite plus 50% austenite, followed by an isothermal treatment at 400°C for 1500 s. In both steels, precipitation of manganese carbides was avoided by cooling at 20 °C/s from the soaking temperature, because these carbides precipitates in the range 525 to 650°C [44].

2.1. Retained Austenite

The retained austenite, determined as explained above, was 10.4% for steel A and 17.9% for steel D. This retained austenite transforms to martensite when the steels are strained. Furthermore, these data combined with other techniques, allows estimating the fraction of the other phases present in each steel.

2.2. Metallographic Analysis

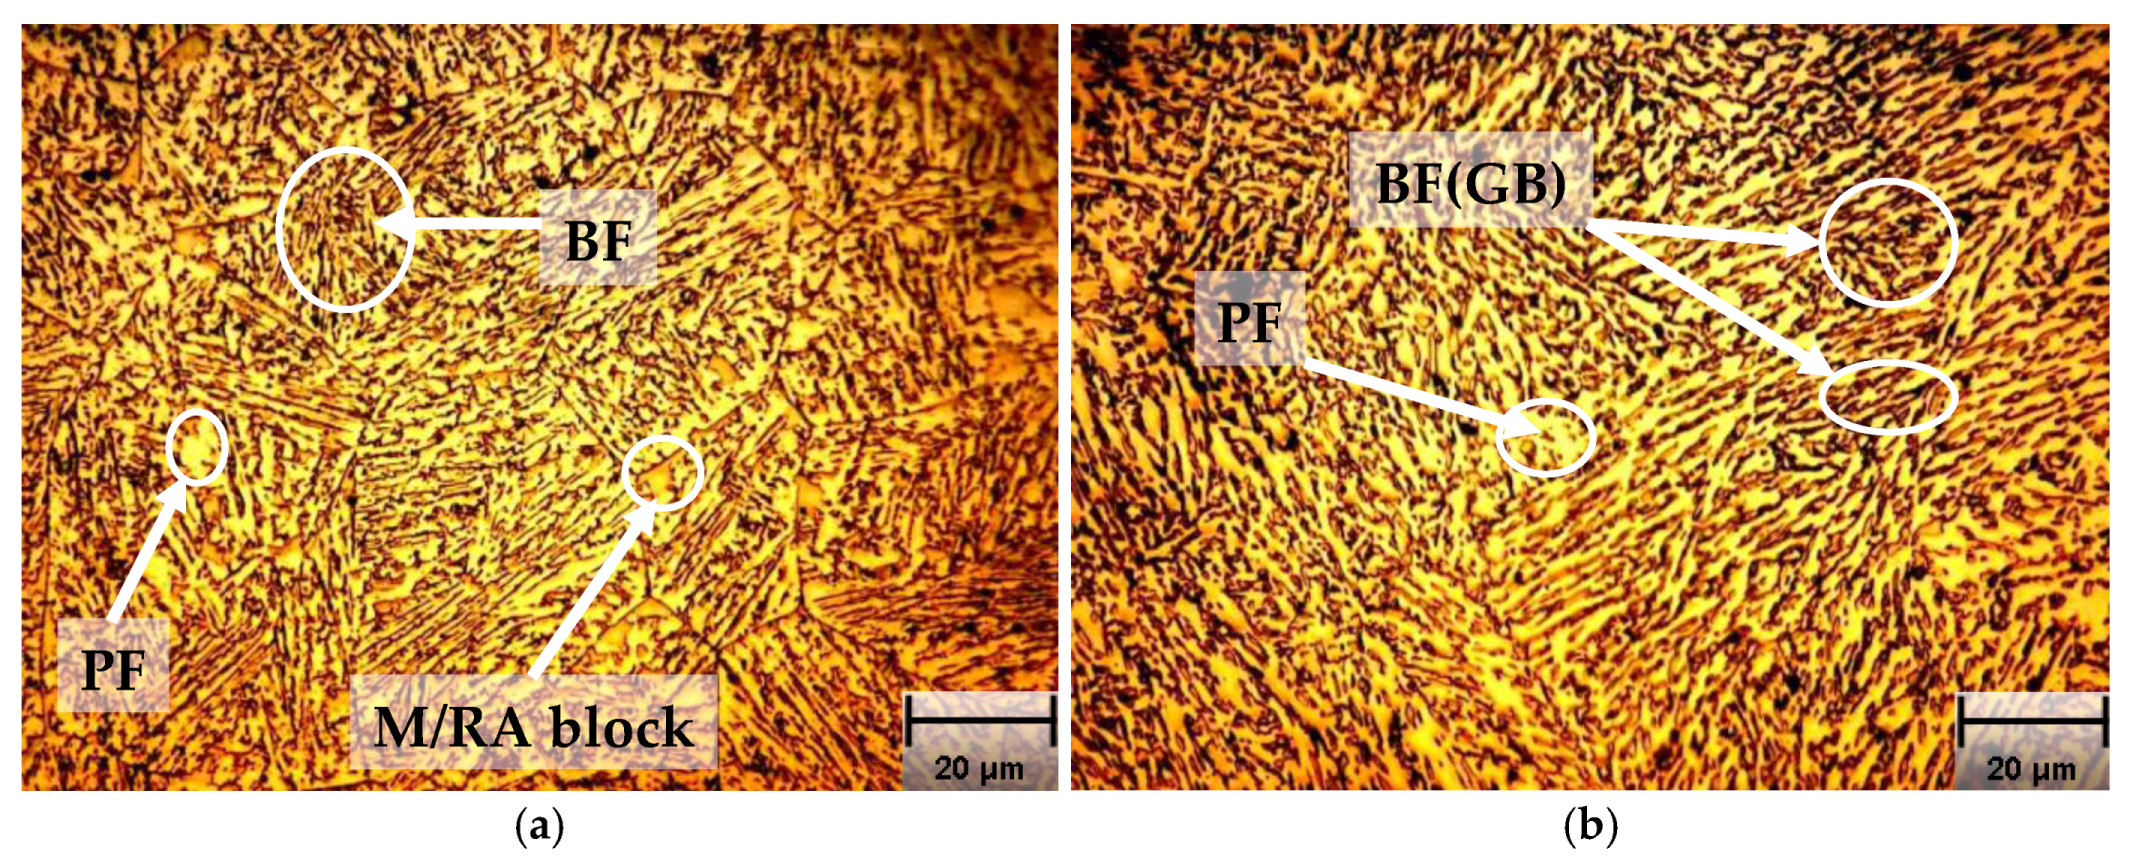
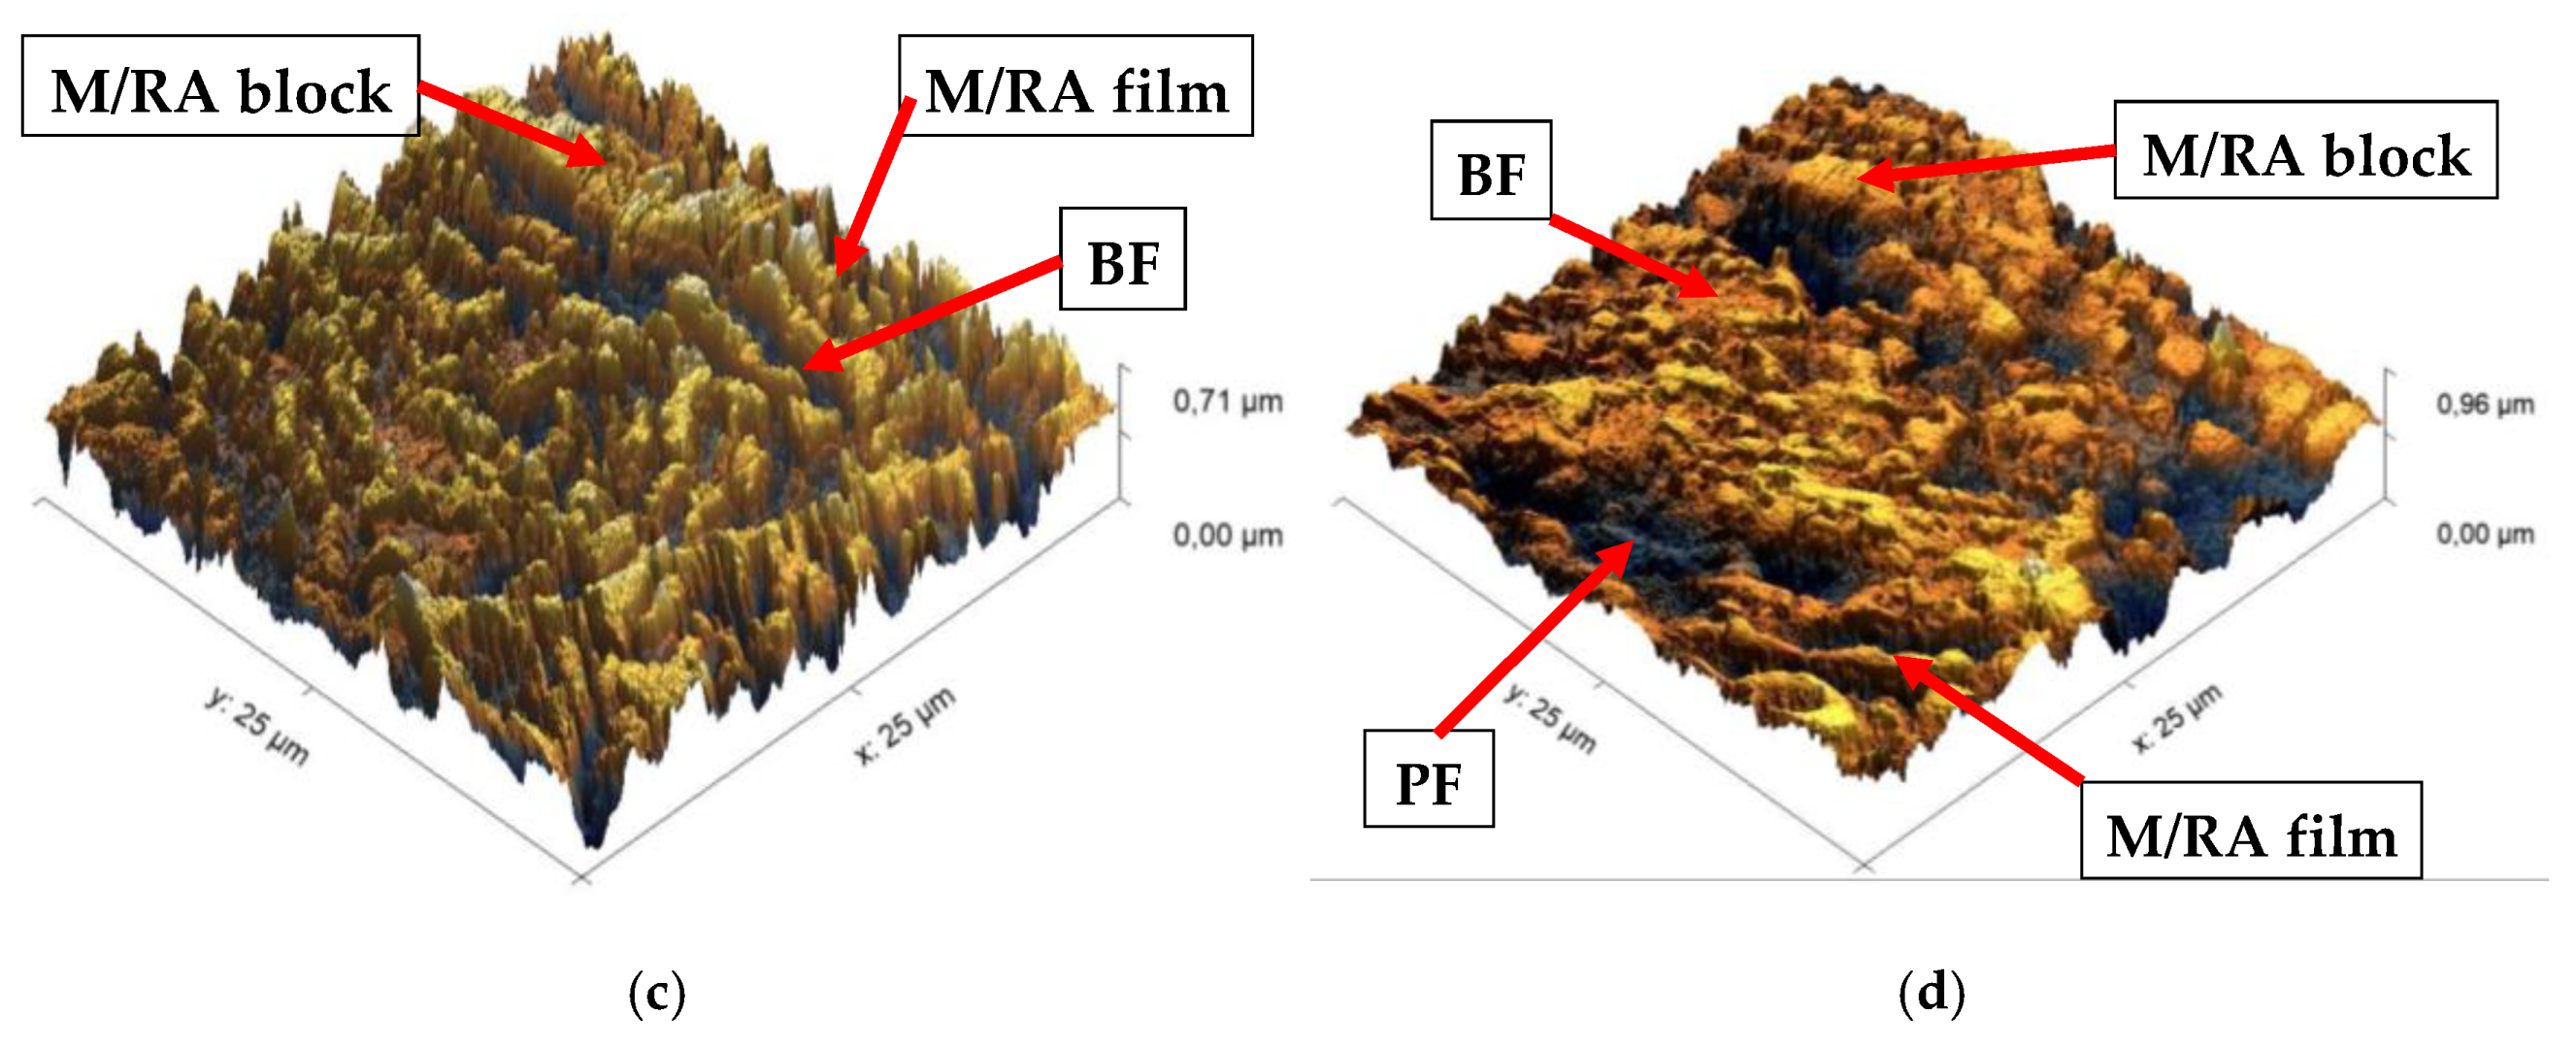
The metallographic analysis of the heat treated samples is shown in Figure 2. In steel A, Figure 2(a), islands of a white phase corresponding to polygonal ferrite (PF) and brown islands corresponding to blocks of martensite (M) can be observed. Black lines correspond to grain boundaries between BF (bainitic ferrite). From the 10.4% value of retained austenite (RA), it can be assumed that the retained austenite exists between BF plates and M blocks, forming a characteristic microstructure of TRIP steels, that corresponds to a set formed by BF, M and carbide-free RA. M and RA are close to each other, so the microconstituent is called M/RA. With the help of scanning electron microscopy (SEM) and atomic force microscopy (AFM), see Figure 2(c), it can be concluded that the morphology (block or plates) and its proportion will depend on C content and heat treatment. So, in steel A, it is possible to observe PF, BF and M/RA blocks.
Steel D, Figure 2(b) and 2(d), shows a coarse structure, with PF and BF plus some islands that can be related to M/RA microconstituent. This morphology can be identified as granular bainite (GB), although its formation mechanism it is not clear enough. This steel was annealed at 760°C for 1200 s, which yielded 50% v/v PF and enriched the austenite with 0,5-0,6 wt%C. Then, during isothermal treatment at 400°C, austenite transforms into a lath-like BF structure, which after 1500 s, changes to a granular shape.
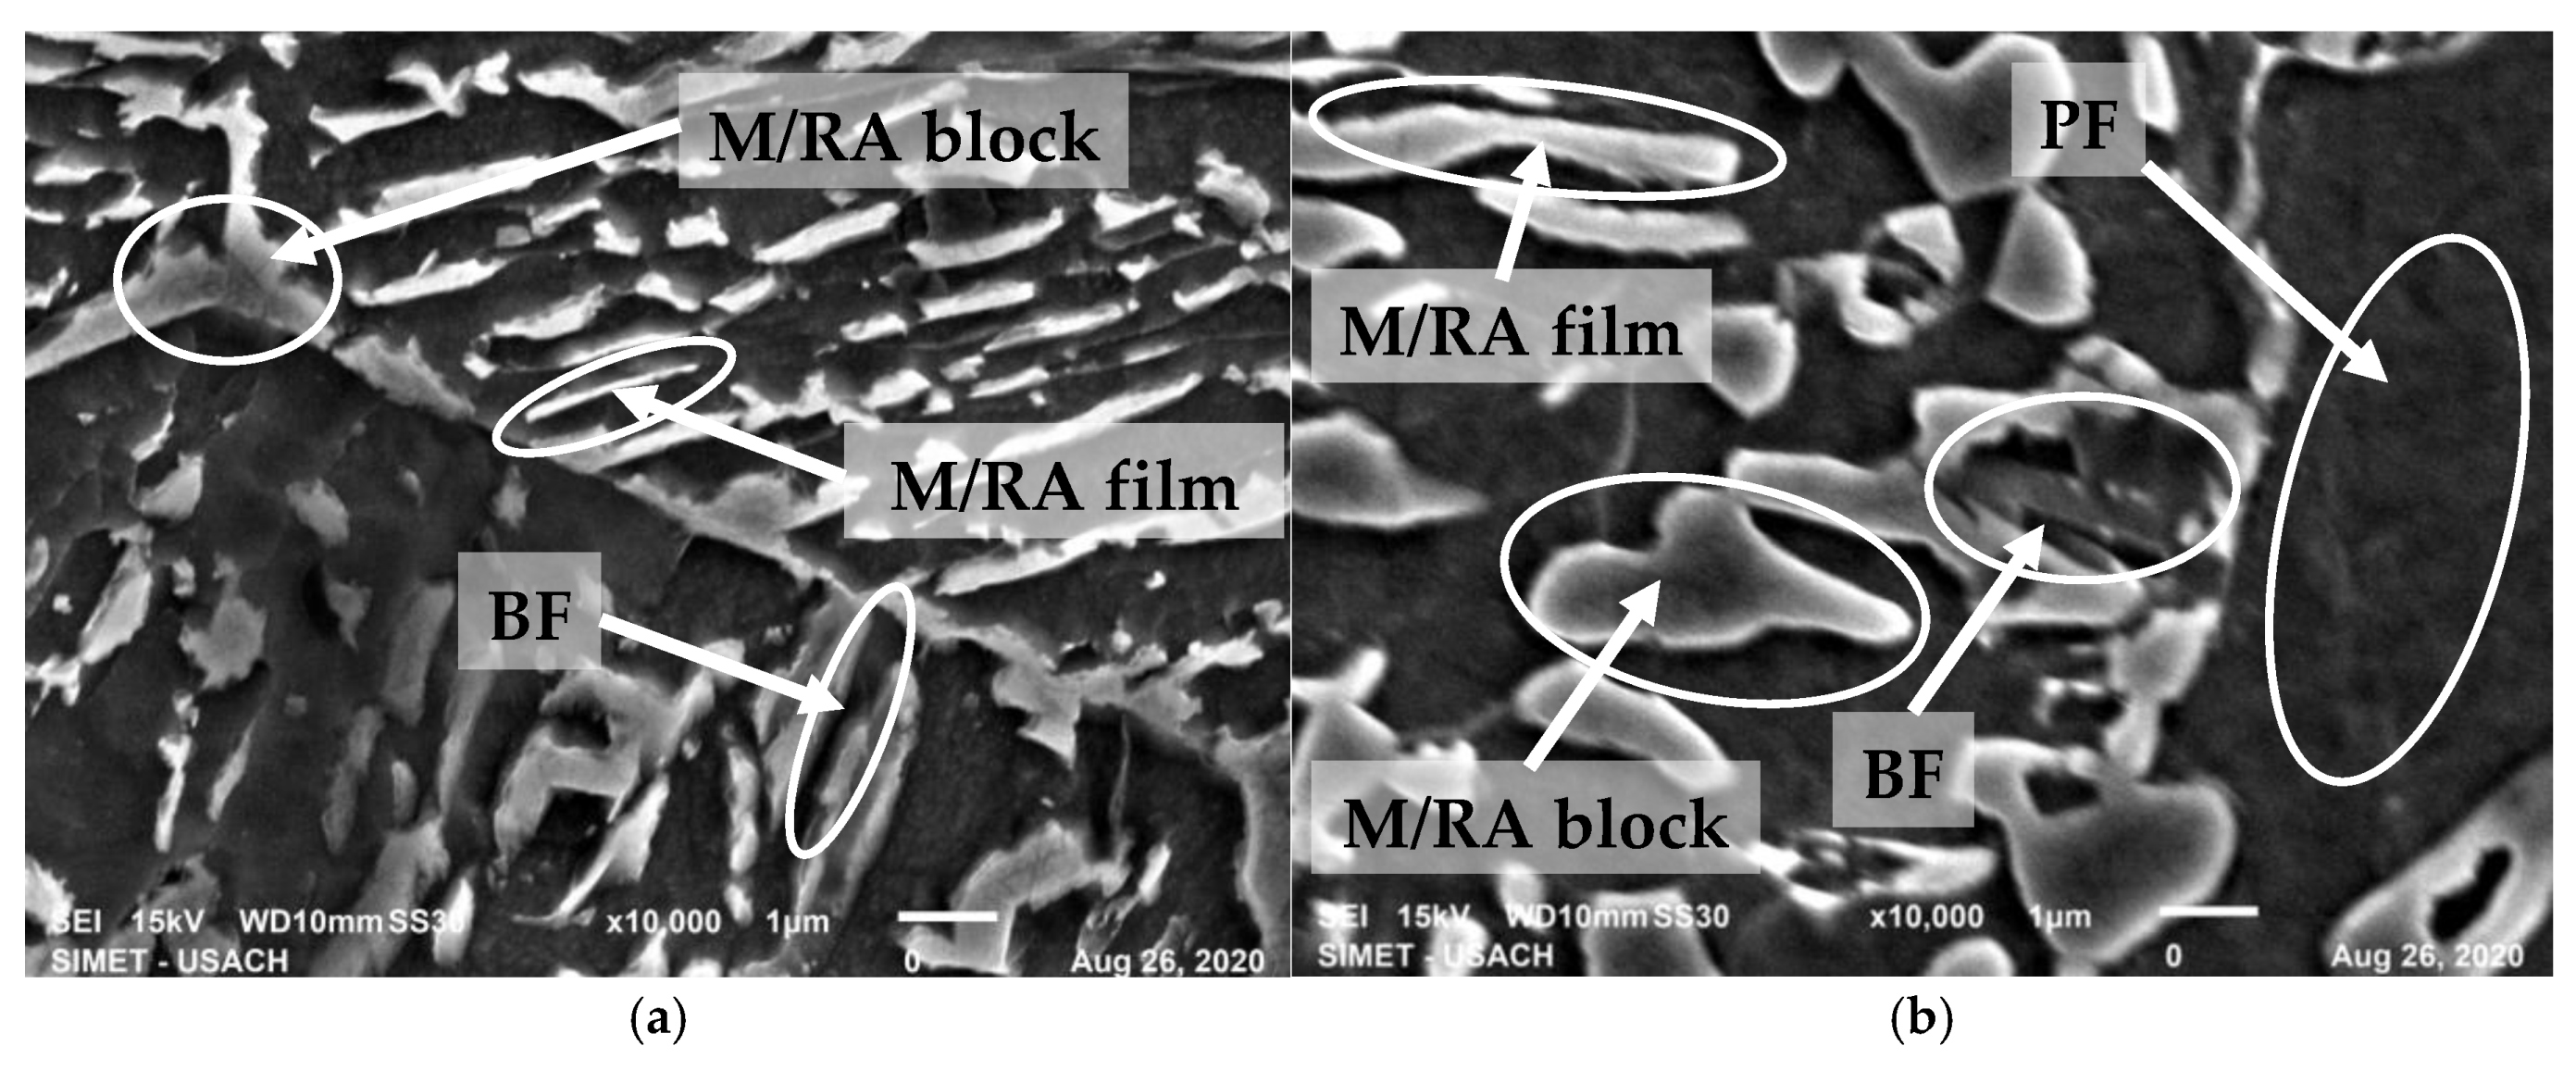
SEM images are shown in Figure 3. Steel A, Figure 3(a), exhibits a plate or lath-like BF matrix with islands of M/RA blocks and PF randomly distributed. The previous austenitic grain boundaries from which BF plates nucleated and grew is clearly observed. Between BF plates, M/RA can be seen primarily as films (M/RA film) and secondarily as M/RA blocks. Steel D, Figure 3(b), is mainly constituted by PF, BF (with granular morphology) and M/RA blocks; some M/RA films can also be observed. These films have brilliant and white borders related to the presence of RA surrounded by irregular BF blocks.
Table 2 shows the volume fraction of each phase, obtained by optical microscopy, scanning electronic microscopy and X-ray diffraction. These values are used in the model explained in the following section in order to model and predict the mechanical properties of each steel.
Tensile properties of both steels were determined following the ASTM E-8 standard [46] and are summarized in Table 3.

3. Model Description

The model considers that these steels have four phases: ferrite, bainite, martensite and retained austenite. Moreover, the following aspects are considered in the model: retained austenite transforms into martensite when the steel is submitted to strain; each phase has a flow law and finally, a mixture law is used between phases. This model was carried out using MATLAB software, version R2023b.
To numerically represent the mechanical behavior of multiphase steel, the model proposed by Bouquerel et al. was used [40]. However, that model does not consider the presence of initial martensite in the steels, so it was modified to consider this phase in the steels. Another modification to the original model was to consider the austenite hardness as intermediate to those of the hard phases (martensite and bainite) and the soft phase (ferrite).

3.1. Retained Austenite to Martensite: Olson and Cohen Model

This model allows the assessment of the fraction of martensite f α that appears when the austenite submitted to a strain ε transforms into martensite:
f α ´ = 1 e x p β O C 1 e x p α O C ε n
α O C , β O C and n are constants. The term α O C depends on the stacking fault energy and β O C is proportional to the probability of intersection of two slip bands. The parameter n depends only on the material; in this case Samek et al. found that n =2 [47].

3.2. Mecking-Kocks Model

This model assesses the increment of dislocations due to phase deformation and can be expressed as:
ρ M ε = 1 b d + k ρ b f ρ
where ρ is the dislocation density, ε , the strain, b , the Burgers vector, M , the Taylor factor and d , the grain size; f and k are parameters of the model.
Given G , the shear modulus, σ 0 , a term related to lattice friction and α , a constant associated to dislocation interactions between themselves, the flow law can be expressed with the following model for each phase as:
σ = σ 0 + α M G b ρ

3.3. Retained Austenite

In the case of retained austenite, the grain size d is not constant, because each crystal of austenite transforms into an aggregate of martensite and austenite, assuming that the volume remains constant. From this, it can be proved that [41]:
d γ ε = d 0 1 f α ' 3
where d γ ε is the grain size of the retained austenite, d 0 is the initial retained austenite grain size and f α ´ is the fraction of martensite transformed from retained austenite. Therefore, in the case of retained austenite, the Mecking-Kocks model must be modified to:
ρ M ε = 1 b 1 d 0 1 f α ' 3 + k ρ f ρ

3.4. Rodriguez-Gutierrez Model for Martensite

In the case of martensite, the flow law can be expressed according to the Rodriguez-Gutierrez model as:
σ = σ 0 + α M G b 1 e x p ( M f ε ) f L

3.5. Mixture Law and Partition Coefficient

Given that multiphasic steels have various phases, a mixture law can be used in order to compute the strength of a two-phase composite material. If A and B are the phases present in a steel, the mechanical strength of the material can be represented as:
σ A B = σ A f A + σ B ( 1 f A )
with σ A and σ B , the strength of phases A and B respectively, and f A , the volume fraction of phase A.
In those cases, with two phases of different mechanical strength, it is assumed that stress and strain are shared between both phases through a partition coefficient defined as:
q = σ B M σ F ε F ε B M
with σ B M and σ F , the strength of the composite material and phase B respectively and ε B M and ε F , the strain of the composite materials and phase B respectively.
Physically, q represents how stress and strain are distributed between hard and soft phases. As this distribution depends on the applied strain and stress, the value of q must be a function of strain. It has been reported that the partition coefficient q starts at relatively high values [48,49],decreasing as the strain increases. So, the following is the function proposed by the authors for this parameter:
q = K e b ε
with K and b , parameters of the material and ε , the plastic strain.

4. Implementation of the Constitutive Model

In the implementation of the model, polygonal ferrite is considered a soft phase, bainitic ferrite and martensite are hard phases and austenite, due to C enrichment, is considered to have an intermediate hardness.
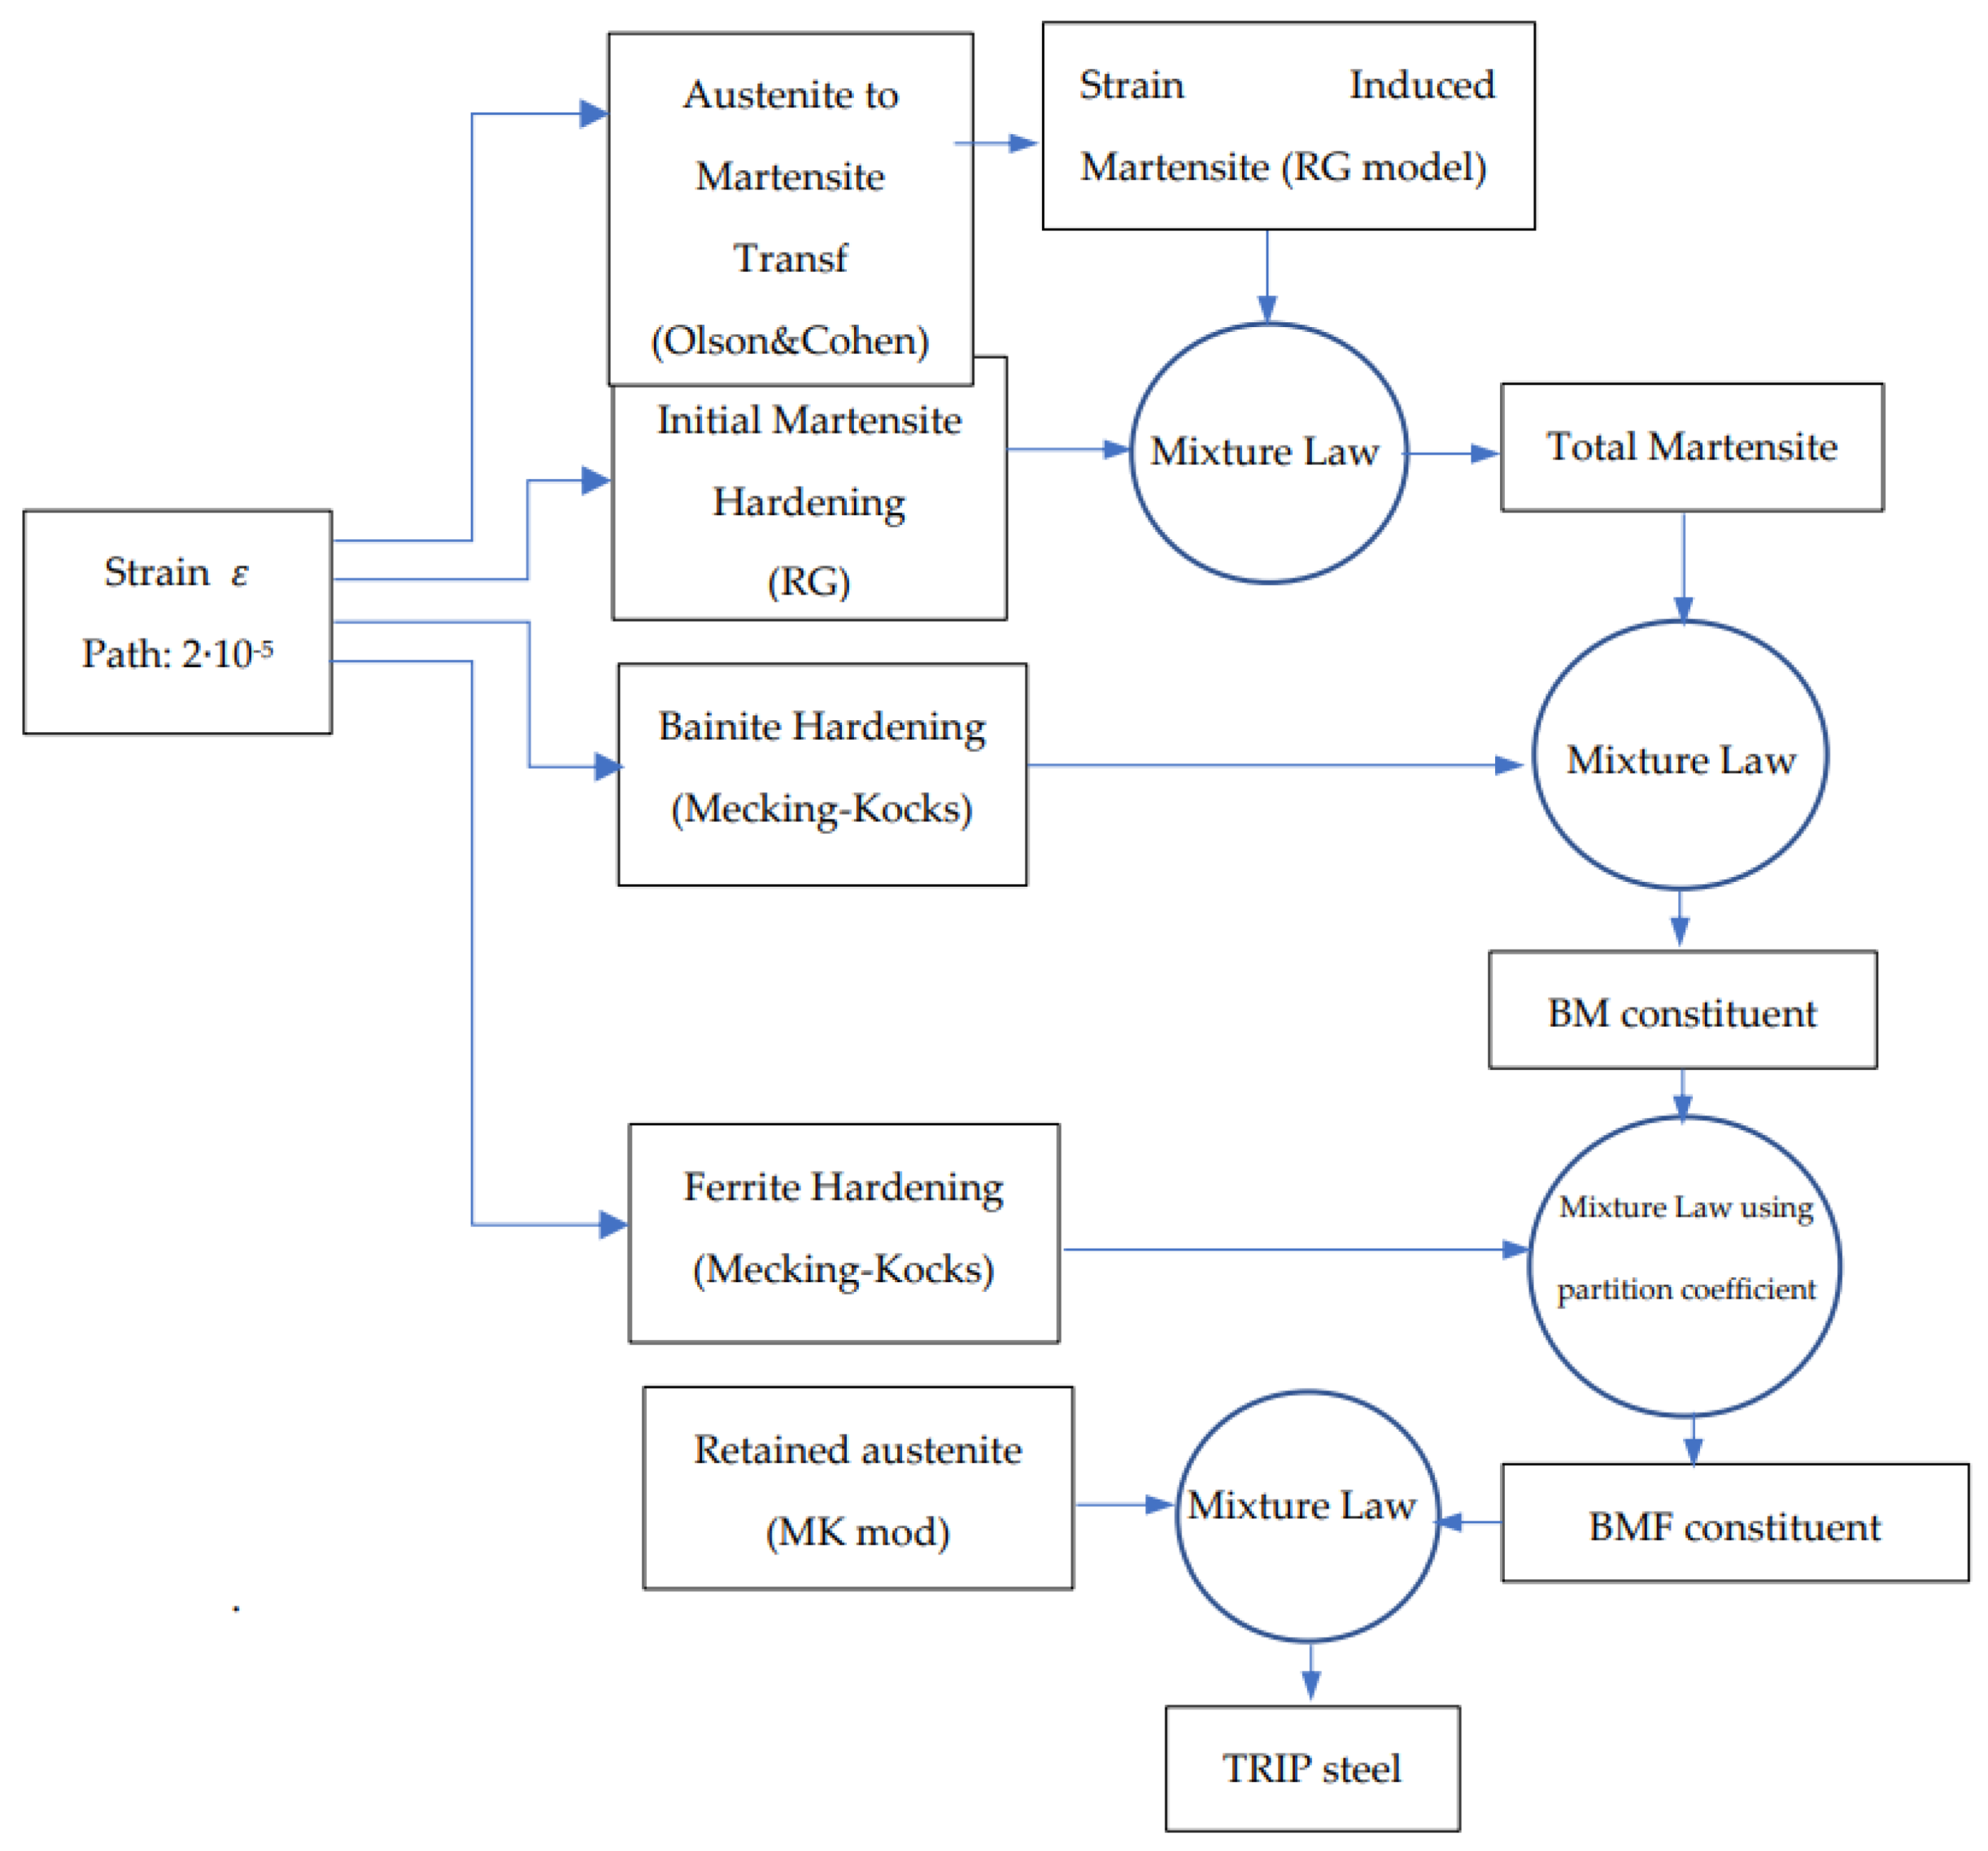
As Figure 4 shows, the model is carried out by means of the following paths:
(a)
The starting parameter is the plastic strain ε . The model assumes an increment of 2 · 10 5 in this parameter.
(b)
From the incremental value assumed in (a), the model computes:
b.1) The fraction of martensite that appears from the strain-induced transformation of austenite, equation 1.
b.2) The strain hardening of ferrite, bainite and retained austenite using the Mecking-Kocks model described in equations 2 (for ferrite and bainite) and 5 (for austenite).
b.3) The strain hardening of martensite by means of equation 6.
(c)
The total martensite strength is computed by means of a mixture law between initial and strain-induced martensite.
(d)
A mixture law combines the total martensite strength and the bainite strength, obtaining the mechanical strength of the BM (bainite-martensite) constituent.
(e)
The ferrite and BM component are combined using a mixture law in order to obtain the BMF (bainite-martensite-ferrite) strength.
(f)
Finally, the retained austenite and BMF component are combined through a mixture law, obtaining the mechanical strength of the TRIP steel.

4.1. Parameters Used in the Model

Due to the differences in austenite stability, values of α O C and β O C in equation (1) are different for each steel. Table 4 shows the values of these parameters for each steel.
An initial dislocation density ρ 0 was assumed for each of the present phases. Dislocation density is higher in austenite than in ferrite and bainite. Initial yield stress σ 0 was obtained for ferrite by means of a tensile test, and for bainite, austenite and martensite, from references. Parameters α and M are the same for each phase, 0.55 and 3 respectively. Table 5 shows the values of the parameters used in this work, including the references.
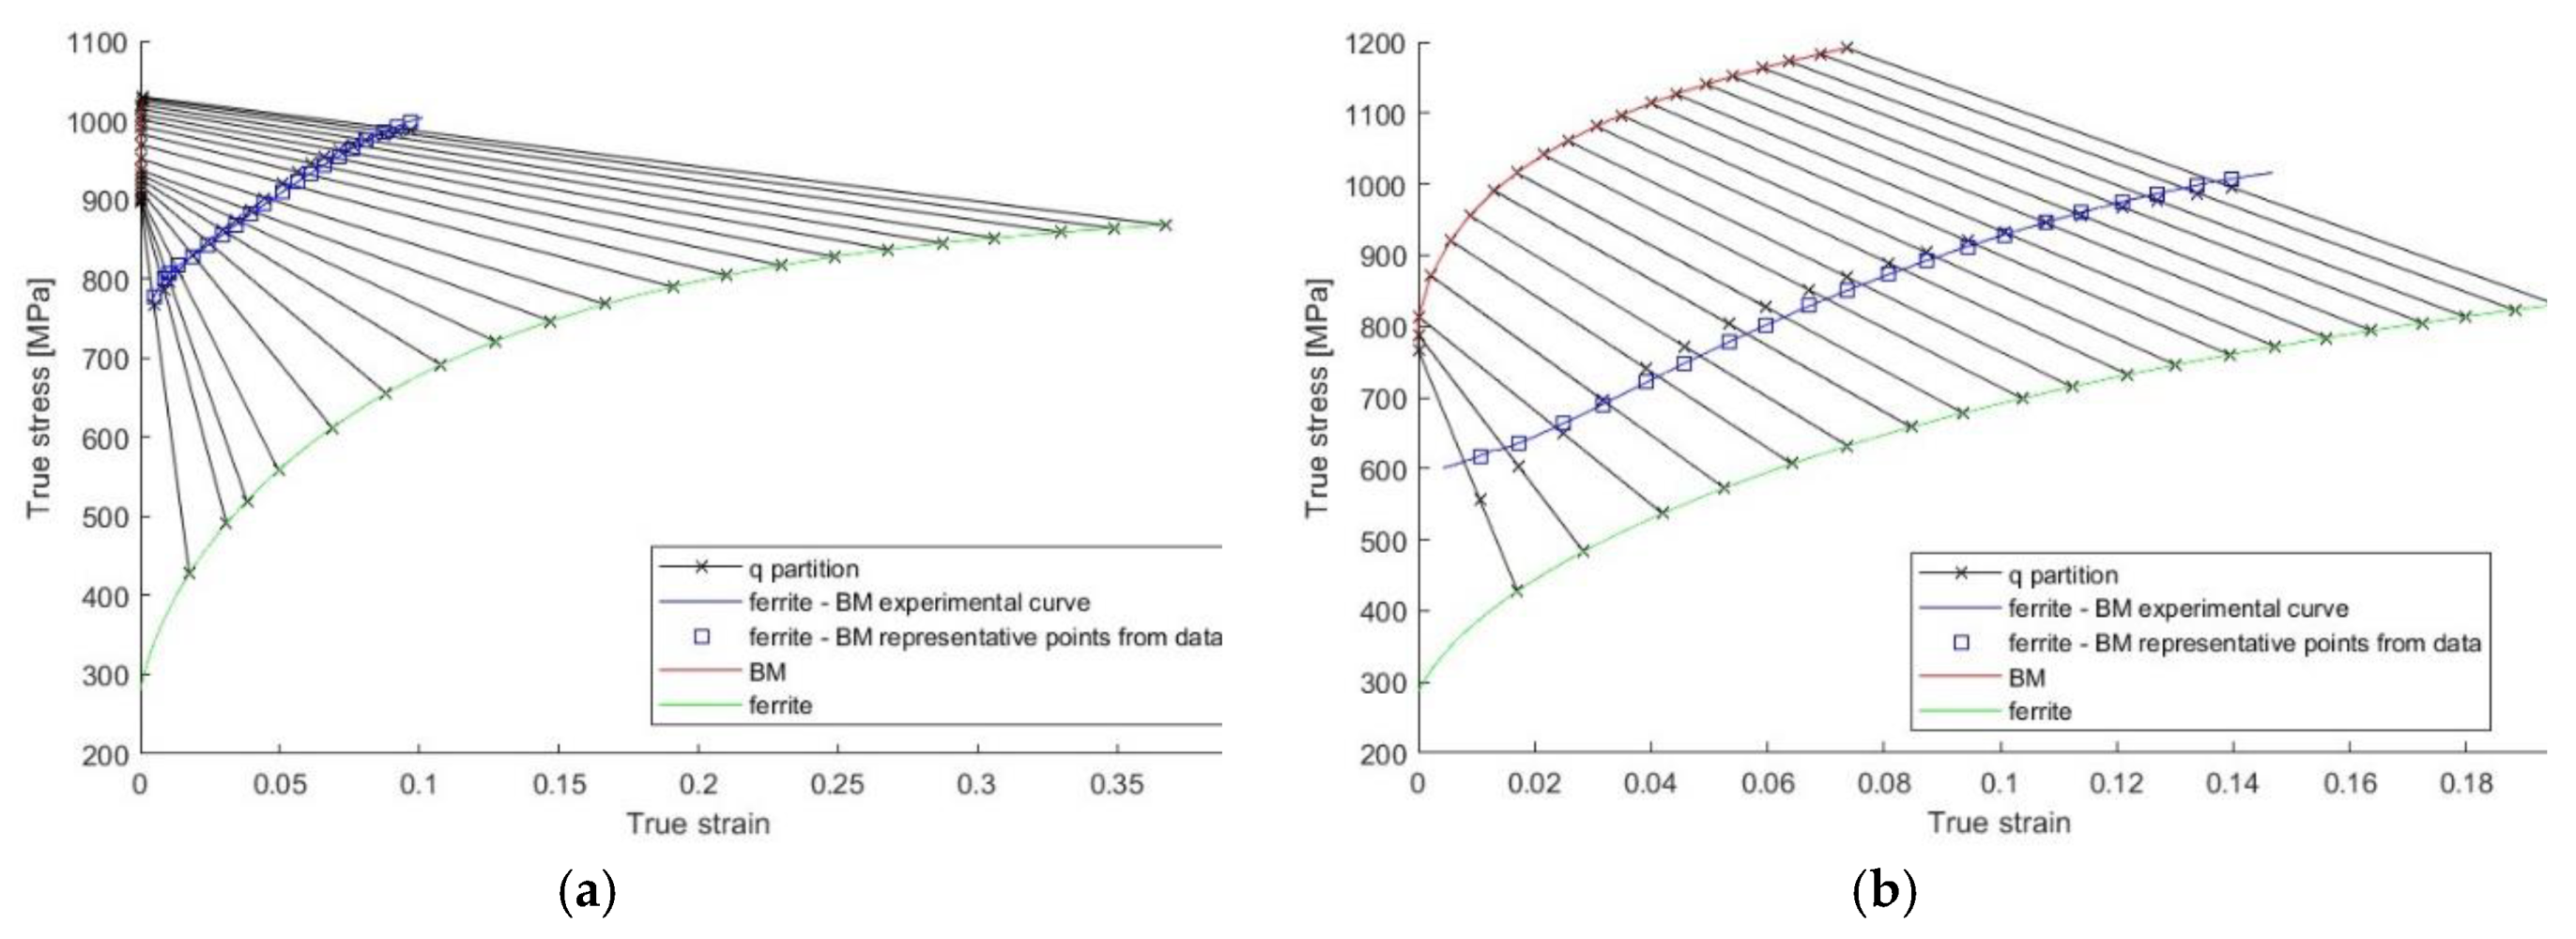
In Figure 5, the hardening curve of ferrite (green curve) and that of the BM mixture (red curve) are depicted. The ferrite curve was obtained by applying the Mecking-Kocks model (eq.2), while the BM curve was derived through the application of both the Mecking-Kocks and Rodriguez-Gutierrez (eq. 6) models, along with the simple mixing law. However, in order to proceed with the calibration of the partition coefficient ( q ), the experimental stress-strain curve was considered without the contribution of austenite. This is because the partition coefficient only applies within the BM-ferrite mixture. Austenite is considered here as a constituent with moderate hardness. The diagram shown in Figure 4 indicates that the partitioning effect of the q coefficient applies to the BM-ferrite mixture, as previously discussed. For this reason, the original experimental stress vs. strain curve needed to be adjusted by subtracting the effect of austenite. This adjustment was achieved through a simple mixing law (eq. 7), resulting in the blue curve of Figure 5, so, this curve represents the stress-strain. The black lines (with a negative slope) represent the results of the estimation of partitioning between the BM constituent and ferrite relationship, as will be explained in the next paragraph.
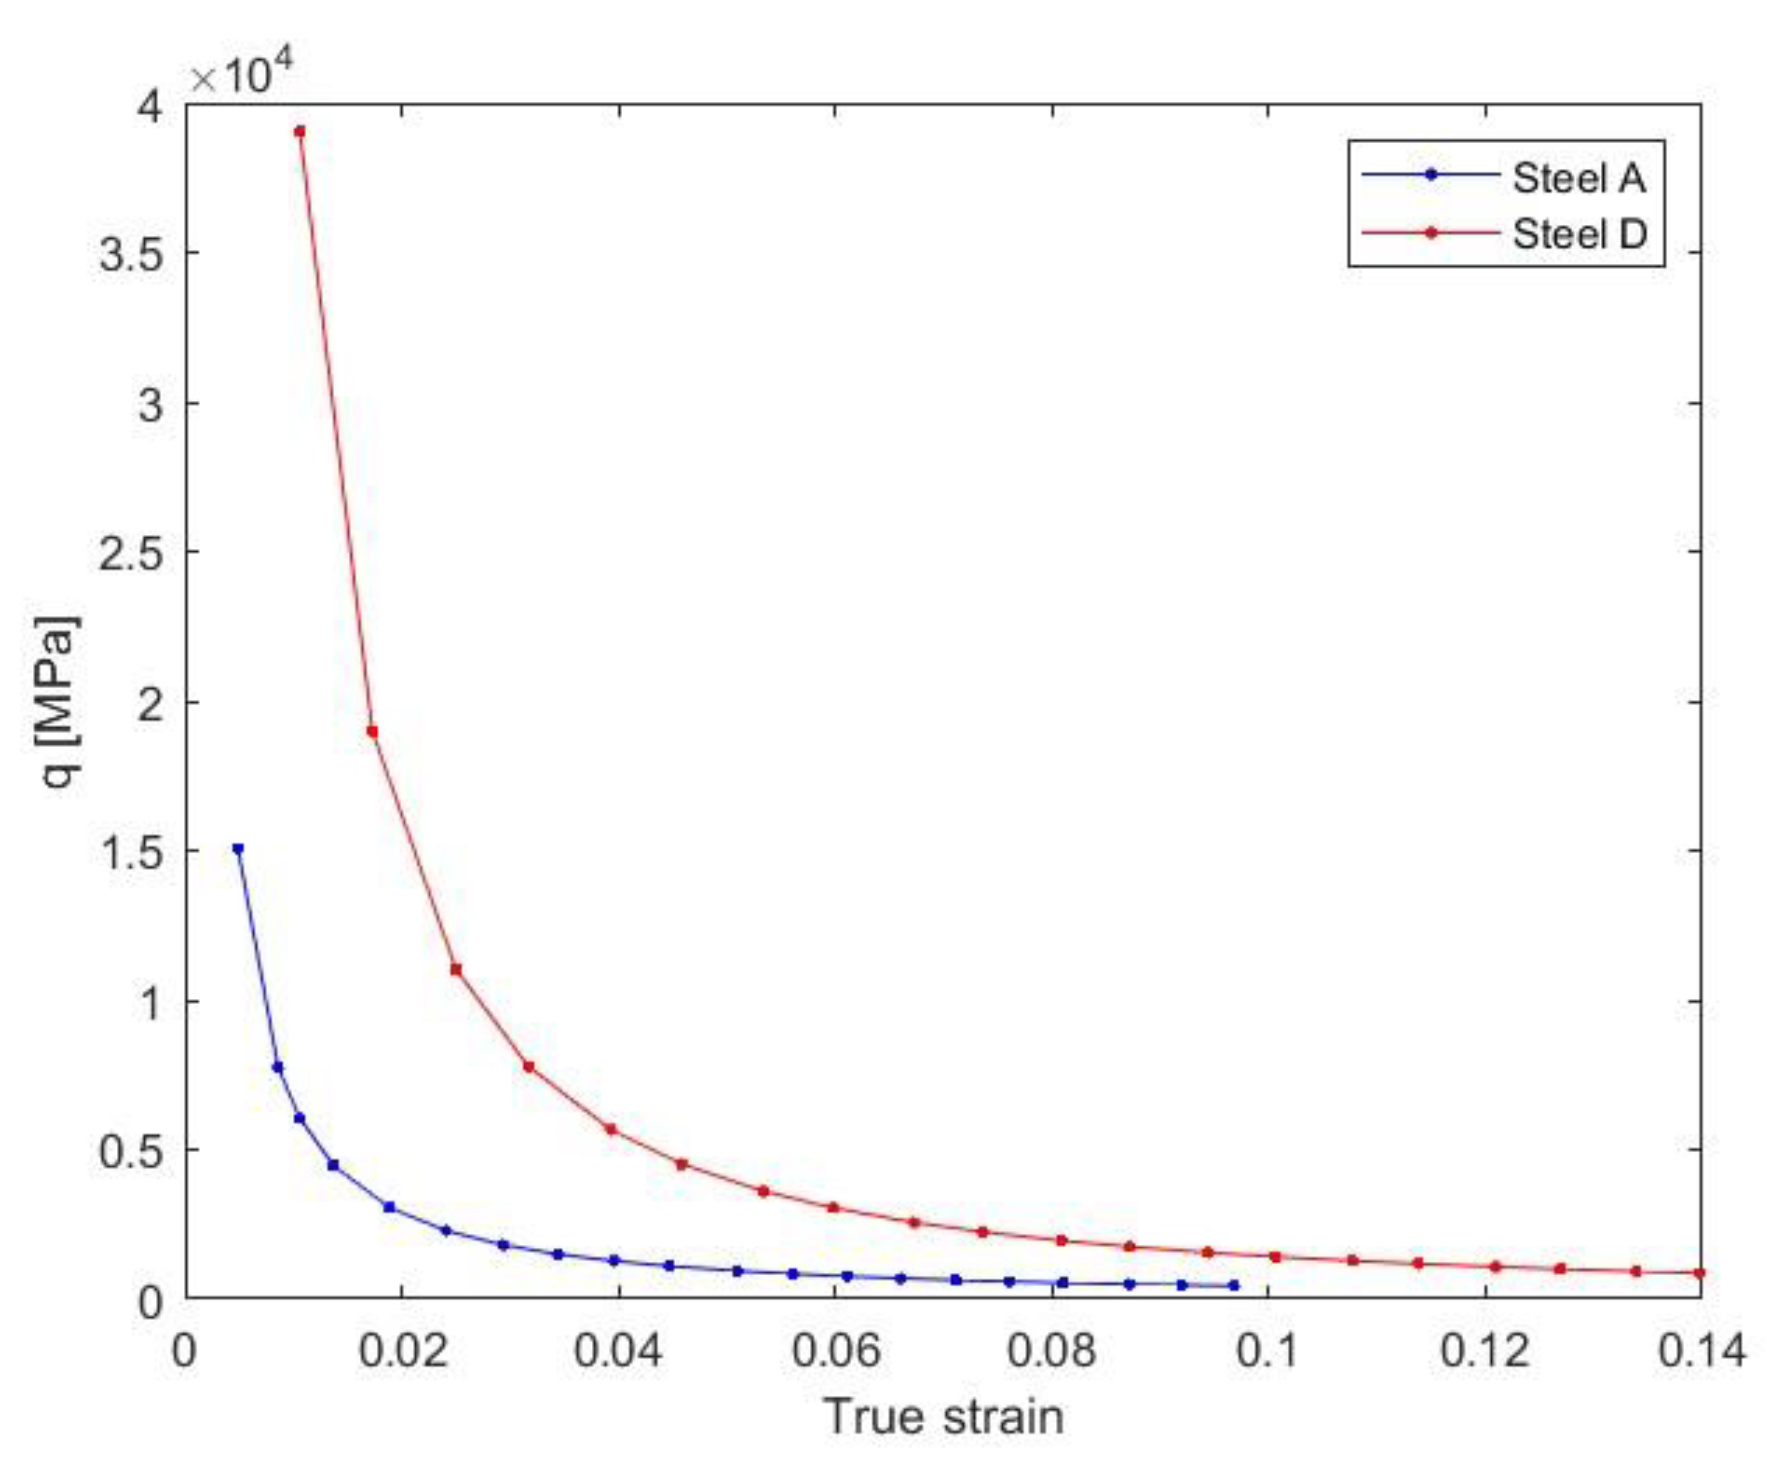
For each curve of Figure 5, twenty representative points of the stress-strain curve are determined, covering the entire curve. For each point, slopes are drawn passing through three points: one on the red curve (BM), another on the green curve (ferrite) and one passing through the chosen representative point on the blue curve. The stress value is obtained according to equation 7, knowing the stress values for each phase (ferrite and BM) and their volumetric fractions. The combination that minimizes the difference between the calculated and experimental stresses is selected for each point, determining a value for q . Subsequently, q is plotted as a function of strain, resulting in an expression described in eq. 9 and shown in Figure 6. The values of K and b obtained for each steel are presented in Table 6. Using this relationship, the value of q is obtained for each strain, and the stress-strain curve (without austenite) is reconstructed. Finally, employing a simple mixing rule, the overall stress-strain curves for each steel are obtained and shown in Figure 7.
As mentioned, unlike Figure 5, Figure 7 takes into account the contribution of austenite to represent the behavior of TRIP steel in its entirety. The blue curve represents the experimentally obtained stress-strain curve, and the blue squares correspond to representative points on the experimental curve. The x symbols represent the results of numerical modeling and should be compared with the corresponding blue squares.
Table 7 presents a quantification of the average and maximum differences and percentage errors for steels A and D.
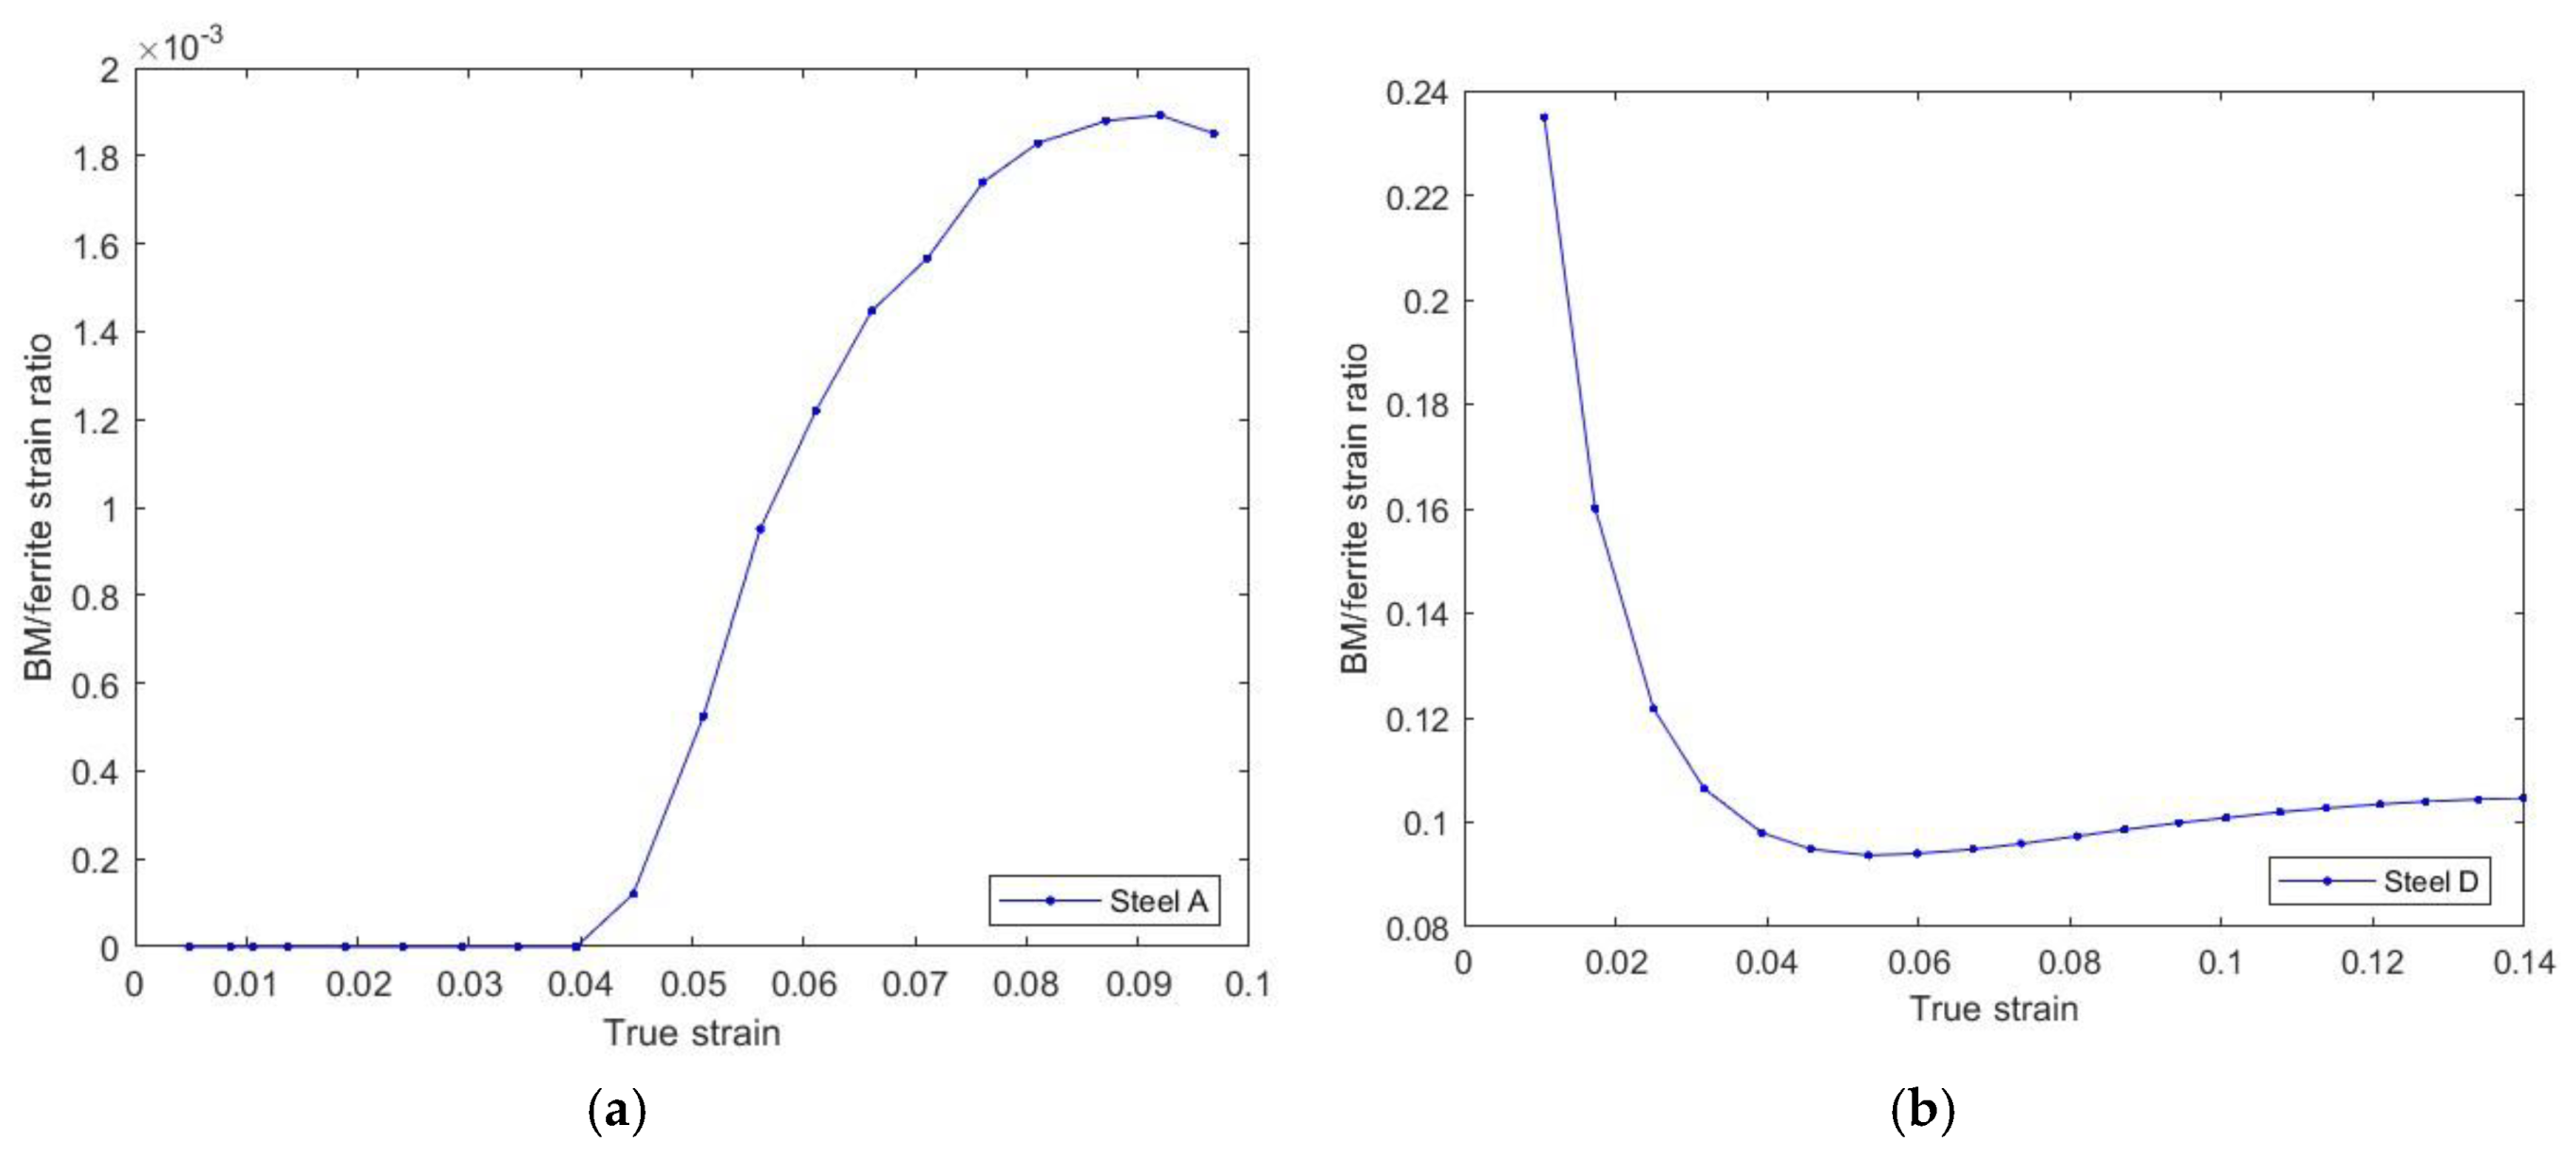
Figure 8 shows the ε B M ε F e r r i t e value against strain. Due to the magnitudes of these values, these curves were displayed on separate graphs. Note that the values for steel D are significantly higher than those for steel A (two orders of magnitude).

5. Discussion

One of the most relevant objectives of the model is to be able to represent the stress-strain partitioning between the hard microconstituents (bainite and martensite, called BM) and the soft one (ferrite), which is reflected in the coefficient q .
Figure 5 illustrates that the model fits the experimental data for both steels. The most notable difference is observed in the initial stages of deformation in the case of steel D (Figure 5-b).
As the primary objective of the proposed model is to simulate and represent the true stress-strain curve of multiphase steels with TRIP behavior, Figure 7 presents the final results of the numerical model outlined in Figure 4, including austenite, and compares it with the corresponding experimental curves. Table 7 indicates that, for both steels, the modeling gives good results. For steel A, the maximum error was 1.6%, while for steel D, the maximum error was 8.5%. Given the complexity of the model and the multitude of factors involved, the errors fall within an acceptable range. Steel D exhibited the highest error; however, upon examining Figure 7-b, it is evident that the biggest discrepancy between experimental and modeled stress values, is related to the lowest deformation data. By excluding the effect of this point, both the maximum and average errors decrease significantly, approaching values similar to those for steel A. It is expected that the largest error tends to concentrate in the early stages of deformation. This is because the model describes a plastic behavior; however, in the initial stages, the behavior can have significant elastic components, especially due to the hard constituent. This implies that overall plasticity may be associated with the elasticity of the hard phase and plasticity of the soft phase.
In relation to the partition coefficient, it should be expected that at low total strain values, both the hard and soft microconstituents experience low deformation. Therefore, the difference in the denominator of Equation 8 is small, resulting in high q values as Figure 6 shows. As deformation increases, however, it is the soft phase that predominantly contributes to deformation, not the hard phase. Consequently, the difference in the denominator begins to increase, and the value of q decreases [40,41,49]. However, as the soft phase deforms, it also hardens, and the relative contribution of the hard phase becomes significant in the total deformation. For this reason, at relatively high deformations, the relative contribution of the hard and soft phases tends to remain constant.
Figure 8 depicts the ε B M ε F relationship as a function of deformation for each steel. For steel A, this ratio remains zero until a total plastic deformation of 0.04, indicating that up to this value the plastic deformation of the hard phase is zero, which is consistent with what is observed in Figure 5a. The hard phase in steel A is mainly martensite, so it is expected that in the initial stages the hard microconstituent will undergo only elastic deformation. For total plastic deformations greater than 0.04, the increase in this ratio could be related to the onset of plastic deformation of the hard phase, which increases to a maximum of approximately 1.9x10⁻³ before subsequently decreasing. This decrease may be associated with the increased contribution of plastic deformation from the soft phase (ferrite).
For steel D, the value of ε B M ε F starts at relatively high values, yet always less than 1. This indicates that, at the onset of deformation, the hard phase is already undergoing plastic deformation. In steel D, the primary hard microconstituent is mainly bainite, which can contribute to deformation from early stages. As the total plastic deformation increases, the contribution of plastic deformation from ferrite becomes more significant, causing the ratio to decrease. The ratio slightly increases beyond 0.06, which might be associated with the increase in ferrite hardness due to deformation or the TRIP effect of retained austenite. It should be noted that for steel D, the deformation of the hard phase is significant, as seen in Figure 5, reaching nearly 0.08 (8%).
The model proposed in this current work has already been addressed in a previous study [41]. Among the main strengths of the model is its ability to help explain the mechanical behavior of steels with complex microstructures based on their microstructural characteristics: the proportion of present phases, grain size, austenite stability, properties of each phase, hardening laws, mixing laws and partition coefficient.
In the present study, the model was applied to two significantly different TRIP steels: steel A, which contained a considerable fraction of martensite, and steel D, in which the hard microconstituent was primarily composed of bainite. Figure 5 and Figure 7 demonstrate that the model reasonably describes the stress-strain curve for each steel, depending on the nature of the dominant microconstituent in the hard phase. These results highlight the versatility of the proposed model, contributing to a better phenomenological understanding of the mechanical behavior of steels with complex microstructures.
The developed and applied model, inspired by the work of Bouquerel [40], differs from it in three main aspects: (i) the initial martensite was not considered in Bouquerel´s model; (ii) austenite is considered as a constituent of intermediate hardness (Bouquerel considers it a phase of high hardness); (iii) Bouquerel did not consider that the coefficients k and f (Mecking-Kocks) in ferrite could be adjustable. The authors propose this variant because, due to the TRIP effect, the additional hardening is transferred to ferrite. For this reason, the constants k and f , associated with the evolution of dislocations, should also be influenced by the stability of austenite.

6. Conclusions

A phenomenological model for the prediction of the stress-strain curve of two TRIP steels with the same composition but different heat treatment was studied. Different phenomenological features were considered to develop the model as well as the multiphasic characteristic of the steel, the austenite to martensite transformation kinetics, the strain hardening law, the mixing law and partition coefficient among others. The following are the most relevant conclusions:
  • The model used includes constitutive equations that represent the different phenomena that appear during the deformation process. These equations have calibration parameters and constants whose values are intrinsic to each phase.
  • In both cases, the agreement between experimental and modeling data were satisfactory. The relative errors in the stress for steels TBF (TRIP Bainitic Ferrite) and TPF (TRIP Polygonal Ferrite) were 0.8 and 1.6% respectively.
  • The model based on partition coefficient shows a great adaptability because it accurately describes the behavior of both steels, taking into account the differences in their characteristics, especially the main hard microconstituents, that is martensite and bainite.
  • Three modifications of the original Bouquerel´s model were included in this work: (a) the presence of initial martensite, not considered in the original model; (b) the assumption that austenite is a microconstituent with moderate hardness, whereas Bouquerel considered it a hard phase; (c) the constants k and f , both related to strain hardening, are affected by TRIP effect. These are the most important novelties of this work.

Author Contributions

Conceptualization, Álvaro Salinas and Alberto Monsalve; Data curation, Paulina Álvarez and Enzo Tesser; Formal analysis, Álvaro Salinas, Paulina Álvarez, Diego Celentano and Alberto Monsalve; Funding acquisition, Alberto Monsalve; Investigation, Enzo Tesser and Alberto Monsalve; Methodology, Álvaro Salinas, Paulina Álvarez and Alberto Monsalve; Project administration, Alberto Monsalve; Resources, Alfredo Artigas and Alberto Monsalve; Software, Álvaro Salinas and Paulina Álvarez; Supervision, Alberto Monsalve; Validation, Álvaro Salinas and Paulina Álvarez; Visualization, Álvaro Salinas, Linton Carvajal and Alberto Monsalve; Writing – original draft, Álvaro Salinas and Alberto Monsalve; Writing – review & editing, Álvaro Salinas, Linton Carvajal and Alberto Monsalve

Funding

This research was funded by DICYT USACH, grant number 052014MG.

Data Availability Statement

We encourage all authors of articles published in MDPI journals to share their research data. In this section, please provide details regarding where data supporting reported results can be found, including links to publicly archived datasets analyzed or generated during the study. Where no new data were created, or where data is unavailable due to privacy or ethical restrictions, a statement is still required. Suggested Data Availability Statements are available in section “MDPI Research Data Policies” at https://www.mdpi.com/ethics.

Acknowledgments

Alberto Monsalve gratefully acknowledges the support of DICYT USACH, Grant 052014MG and SIMET USACH laboratory. Enzo Tesser would like to thank to “Programs, research and Development Directorate, Chilean Navy”.

Conflicts of Interest

The authors declare no conflict of interest.

References

  1. Bouaziz, O.; Zurob, H.; Huang, M. Driving Force and Logic of Development of Advanced High Strength Steels for Automotive Applications. Steel Res. Int. 2013, 84, 937–947. [Google Scholar] [CrossRef]
  2. De Cooman, B. Structure–properties relationship in TRIP steels containing carbide-free bainite. Curr. Opin. Solid State Mater. Sci. 2004, 8, 285–303. [Google Scholar] [CrossRef]
  3. Jacques, P.; Furnémont, Q.; Lani, F.; Pardoen, T.; Delannay, F. Multiscale mechanics of TRIP-assisted multiphase steels: I. Characterization and mechanical testing. Acta Mater. 2007, 55, 3681–3693. [Google Scholar] [CrossRef]
  4. De Meyer, M.; Vanderschueren, D.; De Cooman, B.C. The Influence of the Substitution of Si by Al on the Properties of Cold Rolled C-Mn-Si TRIP Steels. ISIJ Int. 1999, 39, 813–822. [Google Scholar] [CrossRef]
  5. Airod, A.; Petrov, R.; Colás, R.; Houbaert, Y. Analysis of the Trip Effect by Means of Axisymmetric Compressive Tests on a Si-Mn Bearing Steel. ISIJ Int. 2004, 44, 179–186. [Google Scholar] [CrossRef]
  6. Choi, I.D.; Bruce, D.M.; Kim, S.J.; Lee, C.G.; Park, S.H.; Matlock, D.K.; Speer, J.G. Deformation Behavior of Low Carbon TRIP Sheet Steels at High Strain Rates. ISIJ Int. 2002, 42, 1483–1489. [Google Scholar] [CrossRef]
  7. Dan, W.; Zhang, W.; Li, S.; Lin, Z. A model for strain-induced martensitic transformation of TRIP steel with strain rate. Comput. Mater. Sci. 2007, 40, 101–107. [Google Scholar] [CrossRef]
  8. De Meyer, M.; Mahieu, J.; De Cooman, B.C. Empirical microstructure prediction method for combined intercritical annealing and bainitic transformation of TRIP steel. Mater. Sci. Technol. 2002, 18, 1121–1132. [Google Scholar] [CrossRef]
  9. SugimotoK. -I.; SatoS.-H.; KobayashiJ.; SrivastavaA.K. Effects of Cr and Mo on Mechanical Properties of Hot-Forged Medium Carbon TRIP-Aided Bainitic Ferrite Steels. Metals 2019, 9, 1066. [Google Scholar] [CrossRef]
  10. Turteltaub, S.; Suiker, A. Transformation-induced plasticity in ferrous alloys. J. Mech. Phys. Solids 2005, 53, 1747–1788. [Google Scholar] [CrossRef]
  11. Iwamoto, T. Multiscale computational simulation of deformation behavior of TRIP steel with growth of martensitic particles in unit cell by asymptotic homogenization method. Int. J. Plast. 2004, 20, 841–869. [Google Scholar] [CrossRef]
  12. Iwamoto, T.; Tsuta, T. Computational simulation on deformation behavior of CT specimens of TRIP steel under mode I loading for evaluation of fracture toughness. Int. J. Plast. 2002, 18, 1583–1606. [Google Scholar] [CrossRef]
  13. Serri, J.; Martiny, M.; Ferron, G. Finite element analysis of the effects of martensitic phase transformation in TRIP steel sheet forming. Int. J. Mech. Sci. 2005, 47, 884–901. [Google Scholar] [CrossRef]
  14. Delannay, L.; Jacques, P.; Pardoen, T. Modelling of the plastic flow of trip-aided multiphase steel based on an incremental mean-field approach. Int. J. Solids Struct. 2008, 45, 1825–1843. [Google Scholar] [CrossRef]
  15. Sierra, R.; Nemes, J. Investigation of the mechanical behaviour of multi-phase TRIP steels using finite element methods. Int. J. Mech. Sci. 2008, 50, 649–665. [Google Scholar] [CrossRef]
  16. Kouznetsova, V.; Geers, M. A multi-scale model of martensitic transformation plasticity. Mech. Mater. 2008, 40, 641–657. [Google Scholar] [CrossRef]
  17. Lani, F.; Lani, F.; Furnémont, Q.; Furnémont, Q.; Van Rompaey, T.; Van Rompaey, T.; Delannay, F.; Delannay, F.; Jacques, P.; Jacques, P.; et al. Multiscale mechanics of TRIP-assisted multiphase steels: II. Micromechanical modelling. Acta Mater. 2007, 55, 3695–3705. [Google Scholar] [CrossRef]
  18. Li, S.; Dan, W.; Zhang, W.; Lin, Z. A model for strain-induced martensitic transformation of TRIP steel with pre-strain. Comput. Mater. Sci. 2007, 40, 292–299. [Google Scholar] [CrossRef]
  19. Liu, J.-Y.; Lu, H.; Chen, J.-M.; Jullien, J.-F.; Wu, T. Simulation of mechanical behavior of multiphase TRIP steel taking account of transformation-induced plasticity. Comput. Mater. Sci. 2008, 43, 646–654. [Google Scholar] [CrossRef]
  20. Meftah, S.; Barbe, F.; Taleb, L.; Sidoroff, F. Parametric numerical simulations of TRIP and its interaction with classical plasticity in martensitic transformation. Eur. J. Mech. - A/Solids 2007, 26, 688–700. [Google Scholar] [CrossRef]
  21. Dan, W.; Li, S.; Zhang, W.; Lin, Z. The effect of strain-induced martensitic transformation on mechanical properties of TRIP steel. Mater. Des. 2008, 29, 604–612. [Google Scholar] [CrossRef]
  22. Minote, T.; Torizuka, S.; Ogawa, A.; Niikura, M. Modeling of Transformation Behavior and Compositional Partitioning in TRIP Steel. ISIJ Int. 1996, 36, 201–207. [Google Scholar] [CrossRef]
  23. Valance, S.; Coret, M.; Combescure, A. Strain simulation of steel during a heating-cooling cycle including solid-solid phase change. Eur. J. Mech. - A/Solids 2007, 26, 460–473. [Google Scholar] [CrossRef]
  24. Wolff, M.; Böhm, M.; Dalgic, M.; Hüßler, I. Evaluation of models for TRIP and stress-dependent transformation behaviour for the martensitic transformation of the steel 100Cr6. Comput. Mater. Sci. 2008, 43, 108–114. [Google Scholar] [CrossRef]
  25. Yu, H.Y. Strain-hardening behaviors of TRIP-assisted steels during plastic deformation. Mater. Sci. Eng. A 2008, 479, 333–338. [Google Scholar] [CrossRef]
  26. Papatriantafillou, I.; Agoras, M.; Aravas, N.; Haidemenopoulos, G. Constitutive modeling and finite element methods for TRIP steels. Comput. Methods Appl. Mech. Eng. 2006, 195, 5094–5114. [Google Scholar] [CrossRef]
  27. Shan, T.; Li, S.; Zhang, W.; Xu, Z. Prediction of martensitic transformation and deformation behavior in the TRIP steel sheet forming. Mater. Des. 2008, 29, 1810–1816. [Google Scholar] [CrossRef]
  28. Thibaud, S.; Boudeau, N.; Gelin, J. TRIP steel: Plastic behaviour modelling and influence on functional behaviour. J. Mech. Work. Technol. 2006, 177, 433–438. [Google Scholar] [CrossRef]
  29. Uthaisangsuk, V.; Prahl, U.; Bleck, W. Micromechanical modelling of damage behaviour of multiphase steels. Comput. Mater. Sci. 2007, 43, 27–35. [Google Scholar] [CrossRef]
  30. Benzing, J.; Liu, Y.; Zhang, X.; Luecke, W.; Ponge, D.; Dutta, A.; Oskay, C.; Raabe, D.; Wittig, J. Experimental and numerical study of mechanical properties of multi-phase medium-Mn TWIP-TRIP steel: Influences of strain rate and phase constituents. Acta Mater. 2019, 177, 250–265. [Google Scholar] [CrossRef]
  31. Jung, J.; Hur, Y.C.; Jun, S.; Lee, H.-S.; Kim, B.-M.; Kim, J.H. Constitutive Modeling of Asymmetric Hardening Behavior of Transformation-Induced Plasticity Steels. Int. J. Automot. Technol. 2019, 20, 19–30. [Google Scholar] [CrossRef]
  32. Mulidrán, P.; Spišák, E.; Tomáš, M.; Majerníková, J.; Varga, J. The effect of material models in the fem simulation on the springback prediction of the trip steel. Acta Met. Slovaca 2021, 27, 103–108. [Google Scholar] [CrossRef]
  33. Polatidis, E.; Haidemenopoulos, G.; Krizan, D.; Aravas, N.; Panzner, T.; Šmíd, M.; Papadioti, I.; Casati, N.; Van Petegem, S.; Van Swygenhoven, H. The effect of stress triaxiality on the phase transformation in transformation induced plasticity steels: Experimental investigation and modelling the transformation kinetics. Mater. Sci. Eng. A 2020, 800, 140321. [Google Scholar] [CrossRef]
  34. Prüger, S.; Gandhi, A.; Balzani, D. Influence of microstructure morphology on multi-scale modeling of low-alloyed TRIP-steels. Eng. Comput. 2018, 35, 499–528. [Google Scholar] [CrossRef]
  35. Seupel, A.; Kuna, M. Phenomenological modeling of thermomechanical coupling effects of highly alloyed TRIP-steels at different stress states. Procedia Struct. Integr. 2022, 35, 10–17. [Google Scholar] [CrossRef]
  36. Tzini, M.-I.T.; Aristeidakis, J.S.; Christodoulou, P.I.; Kermanidis, A.T.; Haidemenopoulos, G.N.; Krizan, D. Multi-phase field modeling in TRIP steels: Distributed vs. average stability and strain-induced transformation of retained austenite. Mater. Sci. Eng. A 2021, 833, 142341. [Google Scholar] [CrossRef]
  37. Burgold, A.; Droste, M.; Seupel, A.; Budnitzki, M.; Biermann, H.; Kuna, M. Modeling of the cyclic deformation behavior of austenitic TRIP-steels. Int. J. Plast. 2020, 133. [Google Scholar] [CrossRef]
  38. Gui, Y.; An, D.; Han, F.; Lu, X.; Kang, G.; Zhang, X. Multiple-mechanism and microstructure-based crystal plasticity modeling for cyclic shear deformation of TRIP steel. Int. J. Mech. Sci. 2022, 222. [Google Scholar] [CrossRef]
  39. Mu, W.; Rahaman, M.; Rios, F.L.; Odqvist, J.; Hedström, P. Predicting strain-induced martensite in austenitic steels by combining physical modelling and machine learning. Mater. Des. 2020, 197, 109199. [Google Scholar] [CrossRef]
  40. Bouquerel, J.; Verbeken, K.; Decooman, B. Microstructure-based model for the static mechanical behaviour of multiphase steels. Acta Mater. 2006, 54, 1443–1456. [Google Scholar] [CrossRef]
  41. Salinas, Á.; Celentano, D.; Carvajal, L.; Artigas, A.; Monsalve, A. Microstructure-Based Constitutive Modelling of Low-Alloy Multiphase TRIP Steels. Metals 2019, 9, 250. [Google Scholar] [CrossRef]
  42. ASTM E415, “Standard Test Method for Analysis of Carbon and Low-Alloy Steel by Spark Atomic,” in American Society for Testing and Materials, no. April 1999, 2015, pp. 1–9.
  43. ASTM E975, “ASTM E975 Standard Practice for X-Ray Determination of Retained Austenite in Steel with Near Random Crystallographic Orientation,” 2009.
  44. Escobar, J.; Jiménez, J.L.; Artigas, A.; Perez-Ipiña, J.; Monsalve, A. Influence of Cold Deformation on Carbide Precipitation Kinetics in a Fe-22Mn-0.45C TWIP Steel. Materials 2022, 15, 3748. [Google Scholar] [CrossRef] [PubMed]
  45. Tesser, E.; Silva, C.; Artigas, A.; Monsalve, A. Effect of Carbon Content and Intercritical Annealing on Microstructure and Mechanical Tensile Properties in FeCMnSiCr TRIP-Assisted Steels. Metals 2021, 11, 1546. [Google Scholar] [CrossRef]
  46. ASTM E18, “ASTM E8 Standard Test Methods for Tension Testing of Metallic Materials,” 2016.
  47. Samek, L.; De Moor, E.; Penning, J.; De Cooman, B.C. Influence of alloying elements on the kinetics of strain-induced martensitic nucleation in low-alloy, multiphase high-strength steels. Met. Mater. Trans. A 2006, 37, 109–124. [Google Scholar] [CrossRef]
  48. Alvarez, P.; Muñoz, F.; Celentano, D.; Artigas, A.; Cerda, F.M.C.; Ponthot, J.-P.; Monsalve, A. Modeling the Mechanical Response of a Dual-Phase Steel Based on Individual-Phase Tensile Properties. Metals 2020, 10, 1031. [Google Scholar] [CrossRef]
  49. Lian, J.; Jiang, Z.; Liu, J. Theoretical model for the tensile work hardening behaviour of dual-phase steel. Mater. Sci. Eng. A 1991, 147, 55–65. [Google Scholar] [CrossRef]
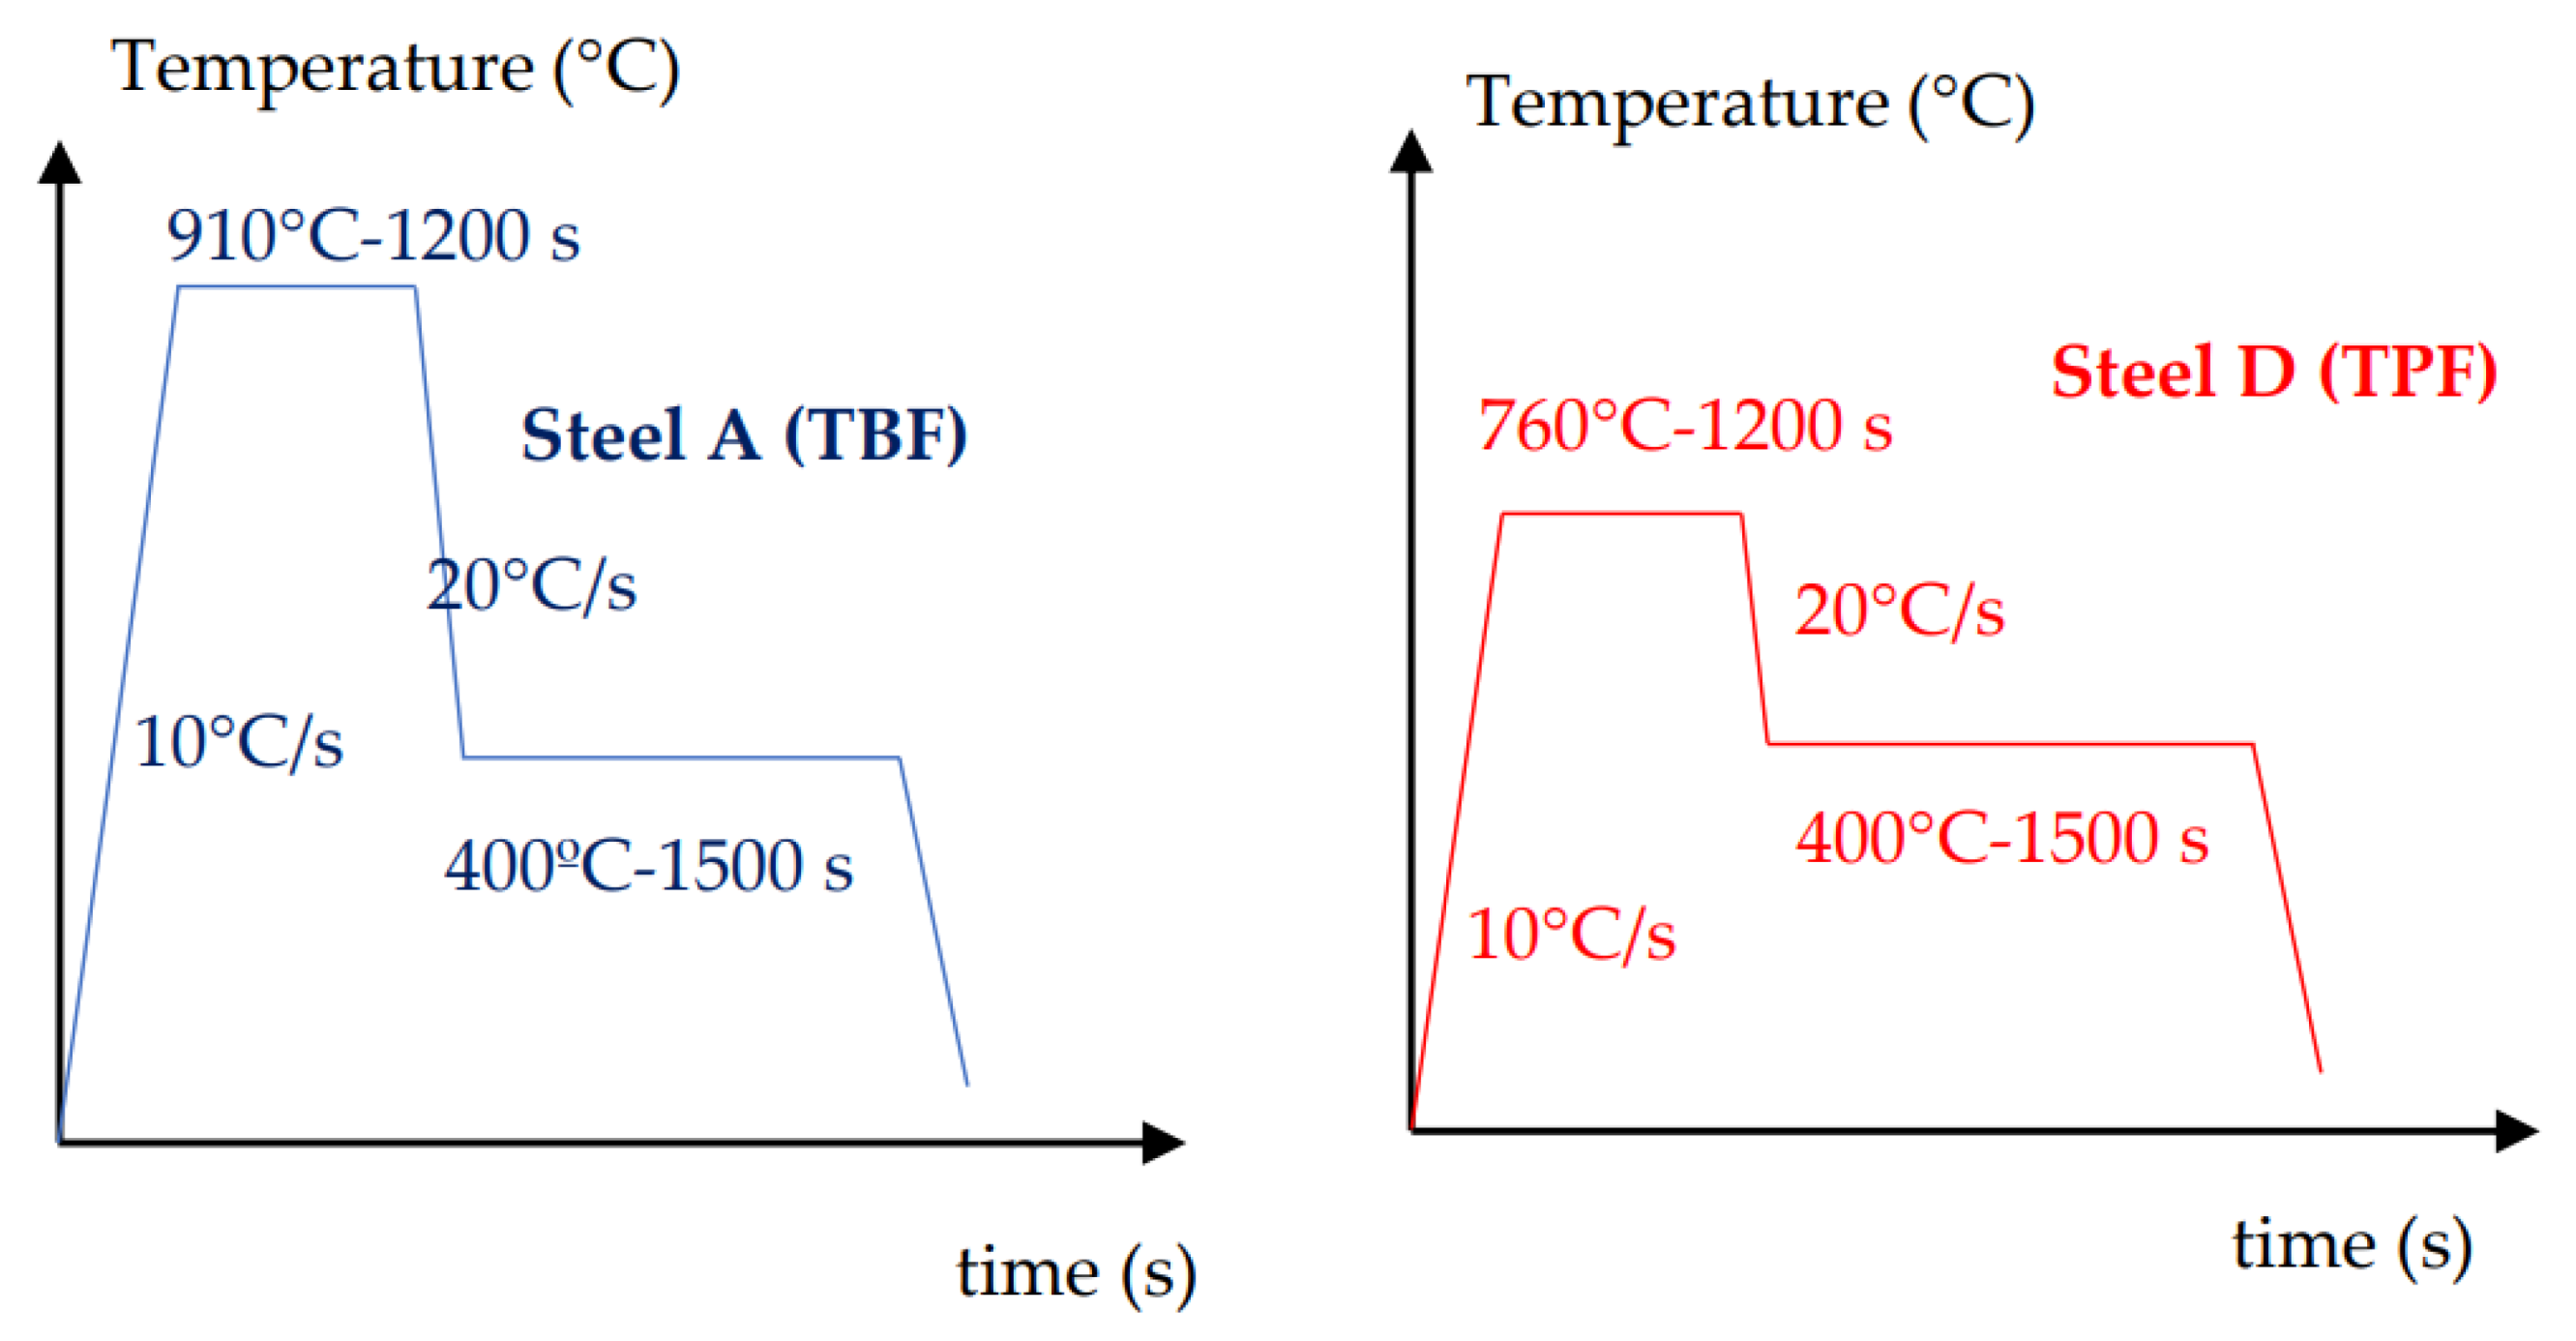
Figure 1. Thermal cycles corresponding to the modelled steels.
Preprints 116656 g001
Figure 2. Optical micrographs 1000X of (a) Steel A and (b) Steel D, both etched with sequencial etching: sodium metabisulfite 10% m/v in distilled water followed by 4% v/v picric acid in ethanol (c) AFM image od steel A; (d) AFM image of steel D.
Preprints 116656 g002aPreprints 116656 g002b
Figure 3. SEM images with secondary electrons, of (a) Steel A and (b) Steel D.
Preprints 116656 g003
Figure 4. Scheme of the phenomenological model used.
Preprints 116656 g004
Figure 5. Experimental and modeled true stress-true strain curves for: (a) Steel A; (b) Steel D.
Preprints 116656 g005
Figure 6. Partition coefficient q for both steels.
Preprints 116656 g006
Figure 7. Plastic stress-strain curves for (a) Steel A and (b) Steel D.
Preprints 116656 g007
Figure 8. Plastic strain ratio between BM constituent and ferrite, against plastic strain. (a) Steel A; (b) Steel D.
Preprints 116656 g008
Table 1. Chemical composition of the studied steel (wt%).
%C %Mn %Si %Cr %Al %Cu %Mo %Ni %P %S %Fe
0.166 1.872 1.534 0.242 0.343 0.0995 0.017 0.050 0.005 0.022 Bal.
Table 2. Volume percentage and grain size (μm) of each phase in Steels A and D.
Phase Steel A
(%)
Steel D
(%)
Grain Size Steel A
(μm)
Grain Size Steel D
(μm)
Polygonal Ferrite (PF) 25.0 52.0 7.2 7.2
Bainitic Ferrite (BF) 33.0 25.0 1.5 2.0
Martensite (M) 31.6 5.1 1.0 2.0
Retained Austenite (RA) 10.4 17.9 0.7 0.7
Transformed Austenite after tension test * 8.1 13.7 - -
Carbon in RA 1.4 1.4 - -
* Referred to the total phases.
Table 3. Mechanical properties of steels A and D.
Steel Yield stress (MPa) UTS (MPa) Total Elongation (%)
A 735 913 18.4
D 560 897 22.3
Table 4. Coefficients α O C , β O C and n for equation 1, and k and f for equation 2.
Steel A Steel D Reference
α O C 24 26 This work
β O C 1 1.5 This work
n 2 2 [47]
k 0.012 0.014 This work
f 3.6 2.8 This work
Table 5. Parameters used in the model.
Constant Units Austenite Ferrite Bainite Martensite Reference
ρ 0 m 2 10 12 3 · 10 12 10 13 - [40]
σ 0 M P a 200 420 [40]
σ 0 M P a 225 1150 This work
α 0.55 0.55 0.55 0.55 [40]
M 3 3 3 3 [40]
G G P a 72 78.5 78.5 78.5 [40]
k 0.01 0.022 - [40]
f 4 5 12.5 [40]
b m 2.58 · 10 10 2.48 · 10 10 2.48 · 10 10 2.48 · 10 10 [40]
Table 6. Values of K and b for each steel.
K (Mpa) b
Steel A 28.04 1.18
Steel D 48.05 1.47
Table 7. Stress differences between experimental and modeled values for each steel.
Maximum Stress Difference Average Stress Difference
(MPa) (%) (Mpa) (%)
Steel A 12.77 1.58 7.40 0.84
Steel D 52.24 8.48 12.48 1.63
Disclaimer/Publisher’s Note: The statements, opinions and data contained in all publications are solely those of the individual author(s) and contributor(s) and not of MDPI and/or the editor(s). MDPI and/or the editor(s) disclaim responsibility for any injury to people or property resulting from any ideas, methods, instructions or products referred to in the content.
Copyright: This open access article is published under a Creative Commons CC BY 4.0 license, which permit the free download, distribution, and reuse, provided that the author and preprint are cited in any reuse.
Prerpints.org logo

Preprints.org is a free preprint server supported by MDPI in Basel, Switzerland.

Subscribe

© 2024 MDPI (Basel, Switzerland) unless otherwise stated