Submitted:
29 August 2024
Posted:
30 August 2024
You are already at the latest version
Abstract
Keywords:
1. Introduction
2. Experimental Procedures
2.1. Materials: Natural Green Inhibitor
2.2. Materials: Alloys and Electrolyte Solution
2.3. Electrochemical Measurements and Inhibitor Efficiency (IE)
2.4. Adsorption Isotherms Determinations
3. Results and Discussion
3.1. Chemical Constituents of D. maritima Bulbs
3.2. Al-Si Alloy Results
3.2.1. Potentiodynamic Polarization Measurement
3.2.2. Electrochemical Impedance Spectroscopy (EIS) Measurements
3.2.3. Adsorption Isotherm and Inhibition Activity Results
3.3. SAE Steel and Commercially Pure Al Sample Results
3.3.1. EIS and Potentiodynamic Polarization (PP) Measurements
4. Conclusions
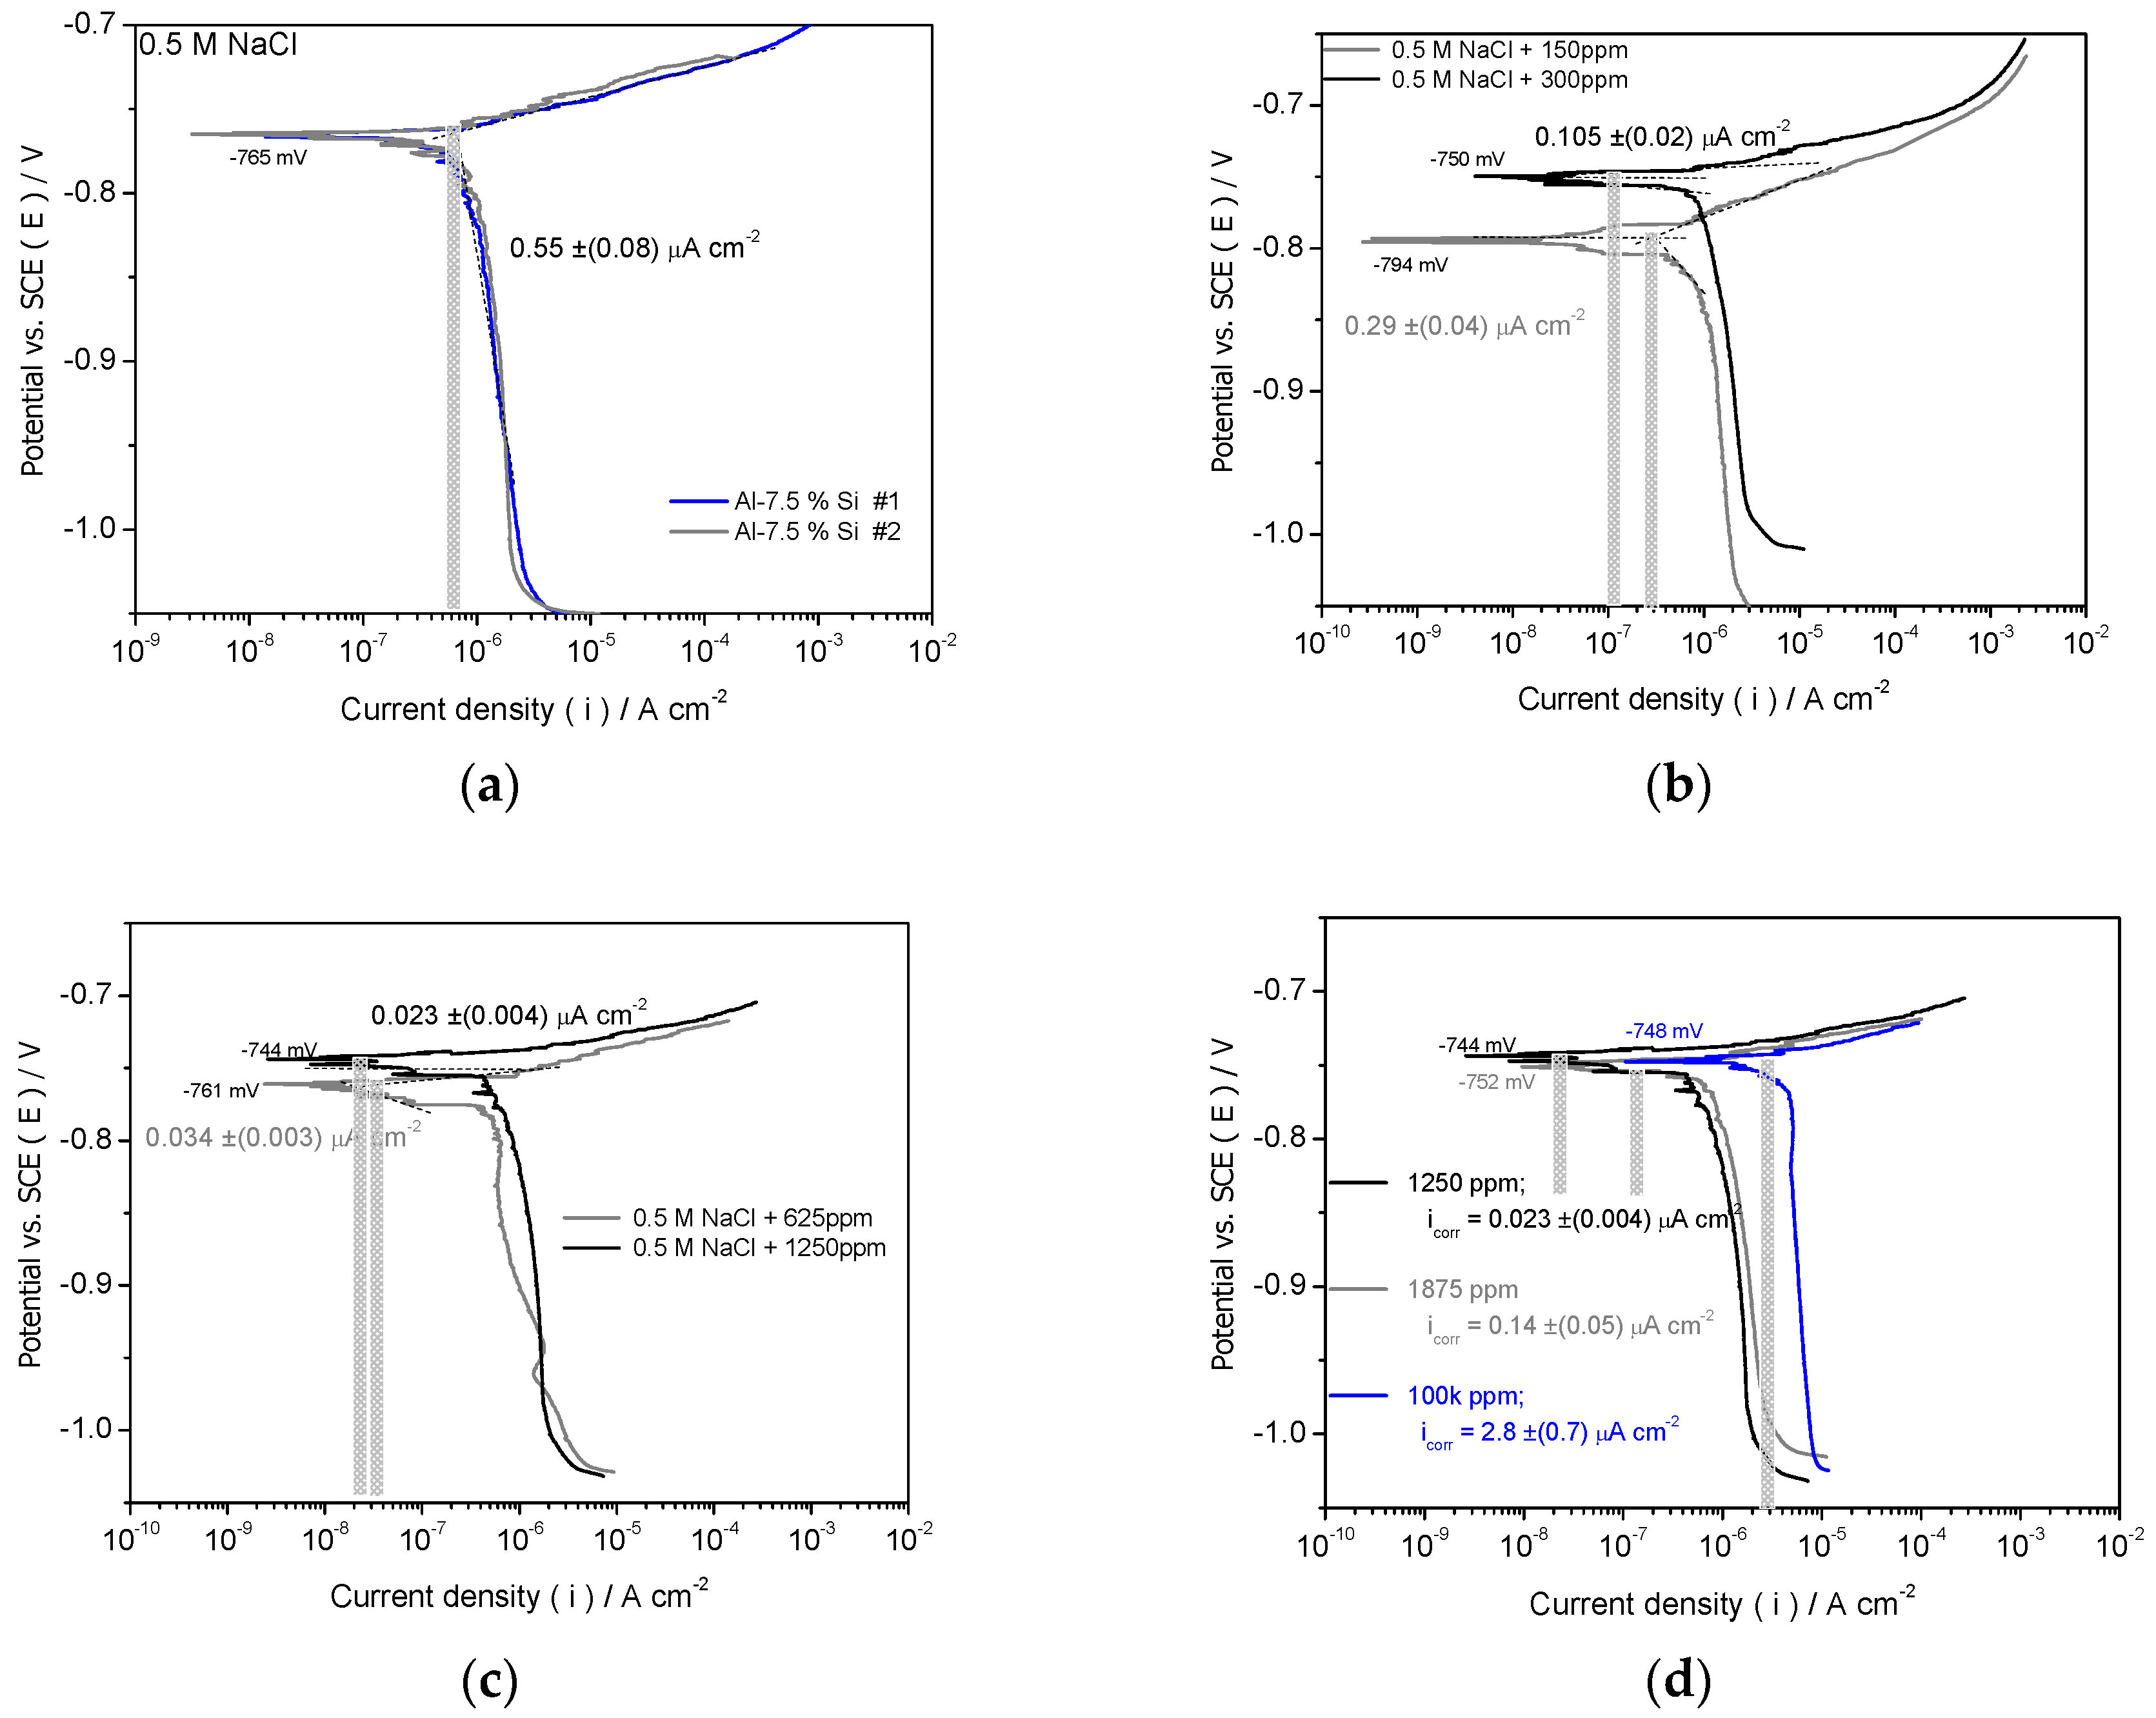
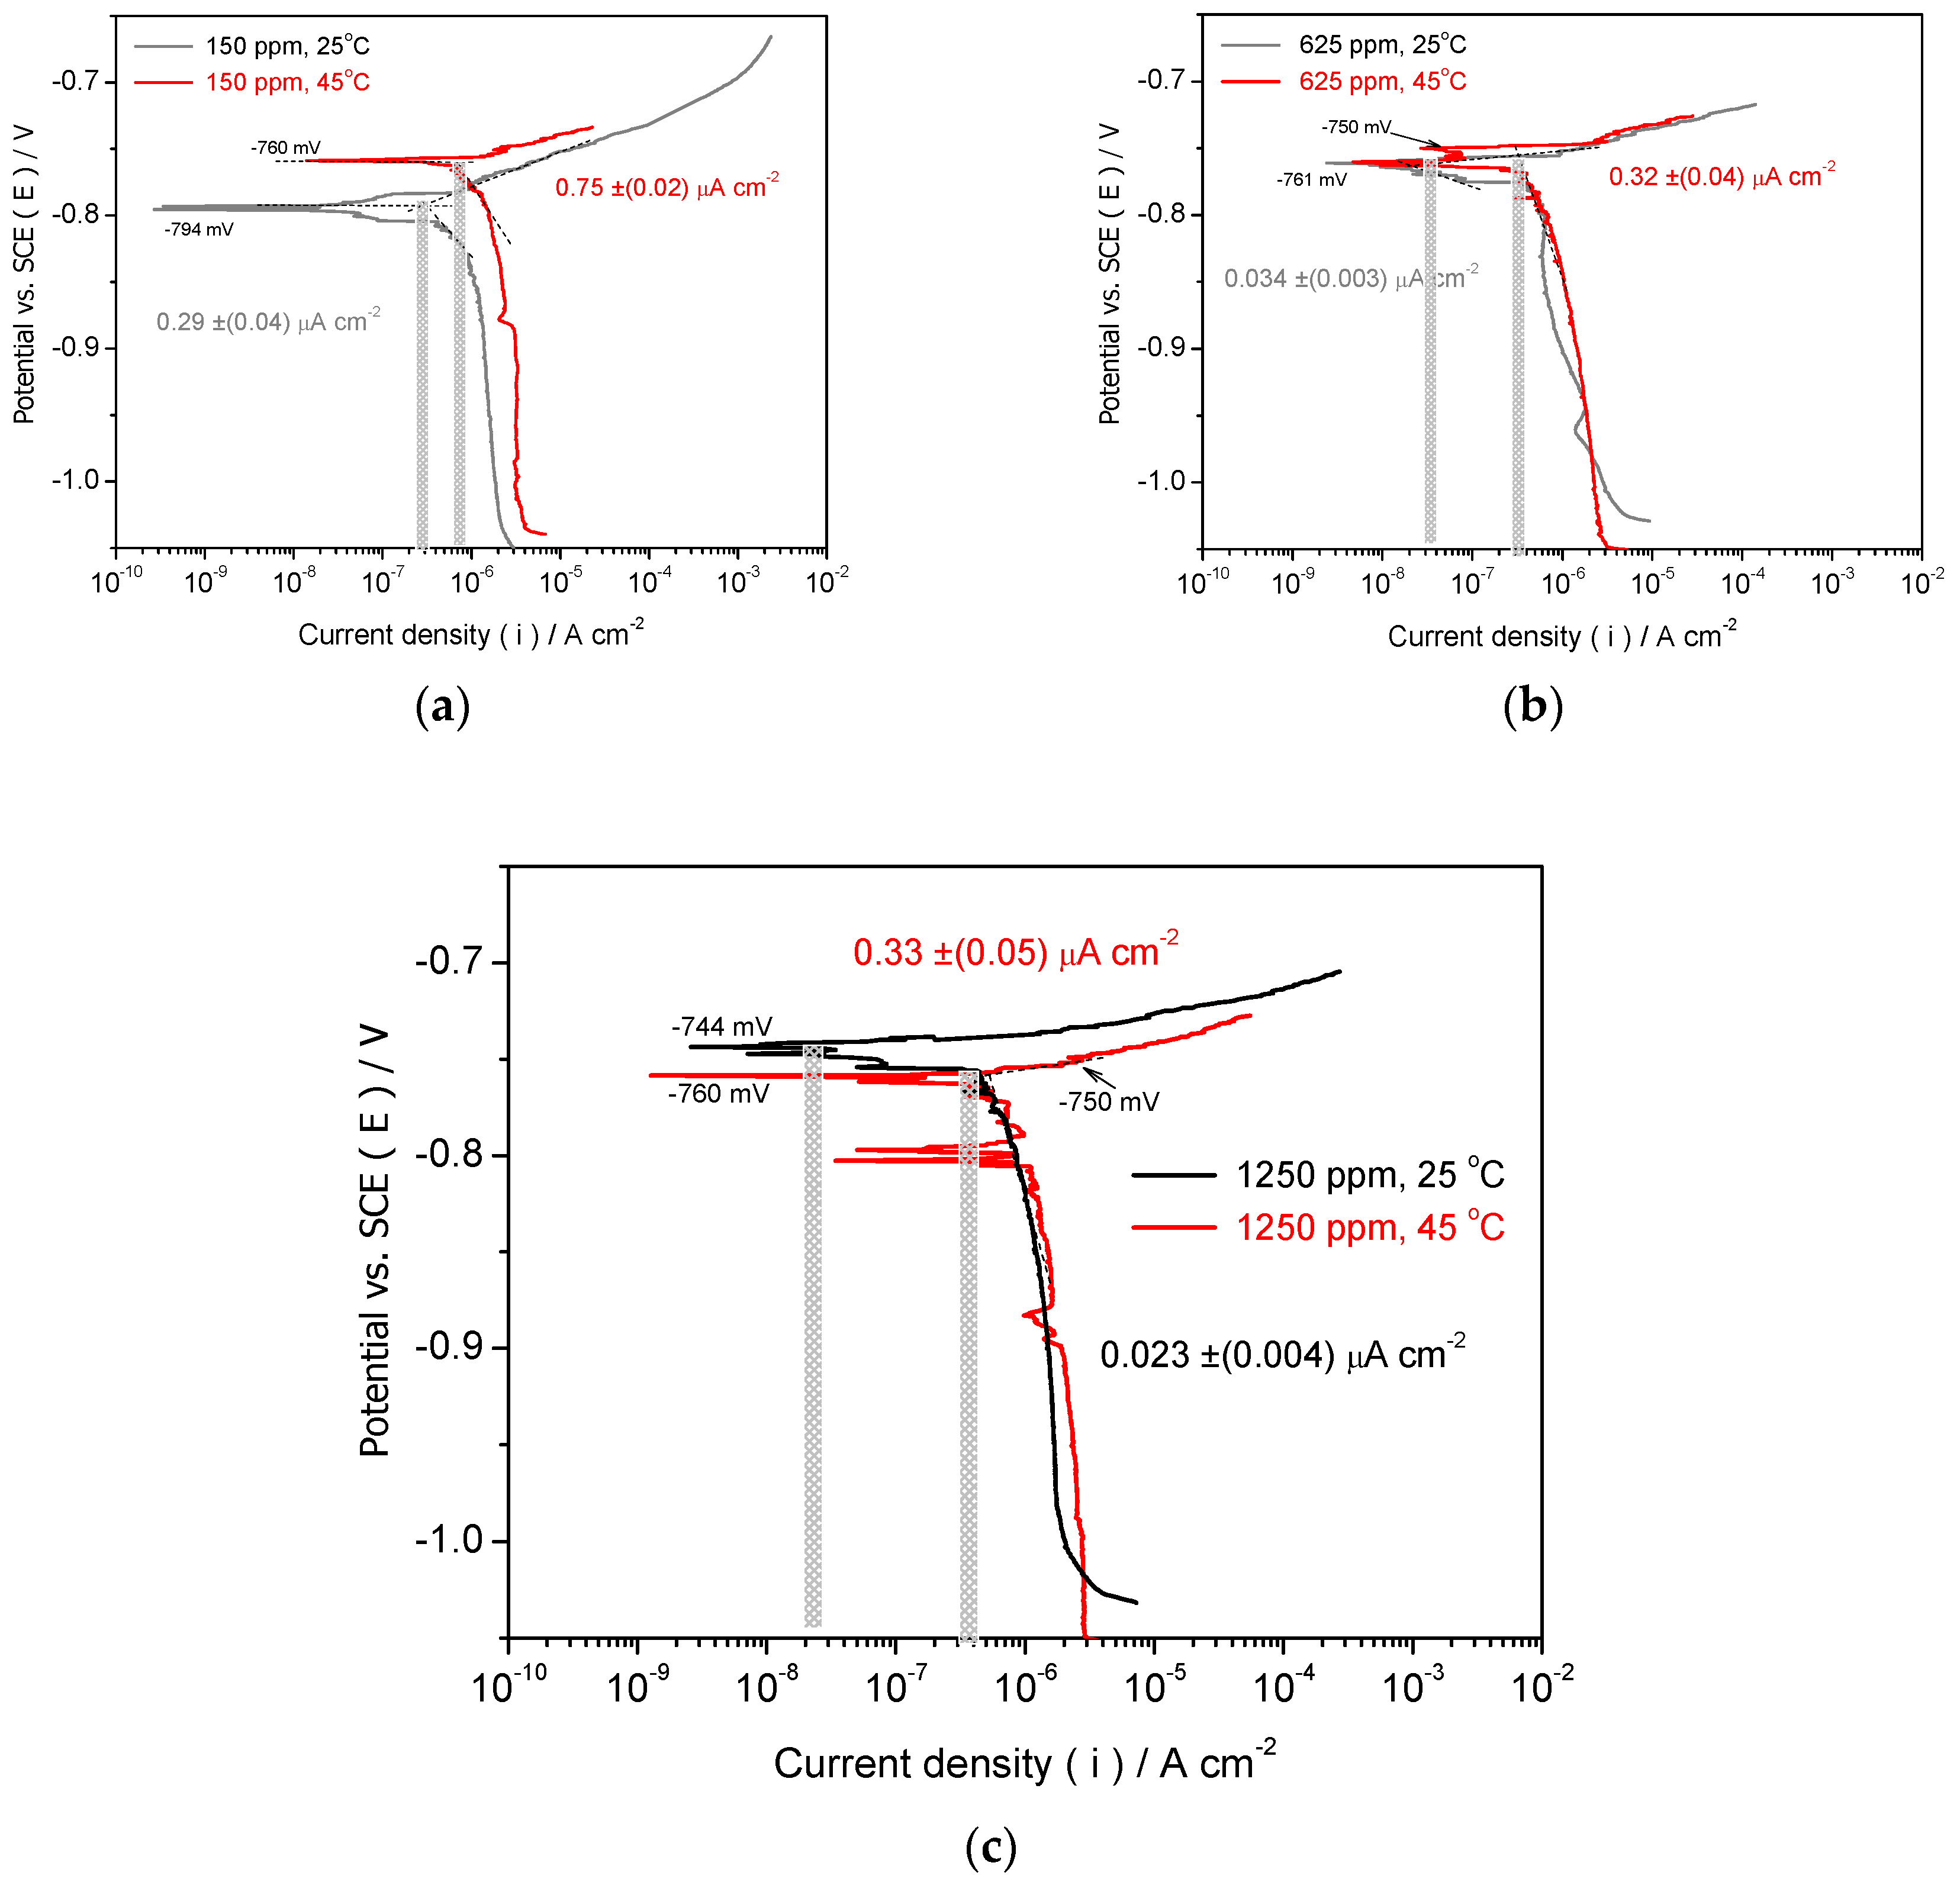
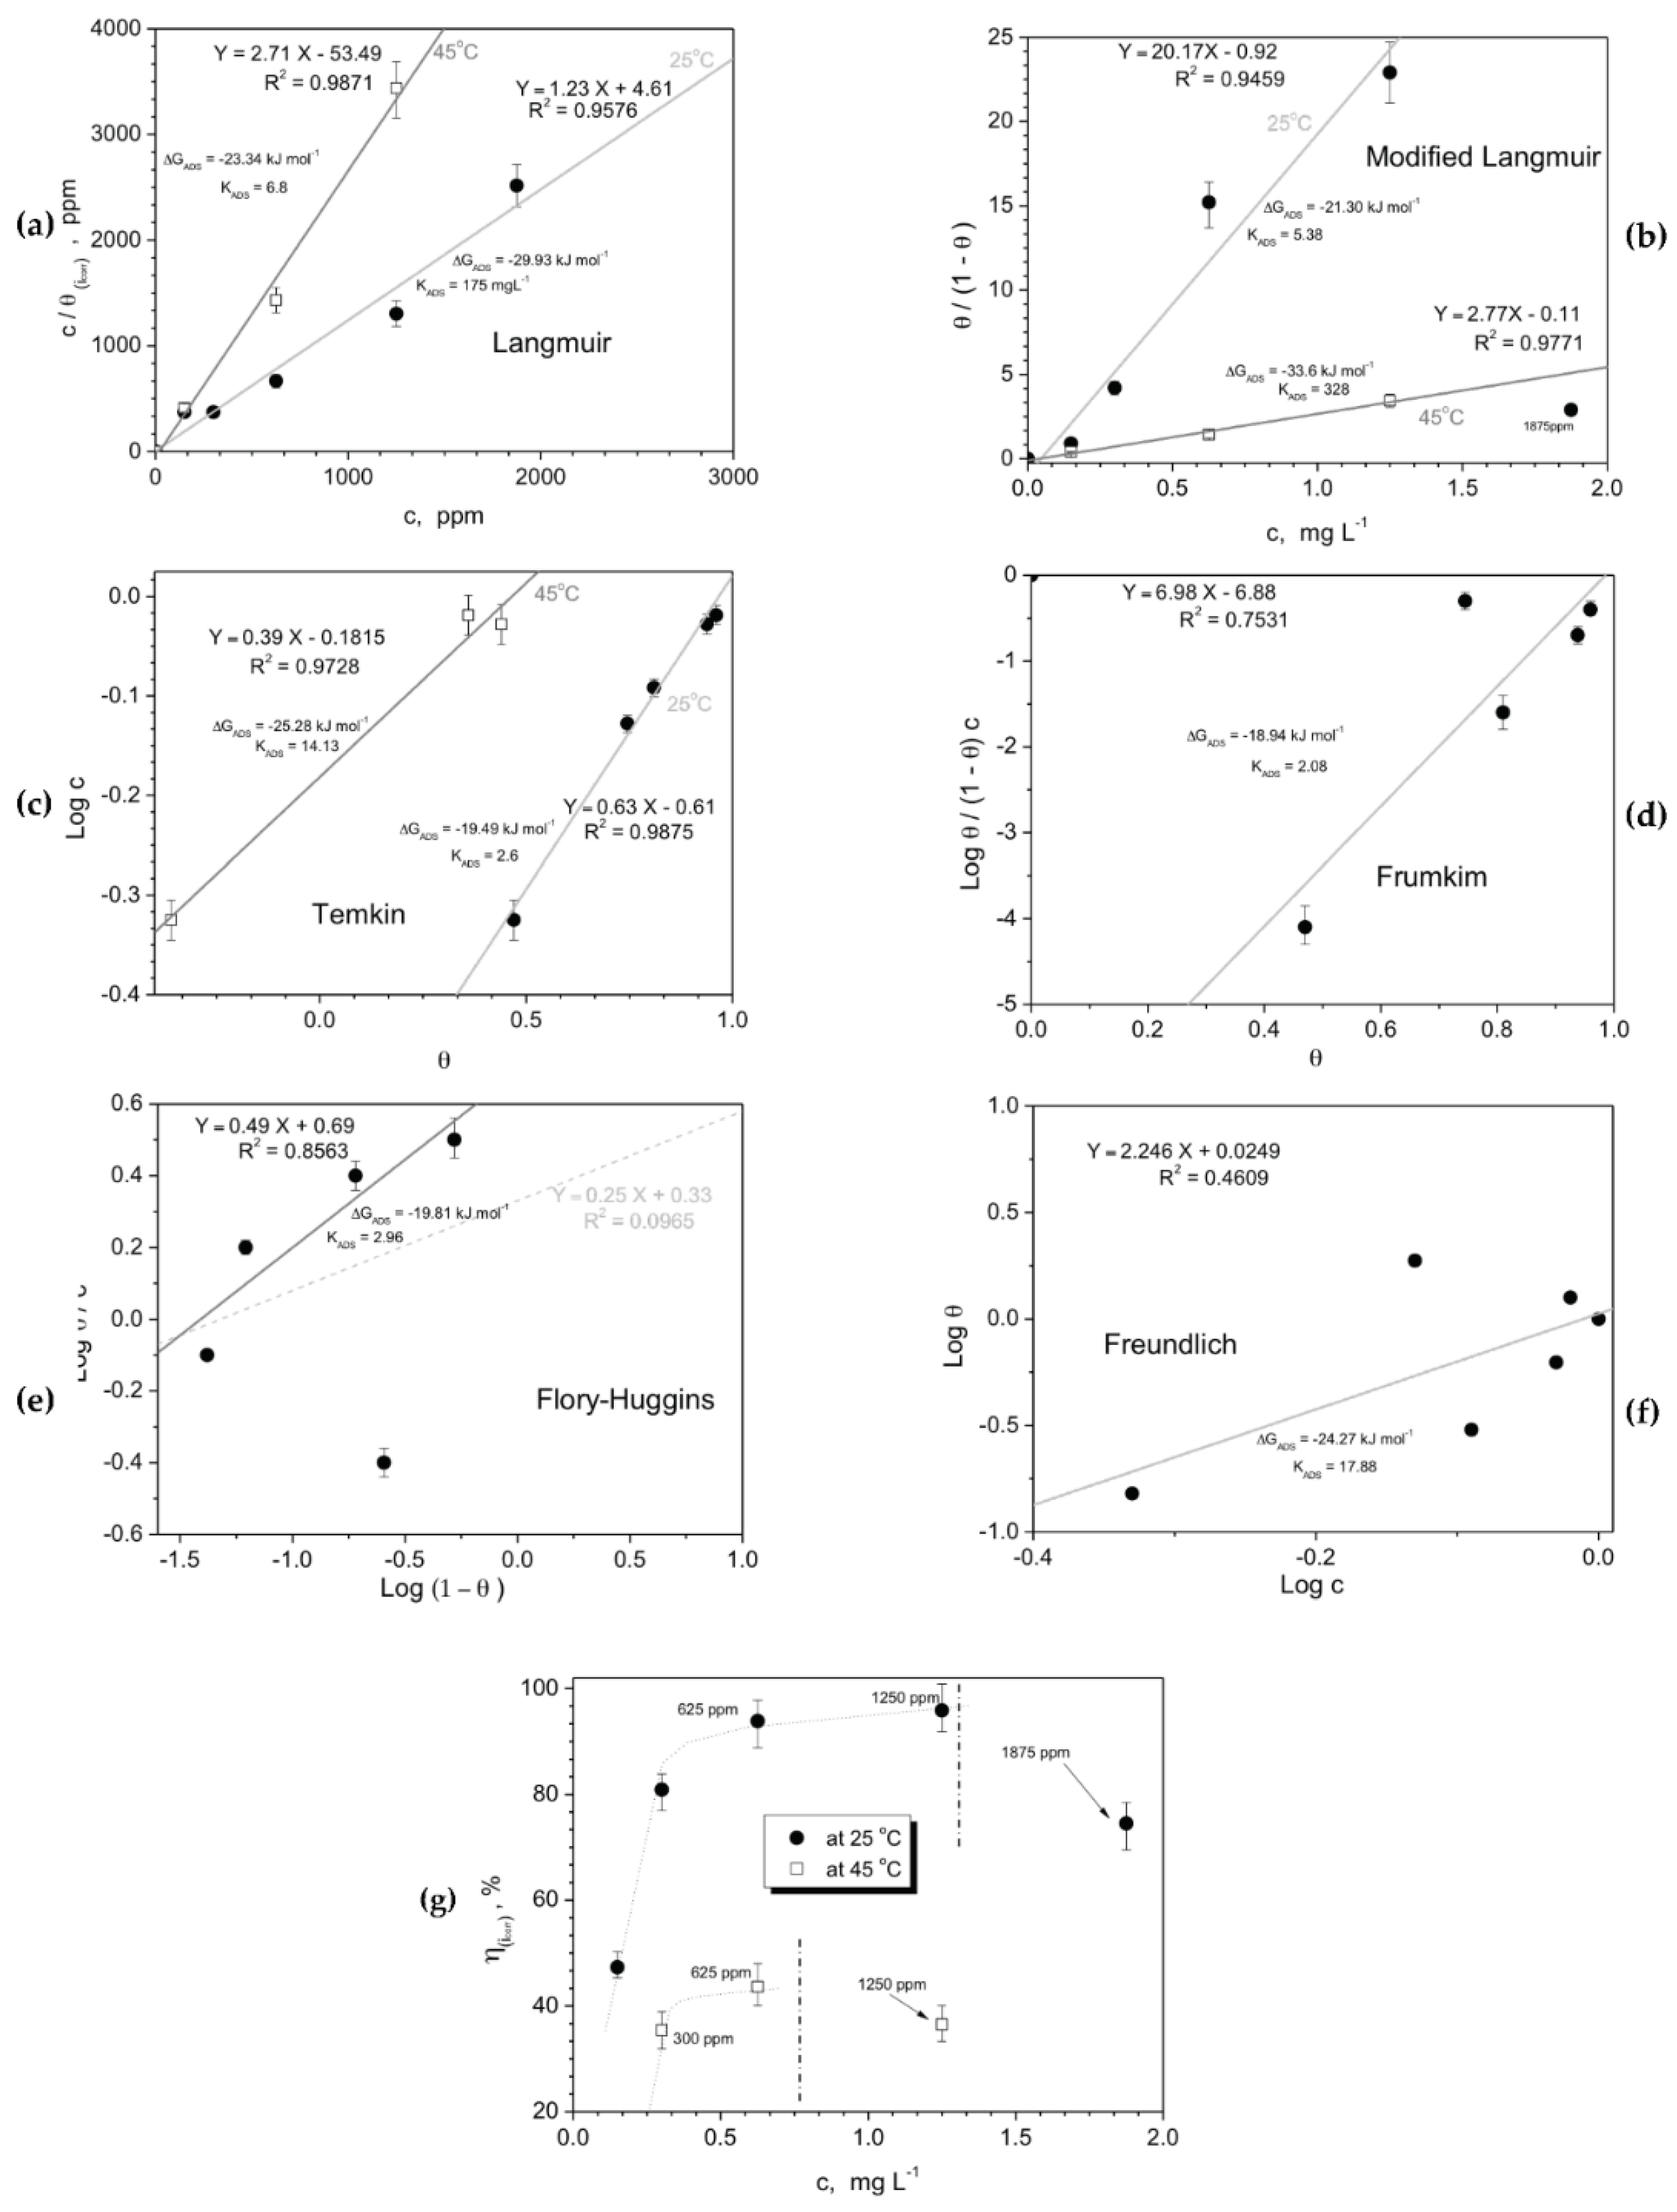
- When as-cast Al-Si alloy samples are evaluated by using potentiodynamic polarization curves, both IE% (inhibition efficiency percentage) and θ (surface coverage) results have demonstrated ~96% and 0.96 are attained, respectively. This when a Drimia maritima concentration of 1250 ppm is used. When 1875 ppm is applied, the corrosion current density increases, which demonstrates that efficiency is negatively affected. It is important to remark that when 150 ppm is utilized the IE% and θ have only achieved to ~47% and 0.47, respectively. These aforementioned results correspond with solution at environmental temperature (~25 oC). However, when at higher temperature (~45 oC), Drimia maritima green inhibitor also demonstrated positive effect attaining of about 43% when 625 ppm is utilized.
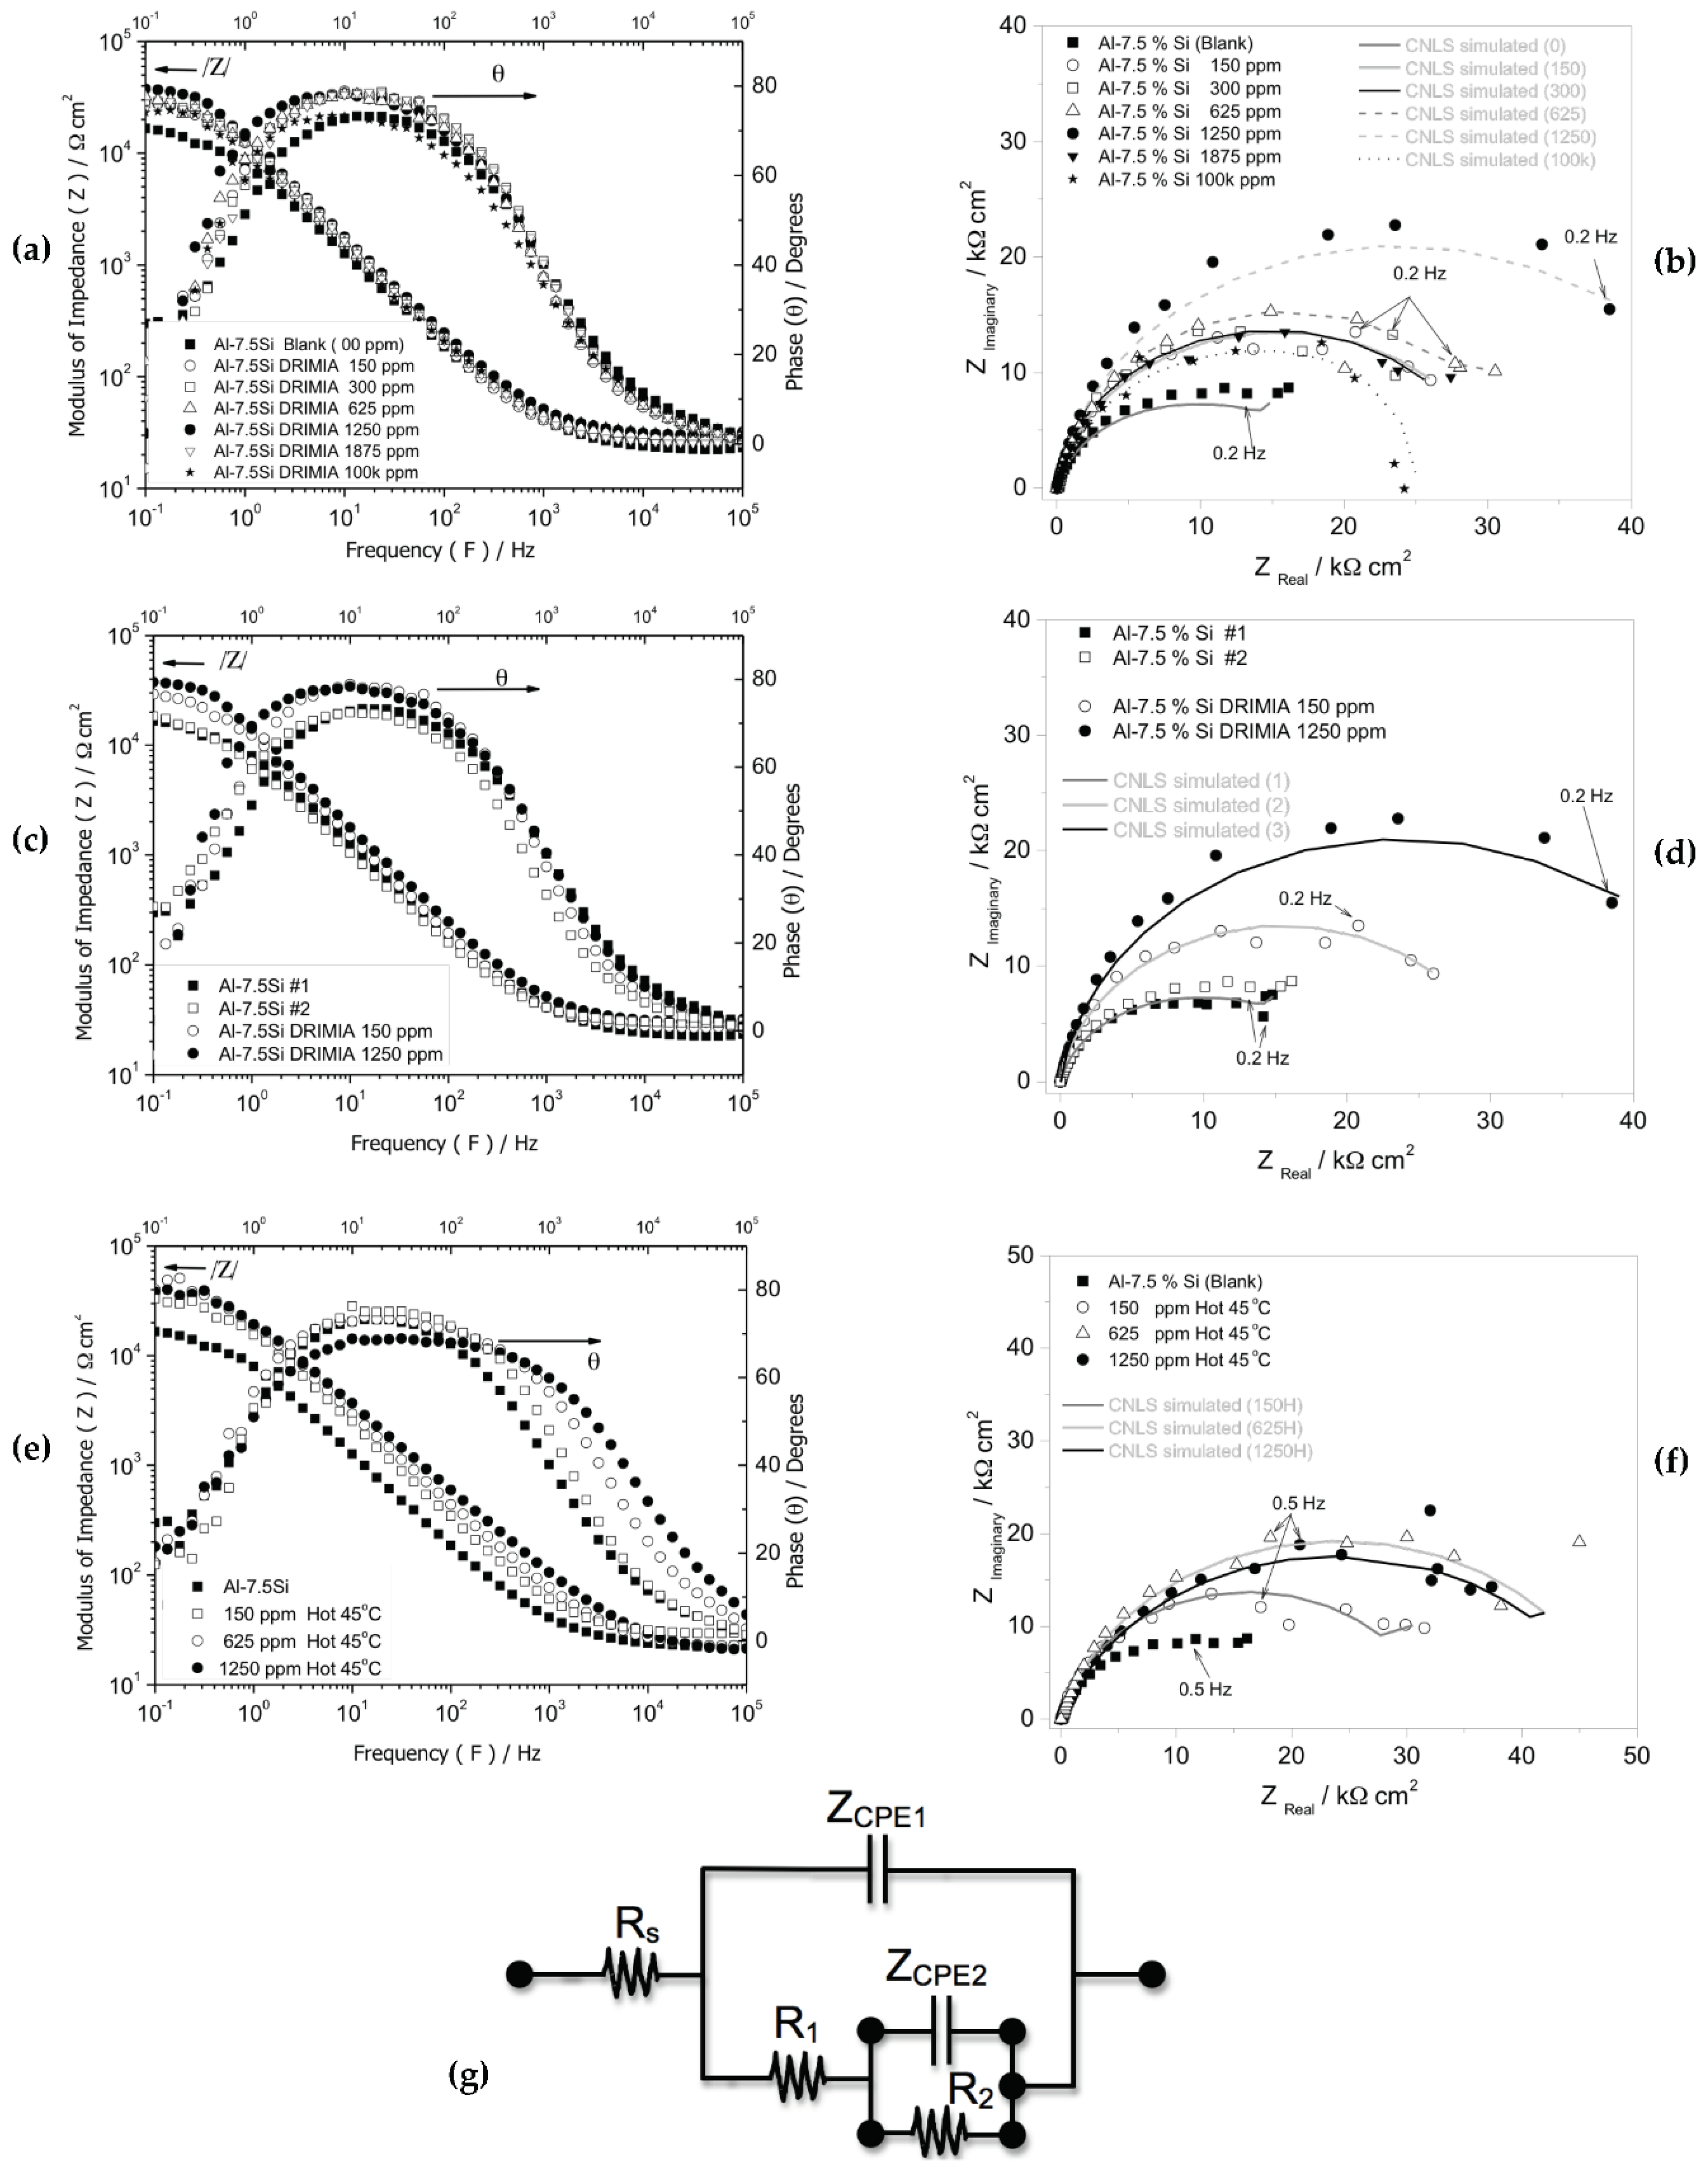
- When EIS results are also evaluated, similar trends concerning to inhibition effect are observed, i.e. the highest inhibition is that of 1250 ppm at 25 oC and 625 ppm at 45 oC. These assertions are achieved when capacitances and its corresponding polarization resistances are examined.
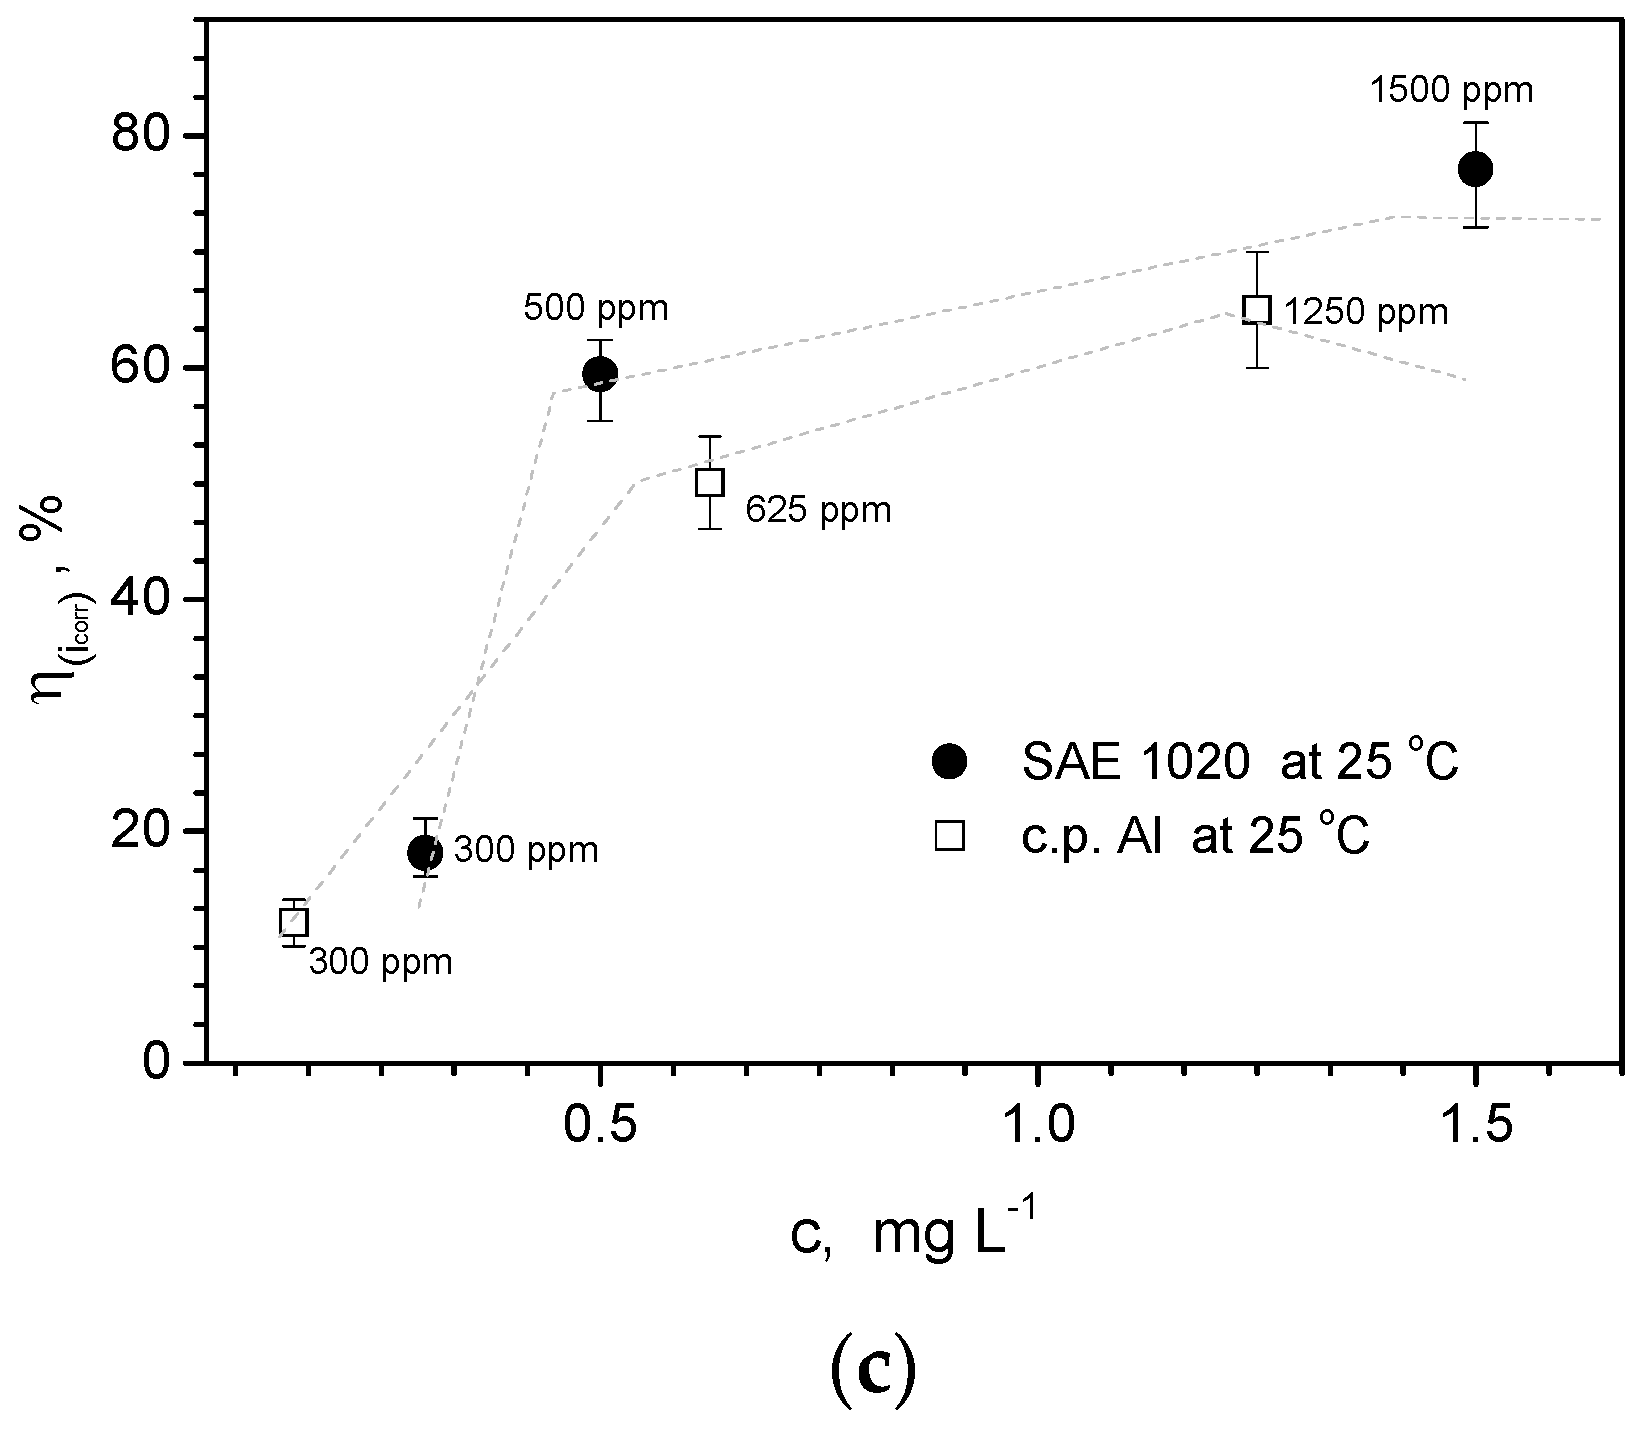
- When both SAE steel and commercially pure Al samples are also examined, it is also verified that inhibition effects are provided. Considering the SAE steel sample, the highest IE% is that of 500 ppm of Drimia maritima. On the other hand, when c.p. Al samples are examined; the concentration of Drimia maritima that provides the highest inhibition behavior (~89%) is that of 1250 ppm. Similar trends are also reached when EIS data are examined.
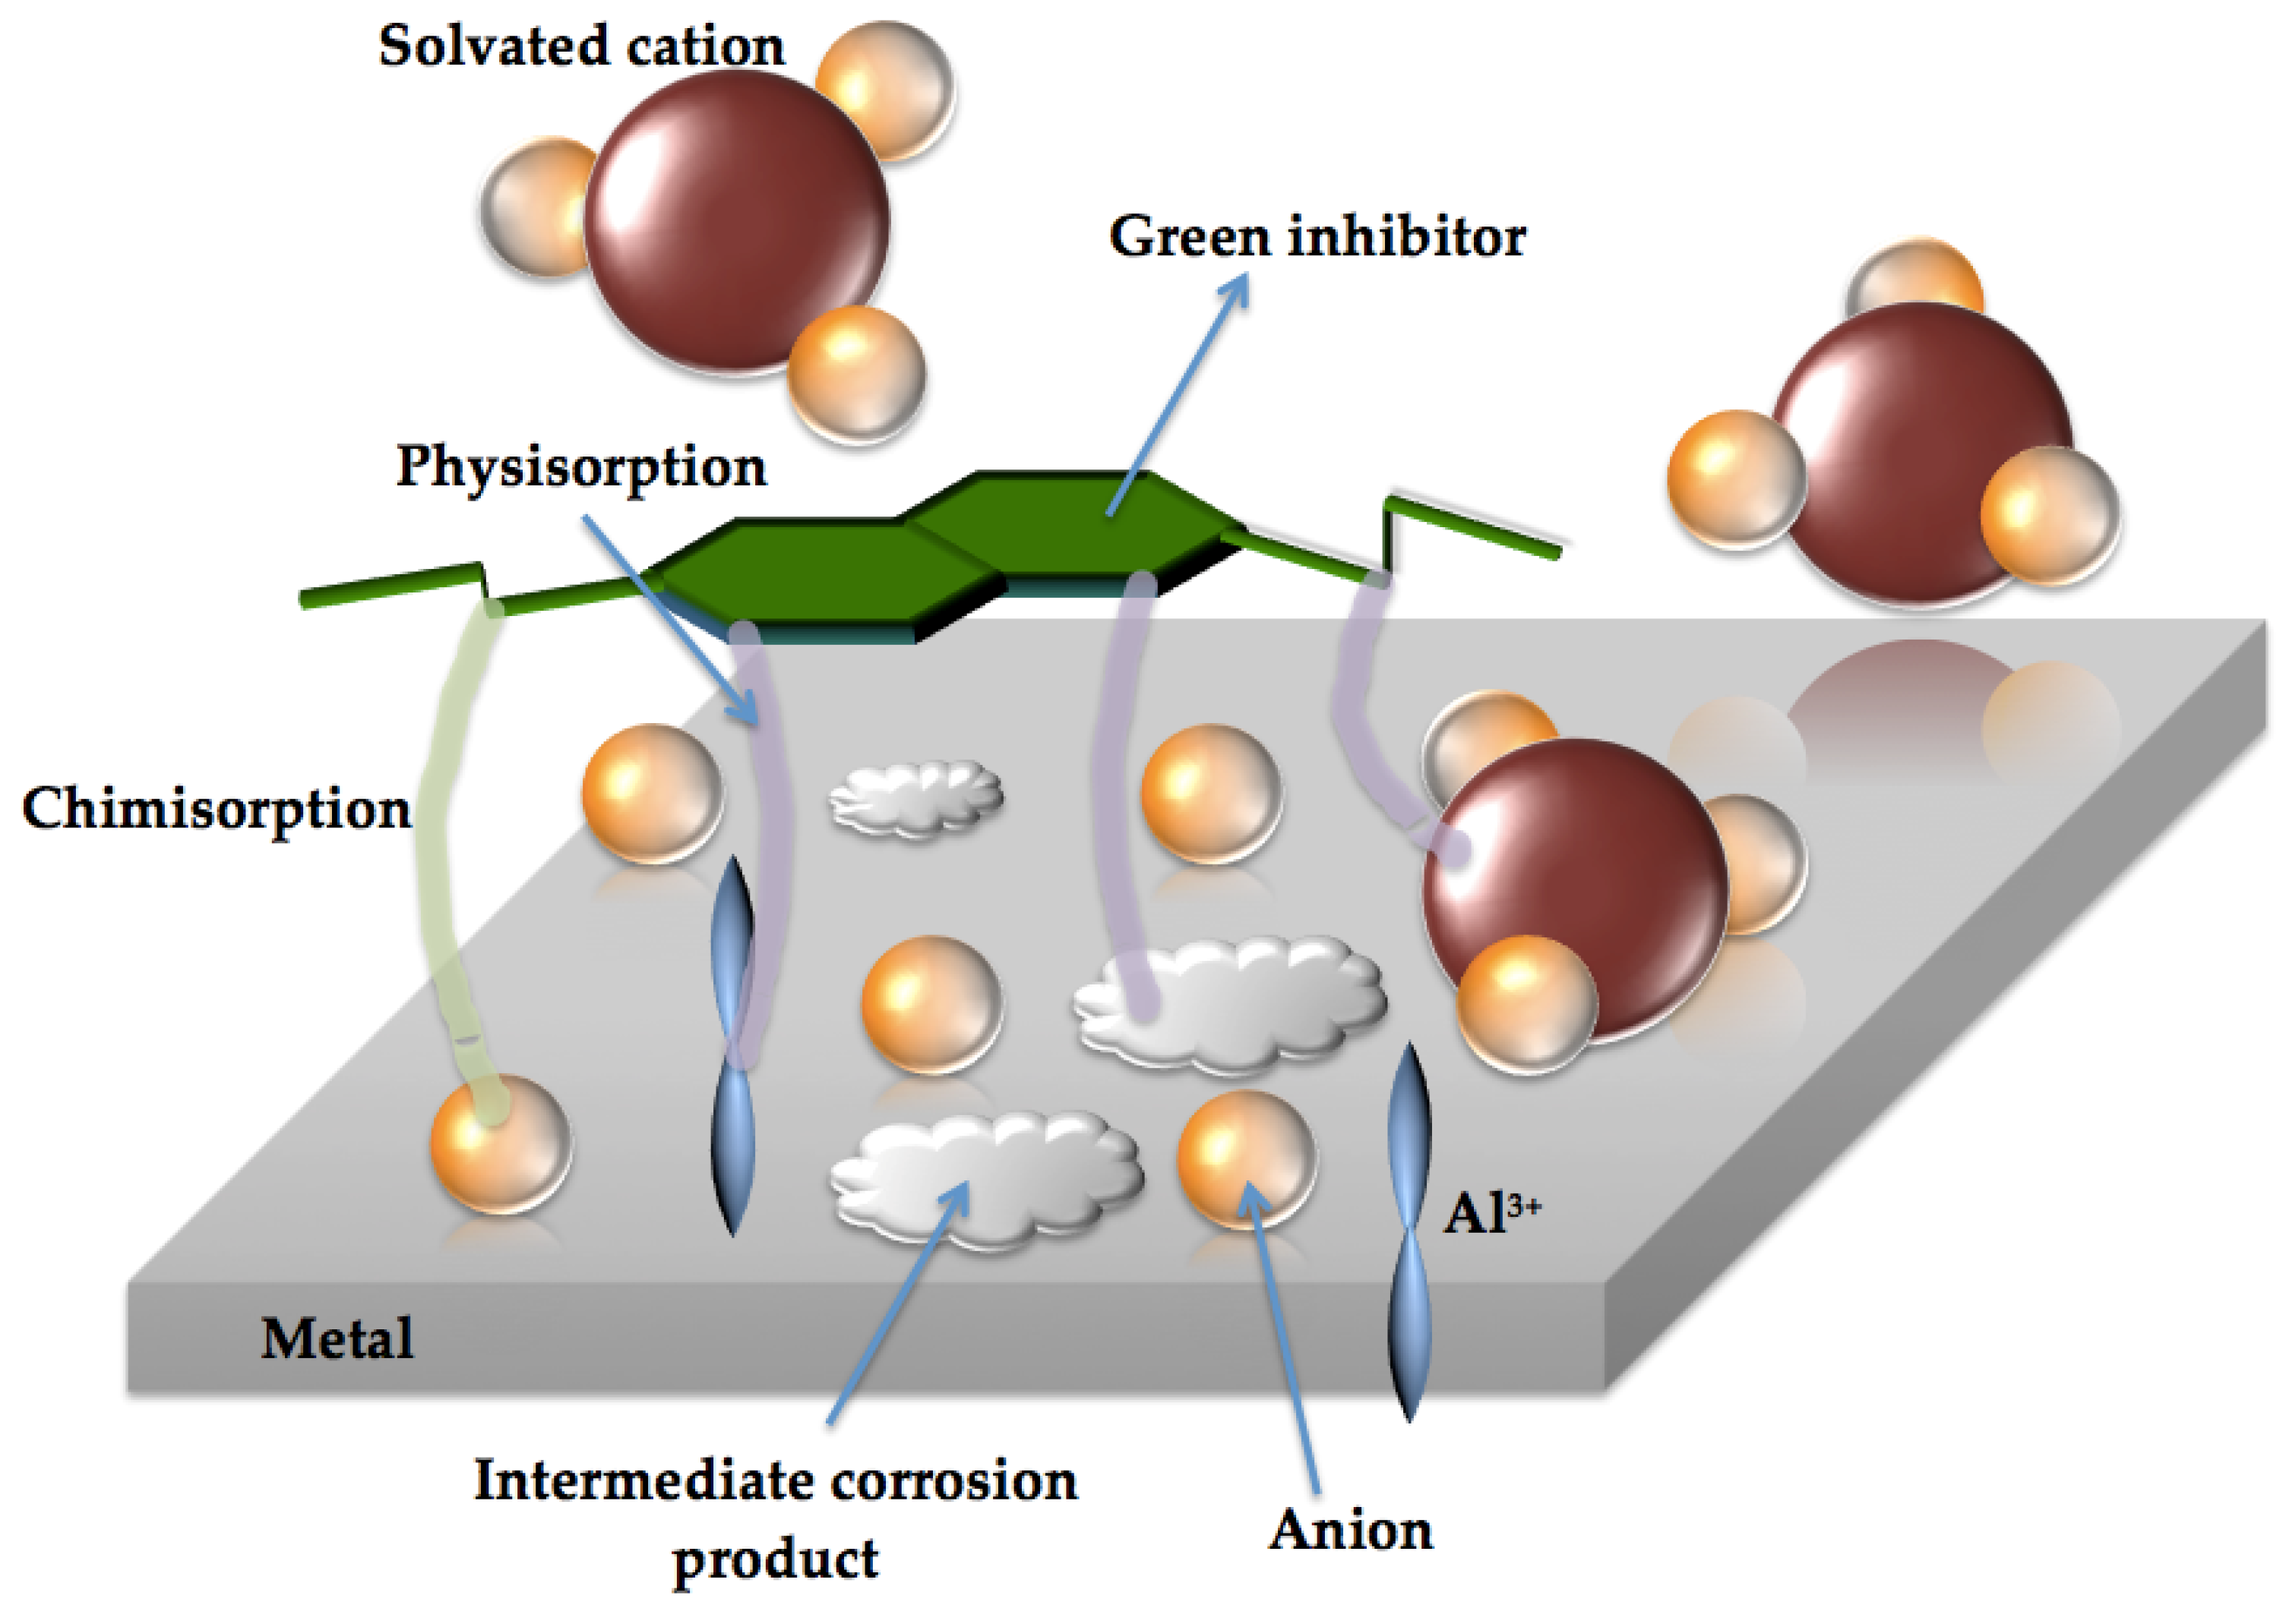
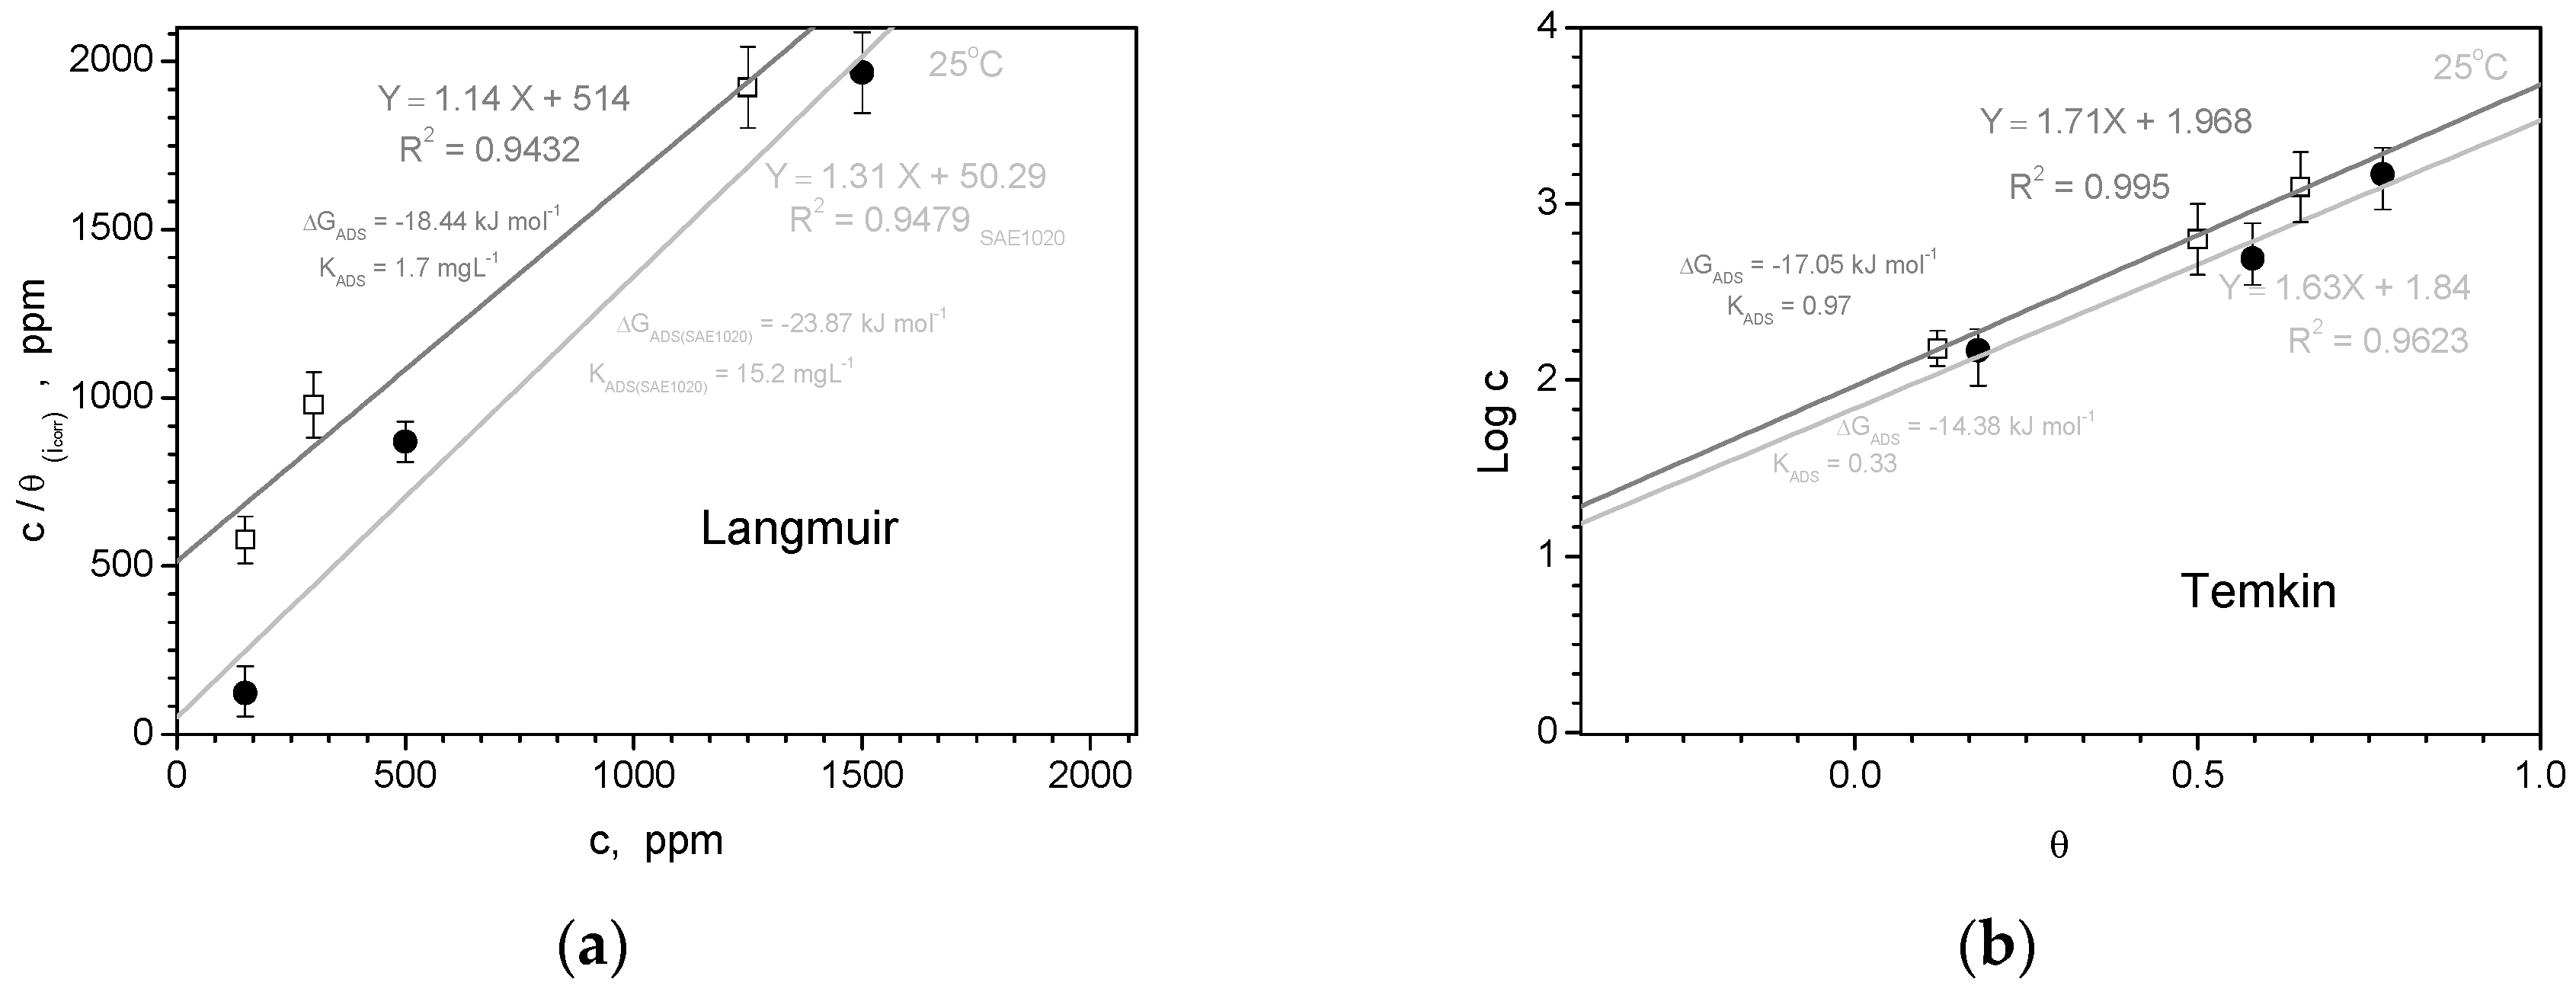
- Based on the determined isothermal adsorption plots by using distinctive methods (i.e. Langmuir, Temkin, Frumkim, Flory-Huggins and Freundlich isotherm), the obtained parameters have indicated that a physical adsorption mechanism is prevalent, on all examined samples. With this, it is considered that an electrostatic interaction (physisorption) mechanism domains the adsorption between negatively charged of the DRIMIA components positively charged cation of “metal” (Al or Fe) at surface.
- Finally, although it is found that physisorption domains the inhibition behavior of the three distinctive materials, it is confirmed that different concentrations provide distinct protection levels or inhibition into NaCl solution. For instance, the Al-Si alloy, the use of 1250 ppm attains an efficiency level of about 96% while for c.p. Al sample only 89% is achieved. On the other hand, the SAE steel sample has its efficiency decreased to ~44%. This indicates that the dosage of Drimia maritima content as green inhibitor into NaCl solution shows certain “susceptibility” for each examined material, and should carefully planned in order to obtain the maximum inhibitor behavior without deleterious and catastrophic effects.
Author Contributions
Funding
Institutional Review Board Statement
Informed Consent Statement
Data Availability Statement
Acknowledgments
Conflicts of Interest
References
- Schweitzer Philip, A. Corrosion Engineering Handbook, 1st Edition, CR Press, 1996.
- Schweitzer Philip, A. Metallic Materials: Physical, Mechanical, and Corrosion Properties (Corrosion Technology), 1st Edition, CR Press, 2006.
- Wolynec, S. Técnicas Eletroquímicas em Corrosão. São Paulo, EDUSP – Editora Universidade de São Paulo, 2003.
- Paul, L., Machunda, R.L. Investigation of Aloe lateritia Gel as Corrosion Inhibitor for Mild Steel in 2 M HNO3 and 1 M H2SO4 Media. Journal of Minerals and Materials Characterization and Engineering 4 (2016) 33-39.
- Kesavan, D., Gopiraman M., Sulochana N. Green Inhibitors for Corrosion of Metals: A Review. Chemical Science Review and Letters 1 (2012) 1-8.
- Koch, G.H., Brongers M.P.H., Thompson N.G., Virmani Y.P., Payer J.H. Corrosion costs and preventive strategies in the United States. NACE Intl PHWA-RD-01-156. 2002.
- Khadraoui, A., Khelifa, A. Hamitouche H., Mehdaoui R. Inhibitive effect by extract of Mentha rotundifolia leaves on the corrosion of steel in 1 M HCl solution. Res. Chem. Intermed. 40 (2014) 961–972.
- Xhanari, K. Finsgar M., Hrncic M.K., Maver U. Kneza Z., Seiti B. Green corrosion inhibitors for aluminium and its alloys: a review. The Royal Soc. of Chemistry RSC advances 7 (2017) 27299-27330.
- Inzunza, R.G., Valdez B., Schorr M. Corrosion Inhibitor Patents in Industrial Applications – A Review. Recent Patents on Corrosion Science 3 (2013) 71-78.
- Hart, K., James A.O. The Inhibitive Effect of Aloe Vera Barbadensis Gel on Copper in Hydrochloric Acid Medium. Journal of Emerging Trends in Engineering and Applied Sciences (JETEAS) 5 (2014) 24-29.
- Abiola, O.K., Oforka N.C. The corrosion inhibition of Azadirachta leaves extract on corrosion of mild steel in HCl solution. Material Chemistry and Physics 70 (2002) 241-268.
- Sangeetha M, Rajendran S., Sathiyabama J., Krishnavenic A. Inhibition of Corrosion of Aluminium and its Alloys by Extracts of Green Inhibitors. Portugaliae Electrochimica Acta 31 (2013) 41-52.
- Xhanari, K., Finsgar M. Organic corrosion inhibitors for aluminium and its alloys in acid solutions: a review. RSC Adv. 6 (2016) 62833–62857.
- Hatch, E. Aluminum: Properties and Physical Metallurgy, p. 433, ASM International, 1984.
- Davis, J.R. Corrosion of Aluminum and Aluminum Alloys, p. 327, ASM International, 1999.
- Rodic, P., Milosevz I. Inhibition of pure aluminium and alloys AA2024-T3 and AA7075-T6 by cerium(III) and cerium(IV) salts. Journal of The Electrochemical Society 3 (2016) C85-C93.
- Badawy, W.A., Al-Kharafi F.M., El-Azab A.S. Electrochemical behaviour and corrosion inhibition of Al, Al-6061 and Al-Cu in neutral aqueous solutions. Corrosion Science 41 (1999) 709-727.
- Osório, W. R., Freire C. M. A. And Garcia “The Role Of Macrostructural Morphology And Grain Size On The Corrosion Resistance Of Zn And Al Castings”, Materials Science Engineering A, 402, 22-32, 2005.
- Osório, W.R., Goulart, P.R, Santos, G.A, Moura Neto, C., Garcia, A, “Effect Of Dendritic Arm Spacing On Mechanical Properties And Corrosion Resistance Of Al 9 Wt % Si And Zn 27 Wt% Al Alloys”, Mettalurgical Materials Transactions, V. 37a, Pp. 2525-2537, 2006.
- Osório, W.R., Spinelli, J.E. Ferreira, I.L., Garcia, A. The Roles Of Macrosegregation And Of Dendritic Array Spacings On The Electrochemical Behavior Of An Al-4.5wt%Cu Alloy, Electrochimica Acta, V. 52, Pp. 3265-3273, 2007.
- Osório, W. R.; Peixoto, L C.; Garcia, L. R.; Garcia, A. Corrosion Behavior Of Hypoeutectic Al-Cu Alloys In H2SO4 And Nacl Solutions. Acta Metallurgica Sinica, V. 22, P. 241-246, 2009.
- Osório, W. R.; Peixoto, L C.; Canté, M. V.; Garcia, A. Electrochemical Corrosion Characterization Of Al Ni Alloys In A Dilute Sodium Chloride Solution. Electrochimica Acta, V. 55, P. 4078-4085, 2010.
- Osório, W. R.; Peixoto, L C.; Canté, M. V.; Garcia, A. Microstructure Features Affecting Mechanical Properties And Corrosion Behavior Of A Hypoeutectic Al Ni Alloy. Materials And Design, V. 31, P. 4485-4489, 2010.
- Osório, W. R.; Peixoto, L C.; Goulart, P. R.; Garcia, A. Electrochemical Corrosion Parameters of As-Cast Al Fe Alloys In A Nacl Solution. Corrosion Science, V. 52, P. 2979-2993, 2010.
- Osório W.R., Moutinho D.J., Peixoto L.C., Ferreira I.L., Garcia A., Macrosegregation And Microstructure Dendritic Array Affecting The Electrochemical Behaviour Of Ternary Al–Cu–Si Alloys. Electrochimica Acta 56 (2011) 8412-8421.
- Osório, W.R., Siqueira C. A., Santos C.A., Garcia A. The Correlation Between Electrochemical Corrosion Resistance And Mechanical Strength Of As-Cast Al-Cu And Al-Si Alloys. International J. Electrochem. Sci. 6 (2011) 6275 – 6289.
- Osório W., R.; Goulart P., R., Garcia A. Effect of silicon content on microstructure and electrochemical behavior of hypoeutectic Al-Si alloys. Materials Letters 62 (2008) 365-369.
- Osório, W.R., Cheung N., Spinelli J.E., Goulart P.R., Garcia A. Efects of a eutectic modifier on microstructure and surface corrosion behavior of Al-Si hypoeutectic alloys. Journal of Solid State Electrochemistry 11 (2007) 1421-1427.
- Goulart, P.R., Spinelli J.E., Osório W.R., Garcia A. Mechanical properties as a function of microstruture and solidification thermal variables of Al-Si castings. Materials Science & Engineering. A, 421 (2006) 245-253.
- Osório, W.R., Peixoto L.C., Moutinho D.J., Gomes L.G., Ferreira I.L., Garcia A., Corrosion Resistance Of Directionally Solidified Al–6Cu–1Si And Al–8Cu–3Si Alloys Castings. Materials And Design, Vol. 32, Pp. 3832–3837, 2011.
- Osório, W.R., Freitas E.S., Garcia A. Electrochemical Impedance Spectroscopy And Potentiodynamic Polarization Studies Affected By The Microstructure Array Of A Monotectic Al-Pb Alloy In A Nacl Solution. Corrosion 70 (2014) 1031-1042.
- Osório, W.R., Freitas E.S., Garcia A. Corrosion Performance Based On The Microstructural Array Of Al-Based Monotectic Alloys In a NaCl Solution. Journal Of Materials Engineering And Performance 23 (2014) 333-341.
- Osório, W.R., Canté M.V., Brito C., Freitas E.S., Garcia A. Electrochemical Behavior Of An Al-Fe-Ni Alloy Affected By Nano-Sized Intermetallic Particles. Corrosion 71 (2015) 510-522.
- Speller, F.N., Chappel E.L., Russell R.P. Practical applications of inhibitors for picling operations. Trans. Am. Inst. Chem. Engrs. 49 (1927) 165-169.
- Sharma, S.K., Peter A., Obot I.B. Potential of Azadirachta indica as a green corrosion inhibitor against mild steel, aluminum, and tin: a review. Journal of Analytical Science and Technology 6 (2015) 26-42.
- Obi-Egbedi, N.O., Obot I.B., Umoren S.A. Spondias mombin L. as a green corrosion inhibitor for aluminium in sulphuric acid: Correlation between inhibitive effect and electronic properties of extracts major constituents using density functional theory. Arabian Journal of Chemistry 5 (2012) 361–373.
- Obot, I.B., Obi-Egbedi N.O. Ginseng Root: A new Efficient and Effective Eco-Friendly Corrosion Inhibitor for Aluminium Alloy of type AA 1060 in Hydrochloric Acid Solution. Int. J. Electrochem. Sci., 4 (2009) 1277 – 1288.
- Badawi, A.K., Fahim I.S. A critical review on green corrosion inhibitors based on plant extracts: Advances and potential presence in the maket. Int. J. Corros. Scale Inhib. 10 (2021) 1385-1406.
- Hamouda A. B., Chaieb I., Zouari L., Zarrad K., Laarif A. Toxicological effects of Urginea maritima (L.) against the red flour beetle (Coleoptera: Tenebrionidae). Journal of Entomology and Zoology Studies 4 (2016) 17-20.
- Sharma H. J., Devi N. S. Phytochemical Analysis of Drimia Species. International Journal of Applied Science – Research and Review 4 (2017) 1-4.
- F. Nejatbakhsh, H. Karegar-Borzia, G. Amin, A. Eslaminejad, M. Hosseini, M. Bozorgie, M. A. Gharabaghi. Squill Oxymel, a traditional formulation from Drimia Maritima (L.) Stearn, as an add-on treatment in patients with moderate to severe persistent asthma: A pilot, triple-blind, randomized clinical trial. Journal of Ethnopharmacology 196 (2017) 186–192.
- Hamouda A. B., Chaieb I., Zouari L., Zarrad K., Laarif A. Toxicological effects of Urginea maritima (L.) against the red flour beetle (Coleoptera: Tenebrionidae). Journal of Entomology and Zoology Studies 4 (2016) 17-20.
- Gould, L., Fisch S., Cherbakoff A., Degraff A.C. Clinical studies on proscillaridin A, a new squill glycoside. J clin pharmacol new drugs 11(1971) 135-145.
- Bielawski K, Winnicka K, Bielawska A. Inhibition of DNA topoisomerases I and II, and growth inhibition of breast cancer MCF- 7 cells by ouabain, digoxin and proscillaridin A. Biol Pharm Bull. 29 (2006) 1493-1497.
- Winnicka, K., Bielawski K., Bielawska A., Miltyc W. Apoptosis-mediated cytotoxicity of ouabain, digoxin and proscillaridin A in the estrogen independent MDA-MB-231 breast cancer cells. Arch Pharm Res. 30 (2007) 1216-1224.
- Nilubol, N., Zhang L., Shen M., Zhang Y.Q., He M., Austin C.P., Kebebew E. Four clinically utilized drugs were identified and validated for treatment of adrenocortical cancer using quantitative high-throughput screening. J Transl Med. 10 (2012) 1-15.
- Al-Abdallat K., Obeidat M., Ababneh N.A., Zalloum S., Al Hadidi S., Al-Abdallat Y., Zihlif M. and Awidi A. Phytochemical analysis and anticancer properties of Drimia Maritima bulb extracts on colorectal cancer cells. Molecules 2023, 28, 1215. [CrossRef]
- Rugmini Ammal, P., Prajila M., Joseph A. Physicochemical studies on the inhibitive properties of a 1,2,4-triazole Schiff’s base, HMATD, on the corrosion of mild steel in hydrochloric acid. Egyptian J. Petroleum 27 (2017). [CrossRef]
- Obi-Egbedi, N.O., Obot I.B., Umoren S.A. Spondias mombin L. as a green corrosion inhibitor for aluminium in sulphuric acid: Correlation between inhibitive effect and electronic properties of extracts major constituents using density functional theory. Arabian Journal of Chemistry 5 (2012), 361–373.
- Wang, C., Zou C., Cao Y. Electrochemical and isothermal adsorption studies on corrosion inhibition performance of β-cyclodextrin grafted polyacrylamide for X80 steel in oil and gas production. Journal of Molecular Structure 1228 (2021) 129737. [CrossRef]
- Hirschorn B, Orazem ME, Tribollet B, Vivier V, Frateur I, Musiani M (2010) Determination of effective capacitance and film thickness from constant-phase-element parameters. Electrochim Acta 55: 6218–6227.
- Orazem ME, Pébère N, Tribollet B (2006) Enhanced Graphical Representation of Electrochemical Impedance. J Electrochem Soc 153: 129-136.
- Meyer Y.A., Menezes I., Bonatti R.S., Bortolozo A.D., Osório W.R. EIS Investigation of the Corrosion Behavior of Steel Bars Embedded into Modified Concretes with Eggshell Contents. Metals 12 (2022), 417. [CrossRef]
- Duarte T., Meyer Y.A., Osório W.R. The Holes of Zn Phosphate and Hot Dip Galvanizing on Electrochemical Behaviors of Multi-Coatings on Steel Substrates, Metals 12 (2022 ), 863. [CrossRef]
- Lai, X., Hu J., Ruan T., Zhou J., Qu j. Chitosan derivative corrosion inhibitor for aluminum alloy in sodium chloride solution: A green organic/inorganic hydrid. Carbohydrate Polymers 265 (2021) 118074. [CrossRef]
- Nazir U., Akhter Z., Ali, N.Z., Shah F.U. Experimental and theoretical insights into the corrosion inhibition activity of novel Schiff bases for aluminum alloy in acidic medium. RSC Adv. 9 (2019) 36455-36470. [CrossRef]
- Jakeria, M.R., Toh R.J., Che X.B., Cole I.S. Evolution and stability of 2-mercaptobenzimidazole inhibitor film upon Al alloy 6061. J. Applied Electrochem 52 (2022) 1021-1044. Doi.org/10.1007/s10800-022-01687-w.
- Wang, J., Zhao J., Tabish M., Peng L., Cheng Q., Shi F. Long-term corrosion inhibition fro AA5052 aluminum alloy by an eco-friendly hybrid inhibitor: Synergism inhibition between rosemary extract and zinc chloride in 0.05M NaCl solution. J. Ind. Eng. Chemistry 120 (2023) 302-315. [CrossRef]
- Farag A.A., Ismail A.S., Migahed M.A. Squid By-product Gelatin Polymer as an Eco-friendly Corrosion Inhibitor for Carbon Steel in 0.5 M H2SO4 Solution: Experimental, Theoretical, and Monte Carlo Simulation Studies. Journal of Bio- and Tribo-Corrosion (2020) 6:16. [CrossRef]
- Pradityana, A. Sulistijono A., Shahab A., Noerochim L, Susanti D. Inhibition of Corrosion of Carbon Steel in 3.5% NaCl Solution by Myrmecodia Pendans Extract. International Journal of Corrosion 2016 (2016) ID 6058286. [CrossRef]
- Garai, S., Garai S., Jaisankar P., Singh J.K., Elango A. A comprehensive study on crude methanolic extract of Artemisia pallens (Asteraceae) and its active component as effective corrosion inhibitors of mild steel in acid solution. Corrosion Science 60 (2012) 193–204. [CrossRef]

| Compunds | Common name | % | Formula (*) | Structure (*) | Density (g/mol) * | Number of atoms |
|---|---|---|---|---|---|---|
| Campesterol | phytosterol | 13.87 | C28H48O |  |
400.69 | 77 |
| 2,3 Butanediol | glycol/alcohol | 10.45 | C4H10O2 |  |
90.12 | 16 |
| 5-Hydroxymethylfurfural | -- | 9.85 | C6H6O3 |  |
126.11 | 15 |
| 9-Octadecenamide | Oleamide | 8.14 | C18H35NO |  |
281.48 | 55 |
| Hexadecanoic acid, ethyl ester | Palmitic acid | 8.05 | C18H36O2 |  |
284.48 | 56 |
| Proscillaridin A | -- | 4.96 | C30H42O8 |  |
530.67 | 80 |
| Concentration (ppm) | icorr ( x 10-6 A/cm2) |
Ecorr (mV) | IE% | θ |
|---|---|---|---|---|
| Blank | 0.550 (±0.08) | − 765 (±2) | --- | --- |
| 150 | 0.290 (±0.04) | − 794 (±2) | 47.3 | 0.47 |
| 300 | 0.105 (±0.02) | − 750 (±2) | 80.9 | 0.81 |
| 625 | 0.034 (±0.003) | − 761 (±2) | 93.8 | 0.94 |
| 1250 | 0.023 (±0.004) | − 744 (±2) | 95.8 | 0.96 |
| 1875 | 0.140 (±0.05) | − 752 (±2) | 74.5 | 0.75 |
| 100k | 2.798 (±0.7) | − 748 (±2) | N/C | N/C |
| Concentration (ppm) | icorr (25oC) ( x 10-6 A/cm2) |
icorr (45oC) ( x 10-6 A/cm2) |
IE%(25oC) | θ | IE%(45oC) | θ |
|---|---|---|---|---|---|---|
| 150 | 0.290 (±0.04) | 0.75 (±0.02) | 47.3 | 0.47 | N/I (*) | --- |
| 625 | 0.034 (±0.003) | 0.32 (±0.04) | 93.8 | 0.94 | 41.82 | 0.42 |
| 1250 | 0.023 (±0.004) | 0.33 (±0.05) | 95.8 | 0.96 | 40.00 | 0.40 |
| Parameters (at 25 oC) |
Blank | 150 ppm | 300 ppm | 625 ppm | 1250 ppm | 1875 ppm |
|---|---|---|---|---|---|---|
| Rs (Ω.cm2) | 22 (± 0.4) | 27 (± 0.3) | 27 (± 0.5) | 29 (± 0.5) | 29 (± 0.5) | 31 (± 0.5) |
| ZCPE 1(10−6 F/cm2) | 4.49 (± 0.2) | 10.6 (± 0.05) | 8.8 (± 0.8) | 10.2 (± 0.3) | 8.4 (± 0.5) | 10.9 (± 0.3) |
| R1 ( Ω.cm2) | 28 (± 6) | 196 (± 19) | 320 (± 80) | 240 (± 40) | 293 (± 45) | 228 (± 50) |
| n1 | 0.97 | 0.93 | 0.94 | 0.92 | 0.92 | 0.91 |
| ZCPE 2 (10−6F/cm2) | 1.94 (± 0.2) | 3.62 (± 0.5) | 2.69 (± 0.3) | 3.74(± 0.3) | 3.58 (± 0.8) | 6.29(± 0.5) |
| R2 (103 Ω.cm2) | 19.2 (± 0.3) | 29.3 (± 0.4) | 30.6 (± 0.5) | 34.7(± 0.7) | 47.1 (± 0.7) | 27.6 (± 0.8) |
| n2 | 0.80 | 0.91 | 0.94 | 0.90 | 0.92 | 0.91 |
| χ2 | 4.31 × 10⁻³ | 2.54 × 10⁻³ | 2.54 × 10⁻³ | 3.26 × 10⁻³ | 4.91 × 10⁻³ | 16 × 10−3 |
| Sum of Sqr. | 0.41 | 0.23 | 0.23 | 0.30 | 0.44 | 0.98 |
|
Parameters (at 45 oC) |
Blank | 150 ppm | 300 ppm | 625 ppm | 1250 ppm | 1875 ppm |
| Rs (Ω.cm2) | 29 (± 0.5) | 29 (± 0.2) | 21 (± 0.5) | |||
| ZCPE 1(10−6 F/cm2) | 7.92 (± 0.3) | 7.34 (± 0.2) | 8.49 (± 1.1) | |||
| R1 (Ω.cm2) | 445 (± 62) | 490 (± 80) | 1429 (± 240) | |||
| n1 | 0.89 | 0.86 | 0.81 | |||
| ZCPE 2 (10−6F/cm2) | 1.93 (± 0.3) | 1.96(± 0.2) | 1.05 (± 0.5) | |||
| R2 (103 Ω.cm2) | 31.9 (± 0.6) | 46.7(± 1.2) | 46.2 (± 0.8) | |||
| n2 | 0.89 | 0.86 | 0.83 | |||
| χ2 | 3.31 × 10⁻³ | 1.91 × 10⁻³ | 1.51 × 10⁻³ | |||
| Sum of Sqr. | 0.30 | 0.18 | 0.14 |
| Parameters (at 25 oC) |
SAE1020 | c.p. Al | |||
|---|---|---|---|---|---|
| 0 ppm | 500 ppm | 1500 ppm | 0 ppm | 1500 ppm | |
| Rs (Ω.cm2) | 97(± 1) | 162 (± 2) | 88 (± 1) | 25 (± 1) | 23 (± 0.5) |
| ZCPE 1(10−6 F/cm2) | 152.9 (± 2.5) | 11.38 (± 0.4) | 69.97 (± 1.6) | 8.55 (± 0.2) | 6.89 (± 1.2) |
| R1 ( Ω.cm2) | 1560 (± 20) | 583 (± 75) | 2384 (± 67) | 85 (± 14) | 1336 (± 220) |
| n1 | 0.69 | 0.86 | 0.77 | 0.84 | 0.82 |
| ZCPE 2 ( F/cm2) | 11.2 10−3 (± 1) | 7.46 10−6 (± 0.4) | 1.12 10−3 (± 0.1) | 6.75 10−6 (± 0.5) | 2.65 10−6 (± 0.2) |
| R2 (103 Ω.cm2) | 6.2 103 (± 0.1) | 15.18 (± 0.2) | 8.37 (± 1.2) | 24.1(± 0.6) | 37.2 (± 0.9) |
| n2 | 0.81 | 0.86 | 0.59 | 0.81 | 0.85 |
| χ2 | 1.3 × 10⁻³ | 5.7 × 10⁻³ | 1.6 × 10⁻³ | 10 × 10−3 | 9.1× 10⁻³ |
| Sum of Sqr. | 0.12 | 0.55 | 0.17 | 0.87 | 0.85 |
| Concentration (ppm) | Examined Material | η (%) |
|---|---|---|
| 1250 | c.p. Al | ~89 (±2) |
| 1250 | Al-Si alloy | ~96 (±1.5) |
| 625 | ~94 (±1.5) | |
| 500 | SAE 1020 | ~68 (±5) |
| 1500 | ~44 (±3) |
Disclaimer/Publisher’s Note: The statements, opinions and data contained in all publications are solely those of the individual author(s) and contributor(s) and not of MDPI and/or the editor(s). MDPI and/or the editor(s) disclaim responsibility for any injury to people or property resulting from any ideas, methods, instructions or products referred to in the content. |
© 2024 by the authors. Licensee MDPI, Basel, Switzerland. This article is an open access article distributed under the terms and conditions of the Creative Commons Attribution (CC BY) license (https://creativecommons.org/licenses/by/4.0/).


