1. Introduction
Electrochemical detection of hydrogen peroxide (H
2O
2) is a widely used technique in various fields, including analytical chemistry, biochemistry, and environmental monitoring. It relies on the principal of producing a measurable electrical signal due to oxidation and reduction of H
2O
2 at the surface of the electrode. This method is appealing and gaining attention in recent studies over the other traditional techniques like chromatography [
1], colorimetry [
2], fluorimetry [
3] etc. due to its remarkable advantages such as high sensitivity, compatibility, low cost and real time analysis.
Electrochemical detection is usually carried out using enzymatic and non-enzymatic methods. However, enzymatic electrochemical sensors are expensive, less stable due to enzyme denaturation, shows poor reproducibility and require tedious purification process. Because of these drawbacks, the non-enzymatic H
2O
2 electrochemical sensors [
4] are in demand as they offer high reproducibility, selectivity and sensitivity. Moreover, they are more stable, easy to use and inexpensive.
Nowadays, metal oxide nanoparticles are used for H
2O
2 sensors [
5] which offers distinctive catalytic and electrical properties and excellent stability for the redox reaction of hydrogen peroxide. In this respect, bismuth-based materials like bismuth oxide [
6,
7], bismuth chalcogenide [
8,
9,
10,
11] bismuth oxychloride [
12] etc. have gained significant interest in the field of energy storage, photocatalysis and electrochemical sensing applications. Another emerging bismuth containing nanomaterial which shows distinguished thermal, chemical and optoelectronic properties is Bi
2O
2Se. Bismuth oxyselenide is a two-dimensional layered material where [Bi
2O
2]
2+ and Se
2− ions are held together by weak electrostatic forces [
13,
14].
Till date, various synthesis methods have been developed to produce Bi
2O
2Se nanosheets, and among these; chemical vapor deposition [
15], pulsed laser deposition [
16], one-pot hydrothermal method [
17], and solution-phase method [
18] are most popular. In most cases selenourea is utilized as the Se source. In this work, we synthesized Bi
2O
2Se using an approach developed by Chitara et al. [
19,
20] with slight modifications. Here, as a selenium source we used selenium powder in place of selenourea. This modified protocol provided an easy, scalable and cost-effective synthetic recipe to obtain Bi
2O
2Se nanosheets. The use of selenium powder (
$13/g) instead of selenourea (
$93/g) significantly reduces the cost of synthesis. Moreover, the toxicity of selenourea is also significantly higher. Our work also identifies the optimal conditions to grow pure phase Bi
2O
2Se nanosheets from Se powder under mild solution-processing conditions. Furthermore, we explore the efficacy of the intermediate Bi
2O
3/Bi
2O
2Se (or Bi
2O
xSe
y) nanocomposites (prepared by varying the synthesis time from 10 minutes to 7 days) towards H
2O
2 sensing.
2. Material and Methods
2.1. Materials and Reagents
Bismuth nitrate pentahydrate (Bi(NO3)3·5H2O) (Thermo Scientific, USA), hydrazine hydrate (N2H4ꞏH2O, Hydrazine, 64%) (Thermo Scientific, USA), Selenium powder from Alfa Aesar, Potassium hydroxide (Fischer Scientific, USA), Sodium hydroxide (Fischer Scientific, USA), ethylenediaminetetraacetic acid disodium salt (EDTA, Across Organics), Nafion solution (5% in lower alcohols, Sigma Aldrich), Isopropyl alcohol (Merck), De-ionized water (DI water, <18 Ω) were used for the experiments. H2O2 (30%, Fischer Scientific, USA) was used as analyte. Phosphate-buffered saline (PBS, pH 7.4, 1X molarity) was used as an electrolyte medium.
2.2. Synthesis
The Bi2OxSey nanomaterials were synthesized using a solution-phase method at room temperature. 1 g Bi(NO3)3·5H2O was dissolved in 200 ml of deionized water and sonicated for 30 minutes. Then another solution containing 80 mg of selenium powder with 10 ml hydrazine hydrate was added into the bismuth nitrate solution. The solution turns black. In this mixture, 3 g of EDTA was added and the stirring was continued for another 10 minutes. Finally, 1.2 g of KOH and 3.2 g of NaOH was added. The solution was vigorously stirred for certain reaction time. The obtained precipitate was then centrifuged at 5000 rpm, washed with water and ethanol, and dried in an oven at 80 0C. To obtain variable compositions of Bi2O3/Bi2O2Se (Bi2OxSey) nanocomposites, the final reaction time (post addition of KOH and NaOH) was varied viz. 10 minutes, 3 hours, 6 hours, 18 hours, and 7 days. The samples are denoted as BOSe-10 min, BOSe-3 h, BOSe-6 h, BOSe-18 h, and BOSe-7 days, respectively. The instrument details for characterization are provided in the supporting information file (ESI).
2.3. Modification of GCE and Electrochemical Sensing
For H2O2 sensing, we used a 3-electrode configuration with glassy carbon electrode (GCE, 3 mm diameter), platinum wire (Pt) as the counter electrode and Ag/AgCl (3.5 M KCl) as the reference electrode. The voltammetric cell was placed in a cell stand (C3, BAS Inc.) equipped with controlled stirring and Argon gas purging. Cyclic voltammetry (CV), and differential pulse voltammetry (DPV) signals were recorded to examine the sensing performance towards H2O2 and other analytes (uric acid, NaCl, ascorbic acid (AA) and dopamine).
For electrochemical analyses dispersed solutions of the nanocomposites were prepared by mixing 5 mg of the samples in isopropanol/DI water (9:1 ratio), along with 100 μL of Nafion solution as binder. This dispersion (2.5 μL) was then drop cast on polished GCE. For the electrochemical measurements, 15 mL of phosphate buffer saline (PBS 1X, pH 7.4) was taken in the voltammetric cell and purged with argon gas for 30 min, with stirring at 400 rpm. During the electrochemical measurements, the stirring and purging was momentarily paused to record the CV and DPV scans. The potential window was 0.6 to -0.9 V vs Ag/AgCl. The scan rate used was 10 mV/s. The pulse parameters for DPV, i.e., height, width, period and increment were 50 mV, 0.01 s, 0.1 s and 10 mV, respectively. The DPV scans were recorded without applying any inversion during the cathodic and anodic sweeps. The initial CV and DPV scans of the electrode, in blank electrolyte, i.e., without dopamine addition were performed, prior to sensing tests. 150 µL of H2O2 from 2 µM stock solution was added. The effective concentration of H2O2 in the electrolyte was 100 times lower. Purging and stirring were continued for 5 min for each addition of H2O2. The stock solutions of 2, 20, 200, 1000 and 10000 µM were used for H2O2 sensing. The effective concentration at each addition of H2O2 was calculated and used in the sensitivity (S) and limit of detection (LOD) evaluation.
For the selectivity tests, analytes of 10 mM concentrations (stock) were used. 150 µL of these stock solutions were sequentially added. The concentration of the interferant analytes (uric acid, NaCl, AA and dopamine) was purposefully kept high to study the efficacy of the sample towards H2O2 detection.
3. Results and Discussion
3.1. Structural and Morphological Characterization
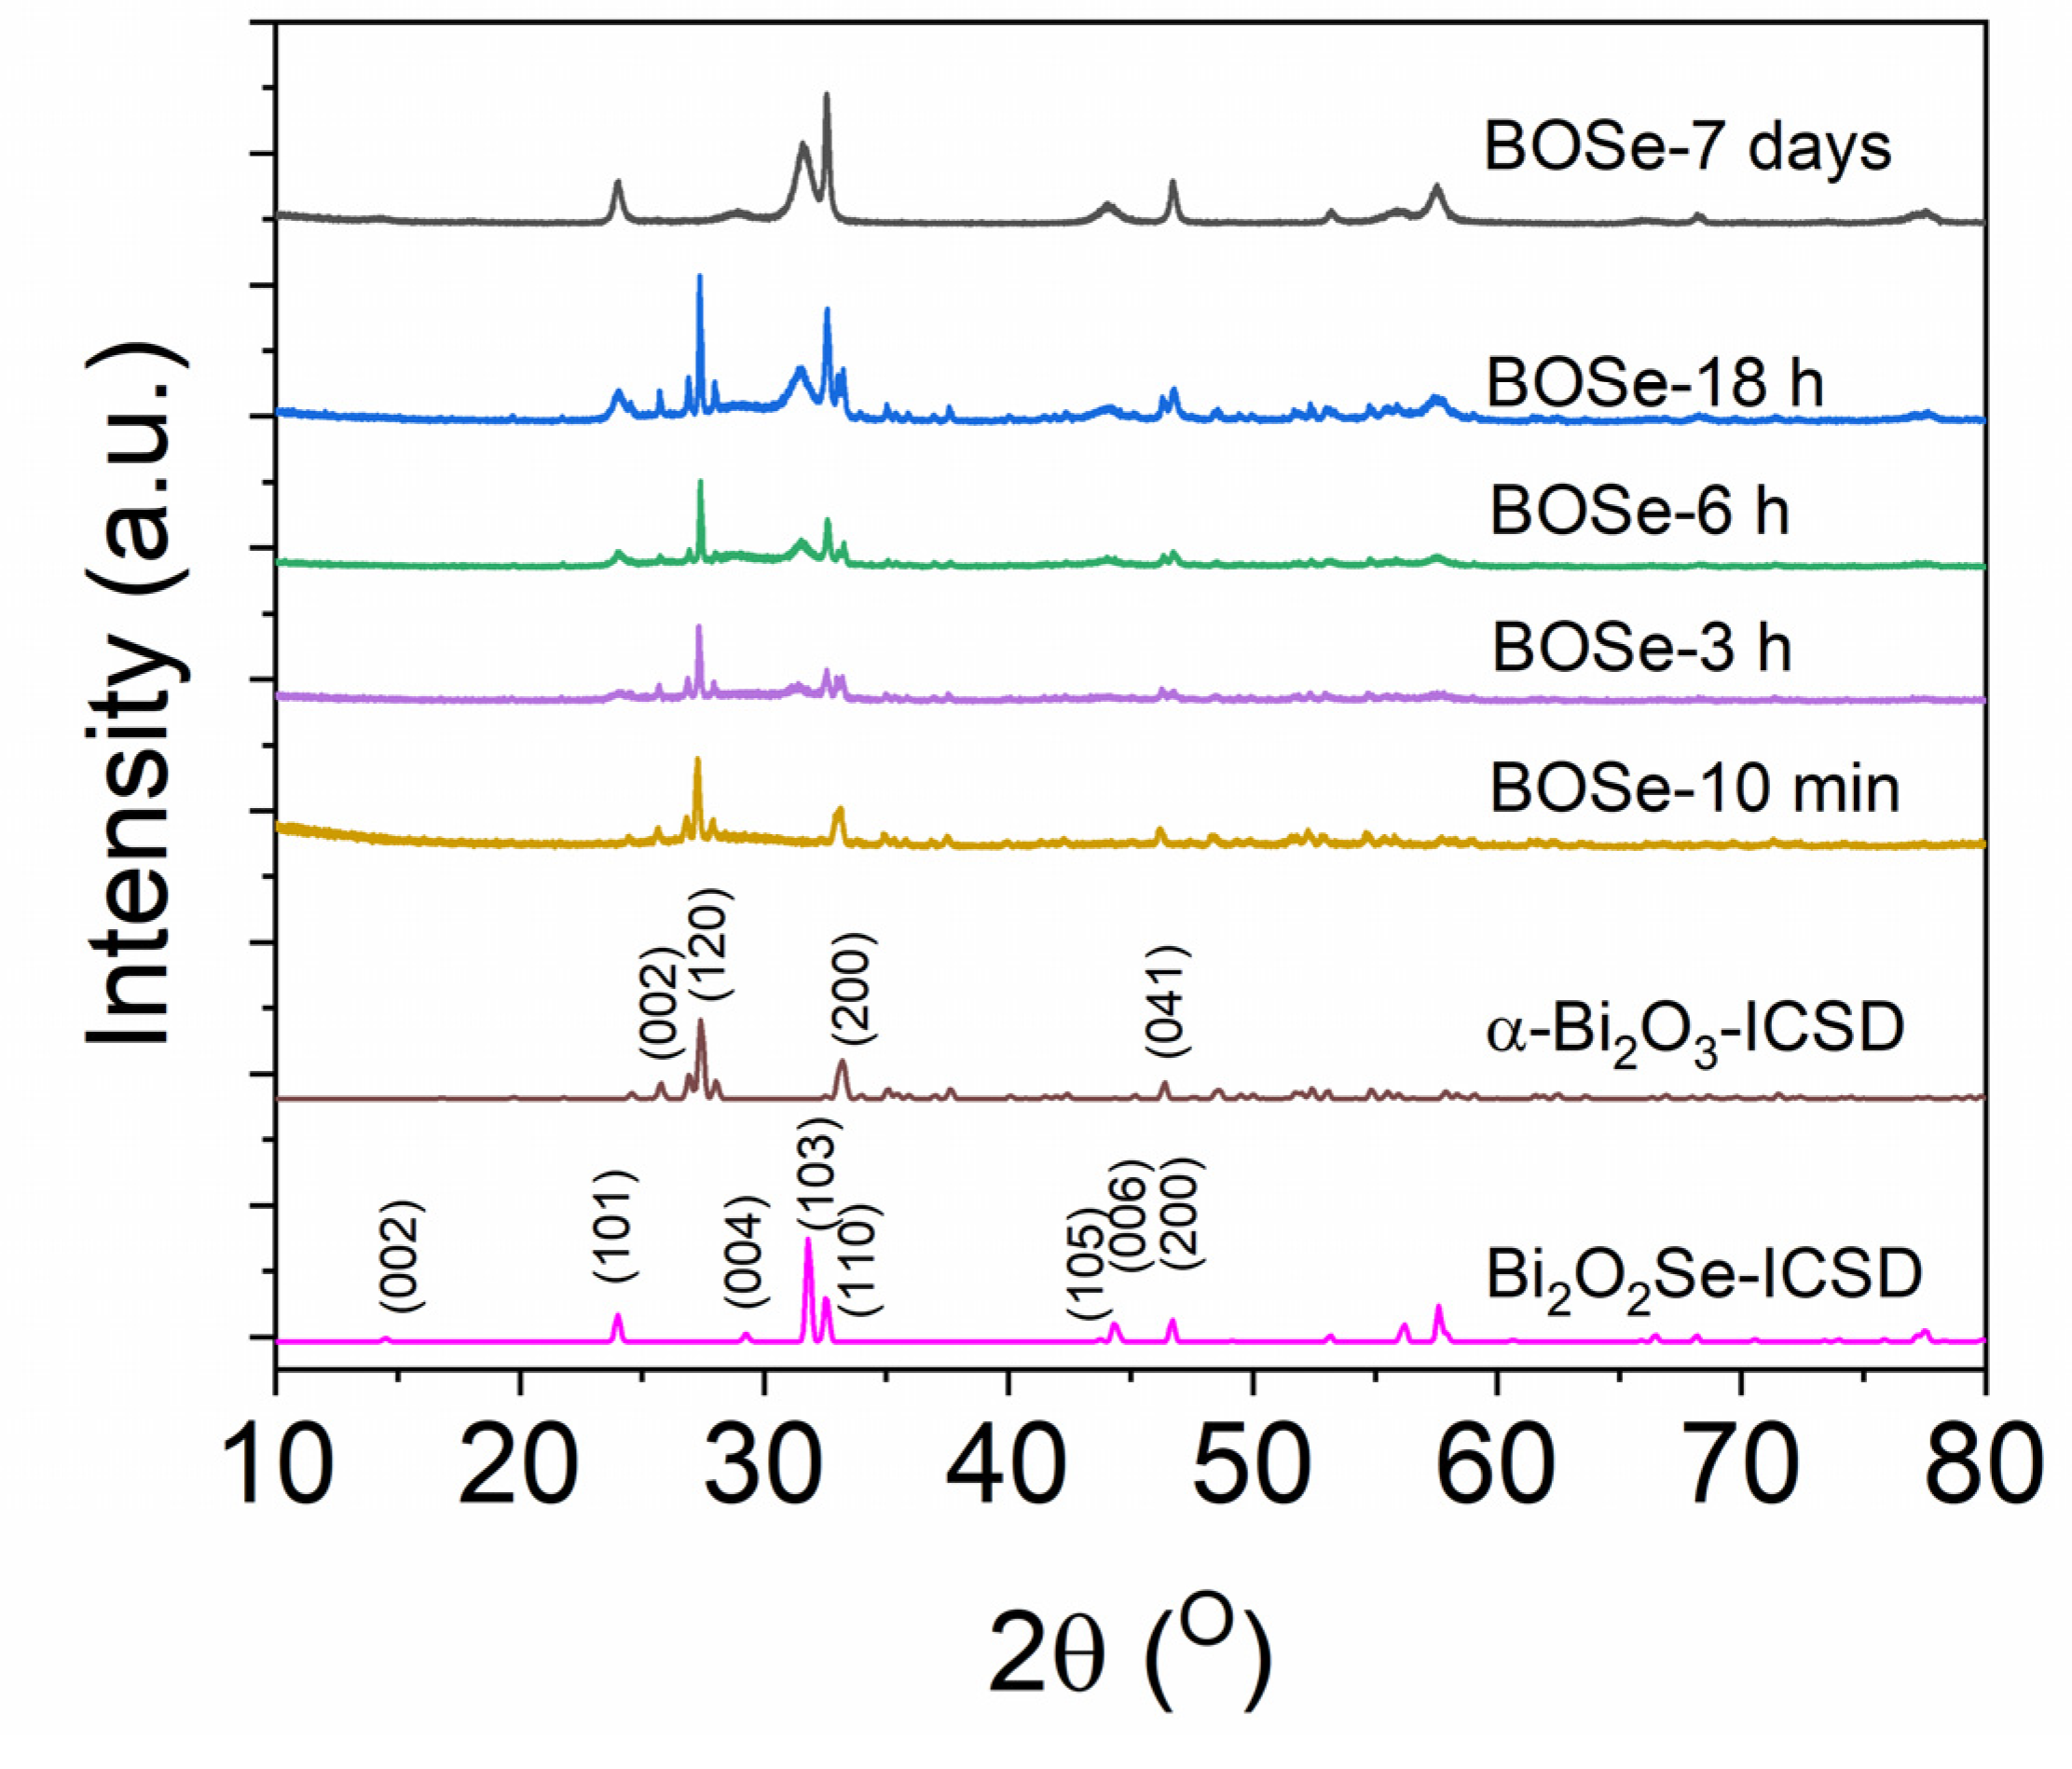
The powder XRD patterns are shown in
Figure 1. The standard data from Inorganic Crystal Structure Database (ICSD) are also provided for reference. The sample prepared with reaction time of 10 min, showed the formation of α-Bi
2O
3 (ICSD code: 2374), i.e., monoclinic structure with Space group
P 121/c1. With increasing reaction time, the formation of Bi2O2Se-type phase is observed. The intensity of the Bi2O2Se component increases with longer reaction time and finally at 7 days, it completely transforms into single phase. The crystal structure of the Bi2O2Se is tetragonal (I 4/mmm space group, ICSD code: 2903) similar to that reported by Ghosh et al. [
18]. For simplicity we refer to intermediate nanocomposite with varying Se content as Bi
2O
xSe
y.
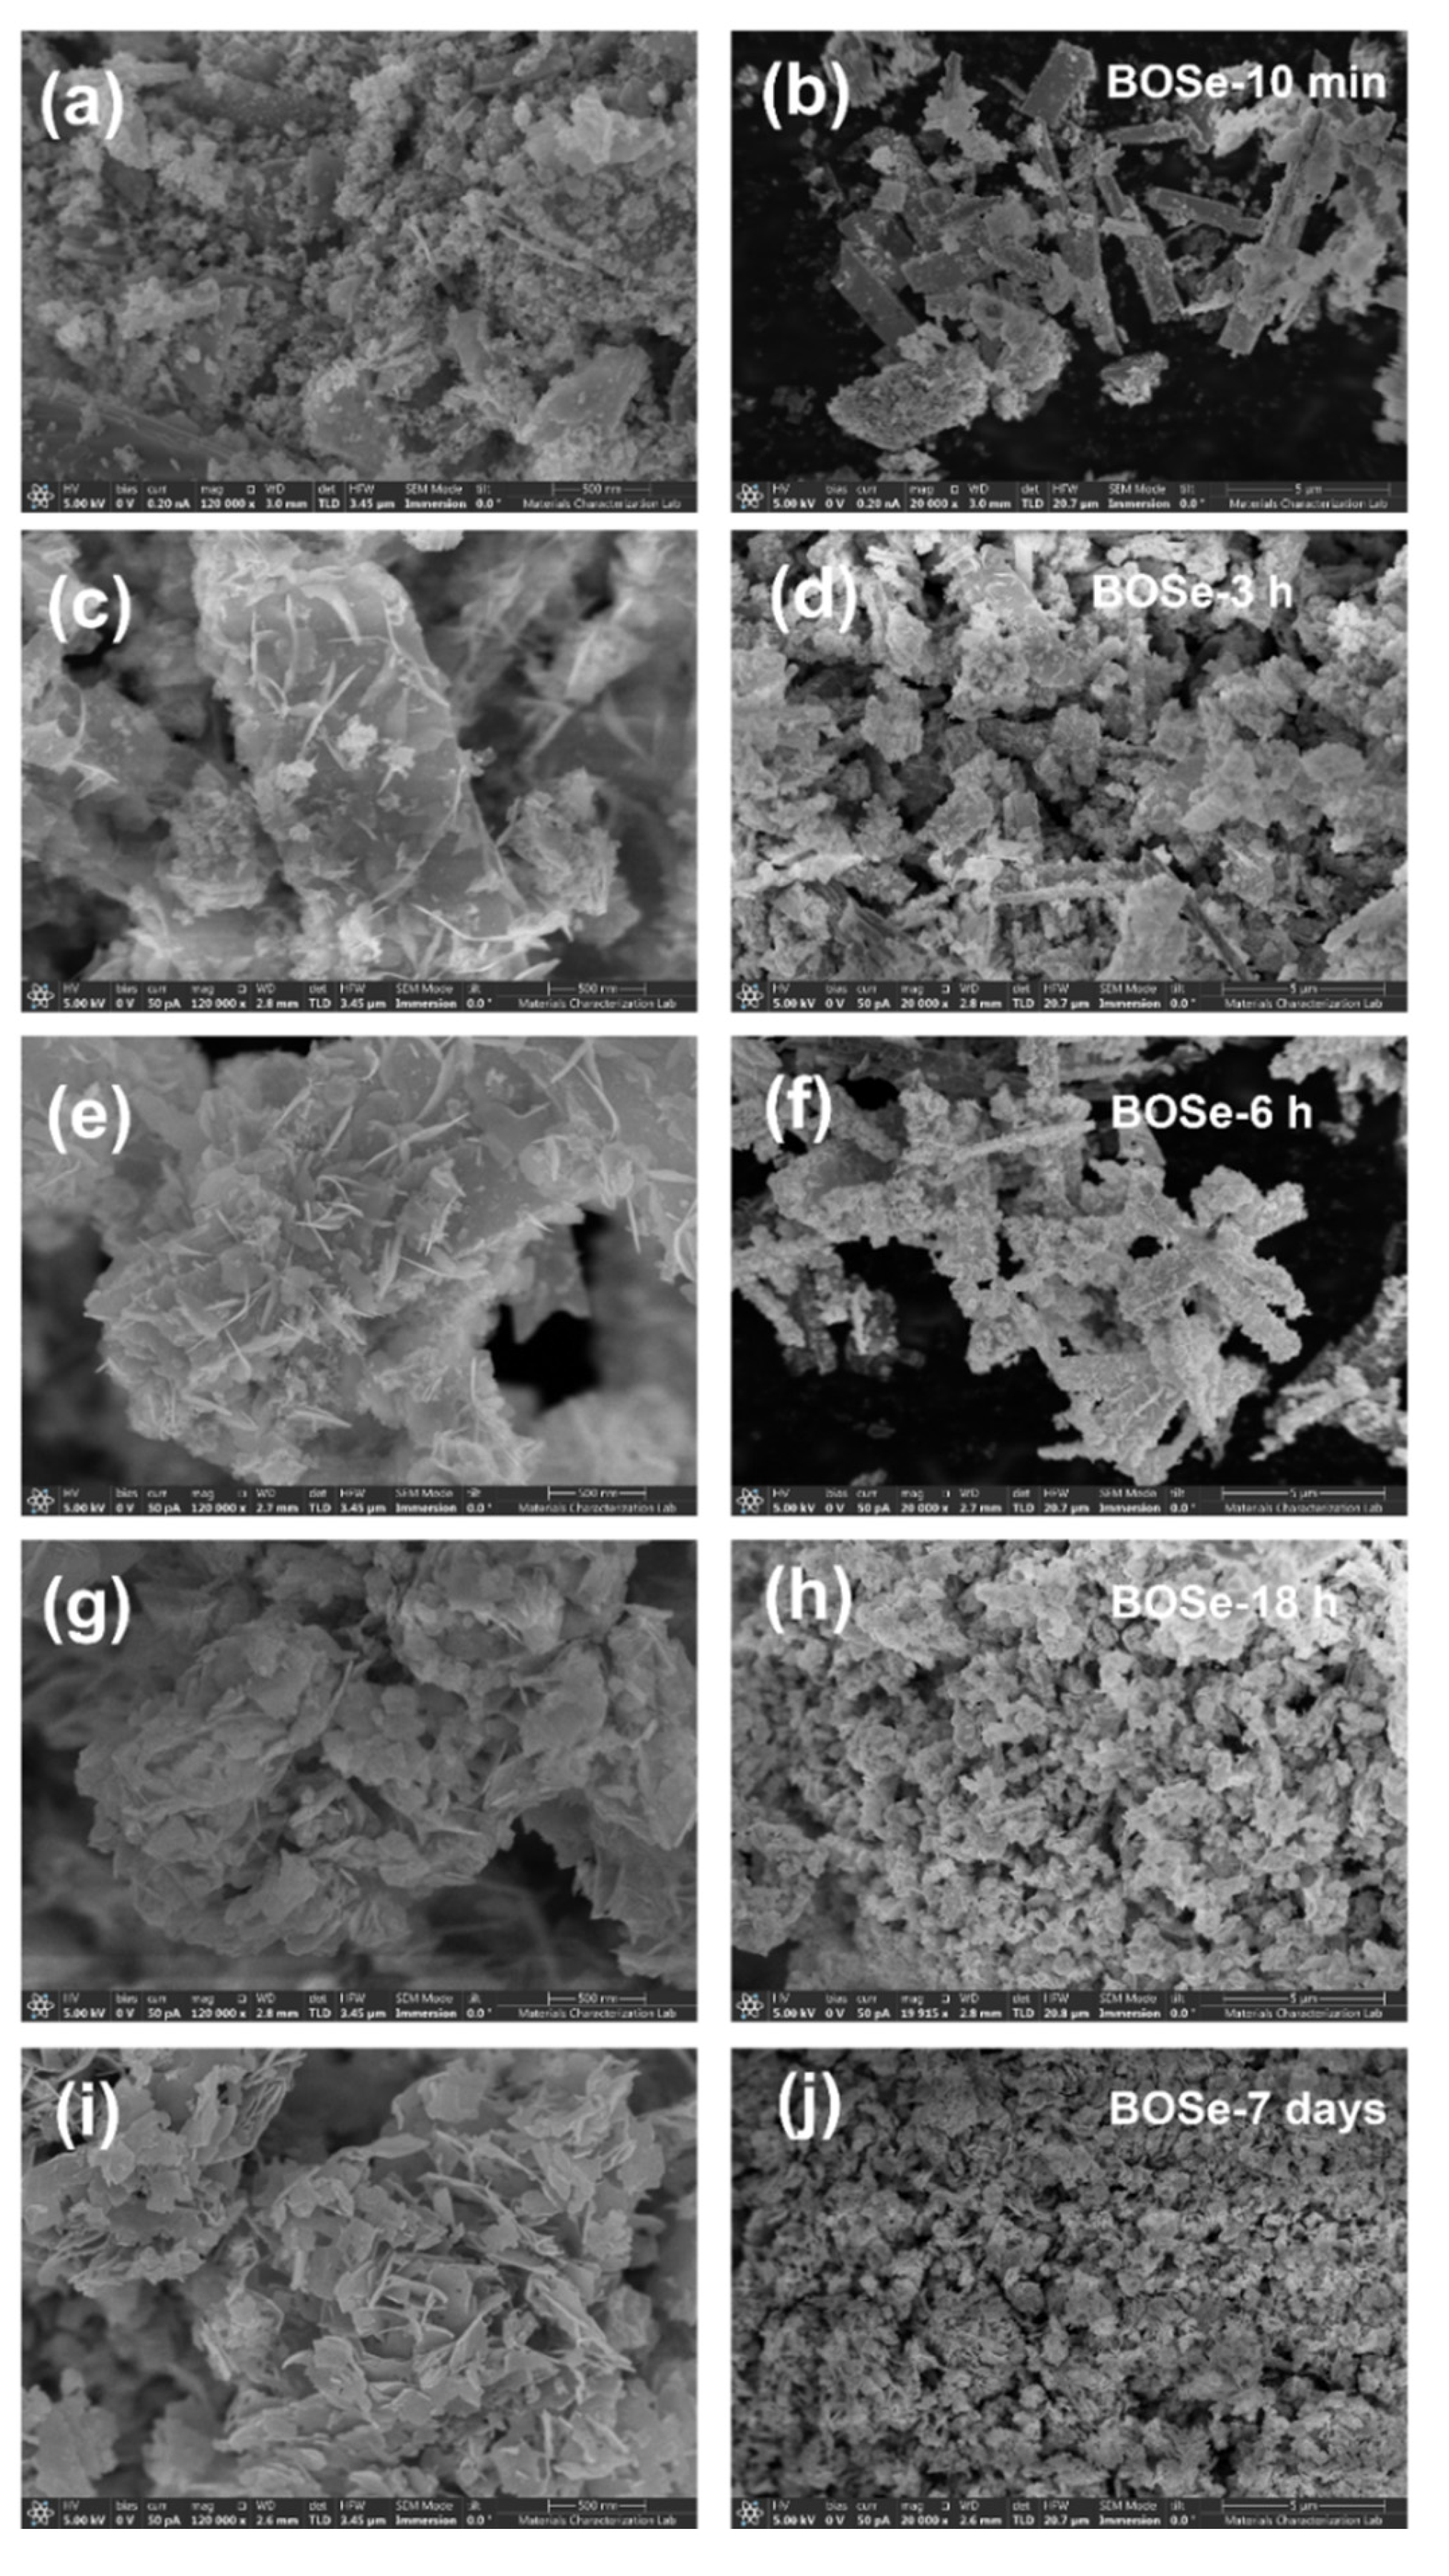
The FE-SEM images at two different scales are shown in
Figure 2. The BOSe-10 min sample has predominant micron-size rod-like structures with very fine agglomerates on the surface. The lack of sheet structure indicates absence of any Bi
2O
2Se. With increased reaction time (BOSe-3 and 6 h), the sheets appear to evolve from the surface of these rod-like structures. At around 18 h, the rods completely transform into agglomerated sheet-like structures. The sheets become well defined for BOSe-7 days, indicating complete transformation to Bi
2O
2Se. The elemental mapping and EDX analyses for the representative BOSe-6 h and BOSe-7 days are provided in
Figures S2 and S3 and
Tables S1 and S2 in the ESI. Clearly, the elemental analyses for BOSe-7 days sample shows good match with the expected stoichiometry of Bi
2O
2Se. The BOSe-6 h sample has much lower Se content, in line with inference from XRD. The XPS analysis for this sample is also provided as
Figure S4 and
Table S3 in ESI, which could possibly be more accurate than EDX.
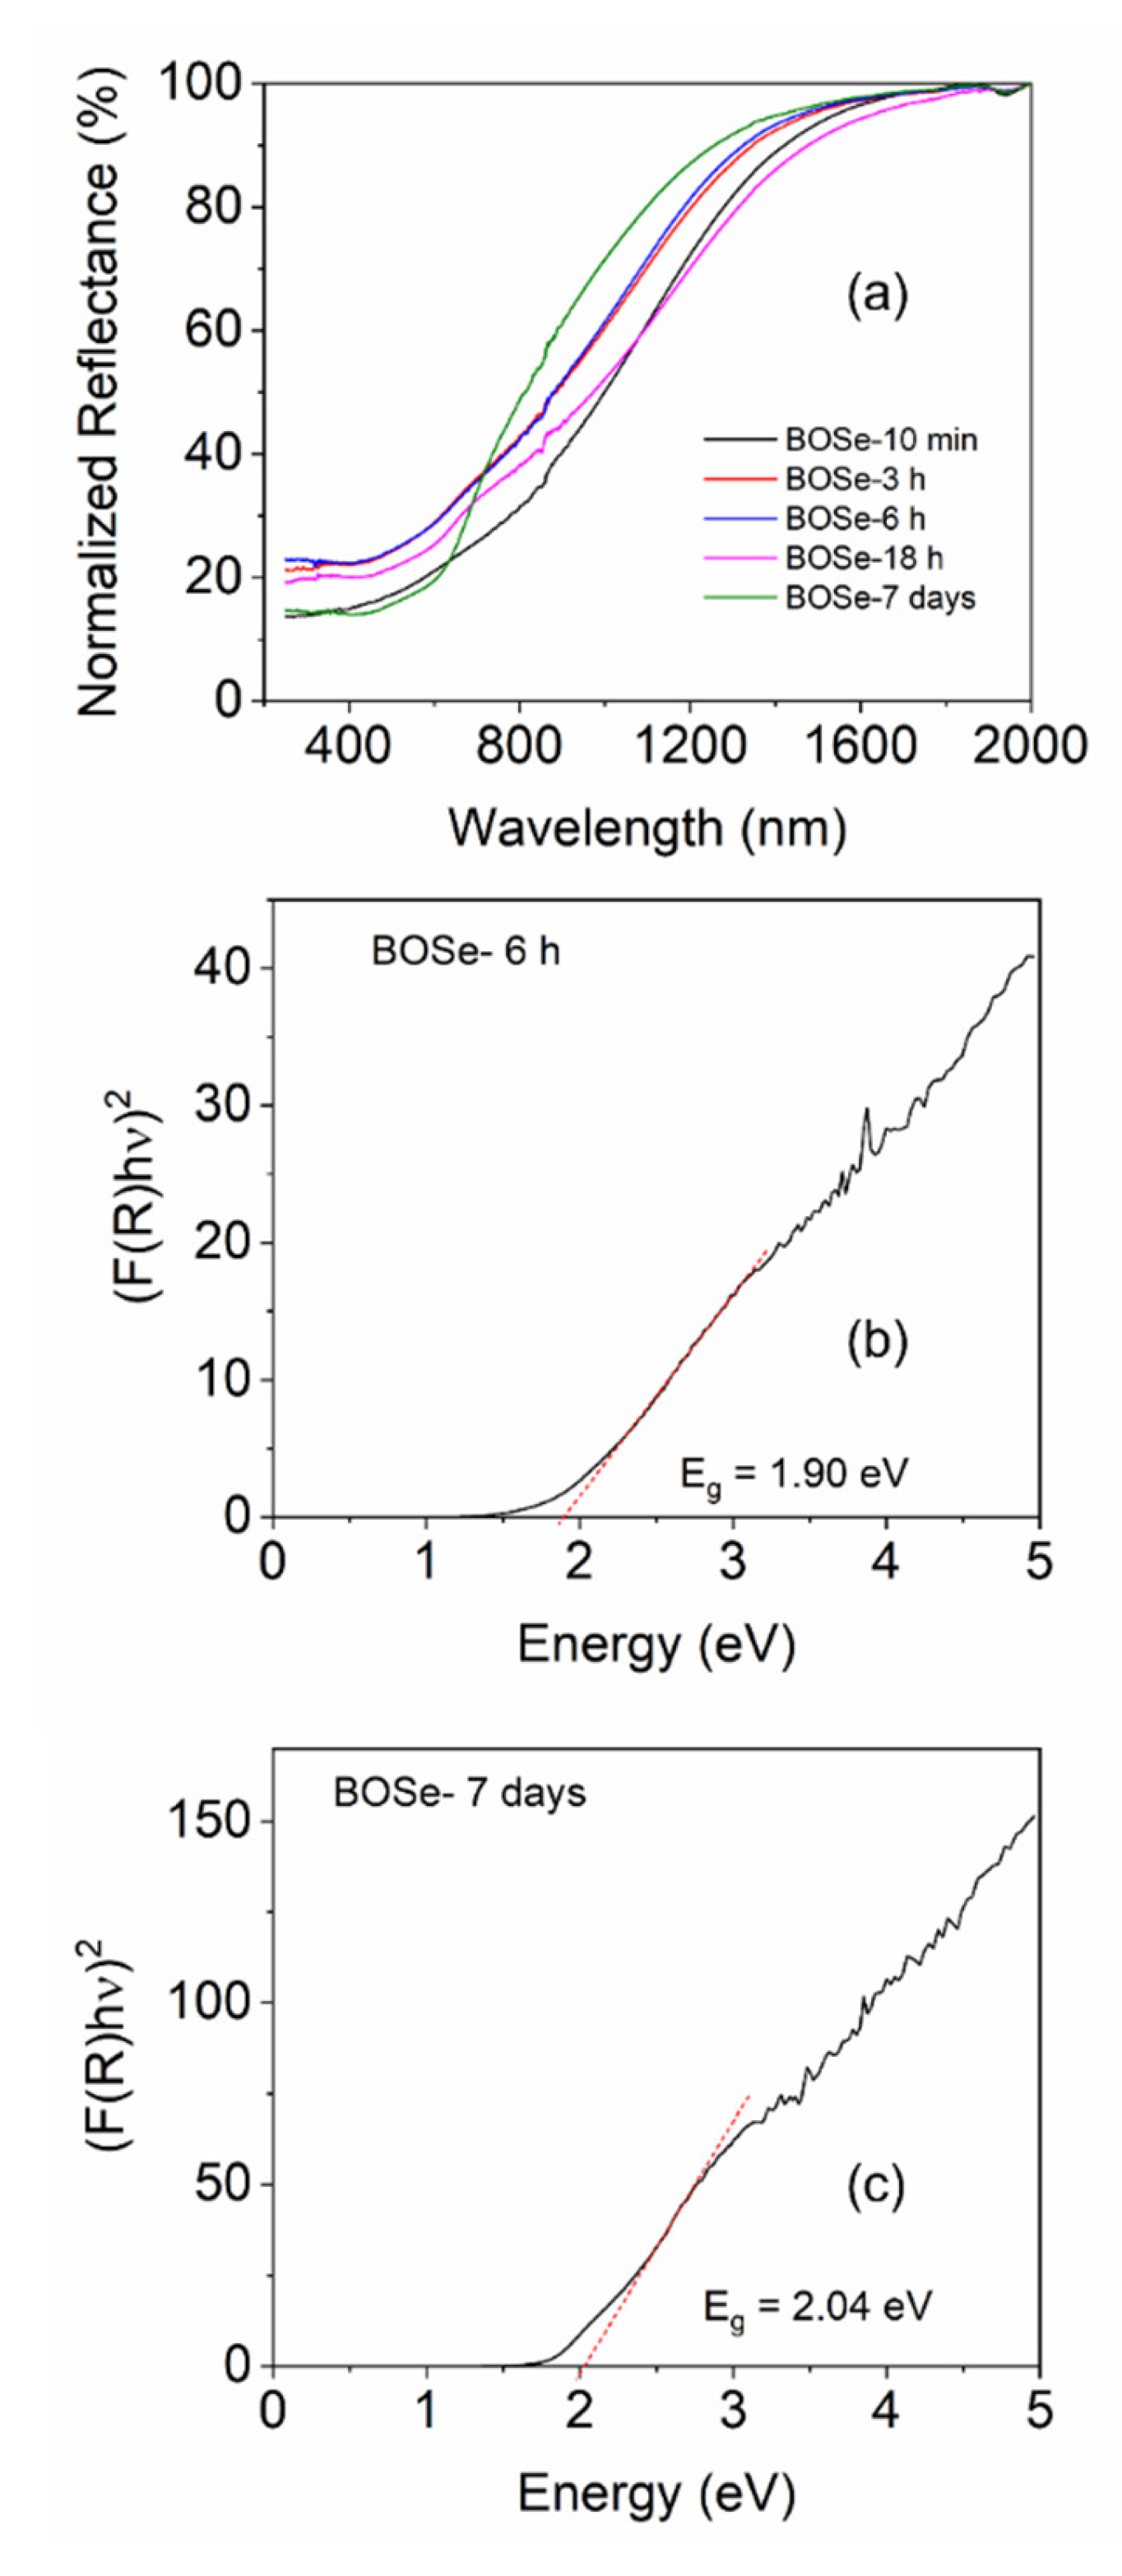
The normalized UV-Vis-NIR diffuse reflectance spectra (UV-Vis-NIR DRS) of the samples are shown in
Figure 3. The BOSe-7 days sample shows slightly different reflectance pattern (indicating a different phase) than others. The composite samples show higher absorption in the NIR region, but lower absorption in the UV-visible region. Nevertheless, the band edge is similar, leading to similar direct band gaps which are estimated using the Kubelka-Munk function [
21,
22]. Interestingly, from the Tauc plots we can observe a slightly higher area below the linear region, for BOSe- 6h which indicates slightly higher proportion of defects in this sample compared to BOSe-7 days. This is understandable considering more interfaces for the nanocomposite.
3.2. Growth Mechanism
Based on the evidence from XRD, SEM, EDX and XPS we can hypothesize the growth mechanism of the Bi
2O
xSe
y samples with this synthesis protocol. Equations (1)–(4), shown below, indicate the possible chemical reactions involved in the formation of Bi
2O
2Se nanosheets, similar to that suggested by Chitara et al. [
19]. According to their mechanism, Bi(NO
3)
3 can undergo hydrolysis to produce BiONO
3. Furthermore, Selenium powder is reduced by hydrazine to produce Se
2− ions in highly alkaline medium. Finally, the self-assembly of the oppositely charged (Bi
2O
2)
2+ and Se
2− layers results in the formation of Bi
2O
2Se nanosheets.
Based on our evidence in this work, it appears that this mechanism may not be complete. We suggest that the availability of Se2- ions could be a rate limiting factor and the replacement of the Se2- ions may be much slower, unlike previously anticipated. Therefore, we can expect the following two outcomes:
Large availability of Se
2-
Another possible route could be through the formation of hydroxide or oxyhydroxide, as below:
However, more work needs to be done to prove the mechanism, which will be undertaken in future.
3.3. Electrochemical Sensing Performance
The CV and DPV scans were performed to analyze the sensitivity by applying a potential from 0.6 to -0.9 V against Ag/AgCl electrode. 150 µL of hydrogen peroxide solution with different concentrations (ranging from 2-10000 µM stock) were then added into 15 mL of argon purged PBS (pH 7.4, 1X). The effective concentrations were calculated to range from 0.02 to 88.2 µM. In between each addition, stirring and purging was employed to help mixing and maintaining the inert atmosphere inside the cell. For each composite, before addition of H
2O
2 blank reading, i.e., without H
2O
2 was performed.
Figure S1 (ESI) depicts the cyclic voltammograms of the different samples. The change in the redox peak patterns is clearly visible among the samples and also with increasing H
2O
2 additions. However, we refrain from in-depth evaluation of sensitivity (S) and LOD using CV as the peak patterns are complex with multiple peaks.
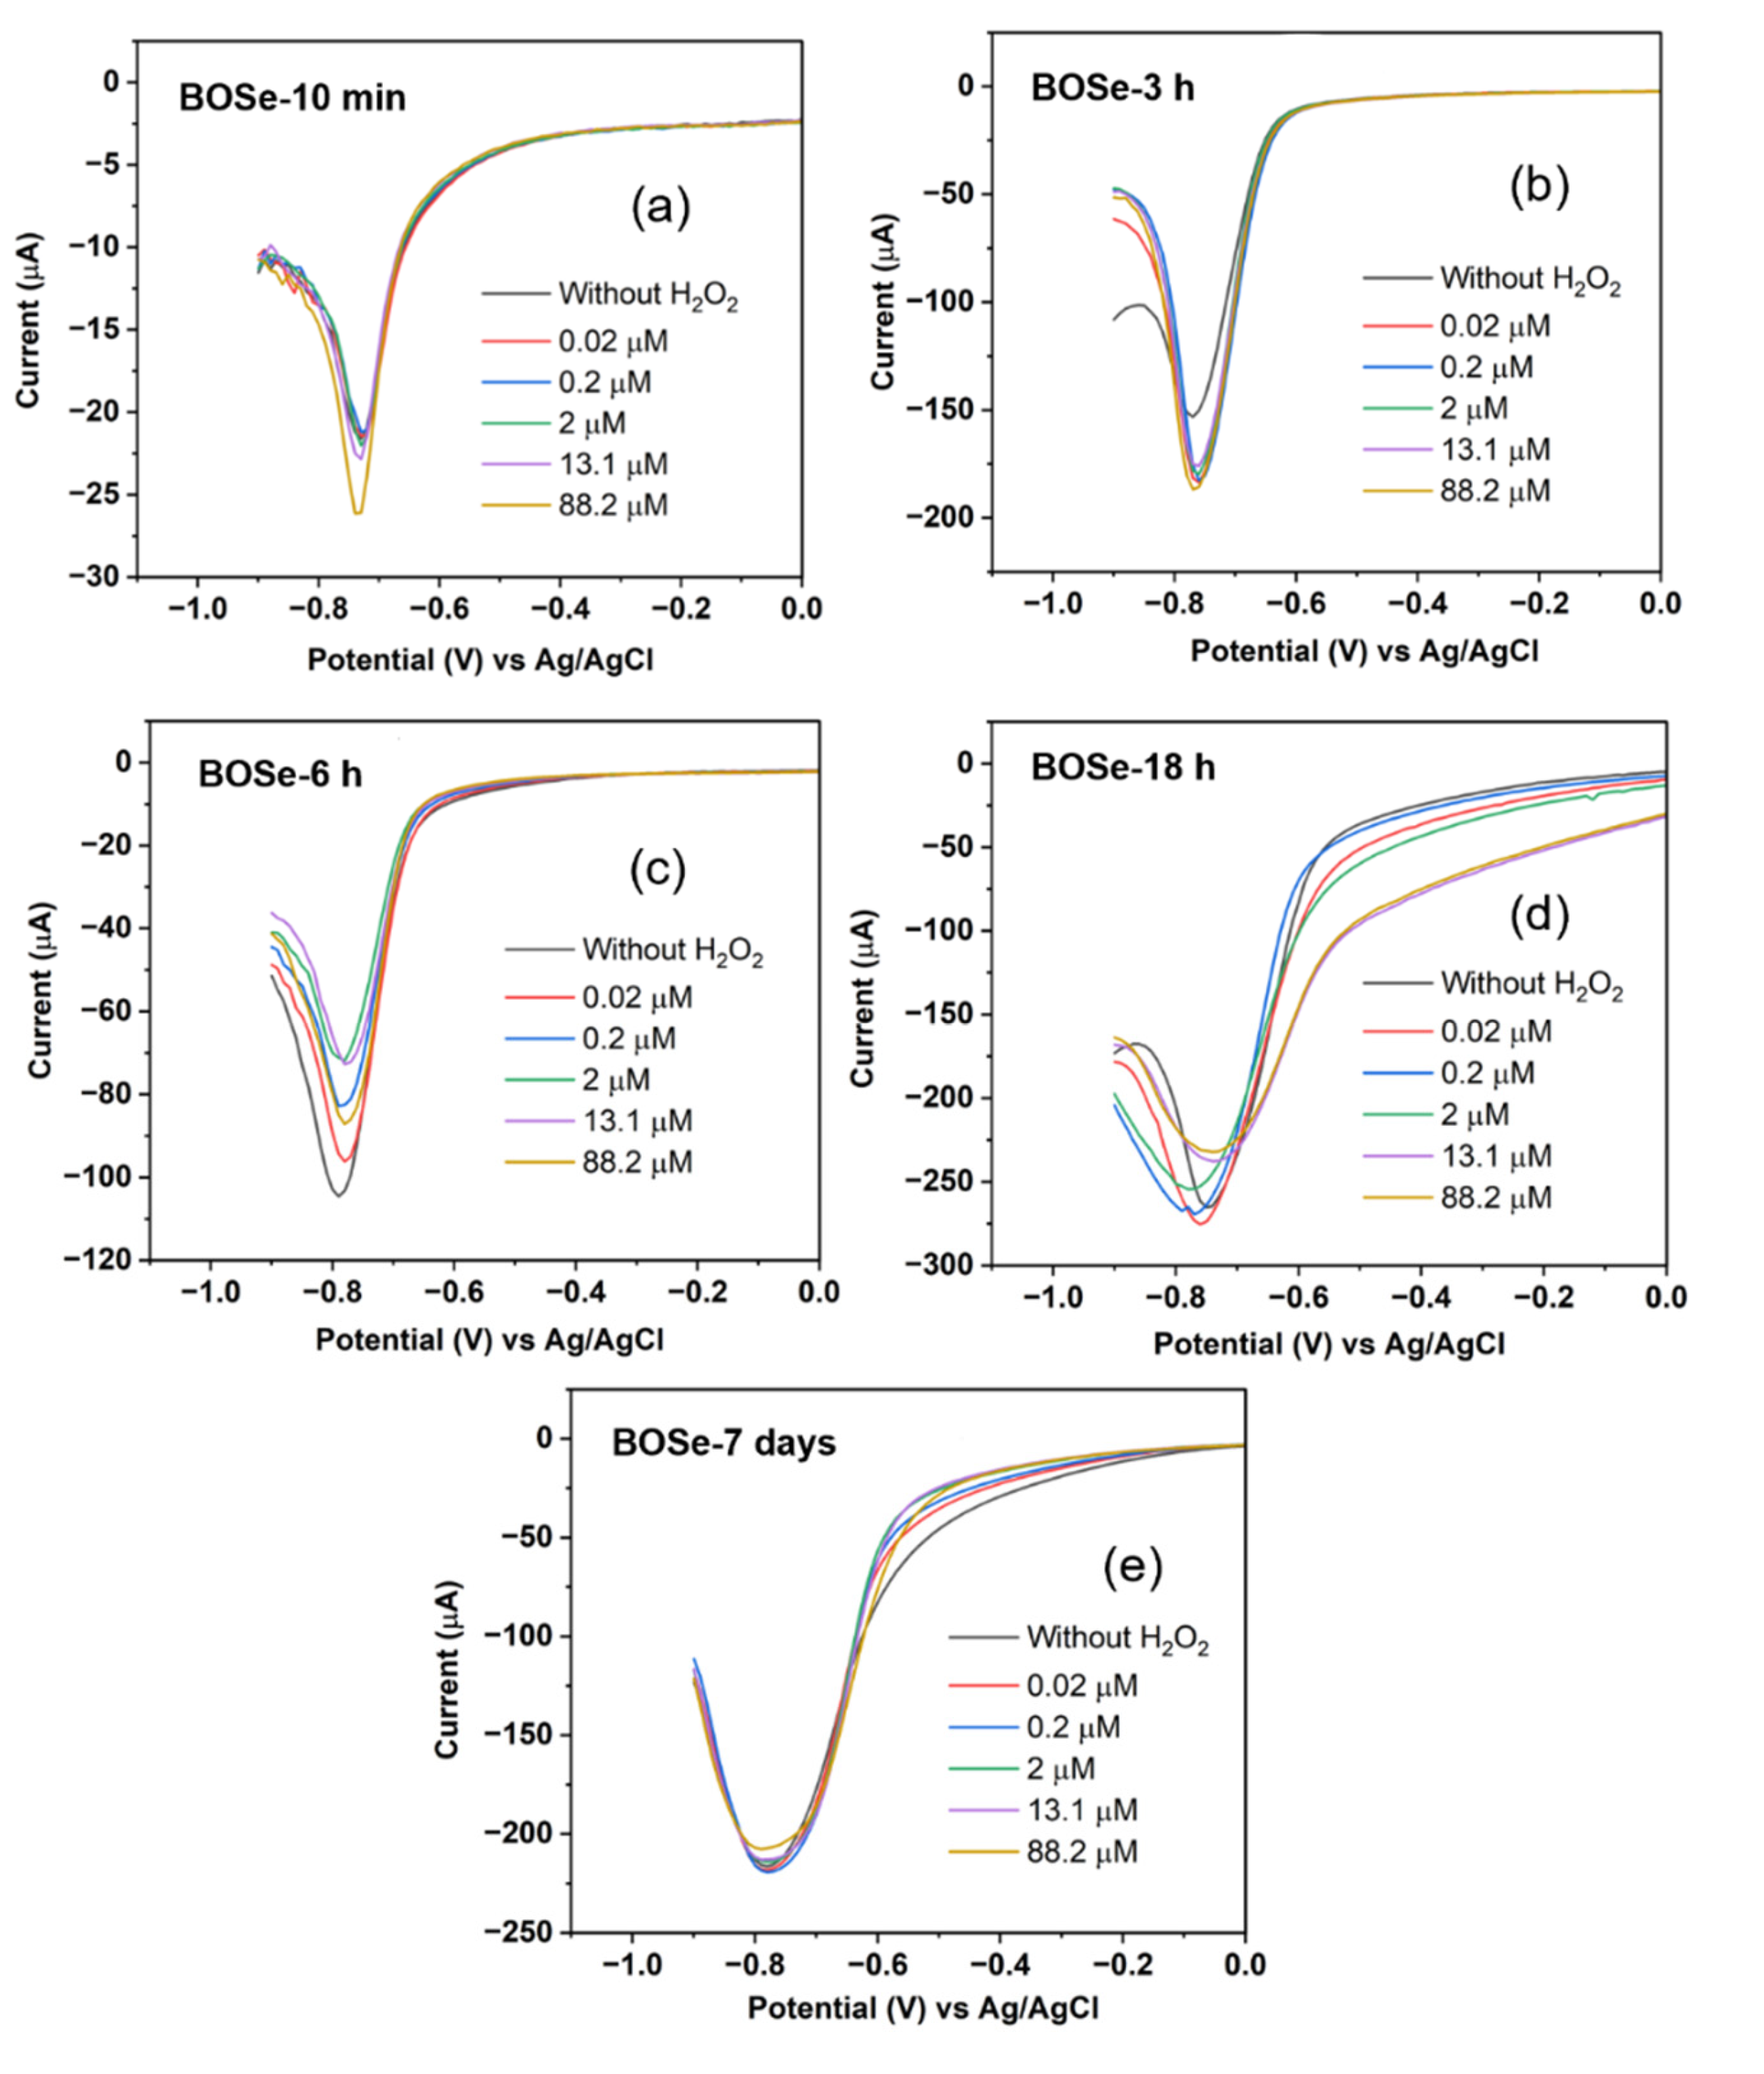
The DPV technique is more sensitive than CV [
23] as it excludes the capacitive contribution. The changes in the current values become significant even at low concentrations. Moreover, in this work (
Figure 4), the peak profile is highly simplified (a single peak in the potential window of 0 to -0.9 V) unlike CV. Therefore, for the evaluation of sensitivity (S) and limit of detection (LOD), we consider the DPV scans with this peak centered around -0.75 V. The LOD and S can be obtained from the plot of the peak current with respect to the concentration of H
2O
2 [
23,
24], as per the equations below.
where, σ is the standard deviation of the response, k is the slope of the linear fits, and A is the area of the working electrode in cm
2.
The evaluated sensitivity and LOD values are given in
Table 1. The BOSe-6 h sample shows the highest sensitivity of 152.7 µA µM
-1 cm
-2 and a low LOD of 1.62 µM. The linear range was found to be 0.02–15 µM. It is interesting to note that the sensitivity values are significantly less for the sample prepared in 10 min (final stirring post addition of KOH and NaOH) and pure phase Bi
2O
2Se. These results clearly indicate that the efficacy of the composite Bi
2O
xSe
y (in particular with reaction time of 6 h) is much higher as compared to the pure phase Bi
2O
2Se, towards H
2O
2 sensing.
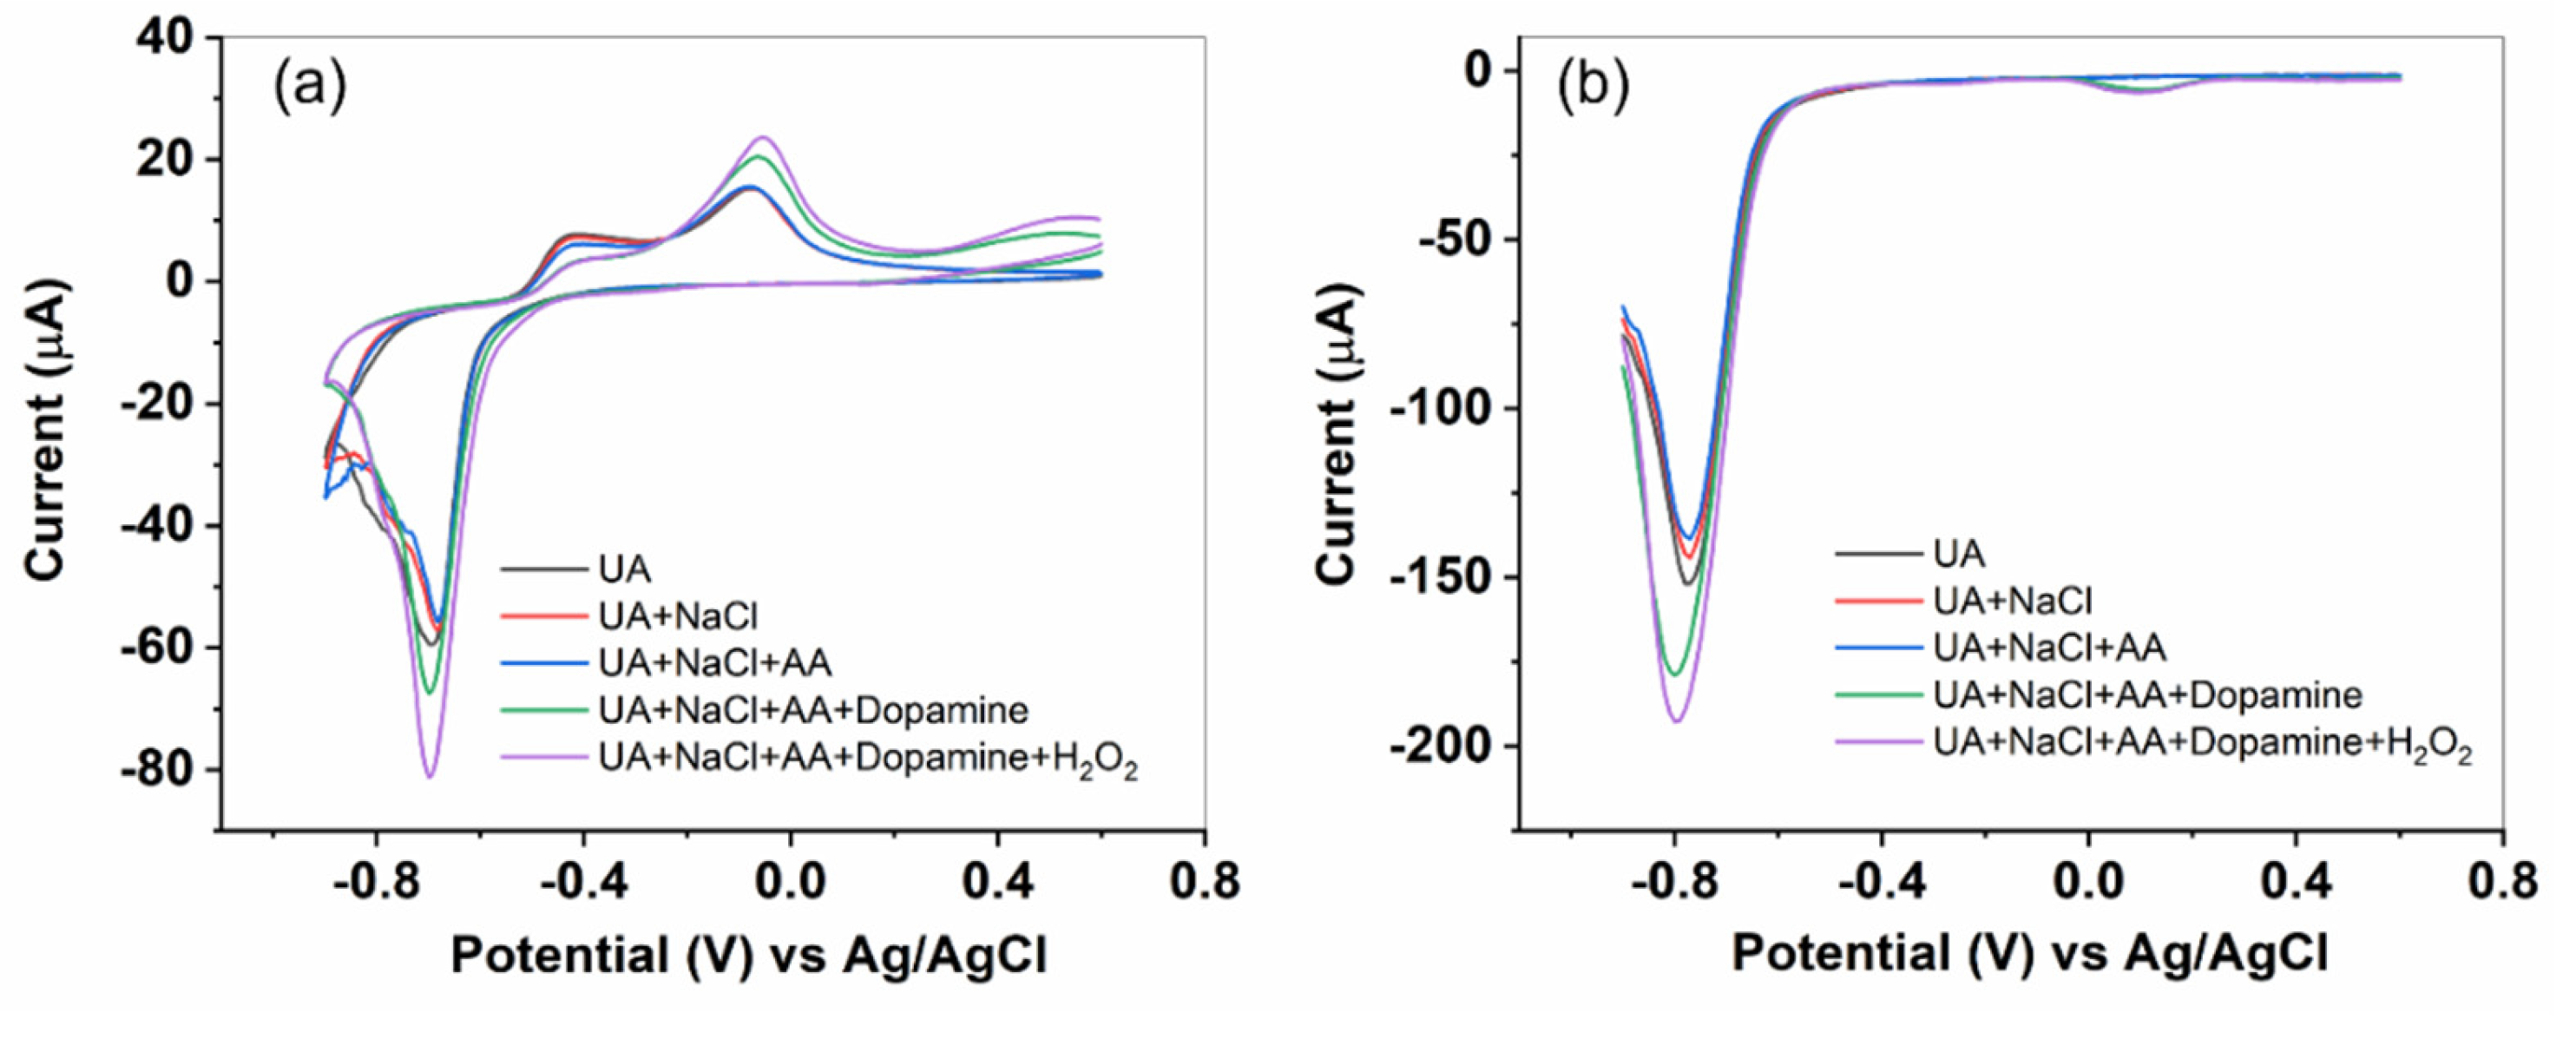
For the selectivity test, we utilize the BOSe-6 h sample. CV and DPV scans were recorded with sequential addition of the high concentration of interfering analytes in the same electrolyte. As seen in
Figure 5, the addition of uric acid, NaCl and Ascorbic acid shows negligible change in the current signal. However, we observe some change when dopamine is added. The DPV peak response for dopamine is usually around 0 V (a small signal is observed,
Figure 5 (b)). The change is more significant with H
2O
2 addition (around -0.8 V), indicating a higher selectivity for H
2O
2 over dopamine.
4. Conclusion
Bi2OxSey nanocomposites with varying Se content were successfully synthesized using a solution-phase method by varying the reaction time. Morphological and structural characterization confirm the progressive changes occur in the nanocomposites with increasing reaction time. The evidence suggests transformation of α-Bi2O3 rods to Bi2O2Se nanosheets. Electrochemical studies performed using CV and DPV showed that Bi2O3/Bi2O2Se nanocomposites with an optimum reaction time of 6 hours, demonstrates remarkable sensitivity (152.7 µA µM-1 cm-2) and selectivity towards H2O2 and can be a potential non-enzymatic sensor.
Supplementary Materials
The following supporting information can be downloaded at the website of this paper posted on Preprints.org.
Acknowledgments
F.Y. acknowledges support from the U.S. National Science Foundation (NSF) under grant #DMR-2122044 and the U.S. Army Research Office (ARO) under grant # W911NF2210109. The authors are also thankful to Materials Characterization Laboratory-Pennsylvania State University (Prof. Jeffrey Shallenberger, Julie Marie Anderson, and Jordan Meyet) for helping with XPS, SEM-EDX and UV-Vis-NIR DRS measurements. The authors are also grateful to SMIF-Duke University for the powder XRD measurements.
References
- Eisenberg, G. Colorimetric Determination of Hydrogen Peroxide. Ind. Eng. Chem. Anal. Ed. 1943, 15, 327–328. [Google Scholar] [CrossRef]
- Ito, E.; Watabe, S.; Morikawa, M.; Kodama, H.; Okada, R.; Miura, T. Detection of H2O2 by Fluorescence Correlation Spectroscopy. In Methods in Enzymology; Elsevier, 2013; Vol. 526, pp. 135–143 ISBN 978-0-12-405883-5.
- Dhara, K.; Mahapatra, D.R. Recent Advances in Electrochemical Nonenzymatic Hydrogen Peroxide Sensors Based on Nanomaterials: A Review. Journal of Materials Science 2019, 54, 12319–12357. [Google Scholar] [CrossRef]
- Thatikayala, D.; Ponnamma, D.; Sadasivuni, K.; Cabibihan, J.-J.; Al-Ali, A.; Malik, R.; Min, B. Progress of Advanced Nanomaterials in the Non-Enzymatic Electrochemical Sensing of Glucose and H2O2. Biosensors 2020, 10, 151. [Google Scholar] [CrossRef] [PubMed]
- Qian, H.; Liu, Y.; Chen, H.; Feng, K.; Jia, K.; Pan, K.; Wang, G.; Huang, T.; Pang, X.; Zhang, Q. Emerging Bismuth-Based Materials: From Fundamentals to Electrochemical Energy Storage Applications. Energy Storage Materials 2023, 58, 232–270. [Google Scholar] [CrossRef]
- Jiang, C.; Fei, Y.-F.; Xu, W.; Bao, Z.; Shao, Y.; Zhang, S.; Hu, Z.-T.; Wang, J. Synergistic Effects of Bi2O3 and Ta2O5 for Efficient Electrochemical Production of H2O2. Applied Catalysis B: Environmental 2023, 334, 122867. [Google Scholar] [CrossRef]
- Guan, Y.; Deng, Q.; Wang, J.; Wang, S.; Li, Z.; He, H.; Yan, S.; Zou, Z. Carbonized Polymer Dots/Bi/β-Bi2O3 for Efficient Photosynthesis of H2O2 via Redox Dual Pathways. Langmuir 2023, 39, 18060–18072. [Google Scholar] [CrossRef]
- Fan, H.; Zhang, S.; Ju, P.; Su, H.; Ai, S. Flower-like Bi2Se3 Nanostructures: Synthesis and Their Application for the Direct Electrochemistry of Hemoglobin and H2O2 Detection. Electrochimica Acta 2012, 64, 171–176. [Google Scholar] [CrossRef]
- Othmani, A.; Derbali, M.; Kalfat, R.; Touati, F.; Dhaouadi, H. A Novel 1D/2D Bi2S3/g-C3N4 Core–Shell Nanocomposite as a Highly Performing H2O2 Non-Enzymatic Electrochemical Sensor. Journal of Materials Research and Technology 2021, 15, 5762–5775. [Google Scholar] [CrossRef]
- Kulkarni, S.S.; Wu, C.T.; Sridhar, V.; Ponnusamy, V.K.; Chattopadhyay, S. Bi2Te3-Au Nanocomposite Schottky Junction with Peroxidase Activity for Glucose Sensing. ACS Applied Nano Materials 2022, 5, 15563–15573. [Google Scholar] [CrossRef]
- Zhao, F.; Zhou, S.; Zhang, Y. Ultrasensitive Detection of Hydrogen Peroxide Using Bi2te3electrochemical Sensors. ACS Applied Materials and Interfaces 2021, 13, 4761–4767. [Google Scholar] [CrossRef]
- Hao, L.; Huang, H.; Guo, Y.; Du, X.; Zhang, Y. Bismuth Oxychloride Homogeneous Phasejunction BiOCl/Bi12O17Cl2 with Unselectively Efficient Photocatalytic Activity and Mechanism Insight. Applied Surface Science 2017, 420, 303–312. [Google Scholar] [CrossRef]
- Bae, J.K.; Cho, H.H.; Shin, H.; Kim, Y.; Ko, H.; Lee, S.J.; Megersa, D.D.; Gudena, G.T.; Chae, S.; Cho, I.S.; et al. One-Step Synthesis of Bi2O2Se Microstructures for Trace Oxygen Gas Sensor Application. Sensors and Actuators B: Chemical 2023, 394, 134398. [Google Scholar] [CrossRef]
- Chitara, B.; Dimitrov, E.; Liu, M.; Seling, T.R.; Kolli, B.S.C.; Zhou, D.; Yu, Z.; Shringi, A.K.; Terrones, M.; Yan, F. Charge Transfer Modulation in Vanadium-Doped WS2/Bi2O2Se Heterostructures. Small 2023, 19, 2302289. [Google Scholar] [CrossRef]
- Song, Y.; Li, Z.; Li, H.; Tang, S.; Mu, G.; Xu, L.; Peng, W.; Shen, D.; Chen, Y.; Xie, X.; et al. Epitaxial Growth and Characterization of High Quality Bi2O2Se Thin Films on SrTiO3 Substrates by Pulsed Laser Deposition. Nanotechnology 2020, 31, 165704. [Google Scholar] [CrossRef] [PubMed]
- Li, M.Q.; Dang, L.Y.; Wang, G.G.; Li, F.; Han, M.; Wu, Z.P.; Li, G.Z.; Liu, Z.; Han, J.C. Bismuth Oxychalcogenide Nanosheet: Facile Synthesis, Characterization, and Photodetector Application. Advanced Materials Technologies 2020, 5, 2000180. [Google Scholar] [CrossRef]
- Sun, Y.; Ye, S.; Zhang, J.; Song, J.; Zhou, F.; Qu, J. Lithium Nitrate-Assisted Hydrothermal Synthesis of Ultrathin Bi2O 2Se Nanosheets and Their Photoelectrochemical Performance. J. Mater. Chem. C 2020, 8, 14711–14717. [Google Scholar] [CrossRef]
- Ghosh, T.; Samanta, M.; Vasdev, A.; Dolui, K.; Ghatak, J.; Das, T.; Sheet, G.; Biswas, K. Ultrathin Free-Standing Nanosheets of Bi2O2Se: Room Temperature Ferroelectricity in Self-Assembled Charged Layered Heterostructure. Nano Letters 2019, 19, 5703–5709. [Google Scholar] [CrossRef]
- Chitara, B.; Limbu, T.B.; Orlando, J.D.; Vinodgopal, K.; Yan, F. 2-D Bi2O2Se Nanosheets for Nonenzymatic Electrochemical Detection of H2O2. IEEE Sensors Letters 2020, 4. [Google Scholar] [CrossRef]
- Chitara, B.; Shringi, A.K.; Roy, B.; Wu, M.H.; Yan, F. Facile Synthesis and Morphology-Induced Photoconductivity Modulation of Bi2O2S Nanostructures. Materials Letters 2023, 346, 134545. [Google Scholar] [CrossRef]
- Mahour, L.N.; Choudhary, H.K.; Kumar, R.; Anupama, A.V.; Sahoo, B. Structural, Optical and Mössbauer Spectroscopic Investigations on the Environment of Fe in Fe-Doped ZnO (Zn1-xFexO) Ceramics Synthesized by Solution Combustion Method. Ceramics International 2019, 45, 24625–24634. [Google Scholar] [CrossRef]
- Kumar, A.; Kumar, R.; Verma, N.; Anupama, A.V.; Choudhary, H.K.; Philip, R.; Sahoo, B. Effect of the Band Gap and the Defect States Present within Band Gap on the Non-Linear Optical Absorption Behaviour of Yttrium Aluminium Iron Garnets. Optical Materials 2020, 108, 110163. [Google Scholar] [CrossRef]
- Two-Dimensional, F.; Kumar Shringi, A.; Kumar, R.; Dennis, N.F.; Yan, F. Two-Dimensional Tellurium Nanosheets for the Efficient Nonenzymatic Electrochemical Detection of H2O2. Chemosensors 2024, Vol. 12, Page 17 2024, 12, 17. [Google Scholar] [CrossRef]
- Baluta, S.; Meloni, F.; Halicka, K.; Szyszka, A.; Zucca, A.; Pilo, M.I.; Cabaj, J. Differential Pulse Voltammetry and Chronoamperometry as Analytical Tools for Epinephrine Detection Using a Tyrosinase-Based Electrochemical Biosensor. RSC Advances 2022, 12, 25342–25353. [Google Scholar] [CrossRef] [PubMed]
|
Disclaimer/Publisher’s Note: The statements, opinions and data contained in all publications are solely those of the individual author(s) and contributor(s) and not of MDPI and/or the editor(s). MDPI and/or the editor(s) disclaim responsibility for any injury to people or property resulting from any ideas, methods, instructions or products referred to in the content. |
© 2024 by the authors. Licensee MDPI, Basel, Switzerland. This article is an open access article distributed under the terms and conditions of the Creative Commons Attribution (CC BY) license (http://creativecommons.org/licenses/by/4.0/).
