Preprint
Article

Metabolic Response to Cropping Pattern in Saffron (Crocus sativus L.)

Altmetrics

Downloads

74

Views

30

Comments

0

Submitted:

30 August 2024

Posted:

02 September 2024

You are already at the latest version

Alerts
Abstract
Considering the prevalence of cropping pattern in many Saffron cultivation regions, the continuous cropping obstacle caused the decline in growth and development. These effects justify the necessity of studying agronomic strategies to promote plant quality and production. Herein, the mono cropping, intercrop of Paulownia and Saffron, and intercrop of Soybean and Saffron patterns have been performed. The metabolites of Saffron under three cropping patterns were determined and identified using by an ultra-performance liquid chromatography-tandem mass spectrometry (UPLC-MS/MS) method. Uni and multivariate statistical analysis were applied to examine the difference between groups and select the significant differential accumulated metabolites. The results showed that a total of 315 compounds were significantly changed in three comparison groups. Phenylalanine metabolism, linoleic acid metabolism, and flavonoid biosynthesis pathway has been greatly enriched by the changed metabolites. The phenyl lactate, trans-2-Hydroxy-cinnamate, γ-Linolenate, 9-oxo-octadecadienoic acid, 13-0xo-0ctadecadienoic acid, 9,12,13-TriHOME of those metabolites showed significant differential accumulation in Saffron under three cropping patterns. And the accumulation of safranal and picrocrocin related compounds, such as Crocetin, Crocin showed a similar variation regularity. These indicate that there may be a close internal relationship between the cropping pattern and the biosynthesis of metabolites related to endogenous substances and Saffron quality formation.
Keywords: 
Subject: Biology and Life Sciences  -   Horticulture

1. Introduction

Saffron (Crocus sativus L.), an autumn-flowering species of the Iridaceae family, is a perennial, stemless herb which probably originated in Greece, Asia Minor, and Persia since the Late Bronze Age with subsequent spread to Asia [1,2,3]. It is introduced and cultivated in the north China with blood circulation and hypoglycemic effect since the middle of last century [1]. The Saffron is suitable for the arid and semi-arid regions characterized by low rainfall, hot summers, and dry cold winters [1,4]. The dry stigmata of Saffron represents the new demand of pharmacological emerge for constituting of the most efficient officinal components [3]. And its production, quality, and officinal function has been affected by cropping patterns [5,6,7,8,9,10]. However, continuous cropping barrier has been the major issue, puzzling the corms variety degeneration, Saffron production, and stigma quality for the limited planting area [11]. Therefore, diverse planting systems have been conducted.
In Sardinia, the cultivation of Saffron is followed by broad beans, chickpeas and lentils cultivations for increasing soil fertility, thereby increasing yield and quality [15]. Faba bean determined the high performance in terms of Saffron flower number and stigma yield under Faba bean-Saffron crop rotation pattern in Italy [2]. Saffron in Abruzzo are recorded as the highest world productions [5]. In the west of Pamir Plateau, planting of almond trees at 6 m × 6 m spacing is advocated for shading Saffron, and Saffron fields are kept fallow in the first year, a wheat or mustard crop is grown in the second year followed by replanting of Saffron [7]. In Saffron, high density planting, planting depth, and manure affect flower number, stigma yield, and biosynthesis of second metabolites of stigma [12,13,14,15,16,17]. Saffron corms are planted in ridge and furrow cultivation in the field area Taliouine [12]. The application of plant growth promoting rhizobacteria (PGPR) and the strain FZB24®of Bacillus subtilis provides benefits to increase stigma biomass yield and higher levels of crocin, crocetin, picrocrocin, and safranal of those secondary metabolites [13,14]. The optimal planting density is a combination of row spacing and planting distance on rows, is crucial in optimizing the yield of stigma [15]. The use of animal manure in high-density Saffron cultivation resulted in the highest number of flowers and yield of Saffron and stigma [15,16,17]. Since 1965, Saffron caught the attention of scientists from china, it began to step into a long road introduction and cultivation. Saffron has been cultivated adopting by ‘indoor –field’ and rice-xerophyte rotation cropping pattern in the middle and lower reaches of Yangtze River (Chongming Island, Shanghai Municipality, 31°39′59″N, 121°28′30″E; Jiande, Zhejiang Province, 29°32′34″N, 119°36′51″E; Xiuzhou, Zhejiang, Province, 30°39′41″N, 120°42′58″E) [18,19,20,21,22]. In the north China plain (Qiaocheng, Anhui province, 33°37′33″N, 115°39′33″E; Yongcheng, Henan Province, 33°92′92″N, 116°44′95″E), vast plain provides possibility of field production for Saffron cultivation. Maize-Saffron and Soybean-Saffron rotation has been certified to be a high optimized cropping pattern [23]. While, the east of Pamir Plateau, an innovative walnut intercropping Saffron pattern has been tested in Xinjiang Region of China. The results showed that the contents of crocin, the effective components, and the total glycoside content, the seed ball yield, filament yield and quality of Saffron was significant higher than that of annual crop cycle [24].
A part of the north China plain, Bozhou city, is one of the main grain producing districts of China. Soybean has been extensively hybridized and cultivated here. And Paulownia is one of the indigenous tree species which exhibits many excellent characteristics such as broad adaptability to environment and short growth period. Due to suitable water and nutrient conditions, herbs have been large-scale cultivated, Bozhou is also known as the largest herb-growing and trading regions of China. Therein, the area covered by Saffron plantations has reached 600 ha. The annual cycle, grain-Saffron rotation, and intercropping patterns are the probable cropping methods of Saffron here. However, limited research has characterized the metabolic responses of Saffron to different cropping pattern for optimizing planting system of Saffron. Therefore, the mono cropping, Paulownia intercropping, and Soybean intercropping are three patterns have been conducted in our study.
In current plant studies, the application of metabolomics approach has been widespread and significant investigate the molecular biological mechanism. Metabolites, the final products of gene transcription, formed the material basis of all organismal phenotypes [25,26]. It can help us to characterize the activities of compounds at the functional level, providing a great theoretical impact on our understanding of metabolic pathways in processes of plant development [27,28]. Hence, by considering the most effective method, we used ultra-performance liquid chromatography-tandem mass spectrometry (UPLC-MS/MS) to describe the metabolomics in stigmas of Saffron. Analysis of metabolome was performed for detecting the relative content of metabolites of stigmas under three cropping patterns. Uni and multivariate statistical analysis were applied to examine the difference between groups and select the significant differential accumulated metabolites. R software was used to conduct PCA analysis, HCA analysis, and data visualization. Finally, the metabolic response to cropping pattern was revealed preliminarily, through analyzing the link between the two. It is meaningful to reference to optimize the cropping system of Saffron.

2. Materials and Methods

2.1. Study Area and Experiment Design
Field experiment were established at Qiaocheng in Bozhou, Anhui Province of China at 115°39′33″E and 33°37′33″N. Temperature annual average is 15 o C and the minimum and maximum temperature are -3 o C and 32 o C, respectively. The average annual precipitation is 867.2 mm, the annual average sunshine duration is 2040.9 h, and 219 days in the year are frost-free. The soil texture was silty-loam in experimental site.
The selected corms had the average weight of 20.50 g (12.3-37.9 g), 3.48 cm (2.5-4.5 cm) in diameter with non pests. Three cropping patterns were performed. The Saffron corms were planted at 15 cm × 30 cm spacing and a depth of 10 cm on 30 June 2023 (CK group). The soybean seeds were sowed at 25 cm × 70 cm spacing on April 2023, and Saffron corms were planted according to the density levels as the mentioned above (SS group) [15]. Planting of Paulownia trees (tree-age, 8 years; crown density, 32%) at 6 m × 5 m spacing on March 2015, and Saffron corms were planted as the mentioned above (SP group) [7,15]. Samples were set for CK_vs_SP, CK_vs_SS, and SP_vs_SS as three comparative groups for comparing the difference of Saffron under three cropping patterns. Three biological replicates were used for each group of sample.
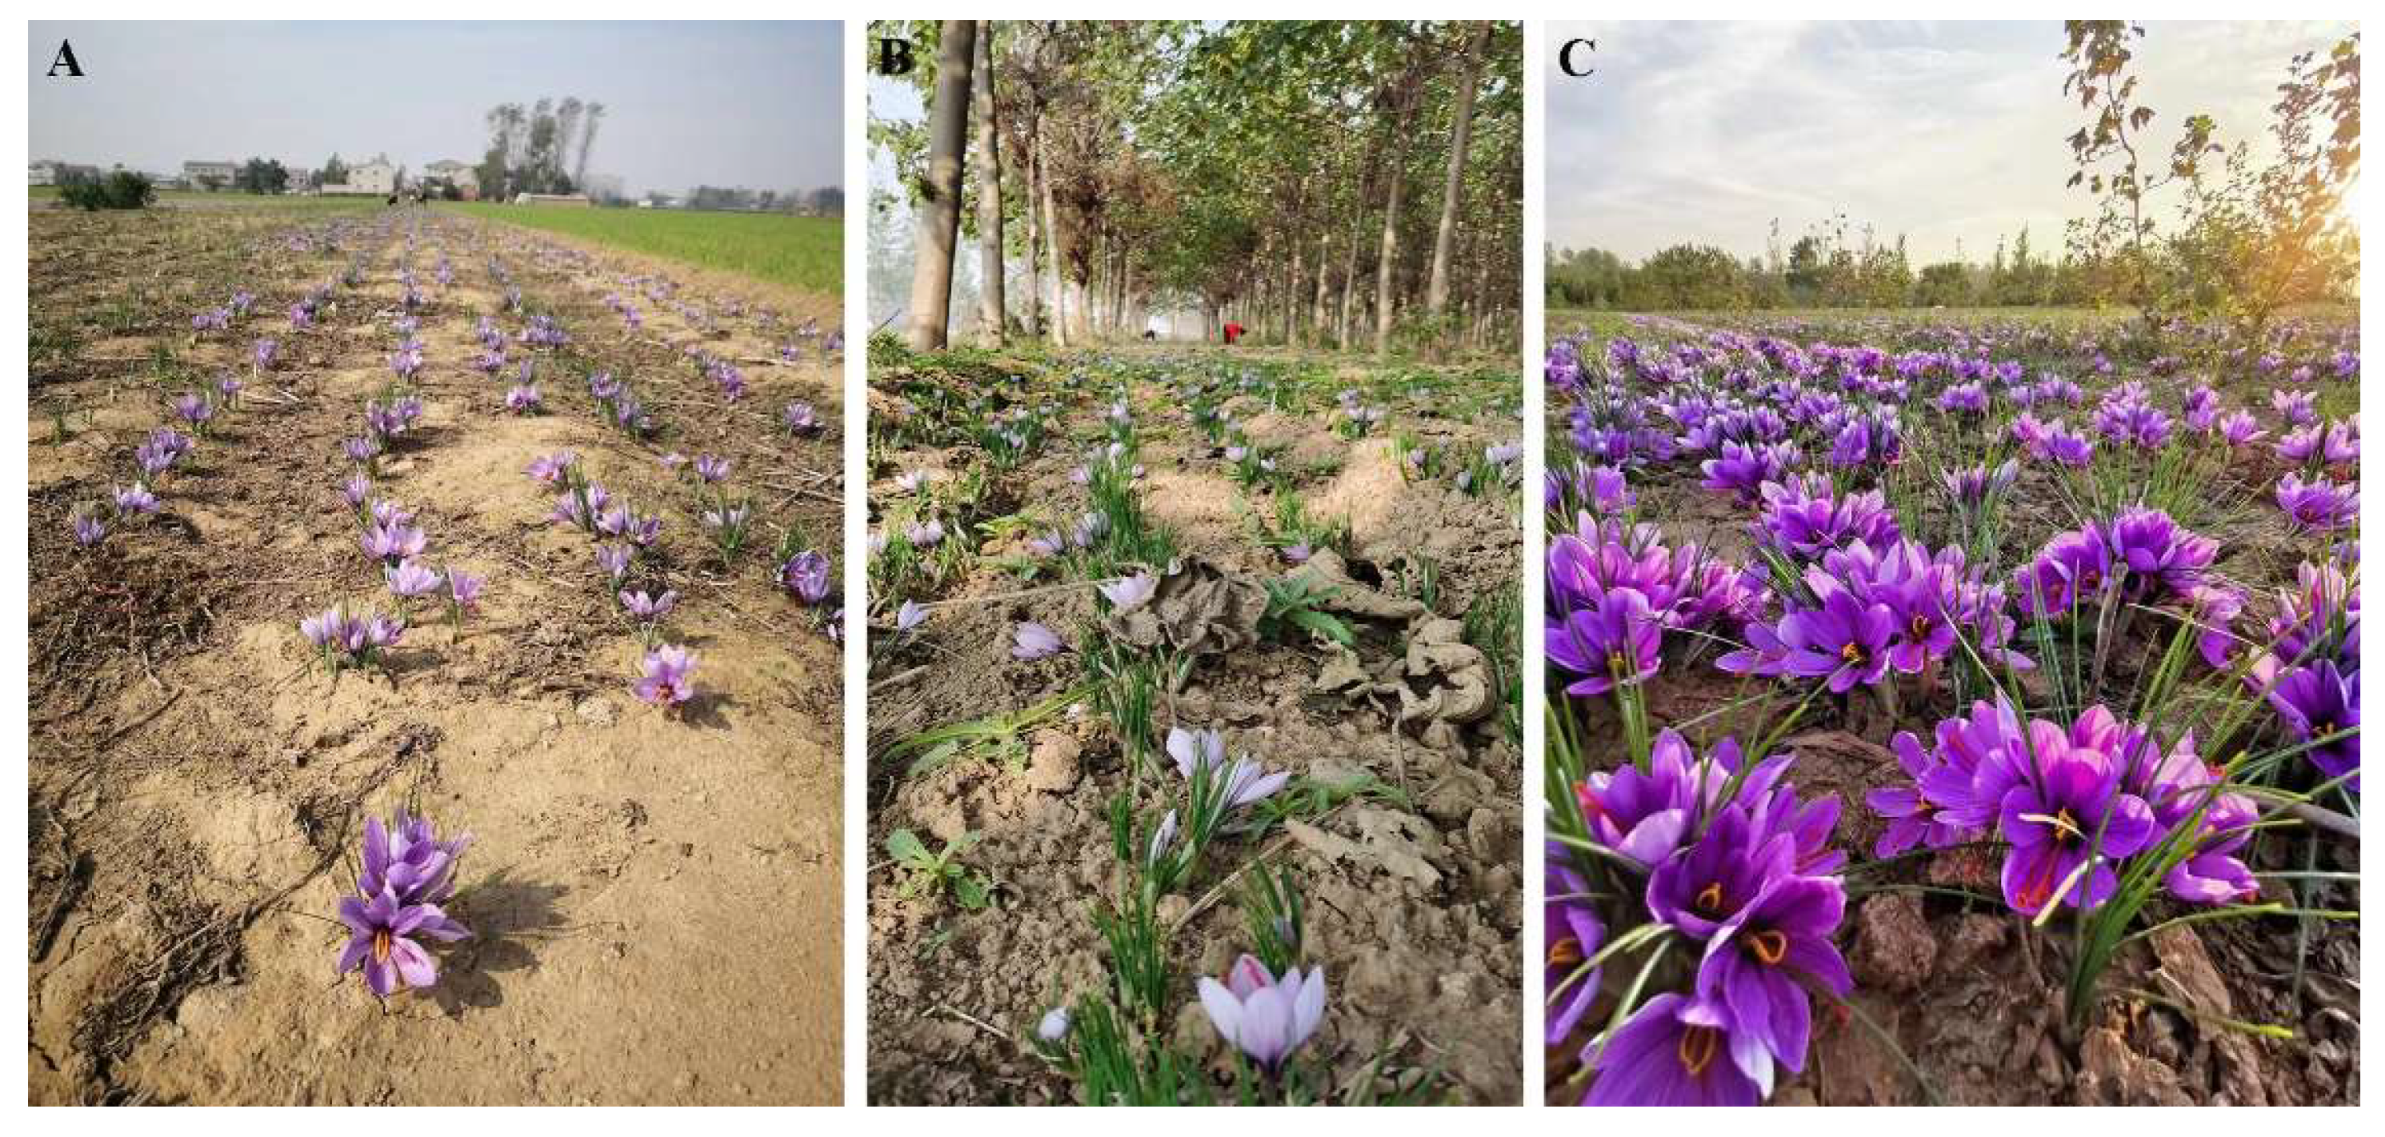
Figure 1. Three cropping patterns. (A) Mono cropping (CK). (B) Paulownia intercropping pattern (SP). (C) Soybean intercropping pattern (SS).
Preprints 116795 g001

2.2. Estimation of Biological Traits

Saffron flowers were gathered and counted in the first hours after sunrise on November 15th-17th 2023 (the blooming florescence), styles were separated soon after [2]. Flowers per Saffron (60 Saffron) were counted, the stigma length of 60 flowers were measured by Image J software. The data collected were subjected to analysis of variance (ANOVA) to estimate the significance of treatments. The Boxplots were graphed by Origin 2021 software.

2.3. Sample Preparation and Metabolic Profiling

2.3.1. Sample Preparation and Extraction

Saffron stigmas from each group were frozen in liquid nitrogen immediately and kept at -80 o C, preparing for metabolite extraction. All samples were freeze-dried by a vacuum freeze-dryer (Scientz-100F). Freeze-dried samples were crushed using a mixer mill (MM 400, Retsch) with a zirconia bead for 1.5 min at 30 Hz. Dissolve 100 mg of lyophilized powder with 1.2 ml 70% methanol solution, vortex 30 seconds every 30 minutes for 6 times in total, place the sample in a refrigerator at 4 °C Ove might. Following centrifugation at 12000 rpm for 10 min, the extracts were filtrated (SCAA-104, 0.22 um pore size, ANPEL) before UPLC-MS/MS analysis preparing for metabolites detection.

2.3.2. UPLC-Conditions

Measurements were taken three times by ultra-high-performance liquid chromatography (Shim-pack UFLC SHIMADZUCBM30A) and tandem mass spectrometry (MS/MS, Applied Biosystems 6500 QTRAP) to obtain mass spectrometric data for metabolite profiling (Metware). The analytical conditions were as follows, UPLC: column, Agilent SB-C18 (1.8 µm, 2.1 mm * 100 mm); The mobile phase was consisted of solvent A, pure water with 0.1% formic acid, and solvent B, acetonitrile with 0.1% formic acid. Sample measurements were performed with a gradient program that employed the starting conditions of 95% A, 5% B. Within 9 min, a linear gradient to 5% A, 95% B was programmed, and a composition of 5% A, 95% B was kept for 1 min. Subsequently, a composition of 95% A, 5.0% B was adjusted within 1.1 min and kept for 2.9 min. The flow velocity was set as 0.35 mL per minute; The column oven was set to 40°C; The injection volume was 4 μL. The effluent was alternatively connected to an ESI-triple quadrupole-linear ion trap (QTRAP)-MS [29].

2.3.3. ESI-Q TRAP-MS/MS

LIT and triple quadrupole (QQQ) scans were acquired on a triple quadrupole-linear ion trap mass spectrometer (Q TRAP), AB4500 Q TRAP UPLC/MS/MS System, equipped with an ESI Turbo Ion-Spray interface, operating in positive and negative ion mode and controlled by Analyst 1.6.3 software (AB Sciex). The ESI source operation parameters were as follows: ion source, turbo spray; source temperature 550°C; ion spray voltage (IS) 5500 V (positive ion mode)/-4500 V (negative ion mode); ion source gas I (GSI), gas II(GSII), curtain gas (CUR) were set at 50, 60, and 25.0 psi, respectively; the collision-activated dissociation(CAD) was high. Instrument tuning and mass calibration were performed with 10 and 100 μmol/L polypropylene glycol solutions in QQQ and LIT modes, respectively. QQQ scans were acquired as MRM experiments with collision gas (nitrogen) set to medium. DP and CE for individual MRM transitions was done with further DP and CE optimization. A specific set of MRM transitions were monitored for each period according to the metabolites eluted within this period. MS data for all samples was then qualitatively and quantitatively analyzed using the Metware database (MWDB) [29]. The results were shown in Table S1, Table S2, and Table S3.

2.3.4. Quality Control Analysis (QC Analysis)

The results show a high overlap of curves of total ion current detected by metabolites. It means that the retention time and peak intensity are consistent, which indicates a better signal stability when the same sample is analyzed at different times by mass spectrometry. The high stability of the instrument provides an important guarantee for the repeatability and reliability of the data (Figure 2, Table S4).
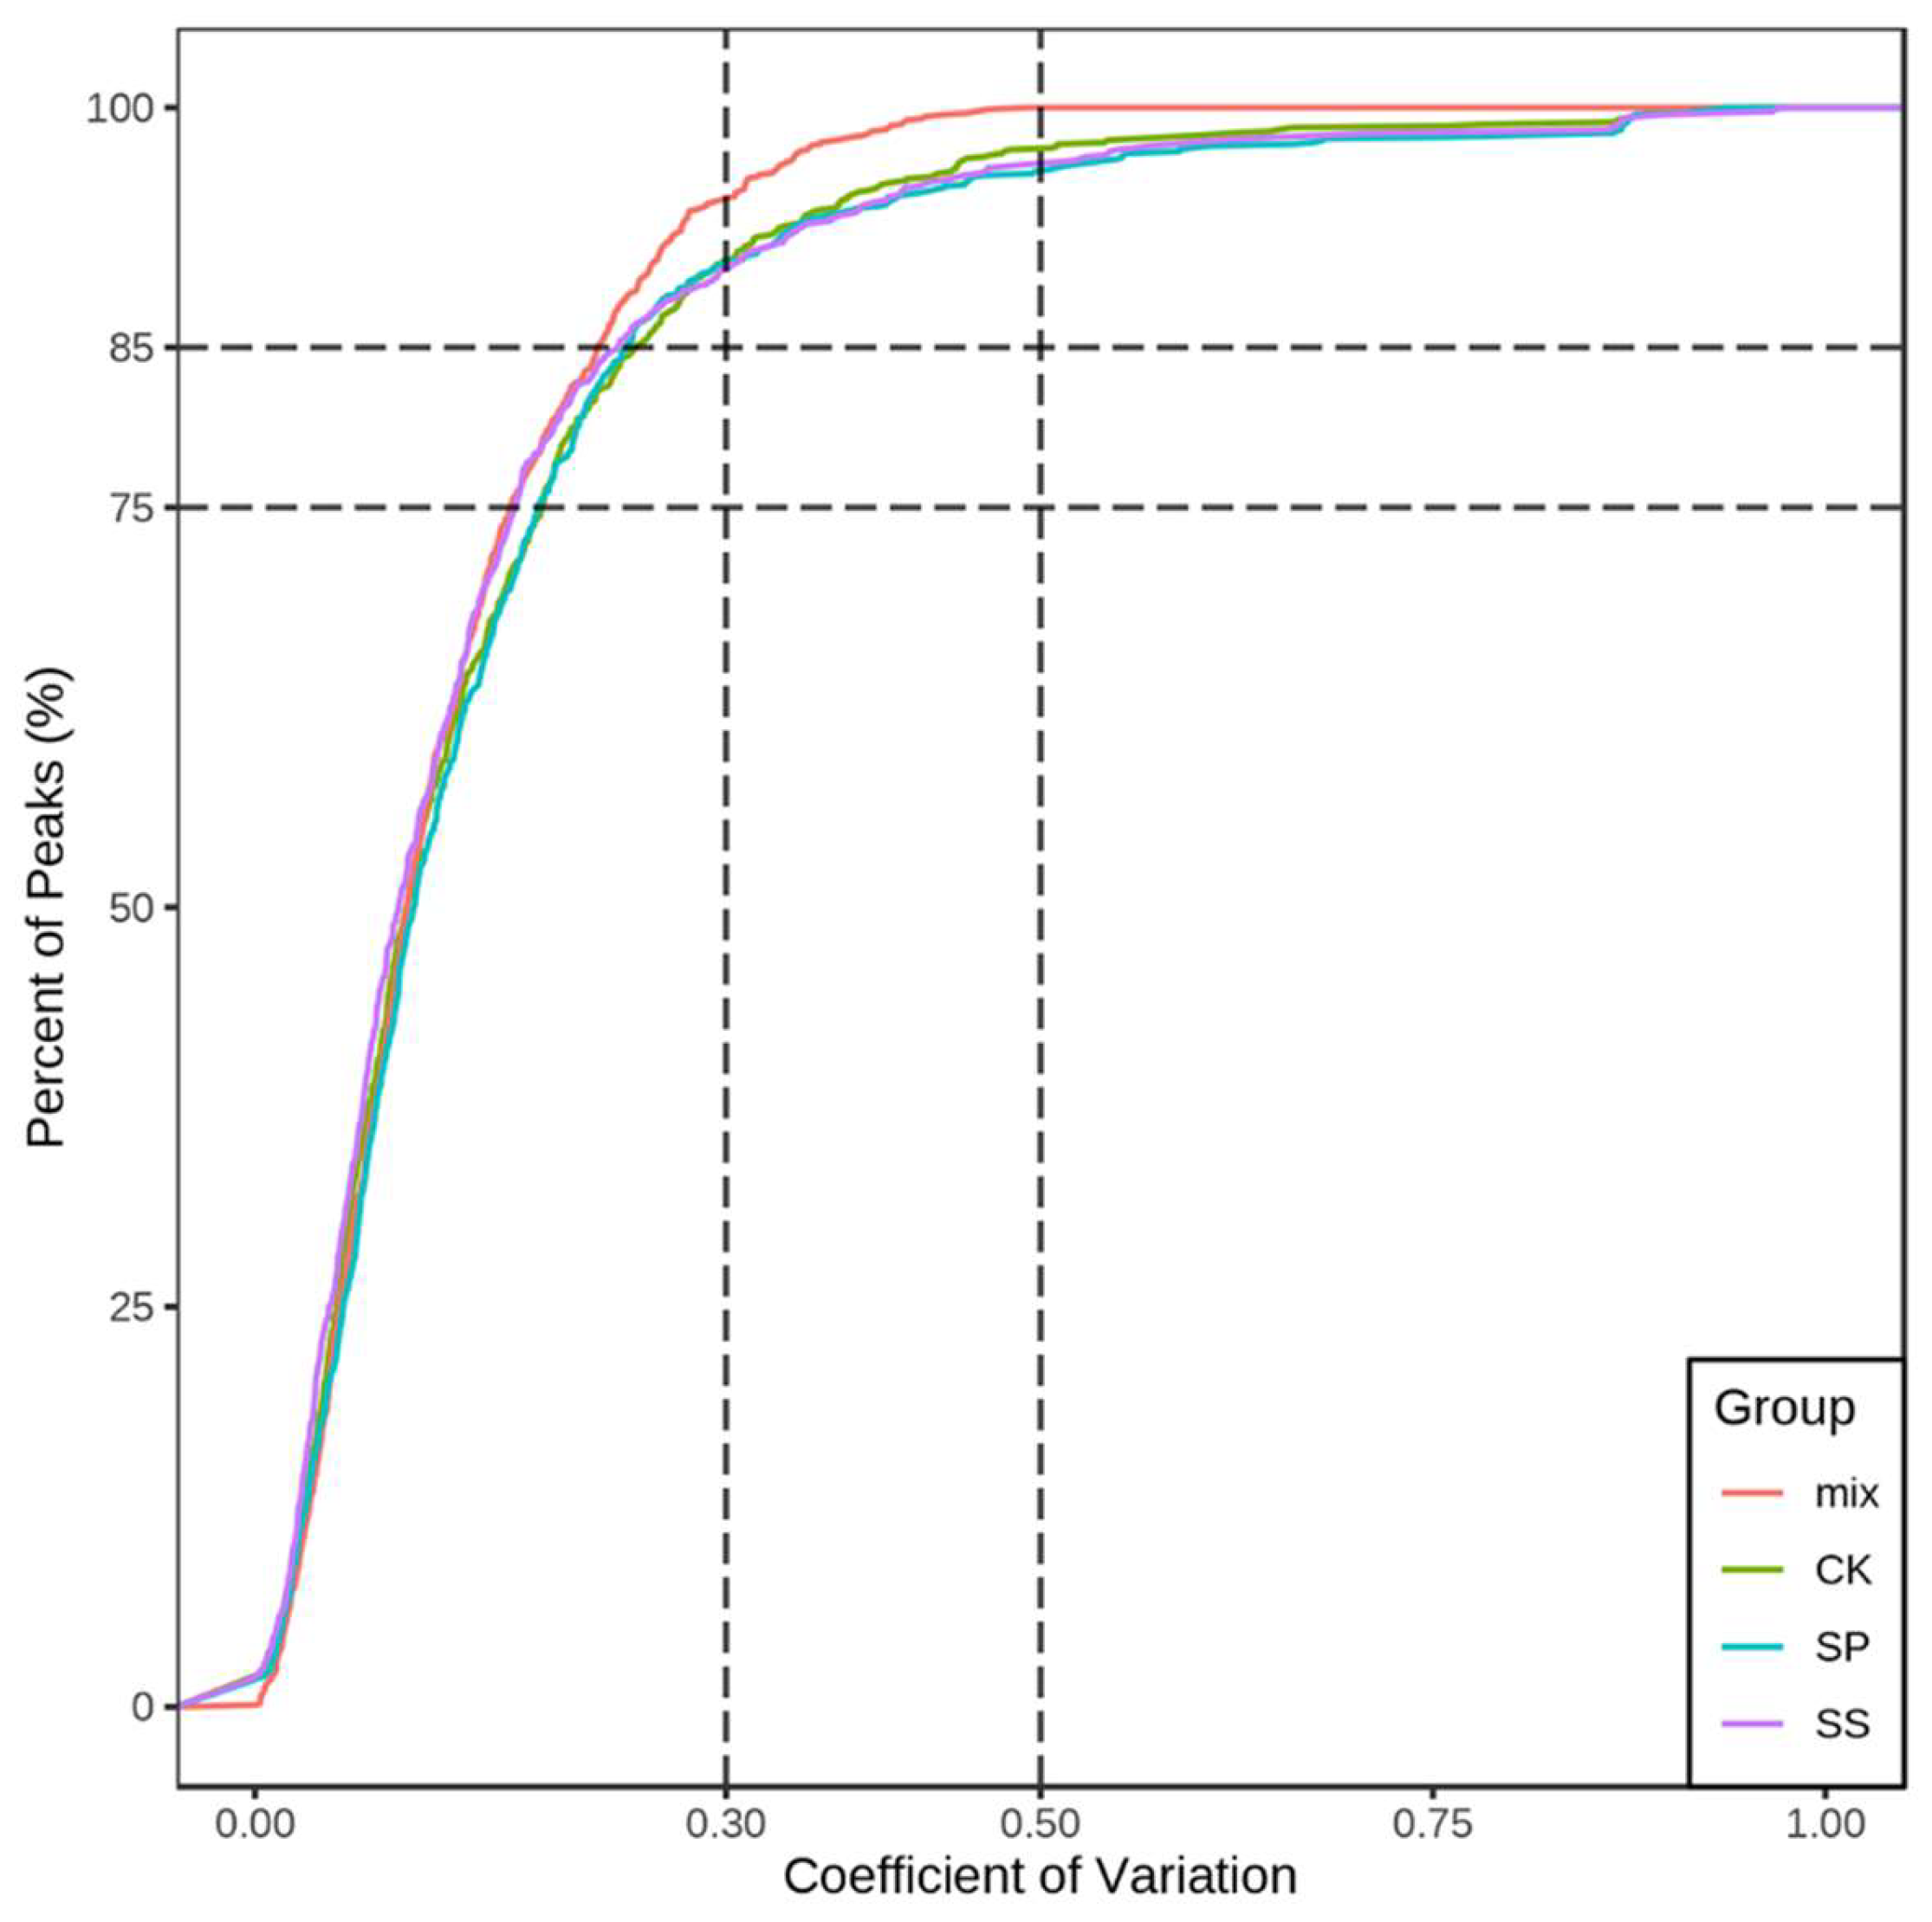
The Coefficient of Variation (CV) indicates the ratio of the standard deviation to the average value of the original data, which can reflect the data dispersion. The application of Empirical Cumulative Distribution Function (ECDF) can make the frequency of CV occurrence of substances with less than reference value be analyzed. The higher the proportion of substances with lower CV value in QC samples, the more stable the experimental data. The results show that the proportion of substances with CV value less than 0.3 in QC samples is higher than 75%, indicating that the experimental data is very stable (Figure 3).

2.3.4. PCA Analysis

Unsupervised PCA (principal component analysis) was performed by statistics function package within R (www.r-project.org). The data was unit variance scaled before unsupervised PCA.

2.3.5. Differential Metabolites Selected

A one-way analysis of variance (ANOVA) was performed for exploring variation patterns, Pearson correlation coefficients between samples were calculated by the corfunction in R software, the probability of hypothesis testing (p-value) is corrected by multiple hypothesis testing using by Benjamini-Hochberg. A OPLS-DA test was examined based on a VIP value ≥ l and univariate statistical analysis at p <0.05 were applied for metabolomics profiling, The P value threshold was corrected for all statistical tests using the FDR, a threshold of FDR < 0.05 and an absolute fold change > 2.0 or < 0.5 were used to describe the significance of differential metabolites for group discrimination [30].

2.3.6. KEGG Annotation and Enrichment Analysis

Identified metabolites were annotated using KEGG Compound database (http://www.kegg.jp/kegg/compound/), annotated metabolites were then mapped to KEGG Pathway database (http://www.kegg.jp/kegg/pathway.html). Pathways with significantly regulated metabolites mapped to were then fed into MSEA (metabolite sets enrichment analysis), their significance was determined by hypergeometric test’s p-values.

3. Results

3.1. Biological Changes in Saffron under Three Cropping Patterns

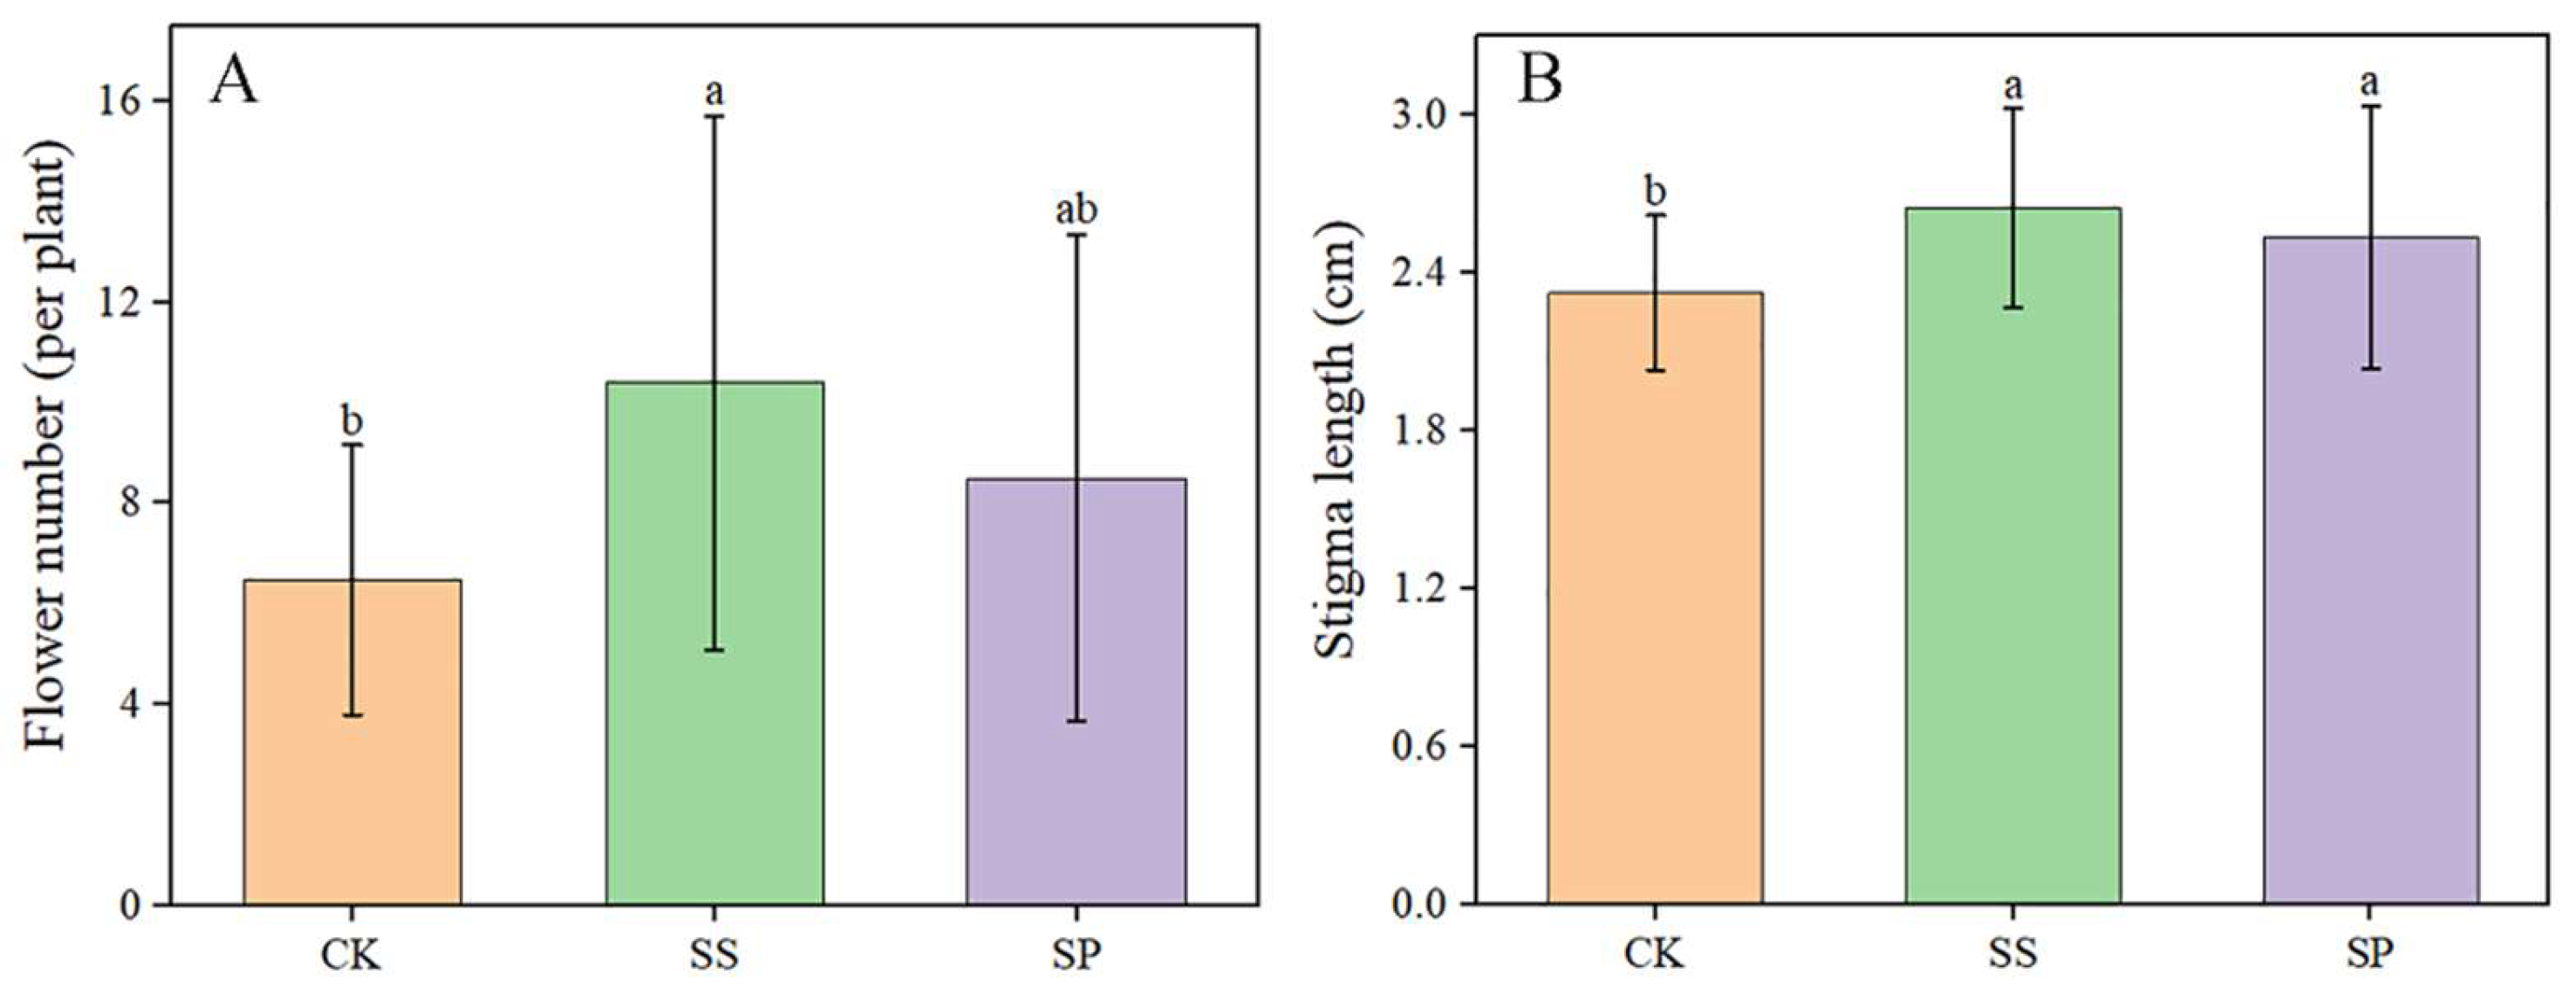
The difference of Saffron flower number per plant and stigma length under three cropping patterns has been compared and analyzed using ANOVA. The results showed that the Soybean intercropping pattern had significant effect (p ≤ 0.01) on the flower production and stigma length (Figure 4, A). The Paulownia intercropping pattern had significant effect (p ≤ 0.01) on the stigma length (Figure 4, B).

3.2. Metabolic Changes in Saffron under Three Cropping Patterns

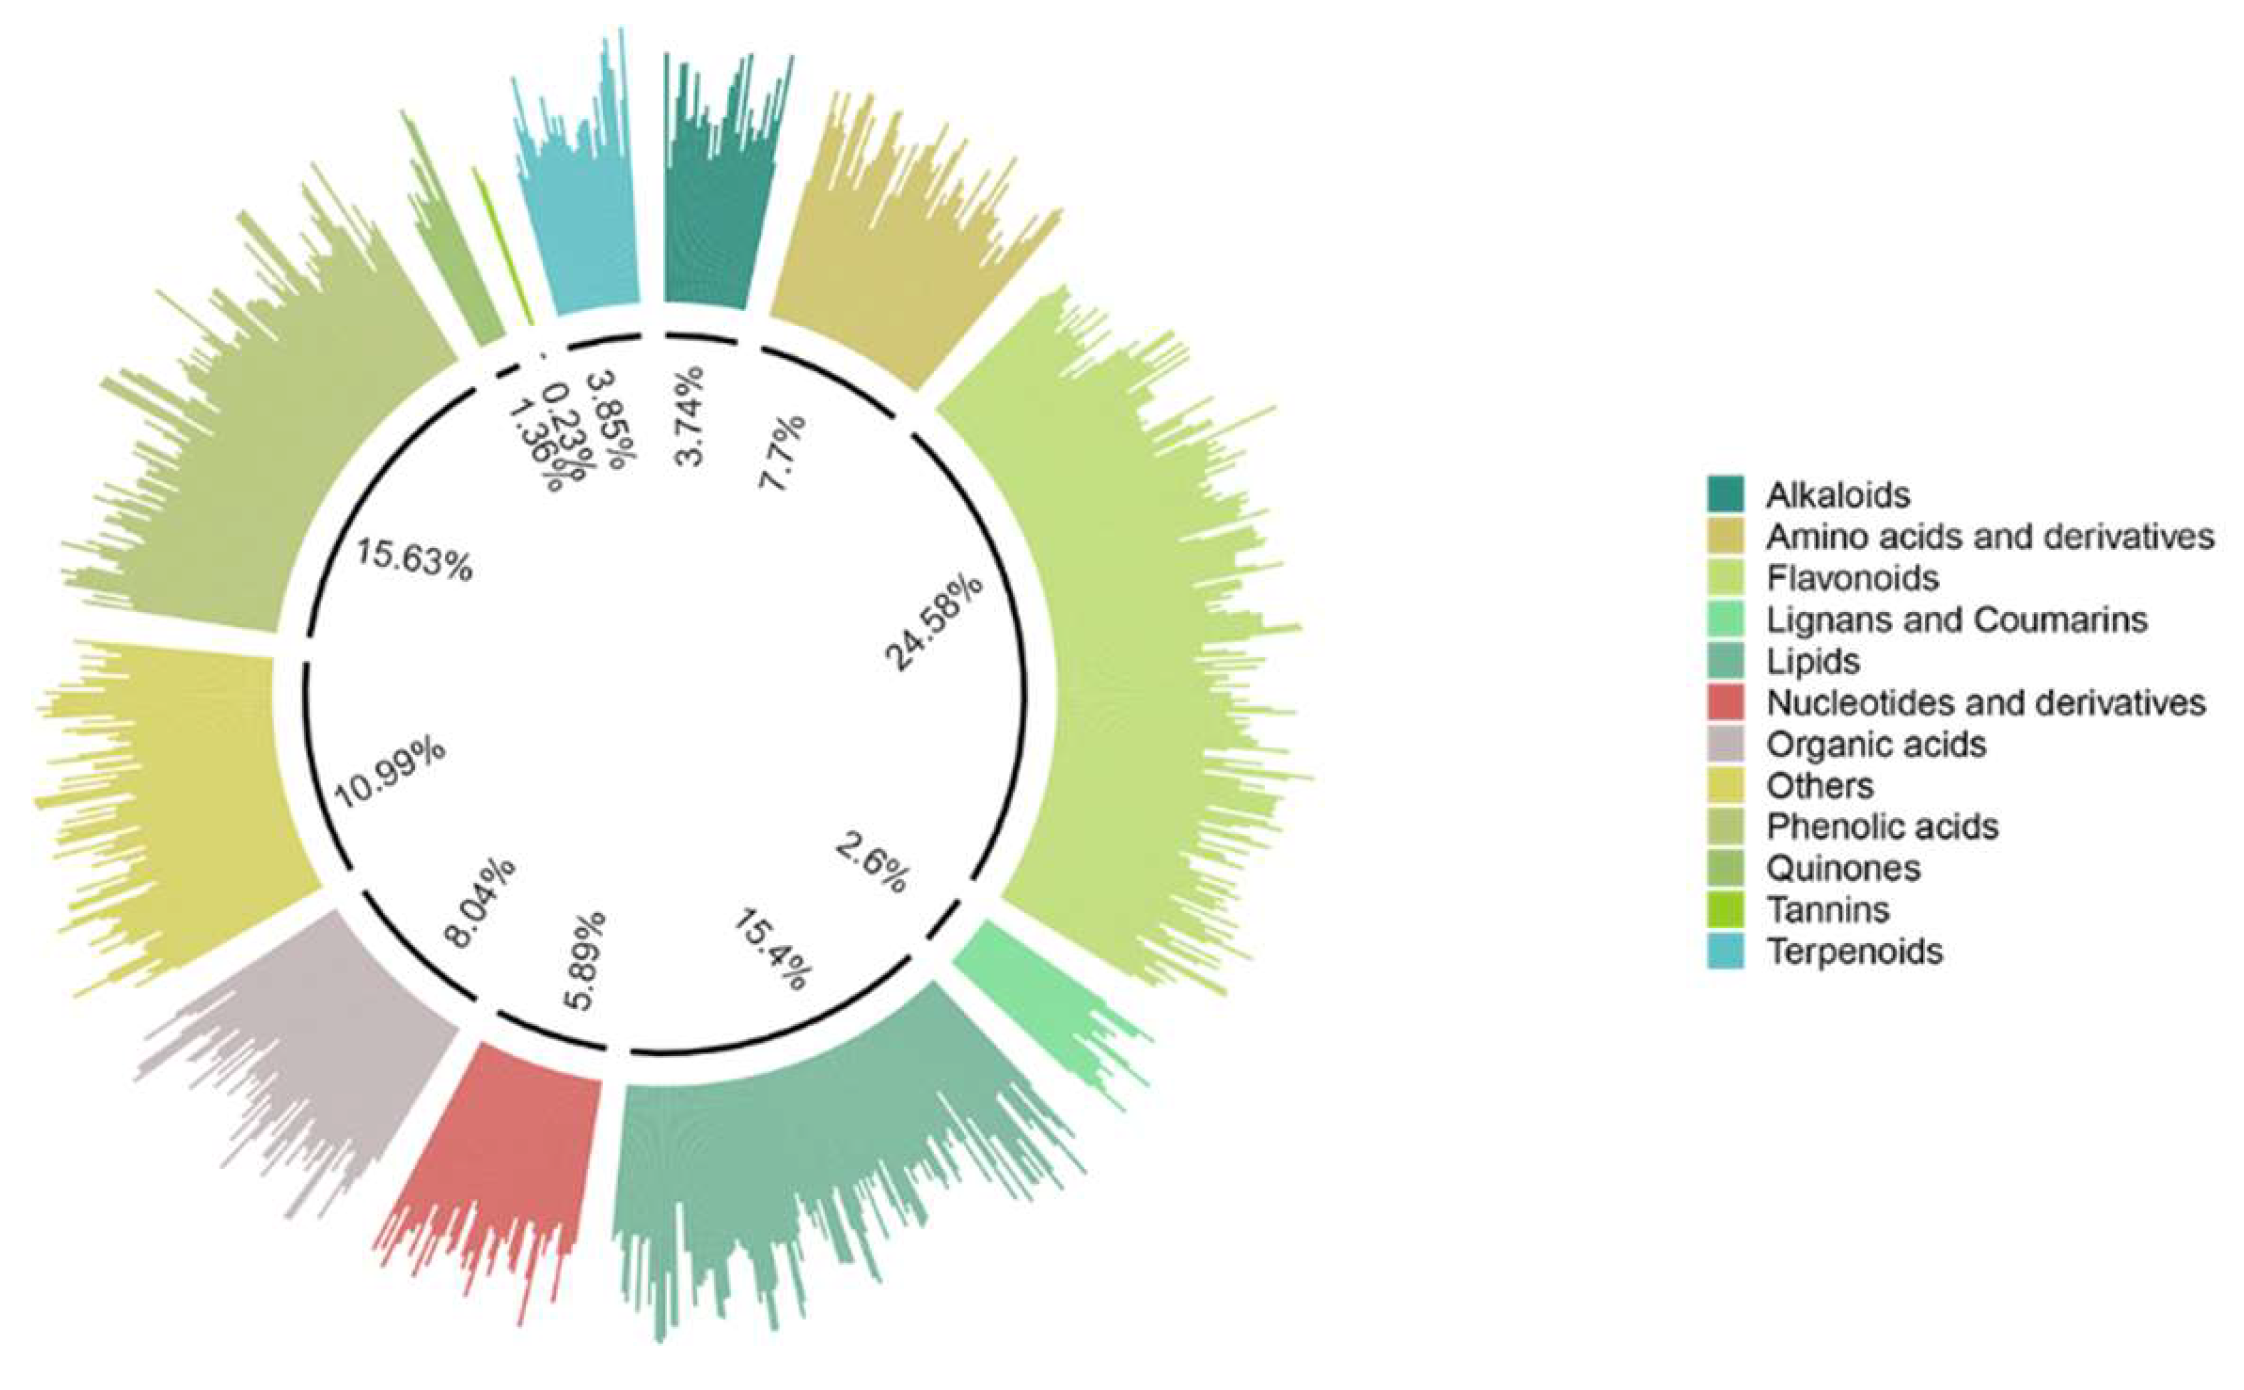
In total, 883 compounds were identified and classified into 12 groups, which related to alkaloids (3.74%), amino acids and derivatives (7.7%), flavonoids (24.58%), lignans and coumarins (2.6%), lipids (15.4%), nucleotides and derivatives (5.89%), organic acids (8.04%), phenolic acids (15.63%), quinones (1.36%), tannins (0.23%), terpenoids (3.85%), and others (10.99%) (Table S4, Figure 5).
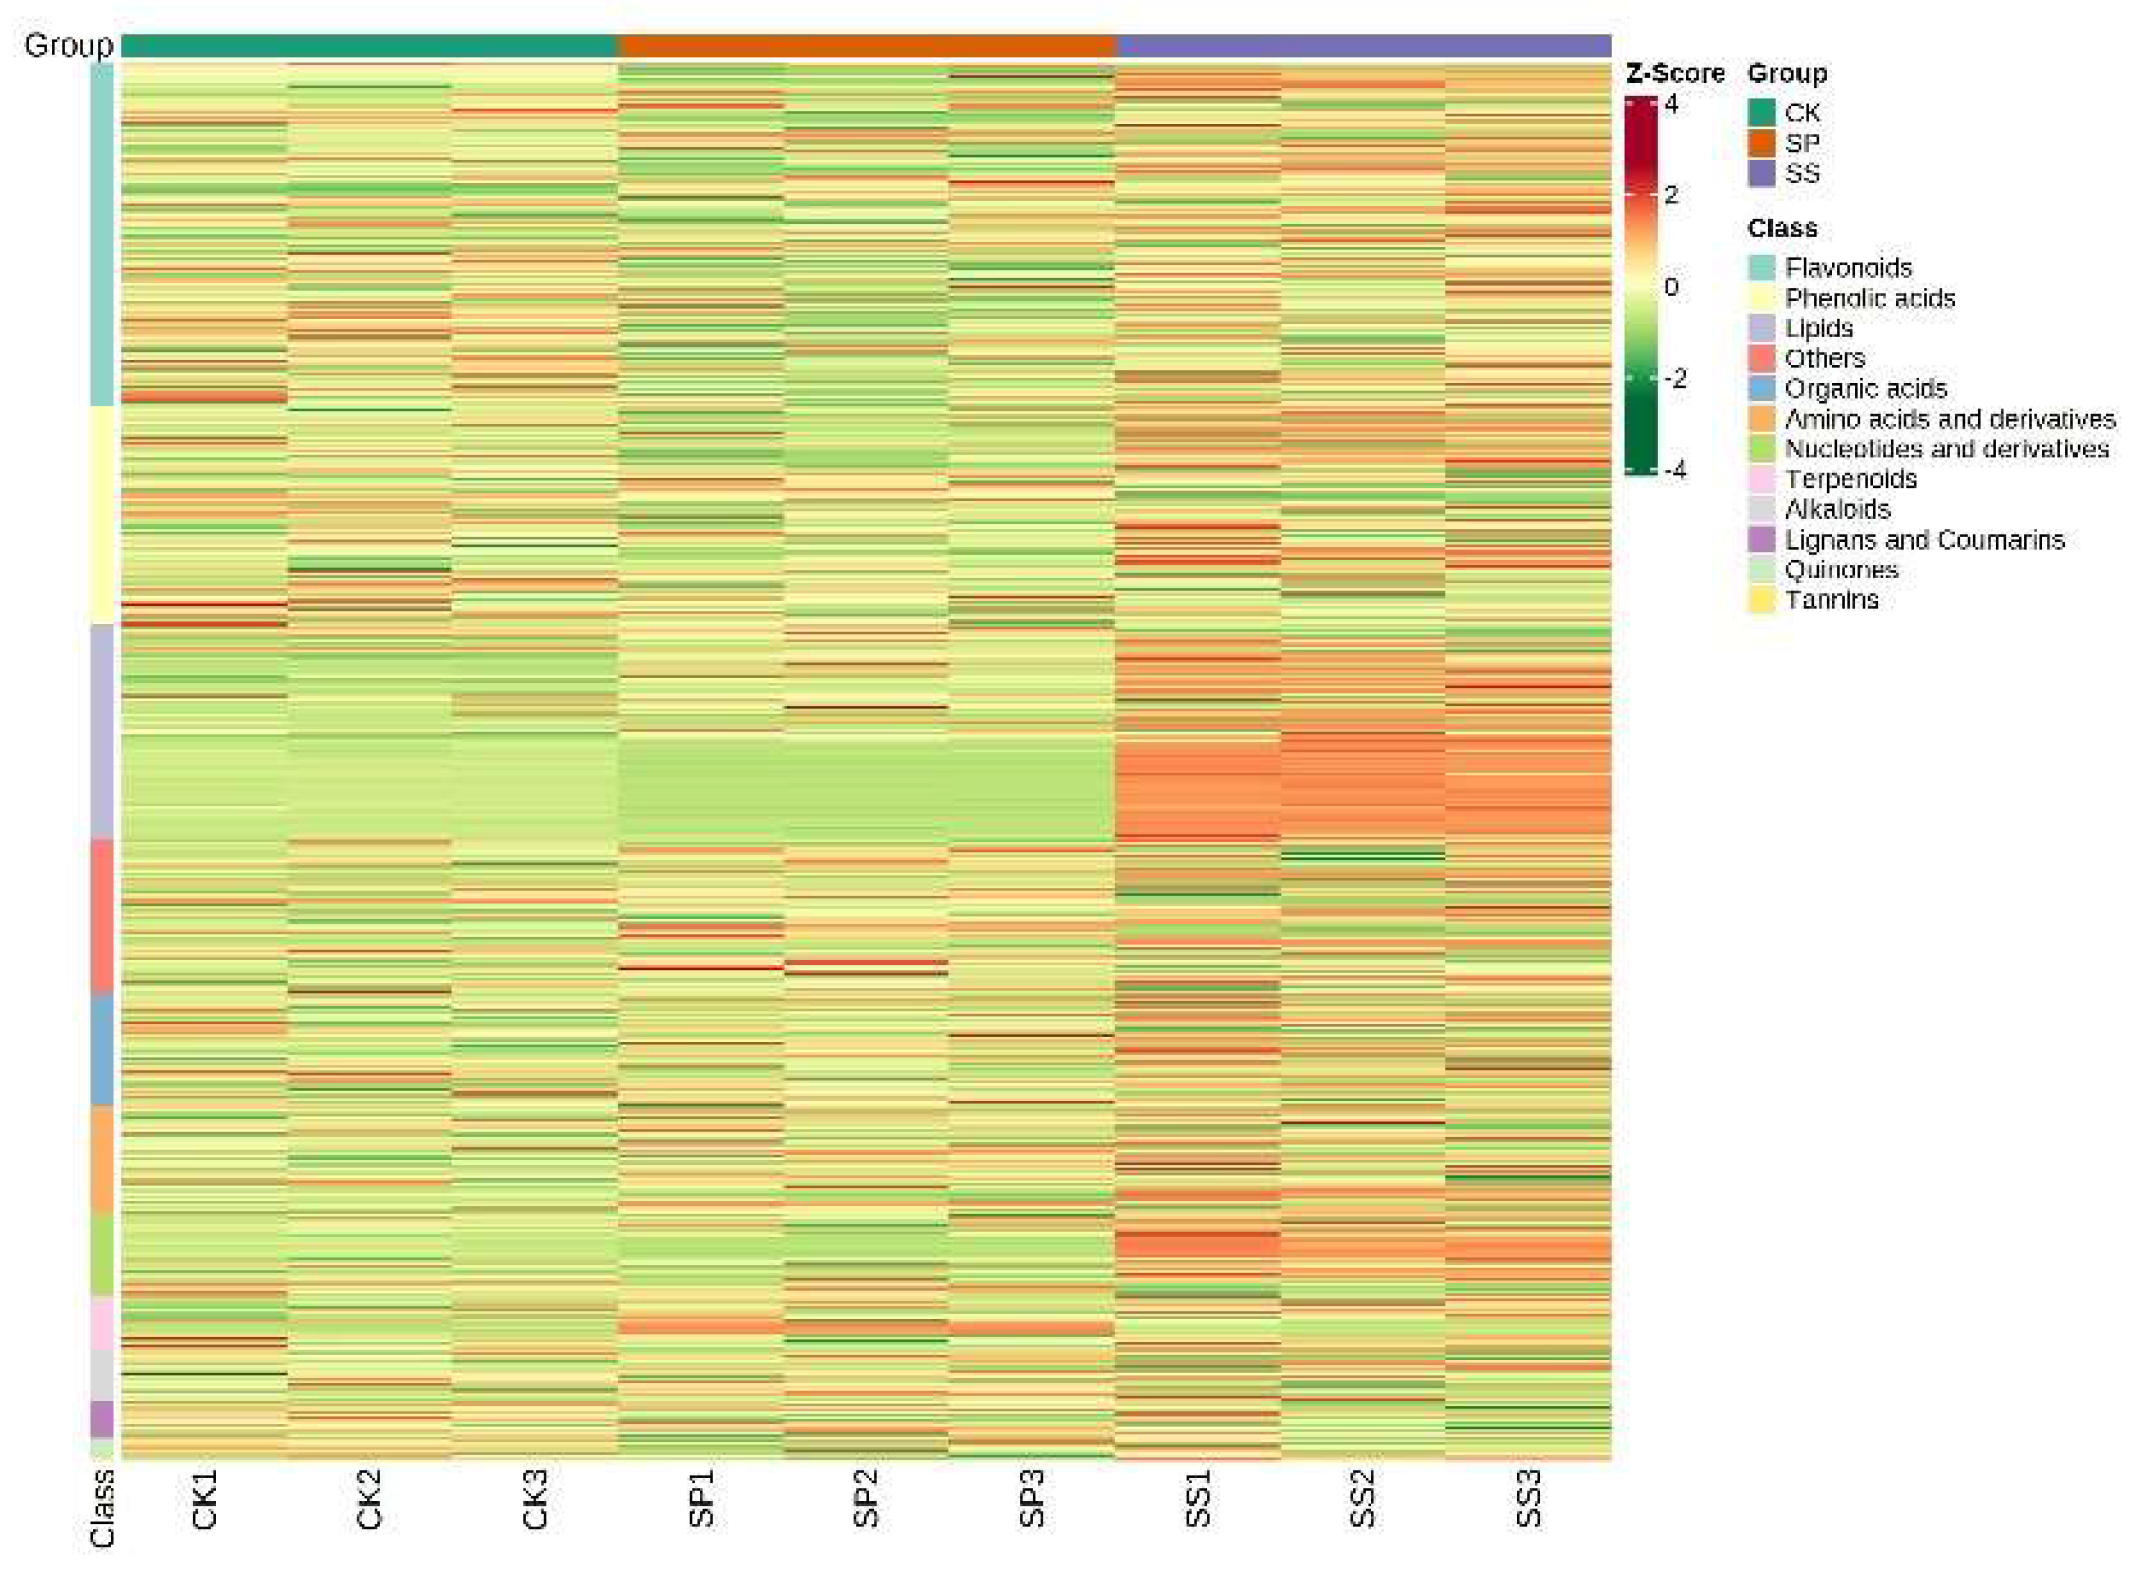
Accumulated quantity of metabolites was then decided by Z-Score. The results were shown in Figure 6, contents of most flavonoids, phenolic acids, lipids, and Nucleotides and derivatives reached the highest in Saffron under SS planting pattern (Figure 6).
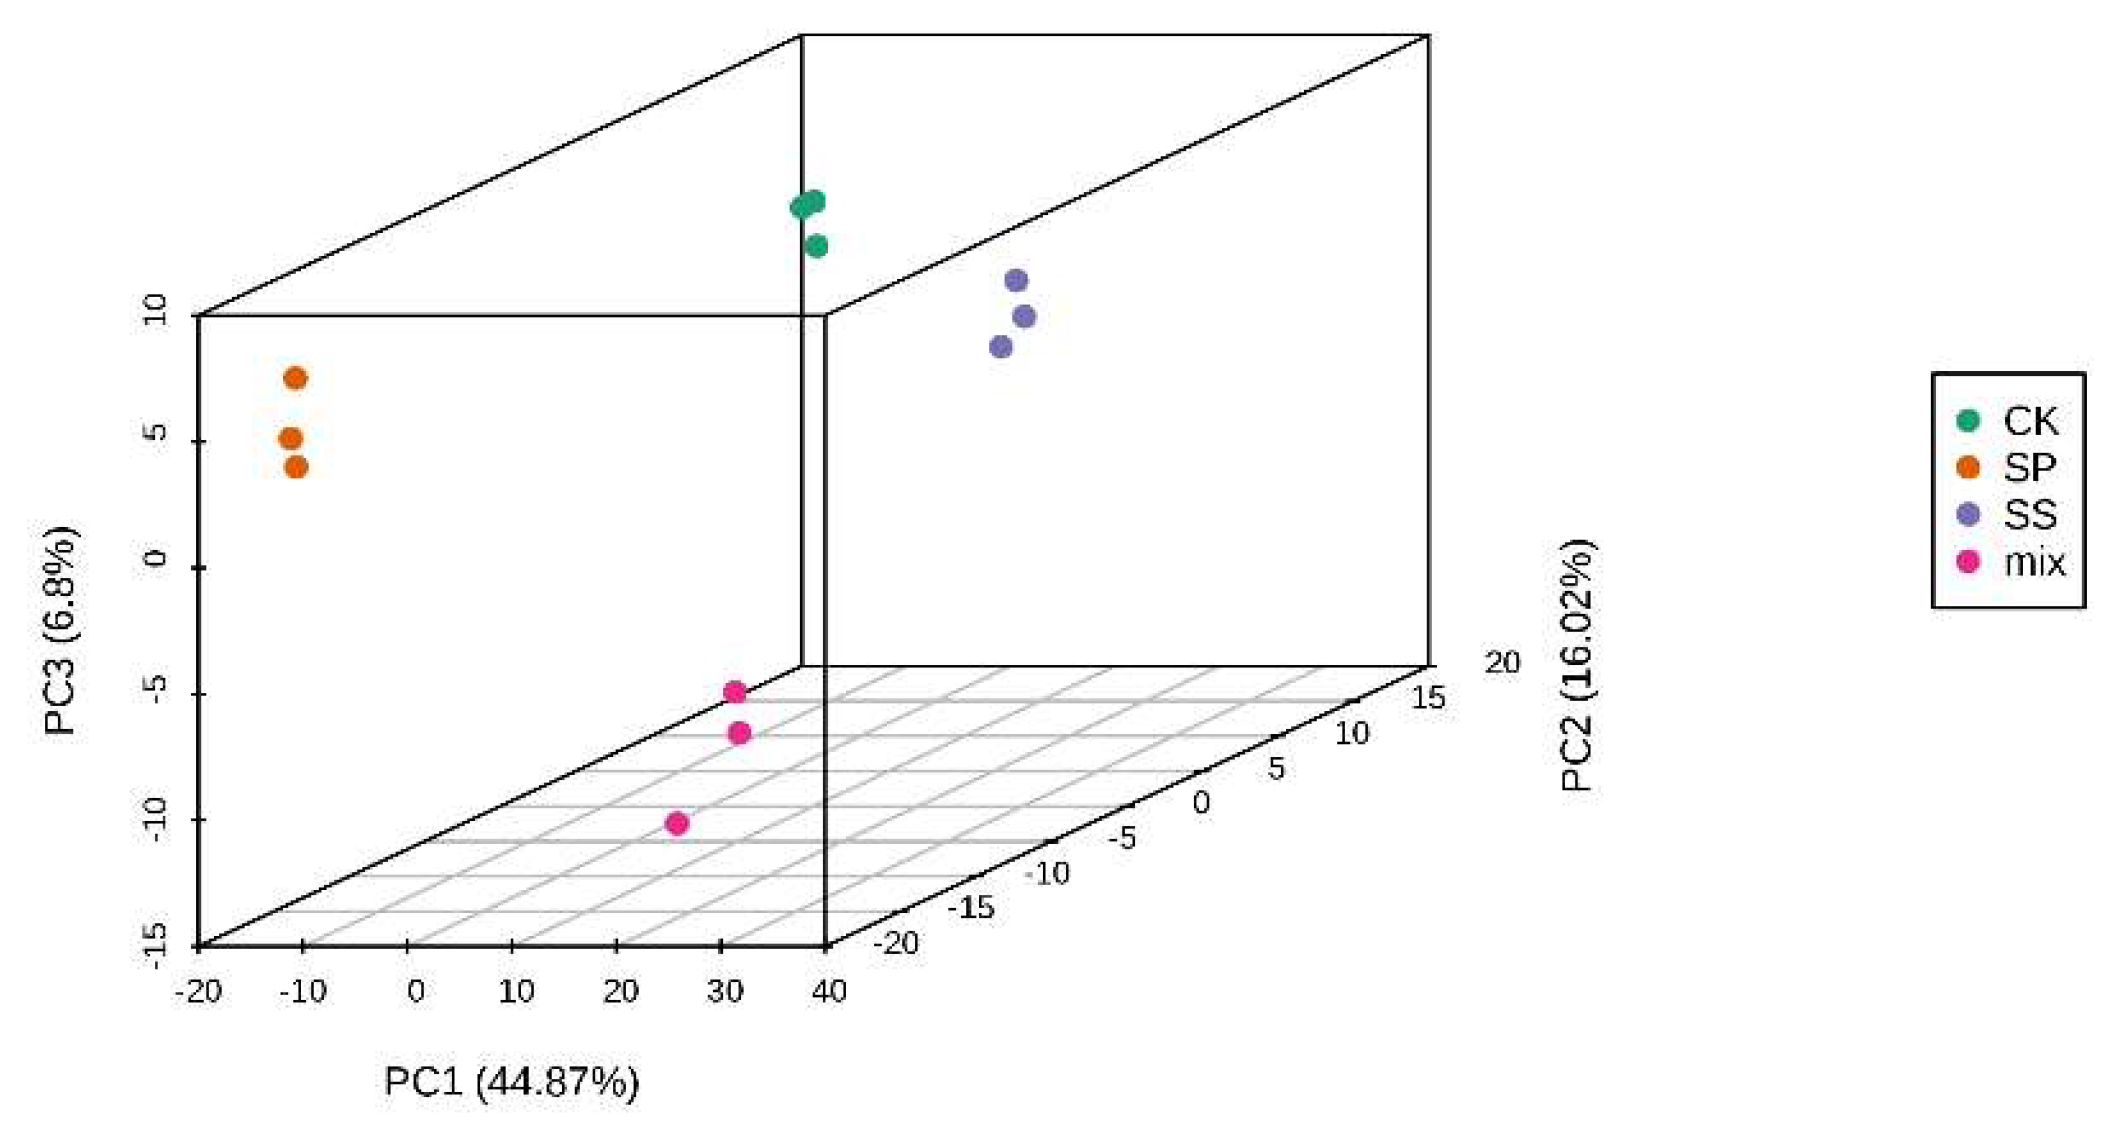
According to the data in Figure 7, the principal component analysis (PCA) of the metabolite data showed that three groups were well separated (PC1 and PC2 accounts for 60% of the variation with a significance level of 0.01), and three biological duplication of each group concentrated in the frequency distribution.
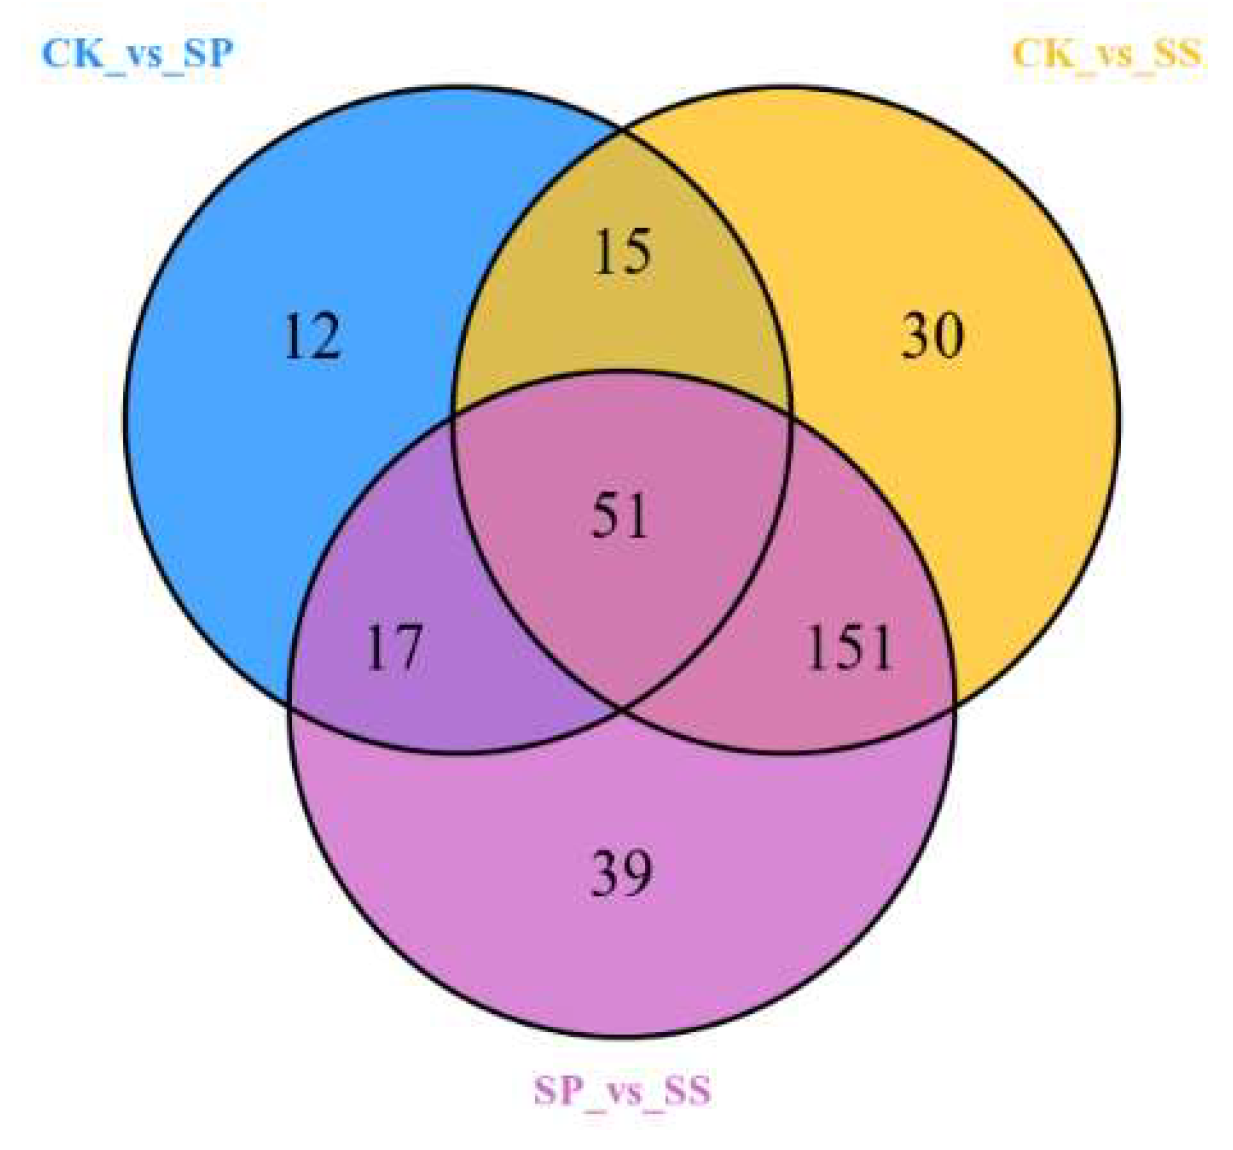
The differentially accumulated metabolites in three comparative groups were identified. The results showed in Figure 8, 95, 247, and 258 differential accumulated metabolites (DAMs) were differentially transcribed in comparison groups CK_vs_SP, CK_vs_SS, and SP_vs_SS (Figure 8). Therein, 51 compounds showed a significant difference in all groups.
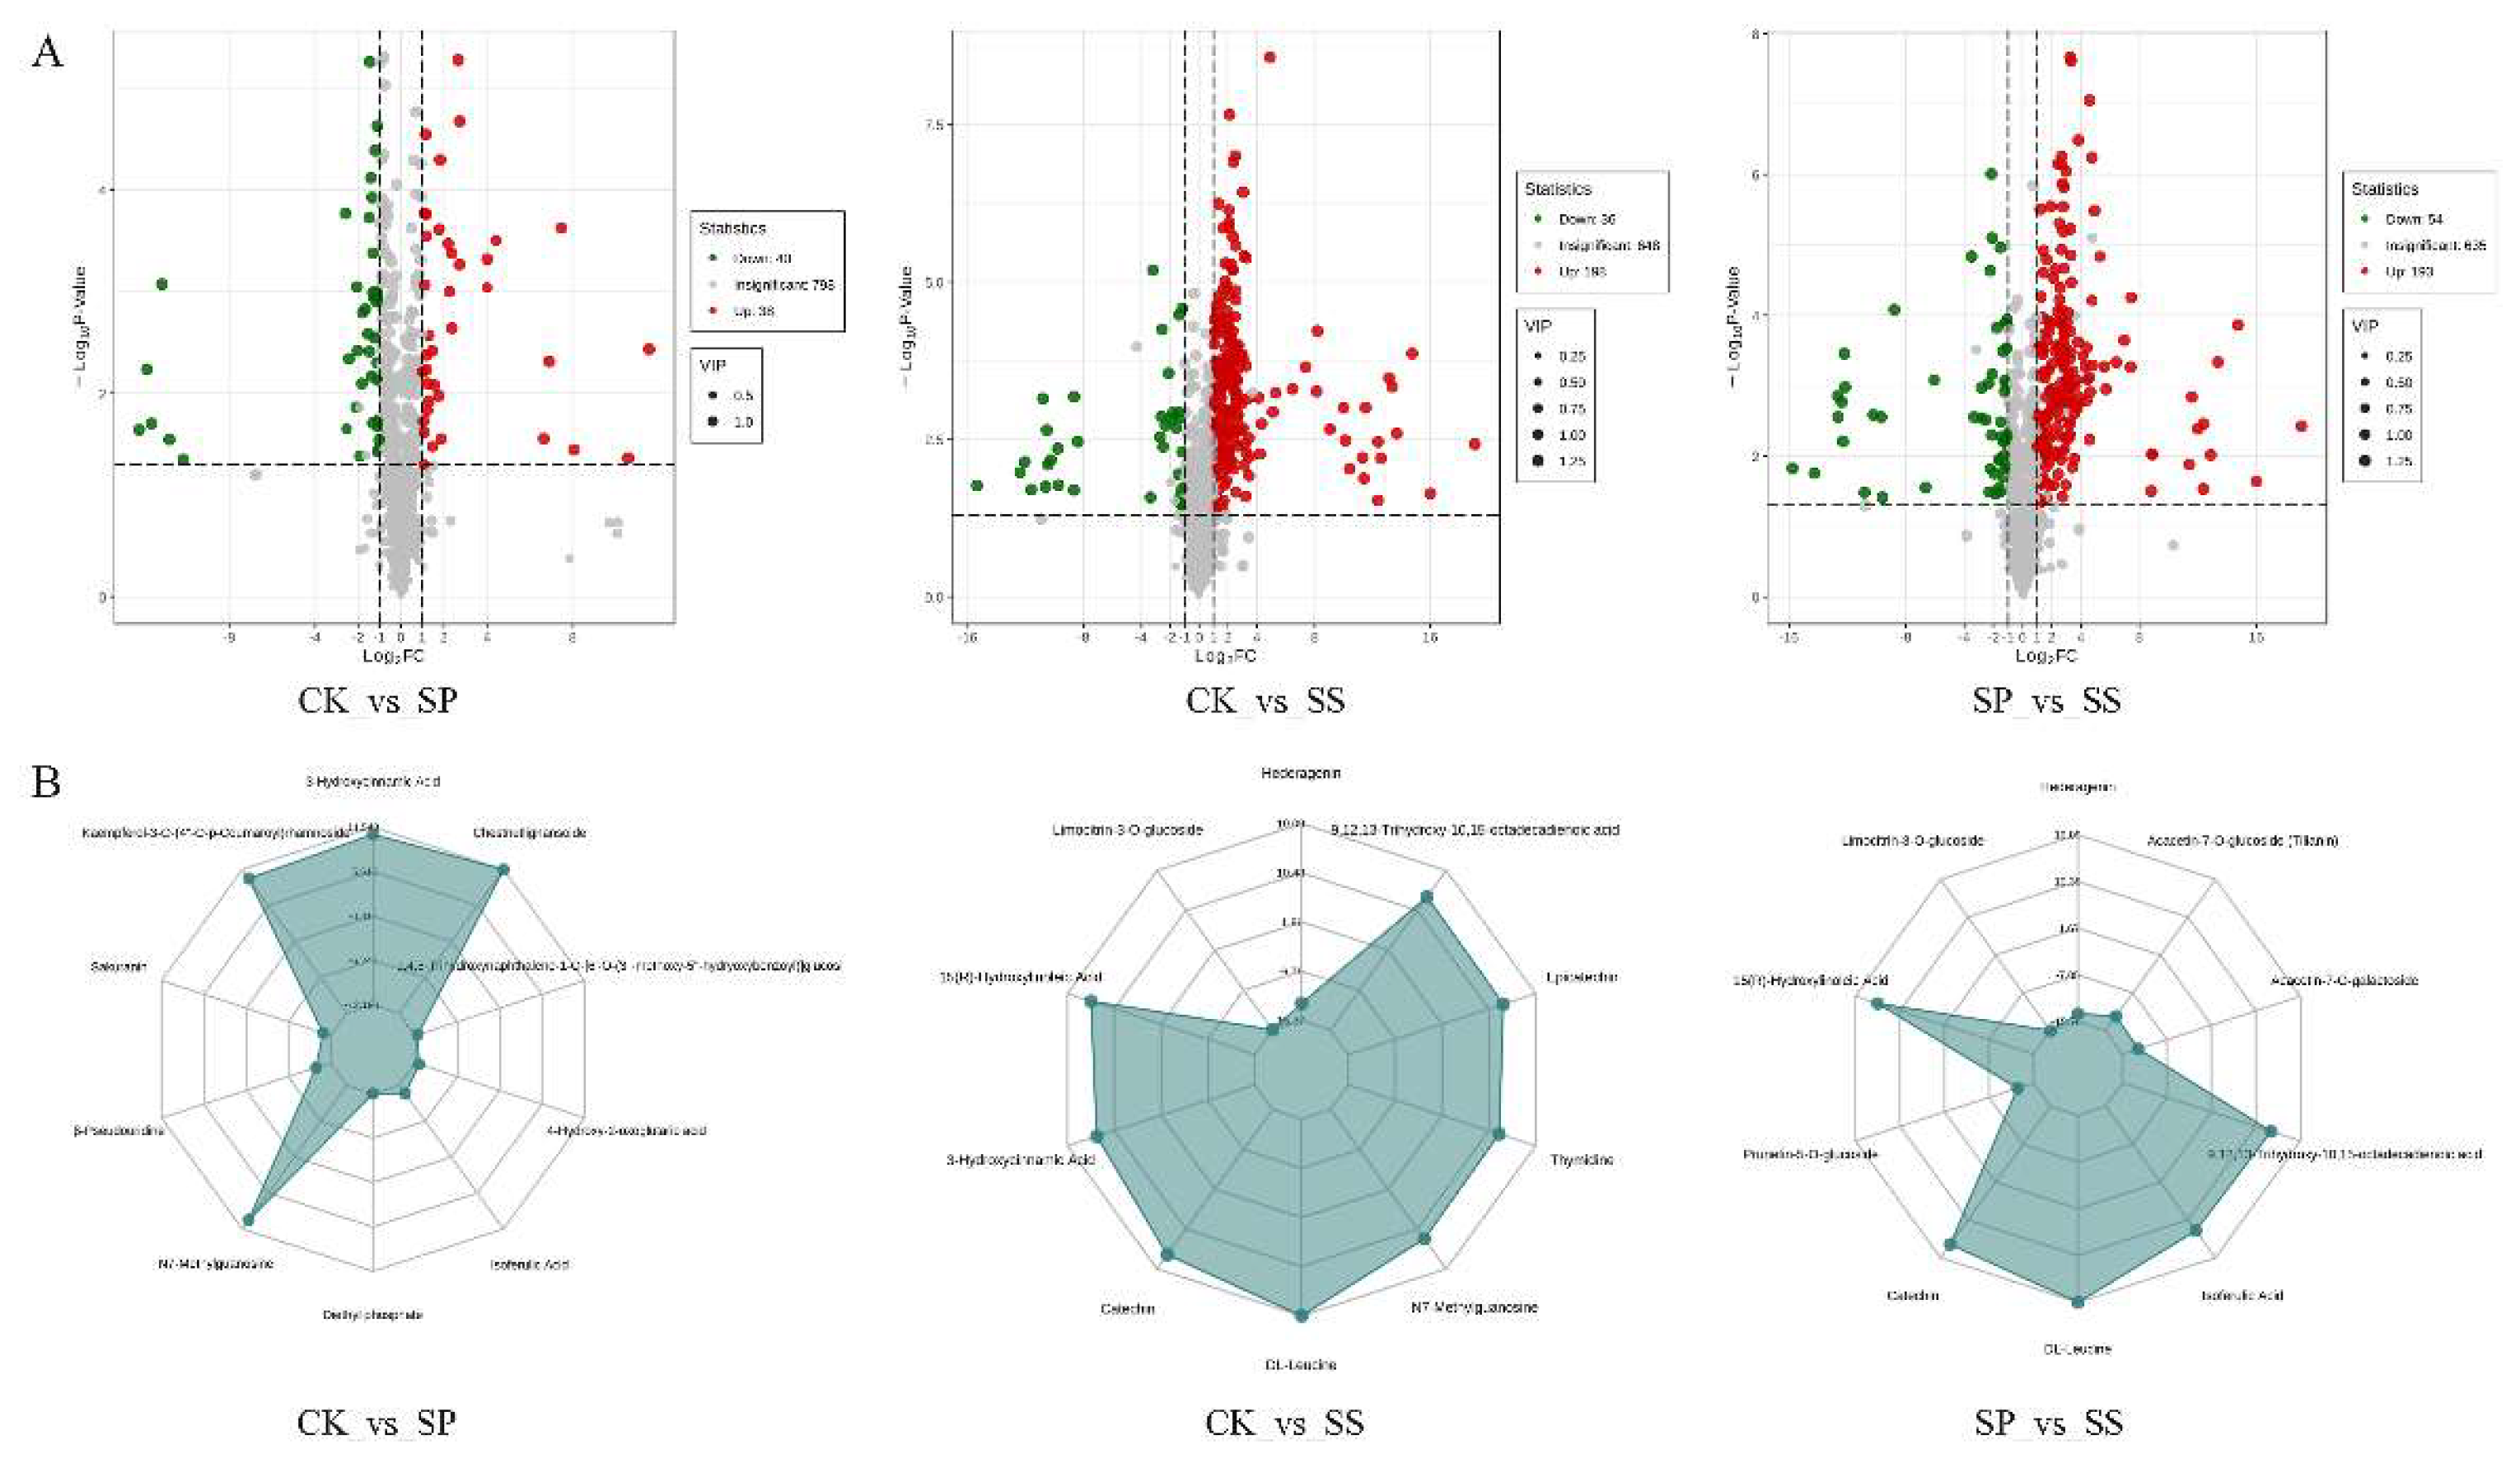
Metabolome analysis showed that a total of 315 compounds were significantly changed in comparison groups CK_vs_SP, CK_vs_SS, and SP_vs_SS (Figure 9). Compared with CK, 38 differential accumulated metabolites were upregulated and 40 were downregulated in SP, 198 DAMs were upregulated and 36 were downregulated in SS. Compared to SP, 193 DAMs were upregulated and 54 were downregulated in SS. Furthermore, the most important ones to Saffron under different plant method were identified utilizing by radar comparative analysis based on the variable importance in projection (VIP) score. The results showed that 3-Hydroxycinnamic Acid, Kaempferol-3-O (4”-O-p-Coumaroyl) rhamnoside, Chestnutlignansoide, 1,4,8-Trihydroxynaphthalene-1-O-[6′-O-(3”-methoxy-5”-hydryoxybenzol)] glucosi, Sakuranin, β-Pseudo uridine, 4-Hydroxy-2-oxoglutaric acid, N7-Methylguanosine, Diethyl phosphate, and isoferulic Acid implying their functional relevance in the SP in comparing with CK. Hederagenin, Linocitrin-3-O-glucoside, 9,12,13-Trihydroxy-10,15-octadecadienoic acid, 15(R)-Hydroxylinoleic Acid, Epicatechin, 3-Hydroxycinnamic Acid, Thymidine, Catechin, N7-Methylguanosine, and DL-Leucine implying their functional relevance in the SS than CK. Hederagenin, Limocitrin-3-O-glucoside, Acacetin-7-O-glucoside (Tilianin), 15(R)-Hydroxylinoleic Acid, Acacetin-7-O-galactoside, Prunetin-5-O-glucoside, 9,12,13-Trihydroxy-10,15-octadecadienoic acid, Catechin, Isoferulic Acid, and DL-Leucine implying their functional relevance in the SS than SP.
KEGG analysis showed that differential accumulated metabolites were significantly enriched in phenylalanine metabolism, linoleic acid metabolism, flavonoid biosynthesis, phenylpropanoid biosynthesis, biosynthesis of unsaturated fatty acids, arginine and proline metabolism, and alpha-Linolenic acid metabolism pathway from CK_vs_SP comparative group (Figure 10). Differential accumulated metabolites were significantly enriched in pyrimidine metabolism, purine metabolism, phenylalanine metabolism, nicotinate and nicotinamide metabolism, linoleic acid metabolism, and alpha-Linolenic acid metabolism from CK_vs_SS comparative group. The metabolites were significantly enriched in pyrimidine metabolism, purine metabolism, phenylalanine metabolism, nicotinate and nicotinamide metabolism, linoleic acid metabolism, and flavonoid biosynthesis pathway from SP_vs_SS comparative group. Notably, the phenylalanine metabolism, linoleic acid metabolism, and flavonoid biosynthesis pathway has been determined that were most highly correlated with the substance change in all comparative groups. Therefore, the three pathways were analyzed for elucidating the metabolic mechanism responsible to the observed differences in all comparative groups.
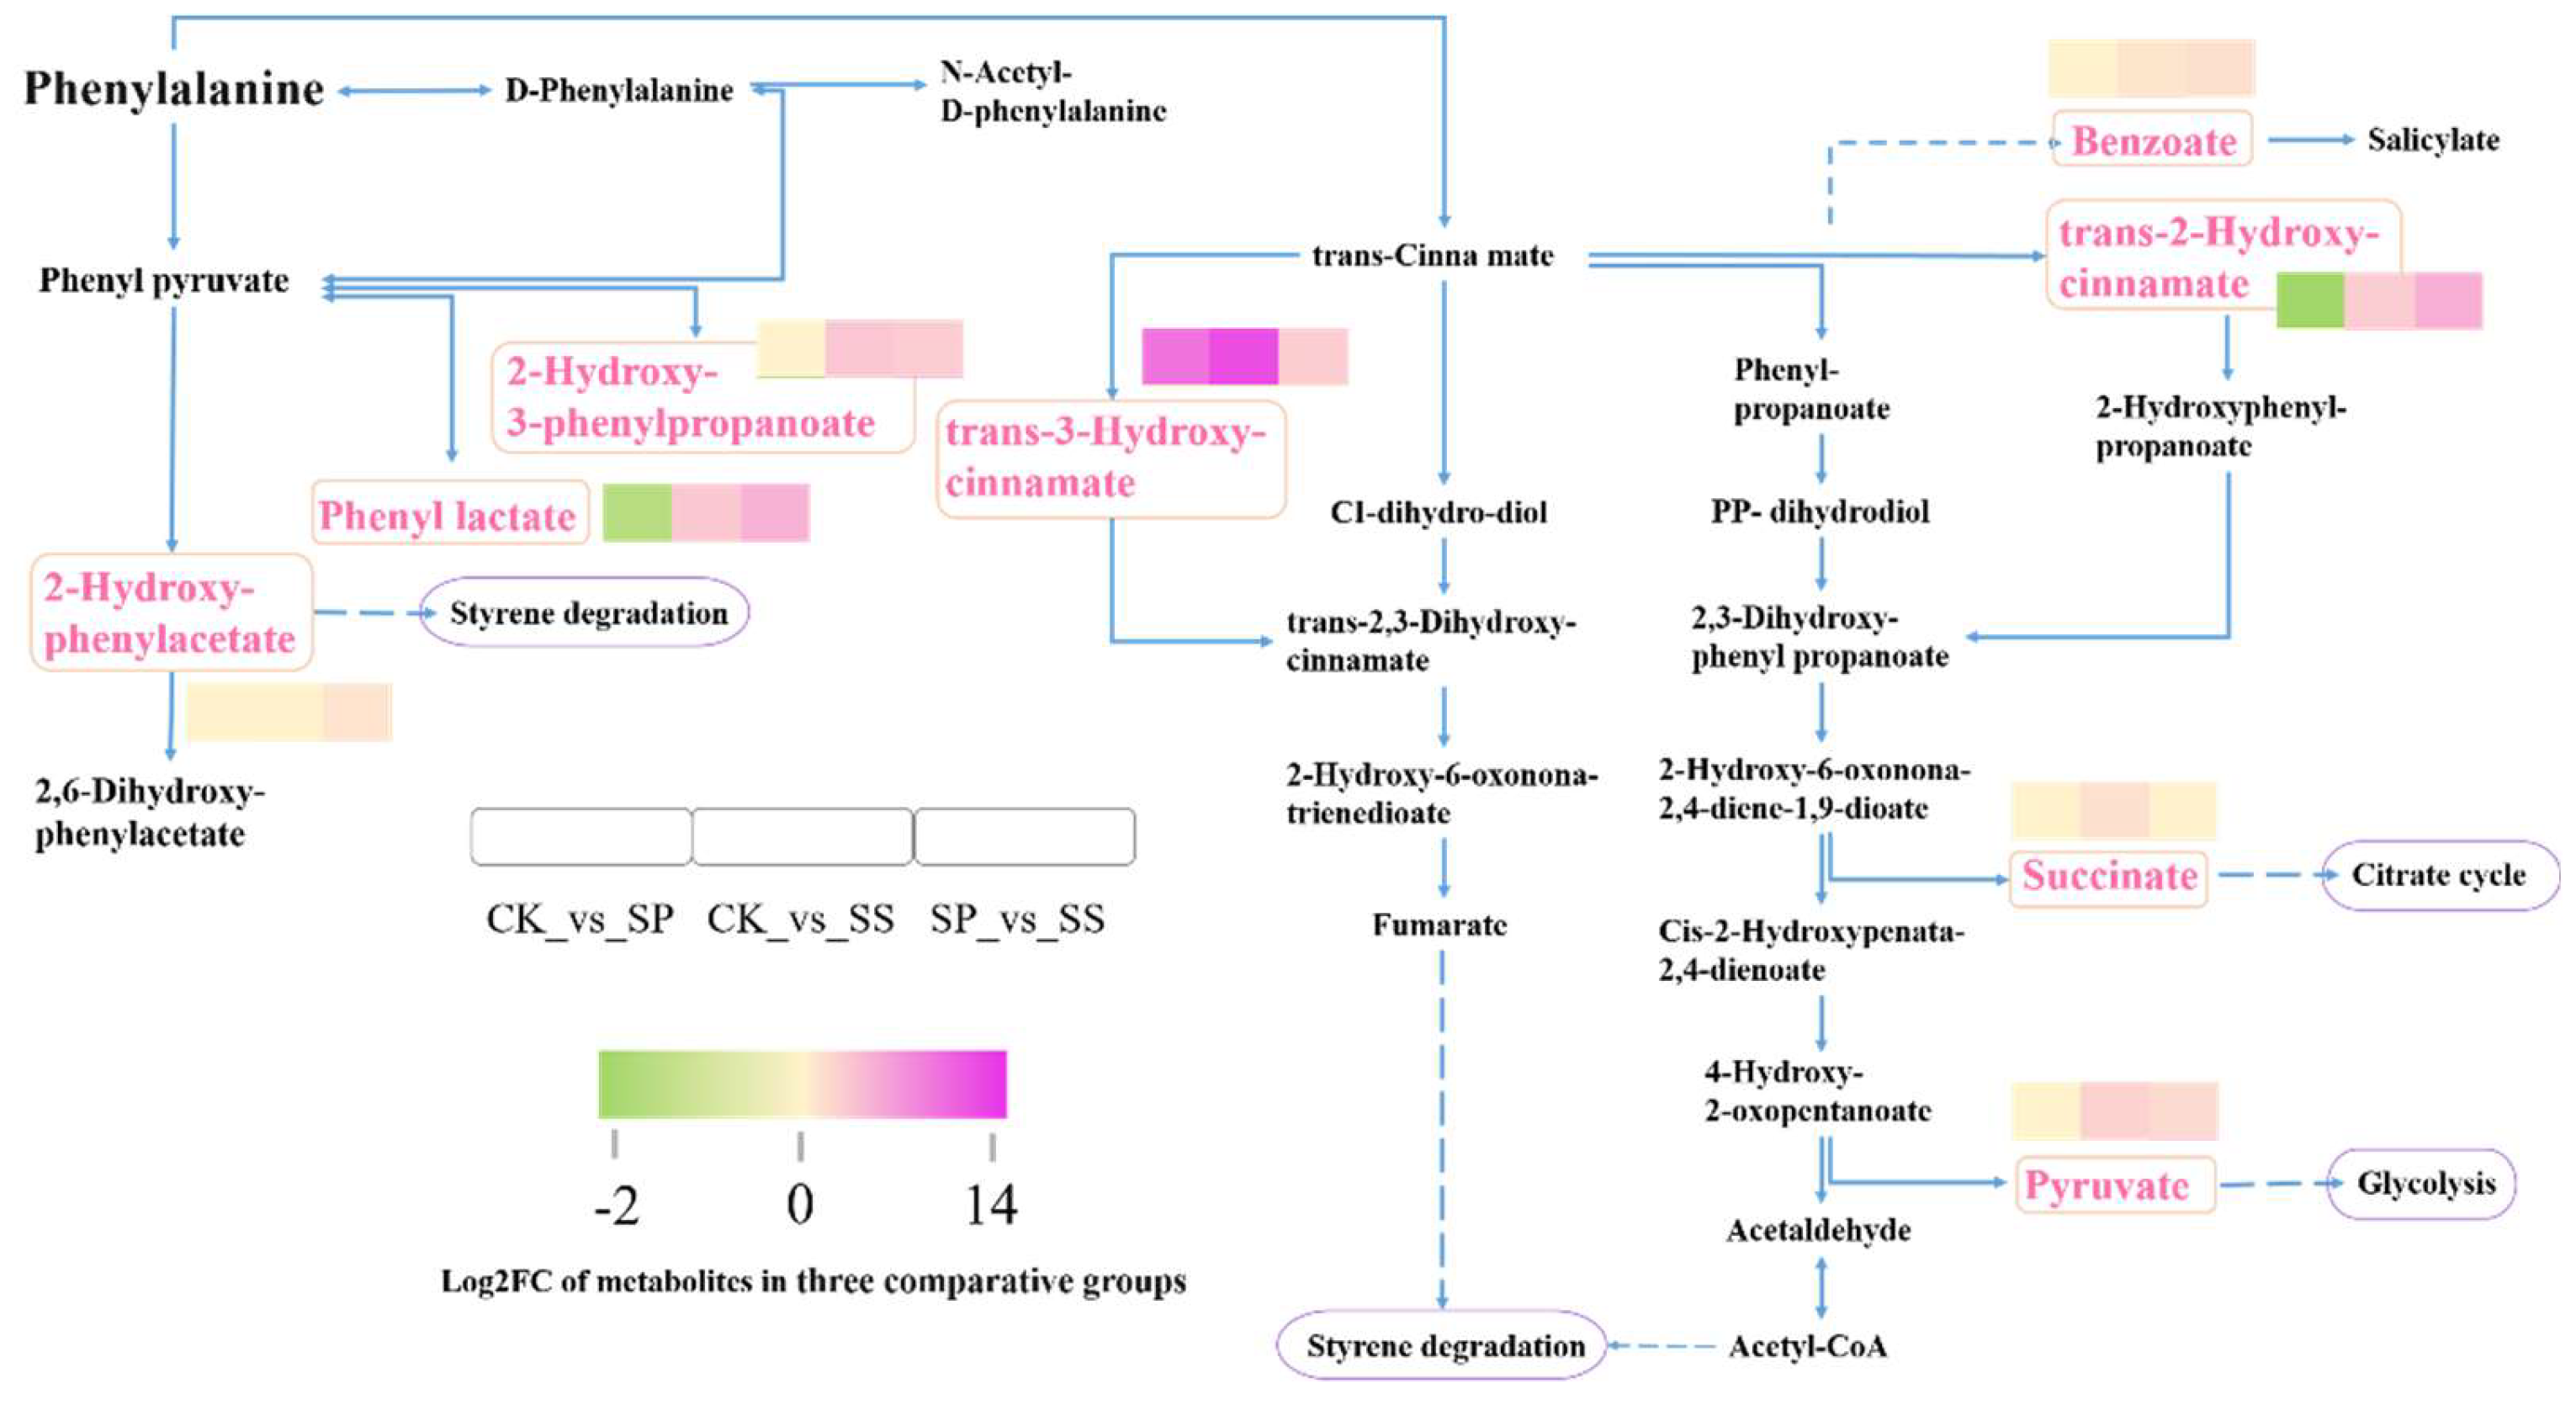
Further analysis indicated that metabolites involved in phenylalanine metabolism pathway were dramatically activated in all comparative groups. The accumulation of 2-Hydroxy-3-phenylpropanoate, trans-3-Hydroxy-cinnamate, 2-Hydroxy-phenylacetate, benzoate, succinate, pyruvate, and trans-2-Hydroxy-cinnamate changed significantly in three comparing groups. The results showed that, comparing with CK, the phenyl lactate and trans-2-Hydroxy-cinnamate was higher accumulated in SS and reduced in SP, the trans-3-Hydroxy-cinnamate was higher accumulated in SS and SP, the Benzoate, succinate, pyruvate, and 2-Hydroxy-3-phenylpropanoate was higher accumulated in SS. In comparing with SP, the phenyl lactate, trans-2-Hydroxy-cinnamate, trans-3-Hydroxy-cinnamate, Benzoate, pyruvate, and 2-Hydroxy-3-phenylpropanoate was higher accumulated in SS (Figure 11).
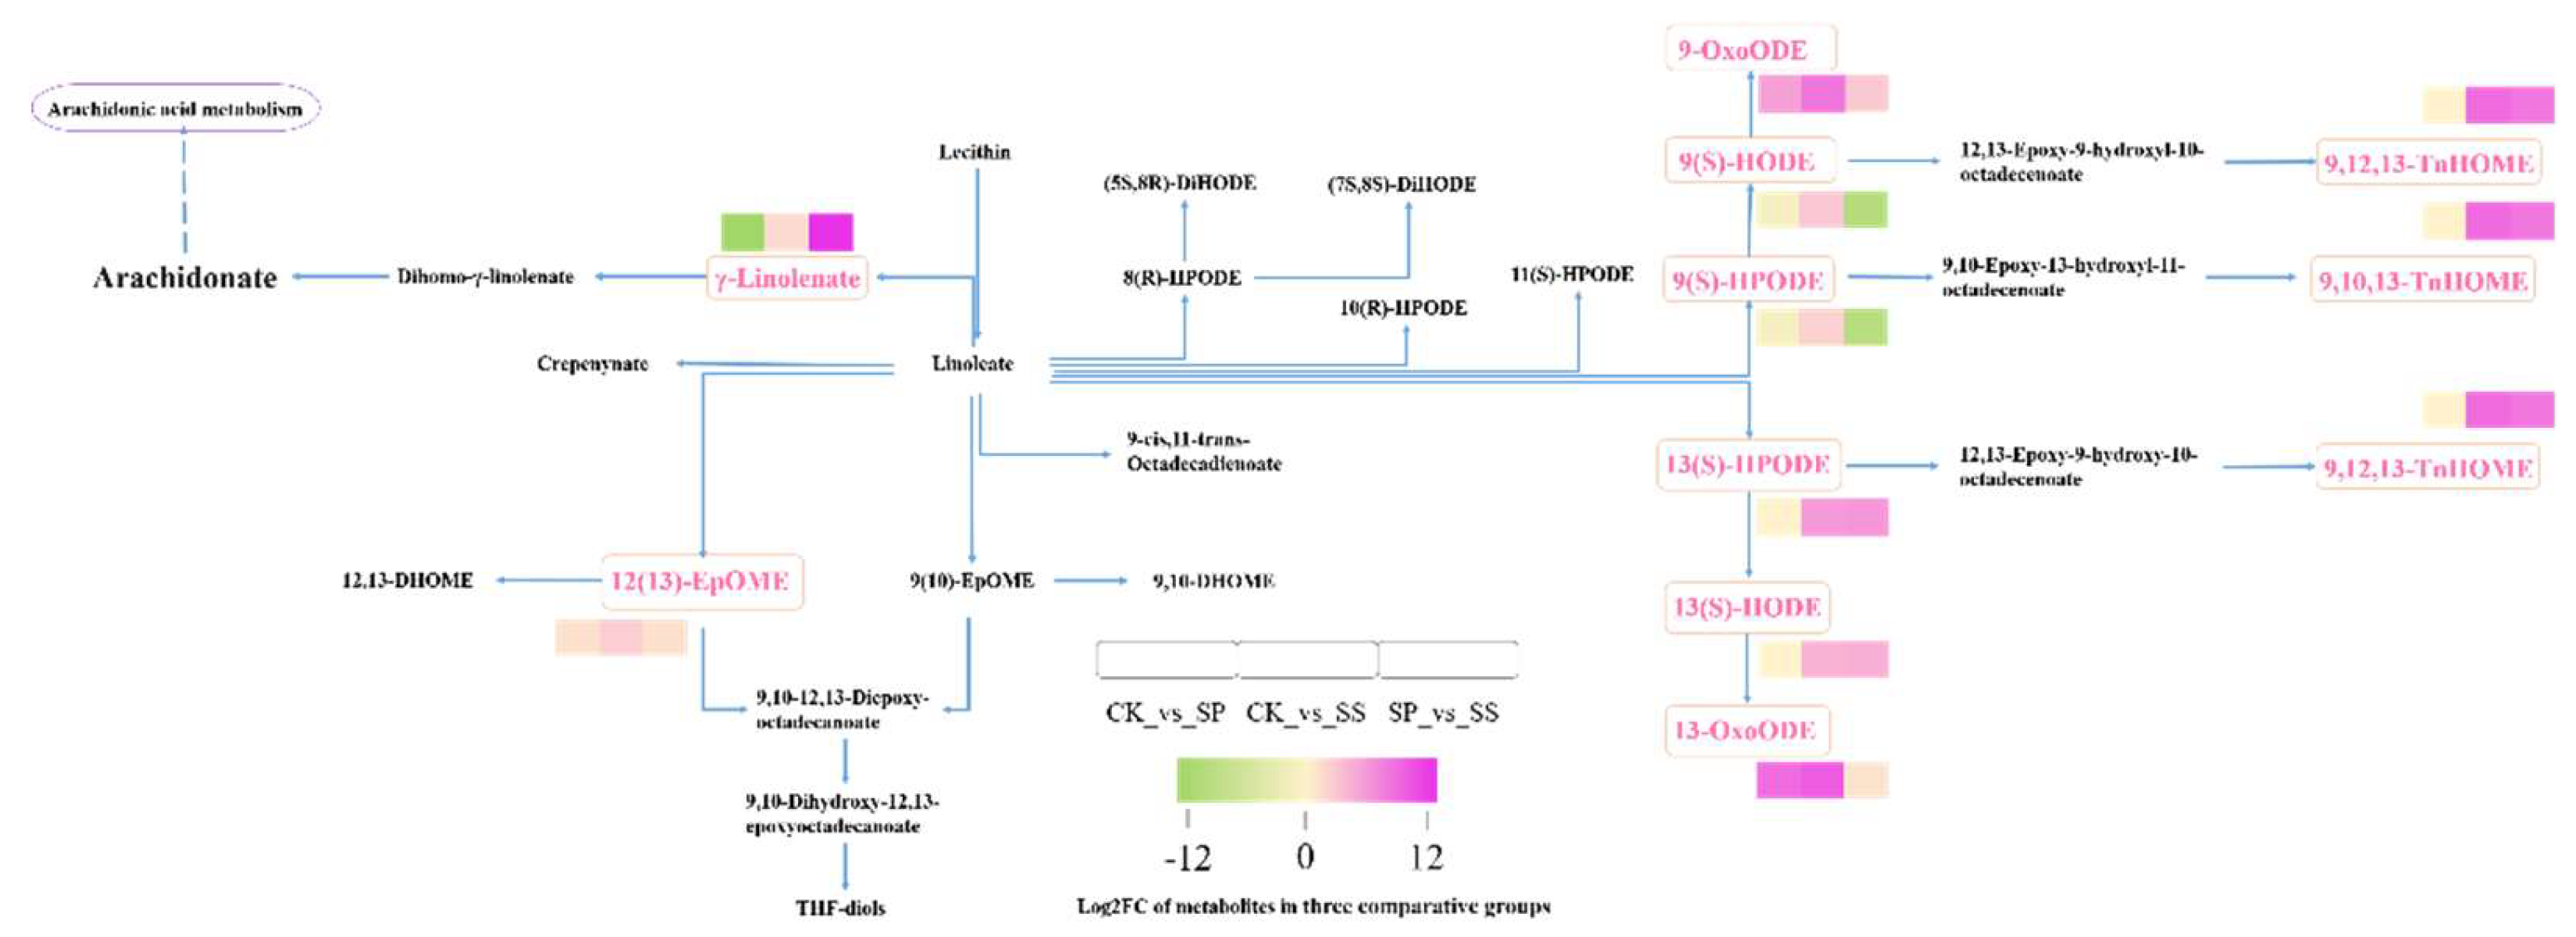
In Linoleic acid metabolism pathway, γ-Linolenate, 9-OxoODE, 13(S)-HODE, 13(S)-HPODE, 13-OxoODE, 9,12,13-TnHOME, 9,10,13-TnHOME, 12(13)-EpOME, 9(S)-HODE and 9(S)-HPODE were significantly differential accumulated in three comparing groups. In comparing with CK, the 9-OxoODE and 13-OxoODE were higher accumulated in SP and SS, the 9,12,13-TnHOME, 9,10,13-TnHOME, 12(13)-EpOME, 13(S)-HODE, 13(S)-HPODE, 9(S)-HODE and 9(S)-HPODE were higher accumulated in SS, while the γ-Linolenate was reduced in SP. In comparing with SP, the γ-Linolenate, 13(S)-HODE, 13(S)-HPODE, 9,12,13-TnHOME, 9,10,13-TnHOME, and 12(13)-EpOME were higher accumulated in SS, while the 9(S)-HODE and 9(S)-HPODE reduced (Figure 12).
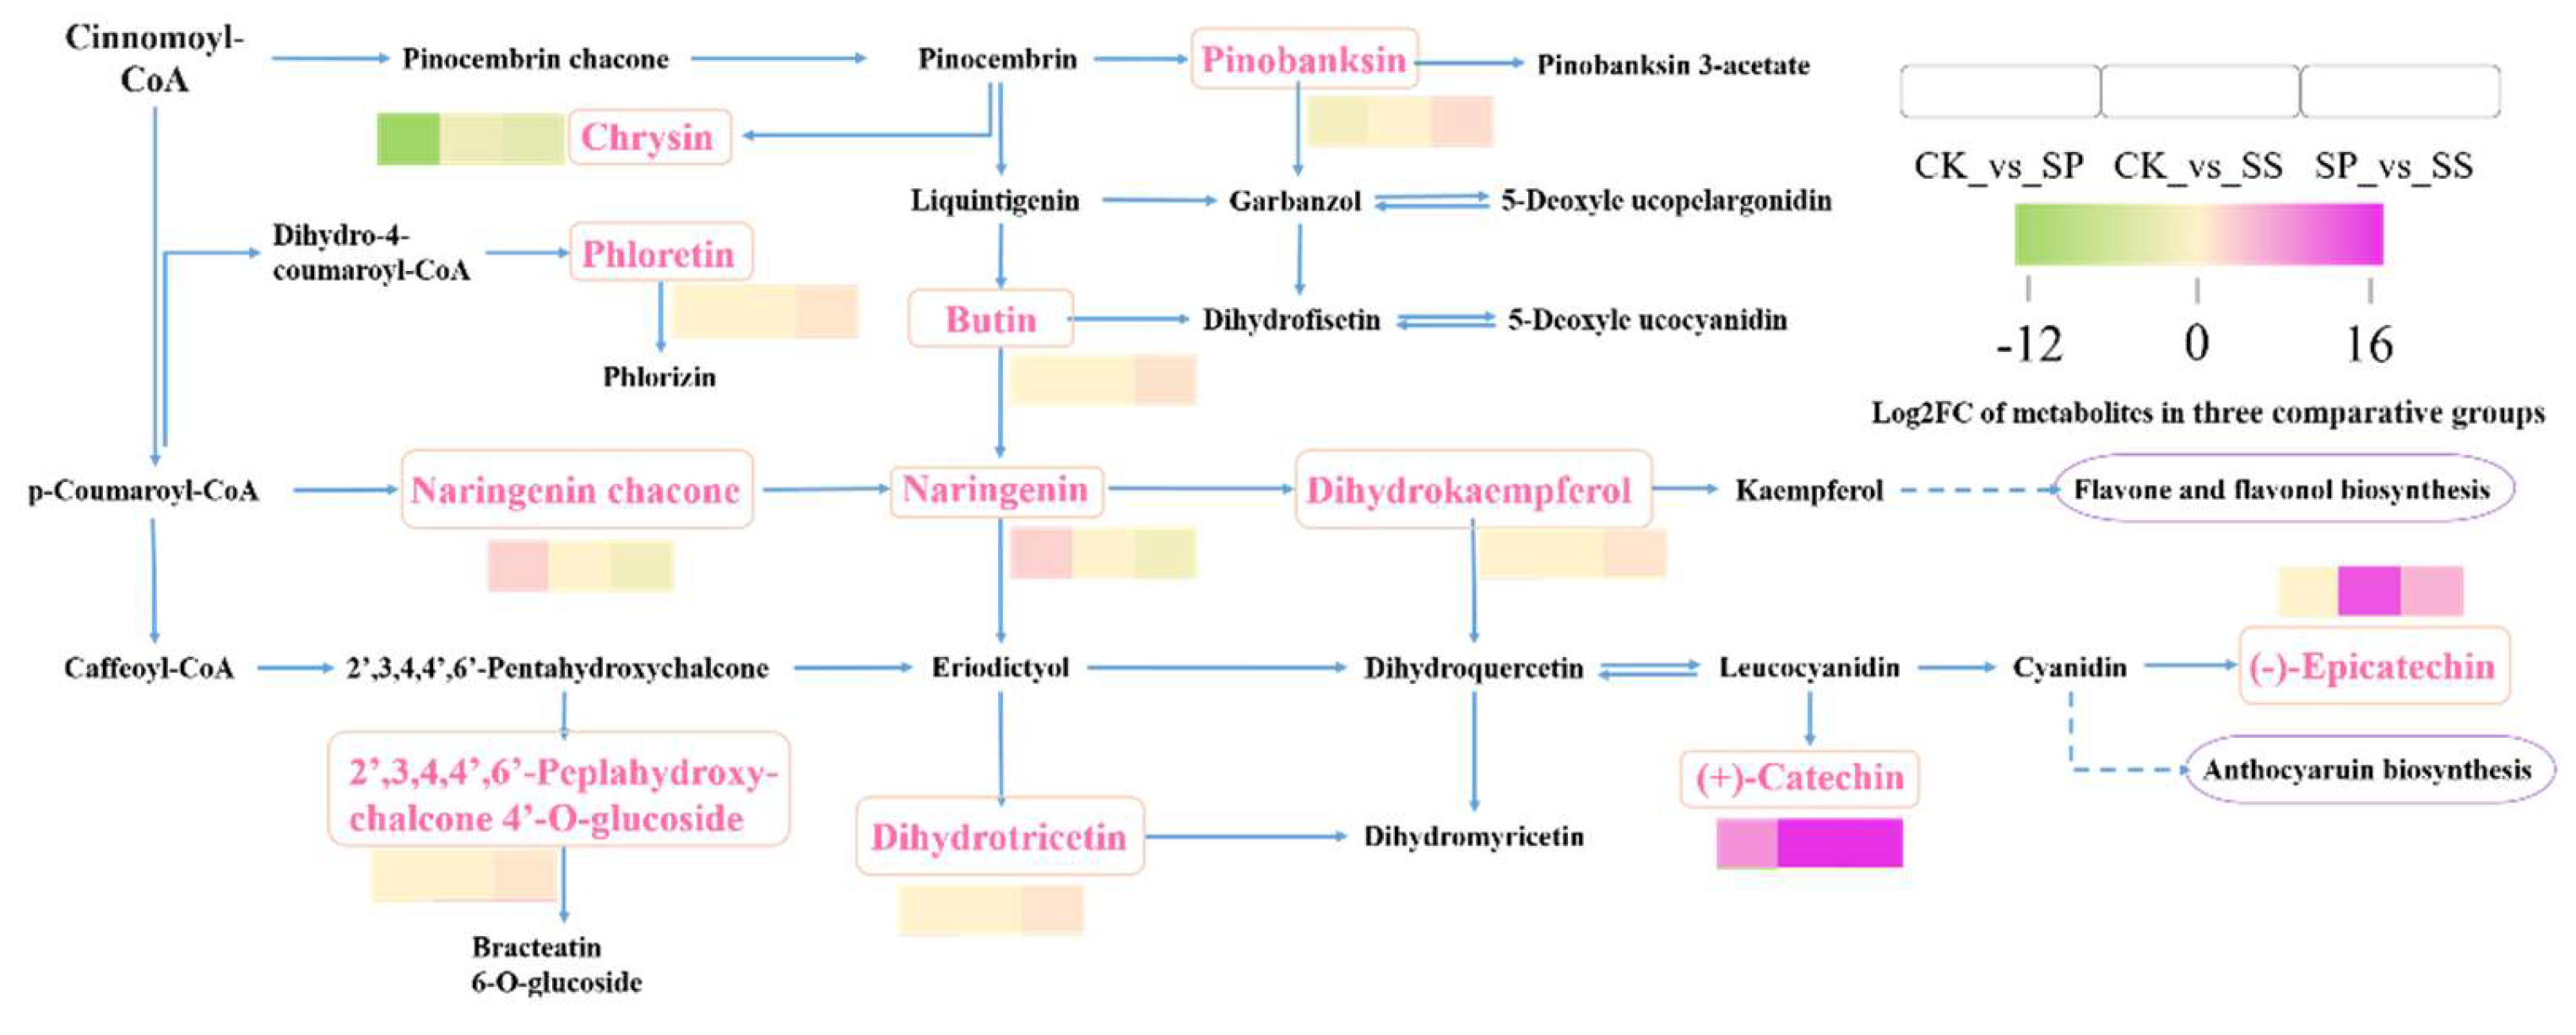
In Flavonoid biosynthesis pathway, the Pinobanksin, Chrysin, Phloretin, Butin, Naringenin chacone, Naringenin, Dihydrokaempferol, 2′,3,4,4′,6′-Peplahydroxy-chalcone 4′-O-glucoside, Dihydrotricetin, (+)-Catechin, and (-)-Epicatechin were significantly differential accumulated in three comparing groups. In comparing with CK, the Naringenin chacone, Naringenin, and (+)-Catechin were higher accumulated in SP, while the Chrysin reduced. And the (+)-Catechin and (-)-Epicatechin were higher accumulated in SS than CK. In comparing with SP, the Pinobanksin, Phloretin, Butin, Dihydrotricetin, Dihydrokaempferol, 2′,3,4,4′,6′-Peplahydroxy-chalcone 4′-O-glucoside, (+)-Catechin, and (-)-Epicatechin were higher accumulated in SS, while the Chrysin reduced (Figure 13).

3.3. Metabolites Related to Safranal and Picrocrocin Change under Three Cropping Patterns

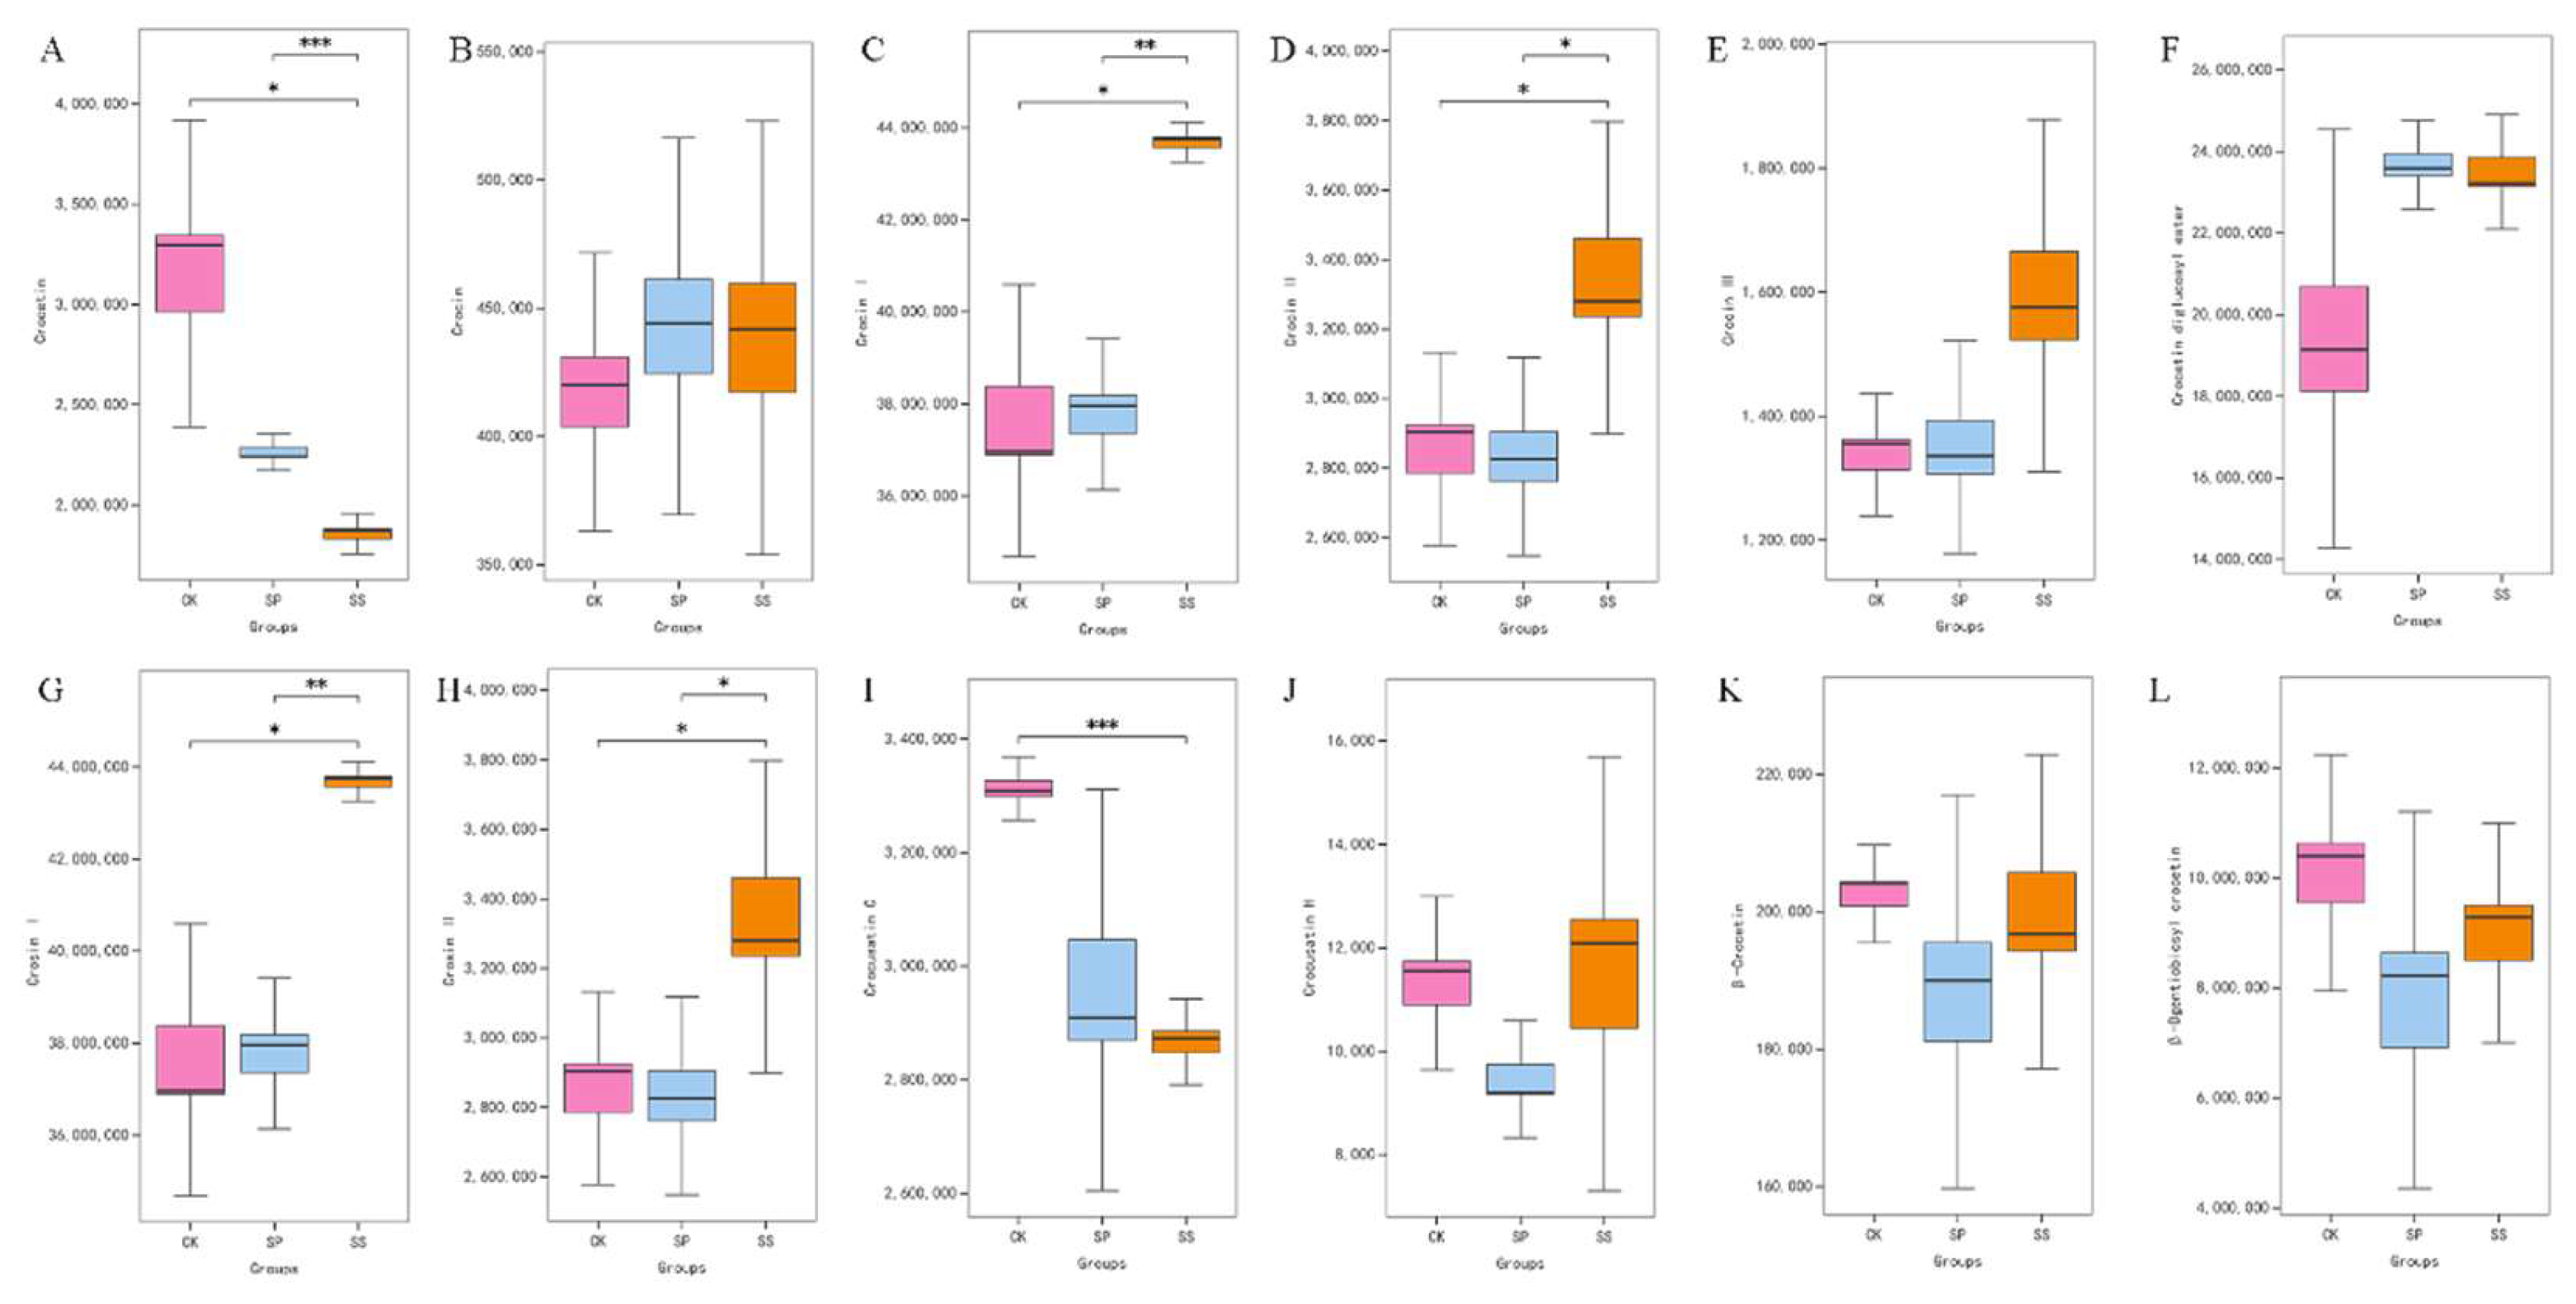
The relative content of metabolites related to Saffron quality, such as Crocetin, Crocin, Crocin І, Crocin II, Crocin III, Crosin І, and Crosin II, were examined and compared. The results showed that the Soybean intercropping pattern had a significant effect on the accumulation of Crocetin (Figure 14, A; p ≤ 0.001), Crocin І (Figure 14, C; p ≤ 0.01), Crocin II (Figure 14, D, p ≤ 0.05), Crosin І (Figure 14, G; p ≤ 0.01), Crosin II (Figure 14, H; p ≤ 0.05), and Crocusatin C (Figure 14, I; p ≤ 0.001).

4. Discussion

Saffron is an autumn flowering geophyte, unique to blooming distinct differ from most spring or summer flowering plants, being well adapted to plateaus, plains, and mountain ranges between 30 and 39 degrees north [1,2]. Differing from most plants, while the summer sunlight was absorbed for photosynthesis by leaves of others, the corms of Saffron need to be hidden in soil with shade [2,3]. The corms grow and develop through the summer, and the stigmas are harvested in autumn as a Chinese medicinal herb. However, continuous mono cropping obstacle has been proposed as an inhibition to the yield and the quality of stigmas for the cause of degeneration and pest [2,6,7,15]. Intercropping, as an effective strategy for cultivation, applied in crop-growing extensively [7,24]. Crop intercropping and understory intercropping has been proved to be effective to herb production and quality [7,24]. Due to the interesting biological habit, soybean-Saffron, maize-Saffron, and trees-Saffron intercropping methods appear to be viable.
The results of mono cropping, soybean intercropping, and paulownia intercropping field experiments in our study showed that intercropping patterns had significant effect on yield and quality of Saffron (Figure 4). And the differential accumulated metabolites mainly mapped to phenylalanine metabolism, linoleic acid metabolism, and flavonoid biosynthesis pathways [Figure 11, Figure 12, Figure 13]. It is remarkably similar to those of the previous studies indeed [3,7,24]. Notably, soybean intercropping pattern presented greater advantage in stigma length and biosynthesis of Kaempferol (Figure 9), flavonoids (such as, crocetin, crocin, Crocusatin C, Catechin, and Epicatechin) (Figure 13, Figure 14), phenolic acids (such as trans-3-Hydroxy-cinnamate, phenyl lactate, trans-3-Hydroxy-cinnamate) (Figure 10), and lipids (9-OxoODE, 13-OxoODE, 9,12,13-TnHOME, 9,10,13-TnHOME, and γ-Linolenate) (Figure 12).
It is reported that nitrogen as the most essential element needed for plant growth and development in Saffron [31]. For this reason this enhancement of both stigma length and metabolites accumulation, could be mainly attributed to the nitrogen fixed into the soil by soybean through symbiotic nitrogen fixation [29,30]. It is generally accepted that an appropriate intercropping improves soil structure and shading effect resulting in higher yield and quality of the intercrop [7,15,24]. Since legumes make substantial net N contributions to soil fertility, which could also be used to more efficiently accumulate flavonoids, phenolic acids, and lipids of Saffron, thus increasing stigma yields and quality in intercrops [15,31]. By contrast, the paulownia intercropping pattern performed slightly inferior, but better than the mono. The findings are similar to the walnut-Saffron intercropping and almond-Saffron intercropping [7,24]. The experiment on the effect of walnut intercropping on soil microbial count, biological characteristics and yield of Saffron, the quality of stigma showed that the total H15 microbial count was 33.21×10 ~ 5cfu/g, which was 1.55 times of that of the mono. The flower number and stigma length under walnut was significantly different from those of mono. And the quality of crocin in walnut intercropping showed a certain influence on the higher accumulation of crocin and Crosin [24]. These results indicate that the effect of intercropping which is represented by metabolites accumulation and biological traits of Saffron production, and also suggest that the intercropping pattern can be popularized in plain area.
However, the critical factors influencing Saffron production and quality are complex and diversified, such as germplasm, corm quality, plant depth and density, soil properties, irrigation, and canopy density. Therefore, determining the optimal planting method of Saffron, which is a combination of various aspects, is crucial in optimizing the yield and quality of Saffron.

5. Conclusions

In general, the results showed that differential accumulated metabolites were significantly enriched in phenylalanine metabolism, linoleic acid metabolism, and flavonoid biosynthesis. The certain flavonoids (such as Chrysin, (+)-Catechin, and (-)-Epicatechin), phenolic acids (trans-2-Hydroxy-cinnamate, trans-3-Hydroxy-cinnamate, and 2-Hydroxy-3-phenylpropanoate), and lipids (γ-Linolenate, 9-OxoODE, and 13-OxoODE,) were significantly differential accumulated in Saffron stigmas under three comparing groups. By intercropping pattern, especially soybean intercropping, flower yield and stigma length and indicators improved. The effects of soybean intercropping pattern were significant on the concentrations of Crocetin, Crocin, Crocin І, Crocin II, Crocin III, Crosin І, Crosin II, and Crocusatin C in Saffron stigma. Therefore, to achieve suitable economic yield in Saffron cultivation, application of soybean intercropping pattern is suggested for plain areas with similar climatic and edaphic conditions to this experiment. To optimize the planting patterns of saffron, study on planting depth, water and nutrient management, germplasm improvement should be concerned for further.

Author Contributions

Conceptualization, Q.J. and K.L.; methodology, Y.Z.; software, J.Z.; validation, W.G., Y.Y. and X.C.; formal analysis, Q.J.; investigation, K.L.; resources, Y.Z.; data curation, J.Z.; writing—original draft preparation, Q.J.; writing—review and editing, Q.J.; visualization, L.Z.; supervision, H.C.; project administration, Q.J.; funding acquisition, Q.J. All authors have read and agreed to the published version of the manuscript.

Funding

This research was funded by Education Department of Anhui Province University Science and Technology Project, grant number 2023AH052276.

Data Availability Statement

The original contributions presented in the study are included in the article, further inquiries can be directed to the corresponding authors.

Acknowledgments

We would like to thank Wuhan Matware Biotechnology for assistance with the metabolic data analysis.

Conflicts of Interest

The authors declare no conflicts of interest. The funders had no role in the design of the study; in the collection, analyses, or interpretation of data; in the writing of the manuscript; or in the decision to publish the results”.

References

  1. Sepaskhah, A.R.; Kamgar-Haghighi, A.A. Saffron irrigation regime. International Journal of Plant Production 2009. 3, 1735–8043. https://www.researchgate.net/publication/285805929_Saffron_Irrigation_Regime.
  2. Fabio, G.; Carmelo, S.; Giovanni, A. Crop rotation as an effective strategy for Saffron (Crocus sativus L.) cultivation. Scientia Horticulturae 2016. 211, 34-39. [CrossRef]
  3. Souret, F. F.; Weathers, P. J. Cultivation, in vitro Culture, Secondary Metabolite Production, and Phytopharmacognosy of Saffron (Crocus sativus L.). Journal of Herbs, Spices & Medicinal Plants 2000. 6(4), 99–116. [CrossRef]
  4. Kafi, M., Koocheki, A., Molafilabi, M., Saffron Production and Processing. Ferdowsi University of Mashhad Press, Iran. 2002. http://refhub.elsevier.com/S0926-6690(19)30314-0/sbref0135.
  5. Tammaro, F. Saffron (Crocus sativus L.) in Italy. In Negbi. M. (ED.). Saffron: Crocus sativus L. Harwood Academic Publishers, Australia, 1999. 53–62.
  6. Kumar, A., Devi, M., Kumar, R. et al. Introduction of high-value Crocus sativus (Saffron) cultivation in non-traditional regions of India through ecological modelling. Sci Rep 2022. 12, 11925. [CrossRef]
  7. Sampathu, S.R.; Shivashankar, S.; Lewis, Y.S.; Wood, A.B. Saffron (Crocus Sativus Linn.)—Cultivation, processing, chemistry and standardization. CRC Critical Reviews in Food Science and Nutrition 2009. 20(2), 123–157. [CrossRef]
  8. Alireza, K.; Seyyed, M.S. Mother Corm origin and planting depth affect physiological responses in Saffron (Crocus sativus L.) under controlled freezing conditions. Industrial Crops and Products 2019. 138. 111468. [CrossRef]
  9. Wohor, O.Z., Rispail, N., Ojiewo, C.O., Rubiales, D. Pea breeding for resistance to rhizospheric pathogens. Plants (Basel) 2022. 11, 2664. [CrossRef]
  10. Zhu, Y.C.; Zhang, J.H.; Gao, X.Q.; Shen, Y.; Qin, L.P.; Zhu, B. Metabolites from a co-culture of Trichoderma yunnanense and Paenibacillus peoriae improve resistance to corm rot disease in Crocus sativus. Industrial Crops and Products 2024. 213, 118465. [CrossRef]
  11. Shah, A.A.; Tripathi, R.B. Improved technology of Saffron (crocus sativus l.) cultivation in kashmir. Asian Journal of Horticulture 2008. 3, 446-448.
  12. Seyyed, J.A.; Ali, S.; Jafar, N.; Ehsan, O. Relationship between fertilization and planting depths on antioxidant activity in Saffron (Crocus sativus L.). Industrial Crops and Products 2023. 191, 116004. [CrossRef]
  13. Imane, C.; Laila, S.; Jamal, A. Improved growth and quality of Saffron (Crocus sativus L.) in the field conditions through inoculation with selected native plant growth-promoting rhizobacteria (PGPR). Industrial Crops and Products 2023. 197, 116606. [CrossRef]
  14. Cid-P’erez, T.S.; Nev’arez-Moorillo’n, G.V.; Ochoa-Velasco, C.E.; Navarro-Cruz, A.R.; Herna’ndez-Carranza, P.; Avila-Sosa, R. The relation between drying conditions and the development of volatile compounds in Saffron (Crocus sativus). Molecules 2021. 26, 6954. [CrossRef]
  15. Alonso, D.G.L.; Arghittu, A.; Astrka, K., et al. White Book Saffron in Europe Problems and Strategies for improving the quality and strengthen competitiveness [M]. 2006.
  16. Yaser, E.; Mohammad, B.A.; Ehsan, N. High density planting and manure affect flower yield, corm characteristics, and volatile compounds of Saffron (Crocus sativus L.). Industrial Crops and Products 2006. 176. 114363. [CrossRef]
  17. Fallahi, H.R.; Aghhavani-Shajari, M.; Sahabi, H.; Behdani, M.A.; Sayyari-zohan, M.H.; Vatandoost, S. Influence of some pre and post-harvest practices on quality of Saffron stigmata. Sci. Hortic 2021. 278, 109846.
  18. Zhang, J.; Lu, J.; Zhu, Y.; Huang, Q.; Qin, L.; Zhu, B. Rhizosphere microorganisms of Crocus sativus as antagonists against pathogenic Fusarium oxysporum. Front. Plant Sci 2022. 13, 1045147. [CrossRef]
  19. Guan, B.B.; Xiong, J.E.; Li, K.Q. Research progress of influence of cultivation conditions and technology on yield and quality of Saffron. FUJIAN ANALYSIS & TESTING 2023. 32(03), 20-25.
  20. Wang, Z. Cultivation technique of Saffron rice rotation. Journal of Zhejiang Agricultural Sciences 2015. 56(06), 849-850. https://www.nstl.gov.cn/paper_detail.html?id=feefff99f2c1dfb8bcc76010fd8fe92a.
  21. Lin, L.H.; Zhu, M. Paddy-upland rotation of ‘rice-Saffron’. Shanghai Agricultural Science and Technology 2019. 04, 138-139. https://www.nstl.gov.cn/paper_detail.html?id=3b804bcf5b61ea9fdcd53a7f887b49ea.
  22. Deng, S.F.; Wang, X.R.; Zhang, A.C. Study on Saffron-rice rotation in the lower-middle reaches of Yangtze River basin. Jiangxi Agriculture 2019. 14, 7+10. https://www.cnki.com.cn/Article/CJFDTotal-JXNG201914006.htm.
  23. Yang, H.Q.; Li, C.M.; An, S.F. Study on Maize-Saffron rotation pattern in Henan Province. Tillage and Cultivation 2022. 42(02), 75-77. https://www.cnki.com.cn/Article/CJFDTotal-GZZP202202018.htm.
  24. Xu, J. Effects of intercropping of walnut-Saffron on yield, quality and soil microbial quantity [D]. Xinjiang Agricultural University 2022. https://cdmd.cnki.com.cn/Article/CDMD-10758-1023408373.htm.
  25. Oliver, S.G.; Winson, M.K.; Kell, D.B.; Baganz, F. Systematic functional analysis of the yeast genome. Trends in Biotechnology 1998, 16(9), 373–378. [Google Scholar] [CrossRef] [PubMed]
  26. Kopka, J.; Fernie, A.; Weckwerth, W. Metabolite profiling in plant biology: platforms and destinations. Genome Biol 2004, 5, 109. [Google Scholar] [CrossRef]
  27. Fiehn, O.; Kopka, J.; Dörmann, P. Metabolite profiling for plant functional genomics. Nat Biotechnol 2000, 18, 1157–1161. [Google Scholar] [CrossRef]
  28. Jewett, M.C.; Oliveira, A.P.; Patil, K.R. The role of high-throughput transcriptome analysis in metabolic engineering. Biotechnol. Bioprocess Eng 2005, 10, 385. [Google Scholar] [CrossRef]
  29. Chen, W.; Gong, L.; Guo, Z.; Wang, W.; Zhang, H.; Liu, X.; Yu, S.; Xiong, L.; Luo, J. A novel integrated method for large-scale detection, identification, and quantification of widely targeted metabolites: Application in the study of rice metabolomics. Mol. Plant 2013, 6, 1769–1780. [Google Scholar] [CrossRef]
  30. Yuan, H.; Zeng, X.; Shi, J.; Xu, Q.; Wang, Y.; Jabu, D.; Sang, Z.; Nyima, T. Time-course comparative metabolite profiling under osmotic stress in tolerant and sensitive Tibetan hulless barley. Biomed. Res. Int 2018, 9415409. [Google Scholar] [CrossRef] [PubMed]
  31. Rice, J.F.; Zander, A.; Harris, C.; Booker, T.; Lofton, J. Integrating Cover Crops into Soybean Systems in the Southern Great Plains: Impacts on Yield and Yield Components. Agronomy 2024, 14, 1356. [Google Scholar] [CrossRef]
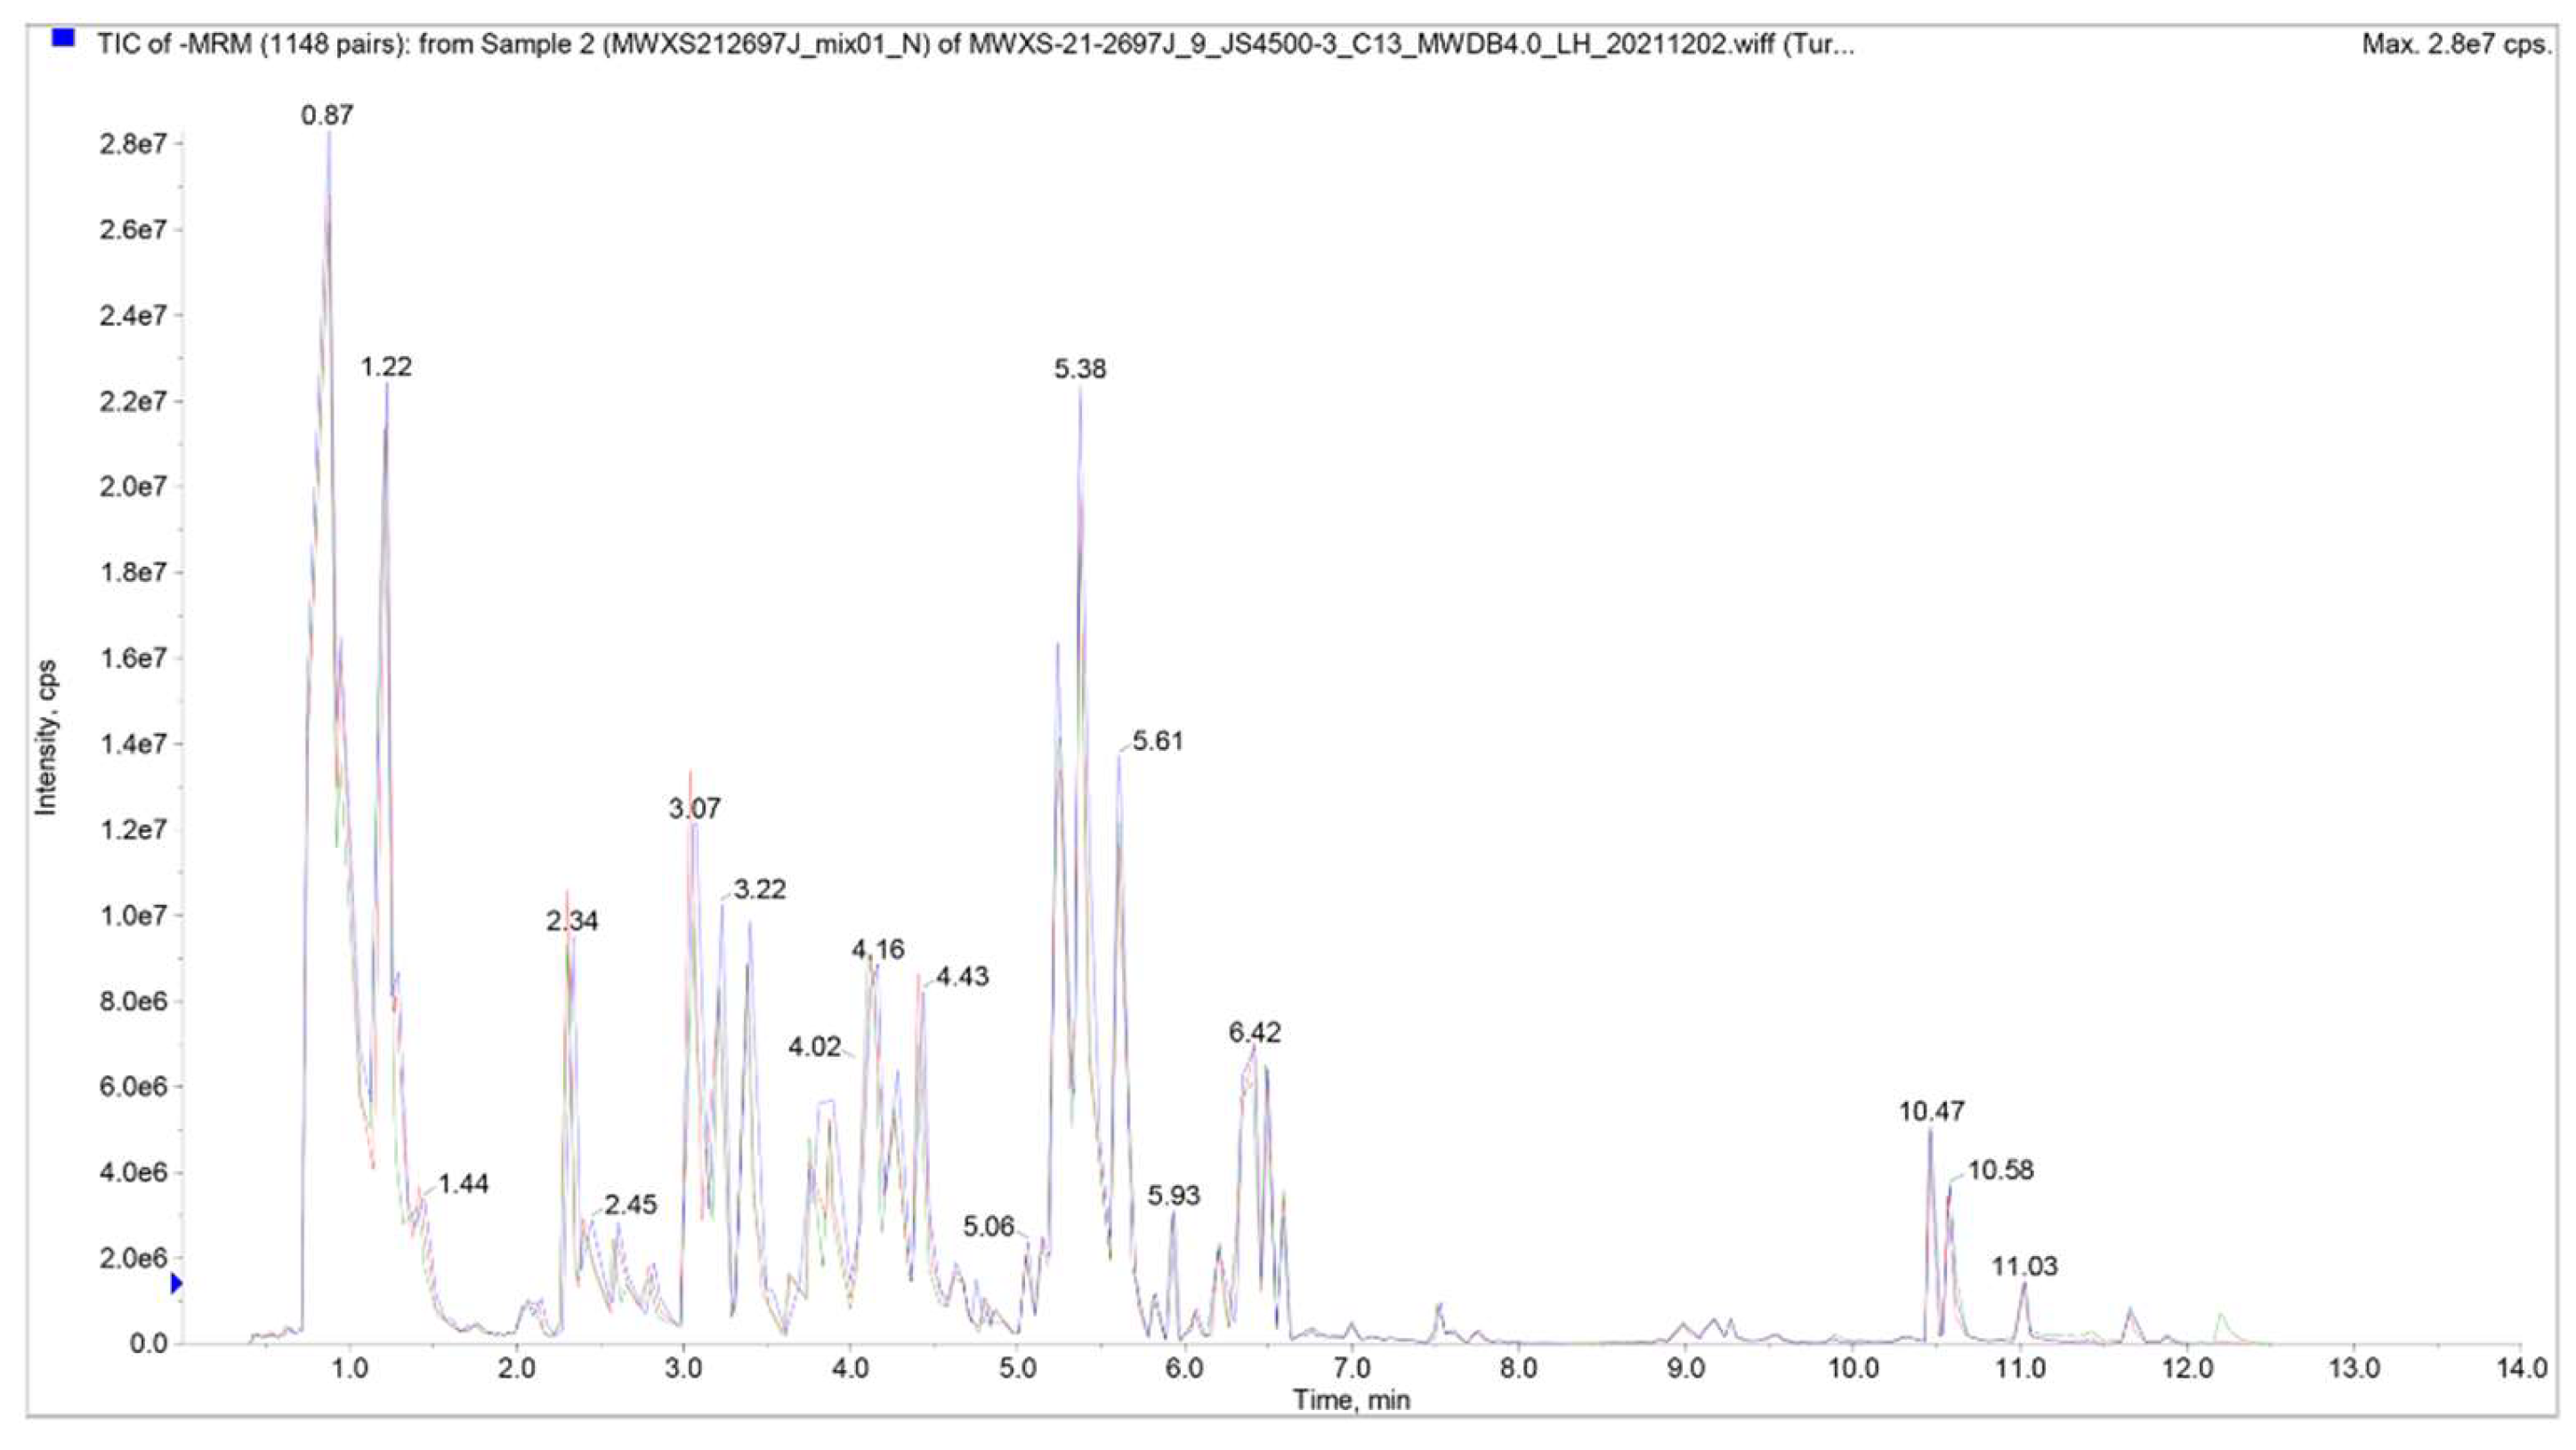
Figure 2. Total ion chromatogram (TlC) overlap of mass spectrometric detection of QC samples. N represents the negative ion mode.
Preprints 116795 g002
Figure 3. Coefficient of variation (CV) Distribution diagram of all group samples.
Preprints 116795 g003
Figure 4. Flower number and stigma length in relation to three cropping patterns. (A) The difference of flower number in three cropping patterns (Mono cropping, CK; Soybean intercropping pattern, SS; Paulownia intercropping pattern, SP). (B) The difference of stigma length in three cropping patterns (CK, SS, and SP).
Preprints 116795 g004
Figure 5. Classified circle chart of all detected metabolites.
Preprints 116795 g005
Figure 6. Heat map visualization of 12 categories of metabolites.
Preprints 116795 g006
Figure 7. Principal component analysis (PCA) of metabolic profiles.
Preprints 116795 g007
Figure 8. Venn diagram of differential accumulated metabolites among three comparison groups.
Preprints 116795 g008
Figure 9. Comparison of upregulated and downregulated metabolites in three comparison groups. (A) Volcano plot of significantly upregulated and downregulated metabolites in Saffron under three comparative groups. (B) Radar charts show that the top 10 metabolites that contribute the separate samples in three comparative groups.
Preprints 116795 g009
Figure 10. Bubble plots of the KEGG enrichment pathways of differential accumulated metabolites in three comparative groups. (A) CK_vs_SP; (B) CK_vs_SS; (C) SP_vs_SS.
Preprints 116795 g010
Figure 11. Comparative analysis of differential accumulated metabolites involved in Phenylalanine metabolism pathway.
Preprints 116795 g011
Figure 12. Comparative analysis of differential accumulated metabolites involved in Linoleic acid metabolism pathway.
Preprints 116795 g012
Figure 13. Comparative analysis of differential accumulated metabolites involved in Flavonoid biosynthesis pathway.
Preprints 116795 g013
Figure 14. Comparative analysis of quality related metabolites under three cropping patterns (CK, SP, and SS). (A) The difference in relative content of Crocetin. (B) The difference in relative content of Crocin. (C) The difference in relative content of Crocin І. (D) The difference in relative content of Crocin II. (E) The difference in relative content of Crocin III. (F) The difference in relative content of Crocetin Diglucosyl ester. (G) The difference in relative content of Crosin І. (H) The difference in relative content of Crosin II. (I) The difference in relative content of Crocusatin C. (J) The difference in relative content of Crocusatin H. (K) The difference in relative content of β-Crocetin. (L) The difference in relative content of β-Dgentiobiosyl crocetin.
Preprints 116795 g014
Disclaimer/Publisher’s Note: The statements, opinions and data contained in all publications are solely those of the individual author(s) and contributor(s) and not of MDPI and/or the editor(s). MDPI and/or the editor(s) disclaim responsibility for any injury to people or property resulting from any ideas, methods, instructions or products referred to in the content.
Copyright: This open access article is published under a Creative Commons CC BY 4.0 license, which permit the free download, distribution, and reuse, provided that the author and preprint are cited in any reuse.
Prerpints.org logo

Preprints.org is a free preprint server supported by MDPI in Basel, Switzerland.

Subscribe

© 2024 MDPI (Basel, Switzerland) unless otherwise stated