Preprint
Article

Evidence of Rapid Rise in Population Immunity from Subclinical Infections in Pakistan from Pre-vaccination Serial Serosurveys in Pakistan

Altmetrics

Downloads

96

Views

71

Comments

0

Submitted:

02 September 2024

Posted:

02 September 2024

You are already at the latest version

Alerts
Abstract
Background: Understanding factors associated with protective immunity against emerging viral infections is crucial for global health. Pakistan reported its first COVID-19 case on February 26, 2020, but compared to other countries, it experienced relatively low COVID-19-related morbidity and mortality between 2020 and 2022. The underlying reasons remain unclear. Our research aims to shed light on this crucial issue. Methods: We conducted serial household surveys over 16 months (Rounds 1-4, July 2020 - November 2021) in urban (Karachi) and rural (Matiari) Sindh, sampling 1100 households and 3900 individuals. Our comprehensive approach included measuring antibodies in sera, testing a subset of respiratory samples for COVID-19 using RT-PCR and antigen tests, and measuring Hemoglobin, CRP, Vitamin D, and zinc in Round 1. Results Participants showed 23% (95% CI 21.9-24.5) antibody seroprevalence in round 1, increasing across rounds to 29% (95% CI 27.4-30.6), 49% (95% CI 47.2-50.9) and 79% (95% CI 77.4-80.8). Urban residents had 2.6 times (95% CI 1.9-3.6) higher odds of seropositivity than rural residents. Seropositivity did not differ between genders. Individuals aged 20-49 had 7.5 (95% CI 4.6-12.4) times higher odds of seropositivity compared to children aged 0-4. Most participants were asymptomatic, with no reported mortality. Vitamin D deficiency was linked to seroprevalence. COVID-19 was confirmed in 1.8% of individuals via RT-PCR and antigen tests. Conclusions: The data suggests a steady increase in humoral immunity in Pakistan, likely due to increased transmission and potential cross-protective immunity, which may be associated with asymptomatic disease, leading to the reduction of morbidity and mortality observed.
Keywords: 
Subject: Public Health and Healthcare  -   Public Health and Health Services

Introduction

The severe acute respiratory syndrome coronavirus 2 (SARS-CoV-2) emerged as a pandemic-causing coronavirus disease (COVID-19) in December 2019 [1,2]. SARS-CoV-2 is a highly transmissible virus [3] that can cause severe illness and death in some individuals. It is an airborne virus that can spread via sneezing, coughing, breathing and speaking, direct contact with infected droplets as well as long range aerosol transmission through the suspended particles and fomites. The World Health Organization (WHO) declared COVID-19 a public health emergency of international concern on January 30, 2020 [3] and the virus was confirmed to have reached Pakistan on 26th February 2020 [4]. Population-level seroprevalence surveys have been used to assess the proportion of individuals infected with SARS-CoV-2 or to determine protection post-immunization. These can also identify risk factors for infection, anticipate the volume of the upcoming waves, and estimate disease burden [5].
The WHO recommended serial seroprevalence surveys to monitor SARS-CoV-2 infections and guide public health strategies and interventions [6]. However, the WHO interim guidelines initially prioritized testing every suspected case of COVID-19, mainly focusing on individuals with severe symptoms and those at high risk for hospitalization to manage healthcare needs and prevent system overload [7] . In Pakistan, early testing of SARS-CoV-2 was limited to patients with severe COVID-19 due to resource constraints [8]. This led to underreporting the full spectrum of the disease in the early phases of the pandemic.
The first confirmed case of COVID-19 in Pakistan was reported on February 26, 2020, with the disease spreading throughout the country. By April 2020, the highest prevalence was reported in Punjab, followed by Sindh province [4]. Pakistan experienced four pandemic waves during the study period (S Figure 1). Up until global reporting of COVID-19 cases was stopped on March 10, 2023, approximately 1.7 million cases and 31,000 deaths were reported from a population of 220 million. Despite the fears that COVID-19 would heavily burden Pakistan’s fragile healthcare system and limited resources, relatively low morbidity and mortality were reported. It is essential to understand the factors associated with these outcomes.
Physical distancing policies varied widely across the country, particularly during the early pandemic period between 2020 and 2021 as the implementation of lockdowns, smart lockdowns, and other movement restrictions depended on city and provincial governments [9,10]. In May 2020, business reopened, leading subsequent surge in COVID-19 cases [11]. However, early 2020 screening efforts were focused on key international conduits identified by the Federal Ministry of Health, aimed at controlling and suppressing COVID-19 in the country [12]. Therefore, it was essential to determine the prevalence of antibodies against SARS-CoV-2 as a surrogate marker of COVID-19 infections within the population. During the early pandemic period, diagnosis of COVID-19 in Pakistan was primarily based on PCR testing. However, access to PCR testing was limited and expensive. Even at the peak of the pandemic in 2020, the maximum number of tests conducted daily was about 70,000 in a population of 220 million [13]COVID-19 antigen tests became available in Pakistan in 2022, but access to them and their use remained limited.
Data from COVID-19 seroprevalence studies conducted in Pakistan mainly focused on cross-sectional sampling at a single time point in specific populations [14,15,16,17]. There is limited data from rural regions with one nationwide study showing differing COVID-19 antibody positivity in urban and rural regions [14]. Pakistan has a predominantly young population, up to 50% of individuals under 40. The recent census shows it is primarily agricultural, with about 37% urban and 63% rural populations [18]. Therefore, to fully understand COVID-19 rates and disease transmission, it is necessary to study both urban and rural populations. Longitudinal sampling allows one to study antibody dynamics in the population, particularly in COVID-19 waves. We focused on the province of Sindh, comparing the population of Karachi, approximately 17.6 million [19], to the population of Matiari, about 0.85 million [20]. The study aimed to determine the prevalence of SARS-CoV-2 antibodies in the general population through serial serosurveys conducted between July 2020 and November 2021 and to associate these with population demographics and health parameters. Sampling was conducted at four-time points within a nested cohort in the same community. This longitudinal approach enabled us to observe temporal changes and trends, providing a good understanding of the community’s response over 18 months. We assessed risk factors for infection by comparing the exposures of antibody-positive and antibody-negative individuals using a standardized questionnaire. We also investigated the presence of SARS-CoV-2 infection by testing respiratory samples in a subset of participants by PCR and COVID-19 antigen testing. Further, during the first survey, we tested blood parameters such as hemoglobin (Hb), serum C-reactive protein (CRP), vitamin D, and zinc concentrations in the study population.

Methods

The study was approved by the Aga Khan University (AKU) ‘s Ethical Review Committee (ERC), Pakistan. Before data collection and serological sampling, written informed consent or assent, in the case of minors, was obtained.

Study Design

Serial, cross-sectional Sero epidemiological surveys were carried out in urban (Karachi) and rural (Matiari) areas of Sindh, Pakistan (Figure 1). The study spanned 16 months, from July 2020 to November 2021, with sampling conducted at four time points in the same population. We adapted the WHO 30 by 7 cluster methodology to ensure population representation. In Karachi, the data was collected from its six districts, i.e., Central, East, West, South, Korangi, and Malir. In the Matiari region, data was collected from both the Hala and Matiari sub-districts. Seven union councils were randomly selected from the available list in each district, which served as primary sampling units. We randomly selected 20 Households from each union council to achieve the required sample size. We enrolled individuals who were residents of the respective districts for at least six months, regardless of age, with no stated intent to migrate.
Data collection and blood sampling were done by six research teams, three in Karachi and three in Matiari. Each research team comprised a phlebotomist, a data collector, and a team leader. Once selected, the same households were revisited at subsequent rounds. The research staff received training on personal hygiene procedures, the use of personal protective equipment, and the safe handling of laboratory samples. After each interview, it was provided with personal protective equipment (aprons, gloves, surgical face masks, and shoe and hair covers) disposed of as hospital waste.
Data were collected from each participant using a structured questionnaire through a computer-assisted personal interview (CAPI) approach. The questionnaire included sections on demographic information, exposure assessment, underlying comorbidities, and a history of any clinical symptoms like chest pain, sore throat, and fever in the past two weeks, as well as a history of travel outside their local region in the past two weeks.

Blood Sample Collection

After administration of the questionnaire, trained phlebotomists collected 3 ml of whole blood from each participant through venipuncture. The blood samples were transported to the Nutrition Research Laboratory (NRL) at AKU, Karachi, under a cold chain. These samples were used for the detection of SARS-CoV-2 antibodies, measurement of hemoglobin, biochemical assessment of vitamin D, C-reactive protein (CRP), and micronutrient (zinc) concentrations.

Measurement of Anti SARS-CoV-2 Antibodies

Antibodies against SARS-CoV-2 were measured in sera through Roche Cobas e411 automated analyzer using Roche Elecsys Anti-SARS-CoV-2 assay kit (Roche, Basel, Switzerland) per manufacturer’s instructions. The assay qualitatively detects total polyclonal antibodies (IgA, IgG, and IgM) against SARS-CoV-2 nucleocapsid (N) antigen. Before each batch, the assay was validated using positive and negative quality controls. Assay values above the cutoff of 1.0 were considered reactive for the presence of anti-SARS-CoV-2 antibodies. Quantitative serum 25-OH vitamin D was determined using the LIASION 25 OH Vitamin D TOTAL assay (DiaSorin, Saluggia, Italy). Zinc levels in plasma were measured using a Thermo scientific atomic absorption spectrometer. Hemoglobin levels were measured using the HemoCue Hb 301 analyzer (HemoCue, CA, USA), while CRP levels were quantified using a Roche CRP (CRPLX) kit on the Cobas c311 analyzer (Roche, Basel, Switzerland).

Detection of SARS-CoV-2 RNA Using RT-PCR

Nasopharyngeal swabs were collected by inserting a sterile swab (Virus RNA collection kit, Beaver, China) into a single nostril and rotated 3-4 times against the nasopharyngeal surface. Respiratory specimens were stored at -80°C until shipped to the National SARS-CoV-2 Reference Lab of the National Institute, Islamabad (NIH-Islamabad) on dry ice. RNA was extracted from 200µl of the media using MagMax Viral/Pathogen II Nucleic Acid Isolation Kit (Thermo Fisher Scientific Inc. Waltham, Massachusetts, US). Real-time PCR was performed using TaqPath COVID-19 CE-IVD RT-PCR Kit on Applied Biosystems 7500 Fast Dx Real-Time PCR Instrument (Thermo Fisher Scientific Inc. Waltham, Massachusetts, US).

COVID-19 Antigen Testing of Respiratory Samples

According to the manufacturer’s guidelines, the rapid antigen test was performed using the SARS-CoV-2 Rapid Antigen Test kit (Roche, Basel, Switzerland). Briefly, the nasopharyngeal swab was collected and inserted into extraction buffer vials and rotated a few times to transfer contents into the buffer, after which the suspension was loaded on the cartridge, and results were read after 15 minutes. A Positive test was recorded when the test line was visible on the cartridge, and the visible control line confirmed the validity for each record. Quality control for each batch run was ensured by testing the commercially available Roche SARS-CoV-2 Antigen Control kit, including positive and negative controls (Roche, Basel, Switzerland).

Sample Size Estimation and Statistical Analysis

We estimated that at least 2974 individuals (at least three individuals per household) stratified by age were needed to estimate an expected seroprevalence of 36% with 5% precision at a 95% level of confidence, with 80% power and a non-response rate of 20%. Reference calculations were based on serological data available at the time [21]. Categorical variables were reported as frequencies and proportions. Seroprevalence was reported by age, gender, socioeconomic status, clinical symptoms, type of residence (rural/ urban), and district for baseline and each follow-up round. Socioeconomic status was assessed using a wealth index derived through principal component analyses of household assets.
Analysis was performed using an intention-to-treat approach. The Pearson Chi-square test was used to establish an association between categorical variables, and trend p-values were used to compare seroprevalence over time by baseline characteristics.
Mixed effect logistic regression was used to explore the impact of time on the seropositive status of the respondent. Individuals were incorporated as a random effect to model individual heterogeneity within seropositive status. The time interaction was tested to measure the impact of change in seropositive status. Furthermore, the analysis adjusted for confounding variables like age, gender, socioeconomic status, type of residence, district, area, medical symptoms, travel history, vitamin D and zinc concentrations, and vaccination status, keeping a positive COVID-19 antibody test as the outcome.
Adjusted odds ratios (OR) with 95% confidence intervals were reported. Covariates examined included age, gender, socioeconomic status, type of residence, district, area, medical symptoms, travel history, vitamin D and zinc levels, and vaccination status. The Cox proportional regression model was used to estimate hazard ratios (HR) and the corresponding 95% confidence intervals for positive cases for all possible risk factors (including area, age, sex, mother tongue, household size, etc.). A p-value of <0.05 was considered statistically significant. Analysis was carried out using STATA Version 17 (StataCorp LLC, College Station, Texas, USA).

Results

Description of Serosurveys

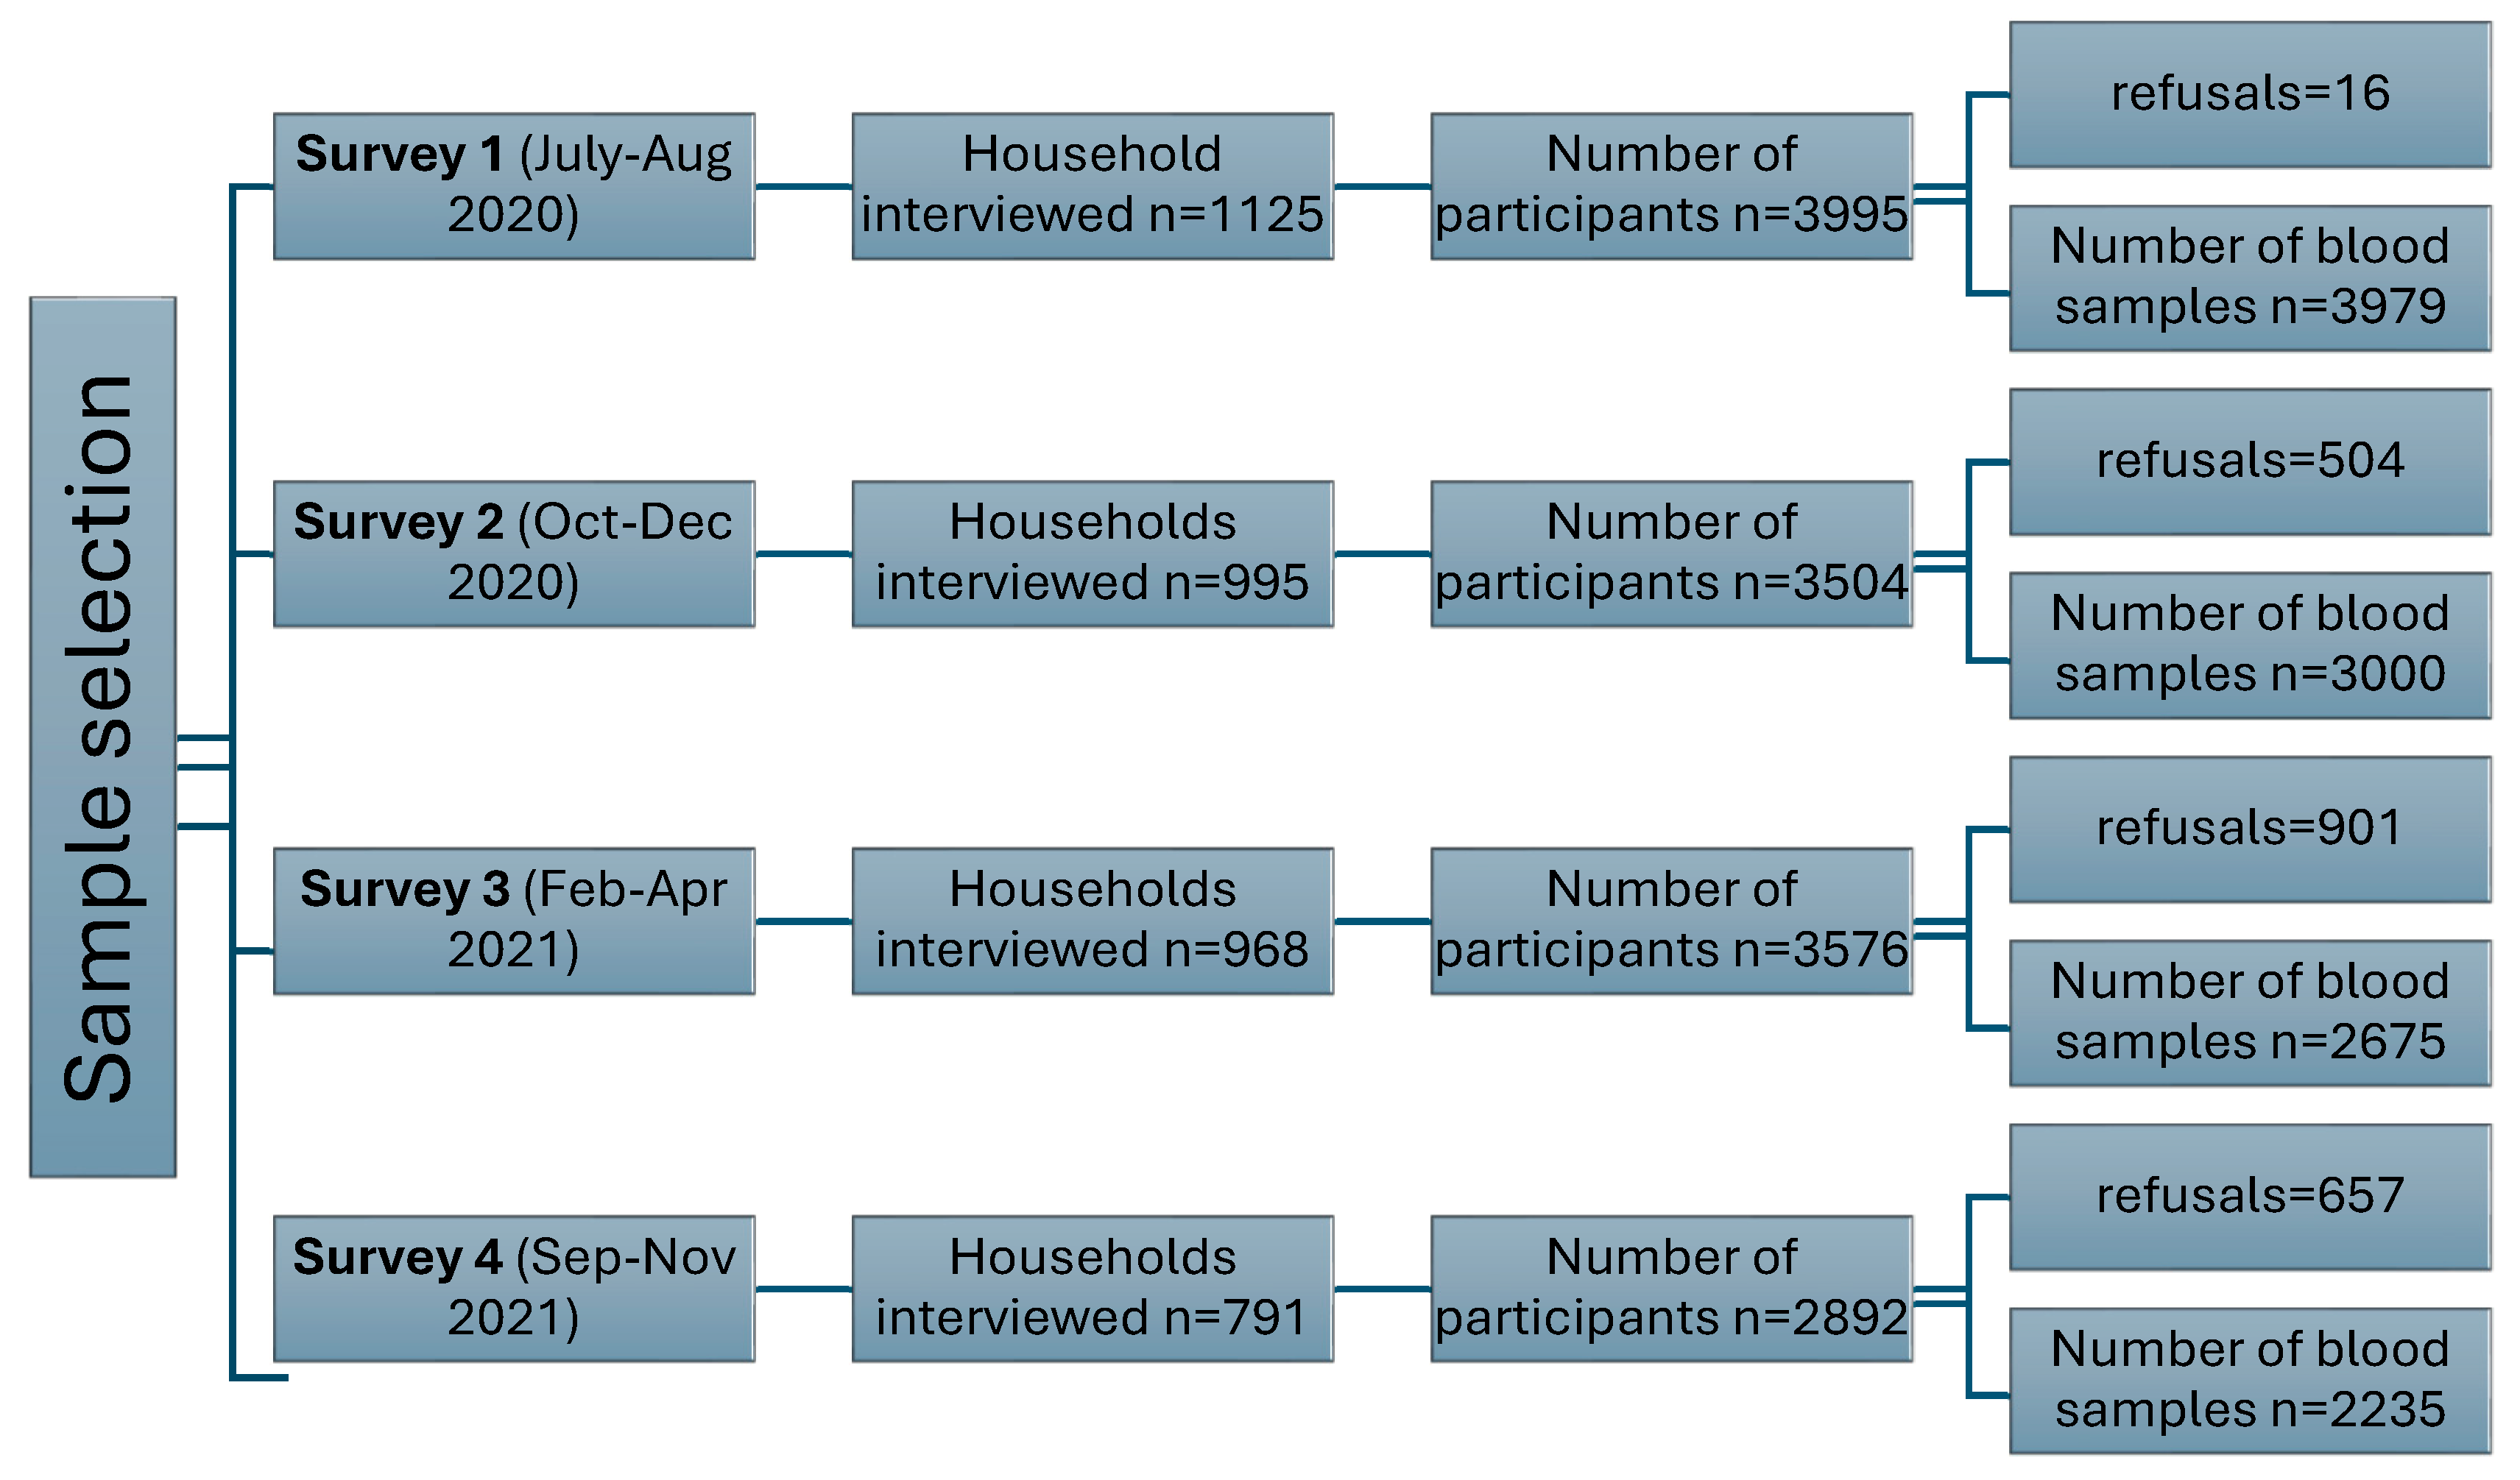
The study comprised four successive household serosurveys conducted between July 2020 and November 2021 (Figure 2). As a result, 11,889 blood samples were collected and tested over the 16 months. The first survey of 1125 households was conducted during July and August 2020, and 3979 subjects consented to interviews and submitted blood samples. The second survey round was conducted from October until December 2020, whereby 995 households were interviewed, recruiting 3000 individuals. The third survey round was conducted between February and April 2021 and included 968 households, from whom 2675 individuals were recruited. The final survey round was conducted between September and November 2021, comprising 791 households, of which 2235 participants were recruited.
In each round, a single blood sample was collected from study participants. Antibodies to SARS-CoV-2 were measured in the sera obtained from each individual across all four rounds of the serosurvey. For every individual recruited to the study, blood samples were tested for health-related parameters, including hemoglobin, CRP, vitamin D, and zinc levels. The tests were performed only once, in Round 1, on the first blood sample collected from each participant.
At each recruitment, demographic and socio-economic data related to any COVID-19-associated symptoms and clinical history were collected. In addition, data associated with any recent travel history was collected during the first survey round. In contrast, information on COVID-19 vaccinations was collected during the fourth survey round, following the introduction of the Sinopharm vaccine in Sindh, Pakistan, for vulnerable adults and front-line workers in March 2021. In each round of the serosurvey, a subset of individuals was selected and sampled using nasal swabs. These swabs were tested for SARS-CoV-2 RNA by PCR in rounds 1 (n=606), 2 (n=742), 3 (n=316), and 4 (n=383), and COVID-19 antigen testing in rounds 2 (n=718), 3 (n=315) and 4 (n=382).

Demographic and Socio-Economic Description of Study Subjects

The study subjects included 43.6% rural and 56.4% urban residents, comprising 60.4% females (Table 1). Sampling was conducted in equivalent age-segregated bands across the four rounds of the serosurvey. Most participants resided in households with six or more individuals (81.7%). Most individuals were identified as belonging to those classified as poor (39.2%). Around half (52.4%) of the sample were of Sindhi ethnicity, likely due to primary sampling within the rural province.
By round 4, COVID-19 vaccinations had been introduced across the country. Therefore, information on vaccination status was collected, with about 50% of participants reporting being vaccinated. Very few individuals (n=113, 3%) reported traveling outside the country in the previous 2 weeks, and very few (n=71, 2%) had visited a health facility in the last two weeks.

Antibody seroprevalence in rural and urban populations

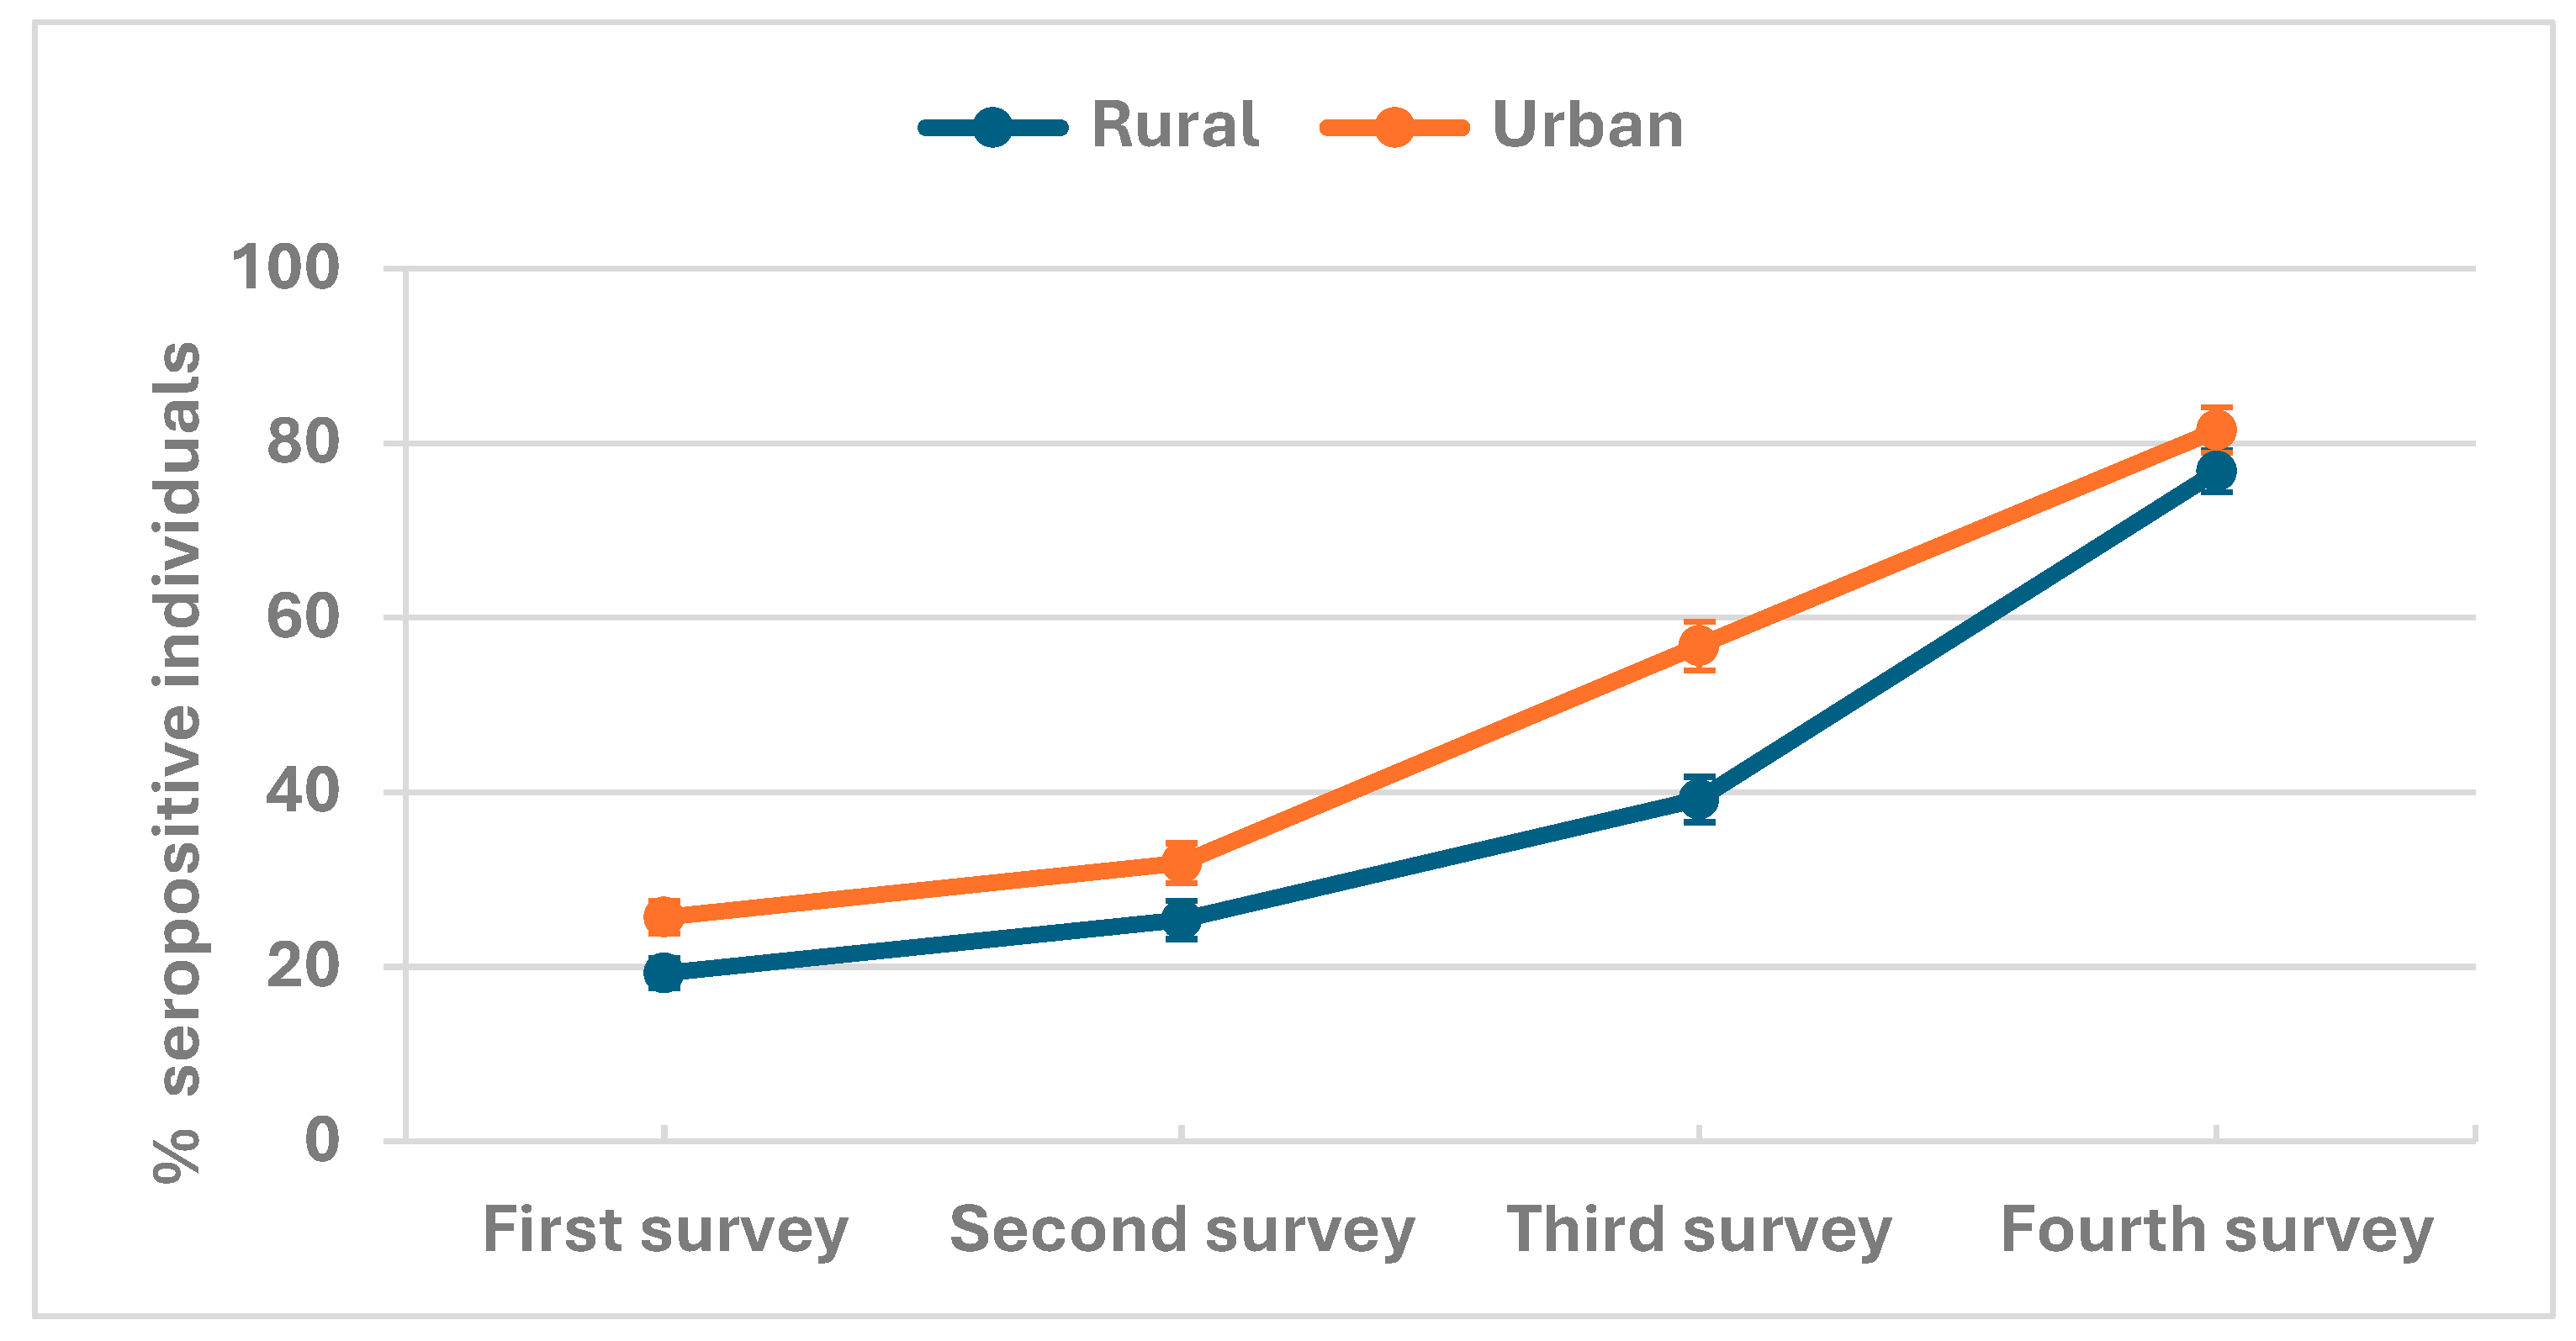
Higher seropositivity in urban areas than in rural areas was observed across the four survey rounds. COVID-19 antibody testing in study subjects revealed that at the time of the first survey (July-August 2020), there was an overall seroprevalence of 23%, with 25.7% positivity in urban areas compared to 19.3% in the rural areas (Table 2, Figure 3A).
By the second round, overall seroprevalence increased to 29% with 31.9% positivity in urban areas versus 25.4% in rural areas. With, a further increase to 49% by the third round and higher (56.8%) seropositivity in urban areas compared to rural areas (39.2%). By the final round, overall seroprevalence was 79%, with 81.5% positivity in urban areas compared to 76.8% in rural areas. The four survey rounds observed higher seropositivity in urban areas than rural ones (Supplementary Table 1).

Factors Associated with SARS-CoV-2 Seropositivity

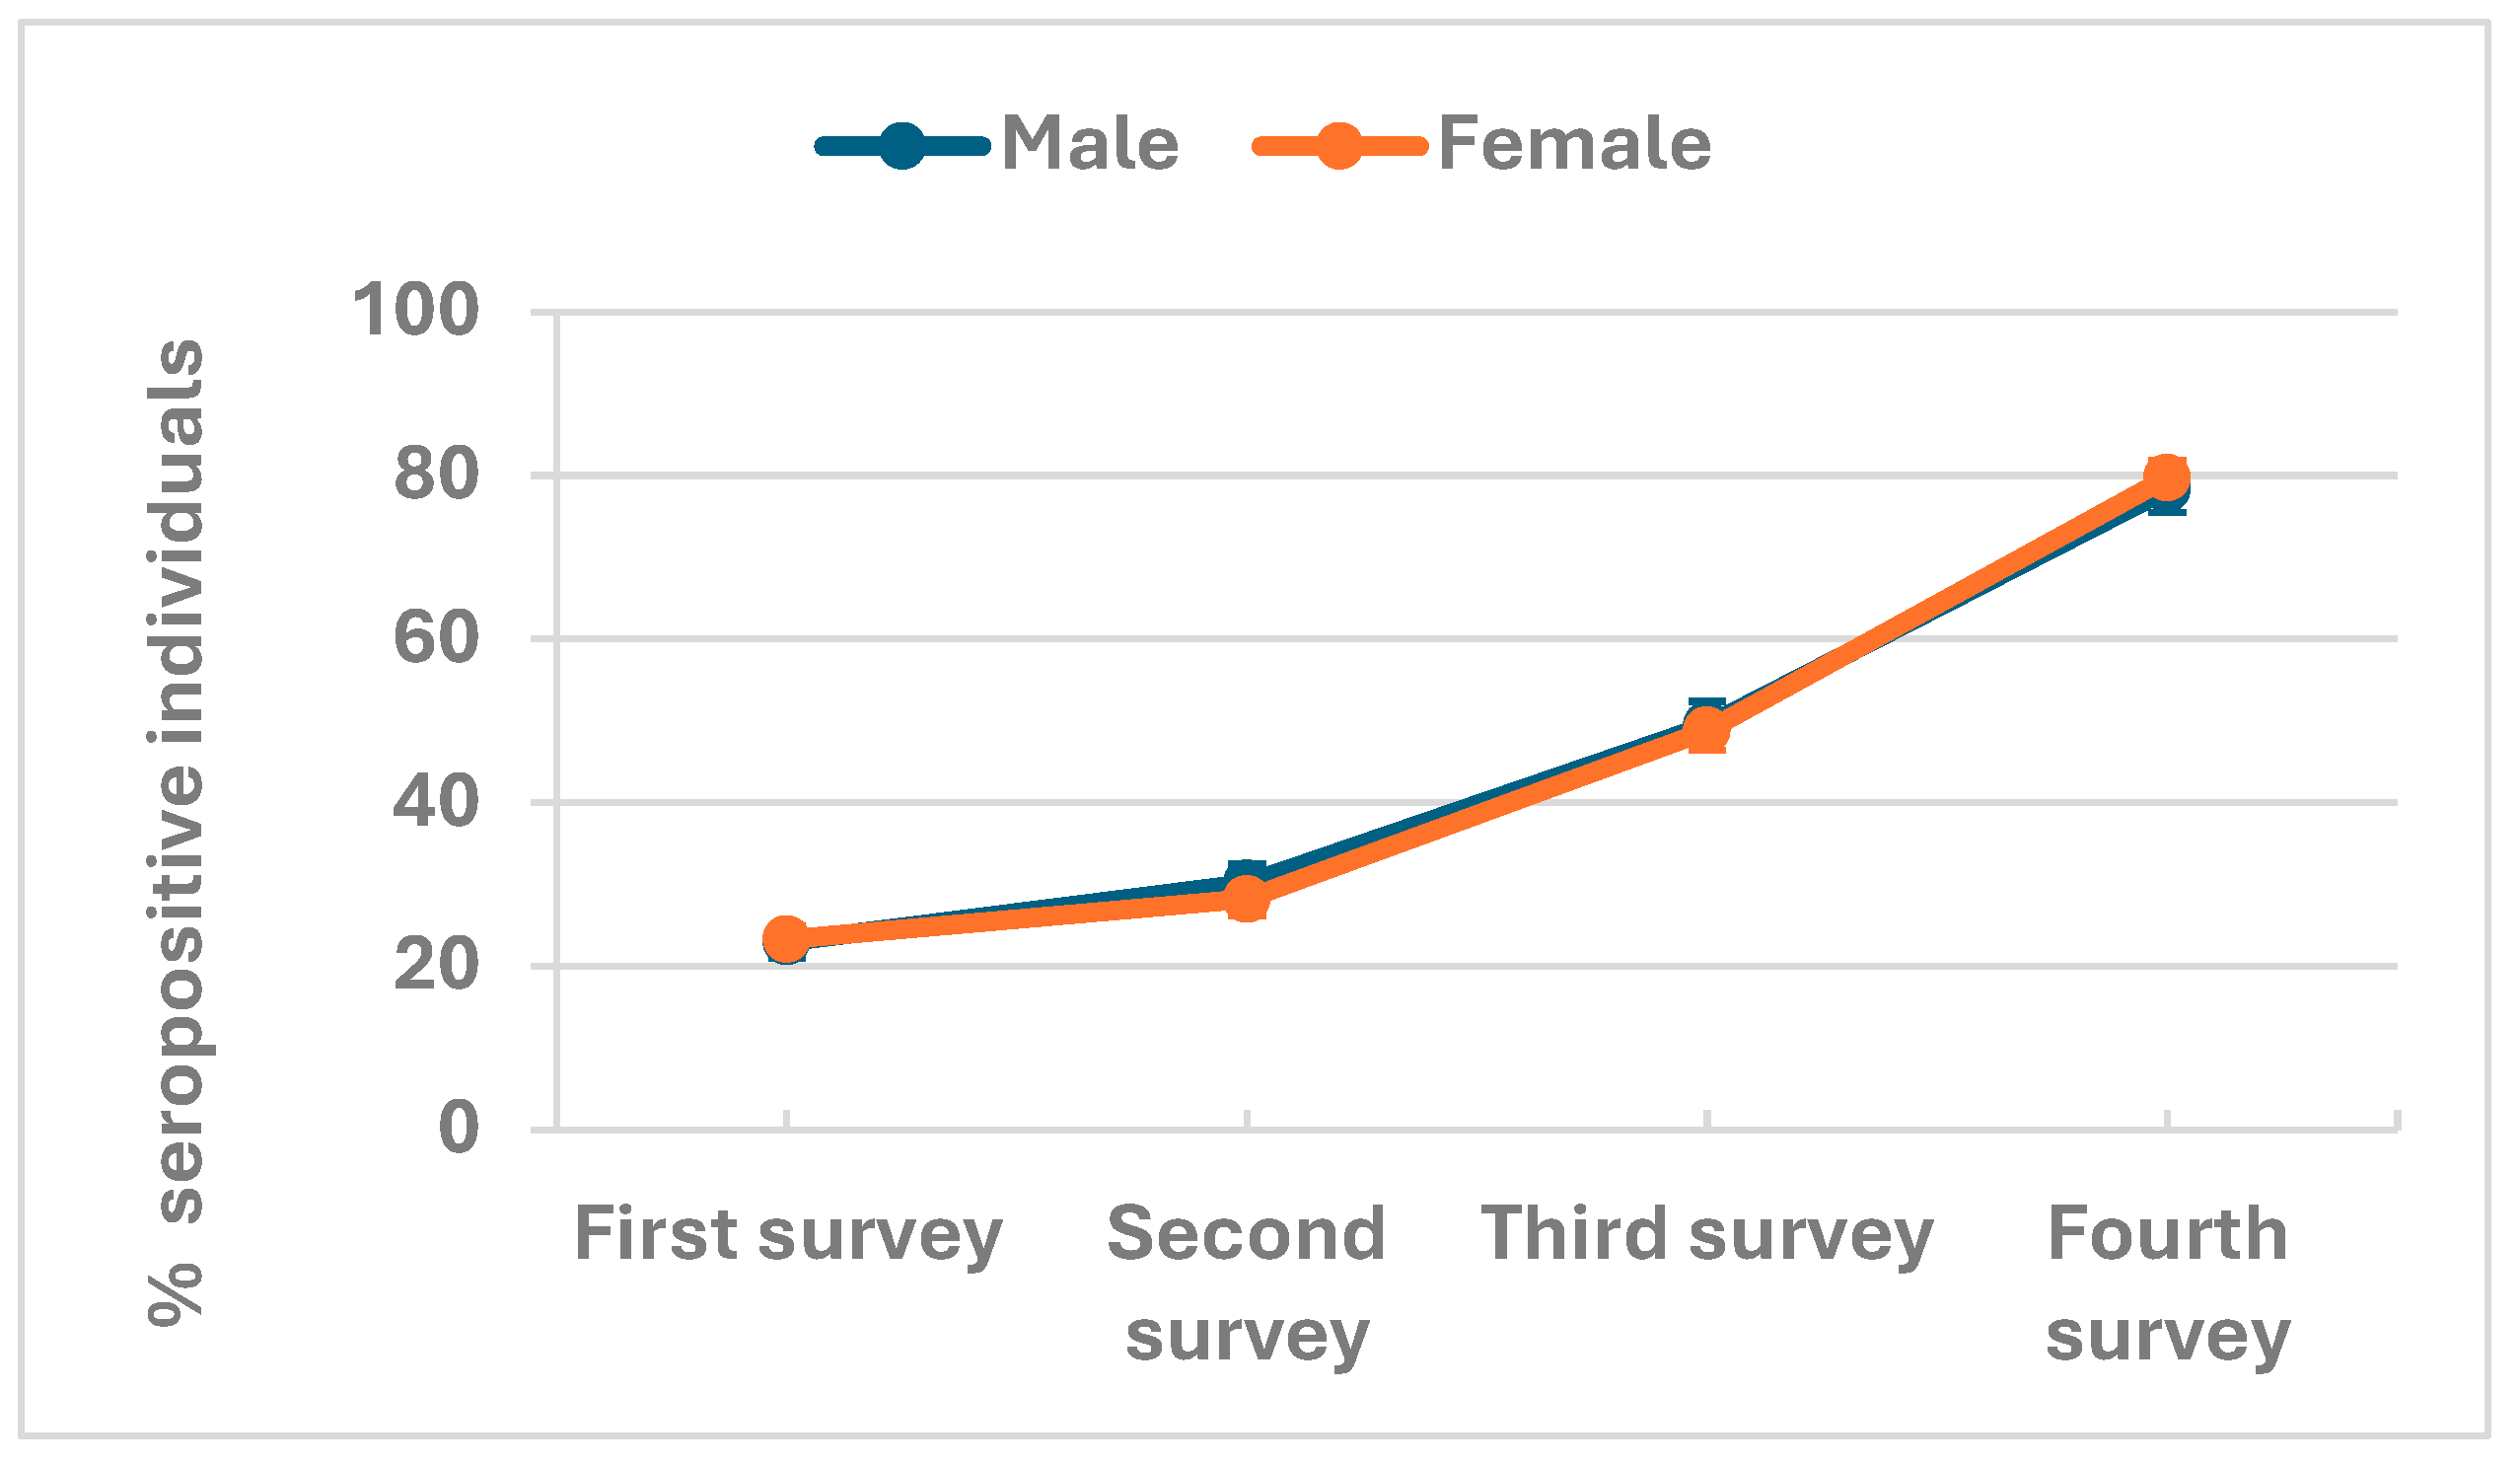
We investigated factors associated with COVID-19 antibody seroprevalence in the population. Seropositivity increased in all individuals throughout the four rounds of the survey and was similar in males and females throughout the study (Figure 3B, Table 2).
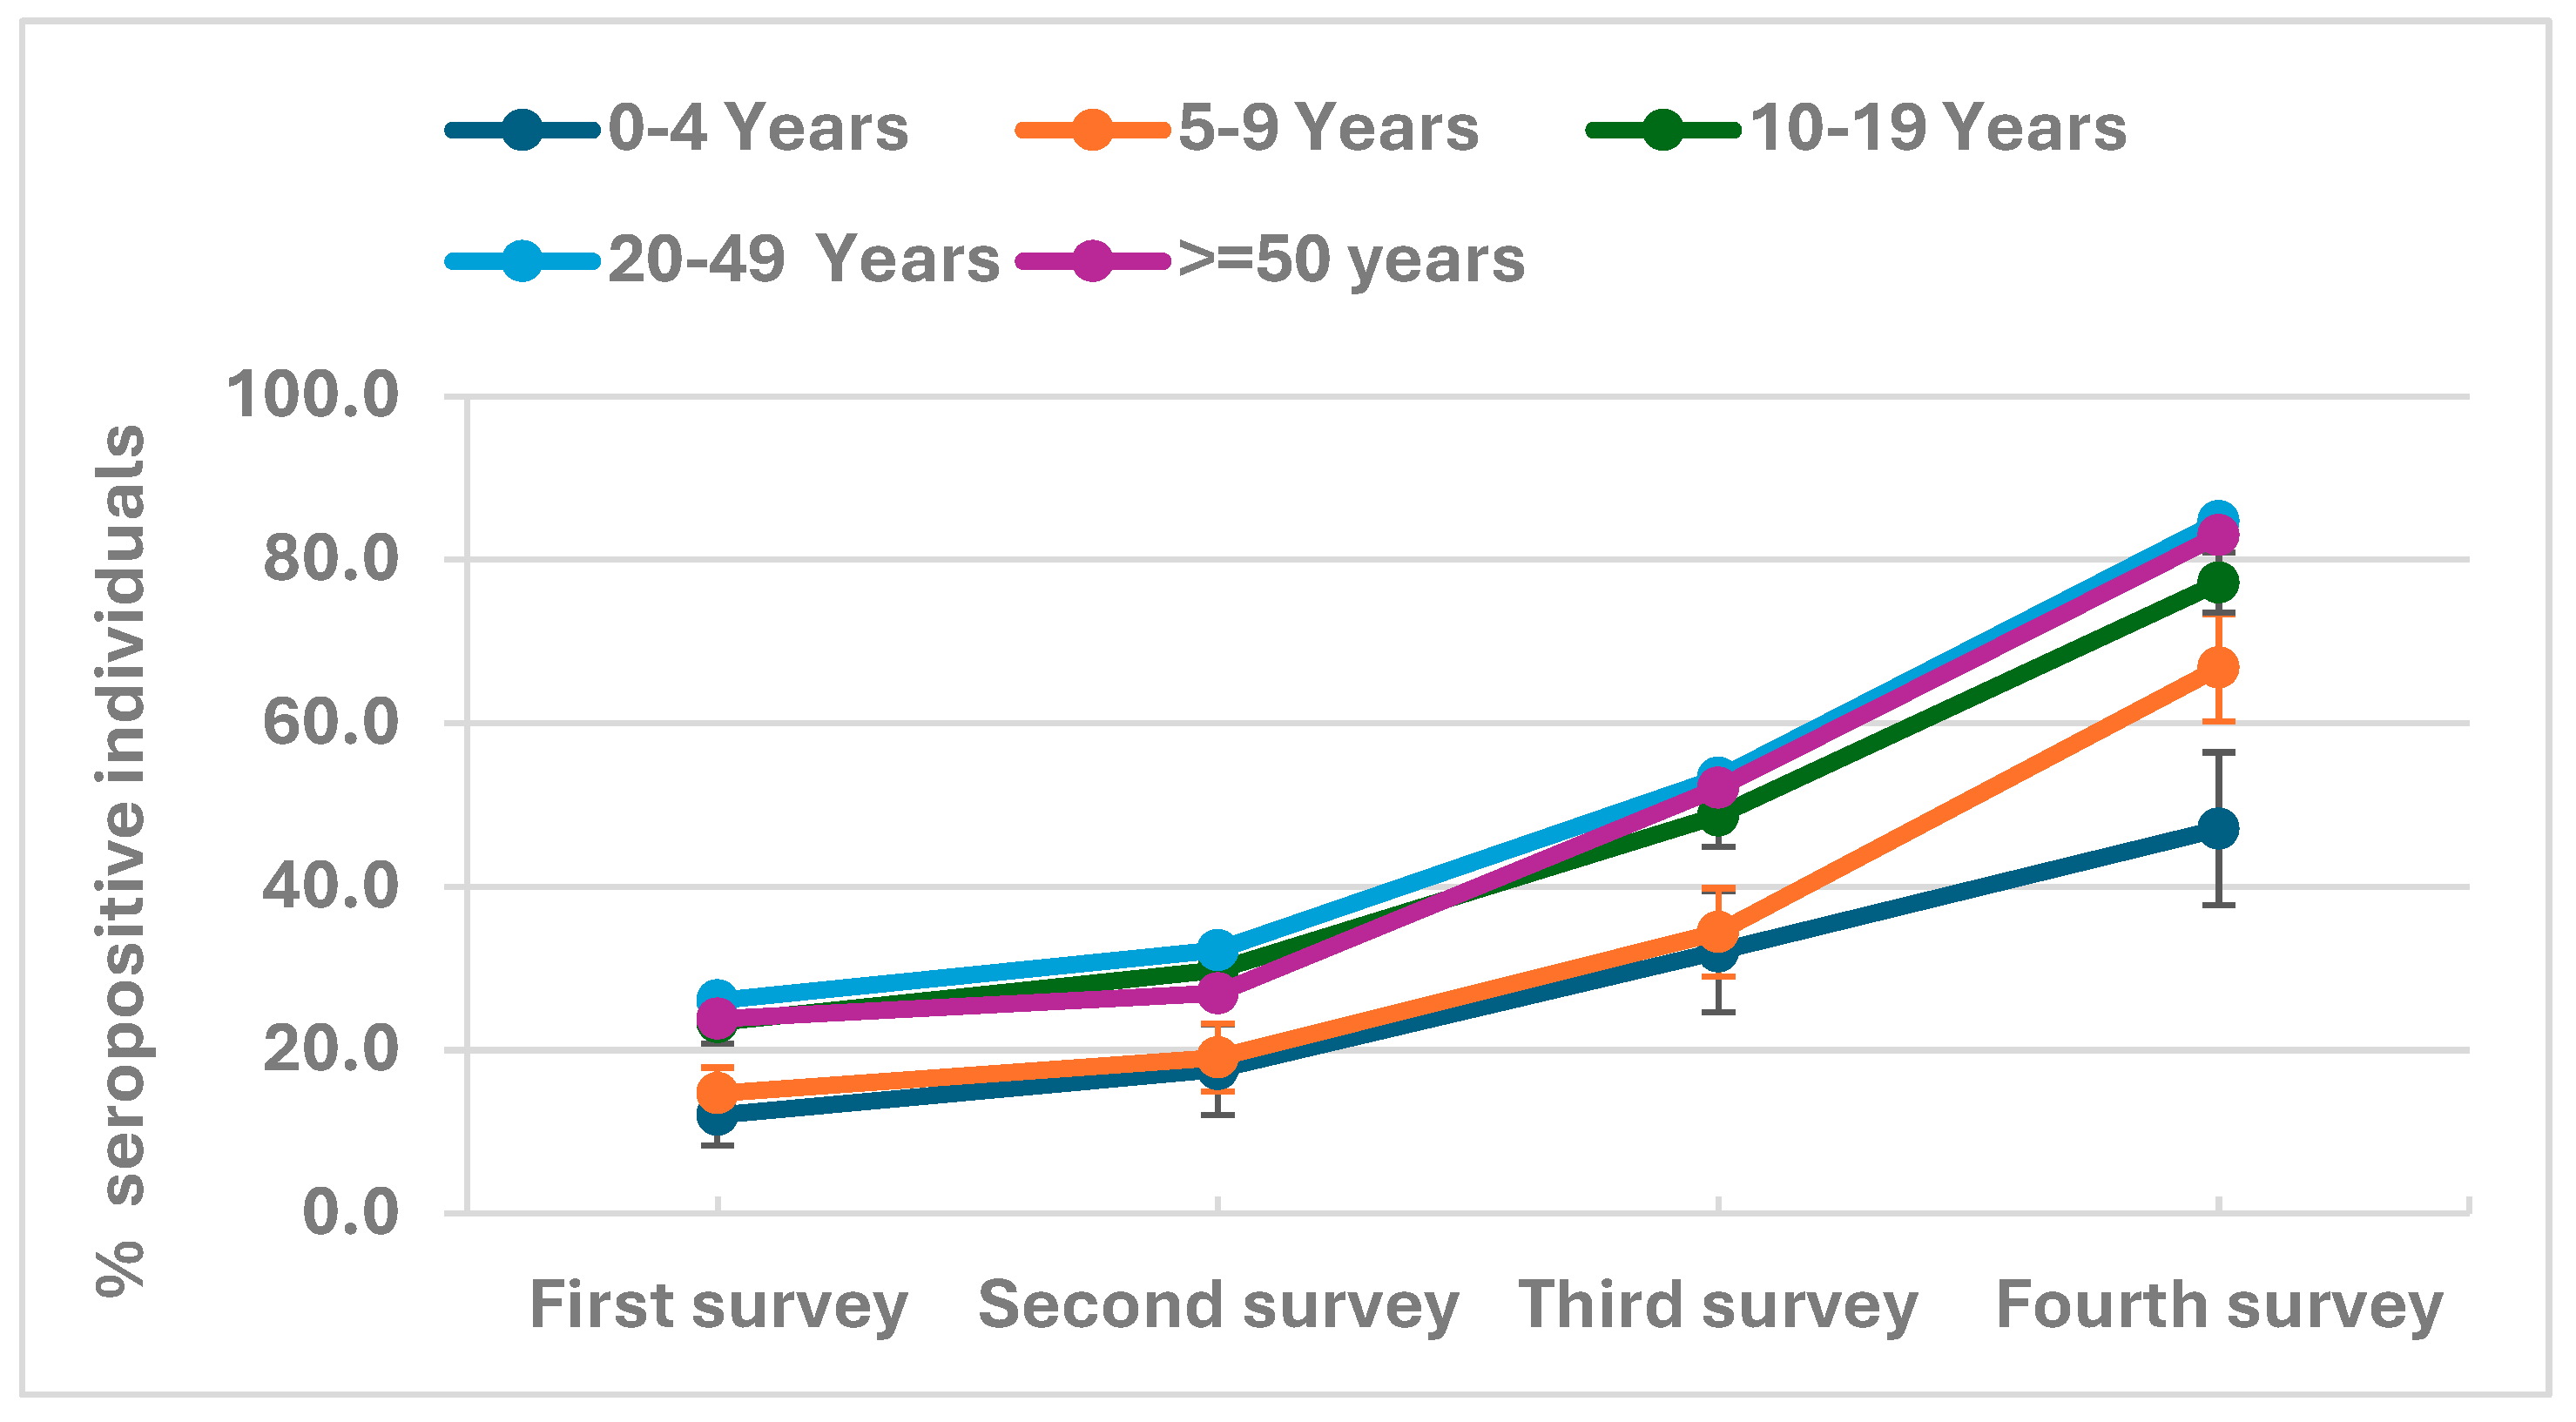
Children aged less than 10 years of age had a lower seroprevalence than older age groups (Table 2, Supplementary Table 1). Examined in age bands of 0-4, 5-9, 10-19, 20-49 years, and those aged 50 years and older, it was apparent that seropositivity increased in all age groups and vitamin D levels across the four serosurveys (Figure 3C); however, those aged below five years had lower COVID-19 antibody seroprevalence.
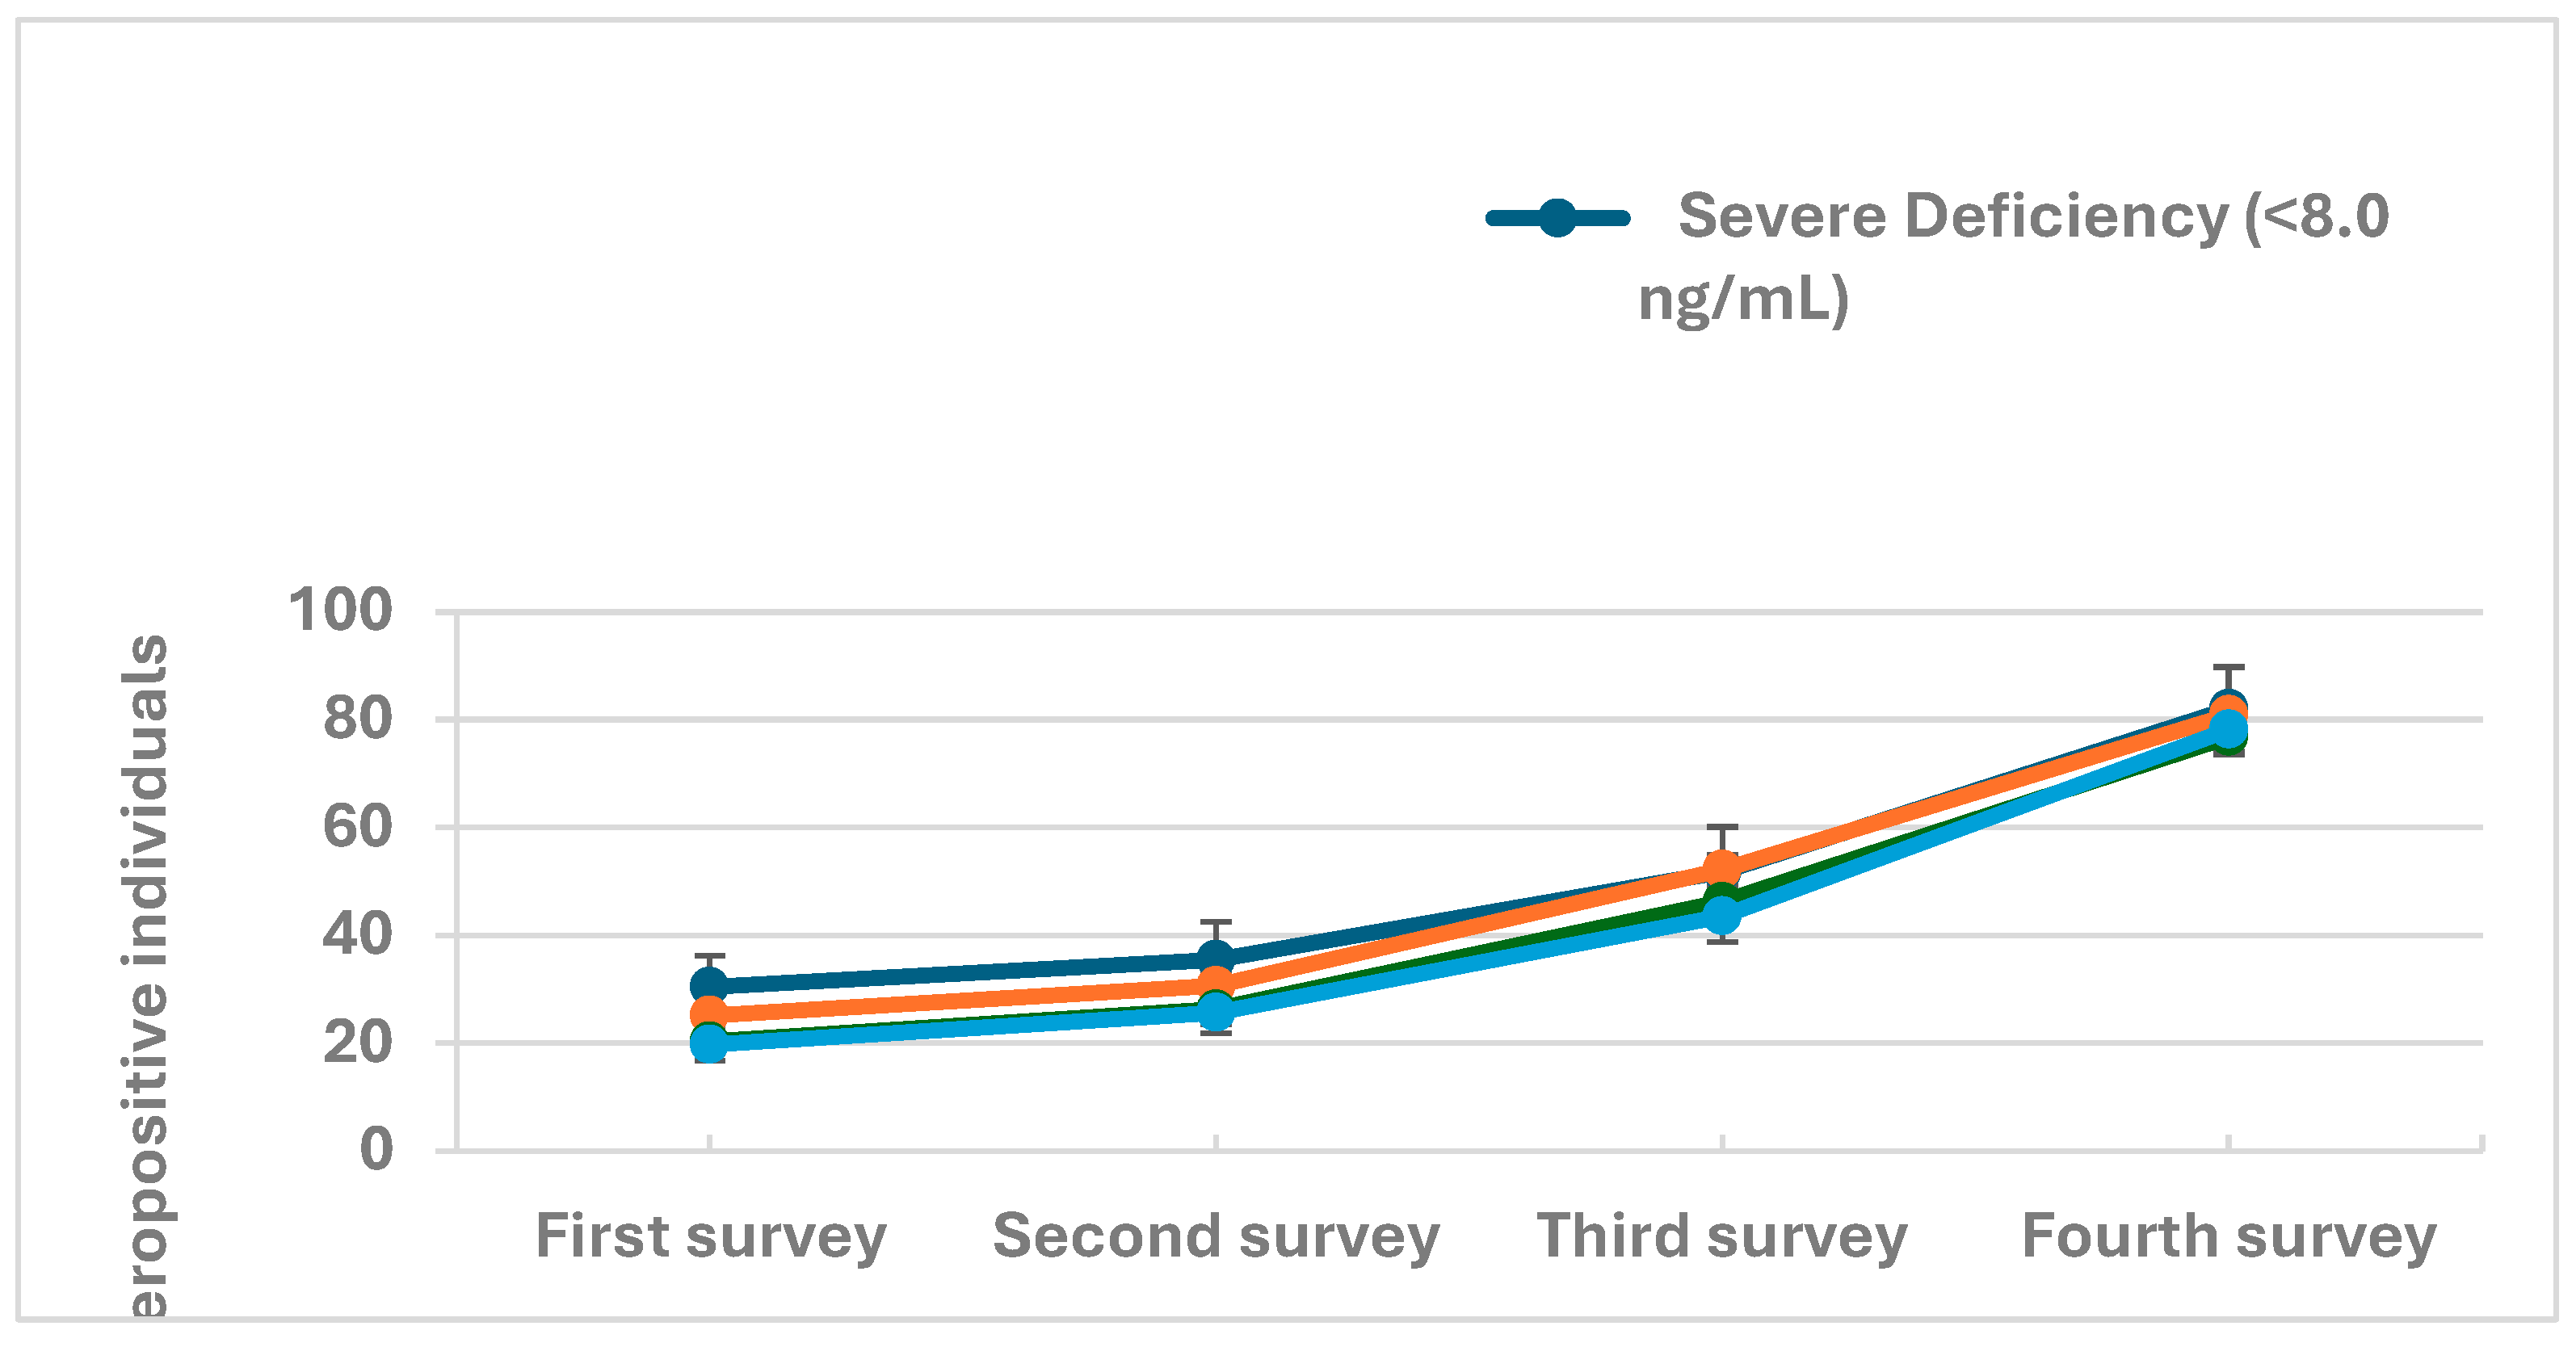
Figure 3D shows the seropositivity in participants with different vitamin D levels, it was apparent that seropositivity increased across the four serosurveys. However, those with severe vitamin D deficiency had higher COVID-19 antibody seropositivity.
Seropositivity was lower in rural (Matiari) districts than in urban Karachi districts (Table 2, Supplementary Table 1). Seroprevalence across the districts did not show any substantial variation throughout all rounds of surveys.
Individuals living alone were less likely to be antibody-positive than individuals living in households of two or greater. Lower antibody seroprevalence was observed in the poorest households compared with the better-off households (Supplementary Table 1). By round 4, higher seropositivity was associated with vaccinated (86.7%) individuals as compared with unvaccinated (71.7%) individuals (Table 2).
Further investigation revealed that certain symptoms, such as fever or loss of smell, were only associated with COVID-19 antibody seropositivity in the univariable model. Variations in hemoglobin levels, CRP, or zinc levels were not associated with COVID-19 seropositivity (Supplementary Table 2). Neither outside travel nor visiting a health facility were strongly associated with seropositivity.
In a multivariable analysis, the odds of being seropositive increased with each round of the serosurvey (Table 3). Further, these were 2.6 times (95% CI 1.9-3.6) higher among urban residents than rural residents. Individuals aged 5–9, 10–19, 20–49, and 50 years and older had 1.8 (95% CI: 1.0, 3.1), 5.1 (95% CI: 3.1, 8.6), 7.5 (95% CI: 4.6, 12.4), and 6.4 (95% CI: 3.7, 10.9) times the risk of being seropositive, respectively, compared to those aged 0–4 years, after adjusting for other variables. Pushto-speaking individuals had a higher risk (OR 2.1, 95% CI 1.3-3.3) than Urdu-speaking individuals of being seropositive. Individuals classified as middle or higher wealth quintiles had a higher risk of seropositivity than those in the poorest quintiles.
Having conjunctivitis was found to be associated with a 1.6 times increased risk of COVID-19 seropositivity. Reported contact with a COVID-19-positive individual in the last two weeks was also associated with higher odds of seropositivity (OR 3.2, 95% CI 1.5-6.8). The risk of being seropositive was 2.1 times higher (95% CI 1.3-3.5) among those with severe vitamin D deficiency compared to those with sufficient vitamin D levels, with an additional risk of 1.7 observed in those with deficient vitamin D levels. Contact with a confirmed case of COVID-19 in the previous two weeks was associated with higher seropositive rates in the study subjects.

Assessing Risk of COVID-19 Seroprevalence

We used the Cox proportional hazard model to assess time to seroconversion among study subjects, of which 79% were seropositive by the fourth round (September – November 2021). Table 4 lists the hazard ratios for the risk of seroconversion throughout the 16-month study period across different characteristics. Individuals aged 5–9, 10–19, 20–49, and 50 years and older had an adjusted hazard ratio (AHR) of 1.3 (95% CI: 1.0, 1.7), 1.9 (95% CI: 1.5, 2.5), 2.2 (95% CI: 1.7, 2.7), and 2.2 (95% CI: 1.7, 2.8), respectively, indicating a higher risk of seroconversion compared to those aged 0–4 years. Punjabis had an AHR) of 1.4 (95% CI 1.2-1.6), Balochis had 1.3 (95% CI 1.0-1.6), and Sindhis had 1.2 (95% CI 1.1-1.3) higher risk of seroconversion as compared to the Urdu-speaking individuals.
All wealth quintiles were significantly at higher risk of seroconversion than the poorest quintile, but no pattern of risk was observed with increasing wealth quintiles. Severe vitamin D deficiency was associated with an adjusted hazard ratio (AHR) of 1.4 (95% CI 1.1-1.7), while vitamin D deficiency was associated with an AHR of 1.2 (95% CI 1.1-1.4) for seropositivity (Table 4, Supplementary Table 3).

Investigation of COVID-19 in Study Subjects

Antibody positivity to SARS-CoV-2 may be due to natural infection, vaccinations, or cross-reactivity to other coronaviruses. [22]. We wanted to determine how the seroprevalence observed may be associated with COVID-19 in the population. Hence, during the serosurveys, nasopharyngeal swab samples were collected from a subset of 2,047 study participants: 606 in Round 1, 742 in Round 2, 316 in Round 3, and 383 in Round 4 (Table 5). Of the 2,047 swabs tested by PCR, 37 (1.8%) were found to be COVID-19 positive. From these 2,346 nasal swabs, we also tested 1,415 samples from all rounds except for Round 1 using the COVID-19 rapid antigen assay. Among the 1,451 individuals tested, 26 (1.8%) were identified positive for SARS-CoV-2 antigens.
The table describes the number of individuals from whom respiratory samples were tested for SARS-CoV-2 RNA by RT-PCR and COVID-19 antigen during the study sero survey rounds.

Discussion

SARS-CoV-2 seroprevalence in two areas of Sindh based on four repeated cross-sectional surveys between July 2020 and November 2021 show a steady increase in the prevalence of individuals with COVID-19 antibodies over the first year of the pandemic. Our study revealed a constant rise in seropositivity over time in all the study districts, increasing from 23% in July 2020 to 79% by November 2021, with a particularly sharp rise between the third and fourth survey rounds, despite no significant increase in clinically symptomatic and positive cases. There was some difference in seropositivity between rural (from 19% to 77%) and urban areas (from 26% to 82%) across the study period of 16 months. No difference was found in seropositivity associated with gender, although younger age (<05 years) was associated with lower COVID-19 seropositivity. Increased household sizes and a higher wealth index were associated with higher seroprevalence rates, as were having deficient serum vitamin D levels. Notably, only 1.8% of respiratory samples tested from a subset of participants tested by RT-PCR or COVID-19 antigen testing showed the presence of SARS-CoV-2, indicating asymptomatic or sub-clinical infection in these individuals. Protective immunity against SARS-CoV-2 is driven by host humoral immunity as indicated by the measurement of antibody seroprevalence. Therefore, our study presents evidence of a population-wide increase in immunity against SARS-CoV-2 infections through the early pandemic period before the introduction of COVID-19 vaccination.
Of the four COVID-19 waves experienced in Pakistan during the study period, the first occurred in May 2020, shortly before the survey began in July 2020. Three subsequent peaks followed this in December 2020, April 2021, and August 2021 [23,24]. The results of COVID-19 seroprevalence we observed during the first survey were broadly consistent with others conducted around the same period. A large seroprevalence study conducted in July 2020 in metropolitan cities of Pakistan reported 17.5% seropositivity. [15], while another study conducted by the National Institute of Blood Diseases (NIBD) in Karachi in July 2020 reported an antibody prevalence of 34% in the community [21]. A study conducted in Lahore reported a seroprevalence of 15.6% among policemen in May 2020 [25]. By December 2020, a healthy blood donor population in Karachi seropositivity was found to be 53% [26].
The relatively minor increase in seroprevalence seen between the first and second survey rounds (between July and November 2020) might be explained by the countrywide “smart” lockdown measures and infection mitigation measures implemented by the government from November 26th, 2020 [27]. From February 2021 onwards, seroprevalence increased, as seen between the third and fourth survey rounds until November, revealing 56.8 to 81.5% seroprevalence in urban settings and 39.2 – 76.8% seroprevalence in rural settings. This increase may be attributable to the easing of lockdown measures in August 2021, with people coming back to work, poor compliance with preventive measures, and the reopening of educational institutions [28].
The early phase of the COVID-19 pandemic was associated with the wild-type Wuhan or S clade strains of SARS-CoV-2, which were predominantly circulating in the population, which was followed by the introduction of G clade strains by the end of 2020 [29,30]. In January 2021, alpha, the first variant of concern (VOC), was introduced in Pakistan, followed by delta variants in May 2021 [31]. COVID-19 vaccinations were rolled out on February 22nd, 2021, initially only for healthcare workers, followed by extended to groups starting with the oldest age groups [32]Therefore, both an increase in viral transmission and vaccinations would have contributed to the increased seroconversion observed between survey rounds 3 and 4. Of note, COVID-19 vaccinations were not available for children (12 – 18 years) until 2022, which was after this study period. Therefore, the increasing seroprevalence (approximately 20 – 70 %) in the 0 –19-year age group was unlikely due to COVID-19 vaccinations.
Our study observed higher odds of seropositivity among urban dwellers, which is consistent with various regional and international studies. [33,34,35]. The trend also fits with increased seropositivity associated with increased household size, likely pointing to higher transmission levels, such as in Karachi, which has a population of 17.6 million.
Our observation of higher odds of seropositivity among people 20-49 years old is consistent with age-related seroprevalence patterns in some studies [36,37]. This contrasts with other studies that have found the advancing age of 60-80 years to be one of the predictors of high seroprevalence [38,39]. Such differences may be due to unique population dynamics and group mobility. Sindhi ethnicity was predominant in the study samples as our rural cohort was from Sindh province. Two population-based seroprevalence studies have reported 3.2% seropositivity in Balochi individuals versus 6.2% in Pashtuns [14] in a community-based sample of 5000 individuals in Oct – Nov 2020 and around 43% seroprevalence among Pashtuns in another conducted in July 2020 [17]. Identifying Balochi and Pushto ethnicities with higher odds of having detectable antibodies in our study is likely reflective of the demographic nature of Karachi, a multi-ethnic city.
Contrary to other studies, belonging to a higher wealth quintile was considered seropositive in our research. This contrasts with a South African study that showed a higher risk of detectable antibodies among people living in informal household settings with low socioeconomic status. [40], and a population-based study in Peru reported higher seroprevalence in socioeconomically deprived strata [41]Differences observed in our population may be associated with the increased mobility of higher-income populations, which increases their risk of exposure to circulating SARS-CoV-2 strains.
We did not find any association between zinc micronutrients and seroconversion; however, our study found vitamin D deficiency associated with seropositivity. Given that the majority of individuals in Pakistan are found to have deficient vitamin D levels [42], this association is likely representative of the population rather than associated with COVID-19 antibody seroprevalence. Vitamin D plays a key role in regulating the immune activation of cells in response to infection. A recent study in Pakistan reported that vitamin D-deficient individuals who tested positive for COVID-19 experienced more extended hospital stays with slower recovery and poor outcomes, whereas those with sufficient levels of vitamin D were less likely to require invasive treatments and fewer complications [43]. However, our data do not suggest whether lower vitamin D concentrations increase the risk of COVID-19 seropositivity or clinical illness in our population.
Testing of respiratory samples from study subjects across the four survey rounds revealed that 1.8% of individuals have COVID-19; this number is relatively low and cannot account for the high rates of seropositivity observed. Therefore, our results describe increasing seroprevalence in both urban and rural regions of Sindh, Pakistan, which are most likely associated with COVID-19 immunity. These data align with reports from our center that have identified increasing IgG antibodies to SARS-CoV-2 Spike in healthy uninfected controls during the early pandemic period, likely associated with pre-pandemic immunity in the cohort [44]. The expansion of antibody responses observed through the study surveys is likely driven by memory B cells triggered by natural infection and cross-reactivity to circulating alpha and beta coronaviruses [22].
The COVID-19 antibodies measured here targeted the SARS-CoV-2 nucleocapsid protein. While most information available focuses on antibodies to the Spike glycoprotein, which is thought to be primarily associated with protection [45]. Antibodies reactive to the nucleocapsid protein also can have neutralizing activity against SARS-CoV-2 [46]. Further, multi-parameter analysis of antibody subtypes to both spike and nucleocapsid proteins can inform on protective immunity based on both cross-reactive and SARS-CoV-2 driven immunity [47,48].
This study was the first large-scale population survey that followed households over 16 months from the early pandemic period of July 2020 through 4 survey rounds. Its representation of baseline and subsequent seropositivity across age groups enables us to understand population trends and the significance of the relatively low COVID-19 morbidity and mortality observed. One limitation of the study is that there were several refusals to participate across rounds; therefore, not all individuals were tested longitudinally. We could not conduct virus-neutralizing assays against SARS-CoV-2 or other related coronaviruses. As we could not distinguish between antibodies produced in response to natural infection and those made by COVID-19 vaccinations, the results of the final survey in November 2021 included seropositivity due to both factors. Finally, convenience sampling and enrollment from only two areas of Sindh compromised the generalizability of the study to the national level.

Conclusions

This study describes rising seroprevalence in urban Karachi and rural Matiari between July 2020 and November 2021. It provides data from both urban and rural areas in Sindh province showing a similar trend. There was rising population seroprevalence coincident with COVID-19 waves in the country, but limited disease was observed in the study population. This fits with increasing rates of seropositivity indicating ‘herd’ immunity following sub-clinical spread of the virus or cross-protection from other seasonal human coronaviruses [49,50]. Further studies are required to fully understand the nature of the seroprevalence observed through testing against different coronaviruses.
Figure Legends
Figure 1. Map of study sites and change in antibody prevalence against SARS-CoV-2: The figure illustrates the spatial distribution and variation in seroprevalence changes across the selected study sites. The main map details Karachi city, the upper inset shows a map of Pakistan highlighting the locations of Karachi city, while the lower inset zooms in on district Matiari.
The colored symbols on the map indicate the change in prevalence of antibodies against SARS-CoV-2 between survey rounds (R4 - R1) across different areas.
Figure 2. Flow diagram of sampling method and timeline of the study:The chart describes the periods of surveys 1, 2, 3 and 4, respectively which were conducted between July 2020 and November 2021. The number of households interviewed as well as the number of participants requested to participate in the study are indicated. The final number of individuals who consent to participate in each round of the study are also listed.
Figure 3(A, B, C & D). Time trends in seropositivity by urban and rural population, gender, age and vitamin D status across four survey rounds: These figures provide a visual representation of how seropositivity evolved in different demographic and health-related subgroups throughout the study period. It presents four line-graphs depicting the time trends in seropositivity (y-axis) across four survey rounds (x-axis) by urban and rural population, gender, age (0-4, 5-9, 10-19, 20-49 and >50 years) and vitamin D status (severely deficient, deficient, desirable and sufficient)

Author Contributions

ZAB conceptualized the study, assisted with interpreting the results, and reviewed the manuscript. MAH and SBS designed the survey and provided senior supervision. IH drafted the first version. JI & ZH wrote the subsequent final version of the manuscript. AAM & MU oversaw data collection activities. KF managed the data, and SM performed the statistical analysis. SC provided senior support for statistical analysis. JI, KB & RZ performed the laboratory analysis. JI, ZH, SBS, AI, SC & ZAB critically reviewed the manuscript. All authors reviewed and approved the final manuscript for submission.

Funding Sources

Nutrition Research Laboratory, Center of Excellence in Women & Child Health, Aga Khan University, Pakistan, provided the funds to conduct this study.

Declaration of Interests

The authors want to reiterate that they have no known competing financial interests or personal relationships that could have appeared to influence the work reported in this paper. This declaration is a testament to the integrity and impartiality of our research.

Acknowledgments

The Nutrition Research Laboratory, Aga Khan University, Karachi, Pakistan, supported this study. We want to acknowledge Mr. Khalid Feroz from the Data Management Unit at the Center of Excellence in Women and Child Health, Aga Khan University, for assisting us in devising data collection strategies. Similarly, we acknowledge Ms. Nazia Syed for coordinating sample collection from field sites.

References

  1. CDC, C.f.D.C.a.P. Centers for Disease Control and Prevention CDC. Novel Coronavirus Wuhan, China. CDC 2019 [cited 2022 February 10,]; Available from: https://www.cdc.gov/coronavirus/2019-ncov/about/index.html.
  2. Lai, N.H., et al., Comparison of the predictive outcomes for anti-tuberculosis drug-induced hepatotoxicity by different machine learning techniques. Comput Methods Programs Biomed, 2019. 188: p. 105307. [CrossRef]
  3. WHO. World Health Organization Severe Acute Respiratory Syndrome 2022 [cited 2022 February 19]; Available from: https://www.who.int/health-topics/severe-acute-respiratory-syndrome.
  4. Abid, K., et al., Progress of COVID-19 Epidemic in Pakistan. Asia Pac J Public Health, 2020. 32(4): p. 154-156. [CrossRef]
  5. Achonu, C., et al. A seroprevalence study of pandemic influenza A H1N1 among Ontarians. in European Scientific Conference on Applied Infectious Disease Epidemiology Abstract Book. Lisbon. 2010.
  6. Organization, W.H., Coronavirus disease 2019 (COVID-19) Situation Report – 73. 2020.
  7. Organization, W.H., When capacity is limited, who should be tested for SARS-CoV-2? 2022, World Health Organization.
  8. GoP, Guidelines Clinical Management Guidelines for COVID-19 Infections, M.o.N.H.S. Government of Pakistan, Regulations & Coordination, Editor. 2020: Pakistan.
  9. NEWS, D., Provinces announce easing lockdown even as Pakistan witnesses record rise in coronavirus cases, in DAWN TODAY’S PAPER. 2020, DAWN.
  10. Emmanuel, F., et al., Pakistan’s COVID-19 Prevention and control response using the world health organization’s guidelines for epidemic response interventions. Cureus, 2023. 15(1). [CrossRef]
  11. Bhutta, Z.A., et al., Balancing science and public policy in Pakistan’s COVID-19 response. East Mediterr Health J, 2021. 27(8): p. 798-805. [CrossRef]
  12. Usman, S., et al., Descriptive analysis of health screening for COVID-19 at points of entry in pakistan according to the centers for disease control and prevention guidelines. International Journal of Travel Medicine and Global Health, 2022. 10(3): p. 108-113. [CrossRef]
  13. Szylovec, A., et al., Brazil’s Actions and Reactions in the Fight Against COVID-19 from January to March 2020. Int J Environ Res Public Health, 2021. 18(2). [CrossRef]
  14. Ahmad, A.M., et al., COVID-19 seroprevalence in Pakistan: a cross-sectional study. BMJ open, 2022. 12(4): p. e055381. [CrossRef]
  15. Javed, W., et al., Sero-prevalence findings from metropoles in Pakistan: implications for assessing COVID-19 prevalence and case-fatality within a dense, urban working population. medRxiv, 2020: p. 2020.08. 13.20173914. [CrossRef]
  16. Nisar, M.I., et al., Serial population-based serosurveys for COVID-19 in two neighbourhoods of Karachi, Pakistan. Int J Infect Dis, 2021. 106: p. 176-182. [CrossRef]
  17. Haq, M., et al., SARS-CoV-2: big seroprevalence data from Pakistan-is herd immunity at hand? Infection, 2021.
  18. Ullah, I., Re-identifying the Rural/Urban: a case Study of Pakistan. Espaço e Economia. Revista brasileira de geografia econômica, 2022(23).
  19. macrotrends, Karachi, Pakistan Metro Area Population 1950-2024. 2024, macrotrends.
  20. Brinkhoff, T., MATIARI District in Pakistan, Pakistan Bureau of Statistics, U.S. Bureau of Census: Demobase Pakistan. .
  21. Zaidi, S., et al., Seroprevalence of anti-SARS-CoV-2 antibodies in residents of Karachi-challenges in acquiring herd immunity for COVID 19. J Public Health (Oxf), 2021. 43(1): p. 3-8. [CrossRef]
  22. Geanes, E.S., et al., Cross-reactive antibodies elicited to conserved epitopes on SARS-CoV-2 spike protein after infection and vaccination. Sci Rep, 2022. 12(1): p. 6496.
  23. Edouard Mathieu, H.R., Lucas Rodés-Guirao, Cameron Appel, Daniel Gavrilov, Charlie Giattino, Joe Hasell, Bobbie Macdonald, Saloni Dattani, Diana Beltekian, Esteban Ortiz-Ospina, and Max Roser, Coronavirus Pandemic (COVID-19). Our World in Data, 2020.
  24. Ahmad, T., et al., COVID-19 in Pakistan: A national analysis of five pandemic waves. PLoS One, 2023. 18(12): p. e0281326. [CrossRef]
  25. Chughtai, O.R., et al., Frequency of COVID-19 IgG Antibodies among Special Police Squad Lahore, Pakistan. J Coll Physicians Surg Pak, 2020. 30(7): p. 735-739. [CrossRef]
  26. Hasan, M., et al., IgG antibodies to SARS-CoV-2 in asymptomatic blood donors at two time points in Karachi. PLoS One, 2022. 17(8): p. e0271259. [CrossRef]
  27. Rashid, M. and M. Piracha, SECOND WAVE OF COVID-19 IN PAKISTAN; HOW WORSE IT CAN GET?
  28. Mueed, A., et al., Impact of school closures and reopening on COVID-19 caseload in 6 cities of Pakistan: An Interrupted Time Series Analysis. medRxiv, 2022. [CrossRef]
  29. Ghanchi, N.K., et al., Higher entropy observed in SAR-CoV-2 genomes from the first COVID-19 wave in Pakistan PLoS ONE, 2021. 16(8)(e0256451): p. [CrossRef]
  30. Umair, M., et al., Whole-genome sequencing of SARS-CoV-2 reveals the detection of G614 variant in Pakistan. PLoS One, 2021. 16(3): p. e0248371. [CrossRef]
  31. Nasir, A., et al., Tracking SARS-CoV-2 variants through pandemic waves using RT-PCR testing in low-resource settings. PLOS Glob Public Health, 2023. 3(6): p. e0001896. [CrossRef]
  32. Siddiqui, A., et al., An overview of procurement, pricing, and uptake of COVID-19 vaccines in Pakistan. Vaccine, 2021. 39(37): p. 5251-5253. [CrossRef]
  33. Kumar, D., A. Burma, and A.K. Mandal, A seroprevalence study of Covid 19 antibody after 1st wave of the pandemic in South Andaman district, India. Clinical epidemiology and global health, 2021. 12: p. 100901. [CrossRef]
  34. Pierce, M., et al., Mental health before and during the COVID-19 pandemic: a longitudinal probability sample survey of the UK population. The Lancet Psychiatry, 2020. 7(10): p. 883-892. [CrossRef]
  35. Shervani, Z., D. Bhardwaj, and R. Nikhat, COVID-19 Infection in India: Seropositivity versus the Dynamics of the Spread. European Journal of Medical and Health Sciences, 2021. 3(4): p. 27-31. [CrossRef]
  36. Inbaraj, L.R., C.E. George, and S. Chandrasingh, Seroprevalence of COVID-19 infection in a rural district of South India: A population-based seroepidemiological study. PloS one, 2021. 16(3): p. e0249247. [CrossRef]
  37. Nisar, M.I., et al., Serial population-based serosurveys for COVID-19 in two neighbourhoods of Karachi, Pakistan. International Journal of Infectious Diseases, 2021. 106: p. 176-182. [CrossRef]
  38. Montenegro, P., et al., Community seroprevalence of COVID-19 in probable and possible cases at primary health care centres in Spain. Family Practice, 2021. 38(2): p. 153-158. [CrossRef]
  39. Shakiba, M., et al., Seroprevalence of COVID-19 virus infection in Guilan province, Iran. MedRxiv, 2020.
  40. Shaw, J.A., et al., Higher SARS-CoV-2 seroprevalence in workers with lower socioeconomic status in Cape Town, South Africa. PLoS One, 2021. 16(2): p. e0247852. [CrossRef]
  41. Reyes-Vega, M.F., et al., SARS-CoV-2 prevalence associated to low socioeconomic status and overcrowding in an LMIC megacity: A population-based seroepidemiological survey in Lima, Peru. EClinicalMedicine, 2021. 34: p. 100801. [CrossRef]
  42. Hassan, S., et al., An audit of clinical laboratory data of 25 [OH]D at Aga Khan University as reflecting vitamin D deficiency in Pakistan. J Pak Med Assoc, 2015. 65(11): p. 1247-50.
  43. Asghar, M.S., et al., Evaluation of Vitamin-D Status and Its Association with Clinical Outcomes Among COVID-19 Patients in Pakistan. The American journal of tropical medicine and hygiene, 2022. 106(1): p. 150. [CrossRef]
  44. Masood, K.I., et al., Humoral and T cell responses to SARS-CoV-2 reveal insights into immunity during the early pandemic period in Pakistan. BMC Infect Dis, 2023. 23(1): p. 846.
  45. Fenwick, C., et al., Changes in SARS-CoV-2 Spike versus Nucleoprotein Antibody Responses Impact the Estimates of Infections in Population-Based Seroprevalence Studies. J Virol, 2021. 95(3). [CrossRef]
  46. Dogan, M., et al., SARS-CoV-2 specific antibody and neutralization assays reveal the wide range of the humoral immune response to virus. Commun Biol, 2021. 4(1): p. 129.
  47. Shrwani, K., et al., Detection of Serum Cross-Reactive Antibodies and Memory Response to SARS-CoV-2 in Prepandemic and Post-COVID-19 Convalescent Samples. J Infect Dis, 2021. 224(8): p. 1305-1315. [CrossRef]
  48. Yuen, R.R., et al., Novel ELISA Protocol Links Pre-Existing SARS-CoV-2 Reactive Antibodies With Endemic Coronavirus Immunity and Age and Reveals Improved Serologic Identification of Acute COVID-19 via Multi-Parameter Detection. Front Immunol, 2021. 12: p. 614676. [CrossRef]
  49. Diez, J.M., C. Romero, and R. Gajardo, Effective presence of antibodies against common human coronaviruses in immunoglobulin medicinal products. Int J Infect Dis, 2021. 116: p. 68-73. [CrossRef]
  50. Zedan, H.T. and G.K. Nasrallah, Is preexisting immunity to seasonal coronaviruses limited to cross-reactivity with SARS-CoV-2? A seroprevalence cross-sectional study in north-eastern France. EBioMedicine, 2021. 71: p. 103580.
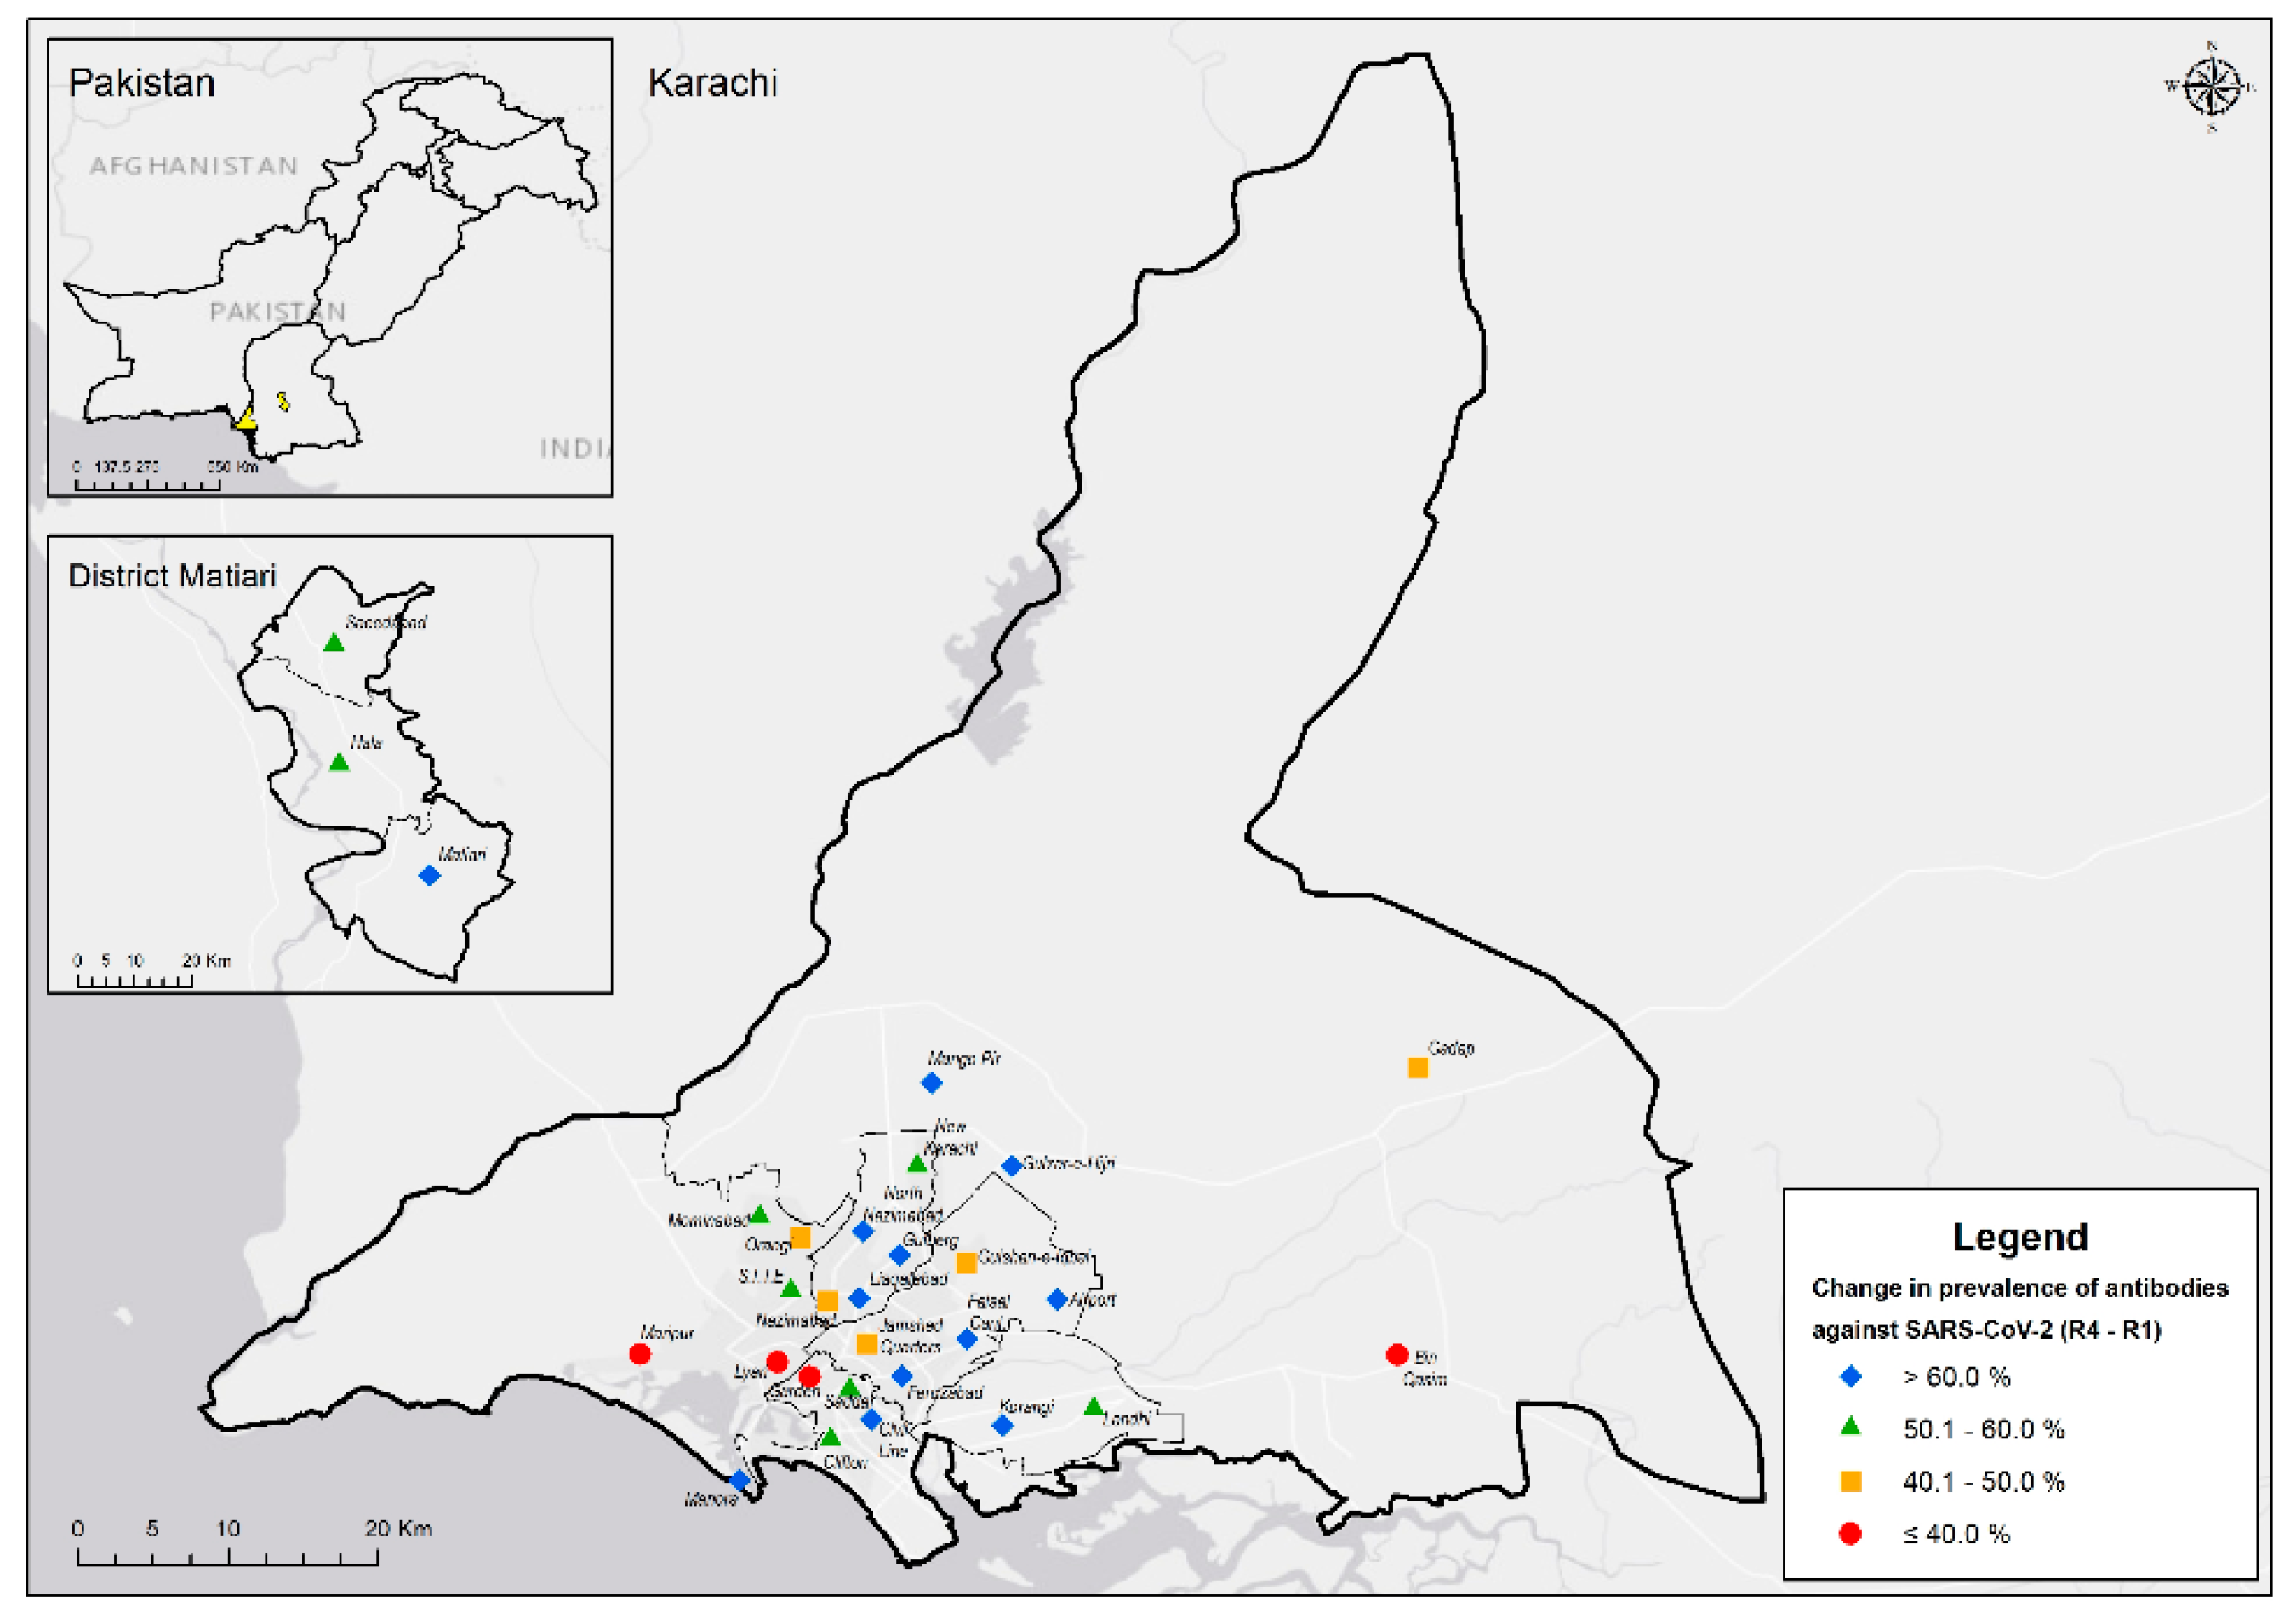
Figure 1. Map of study sites and change in antibody prevalence against SARS-CoV-2.
Preprints 117002 g001
Figure 2. Flow diagram of sampling method and timeline of the study.
Preprints 117002 g002
Figure 3ASu. Time trends in seropositivity by urban and rural population across four survey rounds.
Preprints 117002 g003
Figure 3B. Time trends in seropositivity by gender across four survey rounds.
Preprints 117002 g004
Figure 3C. Time trends in seropositivity by age across four survey rounds.
Preprints 117002 g005
Figure 3D. Time trends in seropositivity by vitamin D status across four survey rounds.
Preprints 117002 g006
Table 1. Description of study subjects according to sociodemographic characteristics.
Overall First survey
(July-Aug 2020)
Second survey
(Oct-Dec 2020)
Third survey
(Feb-April 2021)
Fourth survey
(Sep-Nov 2021)
P-value
N=11889 N=3979 N=3000 N=2675 N=2235
Location
Rural 5,187 (43.6%) 1,550 (39.0%) 1,340 (44.7%) 1,176 (44.0%) 1,121 (50.2%) <0.001
Urban 6,702 (56.4%) 2,429 (61.0%) 1,660 (55.3%) 1,499 (56.0%) 1,114 (49.8%)
Gender
Male 4,711 (39.6%) 1,629 (40.9%) 1,158 (38.6%) 1,048 (39.2%) 876 (39.2%) 0.200
Female 7,178 (60.4%) 2,350 (59.1%) 1,842 (61.4%) 1,627 (60.8%) 1,359 (60.8%)
Age (Years)
0–4 595 (5.0%) 224 (5.6%) 136 (4.5%) 131 (4.9%) 104 (4.7%) 0.930
5-9 1,171 (9.8%) 401 (10.1%) 283 (9.4%) 273 (10.2%) 214 (9.6%)
10-19 2,876 (24.2%) 932 (23.4%) 729 (24.3%) 657 (24.6%) 558 (25.0%)
20-29 2,159 (18.2%) 739 (18.6%) 562 (18.7%) 463 (17.3%) 395 (17.7%)
30-39 1,899 (16.0%) 619 (15.6%) 472 (15.7%) 437 (16.3%) 371 (16.6%)
40-49 1,474 (12.4%) 481 (12.1%) 384 (12.8%) 334 (12.5%) 275 (12.3%)
50-59 876 (7.4%) 298 (7.5%) 224 (7.5%) 184 (6.9%) 170 (7.6%)
60-69 539 (4.5%) 179 (4.5%) 132 (4.4%) 126 (4.7%) 102 (4.6%)
70-79 245 (2.1%) 84 (2.1%) 64 (2.1%) 58 (2.2%) 39 (1.7%)
80 and above 55 (0.5%) 22 (0.6%) 14 (0.5%) 12 (0.4%) 7 (0.3%)
Household size
1 28 (0.2%) 10 (0.3%) 5 (0.2%) 6 (0.2%) 7 (0.3%) 0.270
2 439 (3.7%) 143 (3.6%) 114 (3.8%) 93 (3.5%) 89 (4.0%)
3 228 (1.9%) 81 (2.0%) 54 (1.8%) 53 (2.0%) 40 (1.8%)
4-5 1,485 (12.5%) 542 (13.6%) 386 (12.9%) 311 (11.6%) 246 (11.0%)
6 and above 9,709 (81.7%) 3,203 (80.5%) 2,441 (81.4%) 2,212 (82.7%) 1,853 (82.9%)
Wealth Index(quintiles)
Poorest 2,179 (18.3%) 756 (19.0%) 545 (18.2%) 452 (16.9%) 426 (19.1%) 0.053
Poor 2,468 (20.8%) 830 (20.9%) 645 (21.5%) 559 (20.9%) 434 (19.4%)
Middle 2,230 (18.8%) 771 (19.4%) 567 (18.9%) 469 (17.5%) 423 (18.9%)
Rich 2,313 (19.5%) 761 (19.1%) 595 (19.8%) 534 (20.0%) 423 (18.9%)
Richest 2,699 (22.7%) 861 (21.6%) 648 (21.6%) 661 (24.7%) 529 (23.7%)
Mother tongue
Urdu 2,209 (18.6%) 716 (18.0%) 538 (17.9%) 530 (19.8%) 425 (19.0%) <0.001
Punjabi 840 (7.1%) 376 (9.4%) 223 (7.4%) 146 (5.5%) 95 (4.3%)
Sindhi 6,271 (52.7%) 1,936 (48.7%) 1,596 (53.2%) 1,462 (54.7%) 1,277 (57.1%)
Pashto 790 (6.6%) 287 (7.2%) 206 (6.9%) 144 (5.4%) 153 (6.8%)
Balochi 453 (3.8%) 166 (4.2%) 111 (3.7%) 97 (3.6%) 79 (3.5%)
Saraiki 90 (0.8%) 41 (1.0%) 17 (0.6%) 24 (0.9%) 8 (0.4%)
Hindko 90 (0.8%) 36 (0.9%) 18 (0.6%) 19 (0.7%) 17 (0.8%)
Others 1,146 (9.6%) 421 (10.6%) 291 (9.7%) 253 (9.5%) 181 (8.1%)
Vaccinated against COVID-19 1113 (49.8%) <0.001
Table 2. COVID-19 antibody seroprevalence in study subjects according to sociodemographic characteristics.
First survey (July-Aug 2020) Second survey (Oct-Dec 2020) Third survey (Feb-April 2021) Fourth survey (Sep-Nov 2021)
Positive tests estimate [95% CI] Positive tests estimate [95% CI] Positive tests estimate [95% CI] Positive tests estimate [95% CI]
Overall seroprevalence 923 /3979 23.2% (21.9-24.5) 869 /3000 29.0% (27.4-30.6) 1312 /2675 49.0% (47.2-50.9) 1769 /2235 79.1% (77.4-80.8)
Location
Rural 299 /1550 19.3% (17.4 - 21.3) 340 /1340 25.4% (23.1 - 27.8) 461 /1176 39.2% (36.4 - 42.0) 861 /1121 76.8% (74.2 -79.2)
Urban 624 /2429 25.7% (24.0 - 27.5) 529 /1660 31.9% (29.7 - 34.2) 851 /1499 56.8% (54.2 - 59.3) 908 /1114 81.5% (79.1 -83.7)
Gender
Male 375 /1629 23.0% (21.0 - 25.1) 349 /1158 30.1% (27.6 - 32.8) 518 /1048 49.4% (46.4 - 52.5) 686 /876 78.3% (75.5 -80.9)
Female 548 /2350 23.3% (21.7 - 25.1) 520 /1842 28.2% (26.2 - 30.3) 794 /1627 48.8% (46.4 - 51.2) 1083 /1359 79.7% (77.5 -81.7)
Age (Years)
0–4 27 /224 12.1% (8.4 - 17.0) 24 /136 17.6% (12.1 - 25.0) 42 /131 32.1% (24.6 - 40.5) 49 /104 47.1% (37.7 -56.7)
5-9 59 /401 14.7% (11.6 - 18.5) 54 /283 19.1% (14.9 - 24.1) 94 /273 34.4% (29.0 - 40.3) 143/214 66.8% (60.2 -72.8)
10-19 218 /932 23.4% (20.8 - 26.2) 217 /729 29.8% (26.6 - 33.2) 320 /657 48.7% (44.9 - 52.5) 431/558 77.2% (73.6 -80.5)
20-29 174 /739 23.5% (20.6 - 26.7) 169 /562 30.1% (26.4 - 34.0) 233 /463 50.3% (45.8 - 54.9) 322 /395 81.5% (77.4 -85.0)
30-39 171 /619 27.6% (24.2 - 31.3) 148 /472 31.4% (27.3 - 35.7) 237 /437 54.2% (49.5 - 58.9) 318 /371 85.7% (81.8 -88.9)
40-49 135 /481 28.1% (24.2 - 32.3) 140 /384 36.5% (31.8 - 41.4) 188 /334 56.3% (50.9 - 61.5) 242 /275 88.0% (83.6 -91.3)
50-59 73 /298 24.5% (19.9 - 29.7) 58 /224 25.9% (20.6 - 32.0) 96 /184 52.2% (45.0 - 59.3) 149 /170 87.6% (81.8 -91.8)
60-69 45 /179 25.1% (19.3 - 32.0) 40 /132 30.3% (23.1 - 38.7) 67 /126 53.2% (44.4 - 61.7) 77 /102 75.5% (66.2 -82.9)
70-79 17 /84 20.2% (13.0 - 30.2) 16 /64 25.0% (15.9 - 37.0) 31 /58 53.4% (40.7 - 65.8) 32 /39 82.1% (66.9 -91.2)
80 and above 4 /22 18.2% (7.0 - 39.6) 3 /14 21.4% (7.1 - 49.4) 4 /12 33.3% (13.1 - 62.4) 6 /7 85.7% (41.9 -98.0)
District
Matiari 299 /1550 19.3% (17.4 - 21.3) 340 /1340 25.4% (23.1 - 27.8) 461 /1176 39.2% (36.4 - 42.0) 861 /1121 76.8% (74.2 -79.2)
Karachi Central 113 /498 22.7% (19.2 - 26.6) 94 /345 27.2% (22.8 - 32.2) 196 /306 64.1% (58.5 - 69.2) 236 /281 84.0% (79.2 -87.8)
Karachi East 133 /529 25.1% (21.6 - 29.0) 92 /324 28.4% (23.7 - 33.6) 152 /280 54.3% (48.4 - 60.0) 175 /220 79.5% (73.7 -84.4)
Karachi South 85 /323 26.3% (21.8 - 31.4) 62 /244 25.4% (20.3 - 31.2) 116 /221 52.5% (45.9 - 59.0) 89 /124 71.8% (63.2 -79.0)
Karachi West 182 /587 31.0% (27.4 - 34.9) 179 /455 39.3% (35.0 - 43.9) 224 /401 55.9% (51.0 - 60.7) 275 /325 84.6% (80.3 -88.1)
Korangi 57 /212 26.9% (21.3 - 33.3) 59 /147 40.1% (32.5 - 48.3) 79 /143 55.2% (47.0 - 63.2) 82 /95 86.3% (77.8 -91.9)
Malir 54 /280 19.3% (15.1 - 24.3) 43 /145 29.7% (22.8 - 37.6) 84 /148 56.8% (48.7 - 64.5) 51 /69 73.9% (62.3 -82.9)
Household size
1 1 /10 10.0% (1.4 - 46.7) 1 /5 20.0% (2.7 - 69.1) 2 /6 33.3% (8.4 - 73.2) 4 /7 57.1% (23.0 -85.6)
2 38 /143 26.6% (20.0 - 34.4) 38 /114 33.3% (25.3 - 42.5) 43 /93 46.2% (36.4 - 56.4) 73 /89 82.0% (72.6 -88.7)
3 15 /81 18.5% (11.5 - 28.5) 15 /54 27.8% (17.5 - 41.1) 27 /53 50.9% (37.7 - 64.0) 30 /40 75.0% (59.4 -86.0)
4-5 135 /542 24.9% (21.4 - 28.7) 109 /386 28.2% (24.0 - 32.9) 158 /311 50.8% (45.3 - 56.3) 200 /246 81.3% (75.9 -85.7)
6 and above 734 /3203 22.9% (21.5 - 24.4) 706 /2441 28.9% (27.2 - 30.8) 1082 /2212 48.9% (46.8 - 51.0) 1462 /1853 78.9% (77.0 -80.7)
Wealth Quintile
Poorest 154 /756 20.4% (17.6 - 23.4) 133 /545 24.4% (21.0 - 28.2) 182 /452 40.3% (35.8 - 44.9) 320 /426 75.1% (70.8 -79.0)
Poor 172 /830 20.7% (18.1 - 23.6) 167 /645 25.9% (22.7 - 29.4) 251 /559 44.9% (40.8 - 49.1) 340 /434 78.3% (74.2 -82.0)
Middle 192 /771 24.9% (22.0 - 28.1) 183 /567 32.3% (28.6 - 36.2) 247 /469 52.7% (48.1 - 57.2) 345 /423 81.6% (77.6 -85.0)
Rich 203 /761 26.7% (23.7 - 29.9) 188 /595 31.6% (28.0 - 35.4) 291 /534 54.5% (50.2 - 58.7) 349 /423 82.5% (78.6 -85.8)
Richest 202 /861 23.5% (20.7 - 26.4) 198 /648 30.6% (27.1 - 34.2) 341 /661 51.6% (47.8 - 55.4) 415 /529 78.4% (74.7 -81.7)
Mother tongue
Urdu 163 /716 22.8% (19.8 - 26.0) 137 /538 25.5% (22.0 - 29.3) 286 /530 54.0% (49.7 - 58.2) 333 /425 78.4% (74.2 -82.0)
Punjabi 105 /376 27.9% (23.6 - 32.7) 83 /223 37.2% (31.1 - 43.8) 83 /146 56.8% (48.7 - 64.6) 76 /95 80.0% (70.8 -86.9)
Sindhi 379 /1936 19.6% (17.9 - 21.4) 432 /1596 27.1% (24.9 - 29.3) 647 /1462 44.3% (41.7 - 46.8) 994 /1277 77.8% (75.5 -80.0)
Pashto 87 /287 30.3% (25.3 - 35.9) 74 /206 35.9% (29.7 - 42.7) 82 /144 56.9% (48.7 - 64.8) 128 /153 83.7% (76.9 -88.7)
Balochi 53 /166 31.9% (25.3 - 39.4) 35 /111 31.5% (23.6 - 40.7) 52 /97 53.6% (43.7 - 63.3) 66 /79 83.5% (73.7 -90.2)
Saraiki 10 /41 24.4% (13.7 - 39.7) 7 /17 41.2% (21.0 - 64.8) 9 /24 37.5% (20.8 - 57.8) 5 /8 62.5% (28.5 -87.5)
Hindko 10 /36 27.8% (15.6 - 44.4) 6 /18 33.3% (15.8 - 57.1) 8 /19 42.1% (22.6 - 64.4) 11 /17 64.7% (40.4 -83.2)
Others 116 /421 27.6% (23.5 - 32.0) 95 /291 32.6% (27.5 - 38.2) 145 /253 57.3% (51.1 - 63.3) 156 /181 86.2% (80.4 -90.5)
COVID-19 vaccination status
Vaccinated 965/1113 86.7% (80.2-90.5)
Not vaccinated 804/1122 71.7% (63.2 -79.0)
Table 3. Factors associated with COVID-19 antibody seroprevalence amongst study participants.
Variables Adjusted OR (95% CI) P-values
Round
1 Ref.
2 1.8 (1.5,2.1) <0.001
3 10 (8.3,11.9) <0.001
4 128.6 (99,167) <0.001
Area
Rural Ref.
Urban 2.6 (1.9,3.6) <0.001
Age
0-4 Years Ref.
5-9 Years 1.8 (1.0,3.1) 0.052
10-19 Years 5.1 (3.1,8.6) <0.001
20-49 Years 7.5 (4.6,12.4) <0.001
>=50 years 6.4 (3.7,10.9) <0.001
Mother tongue
  Urdu Ref.
  Punjabi 1.8 (1.2,2.7) 0.007
  Sindhi 1.5 (1.0,2.2) 0.028
  Pashto 2.1 (1.3,3.3) 0.001
  Balochi 1.9 (1.1,3.3) 0.022
  Saraiki 1.4 (0.5,4.2) 0.508
  Hindko 0.8 (0.3,2.3) 0.615
  Others 1.5 (1.0,2.2) 0.054
Wealth Index(quintiles)
  Poorest Ref.
  Poor 1.3 (1.0,1.8) 0.07
  Middle 1.8 (1.3,2.4) <0.001
  Rich 1.9 (1.4,2.7) <0.001
  Richest 1.5 (1.1,2.0) 0.018
Conjunctivitis
  Yes 1.6 (1.1,2.2) 0.007
  No Ref.
Contact with a confirmed COVID-19 case in last 2 weeks
  Yes 3.2 (1.5,6.8) 0.003
  No Ref.
Vitamin D Level (µmol/L)
  Severe Deficiency (<8.0 ng/mL) 2.1 (1.3,3.5) 0.003
  Deficiency (8.0 - 20.0 ng/mL) 1.7 (1.3,2.3) 0.001
  Desirable (>20.0 - 30.0 ng/mL) 1.2 (0.9,1.7) 0.211
  Sufficient (>30.0 ng/mL) Ref.
Table 4. Cox proportional regression model to study association with COVID-19 antibody seropositivity of study participants.
Variables Adjusted (HR 95% CI) P-values
Age
0-4 Years Ref.
5-9 Years 1.3 (1.0,1.7) 0.035
10-19 Years 1.9 (1.5,2.5) <0.001
20-49 Years 2.2 (1.7,2.7) <0.001
>=50 years 2.2 (1.7,2.8) <0.001
Mother tongue
  Urdu Ref.
  Punjabi 1.4 (1.2,1.6) <0.001
  Sindhi 1.2 (1.1,1.3) 0.002
  Pashto 1.0 (0.8,1.2) 0.835
  Balochi 1.3 (1.0,1.6) 0.035
  Saraiki 1.5 (0.9,2.3) 0.105
  Hindko 0.8 (0.5,1.3) 0.399
  Others 1.2 (1.1,1.5) 0.006
Wealth Index(quintiles)
  Poorest Ref.
  Poor 1.2 (1.1,1.4) 0.003
  Middle 1.2 (1.1,1.4) 0.002
  Rich 1.3 (1.1,1.5) <0.001
  Richest 1.1 (1.0,1.3) 0.048
Vitamin D Level (µmol/L)
  Severe Deficiency (<8.0 ng/mL) 1.4 (1.1,1.7) 0.001
  Deficiency (8.0 - 20.0 ng/mL) 1.2 (1.1,1.4) <0.001
  Desirable (>20.0 - 30.0 ng/mL) 1.1 (1.0,1.2) 0.12
  Sufficient (>30.0 ng/mL) Ref.
Table 5. Summary of COVID-19 confirmed through PCR or antigen testing of respiratory specimens of individuals tested in four serosurveys conducted from July 2020 to November 2021.
Survey round tested respiratory swabs tested (PCR + antigen, n) COVID-19 positive specimens % of COVID-19 positive specimens PCR tests conducted (n) Number of PCR Positive specimens % of PCR-positive specimens Antigen tests conducted (n) Number of Antigen Positive specimens % of Antigen positive specimens
Round- 1 606 10 1.7 606 10 1.7 - - -
Round- 2 1460 50 3.4 742 26 3.5 718 24 3.3
Round- 3 631 1 0.2 316 0 0.0 315 1 0.3
Round- 4 765 2 0.3 383 1 0.3 382 1 0.3
Total 3462 63 1.8 2047 37 1.8 1415 26 1.8
Disclaimer/Publisher’s Note: The statements, opinions and data contained in all publications are solely those of the individual author(s) and contributor(s) and not of MDPI and/or the editor(s). MDPI and/or the editor(s) disclaim responsibility for any injury to people or property resulting from any ideas, methods, instructions or products referred to in the content.
Copyright: This open access article is published under a Creative Commons CC BY 4.0 license, which permit the free download, distribution, and reuse, provided that the author and preprint are cited in any reuse.
Prerpints.org logo

Preprints.org is a free preprint server supported by MDPI in Basel, Switzerland.

Subscribe

© 2024 MDPI (Basel, Switzerland) unless otherwise stated