Submitted:
01 September 2024
Posted:
03 September 2024
You are already at the latest version
Abstract
Keywords:
1. Introduction
2. Results
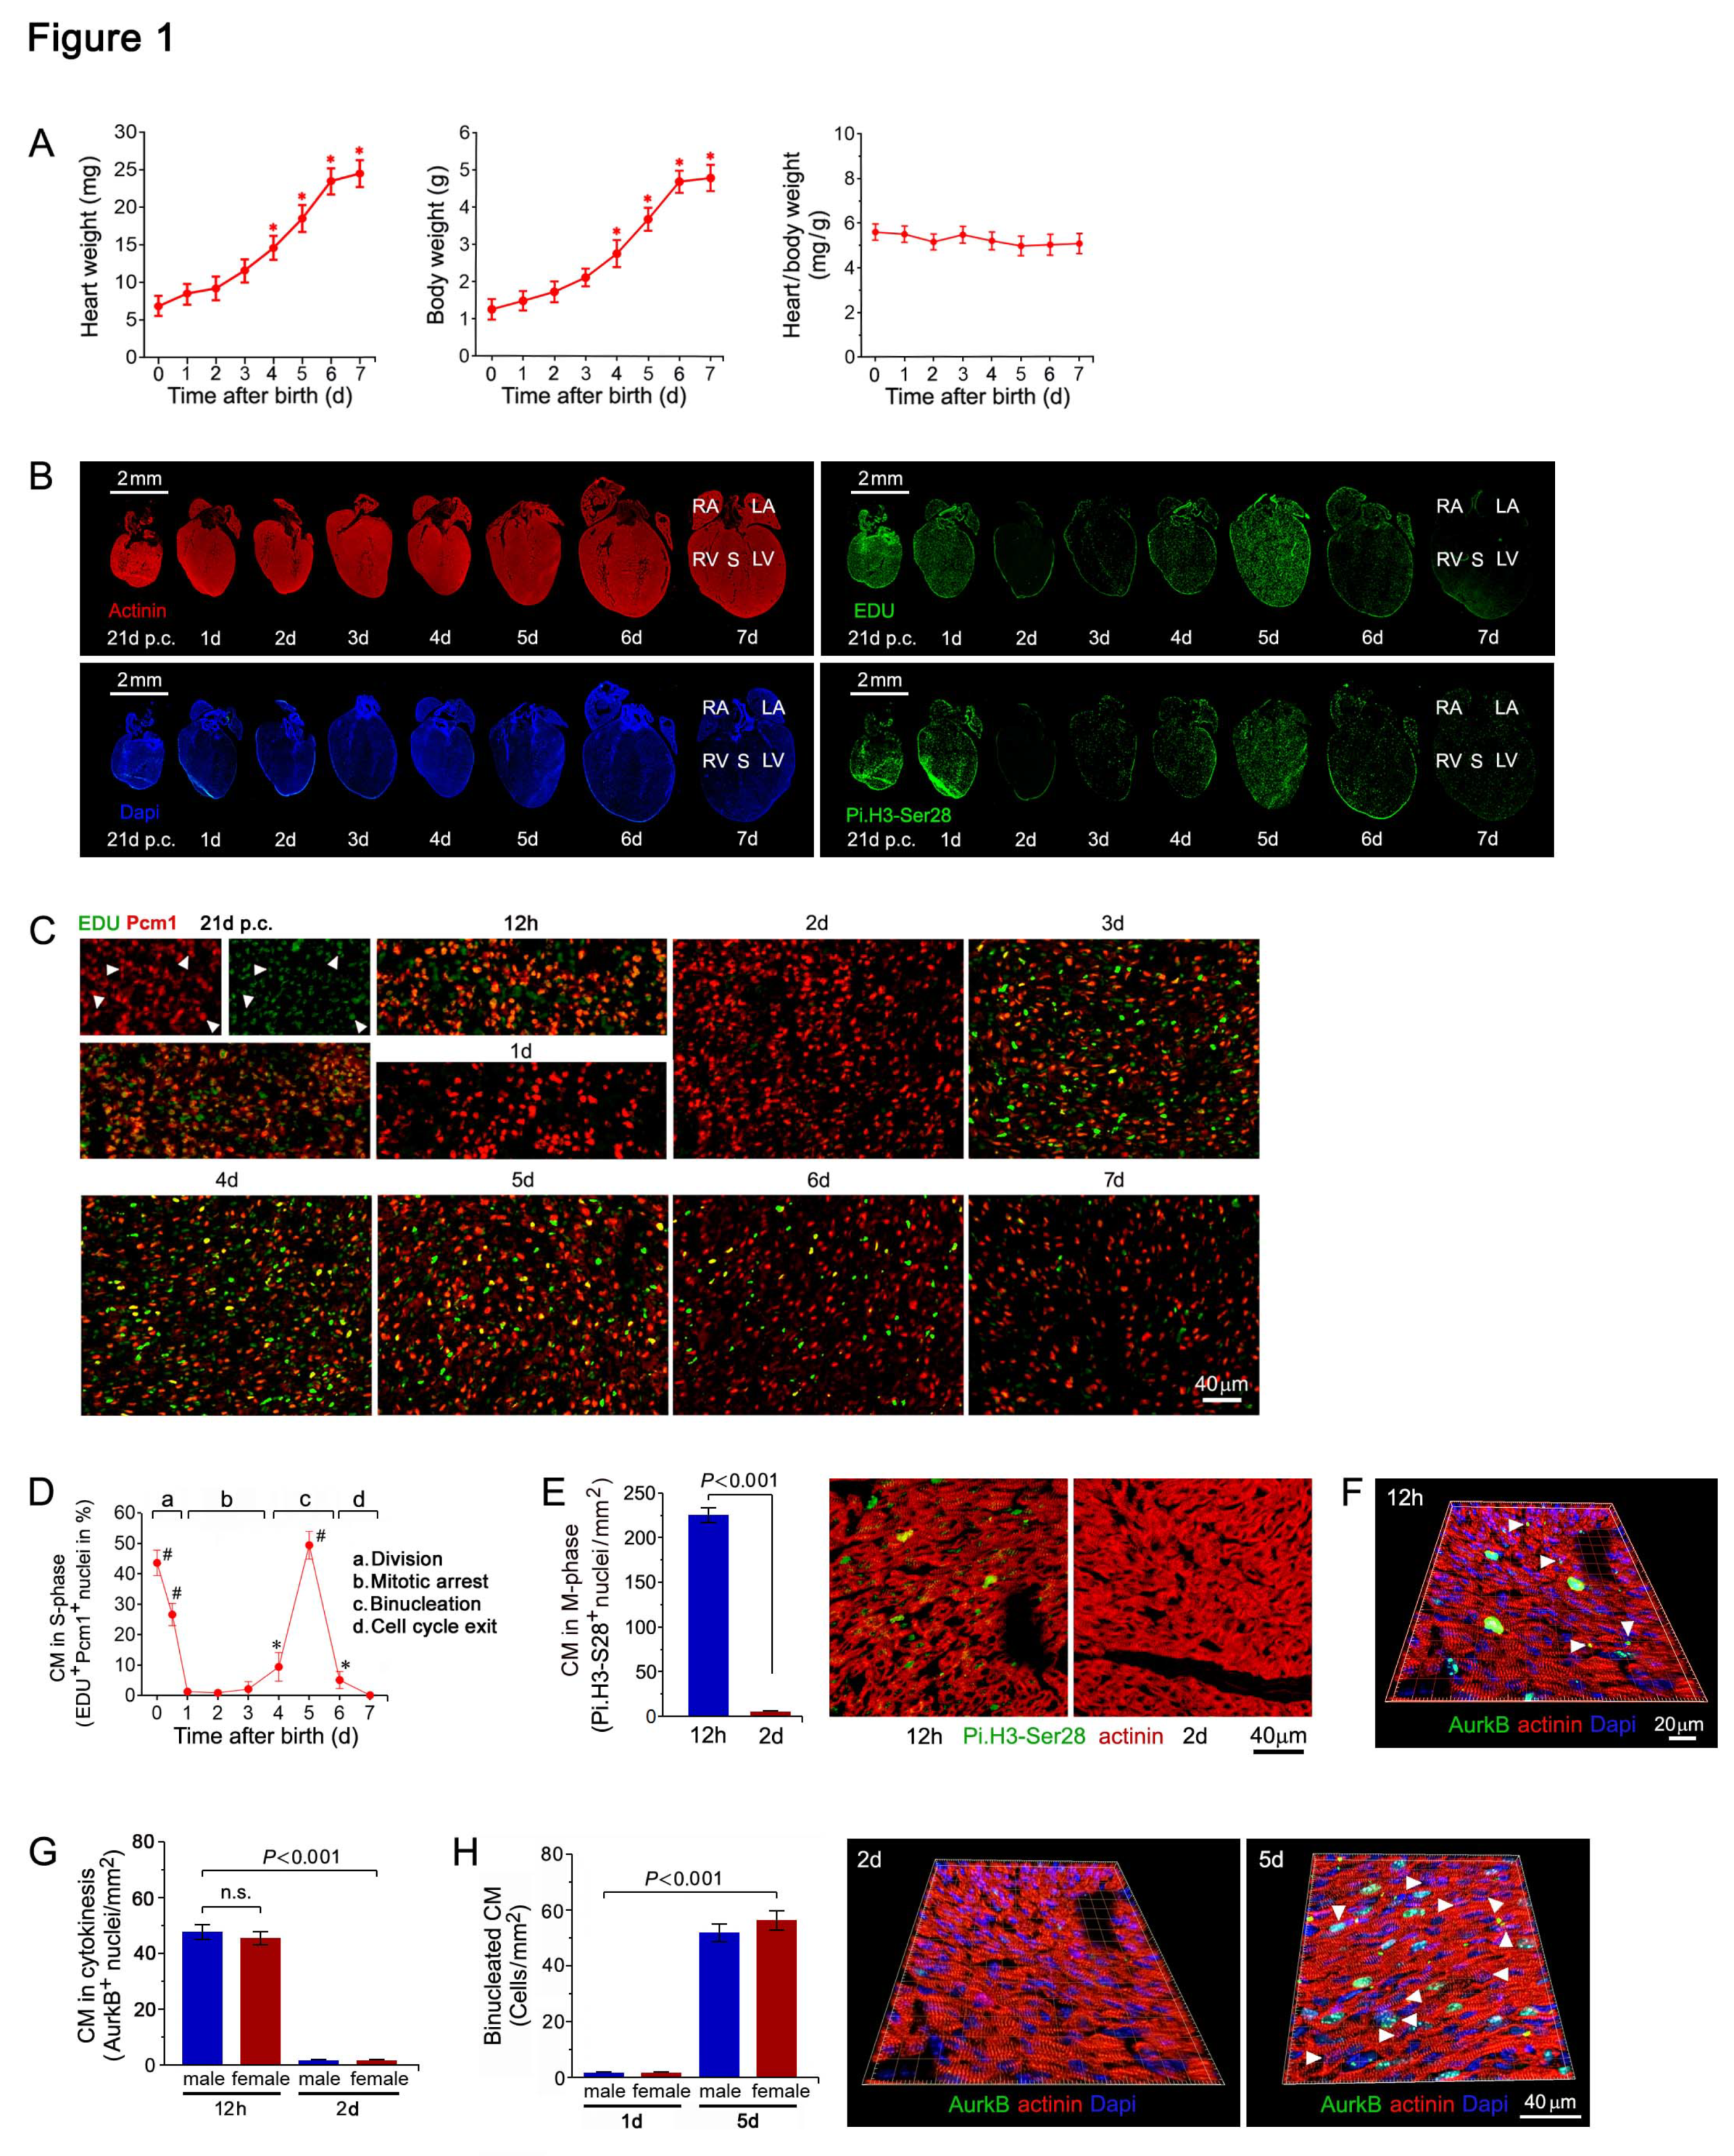
2.1. Cell Cycle Regulation of Cardiomyocytes in during the Early Neonatal Period
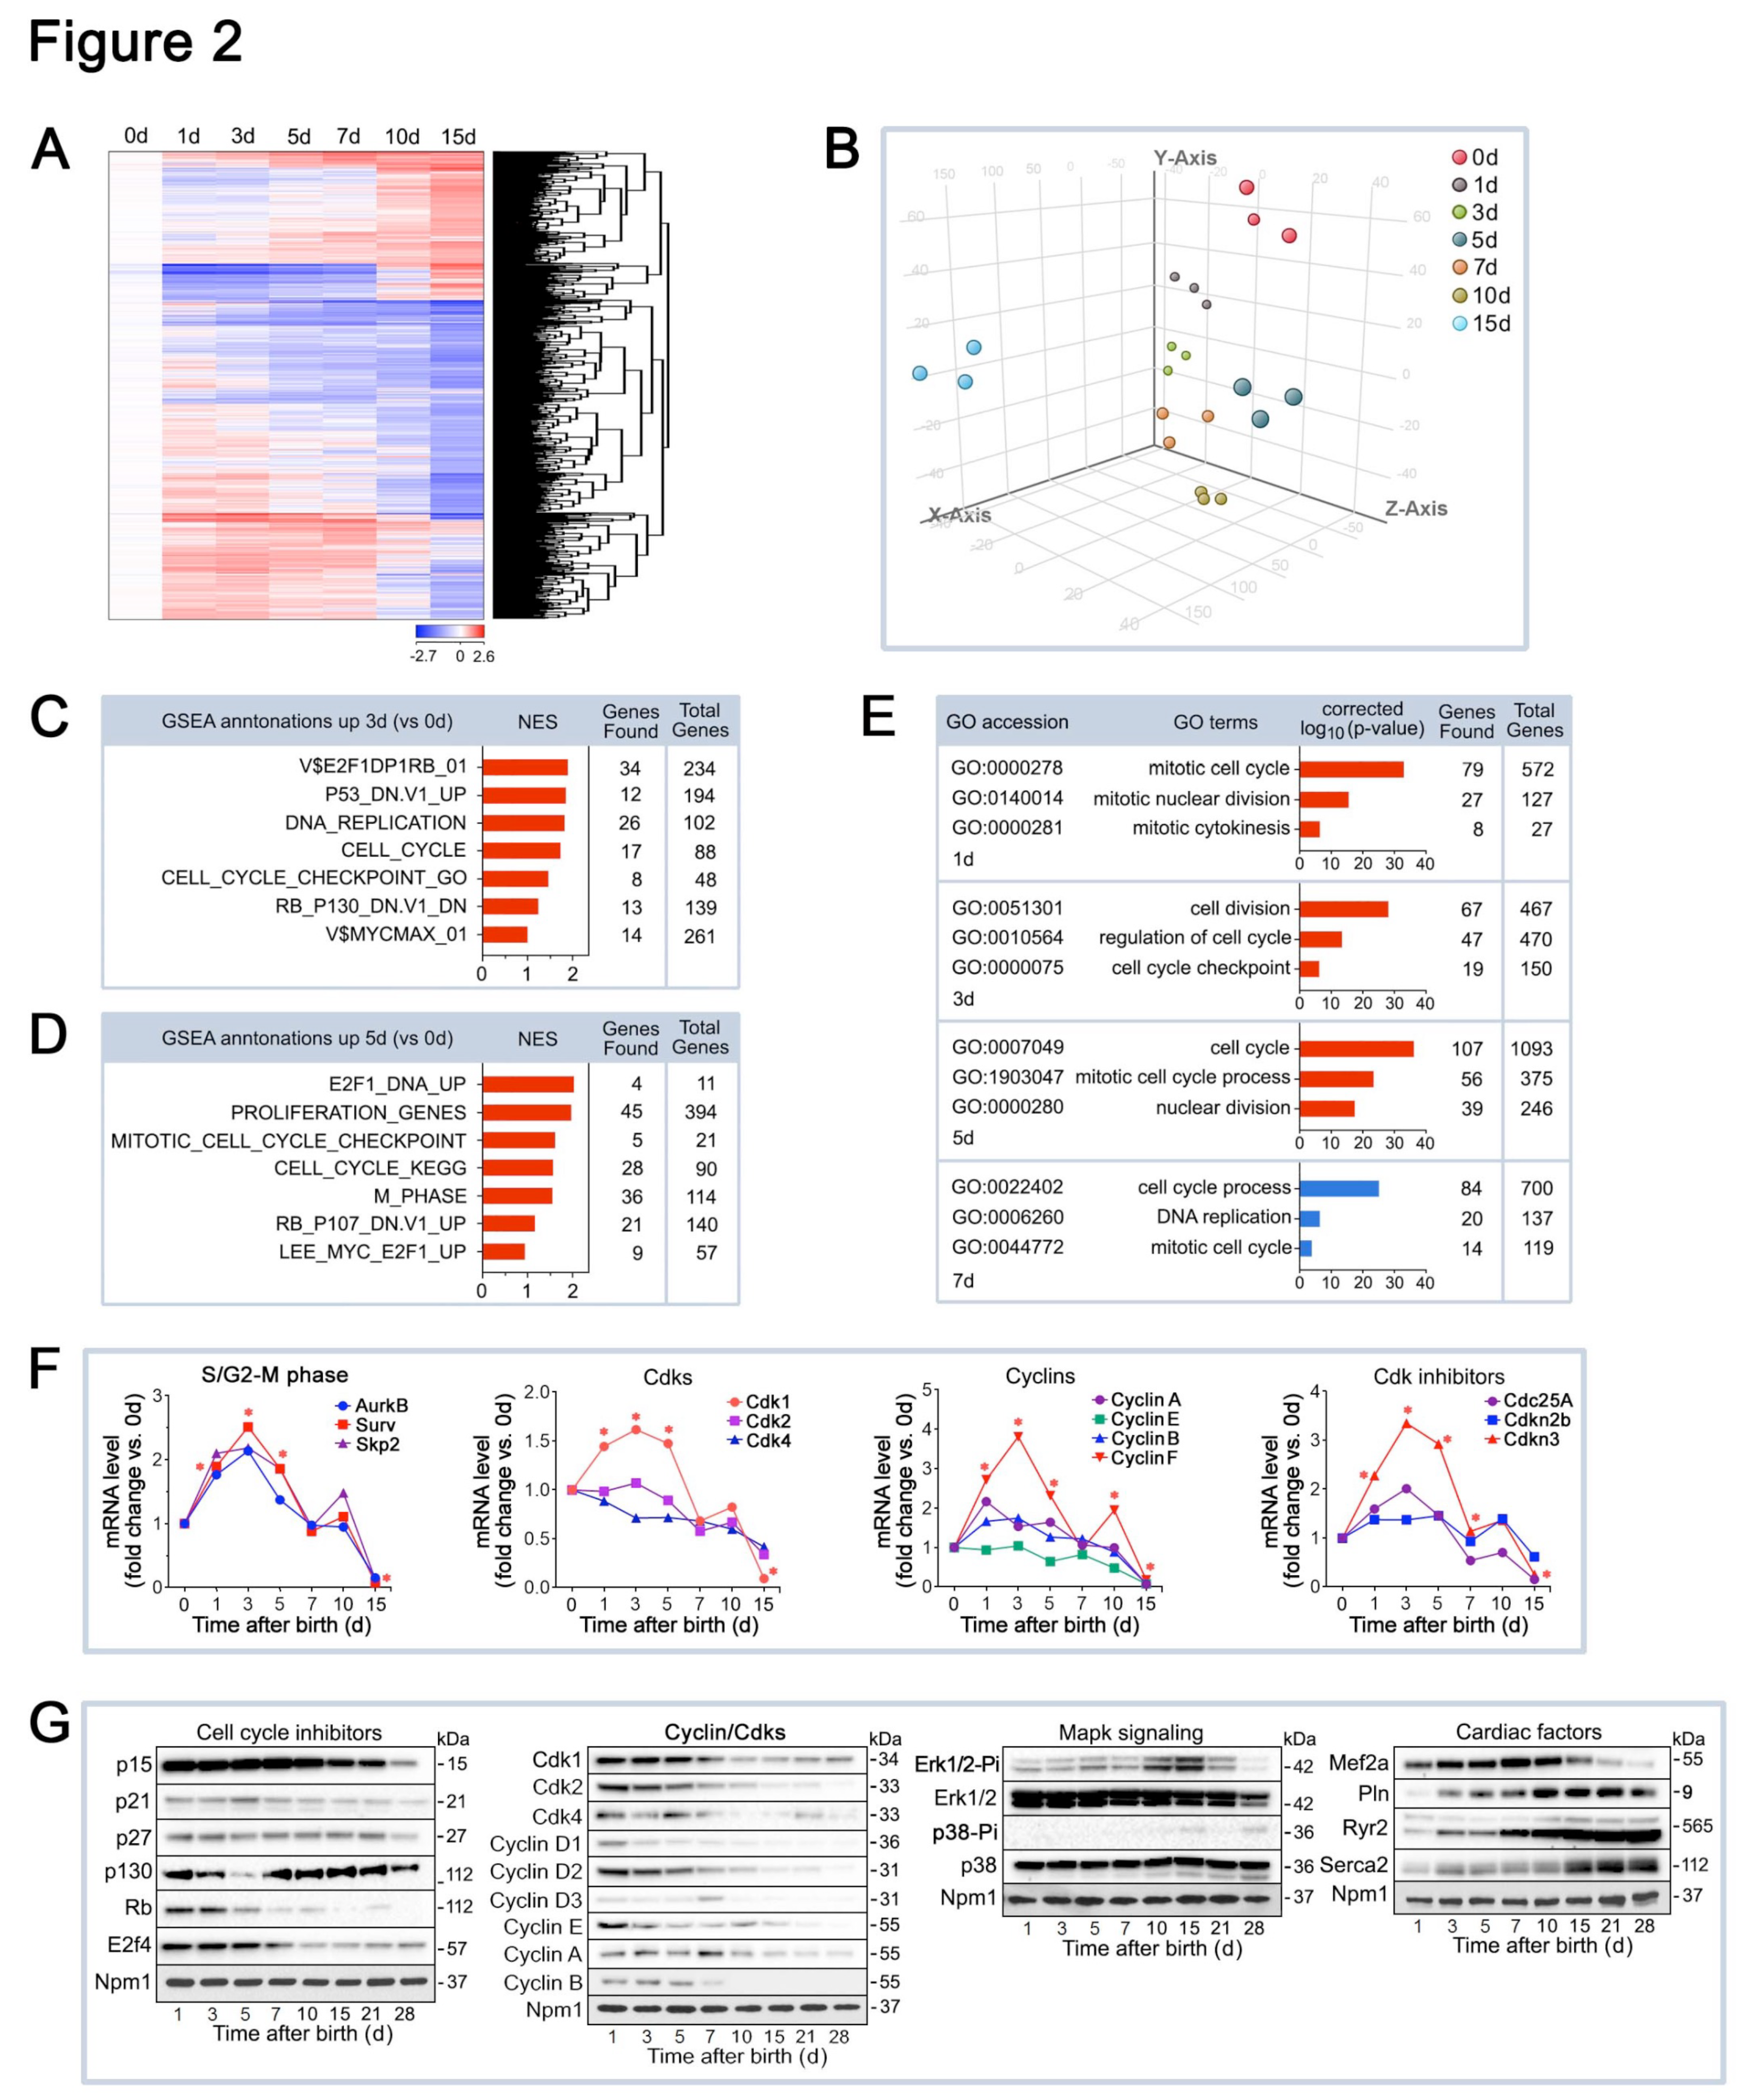
2.2. Differential mRNA Expression of Cell Cycle Factors in the Early Postnatal Period
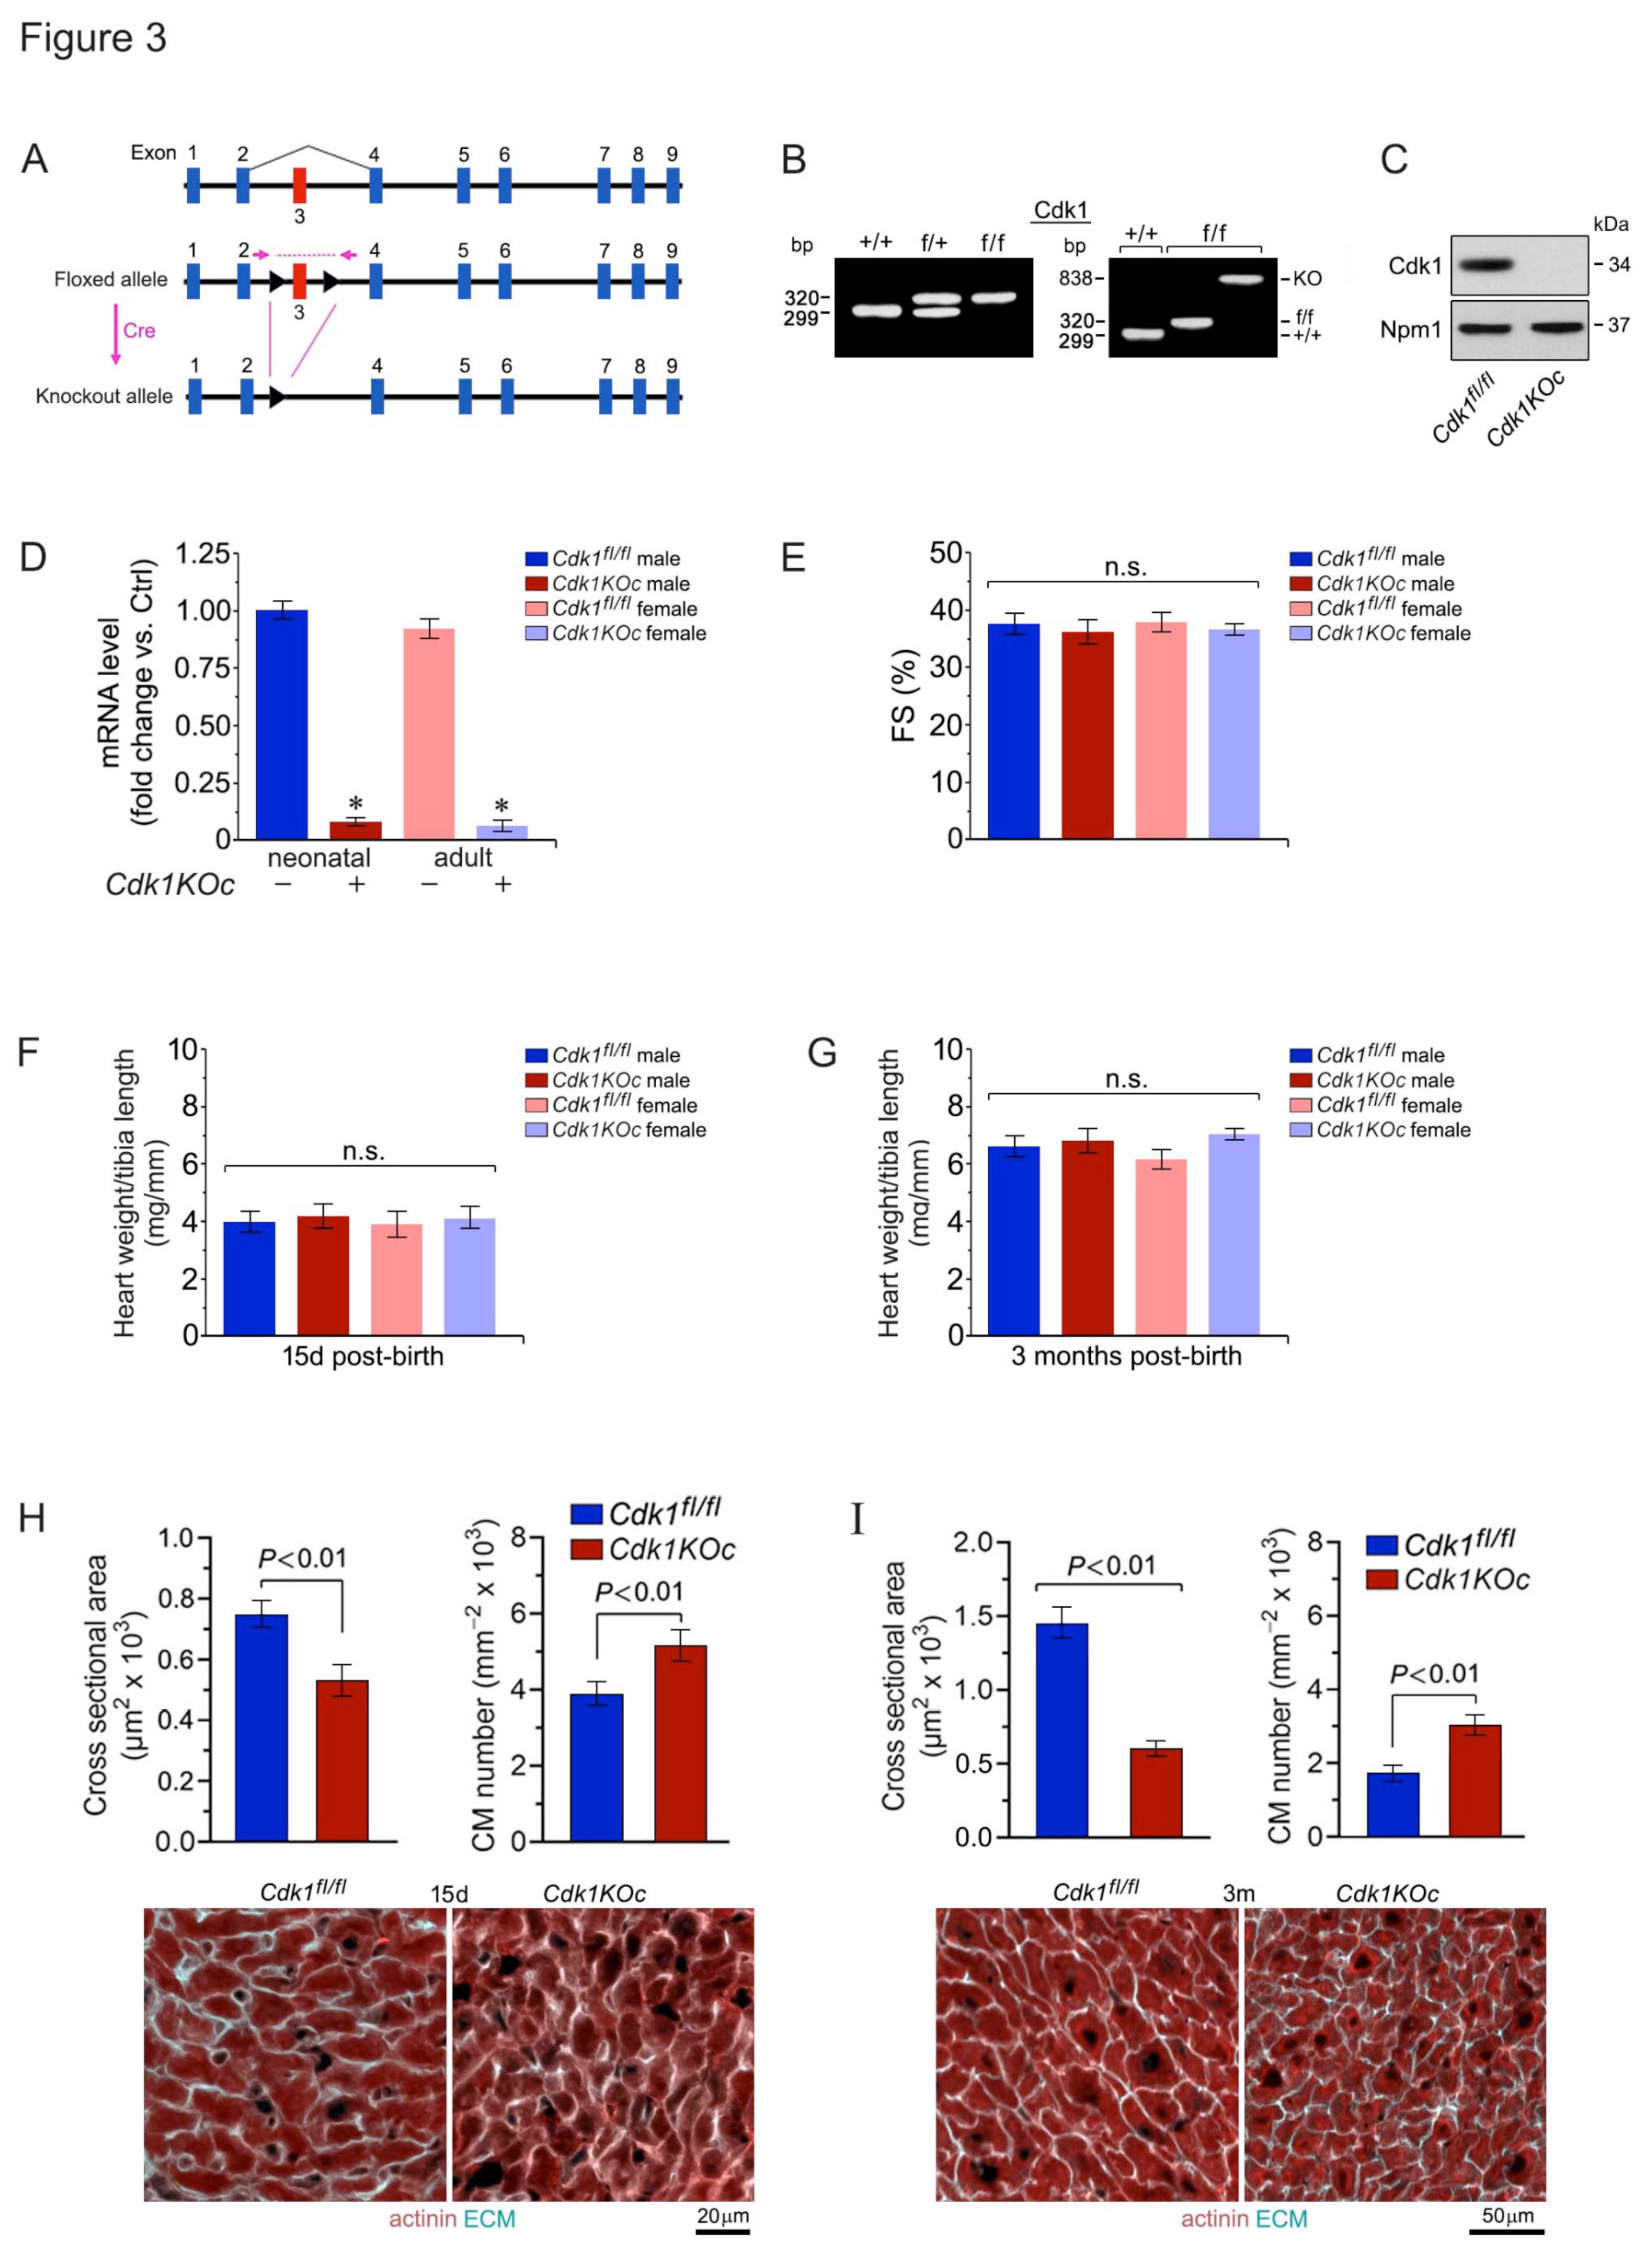
2.3. Ablation of Cdk1 Expands the Proliferative Time Window in Neonatal Cardiomyocytes
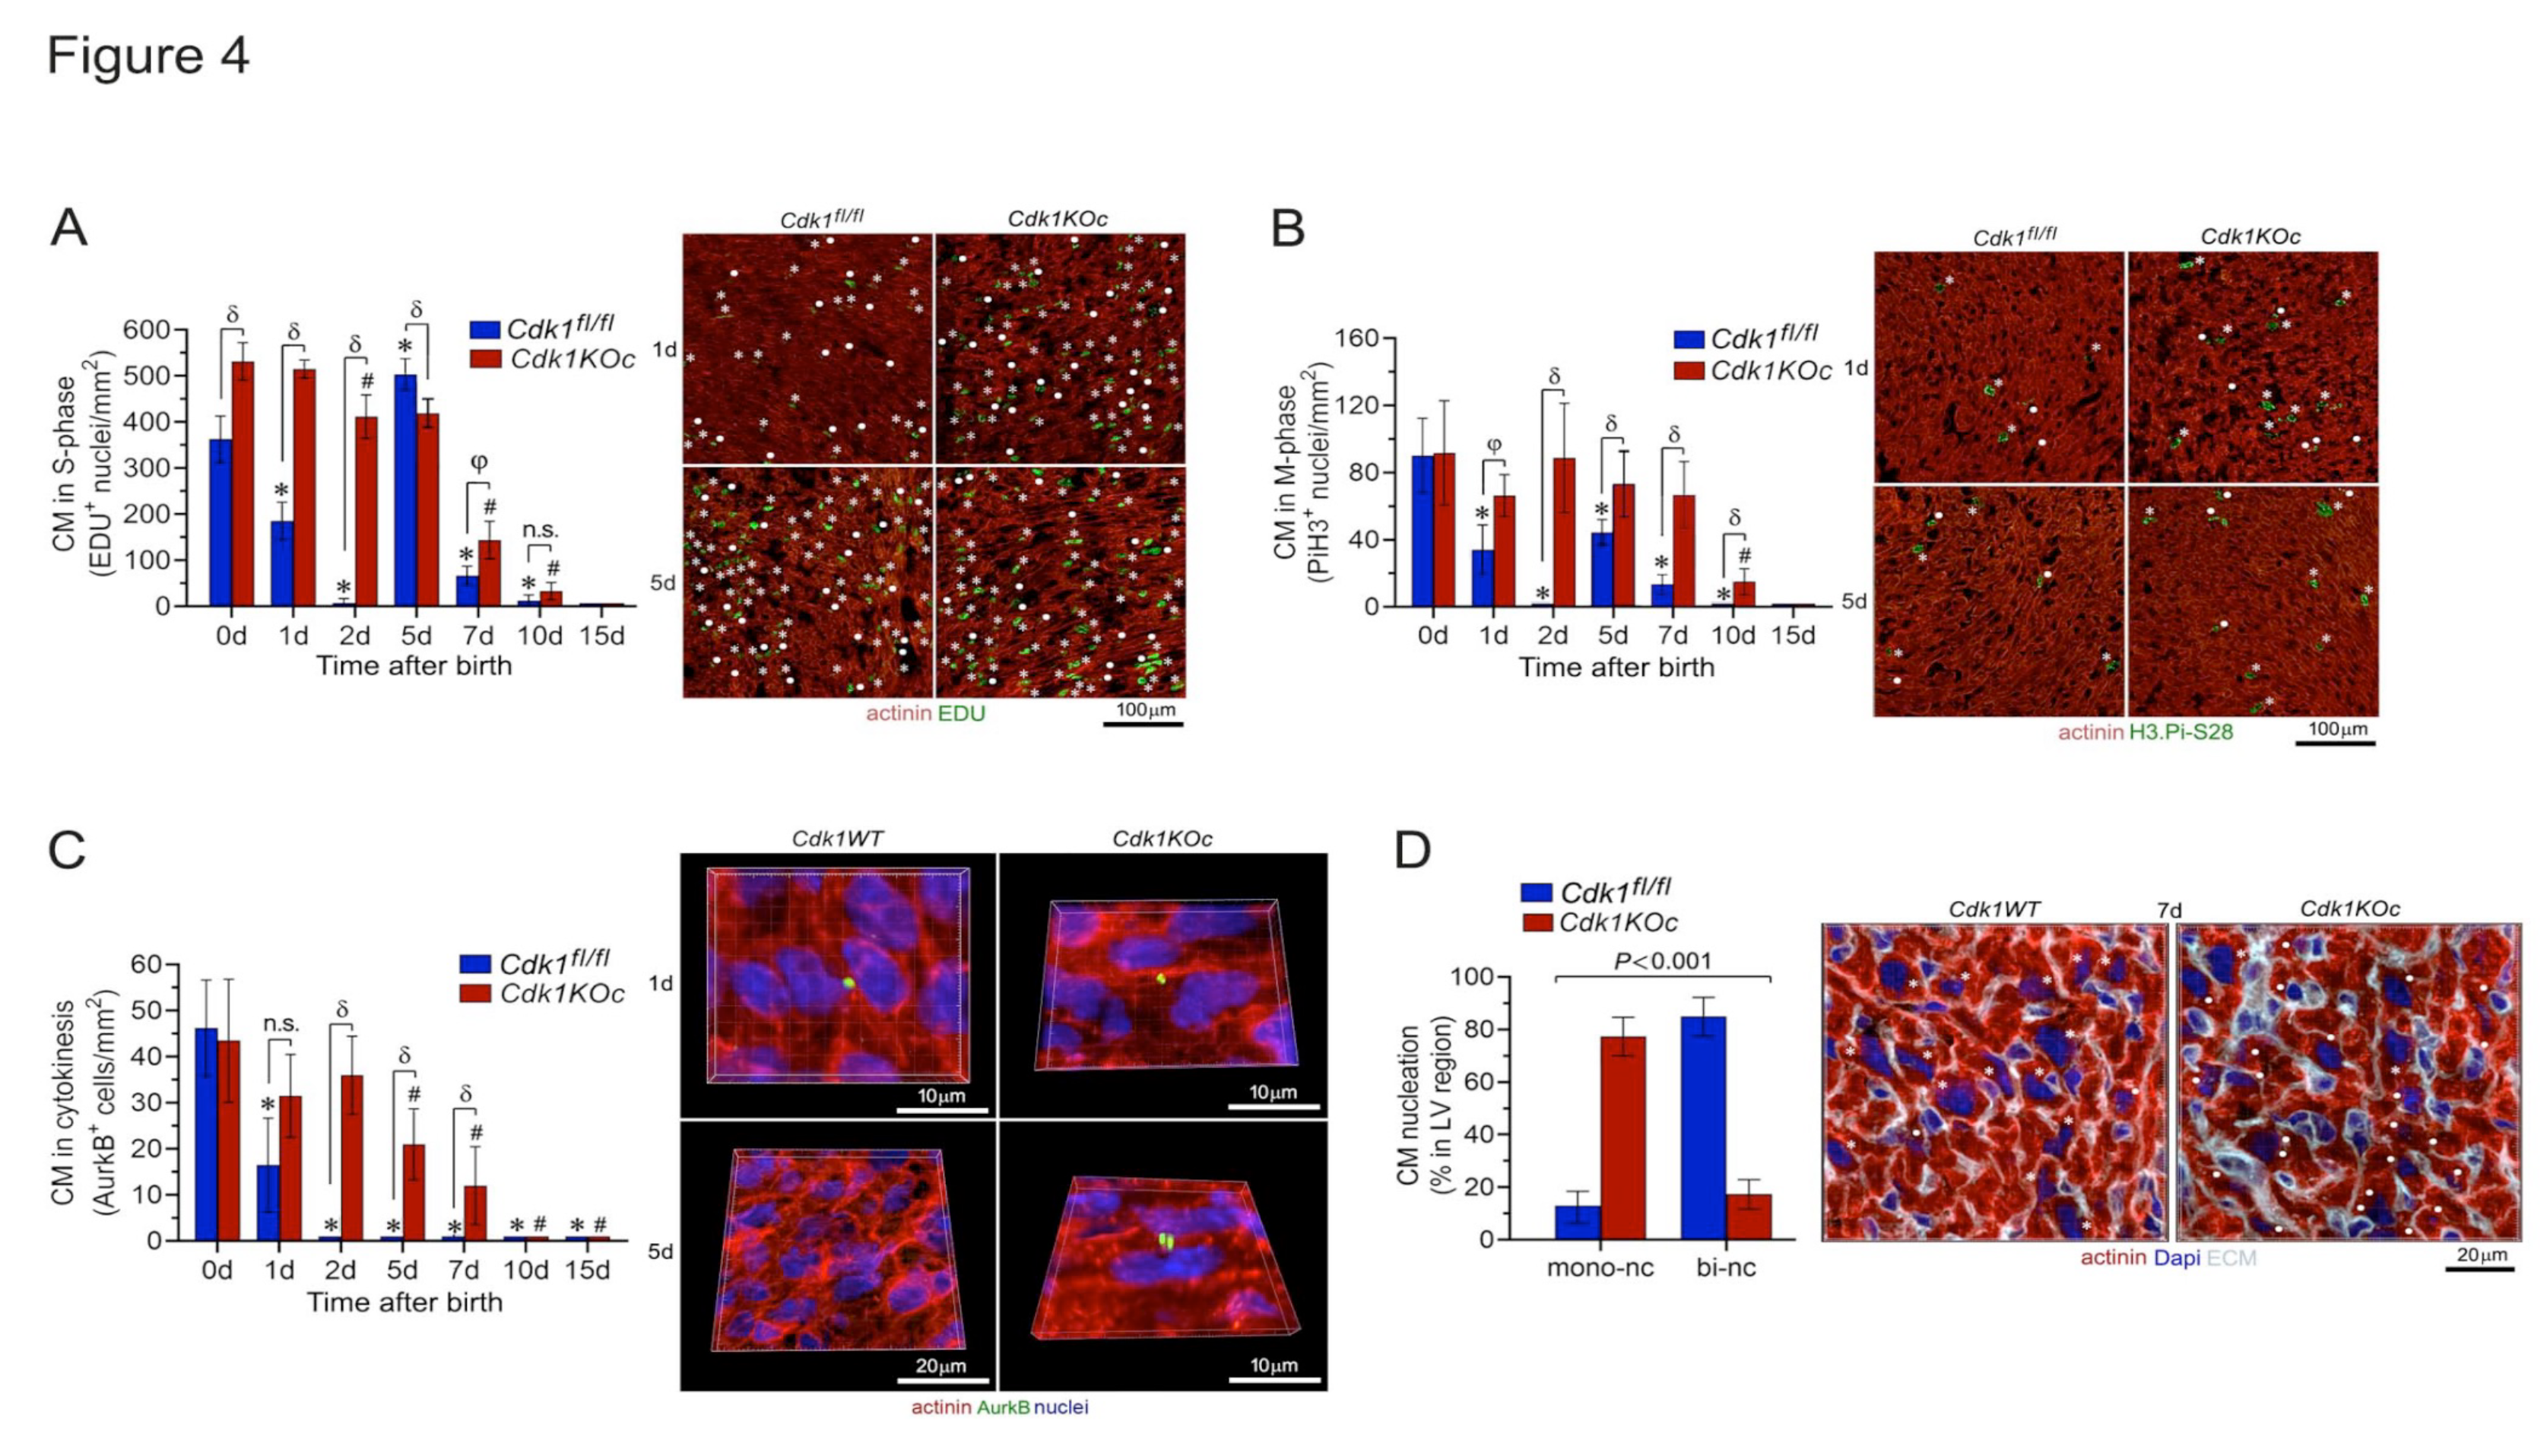
2.4. Loss of Cdk1 Prolongs the Proliferative Window of Cardiomyocytes during the Postnatal Stage
2.5. Loss of Cdk1 Triggers Cell Cycle Re-Entry and Proliferation of Adult Cardiomyocytes Post-MI
2.6. Activation of EGFR1 Signaling Promotes Cardiomyocyte Proliferation in Cdk1KOc Mice Post-MI
2.7. Cdk1-Deficiency Mitigates Hypertrophy, Boosts Survival and Improves Heart Function Post-MI
2.8. Cdk1 Loss Preserves Mitochondrial Energetics by Protecting Against Ischemic Oxidative Stress
3. Discussion
4. Conclusions
5. Materials and Methods
5.1. Generation of Cardiac-Specific Cdk1 Knockout Mice
5.2. Isolation of DNA and Genotyping
5.3. Coronary Artery Ligation
5.4. Echocardiography
5.5. DNA Synthesis, TUNEL, ROS Assays and 3-Dimensional Immunofluorescence Microscopy
5.6. Primary Mouse Neonatal Ventricular Cardiomyocyte Isolation
5.7. Preparation of Protein Extracts from Left Ventricular Heart Tissue Samples
5.8. Western Blotting
5.9. Total RNA Isolation, Reverse Transcription, and Quantitative Real Time PCR Assays
5.10. Cell Cycle RT-qPCR Array
5.11. Gene Expression Analysis and Bioinformatics
5.12. Isolation of Mitochondria, Detection of Oxidative Damage, Antioxidants, and ATP Levels
5.13. Statistical Analyses
Author Contributions
Funding
Institutional Review Board Statement
Informed Consent Statement
Data Availability Statement
Acknowledgments
Conflicts of Interest
References
- Farmakis D, Stafylas P, Giamouzis G, Maniadakis N, Parissis J. The medical and socioeconomic burden of heart failure: A comparative delineation with cancer. Int J Cardiol. 2016;203:279-281. [CrossRef]
- Minicucci MF, Azevedo PS, Polegato BF, Paiva SA, Zornoff LA. Heart failure after myocardial infarction: clinical implications and treatment. Clin Cardiol. 2011;34:410-414. [CrossRef]
- Anderson JL, Morrow DA. Acute Myocardial Infarction. N Engl J Med. 2017;376:2053-2064. [CrossRef]
- Sutton MG, Sharpe N. Left ventricular remodeling after myocardial infarction: pathophysiology and therapy. Circulation. 2000;101:2981-2988. [CrossRef]
- Soonpaa MH, Field LJ. Assessment of cardiomyocyte DNA synthesis in normal and injured adult mouse hearts. Am J Physiol. 1997;272:H220-226. [CrossRef]
- Soonpaa MH, Field LJ. Survey of studies examining mammalian cardiomyocyte DNA synthesis. Circ Res. 1998;83:15-26. [CrossRef]
- Lopaschuk GD, Jaswal JS. Energy metabolic phenotype of the cardiomyocyte during development, differentiation, and postnatal maturation. J Cardiovasc Pharmacol. 2010;56:130-140. [CrossRef]
- Breckenridge RA. Molecular control of cardiac fetal/neonatal remodeling. J Cardiovascular Dev Disease. 2014;1:29-36.
- Soonpaa MH, Kim KK, Pajak L, Franklin M, Field LJ. Cardiomyocyte DNA synthesis and binucleation during murine development. Am J Physiol. 1996;271:H2183-2189. [CrossRef]
- Maillet M, van Berlo JH, Molkentin JD. Molecular basis of physiological heart growth: fundamental concepts and new players. Nat Rev Mol Cell Biol. 2013;14:38-48. [CrossRef]
- Foglia MJ, Poss KD. Building and re-building the heart by cardiomyocyte proliferation. Development. 2016;143:729-740. [CrossRef]
- Zebrowski DC, Engel FB. The cardiomyocyte cell cycle in hypertrophy, tissue homeostasis, and regeneration. Rev Physiol Biochem Pharmacol. 2013;165:67-96. [CrossRef]
- Agata Y, Hiraishi S, Oguchi K, Misawa H, Horiguchi Y, Fujino N, Yashiro K, Shimada N. Changes in left ventricular output from fetal to early neonatal life. J Pediatr. 1991;119:441-445. [CrossRef]
- Lopaschuk GD, Spafford MA, Marsh DR. Glycolysis is predominant source of myocardial ATP production immediately after birth. Am J Physiol. 1991;261:H1698-1705. [CrossRef]
- Lavrentyev EN, He D, Cook GA. Expression of genes participating in regulation of fatty acid and glucose utilization and energy metabolism in developing rat hearts. Am J Physiol Heart Circ Physiol. 2004;287:H2035-2042. [CrossRef]
- Lai L, Leone TC, Zechner C, Schaeffer PJ, Kelly SM, Flanagan DP, Medeiros DM, Kovacs A, Kelly DP. Transcriptional coactivators PGC-1alpha and PGC-lbeta control overlapping programs required for perinatal maturation of the heart. Genes Dev. 2008;22:1948-1961. [CrossRef]
- RA B. Molecular control of cardiac fetal/neonatal remodeling. J Cardiovascular Dev Disease. 2014;1:29-36.
- von Harsdorf R, Hauck L, Mehrhof F, Wegenka U, Cardoso MC, Dietz R. E2F-1 overexpression in cardiomyocytes induces downregulation of p21CIP1 and p27KIP1 and release of active cyclin-dependent kinases in the presence of insulin-like growth factor I. Circ Res. 1999;85:128-136. [CrossRef]
- Tane S, Okayama H, Ikenishi A, Amemiya Y, Nakayama KI, Takeuchi T. Two inhibitory systems and CKIs regulate cell cycle exit of mammalian cardiomyocytes after birth. Biochem Biophys Res Commun. 2015;466:147-154. [CrossRef]
- Wamstad JA, Alexander JM, Truty RM, Shrikumar A, Li F, Eilertson KE, Ding H, Wylie JN, Pico AR, Capra JA, et al. Dynamic and coordinated epigenetic regulation of developmental transitions in the cardiac lineage. Cell. 2012;151:206-220. [CrossRef]
- Sim CB, Ziemann M, Kaspi A, Harikrishnan KN, Ooi J, Khurana I, Chang L, Hudson JE, El-Osta A, Porrello ER. Dynamic changes in the cardiac methylome during postnatal development. FASEB J. 2015;29:1329-1343. [CrossRef]
- Brodsky WY, Arefyeva AM, Uryvaeva IV. Mitotic polyploidization of mouse heart myocytes during the first postnatal week. Cell Tissue Res. 1980;210:133-144. [CrossRef]
- Brodsky WY, Tsirekidze NN, Arefyeva AM. Mitotic-cyclic and cycle-independent growth of cardiomyocytes. J Mol Cell Cardiol. 1985;17:445-455. [CrossRef]
- O’Meara CC, Wamstad JA, Gladstone RA, Fomovsky GM, Butty VL, Shrikumar A, Gannon JB, Boyer LA, Lee RT. Transcriptional reversion of cardiac myocyte fate during mammalian cardiac regeneration. Circ Res. 2015;116:804-815. [CrossRef]
- Mathiyalagan P, Keating ST, Du XJ, El-Osta A. Chromatin modifications remodel cardiac gene expression. Cardiovasc Res. 2014;103:7-16. [CrossRef]
- He A, Kong SW, Ma Q, Pu WT. Co-occupancy by multiple cardiac transcription factors identifies transcriptional enhancers active in heart. Proc Natl Acad Sci U S A. 2011;108:5632-5637. [CrossRef]
- von Gise A, Lin Z, Schlegelmilch K, Honor LB, Pan GM, Buck JN, Ma Q, Ishiwata T, Zhou B, Camargo FD, et al. YAP1, the nuclear target of Hippo signaling, stimulates heart growth through cardiomyocyte proliferation but not hypertrophy. Proc Natl Acad Sci U S A. 2012;109:2394-2399. [CrossRef]
- Lin Z, Zhou P, von Gise A, Gu F, Ma Q, Chen J, Guo H, van Gorp PR, Wang DZ, Pu WT. Pi3kcb links Hippo-YAP and PI3K-AKT signaling pathways to promote cardiomyocyte proliferation and survival. Circ Res. 2015;116:35-45. [CrossRef]
- Heallen T, Zhang M, Wang J, Bonilla-Claudio M, Klysik E, Johnson RL, Martin JF. Hippo pathway inhibits Wnt signaling to restrain cardiomyocyte proliferation and heart size. Science. 2011;332:458-461. [CrossRef]
- Lim S, Kaldis P. Cdks, cyclins and CKIs: roles beyond cell cycle regulation. Development. 2013;140:3079-3093. [CrossRef]
- Rhind N, Russell P. Signaling pathways that regulate cell division. Cold Spring Harb Perspect Biol. 2012;4. [CrossRef]
- Nigg EA. Mitotic kinases as regulators of cell division and its checkpoints. Nat Rev Mol Cell Biol. 2001;2:21-32. [CrossRef]
- Riabowol K, Draetta G, Brizuela L, Vandre D, Beach D. The cdc2 kinase is a nuclear protein that is essential for mitosis in mammalian cells. Cell. 1989;57:393-401. [CrossRef]
- Morgan DO. Principles of CDK regulation. Nature. 1995;374:131-134. [CrossRef]
- Parker LL, Piwnica-Worms H. Inactivation of the p34cdc2-cyclin B complex by the human WEE1 tyrosine kinase. Science. 1992;257:1955-1957. [CrossRef]
- Szmyd R, Niska-Blakie J, Diril MK, Renck Nunes P, Tzelepis K, Lacroix A, van Hul N, Deng LW, Matos J, Dreesen O, et al. Premature activation of Cdk1 leads to mitotic events in S phase and embryonic lethality. Oncogene. 2019;38:998-1018. [CrossRef]
- Huynh N, Dickson C, Zencak D, Hilko DH, Mackay-Sim A, Poulsen SA. Labeling of Cellular DNA with a Cyclosal Phosphotriester Pronucleotide Analog of 5-ethynyl-2’-deoxyuridine. Chem Biol Drug Des. 2015;86:400-409. [CrossRef]
- Crosio C, Fimia GM, Loury R, Kimura M, Okano Y, Zhou H, Sen S, Allis CD, Sassone-Corsi P. Mitotic phosphorylation of histone H3: spatio-temporal regulation by mammalian Aurora kinases. Mol Cell Biol. 2002;22:874-885. [CrossRef]
- Gilsbach R, Preissl S, Gruning BA, Schnick T, Burger L, Benes V, Wurch A, Bonisch U, Gunther S, Backofen R, et al. Dynamic DNA methylation orchestrates cardiomyocyte development, maturation and disease. Nat Commun. 2014;5:5288. [CrossRef]
- Gilsbach R, Schwaderer M, Preissl S, Gruning BA, Kranzhofer D, Schneider P, Nuhrenberg TG, Mulero-Navarro S, Weichenhan D, Braun C, et al. Distinct epigenetic programs regulate cardiac myocyte development and disease in the human heart in vivo. Nat Commun. 2018;9:391. [CrossRef]
- Yasui Y, Urano T, Kawajiri A, Nagata K, Tatsuka M, Saya H, Furukawa K, Takahashi T, Izawa I, Inagaki M. Autophosphorylation of a newly identified site of Aurora-B is indispensable for cytokinesis. J Biol Chem. 2004;279:12997-13003. [CrossRef]
- Hauck L, Dadson K, Chauhan S, Grothe D, Billia F. Inhibiting the Pkm2/b-catenin axis drives in vivo replication of adult cardiomyocytes following experimental MI. Cell Death Differ. 2021;28:1398-1417. [CrossRef]
- Mak TW, Hauck L, Grothe D, Billia F. p53 regulates the cardiac transcriptome. Proc Natl Acad Sci U S A. 2017;114:2331-2336. [CrossRef]
- Gonzalez-Rosa JM, Sharpe M, Field D, Soonpaa MH, Field LJ, Burns CE, Burns CG. Myocardial Polyploidization Creates a Barrier to Heart Regeneration in Zebrafish. Dev Cell. 2018;44:433-446 e437. [CrossRef]
- Kirillova A, Han L, Liu H, Kuhn B. Polyploid cardiomyocytes: implications for heart regeneration. Development. 2021;148. [CrossRef]
- Chaffee BR, Shang F, Chang ML, Clement TM, Eddy EM, Wagner BD, Nakahara M, Nagata S, Robinson ML, Taylor A. Nuclear removal during terminal lens fiber cell differentiation requires CDK1 activity: appropriating mitosis-related nuclear disassembly. Development. 2014;141:3388-3398. [CrossRef]
- Agah R, Frenkel PA, French BA, Michael LH, Overbeek PA, Schneider MD. Gene recombination in postmitotic cells. Targeted expression of Cre recombinase provokes cardiac-restricted, site-specific rearrangement in adult ventricular muscle in vivo. J Clin Invest. 1997;100:169-179. [CrossRef]
- Virag JI, Murry CE. Myofibroblast and endothelial cell proliferation during murine myocardial infarct repair. Am J Pathol. 2003;163:2433-2440. [CrossRef]
- Chen J. The Cell-Cycle Arrest and Apoptotic Functions of p53 in Tumor Initiation and Progression. Cold Spring Harb Perspect Med. 2016;6:a026104. [CrossRef]
- Engel FB, Schebesta M, Duong MT, Lu G, Ren S, Madwed JB, Jiang H, Wang Y, Keating MT. p38 MAP kinase inhibition enables proliferation of adult mammalian cardiomyocytes. Genes Dev. 2005;19:1175-1187. [CrossRef]
- Xie Y, Su N, Yang J, Tan Q, Huang S, Jin M, Ni Z, Zhang B, Zhang D, Luo F, et al. FGF/FGFR signaling in health and disease. Signal Transduct Target Ther. 2020;5:181. [CrossRef]
- Bhatt AS, Ambrosy AP, Velazquez EJ. Adverse Remodeling and Reverse Remodeling After Myocardial Infarction. Curr Cardiol Rep. 2017;19:71. [CrossRef]
- Hauck L, Stanley-Hasnain S, Fung A, Grothe D, Rao V, Mak TW, Billia F. Cardiac-specific ablation of the E3 ubiquitin ligase Mdm2 leads to oxidative stress, broad mitochondrial deficiency and early death. PLoS One. 2017;12:e0189861. [CrossRef]
- Santamaria D, Barriere C, Cerqueira A, Hunt S, Tardy C, Newton K, Caceres JF, Dubus P, Malumbres M, Barbacid M. Cdk1 is sufficient to drive the mammalian cell cycle. Nature. 2007;448:811-815. [CrossRef]
- Berthet C, Klarmann KD, Hilton MB, Suh HC, Keller JR, Kiyokawa H, Kaldis P. Combined loss of Cdk2 and Cdk4 results in embryonic lethality and Rb hypophosphorylation. Dev Cell. 2006;10:563-573. [CrossRef]
- Satyanarayana A, Berthet C, Lopez-Molina J, Coppola V, Tessarollo L, Kaldis P. Genetic substitution of Cdk1 by Cdk2 leads to embryonic lethality and loss of meiotic function of Cdk2. Development. 2008;135:3389-3400. [CrossRef]
- Yuan X, Braun T. Multimodal Regulation of Cardiac Myocyte Proliferation. Circ Res. 2017;121:293-309. [CrossRef]
- Liao HS, Kang PM, Nagashima H, Yamasaki N, Usheva A, Ding B, Lorell BH, Izumo S. Cardiac-specific overexpression of cyclin-dependent kinase 2 increases smaller mononuclear cardiomyocytes. Circ Res. 2001;88:443-450. [CrossRef]
- Kozar K, Ciemerych MA, Rebel VI, Shigematsu H, Zagozdzon A, Sicinska E, Geng Y, Yu Q, Bhattacharya S, Bronson RT, et al. Mouse development and cell proliferation in the absence of D-cyclins. Cell. 2004;118:477-491. [CrossRef]
- Gan P, Patterson M, Watanabe H, Wang K, Edmonds RA, Reinholdt LG, Sucov HM. Allelic variants between mouse substrains BALB/cJ and BALB/cByJ influence mononuclear cardiomyocyte composition and cardiomyocyte nuclear ploidy. Sci Rep. 2020;10:7605. [CrossRef]
- Ahuja P, Sdek P, MacLellan WR. Cardiac myocyte cell cycle control in development, disease, and regeneration. Physiol Rev. 2007;87:521-544. [CrossRef]
- Naqvi N, Li M, Calvert JW, Tejada T, Lambert JP, Wu J, Kesteven SH, Holman SR, Matsuda T, Lovelock JD, et al. A proliferative burst during preadolescence establishes the final cardiomyocyte number. Cell. 2014;157:795-807. [CrossRef]
- Alkass K, Panula J, Westman M, Wu TD, Guerquin-Kern JL, Bergmann O. No Evidence for Cardiomyocyte Number Expansion in Preadolescent Mice. Cell. 2015;163:1026-1036. [CrossRef]
- Soonpaa MH, Zebrowski DC, Platt C, Rosenzweig A, Engel FB, Field LJ. Cardiomyocyte Cell-Cycle Activity during Preadolescence. Cell. 2015;163:781-782. [CrossRef]
- Billia F, Hauck L, Konecny F, Rao V, Shen J, Mak TW. PTEN-inducible kinase 1 (PINK1)/Park6 is indispensable for normal heart function. Proc Natl Acad Sci U S A. 2011;108:9572-9577. [CrossRef]
Disclaimer/Publisher’s Note: The statements, opinions and data contained in all publications are solely those of the individual author(s) and contributor(s) and not of MDPI and/or the editor(s). MDPI and/or the editor(s) disclaim responsibility for any injury to people or property resulting from any ideas, methods, instructions or products referred to in the content. |
© 2024 by the authors. Licensee MDPI, Basel, Switzerland. This article is an open access article distributed under the terms and conditions of the Creative Commons Attribution (CC BY) license (https://creativecommons.org/licenses/by/4.0/).


