1. Introduction
Owing to rapid growth of the eco-friendly vehicle industry, the demand for high-performance magnetic materials has been increasing by more than 20% annually [
1]. In line with this trend, soft magnetic composites (SMCs) are attracting attention, especially for use in the driving motors and fuel pumps of eco-friendly cars. The use of SMCs helps reduce the weight of automobiles, which plays an important role in enhancing their energy efficiency and responding to strengthening environmental regulations in various countries. Therefore, SMC manufacturers are focusing on developing sustainable products [
2]. , for instance, by using recyclable materials, improving energy efficiency, and reducing carbon emissions, to minimize the associated environmental impact [
3]. This trend has further accelerated the growth of the SMC market [
4].
When SMCs are used to manufacture the core of electric vehicle drive motors, they offer several advantages. According to Ampere's law, the shipment of magnetic fields along a closed curve is proportional to the current penetrating the curve. Therefore, it is possible to design an SMC with a three-dimensional magnetic flux path, which greatly improves flexibility in motor design. This facilitates the manufacture of complex-shaped core, thereby contributing to motor performance optimization.
Generally, an SMC is prepared by mixing an iron-based powder with an insulator, molding it at high pressure, and subjecting it to heat treatment. In this process, the powder particles are oriented randomly, which is one of the main characteristics of SMCs. This random orientation of SMCs provides advantages such as isotropic magnetic properties of the core, loss reduction, and ease of manufacture. Compared to a traditional laminated steel core, it is possible to design a three-dimensional magnetic flux path owing to the isotropic magnetic properties of SMC cores, which offers many benefits. In addition, SMCs offer high efficiency and current speed over a large cross-sectional area because each individual particle in them is insulated. Consequently, the magnitude of the eddy current decreases, which leads to a decrease in energy loss due to the eddy current. In sum, SMCs effectively reduce the eddy current loss, thereby providing excellent performance in high-frequency regions. This improvement in the high-frequency performance of SMCs can be explained using the Maxwell equation. According to this equation, at high frequencies, current is concentrated on the conductor surface owing to the skin effect. The SMC structure minimizes this skin effect because each particle in an SMC is insulated, meaning that SMCs can be operated efficiently at high frequencies. This factor is an important in the case of high-efficiency, high-speed electric vehicle drive motors. The mass of the motor must be small to ensure greater acceleration with the same force. By using SMCs, the total motor mass can be reduced, and higher performance can be achieved with the same power. These improvements increase the energy efficiency and driving distance of electric vehicles. Based on these theoretical principles, EV drive motors comprising cores made of SMCs can provide excellent performance and efficiency [
5,
6,
7].
SMC cores are mainly manufactured using the powder metallurgy (PM) method. In this method, a core is prepared by insulating and coating iron powder and subjecting the powder to compression molding. The PM method offers the advantages of high productivity and low material loss because it allows for the integral manufacturing of complex-shaped cores.
The manufacturing process can largely be divided into three stages. The first stage entails raw material preparation and coating. First, iron-based metal powder, which is the basic raw material for SMC manufacturing, is prepared. A special binder solution is added to this powder and mixed uniformly. In this manner, the surface of each metal particle is coated with an insulating material to obtain an electrically separated composite particle powder. Second, the coated composite particle powder is put into a mold and compressed at high pressures. In this step, an SMC core with the desired shape is obtained. During compression, the powder particles are in close contact with each other, and they form the basic shape of the core. Finally, the compression-molded SMC core is heat treated. This process has three main purposes. First, the stability of the core is increased by eliminating the internal stress generated during molding. Next, the lubricant used in the molding process is removed to increase the purity of the core. Finally, the resin used for coating is cured to strengthen the inter-particle bonding force. This heat treatment process determines the mechanical and magnetic properties of the SMC core [
8,
9].
The above-described PM method offers several advantages in the manufacture of SMC cores. It is possible to select a wide range of materials to manufacture cores exhibiting various characteristics while ensuring uniform quality. In addition, mass production is possible, which reduces manufacturing costs. In particular, one of the core characteristics of PM is that it is possible to manufacture parts having pores, meaning that the mechanical properties of the parts can be improved [
10,
11].
Currently, the application scope of SMCs in the field of electric vehicle drive motor cores is expanding gradually. SMCs are composed of electrically insulated magnetic powder particles, and they are used to manufacture the magnetic cores of electric motors. SMCs are particularly suitable for special motor designs, such as axial magnetic flux permanent magnet (AFPM) motors. However, the permeability and mechanical strength of SMCs are lower than those of the existing laminated steel sheets, and research to improve these characteristics is being conducted actively [
12,
13].
In recent studies, various approaches have been proposed to improve the performance of SMCs. These studies have focused on improving the magnetic properties and mechanical strength of SMCs. Shouding Wu et al. systematically studied the effect of microstructure changes and insulating layer content before and after coating on the coating thickness and soft magnetic properties of SMCs by controlling the thickness of the insulating layer with the sol-gel method [
14]. Zhonghao Liu et al. thoroughly investigated the effect of Sn doping on the magnetic properties and microstructure of SMCs [
15]. Pan Luo et al. attempted to optimize the properties of amorphous powder-based SMCs with double-layer inorganic coatings by means of phosphorylation and sodium silicate treatment [
16].
Despite these studies on improving the performance of SMCs through powder composition control, studies on improving SMC performance through control over the manufacturing process of SMC powder are lacking. Among them, performance optimization through PM process control, which is currently attracting attention, must be performed to maintain uniform quality and stability of SMCs.
Therefore, herein, the AncorLam HR powder selected through prior research is prepared using the PM method, and this powder is subsequently used to fabricate a stator core. Then, the performance of this core is evaluated to facilitate its use electric vehicle drive motors. The steps followed in this study are as follows:
- (1)
Design an experimental plan after selecting the key factors that affect the process.
- (2)
Using the physical property data of SMC powder, the degrees of influence of process factors are analyzed by conducting a finite element (FE) analysis following the experimental plan, and the process conditions are selected.
- (3)
Bulk-type prototypes are fabricated using the optimal process conditions, and the performance and characteristics of the prototypes are evaluated by studying the microstructures of the powder and bulk-type prototypes.
- (4)
The effectiveness of SMC powder is verified by comparing its microstructural characteristics with those of the bulk-type prototypes.
- (5)
The SMC powder prepared herein is used to build AFPM-type drive motors, and motor performance is evaluated by conducting simulations.
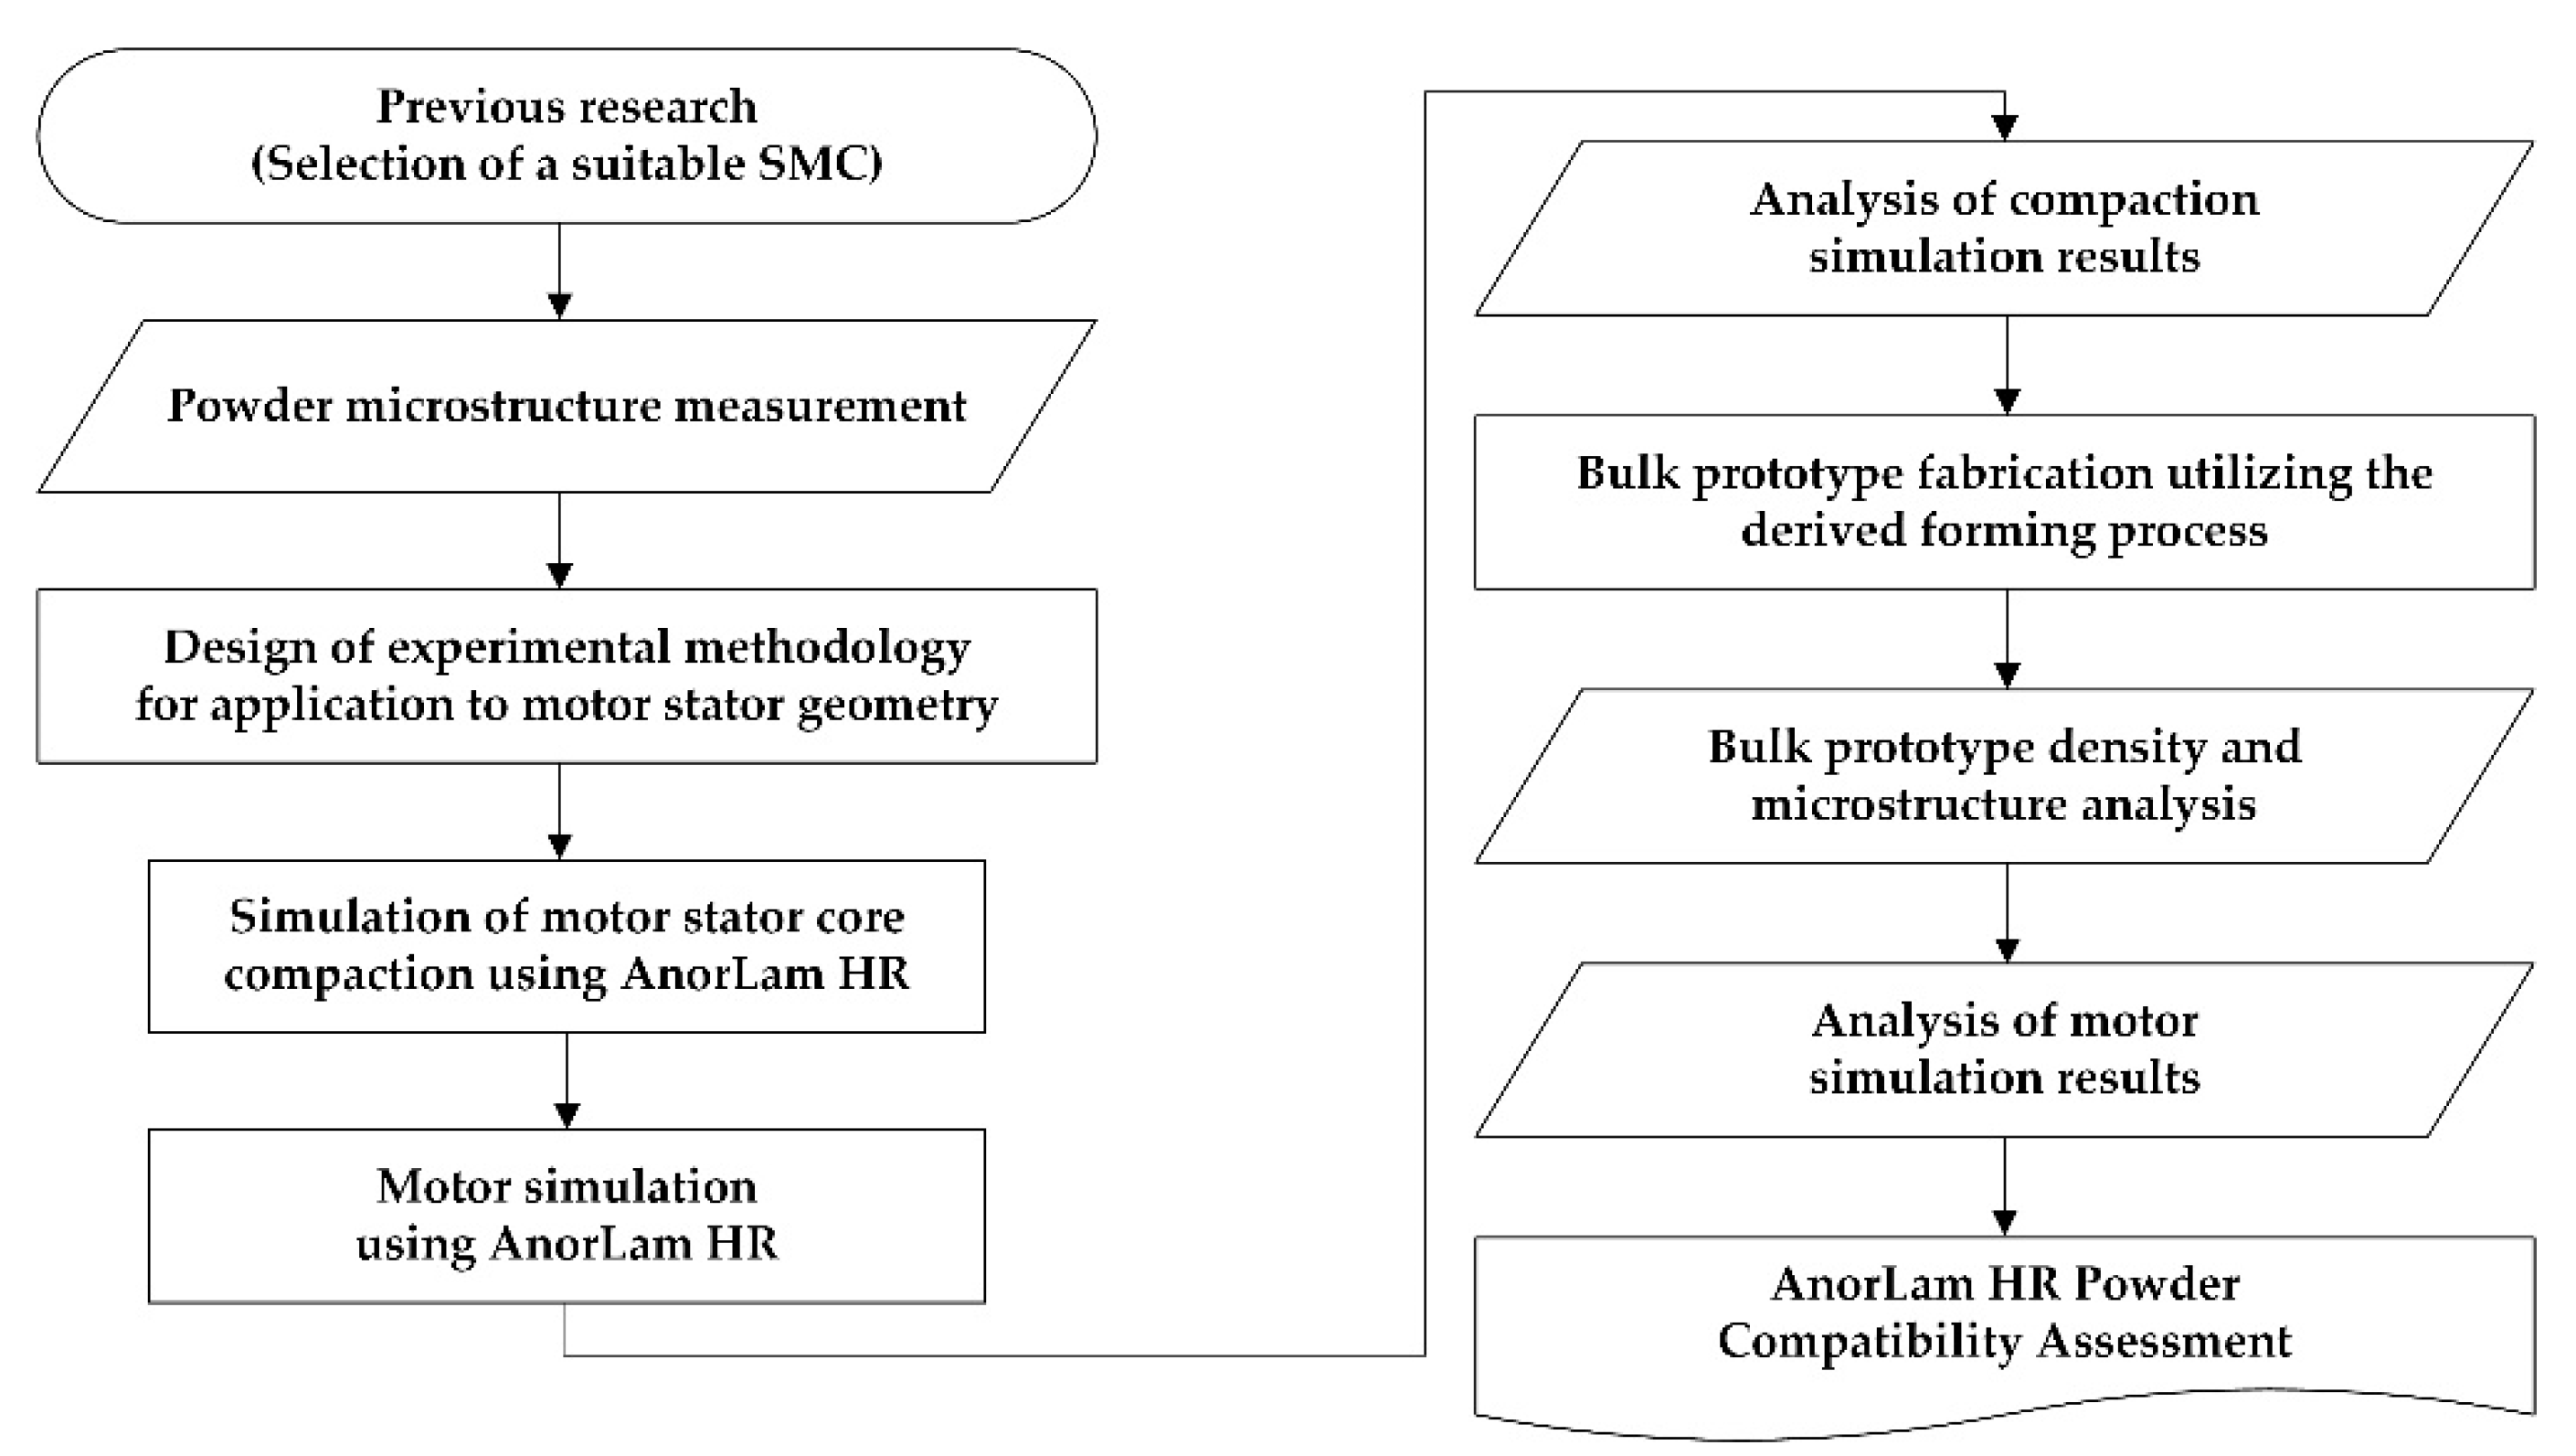
The flow chart of this study is shown in
Figure 1.
2. Materials and Methods
Herein, the physical property measurement database collated in previous studies was used. The physical properties of AncorLam HR (Höganäs, Sweden) powder, which are presented
Figure 2, were used [
17]. In addition, to evaluate the microstructural characteristics of AncorLam HR powder and its bulk prototypes, various analysis techniques such as scanning electron microscopy (SEM), X-ray diffraction (XRD), focused ion beam (FIB), and transmission electron microscopy (TEM) were used. The resulting characteristics of the AncorLam HR powder and its bulk prototype were compared and analyzed. Thereafter, the process conditions were optimized, and a performance evaluation was conducted.
2.1. Material Properties of AncorLam HR
The strain-stress curve data of AncorLam HR powder from room temperature to 90°C are depicted in
Figure 2. An FE analysis of the SMC powder compression process was performed, in which only the firing region, but not the elastic region, was considered.
Table 1 and
Table 2 lists the thermal properties of AncorLam HR powder.
2.2. Methods for Measuring Microstructure
Scanning electron microscopy (SEM) analysis was performed using a JSM-7900F (JEOL Ltd., Tokyo, Japan) instrument. Cross-sections of the bulk prototypes were produced based on the results of the FE analysis; these sections were photographed and compared to the results of the FE analysis. In this analysis, the results of energy dispersion x-ray spectroscopy (EDS) and electron backscatter diffraction (EBSD) were included. The element type and chemical composition of AncorLam HR powder were analyzed through EDS. Through EBSD analysis, the diffraction pattern of the bulk prototype was analyzed to determine the crystal structure and direction of the prototype. On the basis of this analysis, the performance benefits resulting from the random orientation of the powder, an important characteristic of SMCs, were evaluated.
XRD analysis was performed using two instruments. For the powdery AncorLam HR, XRD analysis was performed using an X′Pert PRO MPD (PANalytic B.V., Almello, the Netherlands) instrument. XRD analysis of the bulk prototype was performed using an X′Pert PRO MRD (PANalytic B.V., Almello, the Netherlands) instrument. Changes in the crystal structure of the products during molding and heat treatment of SMC were tracked and evaluated.
An FIB analysis was performed using a Helios 5 UX (Thermo Fisher Scientific, Brno, Czech Republic) device. Moreover, a prepared using an FIB was used for TEM imaging.
The TEM analysis was performed using a JEM-ARM200F (JEOL Ltd., Tokyo, Japan) instrument. In this analysis, the surface shape of the AncorLam HR powder and the chemical composition of the insulating layer were measured. The TEM analysis results of the powder and bulk prototypes were compared and evaluated to analyze the deformation caused by the effect of the powder particles and insulating layer in the process of manufacturing bulk prototype from the AncorLam HR powder through molding.
2.2.1. AncorLam HR Powder Microstructure
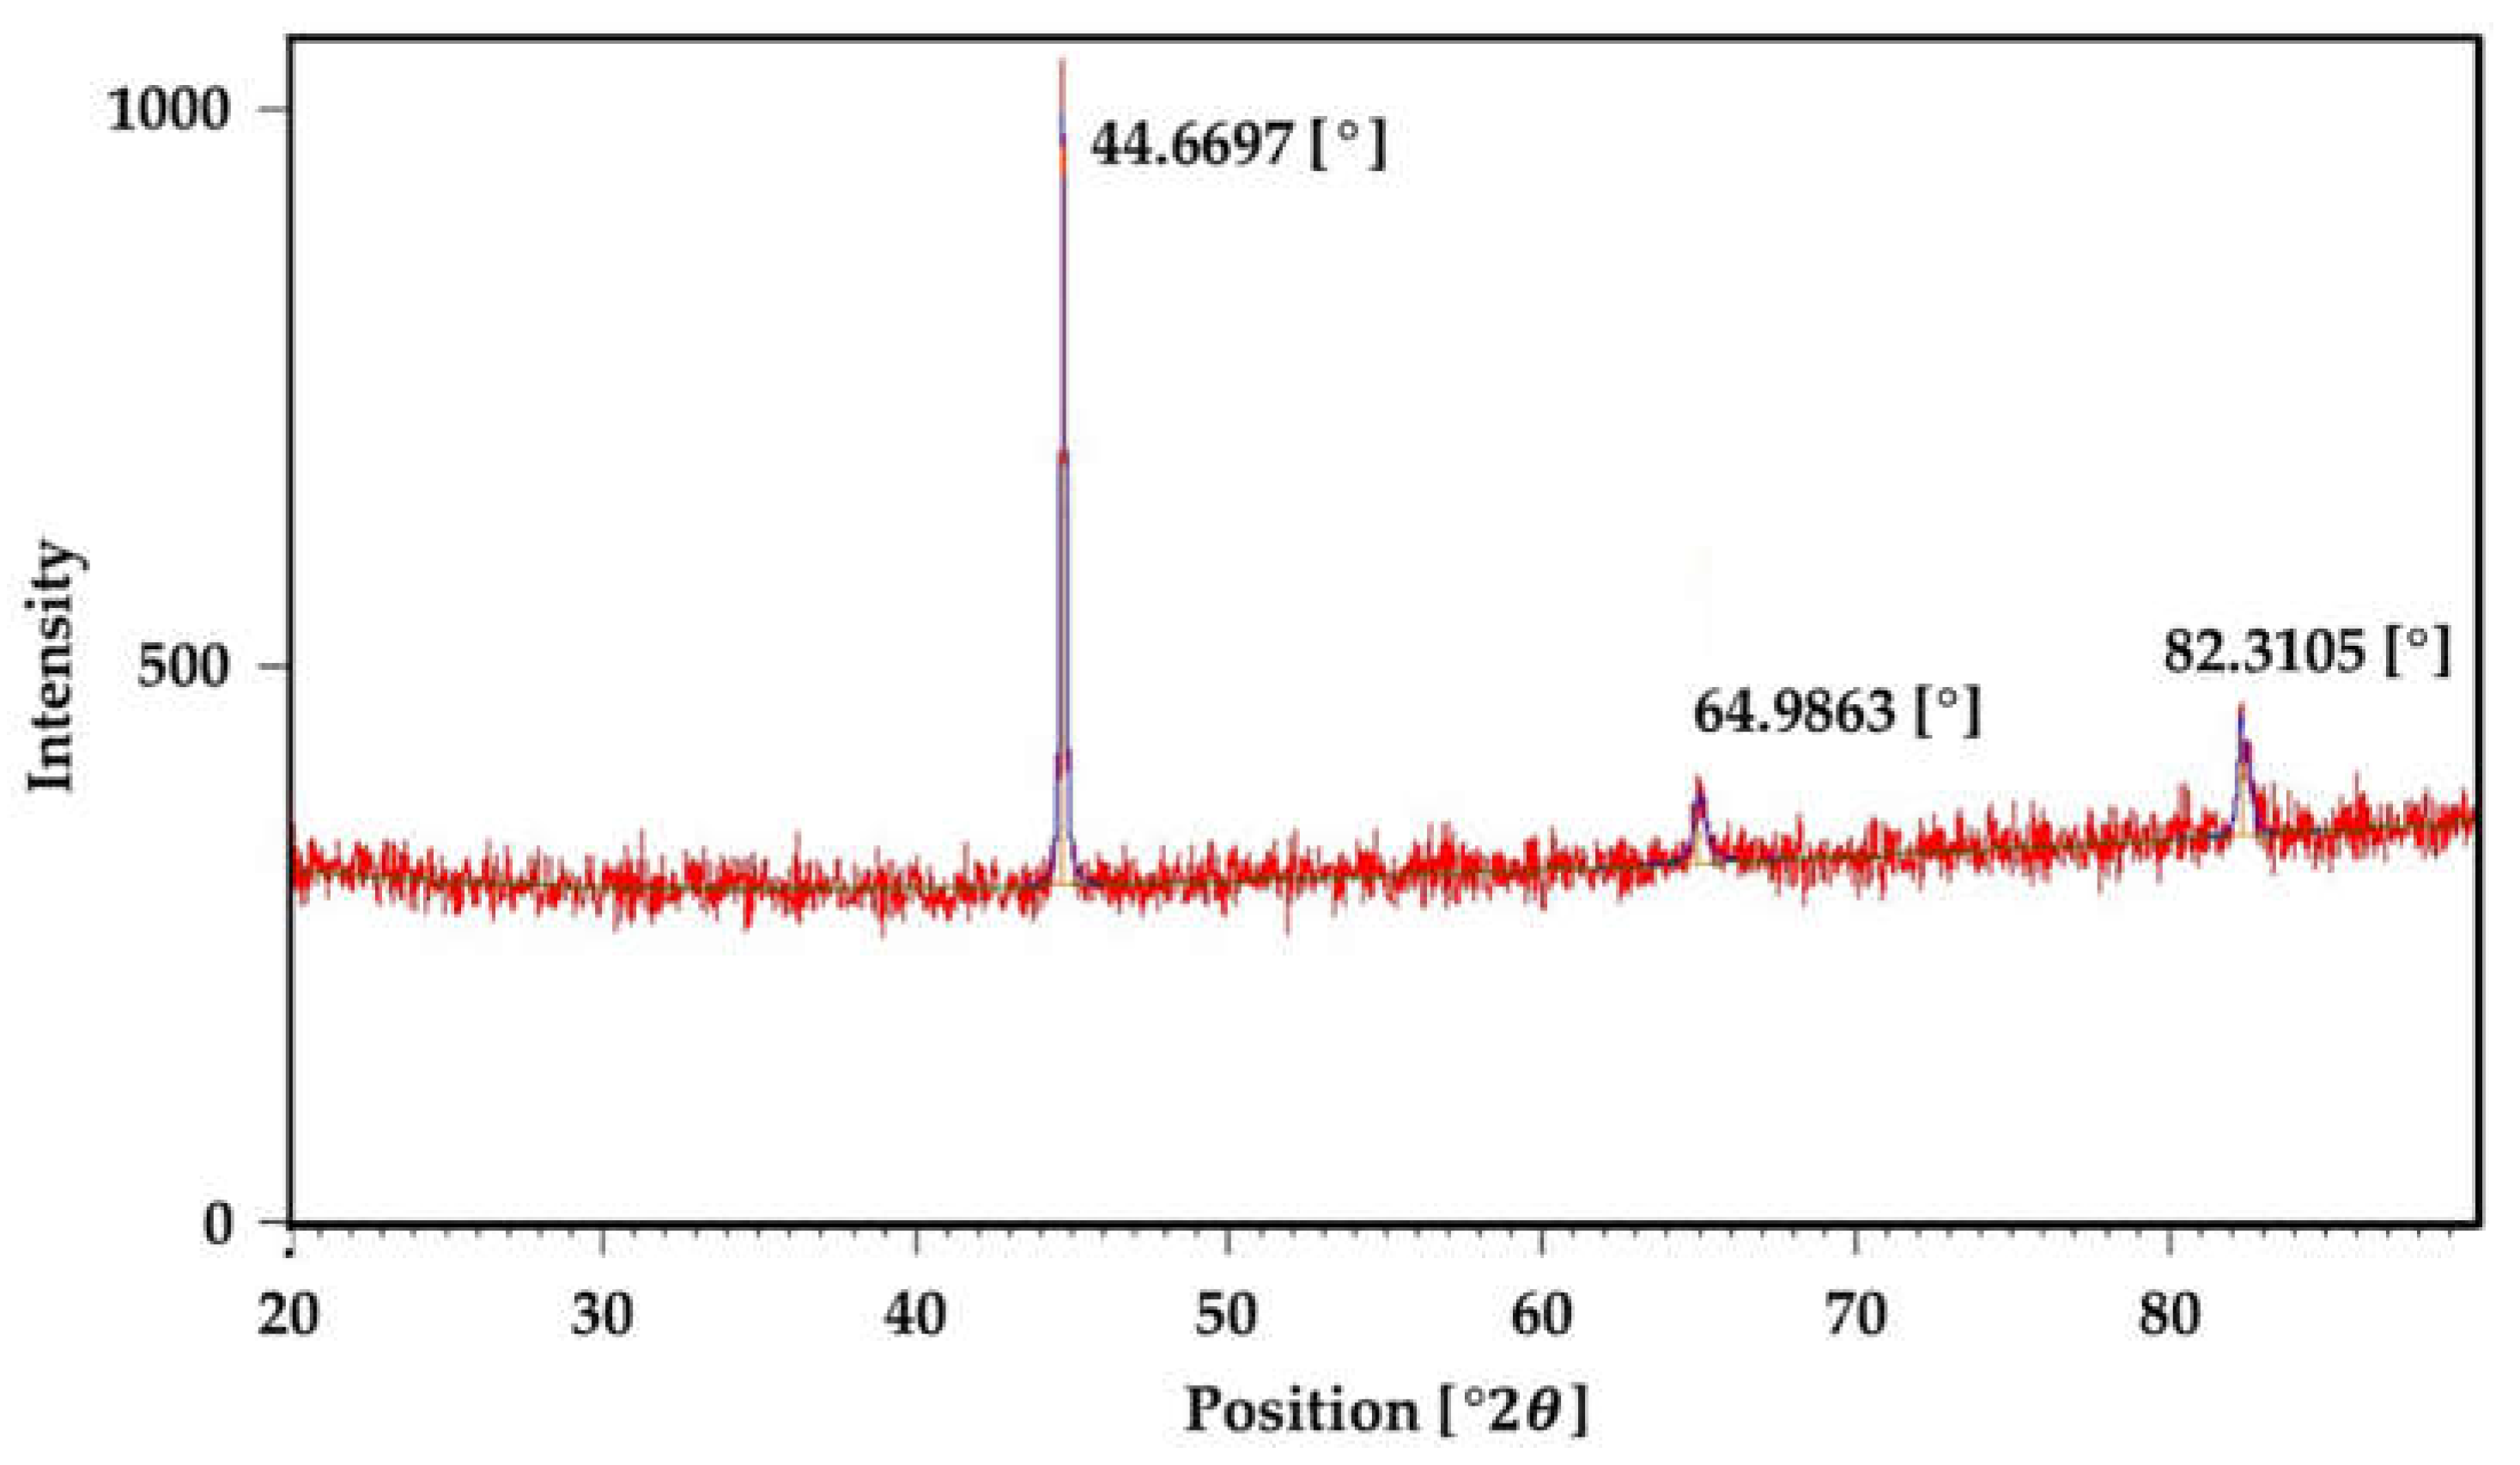
The microstructure of the AncorLam HR powder was measured and evaluated using the microstructure measurement method described in Item 2.2. The XRD measurement results of the AncorLam HR powder are depicted in
Figure 3. According to these results, the peak appeared at 44.7°, 65.0°, and 82.3°, which correspond to the α phases of general Fe.
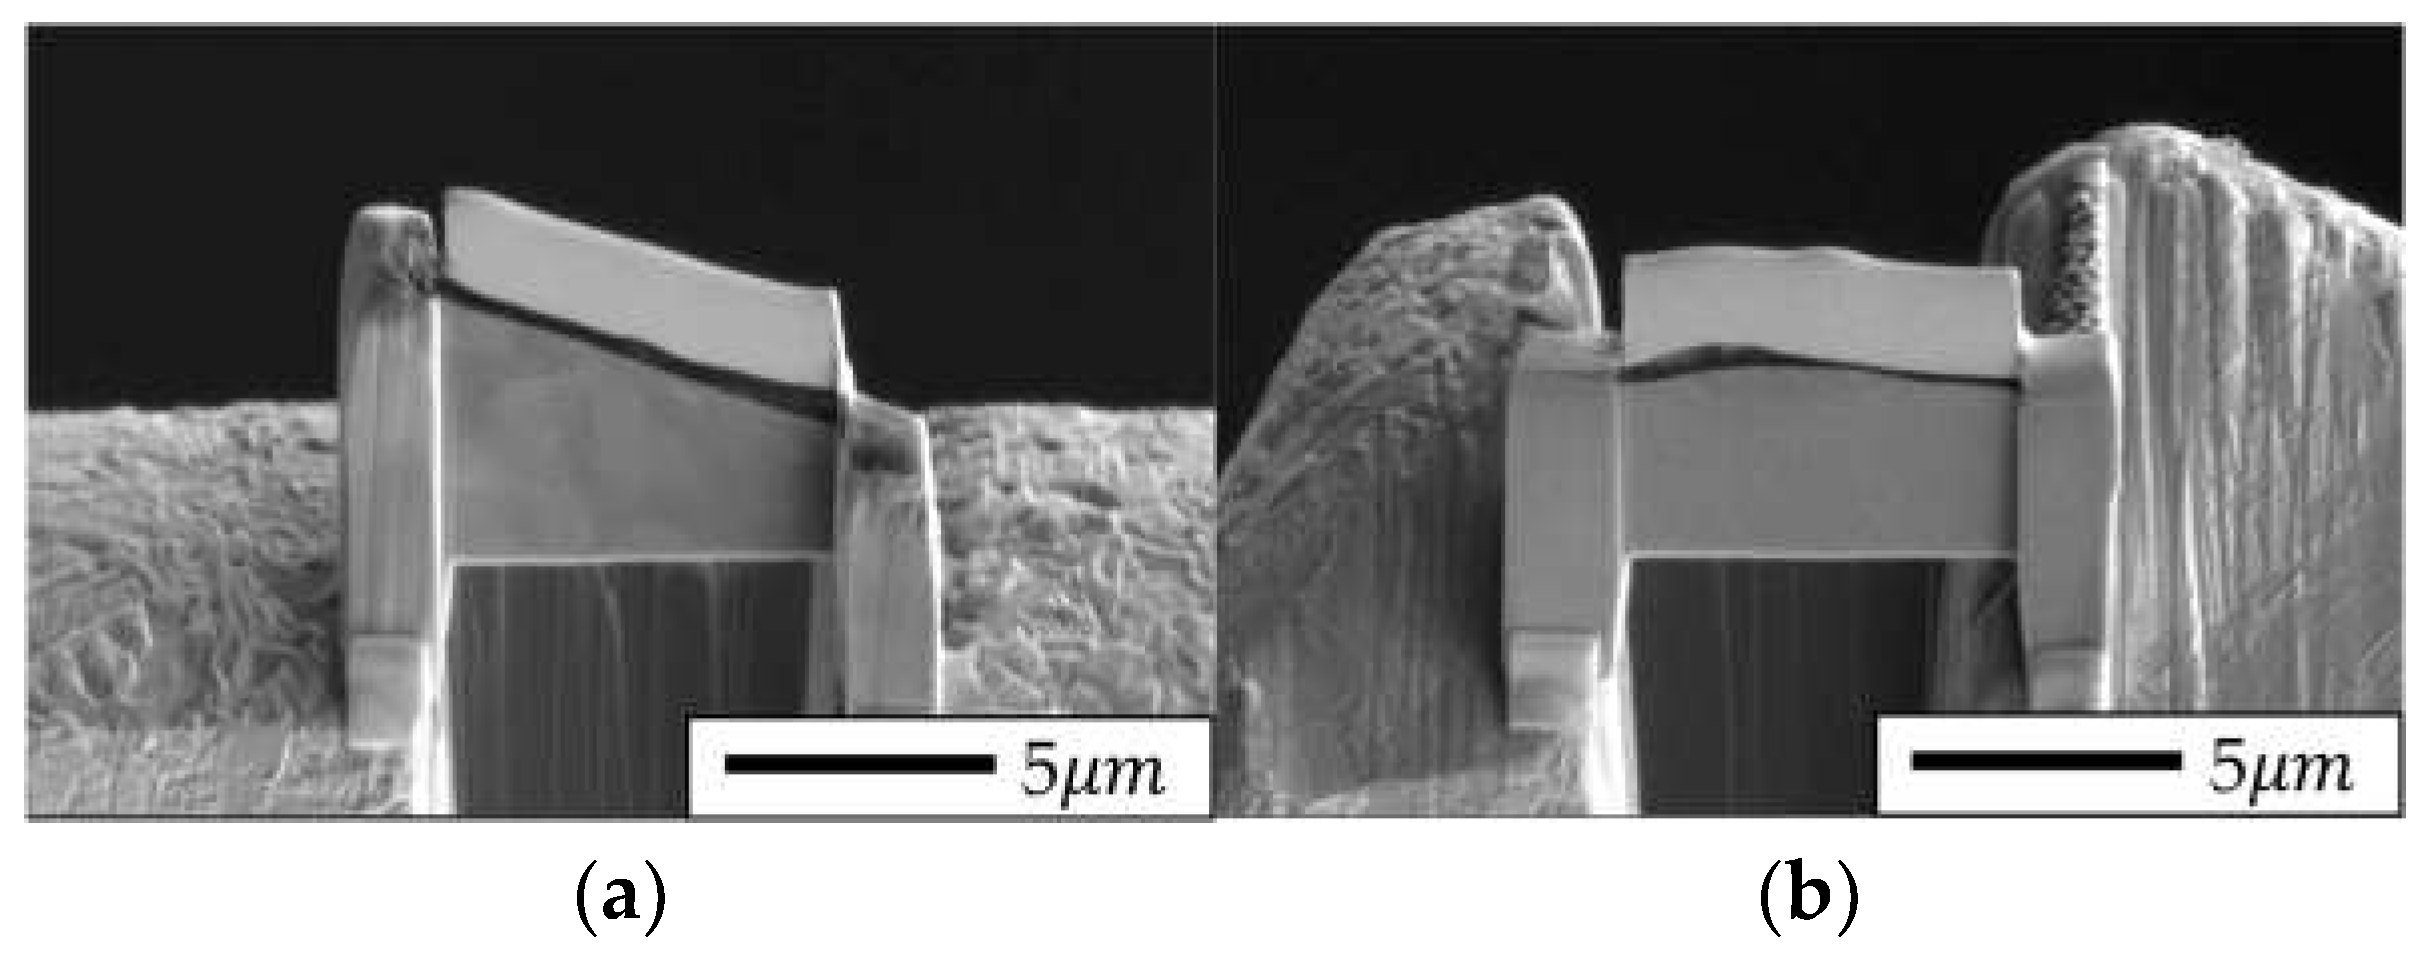
Subsequently, a specimen for TEM imaging was prepared using an FIB instrument, and it is illustrated in
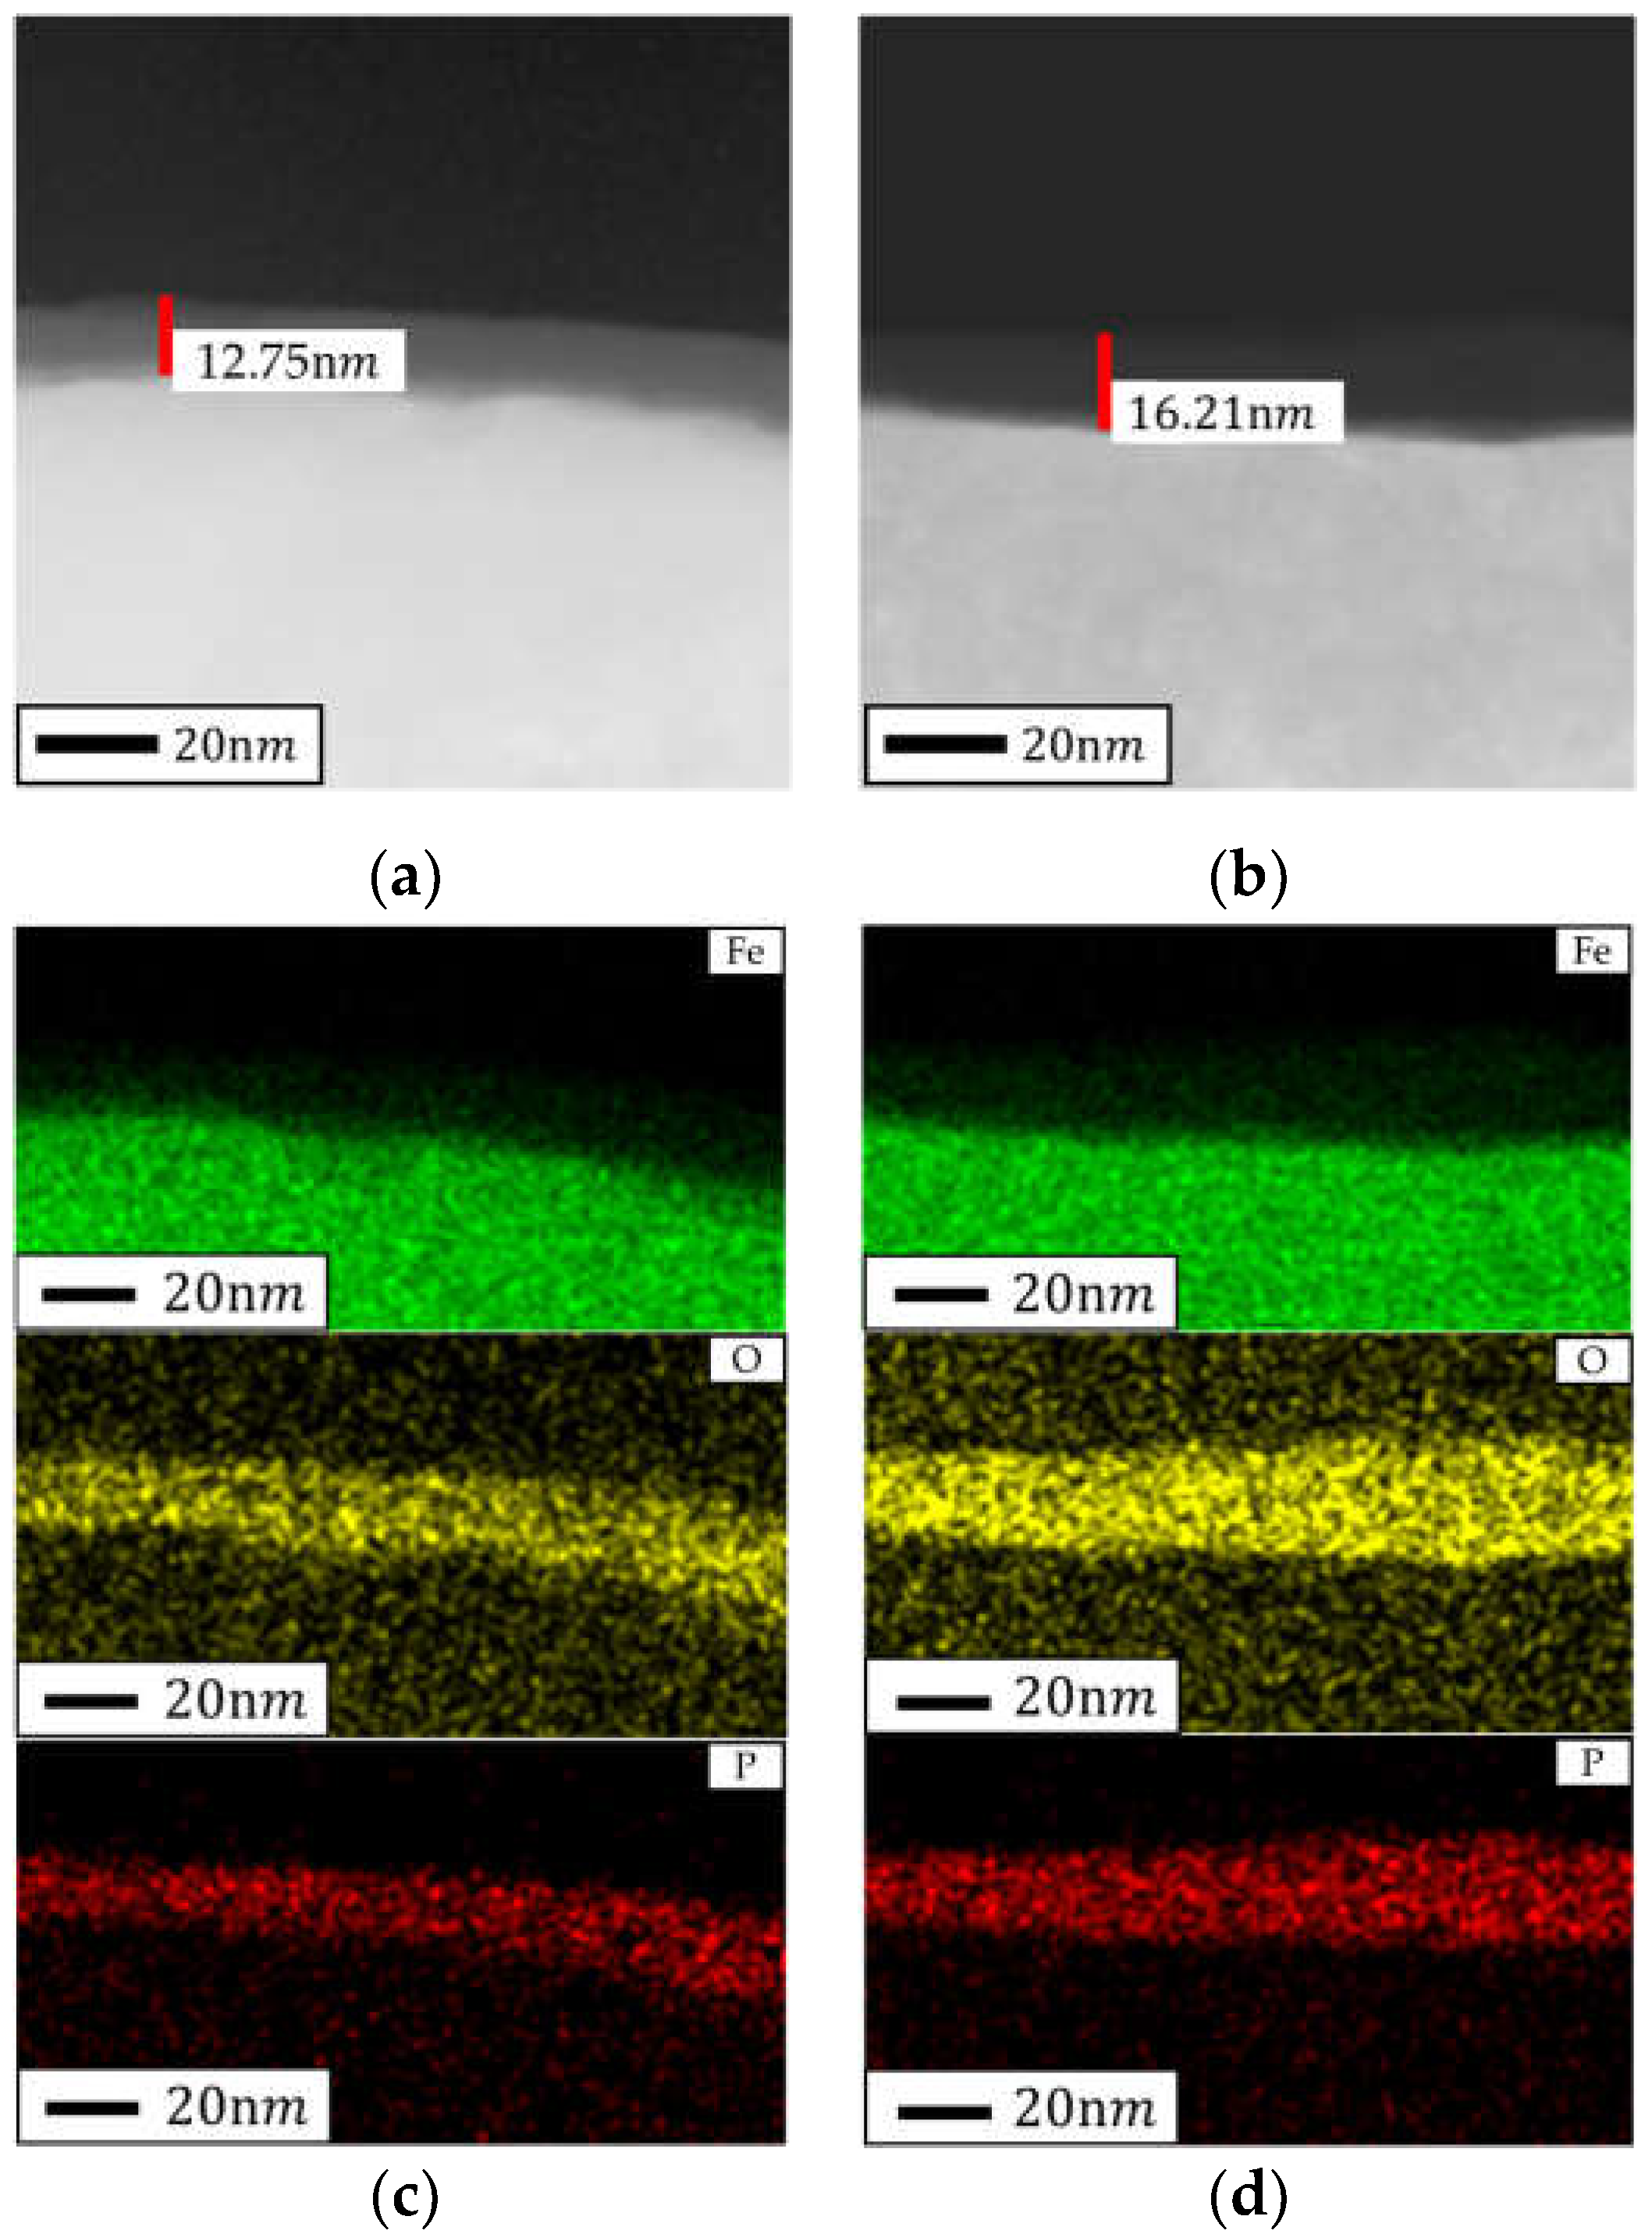
Figure 4. The powder particles to be analyzed were fixed in the FIB chamber, a trench was formed around the particles, and polishing was performed. Subsequently, TEM imaging was performed using the aforementioned specimen to confirm whether an insulating layer was formed on the powder, as illustrated in
Figure 5 (a) and (b). In addition, an EDS analysis was performed to confirm the chemical composition of the insulating layer. As depicted in
Figure 5 (c) and (d), the insulating layer was composed of oxygen and phosphorus. Therefore, a phosphate coating with high potential was formed on the AncorLam HR powder. Generally, thin phosphate-based insulating coatings are formed on the surface of SMC powder particles through a chemical treatment process in which phosphoric acid is employed. In the case of AncorLam HR, a 10–15-nm-thick insulating layer was formed.
2.3. SMCs Powder Compaction Simulation
The powder molding process is a key step in the production of SMCs. In this process, various factors such as chemical composition of the SMC powder, compression conditions, sintering temperature, and time influence the final material properties. Coercive force and saturated magnetic flux density, which are the key performance indicators of SMC cores, depend largely on the density of the final product. To control these indicators, powder control and molding process control are essential, and molding temperature and molding speed can be viewed as the major factors during molding. In general, considering the characteristics of SMC with a waxy lubricating composition, the molding temperature is an essential optimization factor for maintaining uniform product performance in mass production. To ensure uniform powder arrangement during molding, the molding speed in terms of strokes per minute (SPM) must be considered to control the process. By controlling these factors, the final properties of the material can be improved.
2.3.1. Yield Criteria for Porous Materials
Most metals have a polycrystalline structure, which can be explained by their anisotropic behavior at the macroscopic level. However, this behavior does not directly reflect the porosity from the microscopic viewpoint, and therefore, does not act under the Von mises yield condition. The Von mises yield condition assumes the material is continuous, and changes in the macroscopic properties of the material owing to its porosity indirectly affect the application of the Von mises yield condition [
18]. In particular, porosity strongly influences the mechanical properties of in porous materials, and therefore, porosity should be considered. To consider the effect of porosity, various models have been developed, one of which is the Shima–Oyane equation. By using this model, the effect of porosity on the properties of the material can be evaluated quantitatively, and material behavior can be predicted more accurately; this equation is given as (1) [
20].
where
is the effective stress, and
,, and
are the principal stresses.
The Shima–Oyane criterion further modifies the yield condition by incorporating porous f. The modified Shima–Oyane equation is expressed as (2) [
21].
where
is the yield strength of the material,
is a material constant, and
denotes porosity. This equation directly explains how an increase in the porosity of a material reduces its yield stress. For a fully dense material with no porosity,
equals 0, and therefore,
is equal to
. By contrast, for a porous material,
is greater than 0, and therefore,
is less than
.
3. Simulation Conditions
3.1. Analysis Model
The shape of the motor stator core to be prepared from AncorLam HR powder was selected from a previous study, and it is shown in
Figure 6. The initial green body was assumed to be porous, and the initial height based on the apparent powder density of 2.94 g/cc was set to 69.22 mm. The relative density was set to 0.95 to achieve a density of 7.4 g/cc in the final target shape with a height of 27.5 mm. The boundary conditions of the simulation are summarized and shown in
Table 3. The change in height from the initial value of 69.22 mm to the final value of 27.5 mm indicates a high compression rate of approximately 60%. Such a high compression rate may affect the insulating coatings between powder particles. Therefore, to evaluate whether the insulation performance was maintained after the manufacturing process, uniformity and continuity evaluations of the insulating coating were performed at the microstructure level by using an electron microscope.
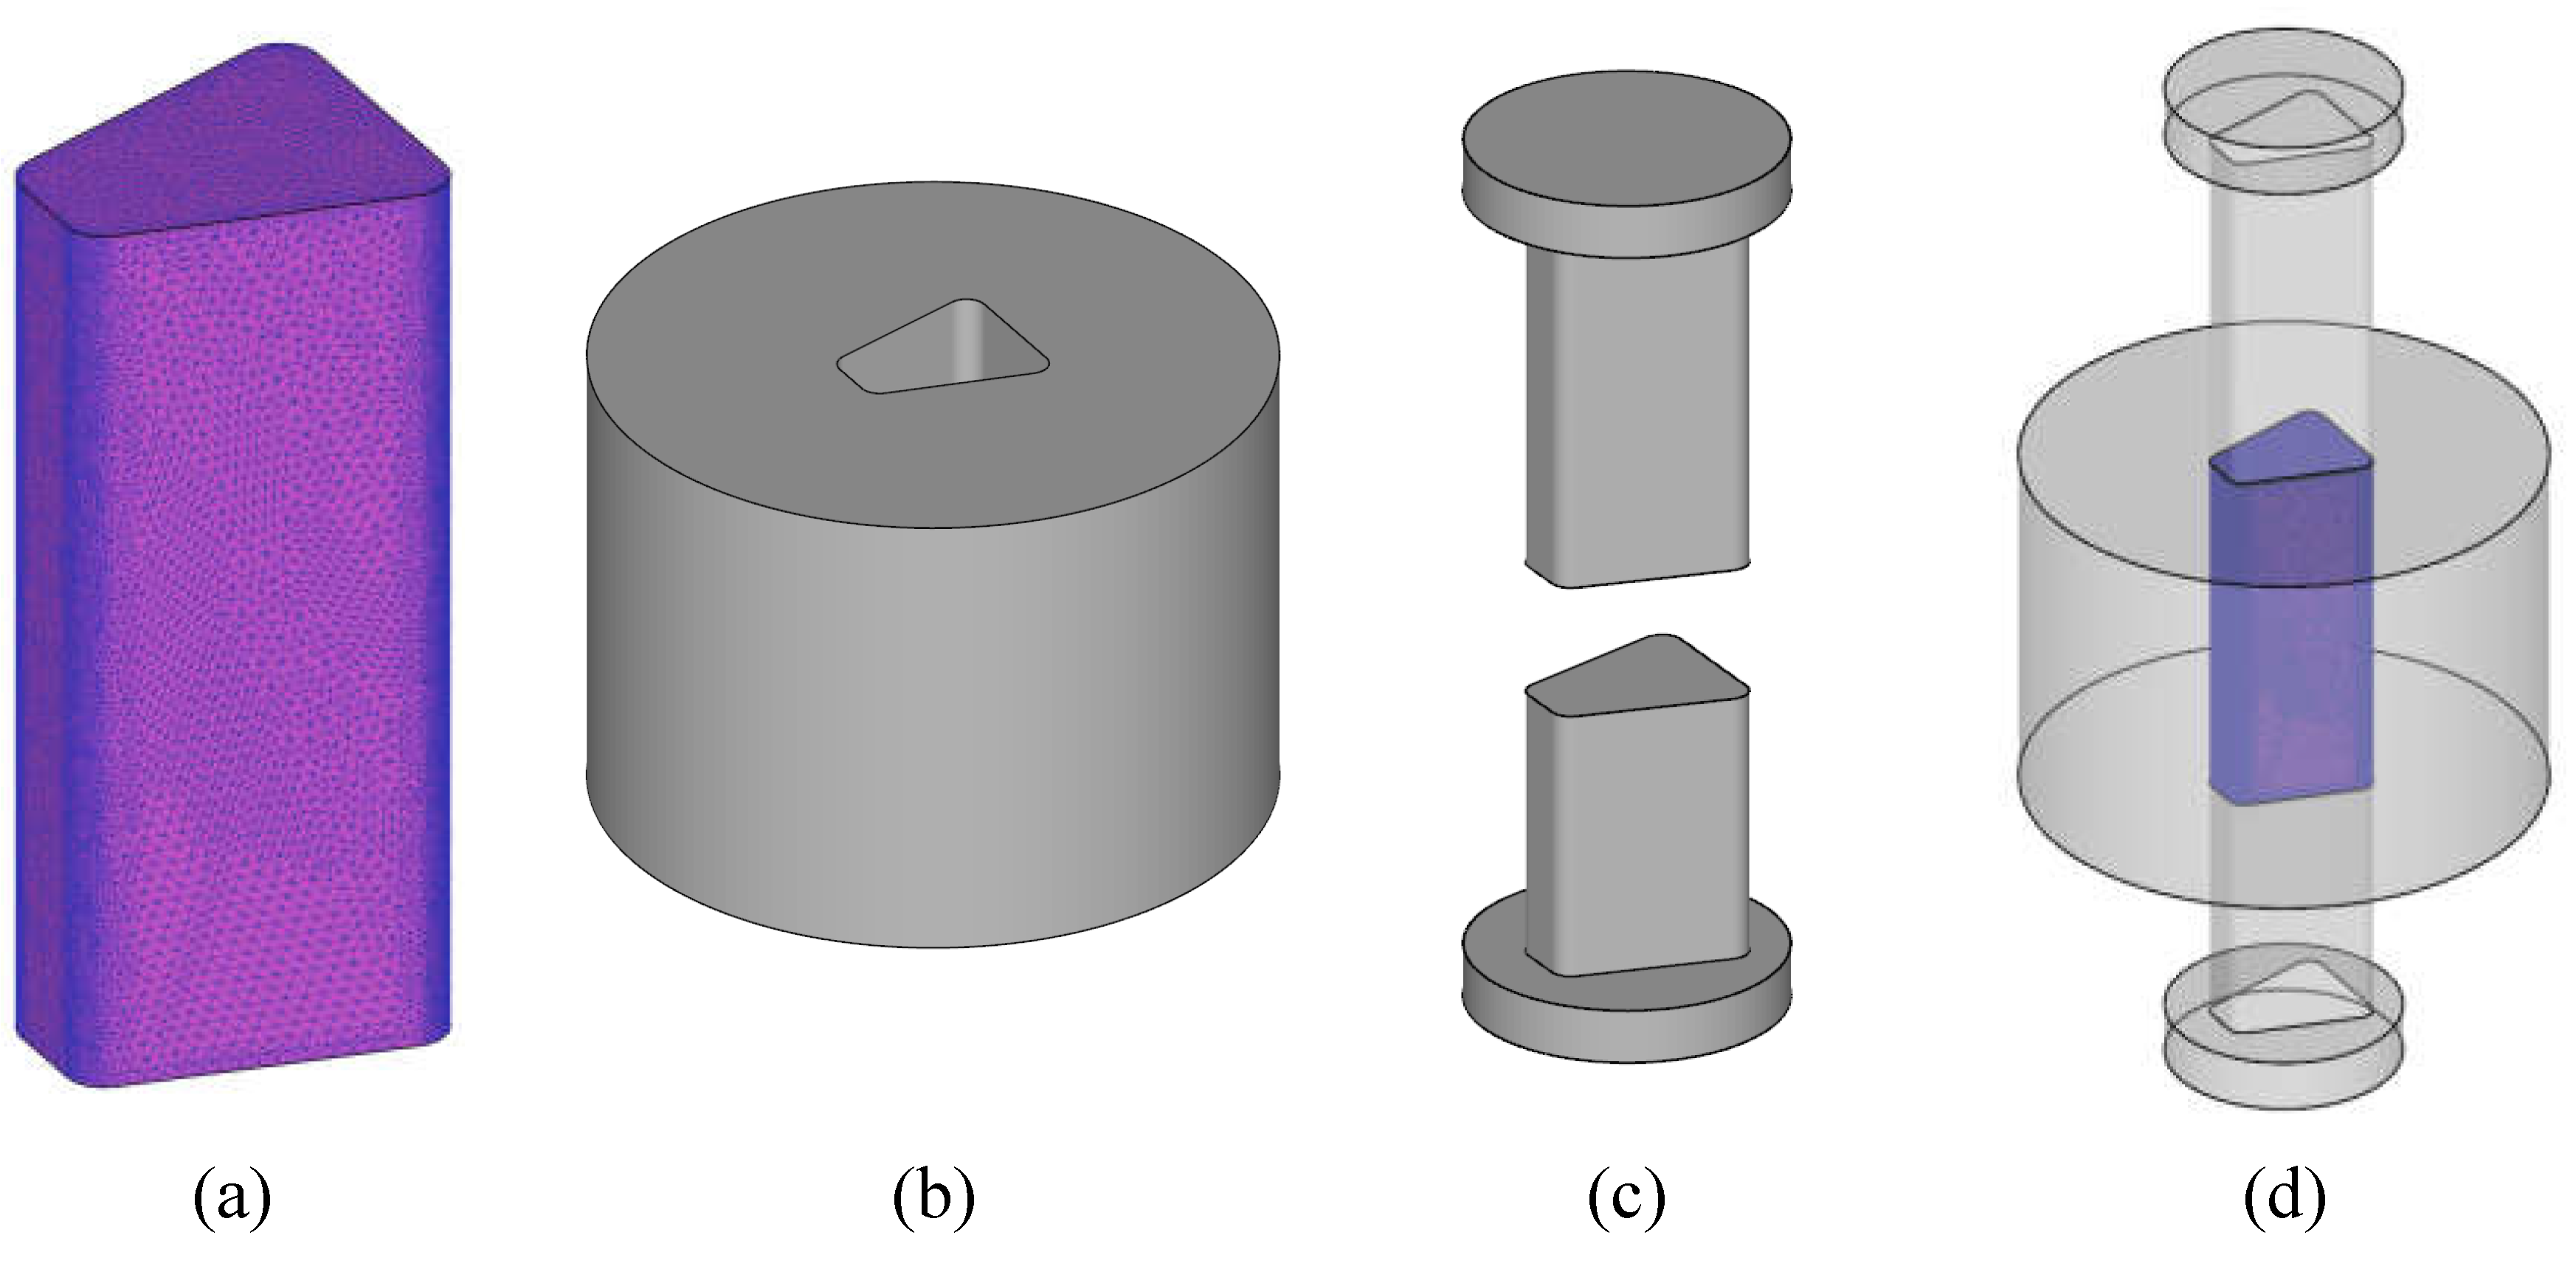
The powder compression simulation using AncorLam HR was designed by simulating a draw-type compressing press. During the operation of this press, the lower punch moves along the Z-axis direction with a speed equal to 1/4 of the speed of the upper punch. With this method, the porous body in the pressurized vacuum is not subjected to uniaxial pressing alone, and the density and stress deviations of the upper and lower portions are minimized owing to bidirectional pressing forces. The stator core model was composed of 221,294 tetrahedral elements.
Figure 7 (a) shows the corresponding shape.
Figure 7 (b) shows the fixed die, and Figure (c)show the upper and lower punches, respectively. The overall assembly is shown in Figure (d). The powder compaction simulation analysis was performed using DEFORM-3D (SFTC, version 13.1) [
22].
3.2. DOE Factor and Level Settings
To realize the desired performance in the manufacture of porous products such as SMCs, it is necessary to achieve a certain level of density level or higher [
23]. In particular, in the case of SMCs, the interparticle bonding is weaker than that in general metal products owing to the inter-powder insulating layer. Therefore, it is essential to achieve high density by controlling molding factors to ensure stable mechanical properties [
24,
25]. While achieving high density is important, uniform density and stress distribution inside molded bodies are essential for achieving uniform core performance [
26]. Non-uniform density distribution induces non-uniform magnetic distribution inside the core, and in the case of high density deviations, partial self-saturation is likely to occur. This phenomenon degrades the overall efficiency of the motor system and increases the torque ripple, which hinders motor operation. In addition, the eddy current path may change in the region with non-uniform density, which would increase the overall eddy current loss. This loss greatly reduces the operating efficiency of motors, especially in the high-frequency region. Additionally, the non-uniformity of density and stress affects the mechanical strength of SMC cores. The low-density region is vulnerable to stress concentration generation, which reduces motor durability and life under high-speed rotation or vibration. In addition, the stability and reproducibility of the manufacturing process decrease, which may increase the characteristic deviations between the produced cores and hamper quality management, thereby lowering the production yield. For these reasons, it is extremely important to achieve uniform internal density and stress distribution when manufacturing SMC cores. For this purpose, the maximum-minimum deviation and stress deviation of relative density were selected as the characteristic values for precise control of the powder compression process. In addition, molding temperature and molding speed (SPM) were selected as the main control factors affecting the distribution of relative density and internal stress. As for the molding temperature, three points were selected between 100°C and room temperature, which is the recommended molding temperature range for AncorLam HR powder. The SPM value was selected based on 7 SPM, which is the minimum molding speed provided by withdrawal-type compaction press devices, and the specific molding process control factor levels are listed in
Table 4 and
Table 5.
3.3. Motor Application Analysis
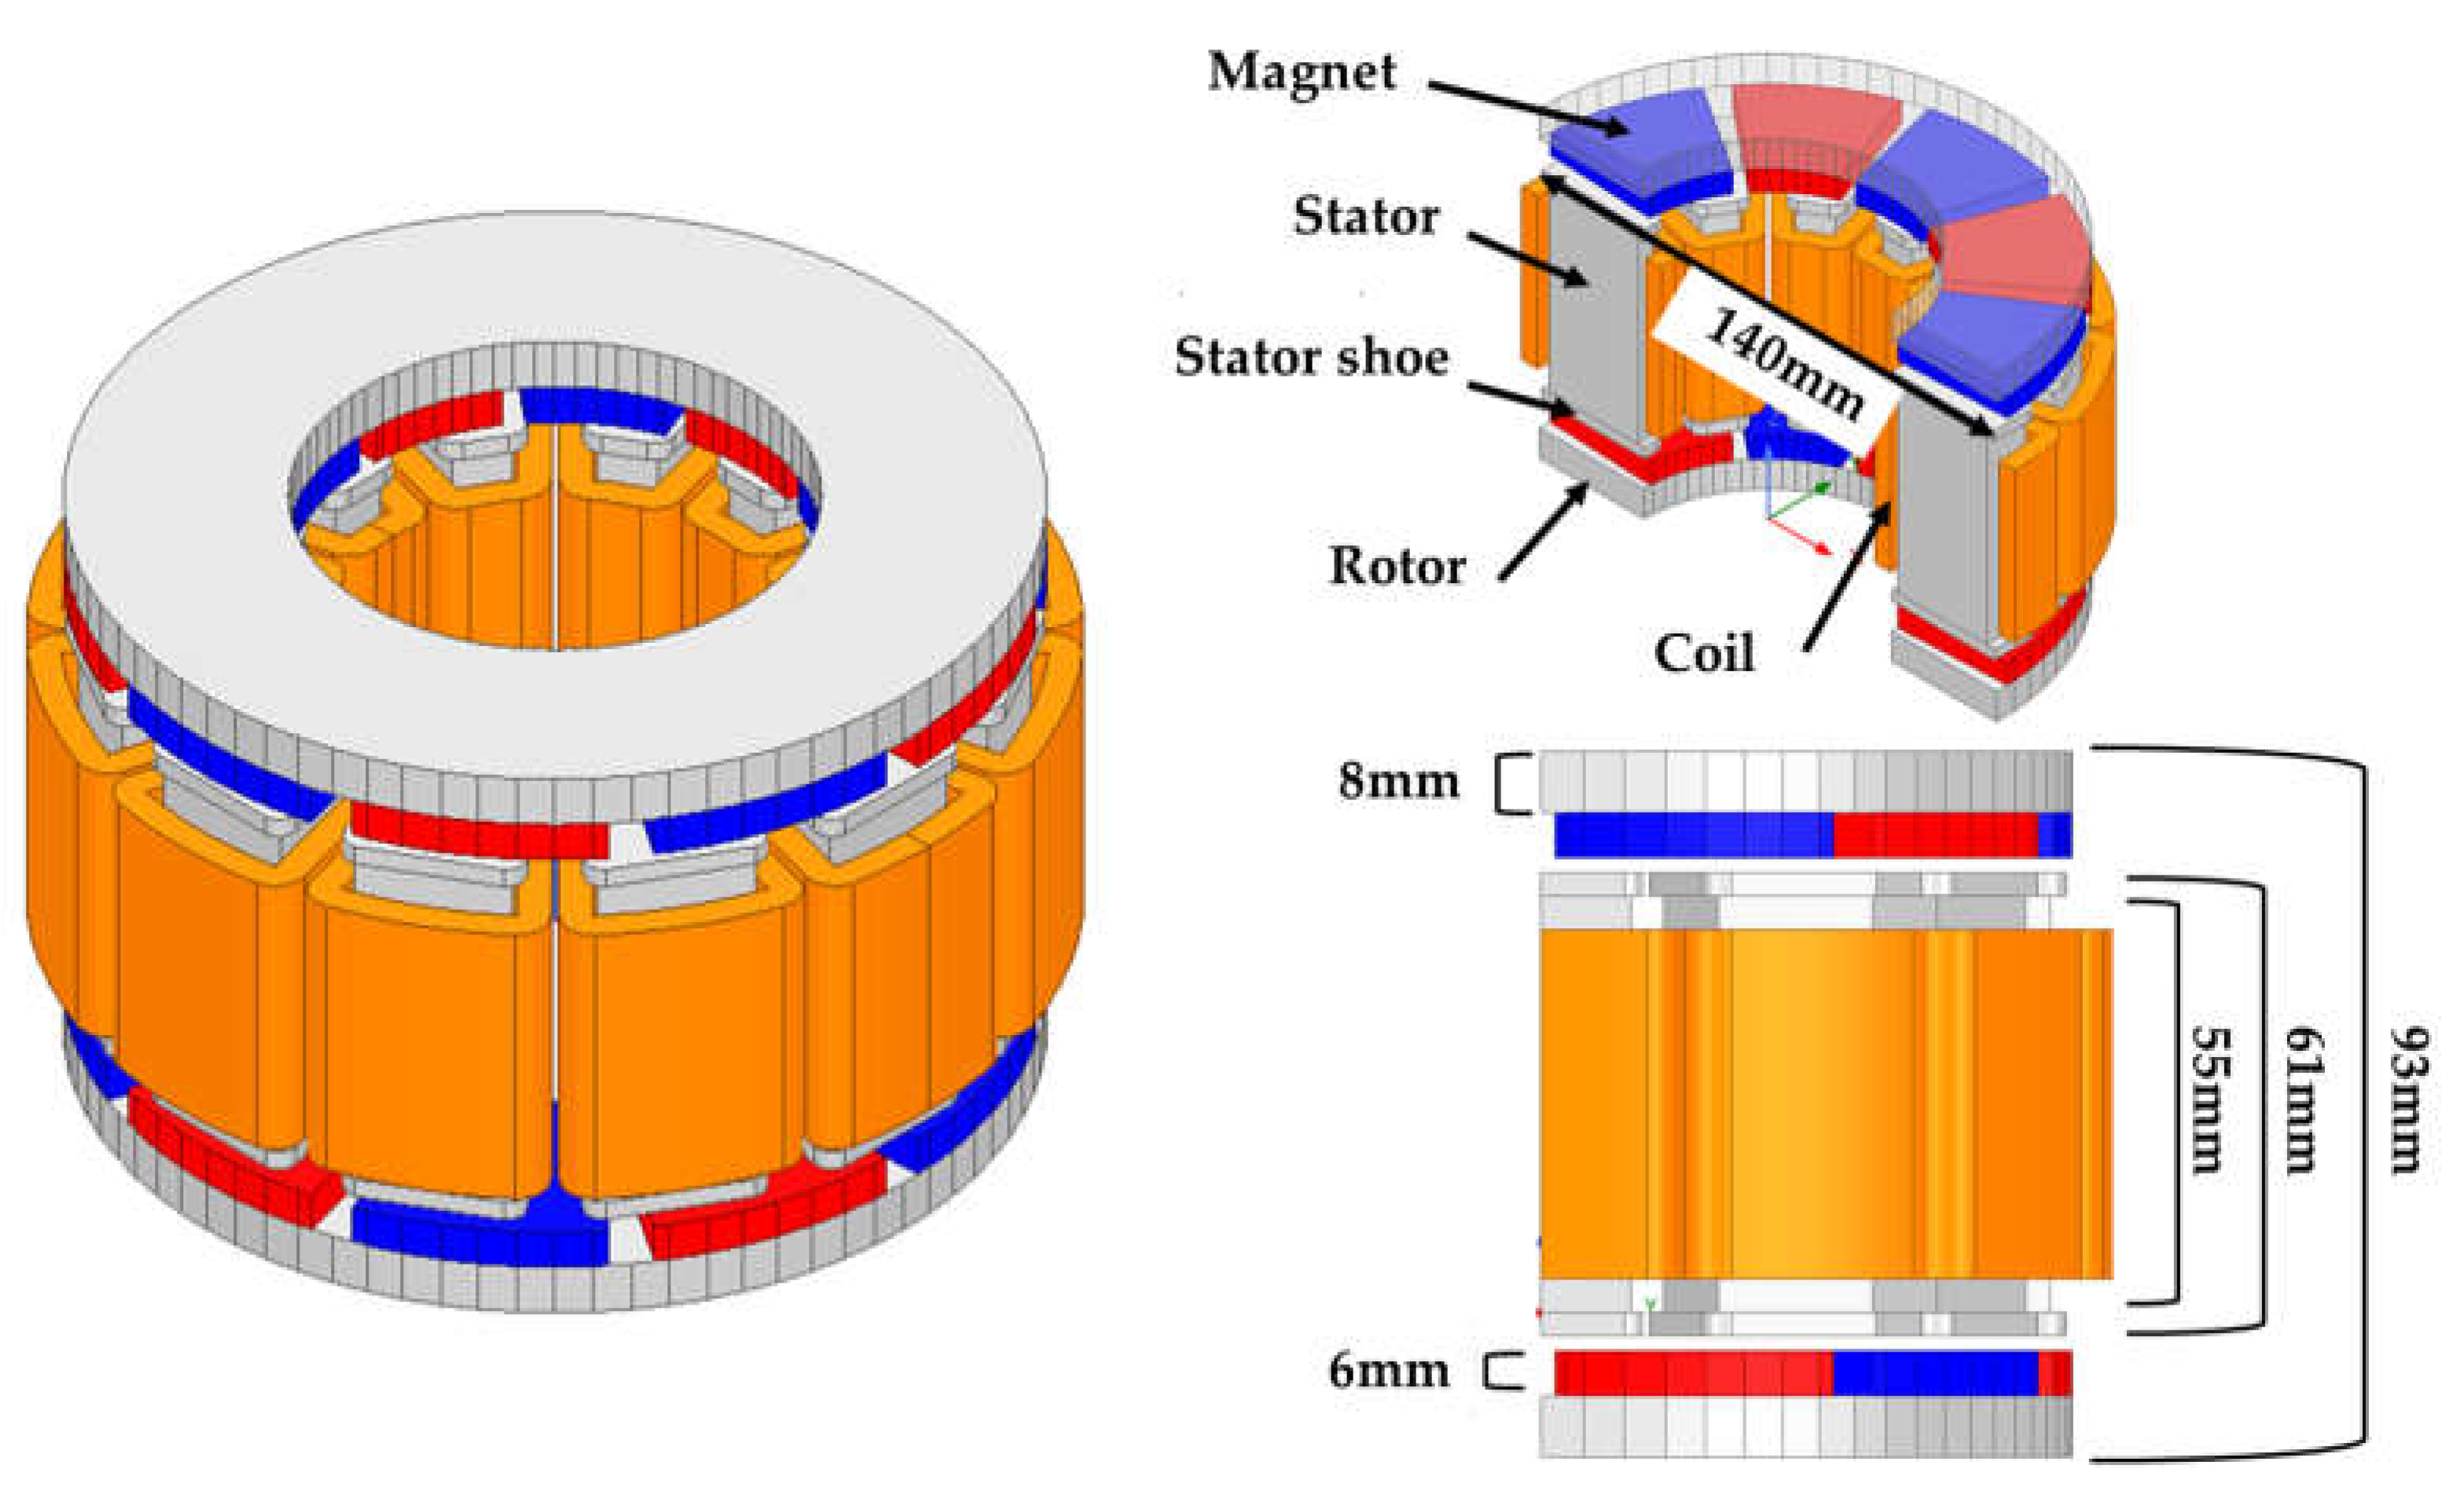
To maximize the advantages of shape liberalization, which is one of the characteristics of SMCs, the performance was evaluated by conducted a simulation in which AncorLam HR powder was applied to an AFPM-type motor. The motor was designed as a 10-pole 12-slot winding model, and the motor shape used in the simulation is shown in
Figure 8. The analysis was performed at 10,000 rpm in the Ansys EM software environment (Ansys) [
27].
4. Results and Discussion
4.1. Simulation Results
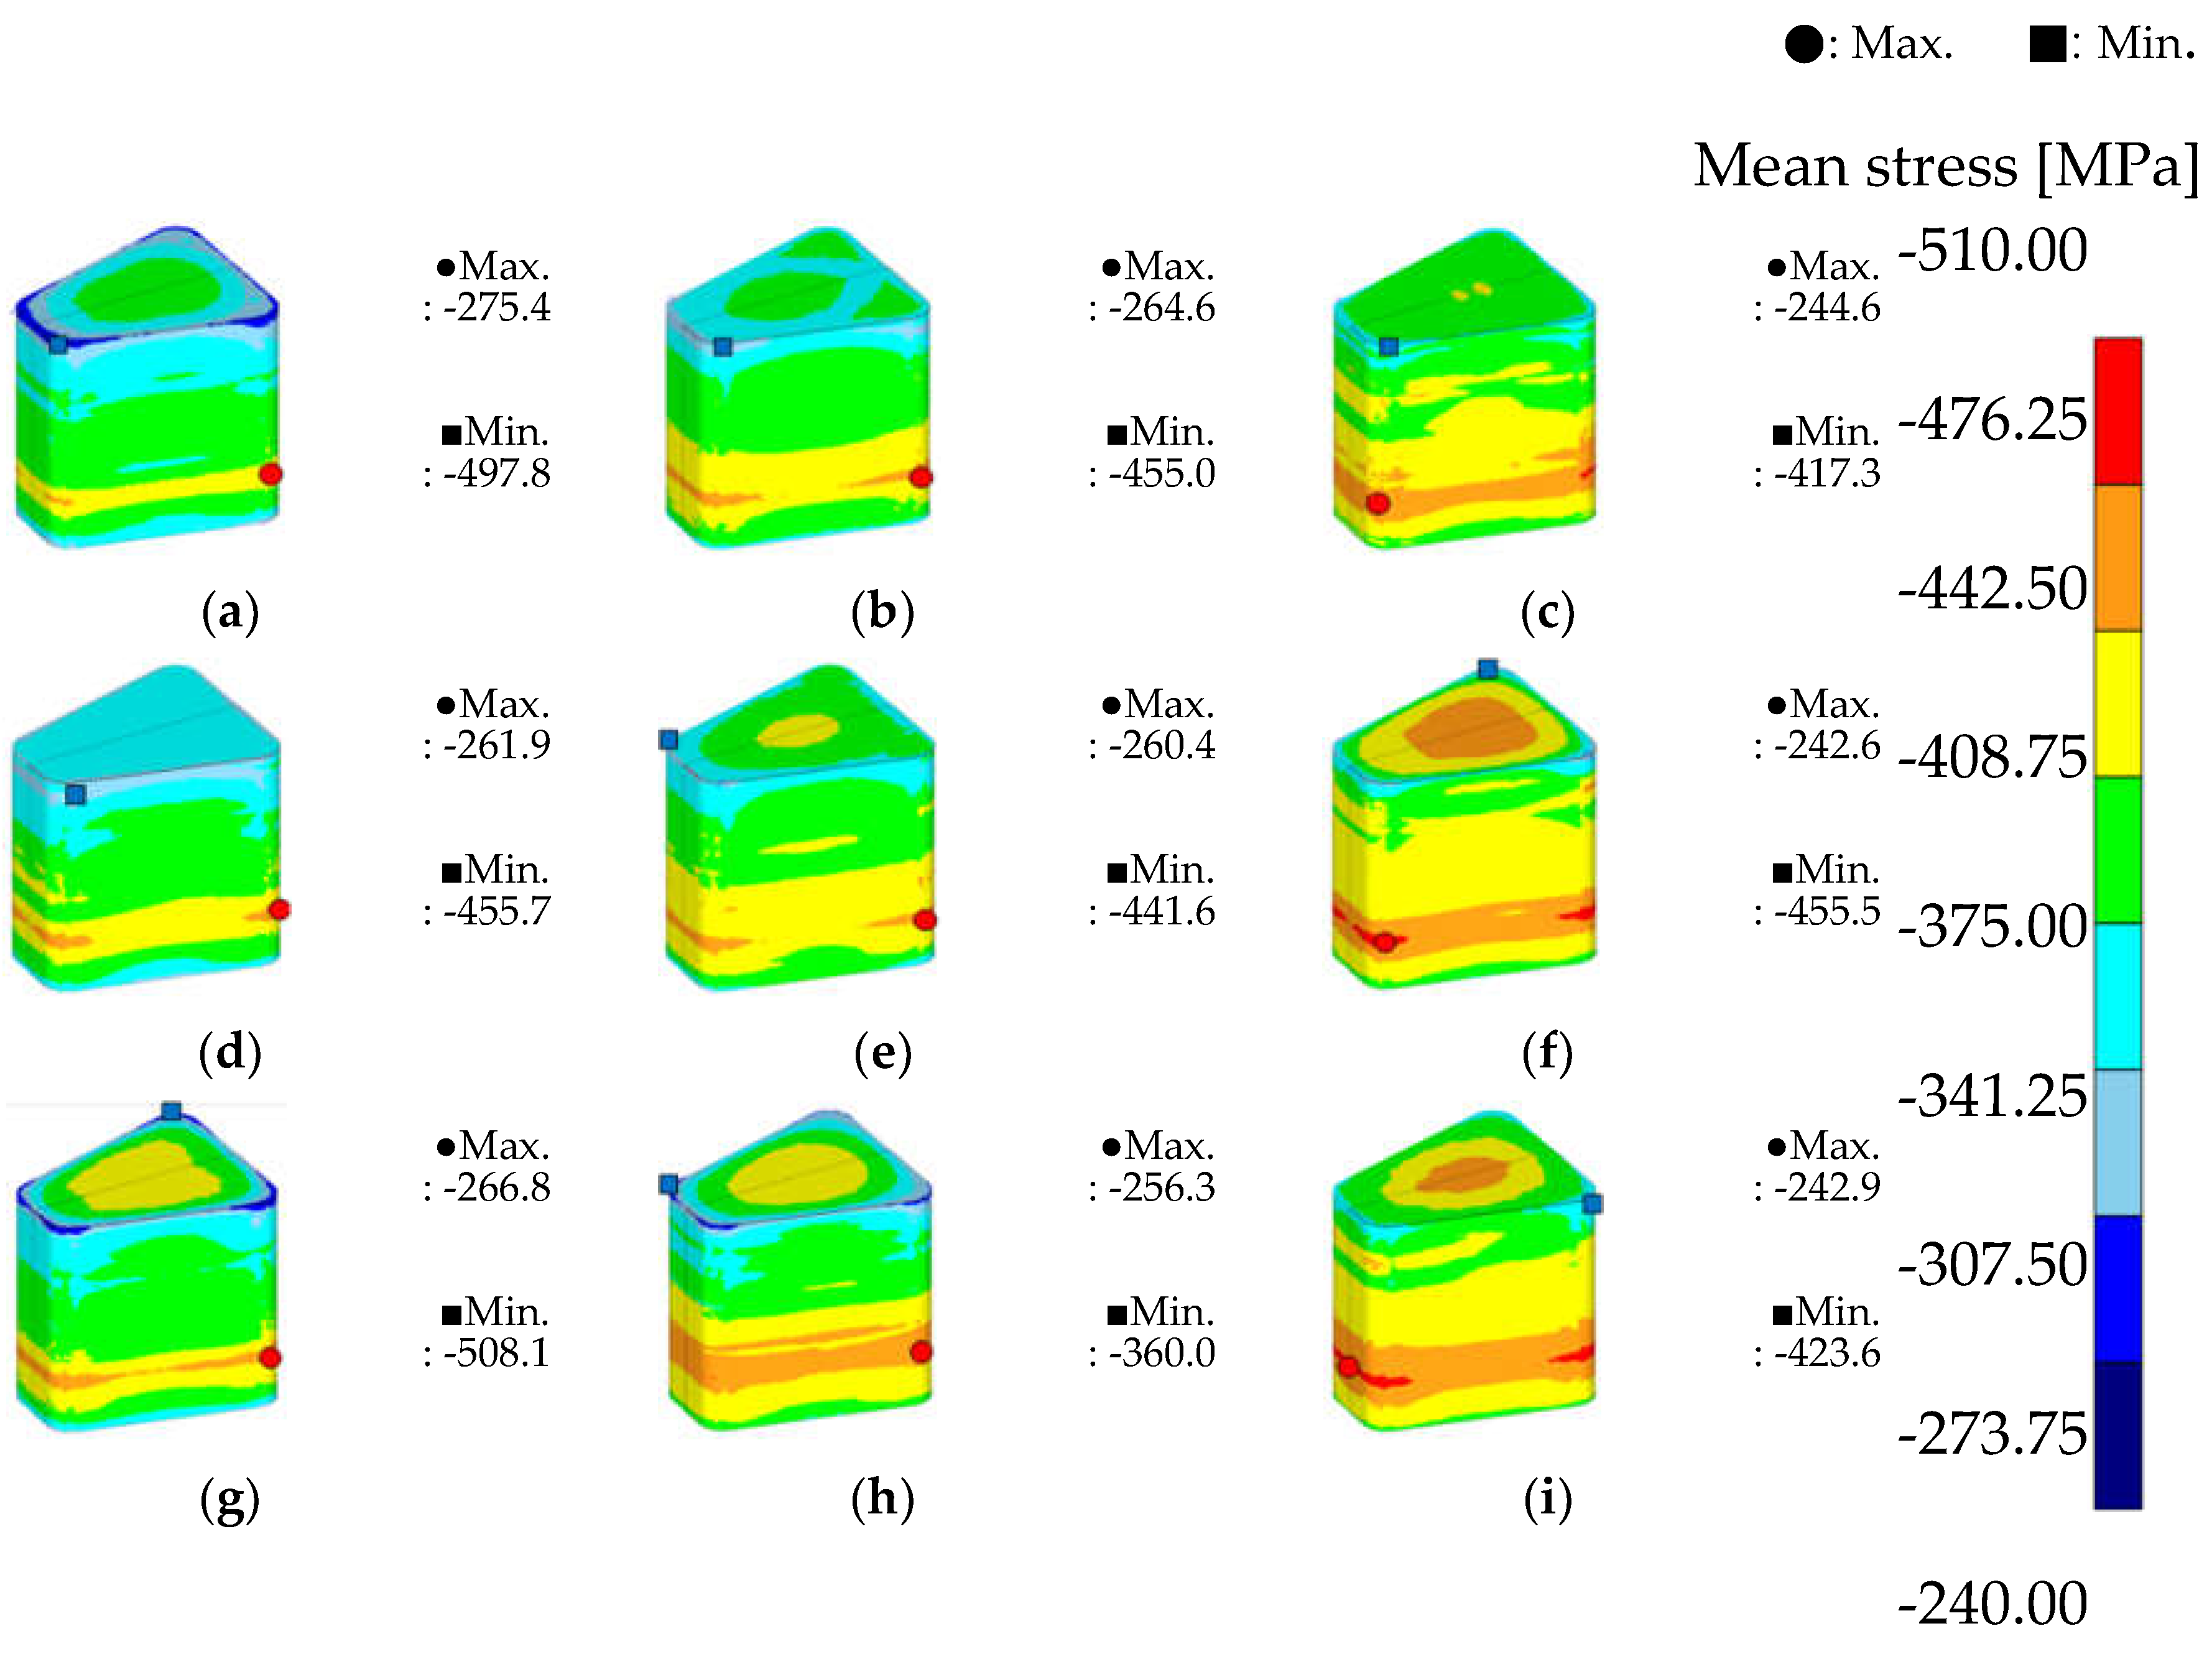
Based on the powder compression simulation results obtained by executing the experimental plan, the optimal conditions for manufacturing SMC stator cores from AncorLam HR powder were determined. The maximum and minimum relative densities, maximum-minimum relative density, maximum-minimum stress deviation, average effective stress, and average mean stress obtained under each simulation condition are listed in
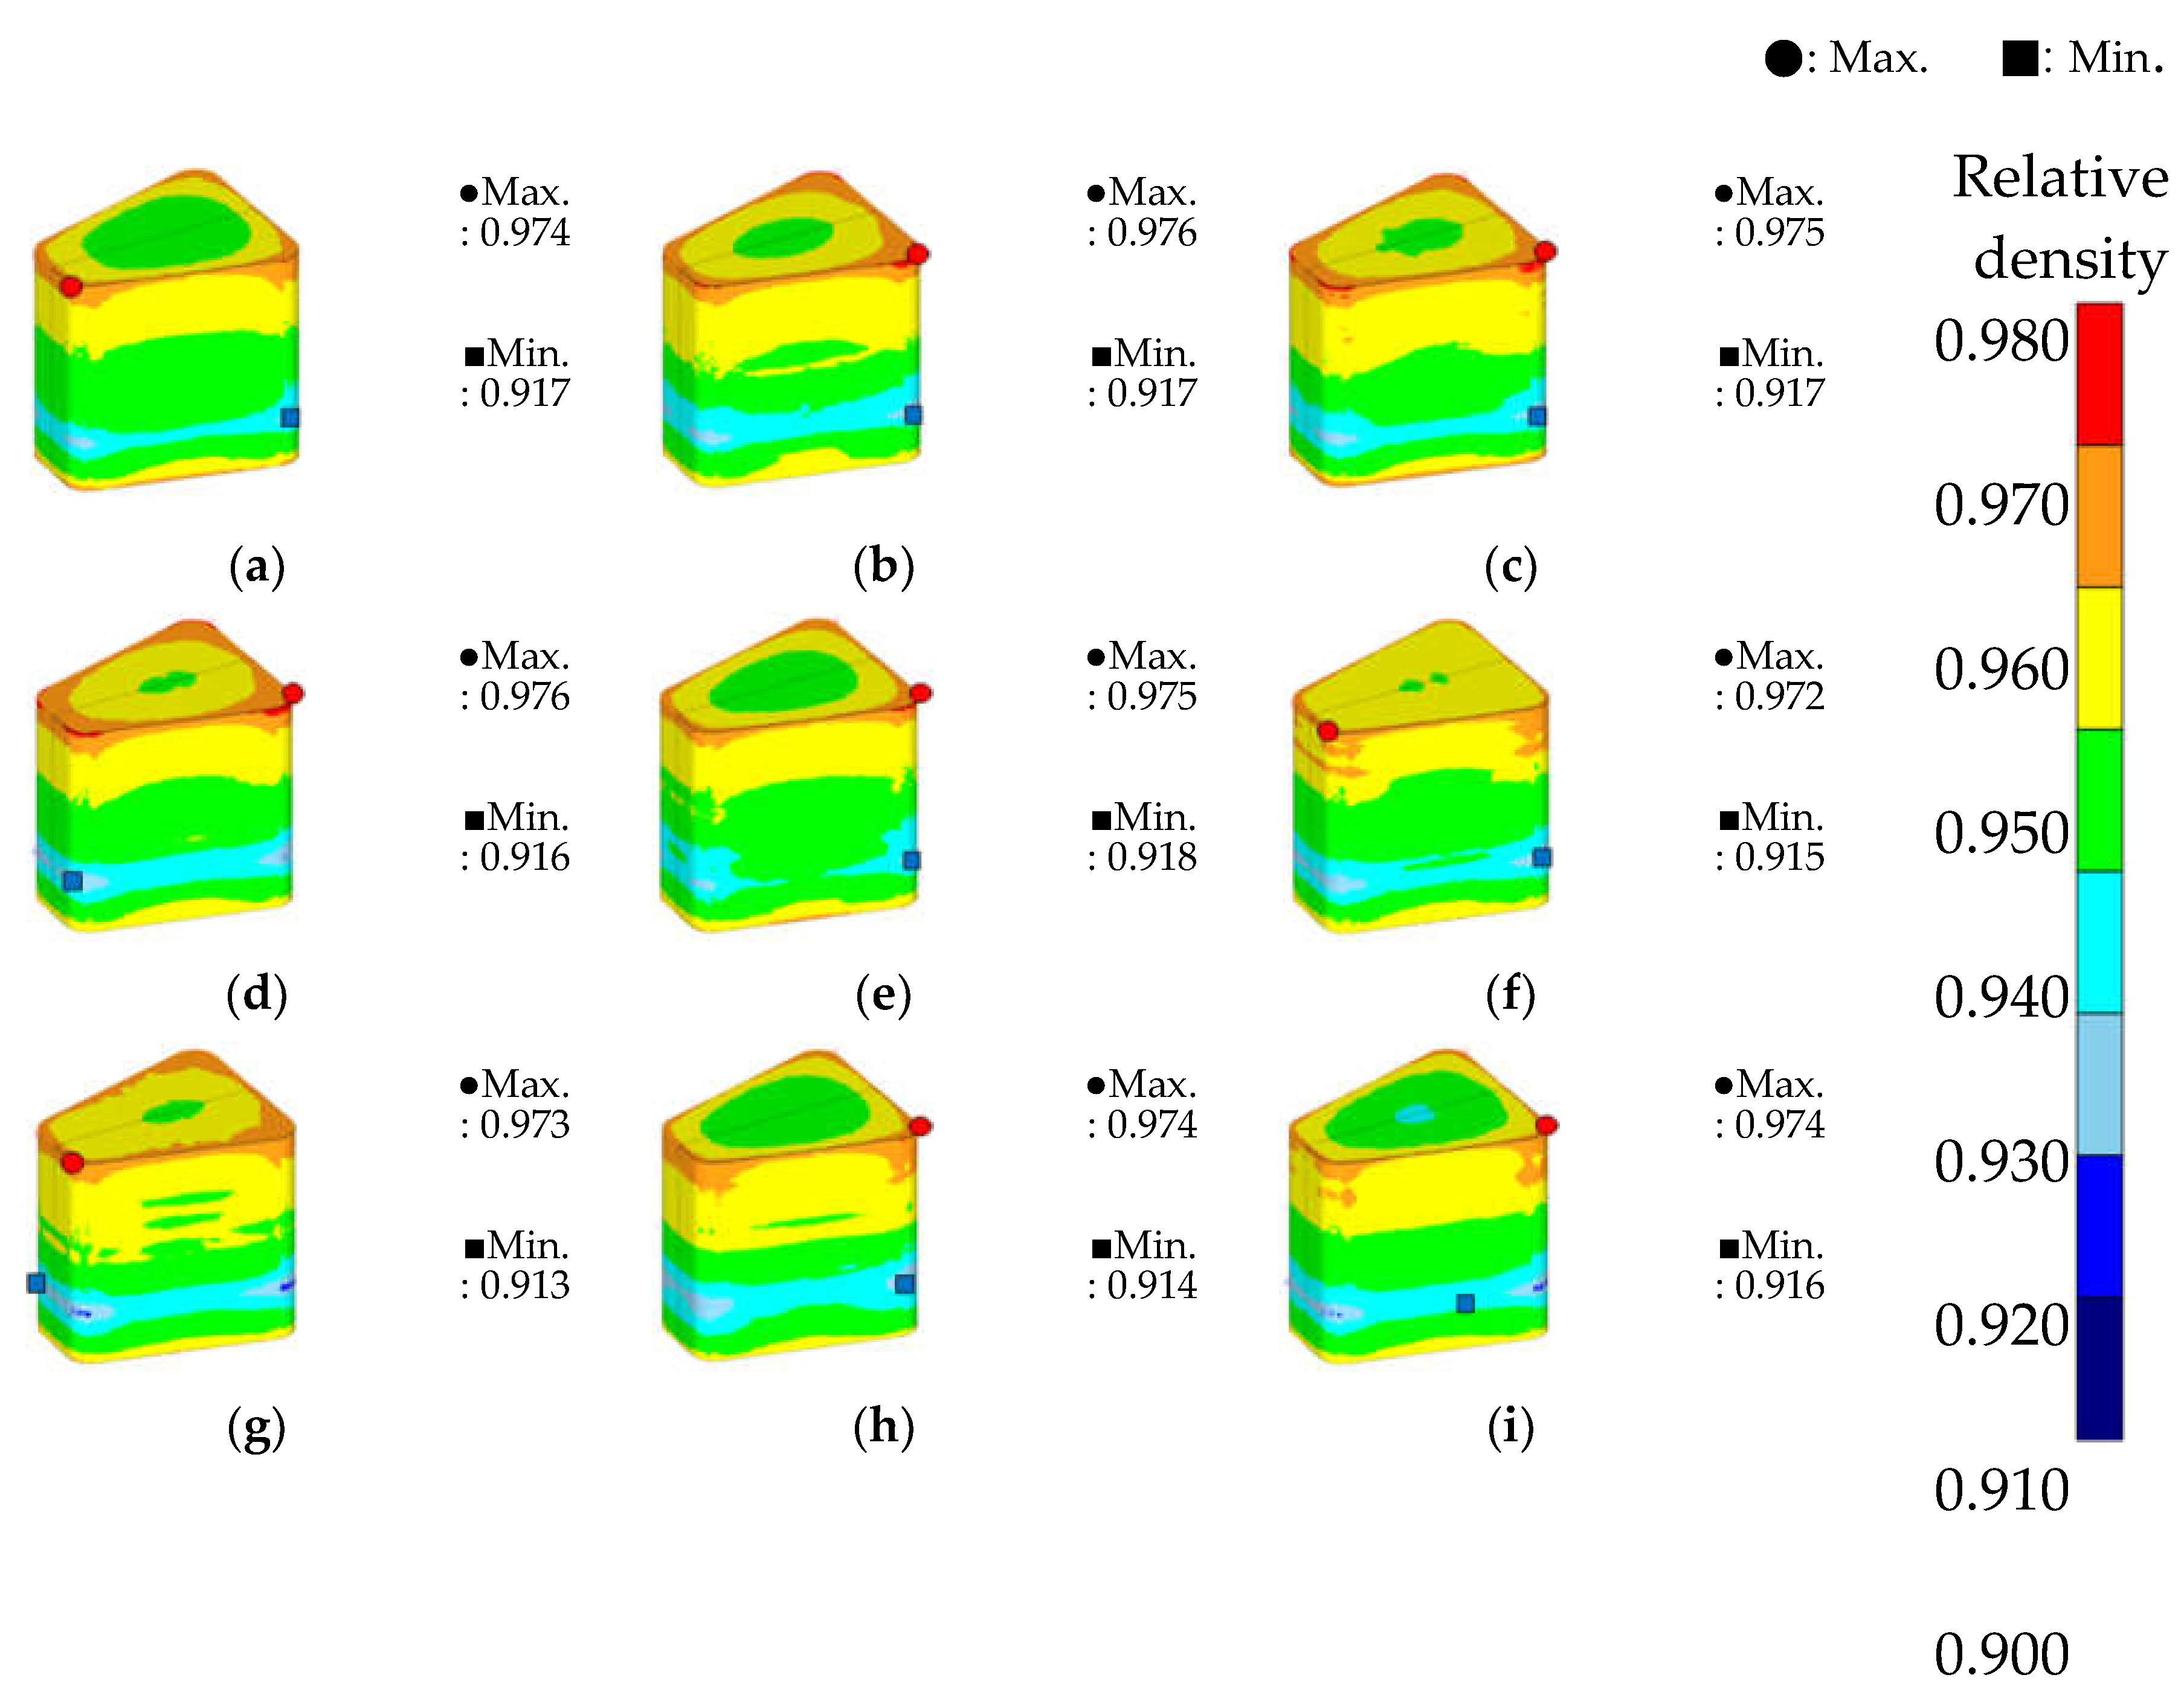
Table 6. The density obtained in the simulation exhibited a maximum-minimum deviation of less than 6% in each of the cases. An analysis of the density result in
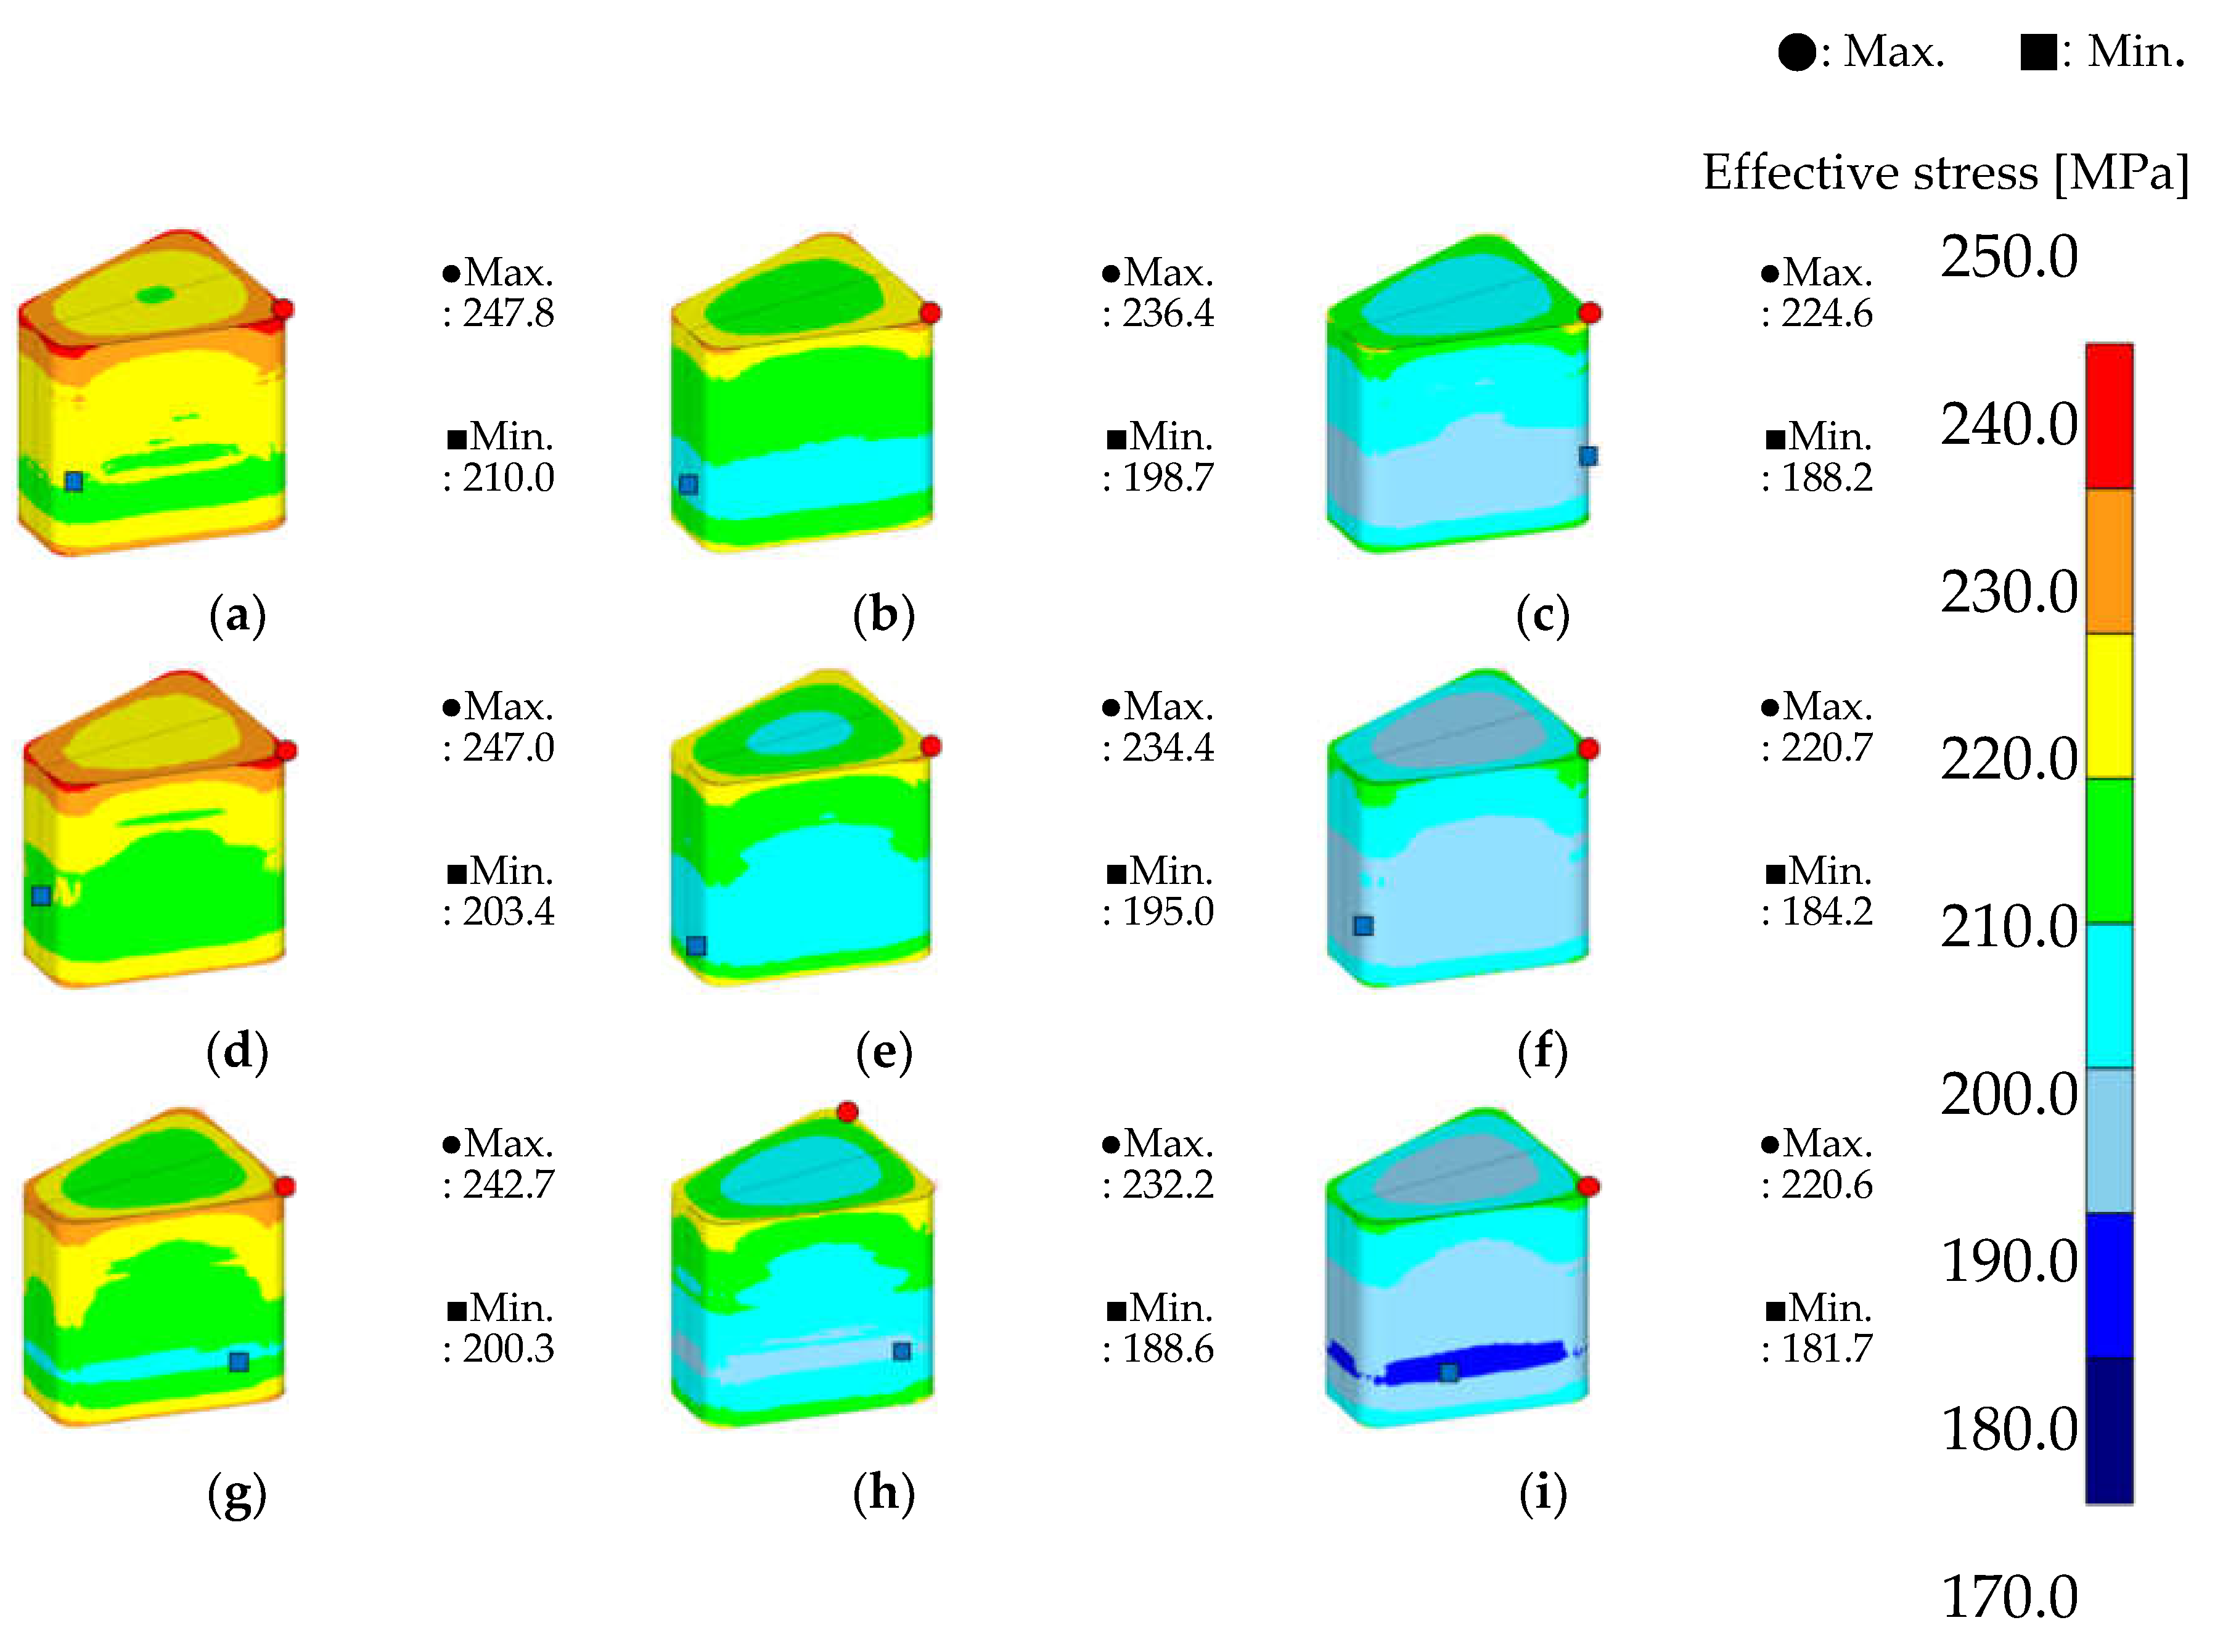
Figure 9 revealed that the density results of the upper and lower parts produced using bidirectional compression were similar, and the minimum density generation point was distributed in the middle point of the core. The maximum-minimum deviation of 6% amounted to an absolute density deviation of approximately 0.4 g/cc close to the central height, and therefore, attention should be paid to the occurrence of cracks during actual manufacturing. The same trend can be observed in
Figure 10., which shows the results of effective stress. In the same context, the mean stress results shown in
Figure 11 should also consider damage to the mold. Among the nine molding conditions, the bulk prototype should be manufactured under the conditions that lead to uniform internal density and stress distribution to ensure stable performance and quality control during production. Therefore, the relative density deviation and stress deviation were analyzed to satisfy this requirement. In the case of relative density deviation, no large deviations were observed on the whole, and the levels were similar; therefore, relative density had an insignificant effect. Representatively, the density deviations of Nos. 1, 3, 5, 6, and 9 showed a low-density deviation level, and simultaneously, showed the similarity of the low density distribution. In a comparison of the effective stresses in various cases, the process conditions of case 3 were selected because the effective stress deviation in case 3 was the lowest. The process conditions of case 3 were 7 SPM and 90°, and bulk prototypes were manufactured under these conditions.
4.2. Validation of Bulk Prototype Production
4.2.1. Density Analysis
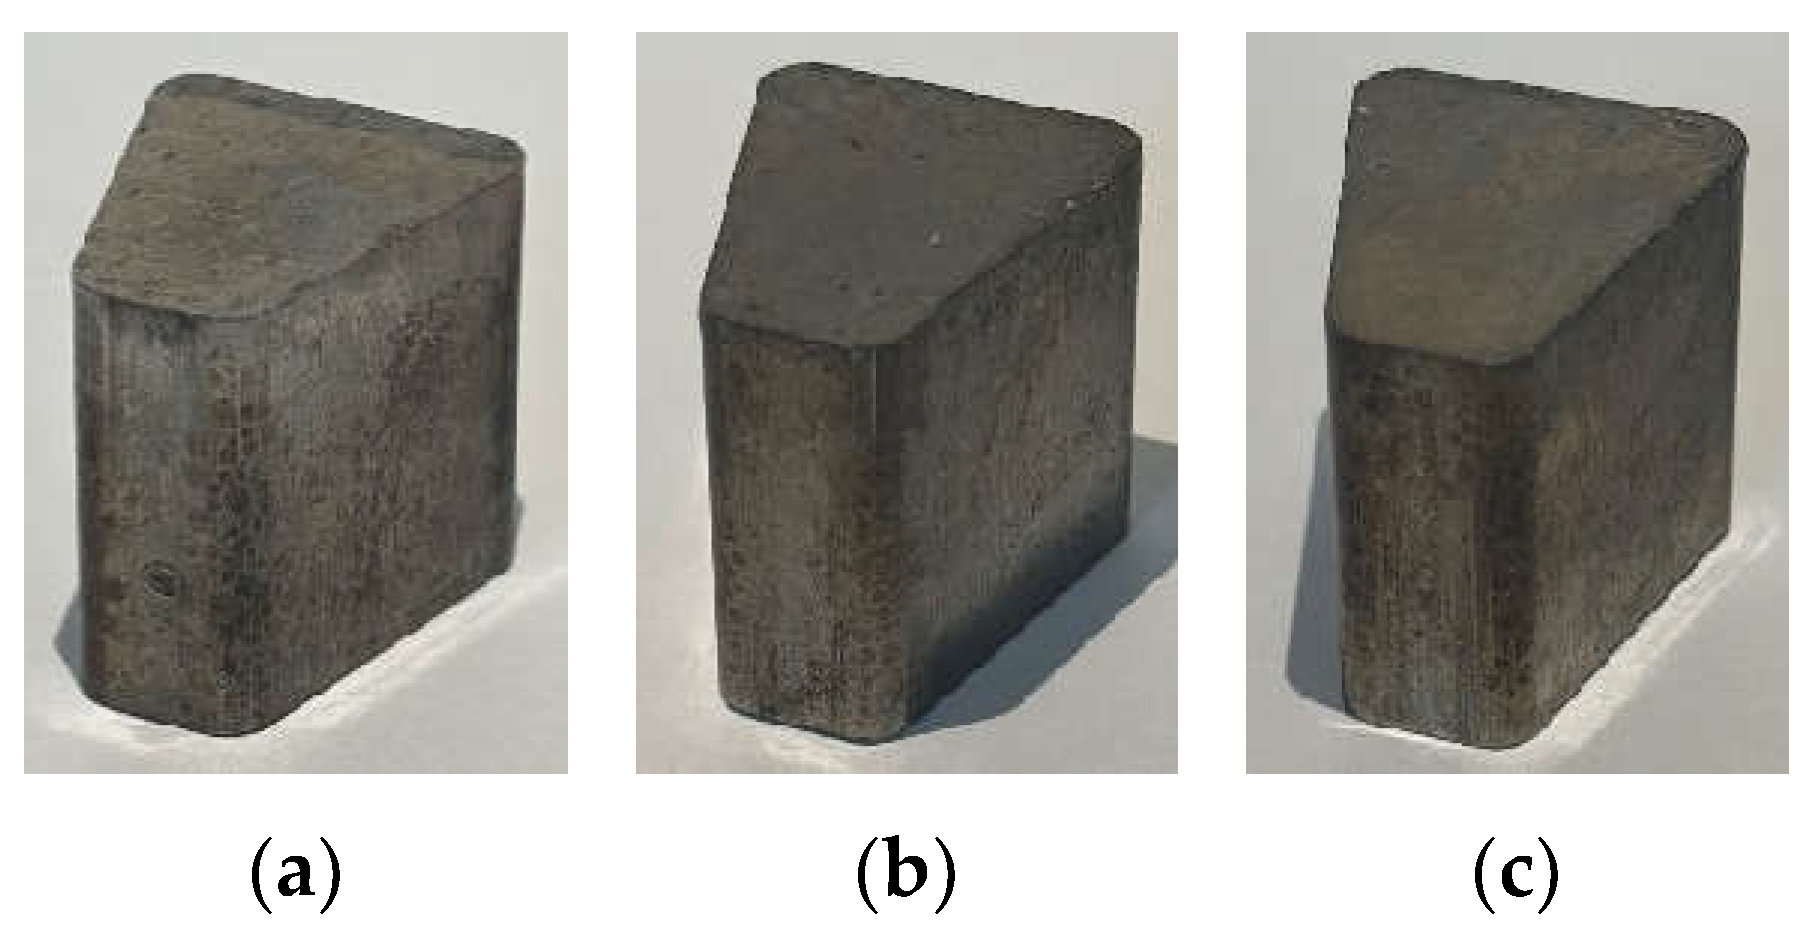
To evaluate the effectiveness of the process, three bulk prototypes were produced, and their densities were measured using the selected process. The three prototypes prepared herein are shown in
Figure 12, and their measured density values are listed in
Table 7. The measured density values of the prototypes were 7.361, 7.365, and 7.355 g/cc, resulting in an average density of 7.360 g/cc. The effectiveness of the process was verified by confirming the simulation target density of 7.4 g/cc and an error level of approximately 0.54%.
4.2.2. Microstructure Analysis
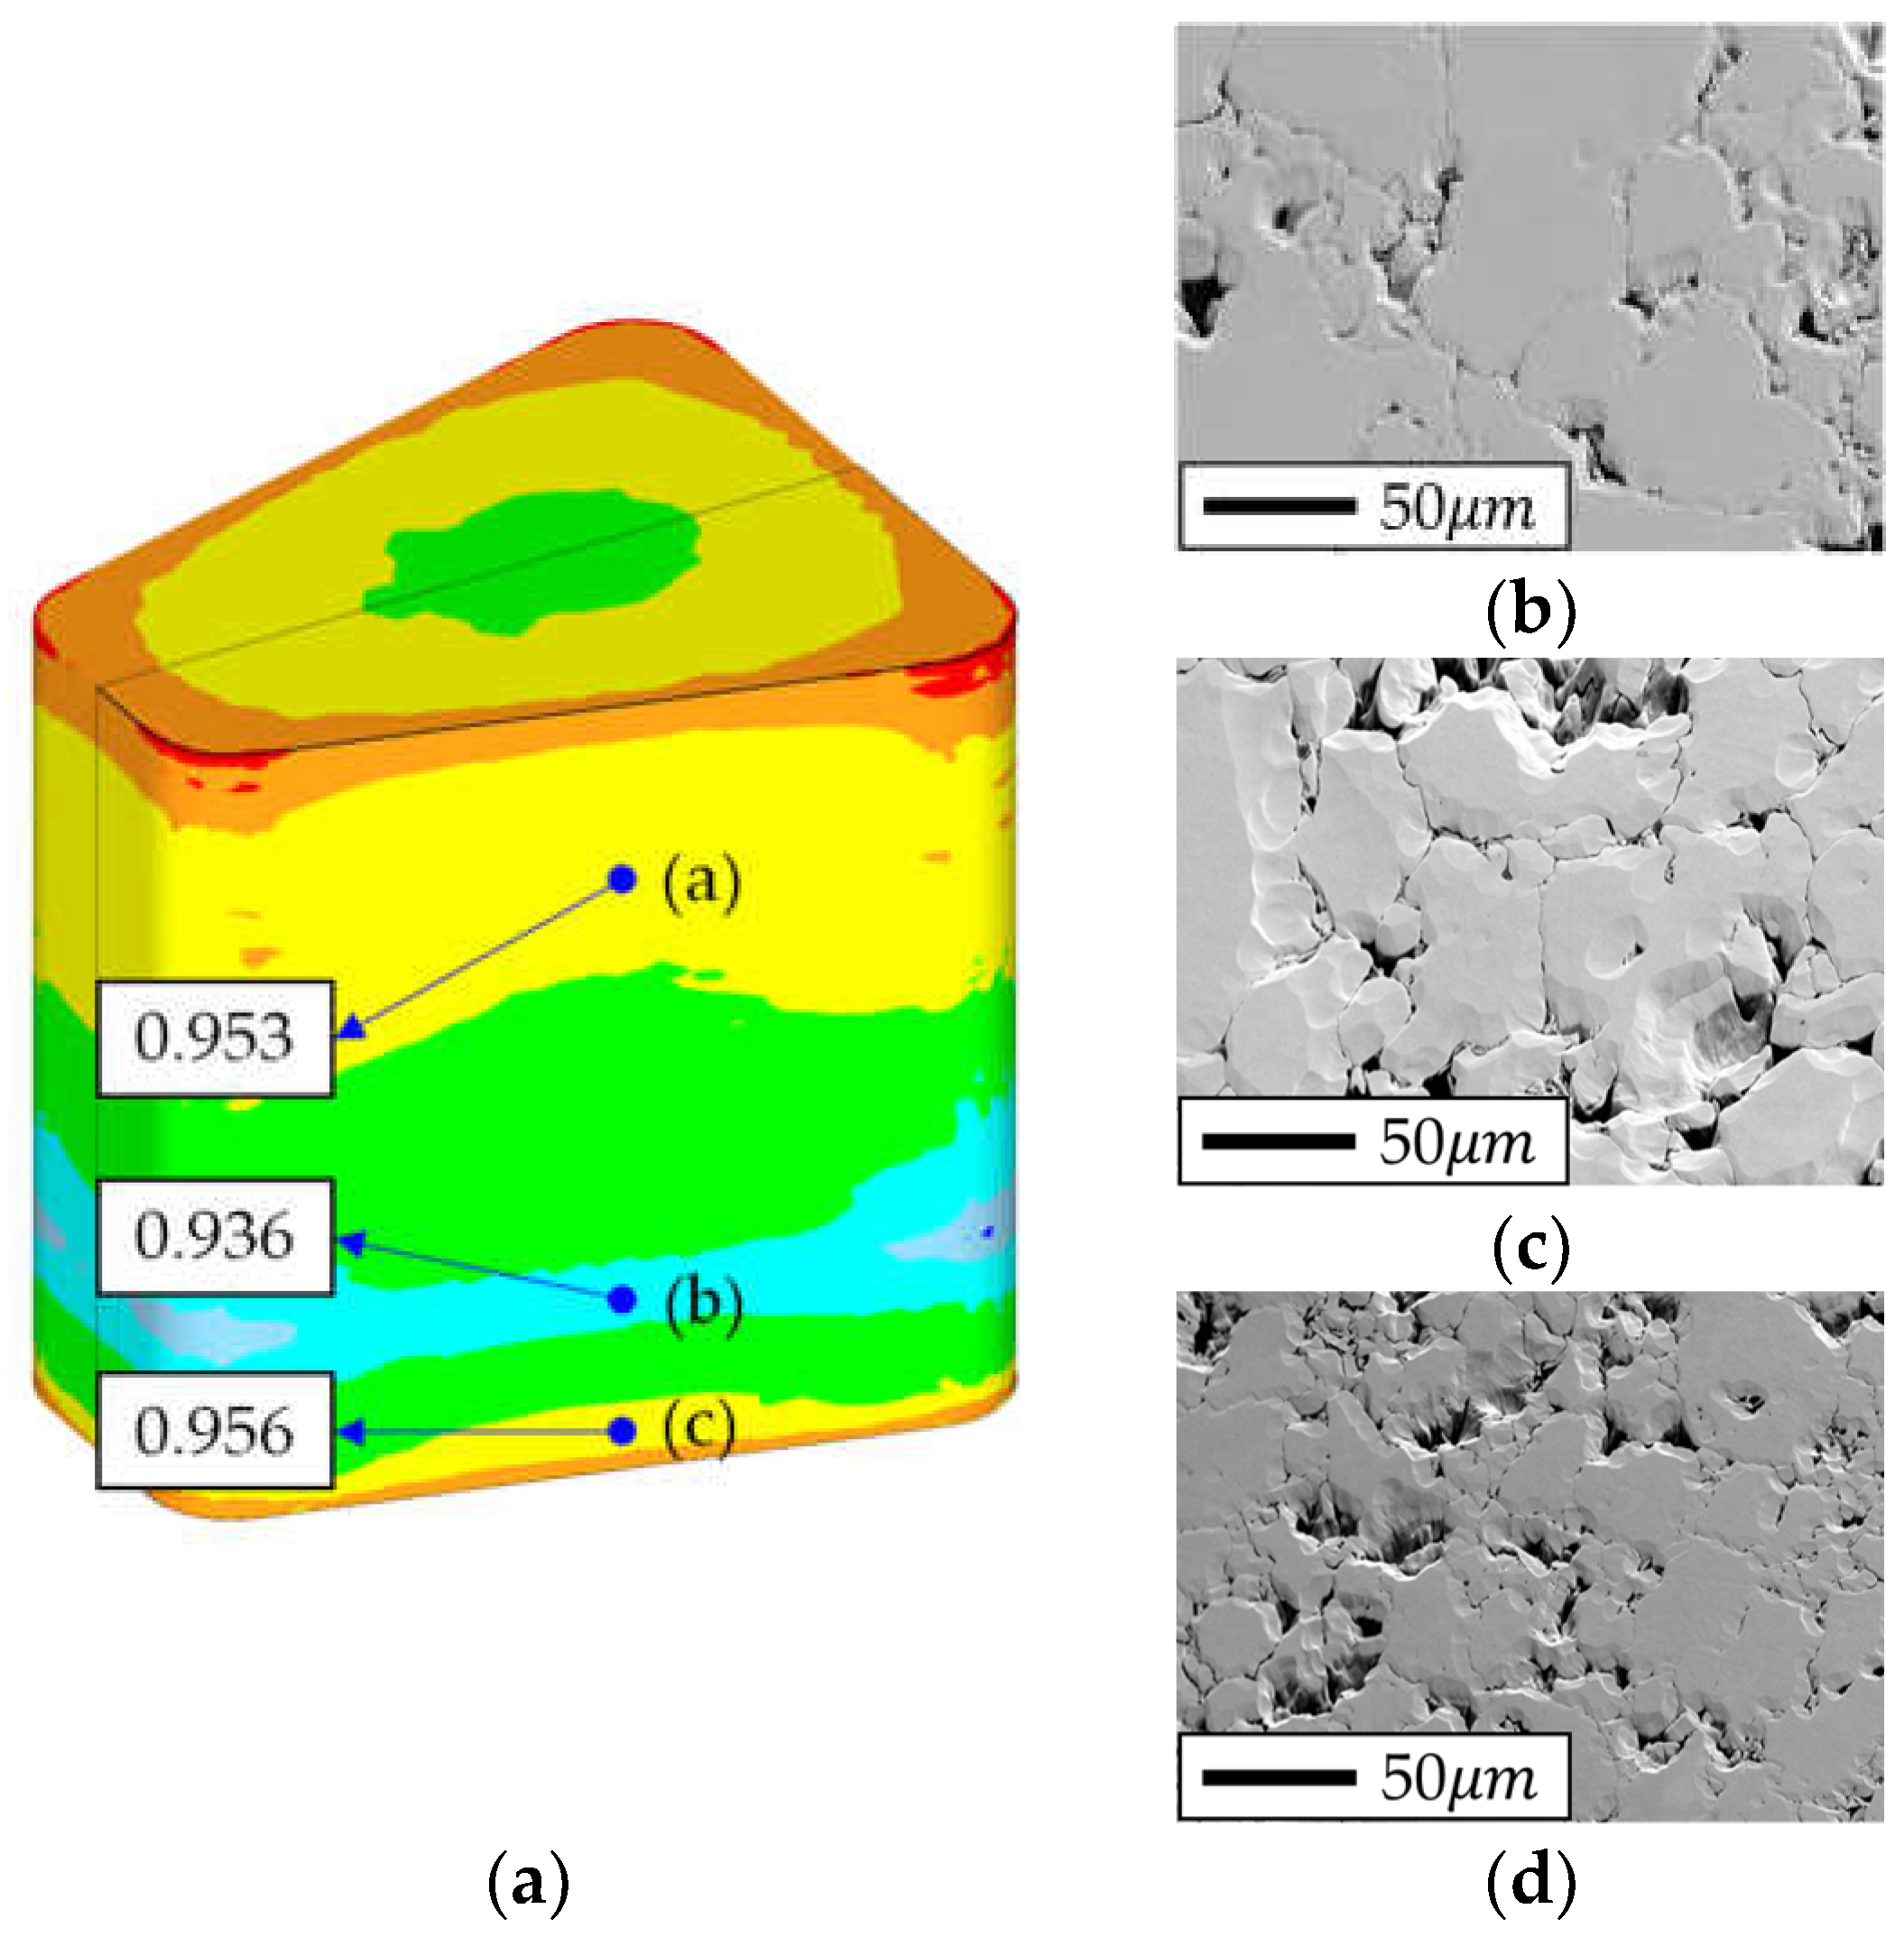
To verify the simulation results and reliability of the bulk prototypes, the trend of density distribution was confirmed through SEM imaging of the prototypes. SEM was photographed using specimen No. 2 with the highest density result, and EDS and EBSD analysis were performed together. According to the density distribution obtained in the simulation, three points with significant density differences were selected. These three points, located at 5 mm, 20 mm, and 25 mm from the top of the prototype, are shown in
Figure 13 (a). The SEM analysis results of these points are presented in
Figure 13.
Similar to the simulation results, relatively large density shapes were observed at the 5-mm and 25-mm points, accompanied by low porosity. In addition, to evaluate the SMC characteristics of the bulk prototype, the EDS and EBSD results obtained at the 5-mm point are presented in
Figure 14 and
Figure 15, respectively. Unlike the powdered AncorLam HR composed of Fe and P, P did not remain in the bulk prototype. The chemical composition of the bulk prototype, as obtained from the EDS analysis, is summarized in
Table 8. The EBSD results confirmed that the crystal structure of the bulk prototype consisted of the BCC structure alone. In addition, random orientation, one of the important properties of SMC, was verified, as illustrated in
Figure 15
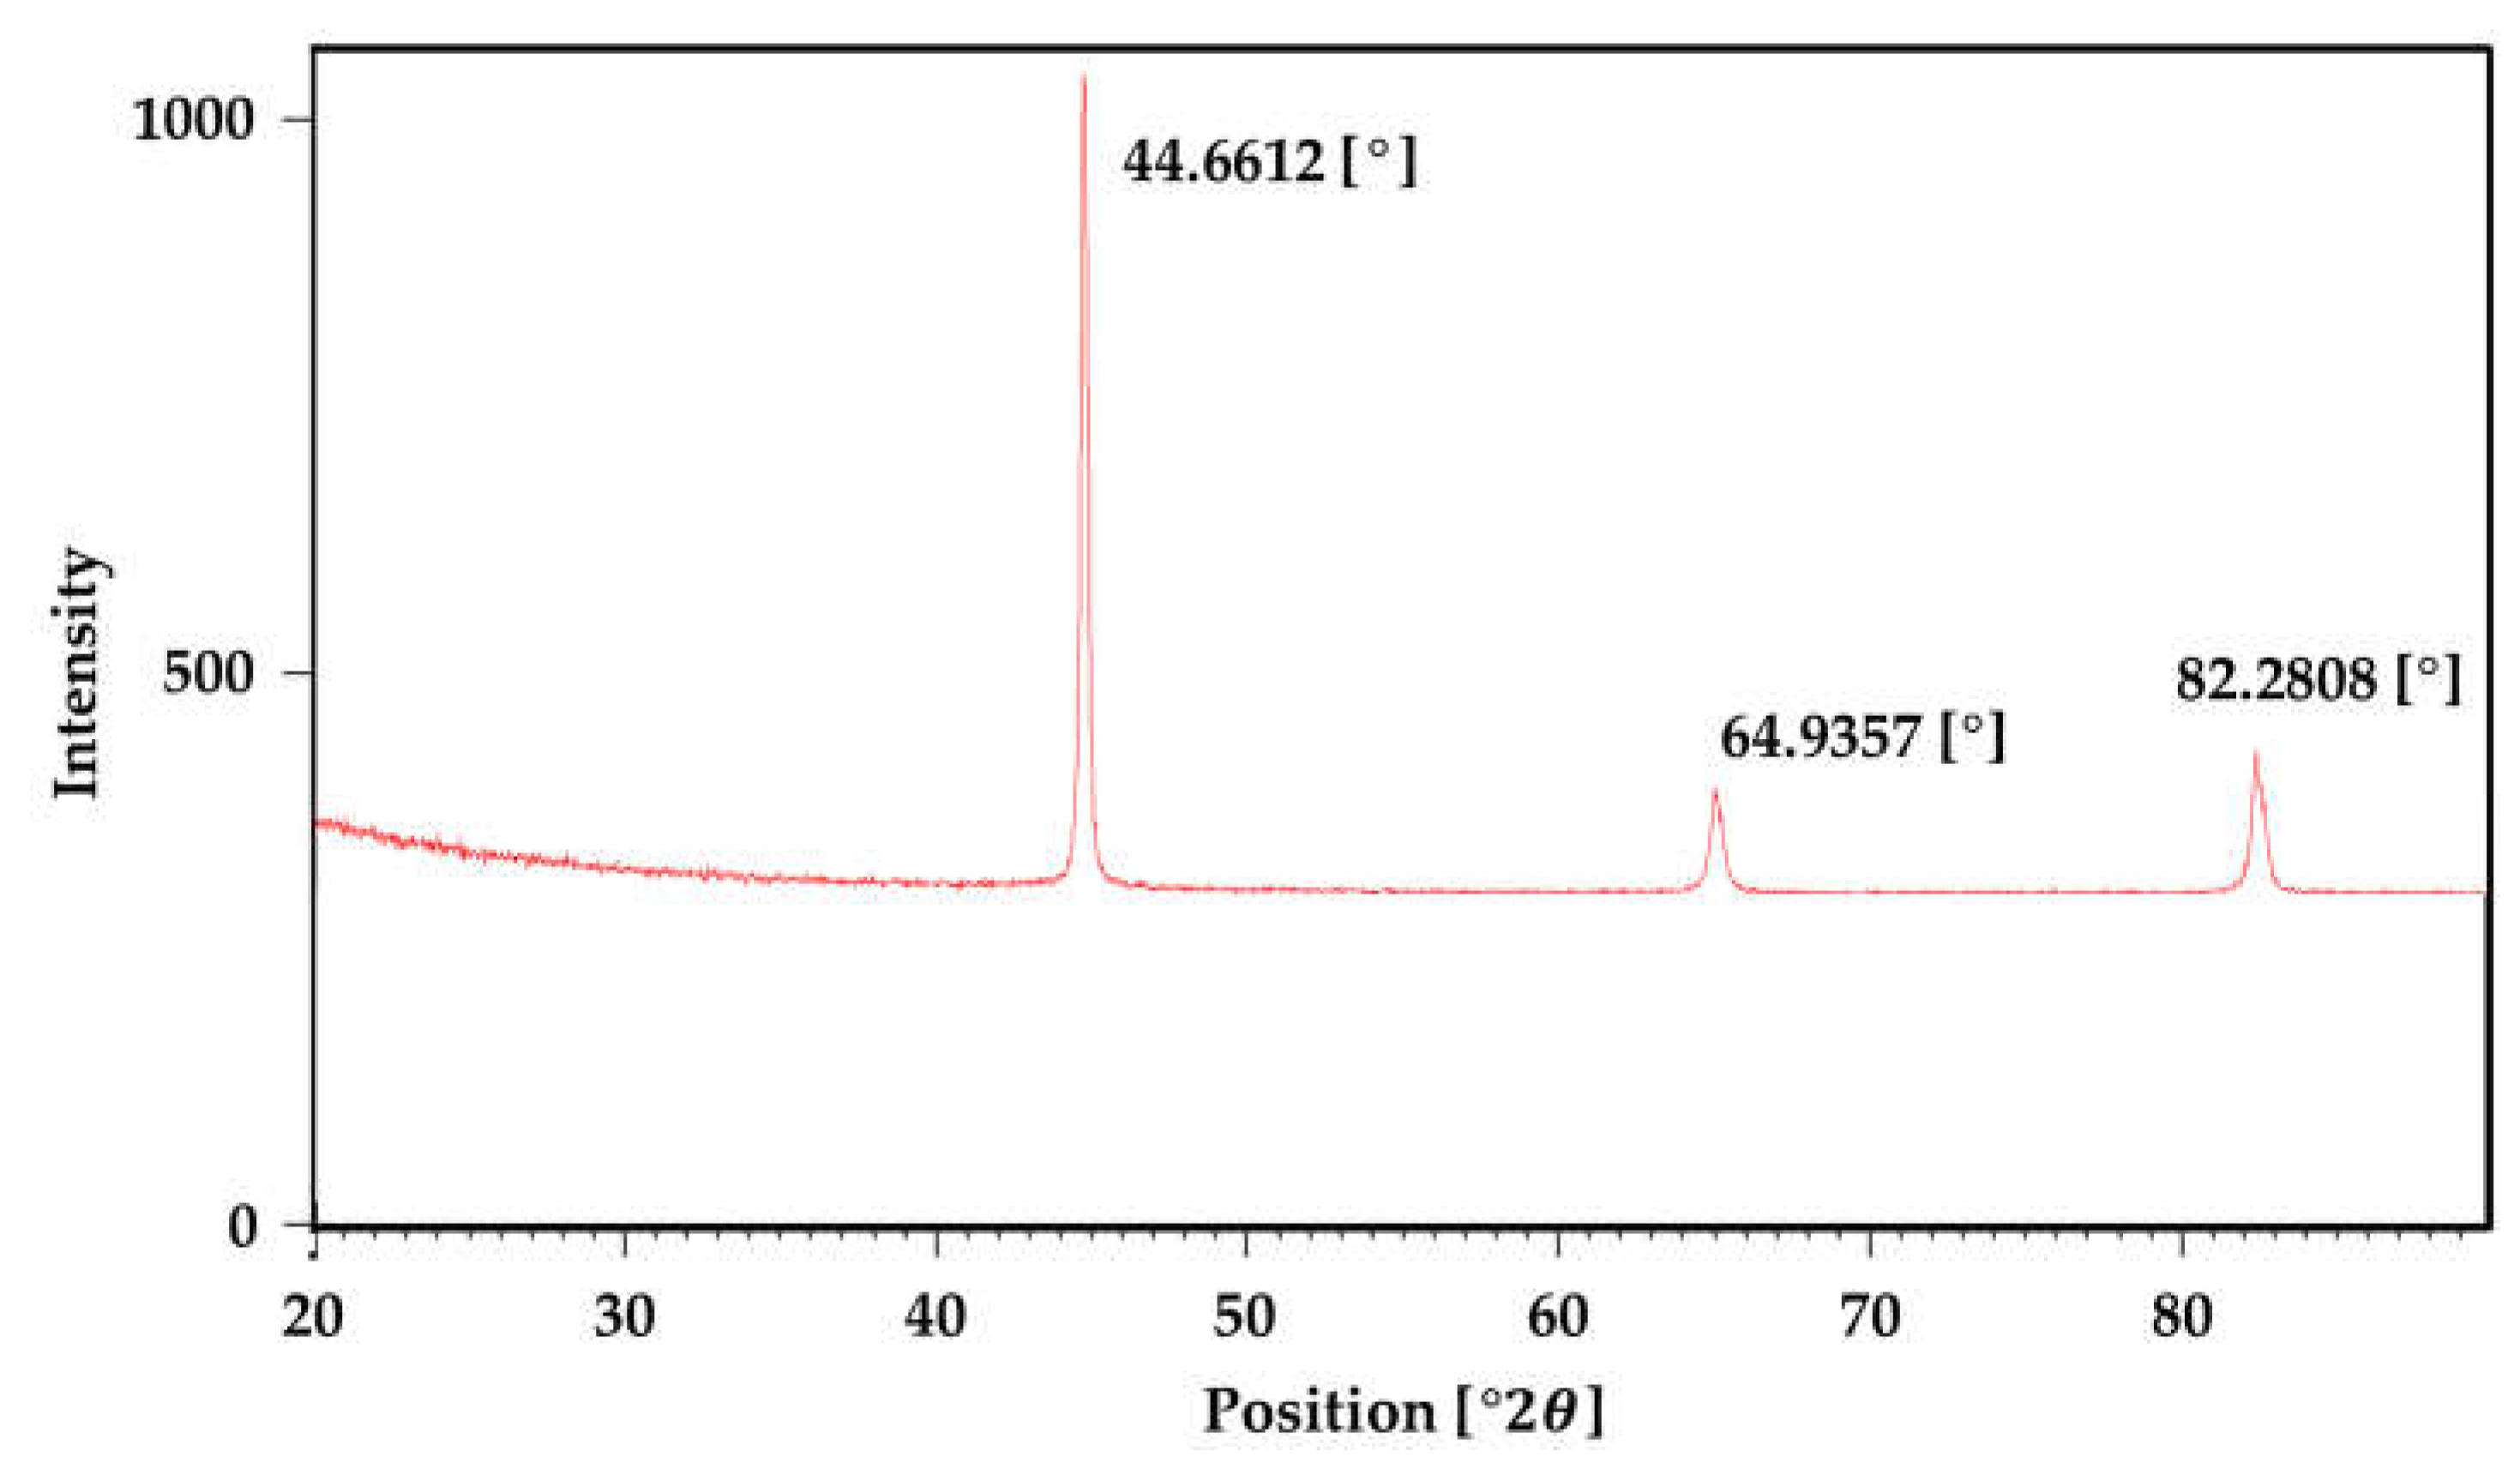
The XRD measurement results of the bulk prototype are presented in
Figure 16. Compared to the XRD measurement results of the powder, illustrated in
Figure 3, peaks appeared at 44.7°, 64.9°, and 82.3°, which represented the α phases of the same Fe. This result confirmed that the molding temperature and heat treatment temperature did not change the internal phase structure of the SMC core during the manufacture of the bulk prototype.
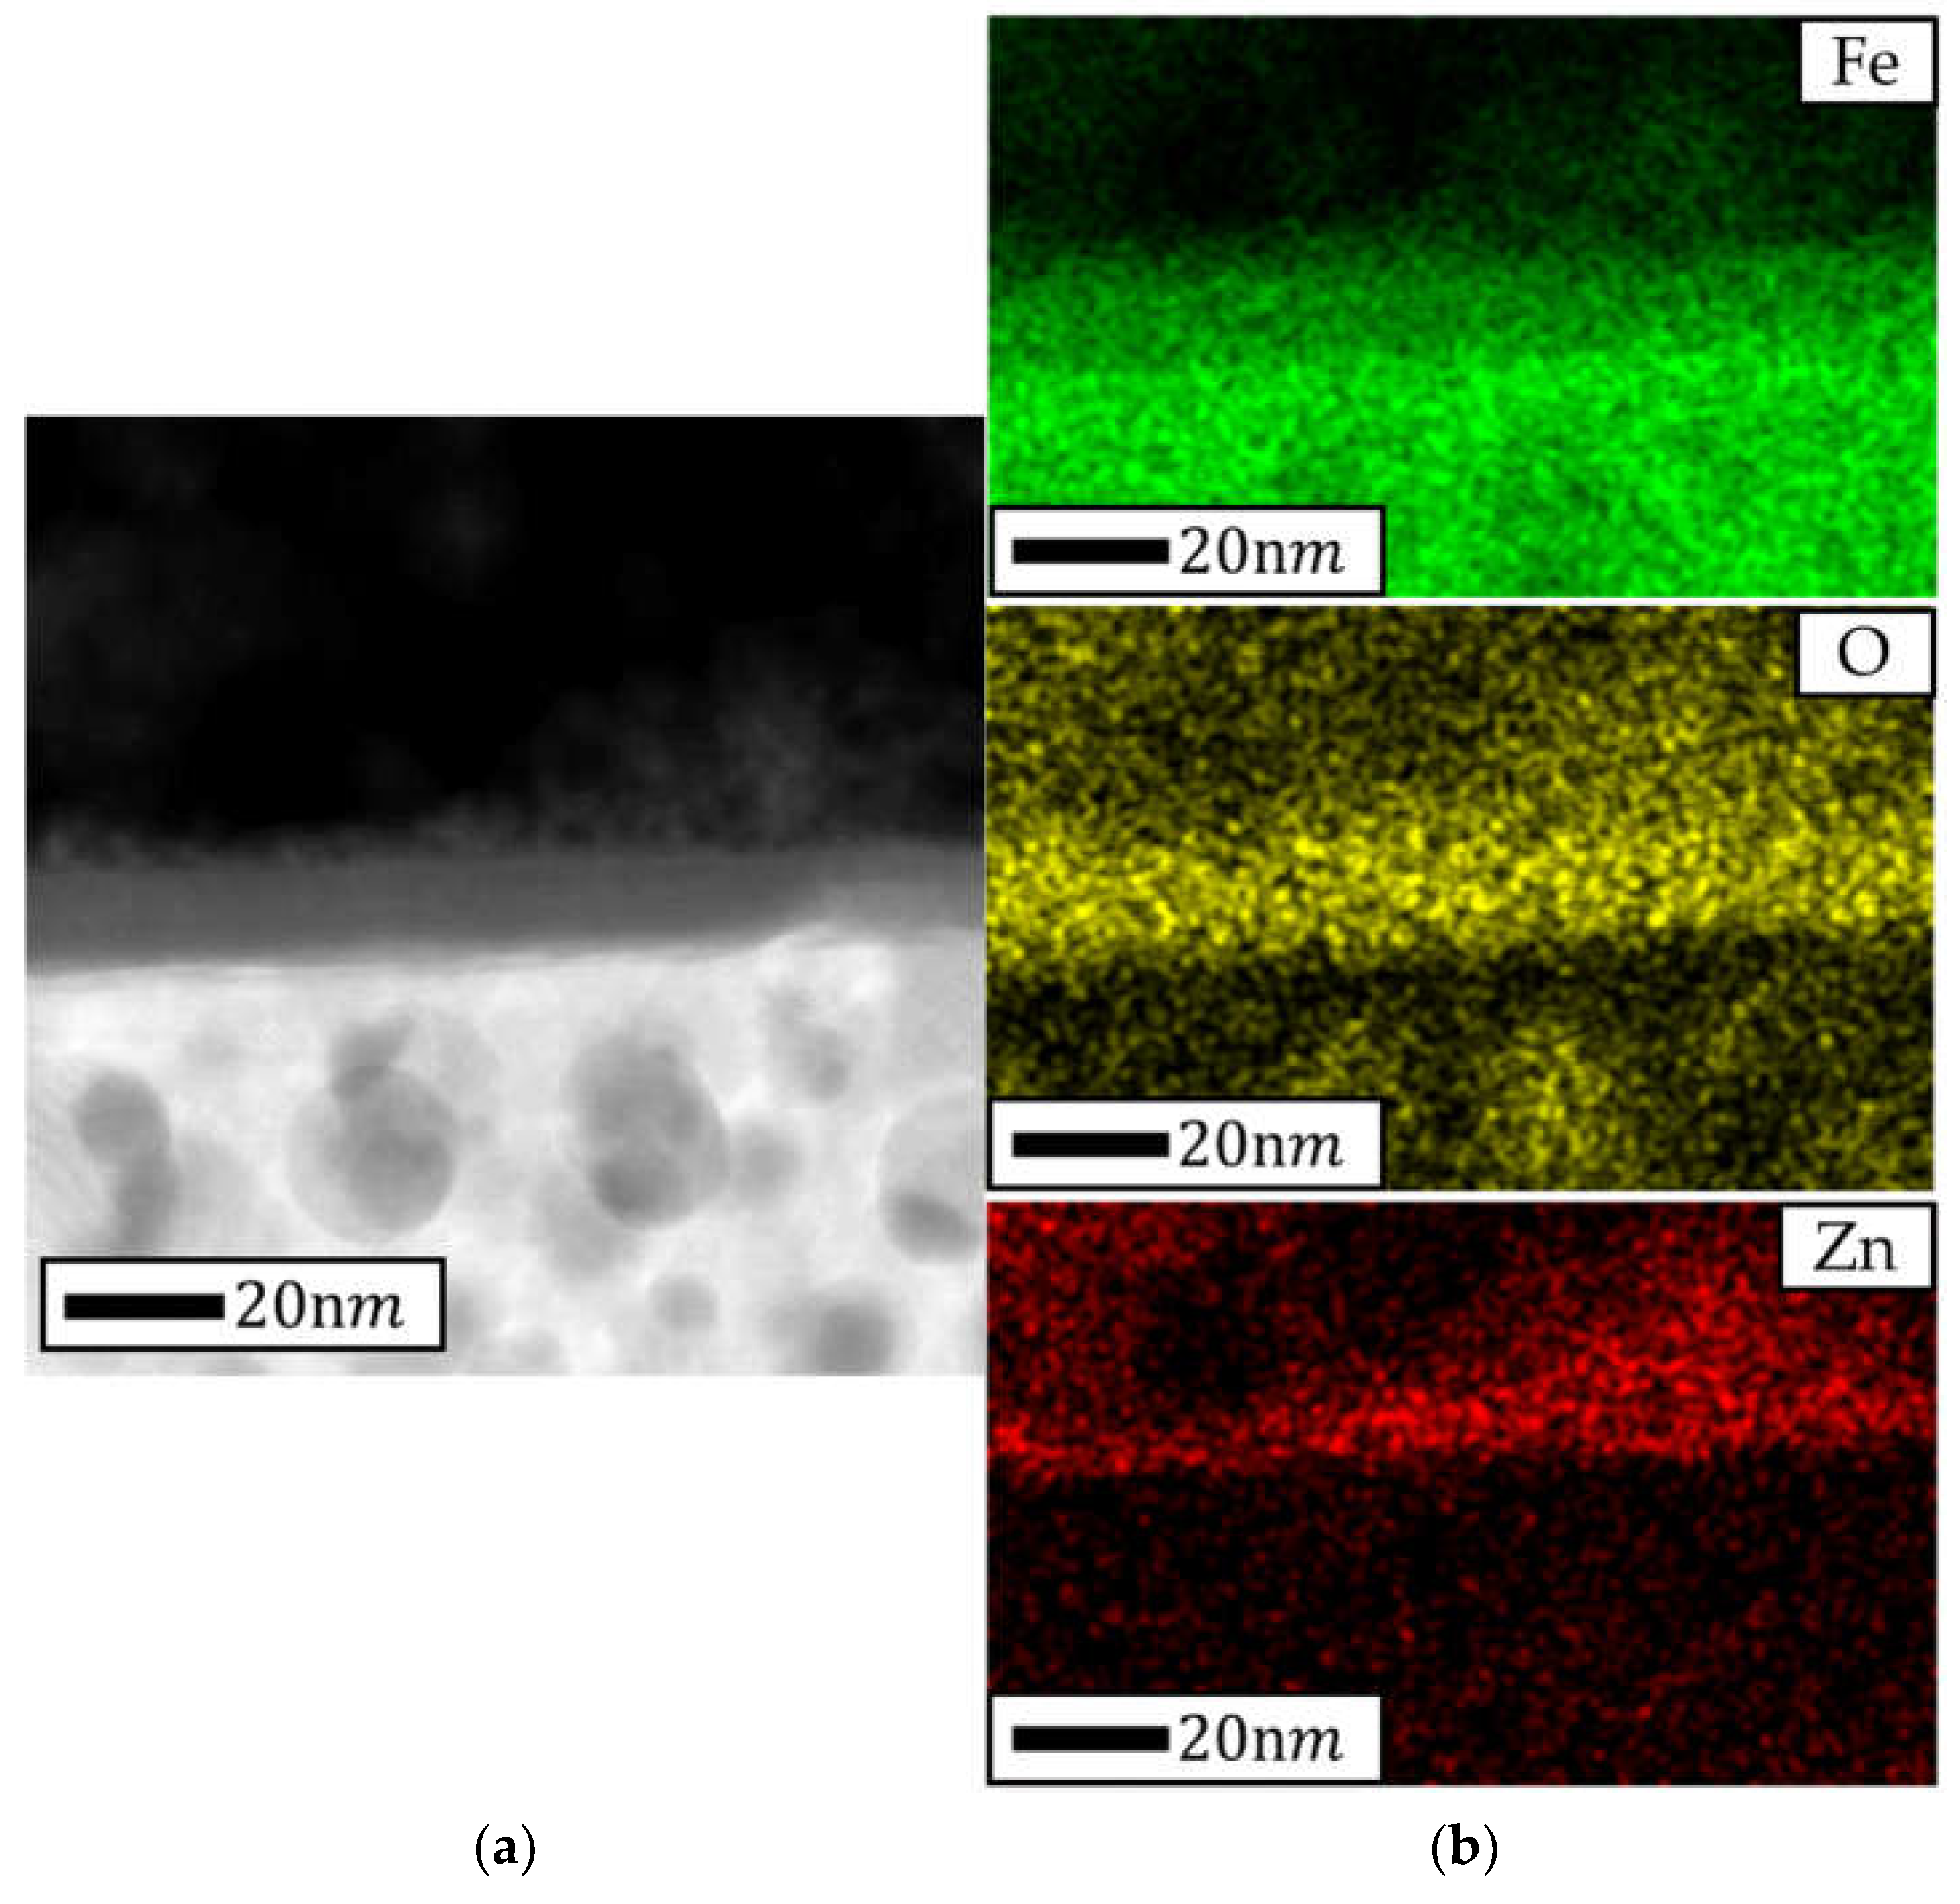
Figure 17 depicts the TEM measurement results for the cross-section of the bulk prototype. As summarized in
Table 8, the non-detection of P, which was measured in the powdered AncorLam HR, was confirmed. As shown in
Figure 17, the insulating layer presumed to be phosphate-based was destroyed over the Fe layer, and at the same time, the Zn-based lubricant used during molding remained. Residual lubricants must be removed during molding or heat treatment because they can affect the electrical and magnetic properties of the SMC core. Residual lubricants reduce the inter-particle insulation effect and act as impurities in the magnetic circuit inside the core, thereby negatively affecting the magnetic flux density and yield of the core.
4.3. Analysis of Motor Simulation Results
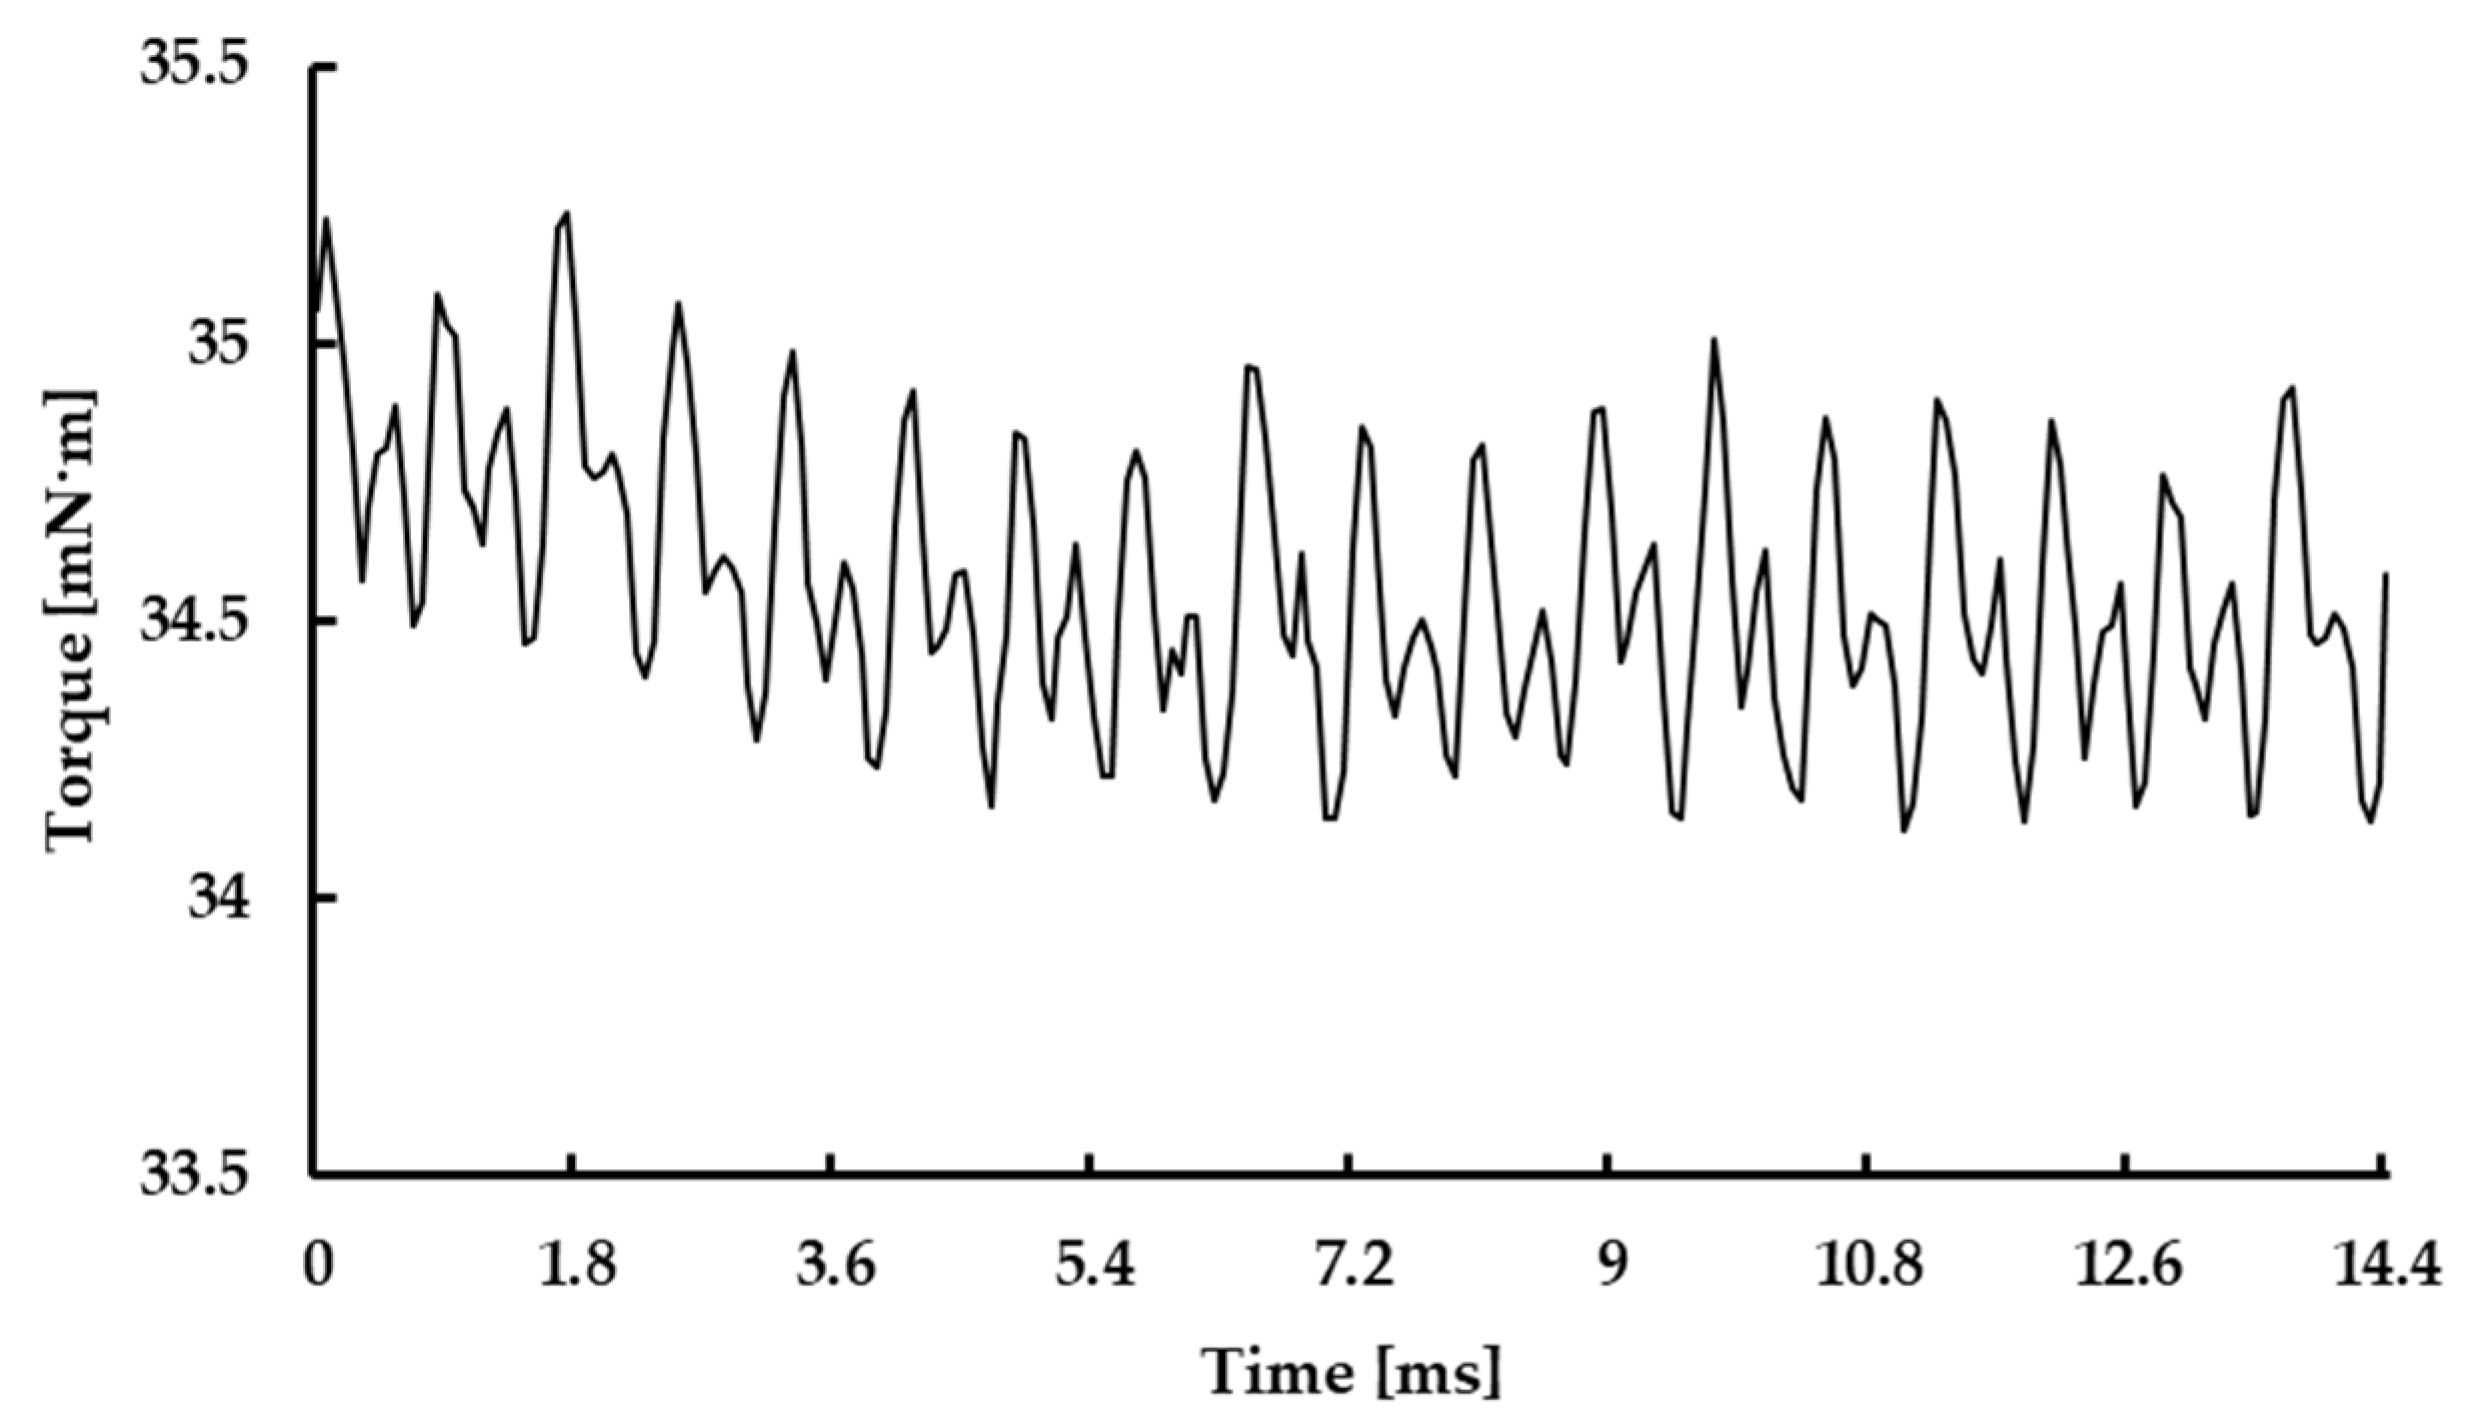
The torque results of the AFPM-type motor simulation conducted using AncorLam HR powder are shown in
Figure 18. The average torque was 34.5 mN∙m. The core loss based on the frequency of AncorLam HR powder is shown in
Figure 19. The higher the frequency, the higher was the core loss.
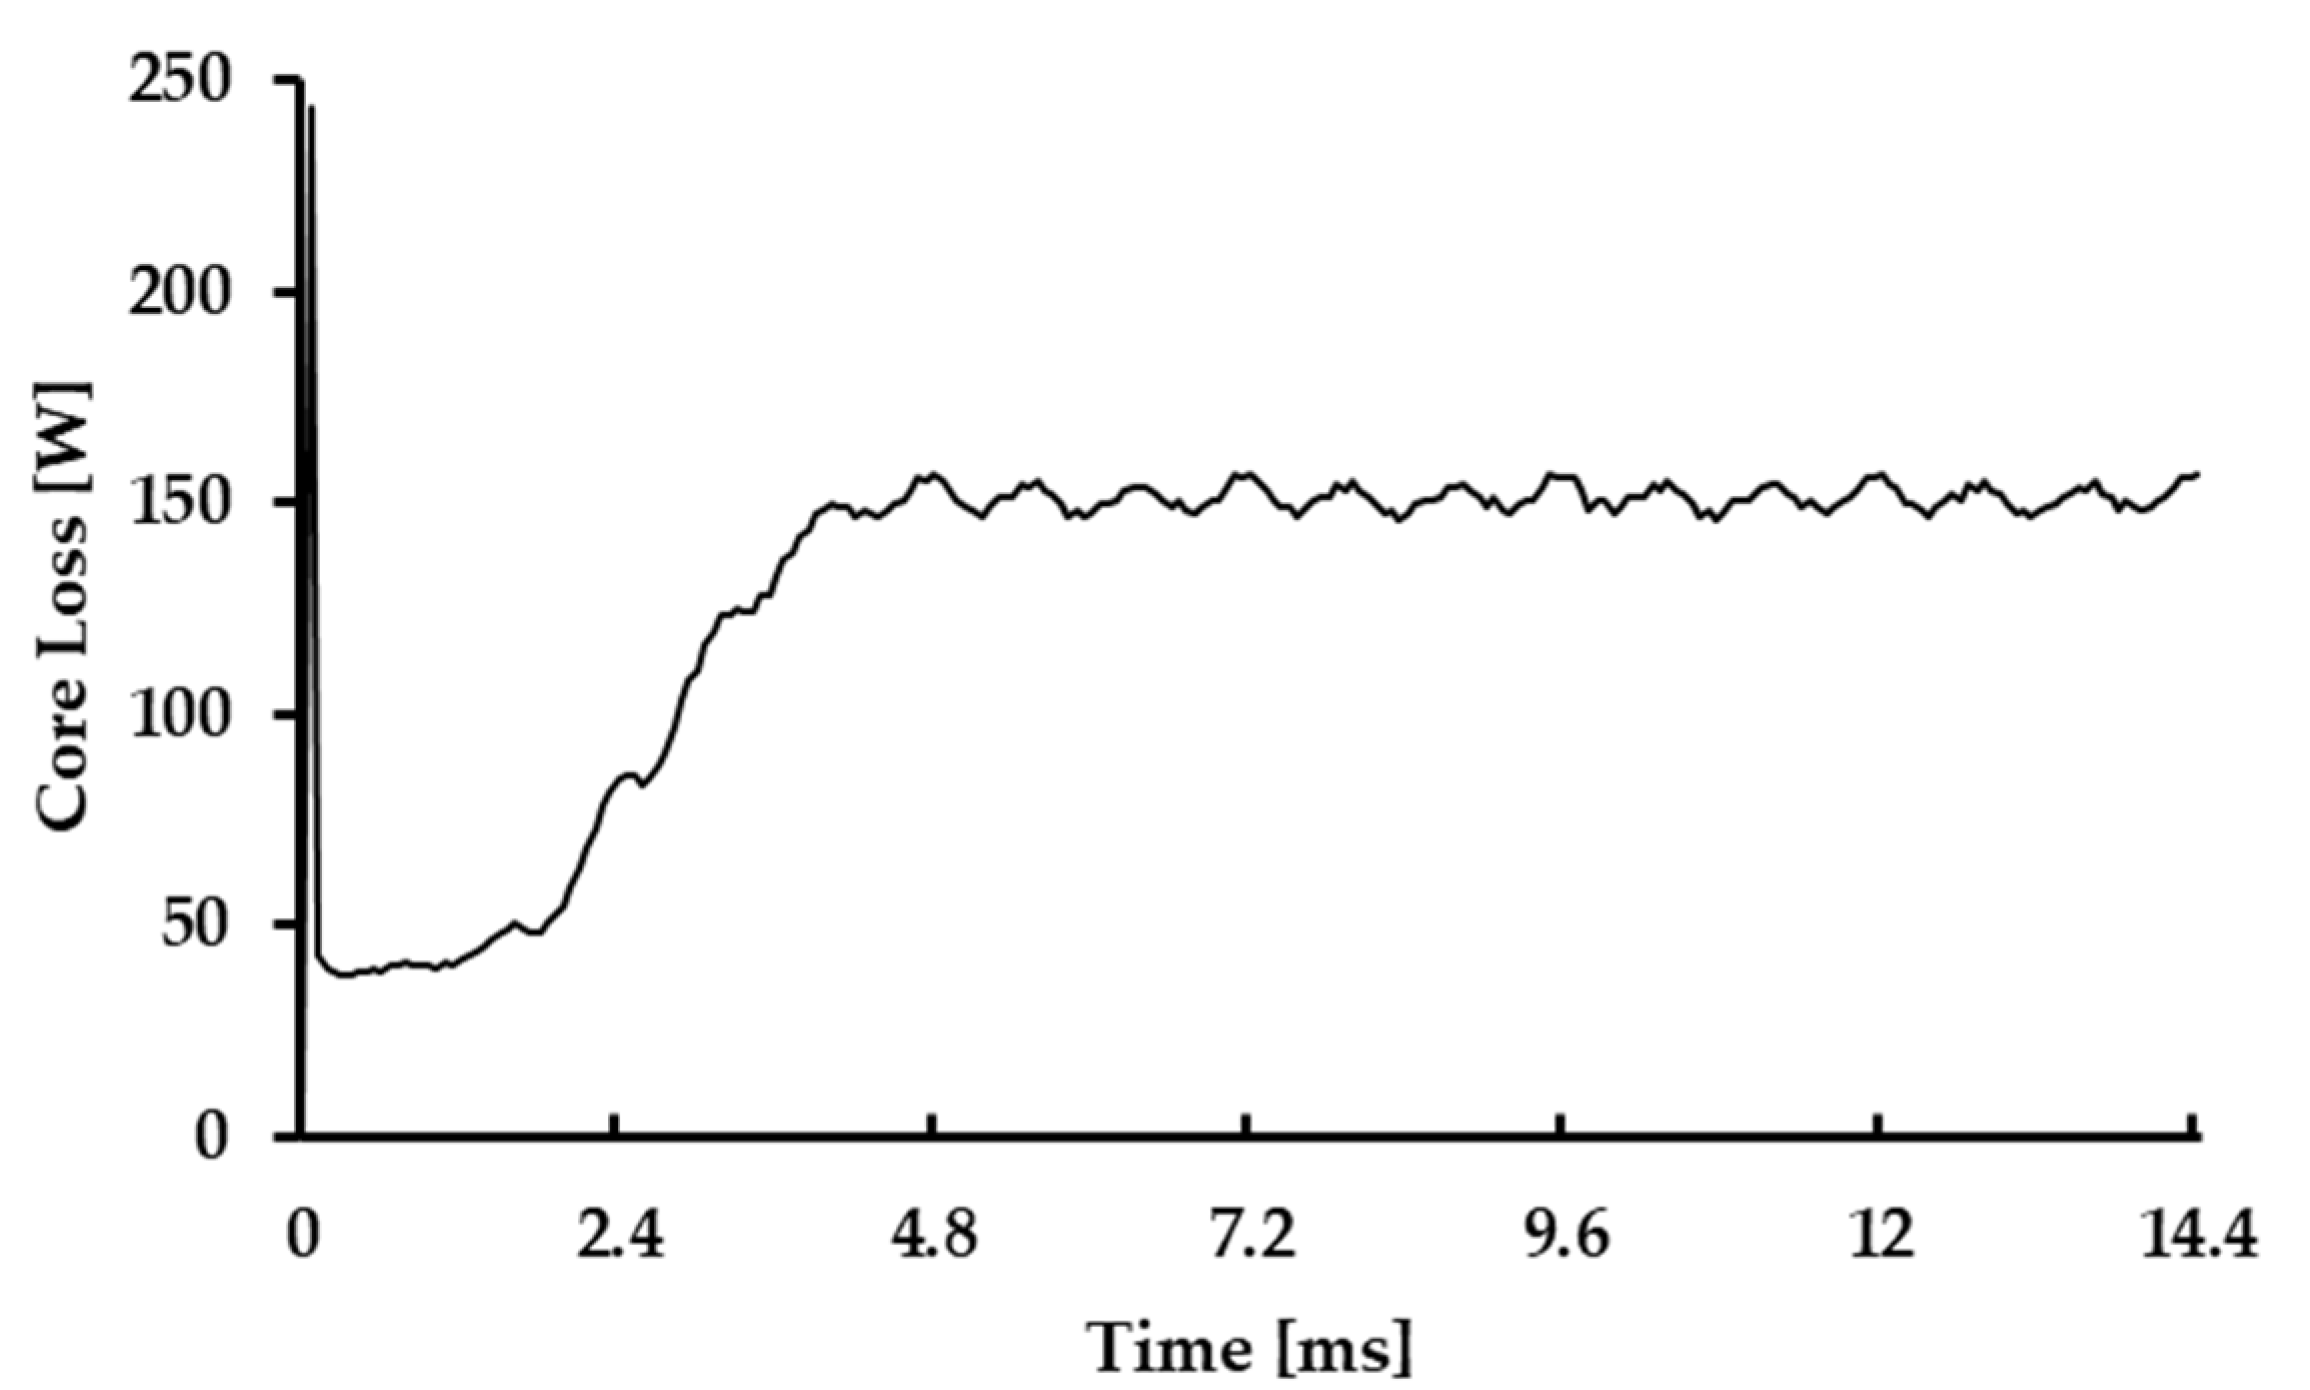
Figure 20 shows the iron loss over time when it was applied to the AFPM-type motor. When the motor started to drive, it exhibited a large iron loss spike. Based on this result, destruction of the insulating layer and the presence of residual lubricant, as described in the microstructure analysis, were inferred because of the increase in frequency and core loss when the motor was being driven.
5. Conclusion
To apply powder for manufacturing the stator core of AFPM-type drive motors, AncorLam HR powder was selected among various SMC materials. By using the mechanical and thermal property data of AncorLam HR powder obtained through prior research, the degree of influence of the process according to the shape of the motor core was analyzed, and a bulk prototype was manufactured by selecting Case 3, which yielded the smallest density and internal stress deviations.
Three bulk prototypes were manufactured using the molding conditions of CPM 7 and 90°, which corresponded to the conditions of Case 3. The average densities and simulated densities of these prototypes showed an error level of 0.54%, thereby confirming the effectiveness of the proposed process. In addition, as an additional reliability verification for the application of AncorLam HR powder to manufacture electric vehicle motor cores, the microstructure of the powder and that of the bulk prototype were measured. The results of SEM measurements at three points of 5 mm, 20 mm, and 25 mm on Sample 2, which had the highest density, indicated that the density trends of the simulation and bulk prototype were consistent, thereby confirming the reliability of the process.
The random orientation of each powder was confirmed through EBSD measurement, and XRD measurement confirmed that the peak of Fe appeared at 44.9°, 65.0°, and 82° in both the powder and bulk prototypes. This confirmed that there was no change in the internal phase structure. The results of EDS analysis through SEM and TEM of AncorLam HR powder and the bulk prototypes confirmed that the phosphorus (P) content was removed from the bulk prototypes that underwent molding after the formation of a phosphate film on each Fe-based powder, thereby confirming the destruction of the insulating layer, an important performance factor for SMCs.
Finally, the average torque in the simulation of the AFPM-type motor prepared from AncorLam HR powder was 34.5 mN·m, and the core loss tended to increase as the frequency increased. In addition, because iron hand spikes were observed during motor startup, it was judged that the optimization of material selection through further research is necessary.
This study confirmed the validity of the material by directly applying and evaluating the commercially available AncorLam HR powder to manufacture electric vehicle motor cores. It provides basic data for improving the performance of AFPM-type motors. A material selection and verification process was proposed. The application of AFPM-type motors needs to be selected and optimized for SMC materials through further research.
Author Contributions
Conceptualization, S.-B.L.; methodology, S.-S.K. and S.-B.L.; validation, S.-S.K. and S.-B.L.; formal analysis, S.-B.L.; investigation, S.-S.K.; software S.-S.K.; data analysis, S.-S.K. and S.-B.L.; data curation, S.-S.K.; writing—original draft preparation, S.-S.K.; writing—review and editing, S.-B.L.; supervision, S.-B.L.; project administration, S.-B.L. All authors have read and agreed to the published version of the manuscript.
Data Availability Statement
Not applicable.
Acknowledgments
This research and APC were funded by “Daegu Metropolitan City 2023 Future Mobility Leading Technology Development Project”.
Conflicts of Interest
The authors declare no conflicts of interest.
References
- Tatsuya S. YE. DA ,Tomoyuk. I ,Tomoyuk. U. YN. and RO. Enhanced Functionality of Soft Magnetic Composites for High-Performance Axial Gap Motors. 2021, 47–52.
- Muthusamy, M.; Pillay, P. Design of an Outer Rotor PMSM with Soft Magnetic Composite Stator Core. 2021 IEEE Energy Convers. Congr. Expo. ECCE 2021 - Proc. 2021, 3987–92. [Google Scholar]
- Zhang, B. Soft Magnetic Composites in Novel Designs of Electrical Traction Machines. (2016).
- Palangar, M.F.; Soong, W.L.; Matheou, C. Advanced Electrical Machines for Electric Vehicle and Aerospace Applications. 2023 IEEE Energy Convers. Congr. Expo. ECCE 2023, 2023, 3984–91. [Google Scholar]
- Ahmed, N.; Atkinson, G.J. A Review of Soft Magnetic Composite Materials and Applications. 2022 Int. Conf. Electr. Mach. ICEM 2022, 2022, 551–7. [Google Scholar]
- Liu, C.; Yang, F.; Wang, S.; Zhang, W.; Wang, Y. Quantitative comparison of low-cost electrical machines with soft magnetic composite and ferrite magnet materials. Int. J. Appl. Electromagn. Mech. 2023, 72, 361–85. [Google Scholar] [CrossRef]
- Chu, S.; Liang, D.; Jia, S.; Liang, Y. Research and Analysis on Design Characteristics of High-Speed Permanent Magnet Claw Pole Motor With Soft Magnetic Composite Cores for Wide Temperature Range. IEEE Trans. Ind. Appl. 2022, 58, 7201–13. [Google Scholar] [CrossRef]
- Saxena, A.; Saxena, K.K.; Jain, V.K.; Rajput, S.K.; Pathak, B.N. A review of reinforcements and process parameters for powder metallurgy-processed metal matrix composites. Mater. Today Proc. 2023. [Google Scholar] [CrossRef]
- Giménez, S.; Echeberria, J.; Castro, F.; de Lardizábal, P.M. DEVELOPMENT OF NANOSTRUCTURED MAGNETIC MATERIALS FOR HIGH FREQUENCY APPLICATIONS THROUGH POWDER METALLURGY, 2007.
- Zhu, J.G.; Lei, G.; Guo, Y.G.; Wang, T.S.; Ma, B. A robust design optimization method for manufacturing SMC-PMSMs and drive systems of six sigma quality. 2017 7th Int. Conf. Power Electron. Syst. Appl. - Smart Mobility, Power Transf. \& Secur. 2017, 1–7. [Google Scholar]
- Iwawaki, T.; Inamori, M.; Morimoto, M. Variation of iron loss by manufacturing method of SMC motor core. 2013 Int. Conf. Electr. Mach. Syst. 2013, 2040–3. [Google Scholar]
- Guo, Y.; Ba, X.; Liu, L.; Lu, H.; Lei, G.; Yin, W.; Zhu, J. A Review of Electric Motors with Soft Magnetic Composite Cores for Electric Drives. Energies 2023, 16. [Google Scholar] [CrossRef]
- Li, J.; Li, Z.; Li, Y.; Ge, J.; Li, Y.; Zeng, L.; Pei, R. Research on the Magnetic Properties of High-Saturation Magnetically Induced Alloy Motors under Magnetocaloric Coupling. Materials (Basel). 2024, 17. [Google Scholar] [CrossRef]
- Wu, S.; Dong, Y.; Li, X.; Gong, M.; Zhao, R.; Gao, W.; Wu, H.; He, A.; Li, J.; Wang, X.; Liu, X. Microstructure and magnetic properties of FeSiCr soft magnetic powder cores with a MgO insulating layer prepared by the sol-gel method. Ceram. Int. 2022, 48, 22237–45. [Google Scholar] [CrossRef]
- Zhonghao, L.; Dong, Y.; Liu, X.; Lu, H.; Wu, Y.; Zhang, R.; Yan, M.; Zhang, H.; Jia, X.; He, A.; Li, J.; Wang, X. Optimizing soft magnetic properties by reducing internal defects and residual stress of Fe85-xSi9.6Al5.4Snx soft magnetic composites. J. Mater. Res. Technol. 2022, 18. [Google Scholar]
- Luo, P.; Yu, H.; Wang, C.; Yuan, H.; Liu, Z.; Wang, Y.; Yang, L.; Wu, W. Properties Optimization of Soft Magnetic Composites Based on the Amorphous Powders with Double Layer Inorganic Coating by Phosphating and Sodium Silicate Treatment. Metals (Basel). 2023, 13. [Google Scholar] [CrossRef]
- Kang, S.; Lee, S. A Study on the Optimal Powder Metallurgy Process to Obtain Suitable Material Properties of Soft Magnetic Composite Materials for Electric Vehicles. Metals (Basel). 2024, 14, 815. [Google Scholar] [CrossRef]
- Tripathi, A.; Ganesh Narayanan, R.; Dixit, U.S. Implementation of Yield Criteria in ABAQUS for Simulations of Deep Drawing: A Review and Preliminary Results, Manufacturing Engineering, (Sharma Vishal S, Dixit Uday S, Sørby Knut, Bhardwaj Arvind, Trehan Rajeev ed.), 2020, Springer Singapore, Singapore, pp.575–88.
- Luo, X.; Liu, Y.; Mo, Z.; Gu, C. Semi-solid Powder Rolling of AA7050 Alloy Strips: Densification and Deformation Behaviors. Metall. Mater. Trans. A 2015, 46, 2185–93. [Google Scholar] [CrossRef]
- Zhang, S.; Chen, X. Deduction of a porosity-dependent yield criterion and its geometrical description for porous materials. Int. J. Mech. Sci. 2014, 89, 58–64. [Google Scholar] [CrossRef]
- Ternero, F.; Rosa, L.G.; Urban, P.; Montes, J.M.; Cuevas, F.G. Influence of the total porosity on the properties of sintered materials—a review. Metals (Basel). 2021, 11. [Google Scholar] [CrossRef]
- Hrairi, M.; Chtourou, H.; Gakwaya, A.; Guillot, M. Modeling the powder compaction process using the finite element method and inverse optimization. Int. J. Adv. Manuf. Technol. 2011, 56, 631–47. [Google Scholar] [CrossRef]
- Singh, S.; Pillay, P. High Torque Density Traction Motor Using Soft Magnetic Composites Material with Surface Ring-type Halbach-array PM Rotor Topology. IECON 2021 – 47th Annu. Conf. IEEE Ind. Electron. Soc. 2021, 1–6. [Google Scholar]
- Yan, A.K.A.; Shuai, F.; Shao, G.; Yuan, W.; Sun, K.; Xiaofeng, L.; Runhua, F. Influence of the annealing process on magnetic performance of iron based soft magnetic composites, 2020.
- Roshandel, E.; Ertugrul, N.; Mahmoudi, A.; Kahourzade, S. Design Optimisation of a High Power Density Electric Machine using Soft Magnetic Composites. 2022 32nd Australas. Univ. Power Eng. Conf. 2022, 1–6. [Google Scholar]
- Jakubas, A.; Jabłoński, P. Measurement and evaluation of the defect size in soft magnetic composites using magnetic field inspections. Energies 2021, 14. [Google Scholar] [CrossRef]
- Patil, S.V.; Saxena, R. Design \& Simulation of Brushless DC Motor Using ANSYS for EV Application. 2022 IEEE Int. Students’ Conf. Electr. Electron. Comput. Sci. 2022, 1–5. [Google Scholar]
Figure 1.
Flow chart of the study.
Figure 1.
Flow chart of the study.
Figure 2.
Strain-stress curve of AncorLam HR.
Figure 2.
Strain-stress curve of AncorLam HR.
Figure 3.
XRD measurement result of AncorLam HR powder.
Figure 3.
XRD measurement result of AncorLam HR powder.
Figure 4.
FIB Specimen Shape.
Figure 4.
FIB Specimen Shape.
Figure 5.
AncorLam HR powder TEM measurement results: (a) cross-section view 1, (b) cross-section view 2, (c) EDS results for view 1 and (d) EDS results for view 2.
Figure 5.
AncorLam HR powder TEM measurement results: (a) cross-section view 1, (b) cross-section view 2, (c) EDS results for view 1 and (d) EDS results for view 2.
Figure 6.
FEA stator core model feature: (a) Upper view and (b) isotropic view.
Figure 6.
FEA stator core model feature: (a) Upper view and (b) isotropic view.
Figure 7.
FEA simulation model feature: (a) initial feature meshing, (b) die, (c) upper and lower punch, and (d) assembly.
Figure 7.
FEA simulation model feature: (a) initial feature meshing, (b) die, (c) upper and lower punch, and (d) assembly.
Figure 8.
AFPM motor shape and dimensions.
Figure 8.
AFPM motor shape and dimensions.
Figure 9.
Relative density results of DOE: Case (a) 1, (b) 2, (c) 3, (d) 4, (e) 5, (f) 6, (g) 7, (h) 8, and (i) 9.
Figure 9.
Relative density results of DOE: Case (a) 1, (b) 2, (c) 3, (d) 4, (e) 5, (f) 6, (g) 7, (h) 8, and (i) 9.
Figure 10.
Effective stress results of DOE: Case (a) 1, (b) 2, (c) 3, (d) 4, (e) 5, (f) 6, (g) 7, (h) 8, (i) and 9.
Figure 10.
Effective stress results of DOE: Case (a) 1, (b) 2, (c) 3, (d) 4, (e) 5, (f) 6, (g) 7, (h) 8, (i) and 9.
Figure 11.
Mean stress results of DOE: Case (a) 1, (b) 2, (c) 3, (d) 4, (e) 5, (f) 6, (g) 7, (h) 8, and (i) 9.
Figure 11.
Mean stress results of DOE: Case (a) 1, (b) 2, (c) 3, (d) 4, (e) 5, (f) 6, (g) 7, (h) 8, and (i) 9.
Figure 12.
Shape of specimen for density measurement: (a) specimen 1, (b) specimen 2 and (c) specimen 3.
Figure 12.
Shape of specimen for density measurement: (a) specimen 1, (b) specimen 2 and (c) specimen 3.
Figure 13.
(a) Relative density at three height points of the motor stator core, (b) SEM of upper point, (c) SEM of middle point, (d) SEM of lower point.
Figure 13.
(a) Relative density at three height points of the motor stator core, (b) SEM of upper point, (c) SEM of middle point, (d) SEM of lower point.
Figure 14.
(a) SEM of upper point, (b) Fe results among EDS results, (c) Si results among EDS results, (d) Cr results among EDS results and (e) Mo results among EDS results.
Figure 14.
(a) SEM of upper point, (b) Fe results among EDS results, (c) Si results among EDS results, (d) Cr results among EDS results and (e) Mo results among EDS results.
Figure 15.
(a) SEM upper point, (b) EBSD result of IPF and (c) EBSD result of Phases.
Figure 15.
(a) SEM upper point, (b) EBSD result of IPF and (c) EBSD result of Phases.
Figure 16.
XRD measurement result of AncorLam HR bulk prototype.
Figure 16.
XRD measurement result of AncorLam HR bulk prototype.
Figure 17.
(a) AncorLam HR bulk prototype TEM measurement results: (b) Fe results among EDS results, (c) O results among EDS results and (d) Zn results among EDS results.
Figure 17.
(a) AncorLam HR bulk prototype TEM measurement results: (b) Fe results among EDS results, (c) O results among EDS results and (d) Zn results among EDS results.
Figure 18.
Torque result over time.
Figure 18.
Torque result over time.
Figure 19.
Core loss result with frequency.
Figure 19.
Core loss result with frequency.
Figure 20.
Core loss results over time.
Figure 20.
Core loss results over time.
Table 1.
Thermal conductivity of AncorLam HR.
Table 1.
Thermal conductivity of AncorLam HR.
Temperature
(°C) |
Thermal diffusivity
(mm2/s) |
Specific heat
(J/gK) |
Thermal
conductivity
(W/mK) |
| 25 |
11.822 |
0.452 |
26.7 |
| 100 |
10.328 |
0.498 |
25.7 |
| 200 |
8.698 |
0.546 |
23.7 |
| 300 |
7.354 |
0.560 |
20.6 |
| 400 |
6.156 |
0.580 |
17.8 |
| 500 |
5.065 |
0.640 |
16.2 |
Table 2.
Thermal expansion coefficient of AncorLam HR.
Table 2.
Thermal expansion coefficient of AncorLam HR.
| Temperature (°C) |
Coefficient of thermal expansion (1e-6/K) |
| 100 |
13.554 |
| 200 |
13.639 |
| 300 |
14.095 |
| 400 |
14.436 |
| 500 |
14.719 |
Table 3.
Boundary conditions of design of simulation.
Table 3.
Boundary conditions of design of simulation.
| Title 1 |
Apparent Density [] |
Initial Relative
Density |
Powder Loading Height[mm] |
| AncorLam HR |
2.94 |
0.3774 |
69.22 |
Table 4.
Design of control factor and level.
Table 4.
Design of control factor and level.
| Factor |
Description |
Level |
| 1 |
2 |
3 |
| A |
SPM [stroke/min] |
7 |
10 |
13 |
| B |
Molding Temperature [°C] |
RT |
55 |
90 |
Table 5.
L9(32) orthogonal array.
Table 5.
L9(32) orthogonal array.
| Simulation no. |
A |
B |
| 1 |
7 |
RT |
| 2 |
7 |
55 |
| 3 |
7 |
90 |
| 4 |
10 |
RT |
| 5 |
10 |
55 |
| 6 |
10 |
90 |
| 7 |
13 |
RT |
| 8 |
13 |
55 |
| 9 |
13 |
90 |
Table 6.
Results for each case according to DOE.
Table 6.
Results for each case according to DOE.
Simulation
no. |
Maximum relative
density |
Minimum relative
density |
Maximum–
Minimum
relative density |
Maximum–
Minimum
Effective stress
[MPa] |
Average
Effective stress
[MPa] |
Average
Mean stress
[MPa] |
| 1 |
0.917 |
0.974 |
0.057 |
38.0 |
219.5 |
-370.292 |
| 2 |
0.917 |
0.976 |
0.059 |
37.7 |
208.5 |
-350.945 |
| 3 |
0.917 |
0.975 |
0.058 |
36.3 |
197.7 |
-331.272 |
| 4 |
0.916 |
0.976 |
0.061 |
43.6 |
215.9 |
-360.552 |
| 5 |
0.918 |
0.975 |
0.056 |
39.4 |
205.1 |
-344.611 |
| 6 |
0.915 |
0.972 |
0.058 |
36.6 |
194.4 |
-324.942 |
| 7 |
0.913 |
0.973 |
0.060 |
42.4 |
212.8 |
-359.962 |
| 8 |
0.914 |
0.974 |
0.059 |
43.6 |
202.3 |
-341.594 |
| 9 |
0.916 |
0.972 |
0.058 |
38.9 |
191.7 |
-322.368 |
Table 7.
Linear dimensions and density measurement results of density specimens.
Table 7.
Linear dimensions and density measurement results of density specimens.
| Linear Dimension |
Specimen 1 |
Specimen 2 |
Specimen 3 |
| Weight[g] |
100.374 |
100.516 |
100.492 |
| Height [mm] |
27.504 |
27.528 |
27.557 |
| Volume [] |
13.636 |
13.648 |
13.663 |
| Density [] |
7.361 |
7.365 |
7.355 |
Table 8.
Chemical composition of bulk prototype.
Table 8.
Chemical composition of bulk prototype.
| Element |
Fe |
Si |
Cr |
Mo |
Sum |
| Wt.% |
99.69 |
0.12 |
0.06 |
0.13 |
100 |
|
Disclaimer/Publisher’s Note: The statements, opinions and data contained in all publications are solely those of the individual author(s) and contributor(s) and not of MDPI and/or the editor(s). MDPI and/or the editor(s) disclaim responsibility for any injury to people or property resulting from any ideas, methods, instructions or products referred to in the content. |
© 2024 by the authors. Licensee MDPI, Basel, Switzerland. This article is an open access article distributed under the terms and conditions of the Creative Commons Attribution (CC BY) license (http://creativecommons.org/licenses/by/4.0/).
