1. Introduction
The Mongolian oak, scientifically designated as
Quercus mongolica Fisch.ex Ledeb., belongs to the Fagaceae family and the Quercus genus. Predominantly found in northern and northeastern China, it stands as a pivotal secondary tree species in the Northeastern forest area. Acclimated to warm and humid conditions, the Mongolian oak exhibits resilience to a moderate level of cold and drought, thus claiming the title of the northernmost and most resilient Quercus species in China [
1]. Boasting a robust root system and remarkable environmental adaptability, it significantly contributes to soil and water conservation, as well as wind and fire prevention [
2]. Furthermore, its sturdy and corrosion-resistant wood finds diverse applications in the manufacture of vehicles, ships, buildings, pit wood, and other materials, rendering it a highly valuable economic resource [
3].
Since the 20th century, the industrial boom has led to a significant increase in greenhouse gas emissions and global temperatures. Consequently, China's climate and environment have undergone marked transformations, with a slightly higher rate of change than the global average during the same period [
4]. This climate change is known to disrupt the delicate water-temperature balance in ecosystems, thereby posing challenges to plant survival and distribution. By delving into how species have responded to climate change in the past and how they might in the future, we can gain a deeper understanding of the factors shaping species evolution and geographical dispersal. This knowledge, in turn, aids in formulating scientifically grounded strategies for managing germplasm resources.
A species distribution model (SDM) forecasts the potential range of a species in a given area by mapping its ecological requirements to specific future climatic conditions [
5,
6,
7]. With technological advancements in computers and statistics, numerous SDMs have been devised and implemented. The most prevalent models are: the Maximum Entropy Model (MaxEnt) [
8], Random Forest (RF) [
9], Artificial Neural Network (ANN) [
10], Generalized Linear Model (GLM), Generalized Additive Model (GAM) [
11], Multiple Adaptive Regression Splines (MARS) [
12], Flexible Discriminant Analysis (FDA) [
13], Classification Tree Analysis (CTA) [
14], Surface Range Envelope Model (SRE) [
15], and Gradient Boosting Machines (GBM) [
16]. Each of these models operates under different principles and algorithms, and the choice of model often depends on the specific research objectives [
17]. To address the limitations of a single model, researchers are increasingly developing ensemble models. One such platform is Biomod2, built on the R language. It enhances the predictive accuracy of species distributions by assigning optimal weights to individual models within the ensemble, thus achieving a superior simulation effect [
18,
19,
20,
21,
22,
23,
24].
Currently, the research on how
Q. mongolica responds to climate change is predominantly localized, and investigations into its radial growth's response to climate variations have primarily been confined to analogous plant species [
25]. While numerous studies have explored the impacts of rising temperatures and extended daylight hours on the key phenological stages of
Q. mongolica in Northeast China through climate chamber simulations [
26], there's a paucity of research examining how climate change impacts its geographic range. Thus, this study aims to (1) forecast alterations in suitable habitats under varying climate scenarios, (2) identify key environmental factors that shape its distribution, and (3) analyze shifts in its ecological niches under diverse future climatic conditions. This will serve as a valuable resource for the conservation and sustainable management of
Q. mongolica populations.
2. Materials and Methods
2.1. Study Area
The Northeast region of China, encompassing latitudes 38°72'to53°56'N and longitudes 115°52' to 135°09'E, is situated in the northeastern part of the mainland. It comprises the administrative territories of Heilongjiang, Jilin, and Liaoning provinces, as well as the eastern section of the Inner Mongolia Autonomous Region, particularly Hulunbuir City, Xing'an League, Tongliao City, and Chifeng City. Collectively, these areas span a vast expanse of approximately 125 x 104 km2. Enclosed by mountains on three sides, the region's topographical makeup is distinct. The western border is marked by the Great Xing'an Mountains, while the Xiaoxing'an Mountains form the northern perimeter. The Changbai Mountains define the southern edge, and from northeast to southwest lie the Sanjiang Plain, Songnen Plain, and Liaohe Plain in the center.
Geographically, the Northeast traverses the middle temperate zone to the cold temperate zone, resulting in a temperate continental monsoon climate. This climate is characterized by four distinct seasons, with rainfall and warmth occurring simultaneously. Winter and summer temperatures vary significantly, with winter temperatures dipping to 40 °C. Topographically, the region slopes from high in the east to low in the west, spanning from humid to semi-humid and semi-arid zones as one travels from southeast to northwest. Annual precipitation gradually declines from 1000mm to below 300mm. Being the largest natural forest distribution area in China, this region boasts a diverse array of vegetation types, including temperate coniferous and broad-leaved mixed forests, cold temperate coniferous forests, warm temperate deciduous broad-leaved forests, and temperate grasslands.
2.2. Collection and Screening of Distribution Data
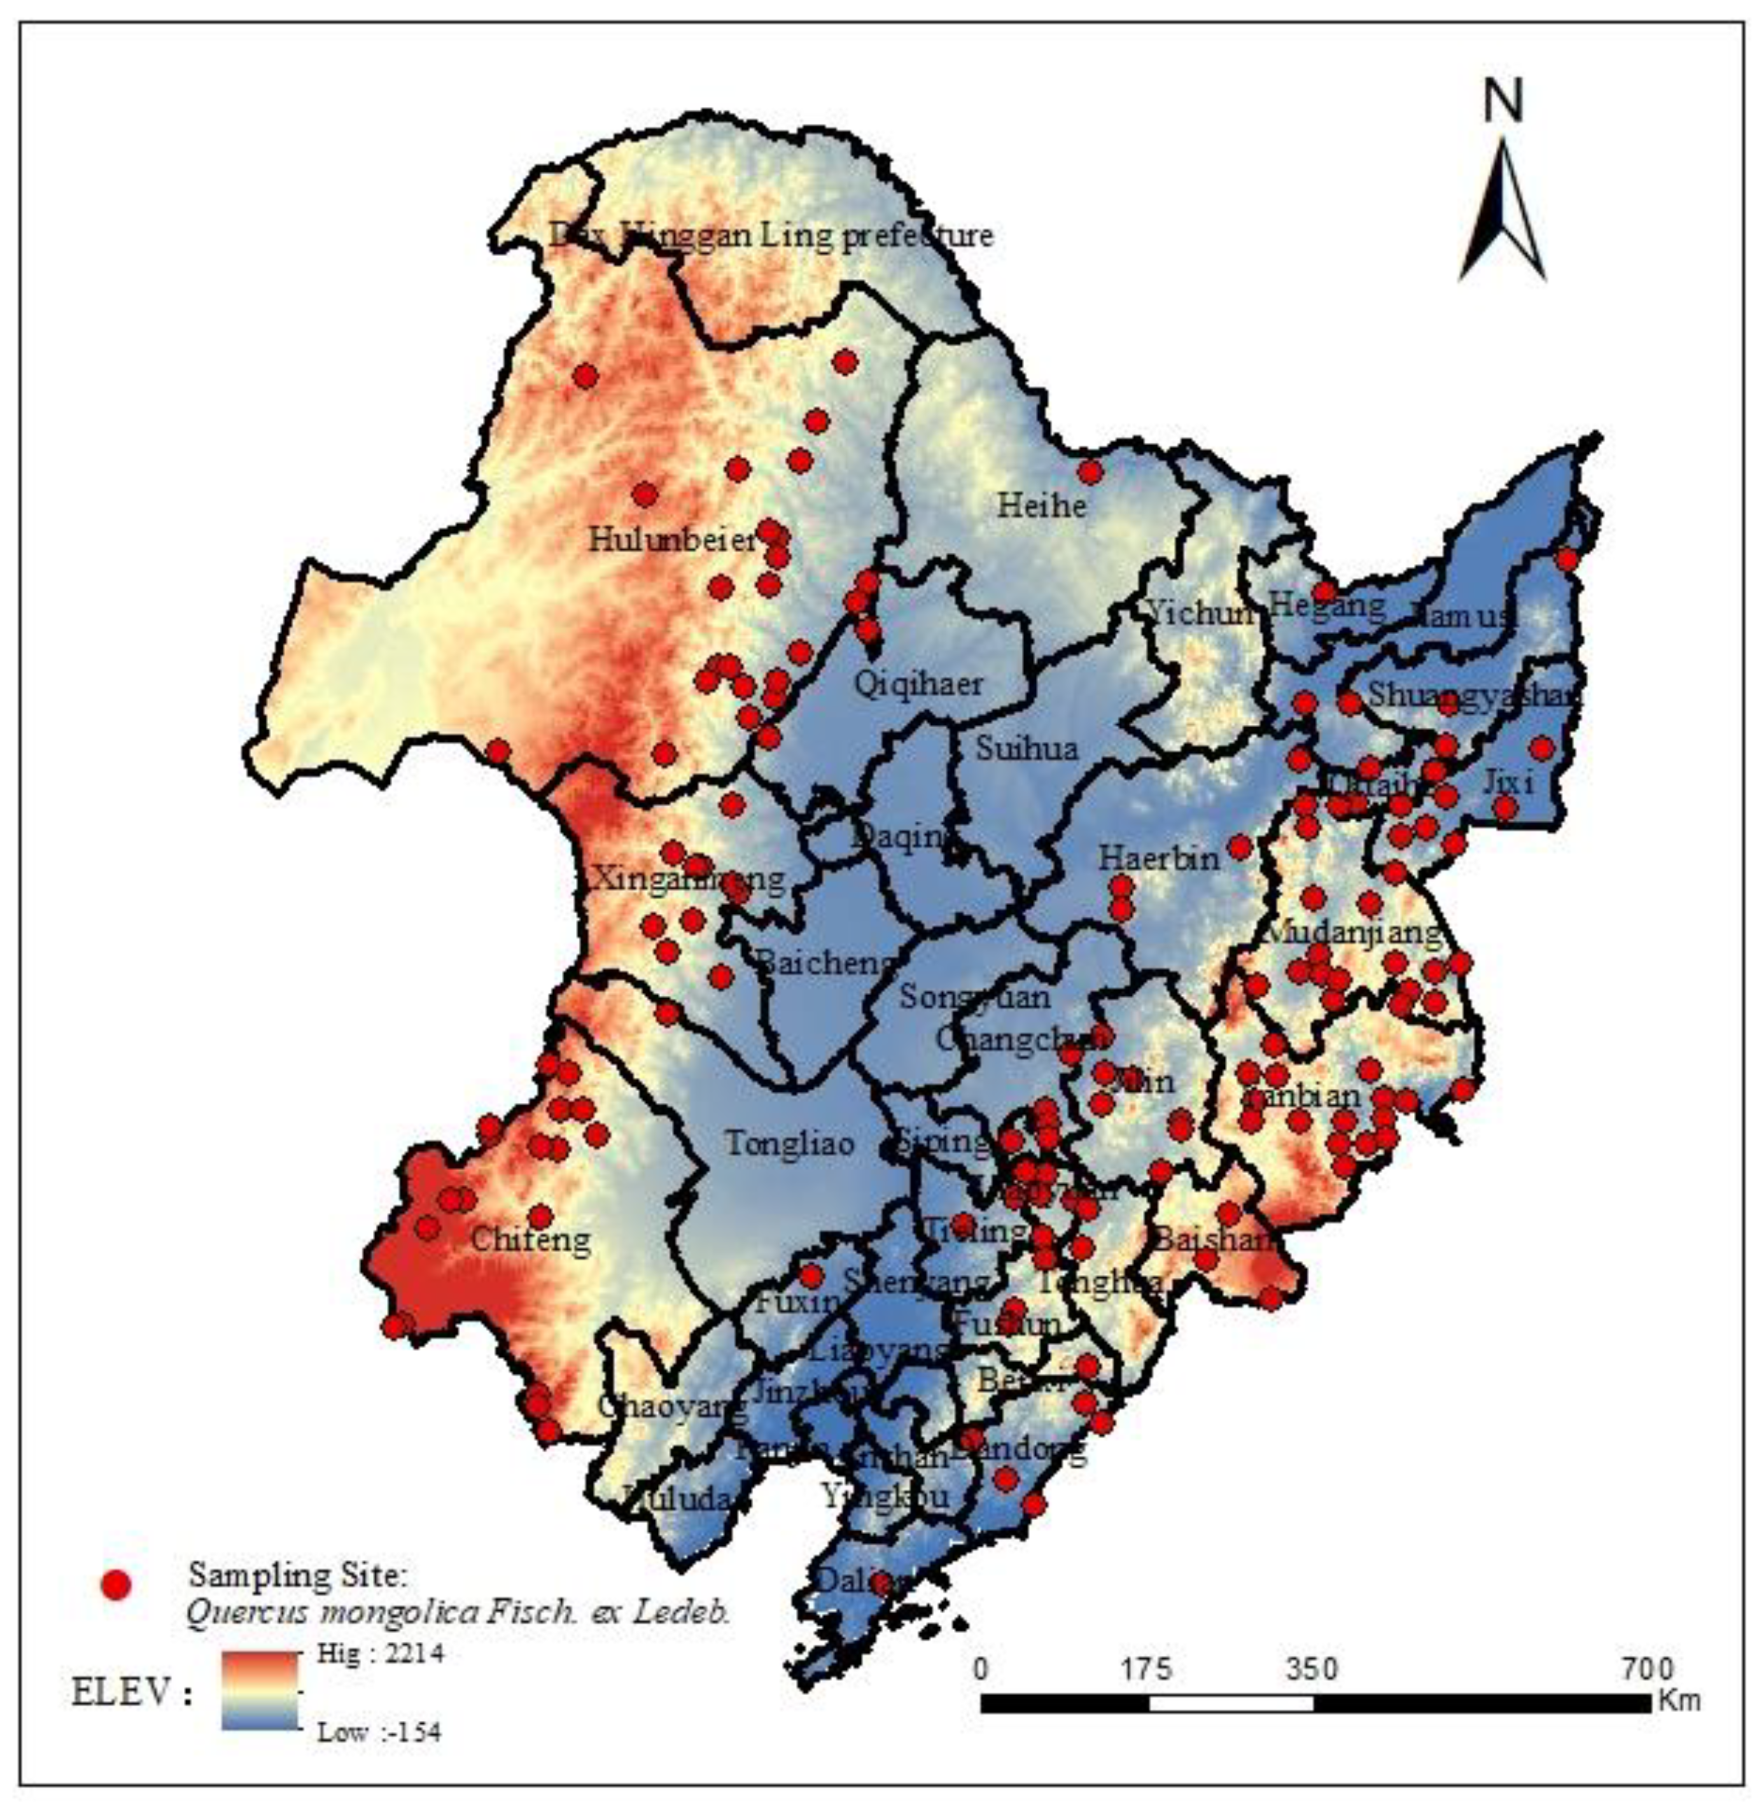
During the field investigation conducted between 2017 and 2021, we leveraged the data from the China Digital Herbarium (CVH), the National Herbarium of China (NSII), the Global Biodiversity Information Network Platform (GBIF), and other relevant public sources. This comprehensive effort resulted in the collection of 174 sample points for
Q. mongolica. Following rigorous screening procedures, 144 valid sample points were ultimately selected for modeling purposes (as illustrated in
Figure 1). Notably, the latitude information was systematically stored in Excel 2019 in the convenient .csv format.
2.3. Acquisition and Processing of Environment Variables
In this research, a total of 14 topsoil data points, 1 topographic data point, and 19 bioclimatic factors were chosen as potential environmental variables for modeling. The soil and topographic data originate from the World Soil Database (
www.fao.org), while the bioclimatic factors are sourced from the World Climate Database (
www.worldclim.org). Utilizing the BCC-CSM2-MR global climate model, we selected three climate scenarios: SSP126, SSP245, and SSP585, for two distinct periods: 2022-2060 (2050s) and 2061-2100 (2090s). The map data is a Chinese standard map, procured from the standard map service website (
http://www.mnr.gov.cn/) of the National Administration of Surveying, Mapping, and Geoinformation, with a drawing review number of GS (2019) No. 1698.
To ensure the integrity and reliability of the data, we conducted a variance inflation factor (VIF) test and a Pearson correlation test on each environmental factor using the usdm package in R 4.2.0 software. Based on the criteria of VIF < 10 and r < 0.8 [
27,
28], we narrowed down the variables to 9 soil factors, 7 climatic factors, and 1 topographic factor for subsequent modeling (as outlined in
Table A1).
2.4. Model Building and Testing
In this study, eight diverse modeling techniques were utilized, specifically: Gradient Boosting Regression Tree (GBM), Generalized Linear Model (GLM), Classification and Regression Trees (CART), Maximum Entropy Modeling (MaxEnt), Surface Range Envelope (SRE), Random Forest (RF), Flexible Discriminant Analysis (FDA), and Artificial Neural Network (ANN). Among these, the MaxEnt model was configured with a modulation frequency doubling parameter (RM) of 0.5 and a feature combination of LQ, while the remaining seven models adhered to the default model parameters provided by Biomod2. For model development, 75% of the distribution point data was randomly sampled to constitute the training dataset, reserving the remaining 25% for testing. Additionally, 500 pseudo-absence points were randomly generated to enhance the modeling process, fulfilling the Biomod2 modeling prerequisites and simulating real-world distribution patterns more accurately.
To assess the predictive accuracy of each individual model, we employed receiver operating characteristic curves (ROCs) and true skill statistics (TSS) [
29,
30]. Specifically, the area under the ROC curve (AUC) was utilized as a metric, ranging from 0.5 to 1, with higher values indicating superior predictive performance. An AUC value exceeding 0.8 signifies excellent or very good prediction accuracy [
31], while values below 0.7 indicate poor performance. Based on the AUC and TSS scores, the five models with the highest values were selected for ensemble modeling. The weight assigned to each model in the ensemble was determined proportionally to its TSS evaluation score.
2.5. Niche Change Analysis
Utilizing the "ecospat" software package, we calculated the overlap rate between the current and future niche of
Q. mongolica across various climatic backgrounds, drawing upon climatic data from distribution points. The visualization of these ecological niche changes was achieved, as detailed in Guo et al. [
32]. Presently, the selection area for background points of
Q. mongolica is defined by the distribution points and a buffer distance of 1 degree. The ensemble model's predicted suitable area serves as the backdrop for future background point selection across varying climatic settings. The overlap index D quantifies the extent of niche overlap between species. Specifically, a D value of 0 signifies no overlap, while a D of 1 indicates complete overlap, as elucidated in Zheng et al. [
33].
2.6. Data Analysis and Processing
Based on the suitability thresholds derived from the combined model, the habitat suitability of Q. mongolica was categorized into four grades: highly suitable (1-0.5), generally suitable (0.5-0.3), less suitable (0.3-0.1), and non-suitable (0.1-0). Utilizing the ArcGIS 10.4.1 software, we mapped the future spatial distribution patterns of Q. mongolica under varying climate change scenarios, tracking the geospatial changes in suitable and non-suitable areas across different time periods. This allowed us to calculate the corresponding area changes. Additionally, we marked the centroid positions of Mongolian oak's suitable habitat during two time periods under diverse climatic backgrounds, determined the centroid migration direction, and calculated the centroid migration distance employing Matlab 2016 software.
3. Results
3.1. Model Accuracy Evaluation
The prediction accuracy of the eight selected single models is depicted in
Figure 2. Amongst these, the Random Forest (RF) model stands out as the superior model with the best predictive capability, exhibiting an exceptionally high AUC value of 0.961 and a TSS value of 0.872. Conversely, the Maximum Entropy (MaxEnt) model performs the worst, with a significantly lower AUC value of 0.776 and a TSS value of just 0.538, indicating a considerable simulation error in predicting the distribution of suitable areas for
Q. mongolica. When compared to the single models, the combined model (ENSEMBLE), which is based on the five optimal single models (RF, GBM, FDA, GLM, ANN), demonstrates a significant improvement in prediction accuracy. Specifically, it boasts an AUC value of 0.985 and a TSS value of 0.936. This clearly illustrates that the combined model is able to effectively reduce the uncertainty arising from the individual models' deficiencies and thereby enhance the accuracy in predicting the suitable area for
Q. mongolica.
3.2. Environmental Factor Analysis
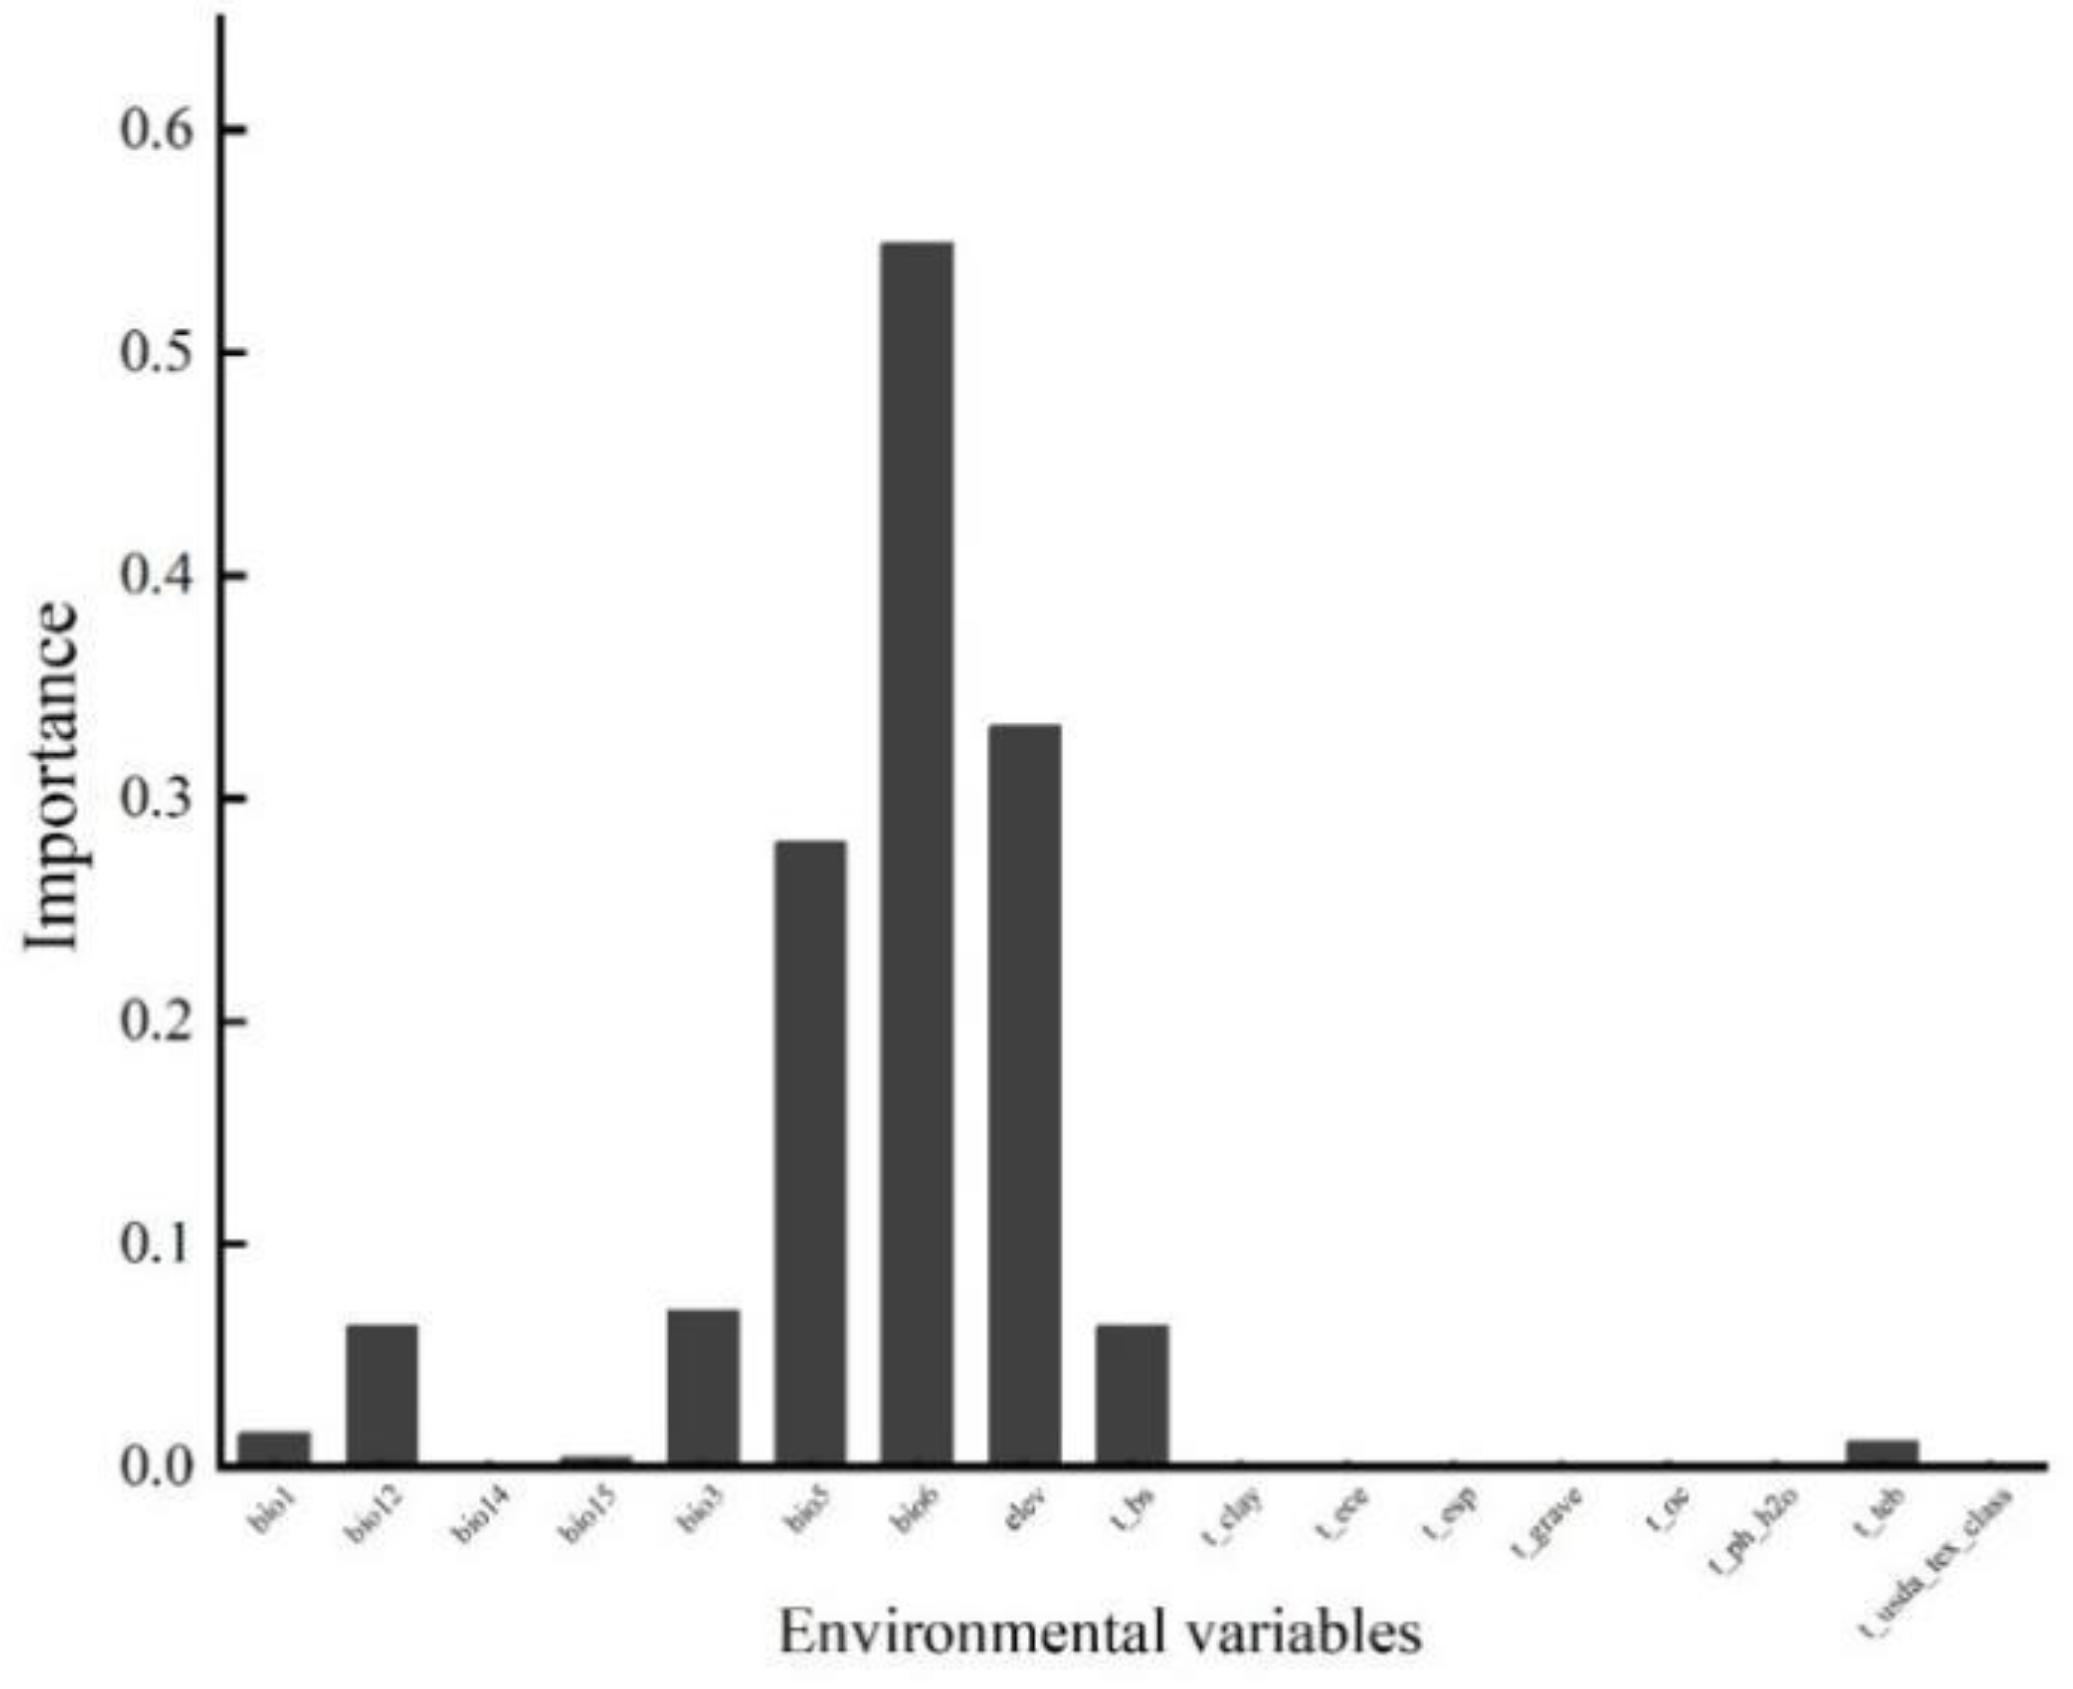
As depicted in
Figure A1, the chosen environmental variables accounted for over 20% of the potential geographical spread of
Q. mongolica. Notably, the minimum temperature during the coldest month (Bio6), altitude (Elev), and the maximum temperature in the hottest month (Bio5) contributed significantly, with a combined influence rate of 83.7%. These were the primary environmental determinants shaping the distribution of
Q. mongolica.
Figure 3 illustrates the response curves of
Q. mongolica to the key environmental factors: Bio6, Elev, and Bio5. The response curves for the habitat suitability of
Q. mongolica to the maximum temperature in the hottest month (Bio6) and the minimum temperature in the coldest month (Bio5) exhibit an "inverted V" pattern, indicating a downward trend with increasing altitude. It is generally acknowledged that the range of environmental factors corresponding to a suitability score of ≥0.5 serves as the threshold for the suitable distribution of a species. Based on these response curves,
Q. mongolica is most suited to regions with a coldest month minimum temperature ranging from -31 °C to 15 °C, a hottest month maximum temperature between 21 and 30 °C, and an altitude not exceeding 1500 meters above sea level.
3.3. The Current Geographical Distribution of Q. mongolica in China
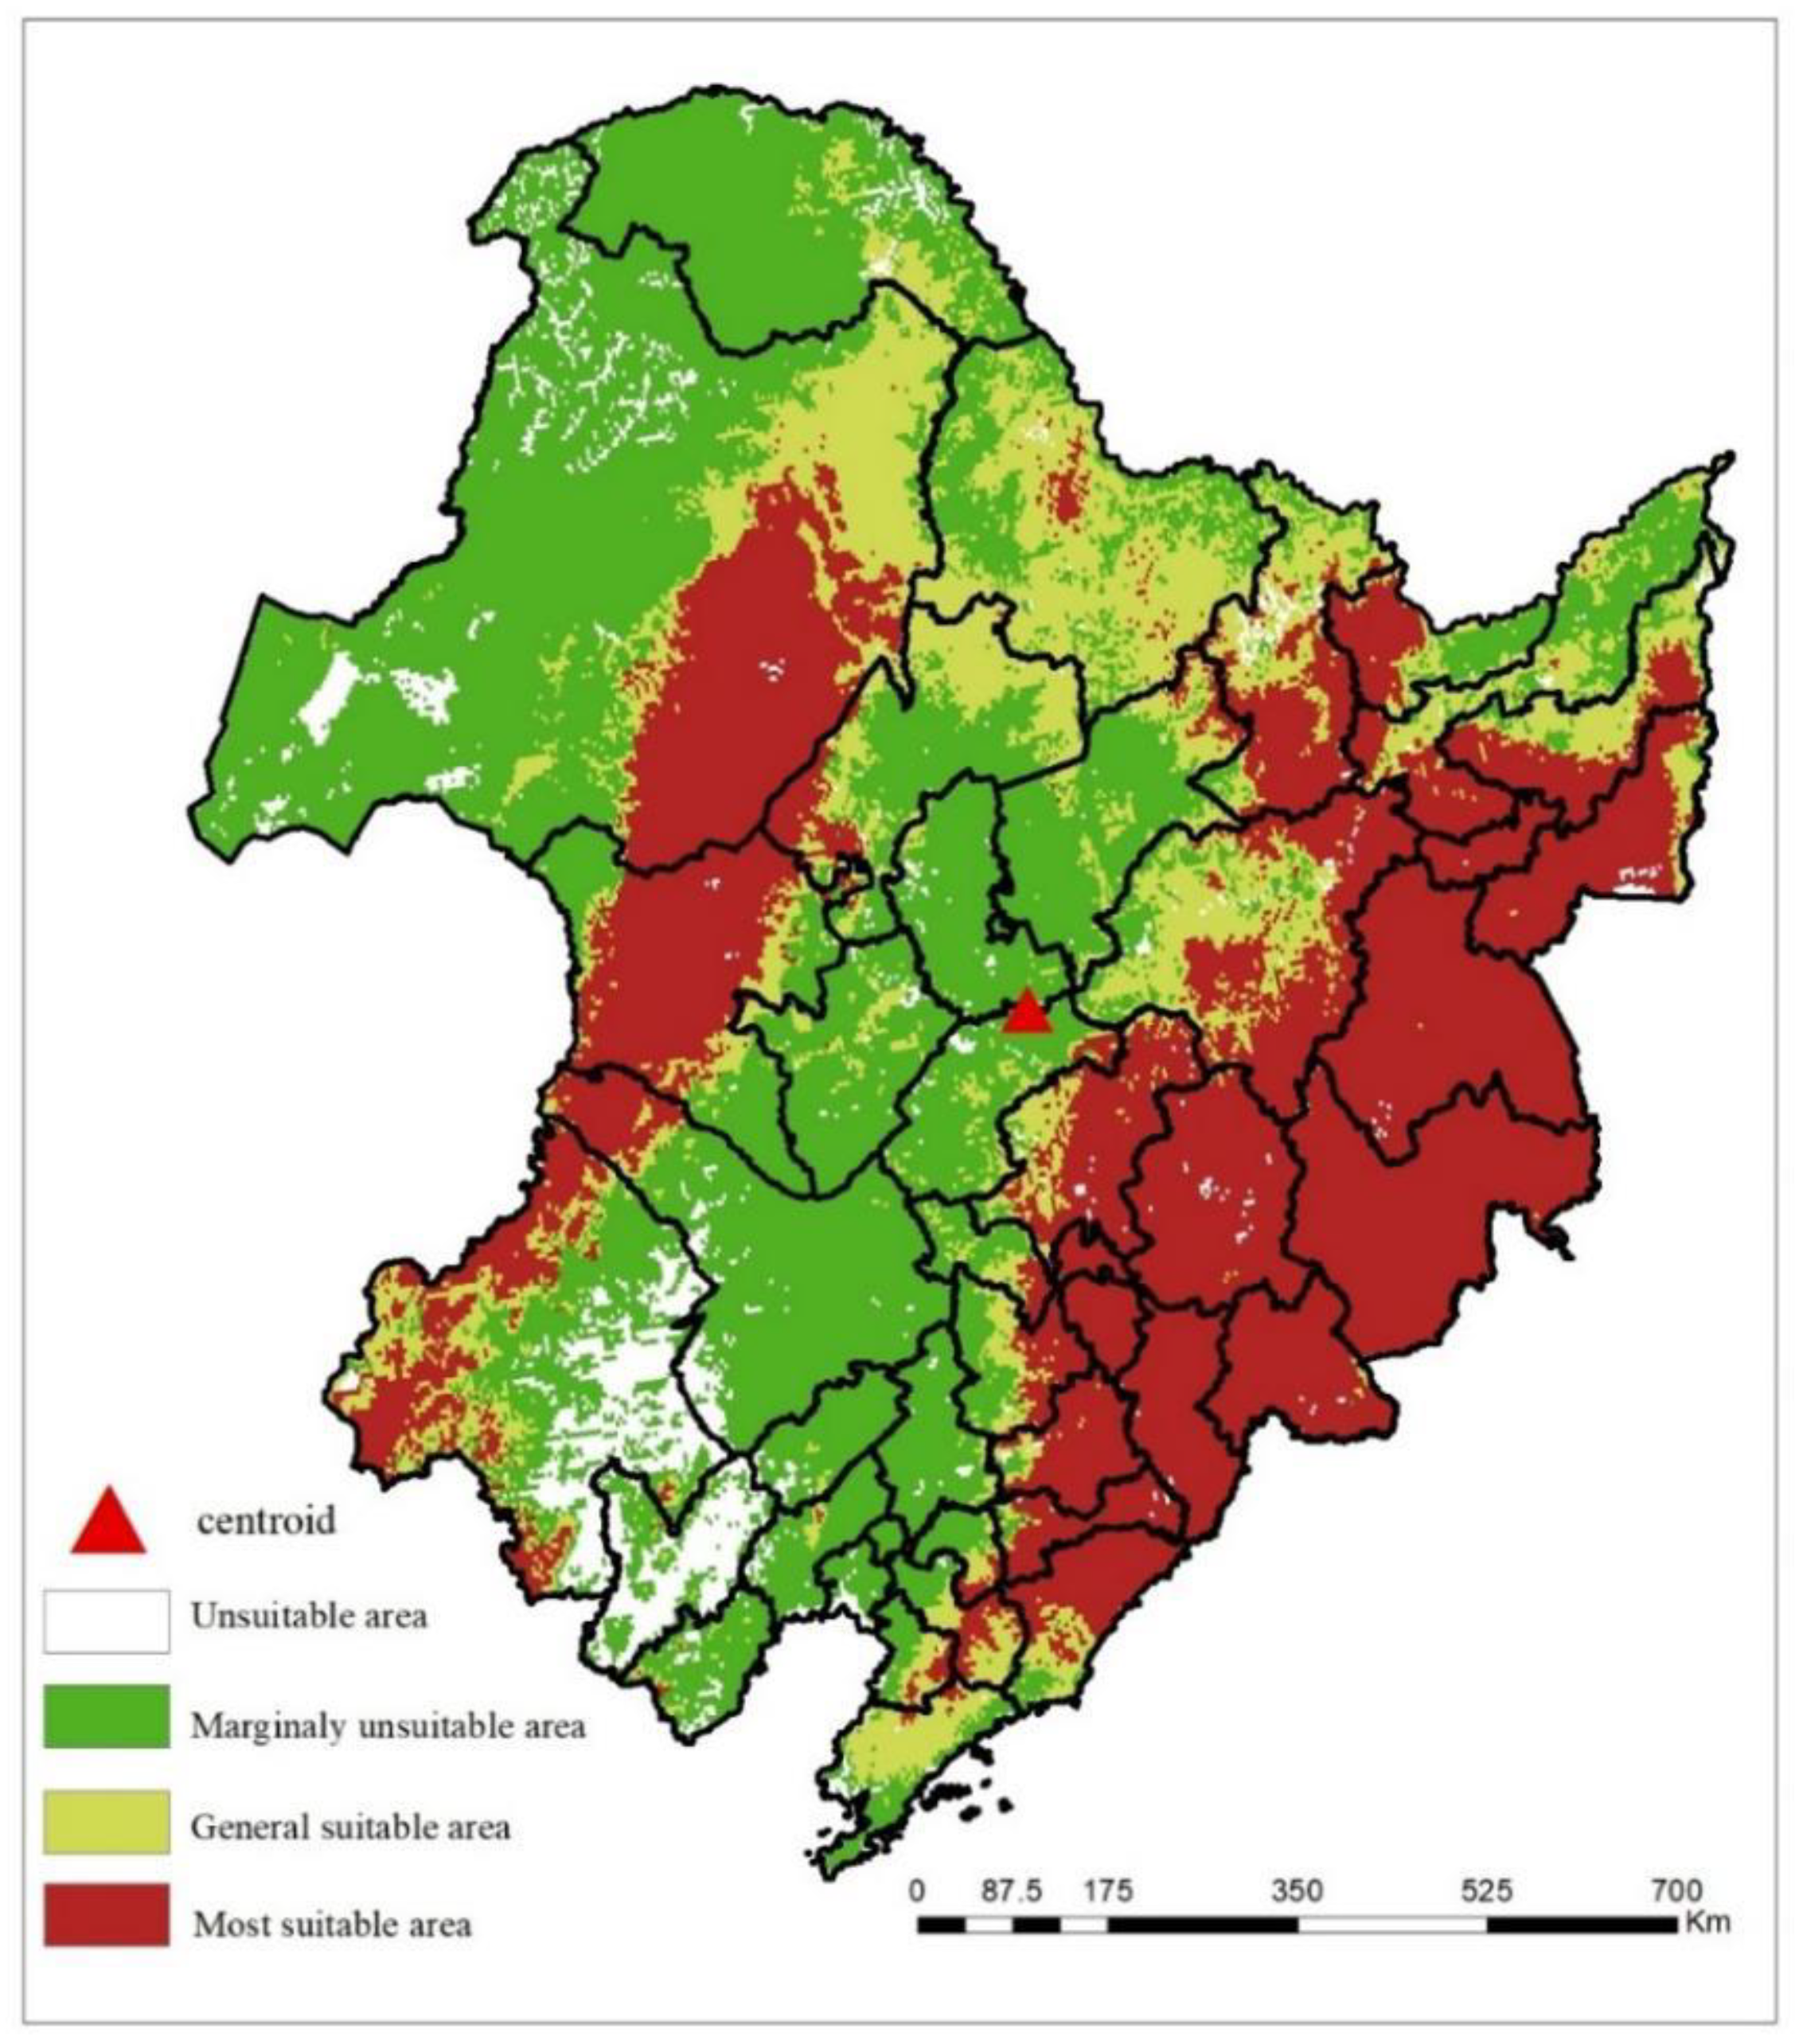
Given the current climate change scenario, the extent of the suitable habitat (encompassing highly and generally suitable areas) for
Q. mongolica spans 74,994.792 km
2 (depicted in
Figure 4). Of this, the area of highly suitable habitat constitutes 47,378.472 km
2. The potential highly suitable regions for
Q. mongolica are primarily divided into two distinct regions. The western regions are concentrated in the southeast of Hulunbuir, the central Xing'an League, the northwest of Tongliao, and the northwest of Chifeng in Inner Mongolia. Conversely, the eastern regions are predominantly found in coastal cities like Dandong, Benxi, Tonghua, Baishan, Jilin, Yanbian Korean Autonomous Prefecture, and Mudanjiang. In summary, the centroid of the entire suitable habitat is situated in Zhaoyuan County, Daqing City, Heilongjiang Province.
3.4. Prediction of the Suitable Area of Q. mongolica in the Future
As depicted in
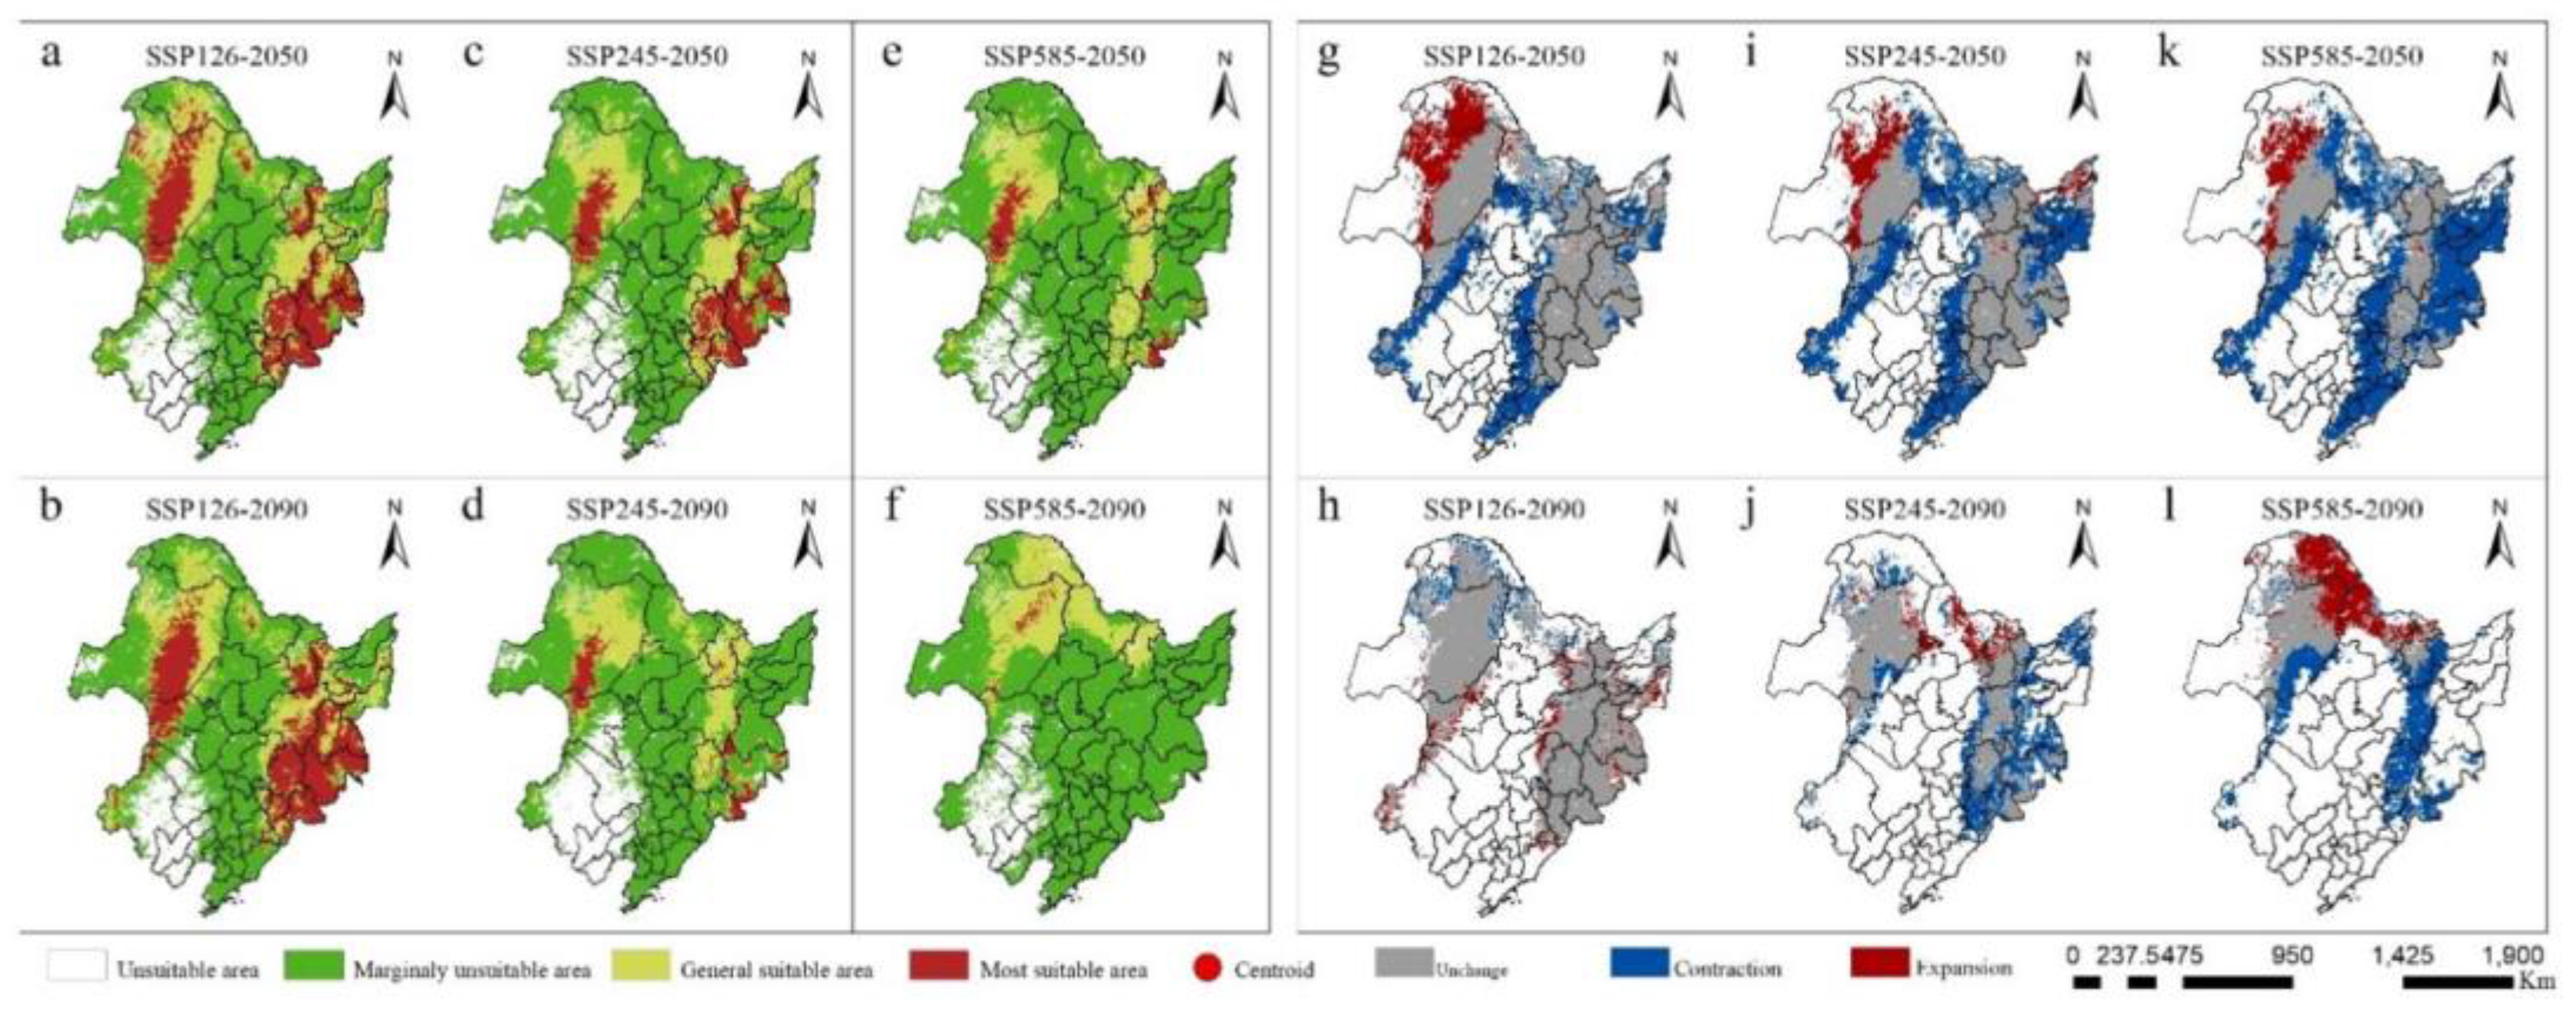
Figure 5, the anticipated spatial distribution of potential and total suitable habitats for
Q. mongolica in China at various future timeframes is presented. When compared to the current extent of
Q. mongolica, its total suitable area is anticipated to undergo varying degrees of decline under the SSP126, SSP245, and SSP585 climate scenarios for the 2050s and 2090s. Notably, the centroid of this distribution will shift northward overall. Under the SSP126 scenario, although an initial reduction is observed, a marginal increase in the total suitable area for
Q. mongolica is projected. Conversely, under the other two scenarios, the suitable area continues to decline. Specifically, under the SSP126 scenario (
Figure 5a,b,h,g), by the 2050s, the total suitable area for
Q. mongolica has shifted northward by 182.7 km compared to its current location. This shift has resulted in a loss of 284,660.23 km
2 from the southern edge, with a compensatory gain of 128,497.04 km
2 in the northern region, ultimately leading to a net decrease of 156,163.19 km
2 compared to the current extent. By the 2090s, the centroid has shifted back southwards by 51.68 km, with a loss of 53,095.70 km
2 in the northern part and an addition of 63,425.56 km
2 to the southern edge, resulting in a net increase of 10,329.86 km
2 compared to the 2050s. In contrast, under the SSP585 scenario (
Figure 5e,f,k,l), the total suitable area for
Q. mongolica undergoes the most significant changes in the 2050s and 2090s, with a total suitable area loss rate of 60%. Additionally, the centroid migration distance is the most extensive among all scenarios.
By the 2050s, a cumulative loss of 483.08 km
2 occurred in the southern and eastern fringes of the suitable area, while a mere 69,394.27 km
2 was gained in the northern region, representing a net decrease of 414,496.53 km
2 compared to the current period. Consequently, the center of mass shifted 190.98 km northward. Progressing to the 2090s, the entire suitable area in the eastern part of the country vanished, resulting in a total loss of 199,172.21 km
2 when compared to the 2050s. Despite the addition of 130,908.33 km
2 in the north, the overall suitable area still decreased by 68,263.88 km
2, and the center of mass migrated an additional 329.631 km northward. Under the SSP245 climate scenario (
Figure 5c,d,i,j), the variation in the total suitable area for
Q. mongolica between the 2050s and 2090s fell within the range observed in the SSP126 and SSP585 climate scenarios, exhibiting a similar trend of diminishing suitable area and northward migration of the center of mass.
Observing the anticipated alterations in the total suitable area for
Q. mongolica in the 2050s and 2090s reveals varying degrees of change under different climate scenarios. The sensitivity of
Q. mongolica's suitable area to climate change, as indicated in
Table 1, follows a descending order from SSP585 to SSP245 and then SSP126. Notably, within the same climate scenario, the highly suitable areas exhibited a greater sensitivity compared to other suitable regions.
3.5. Analysis of the Ecological Niche Change of Q. mongolica in the Future Period
A comparative analysis of the niche characteristics of
Q. mongolica across various climatic backgrounds at present and in the future was conducted. The findings revealed that the migration patterns of the
Q. mongolica niche in diverse climate scenarios were remarkably similar in the future. Furthermore, as climate change intensified, the alterations in the
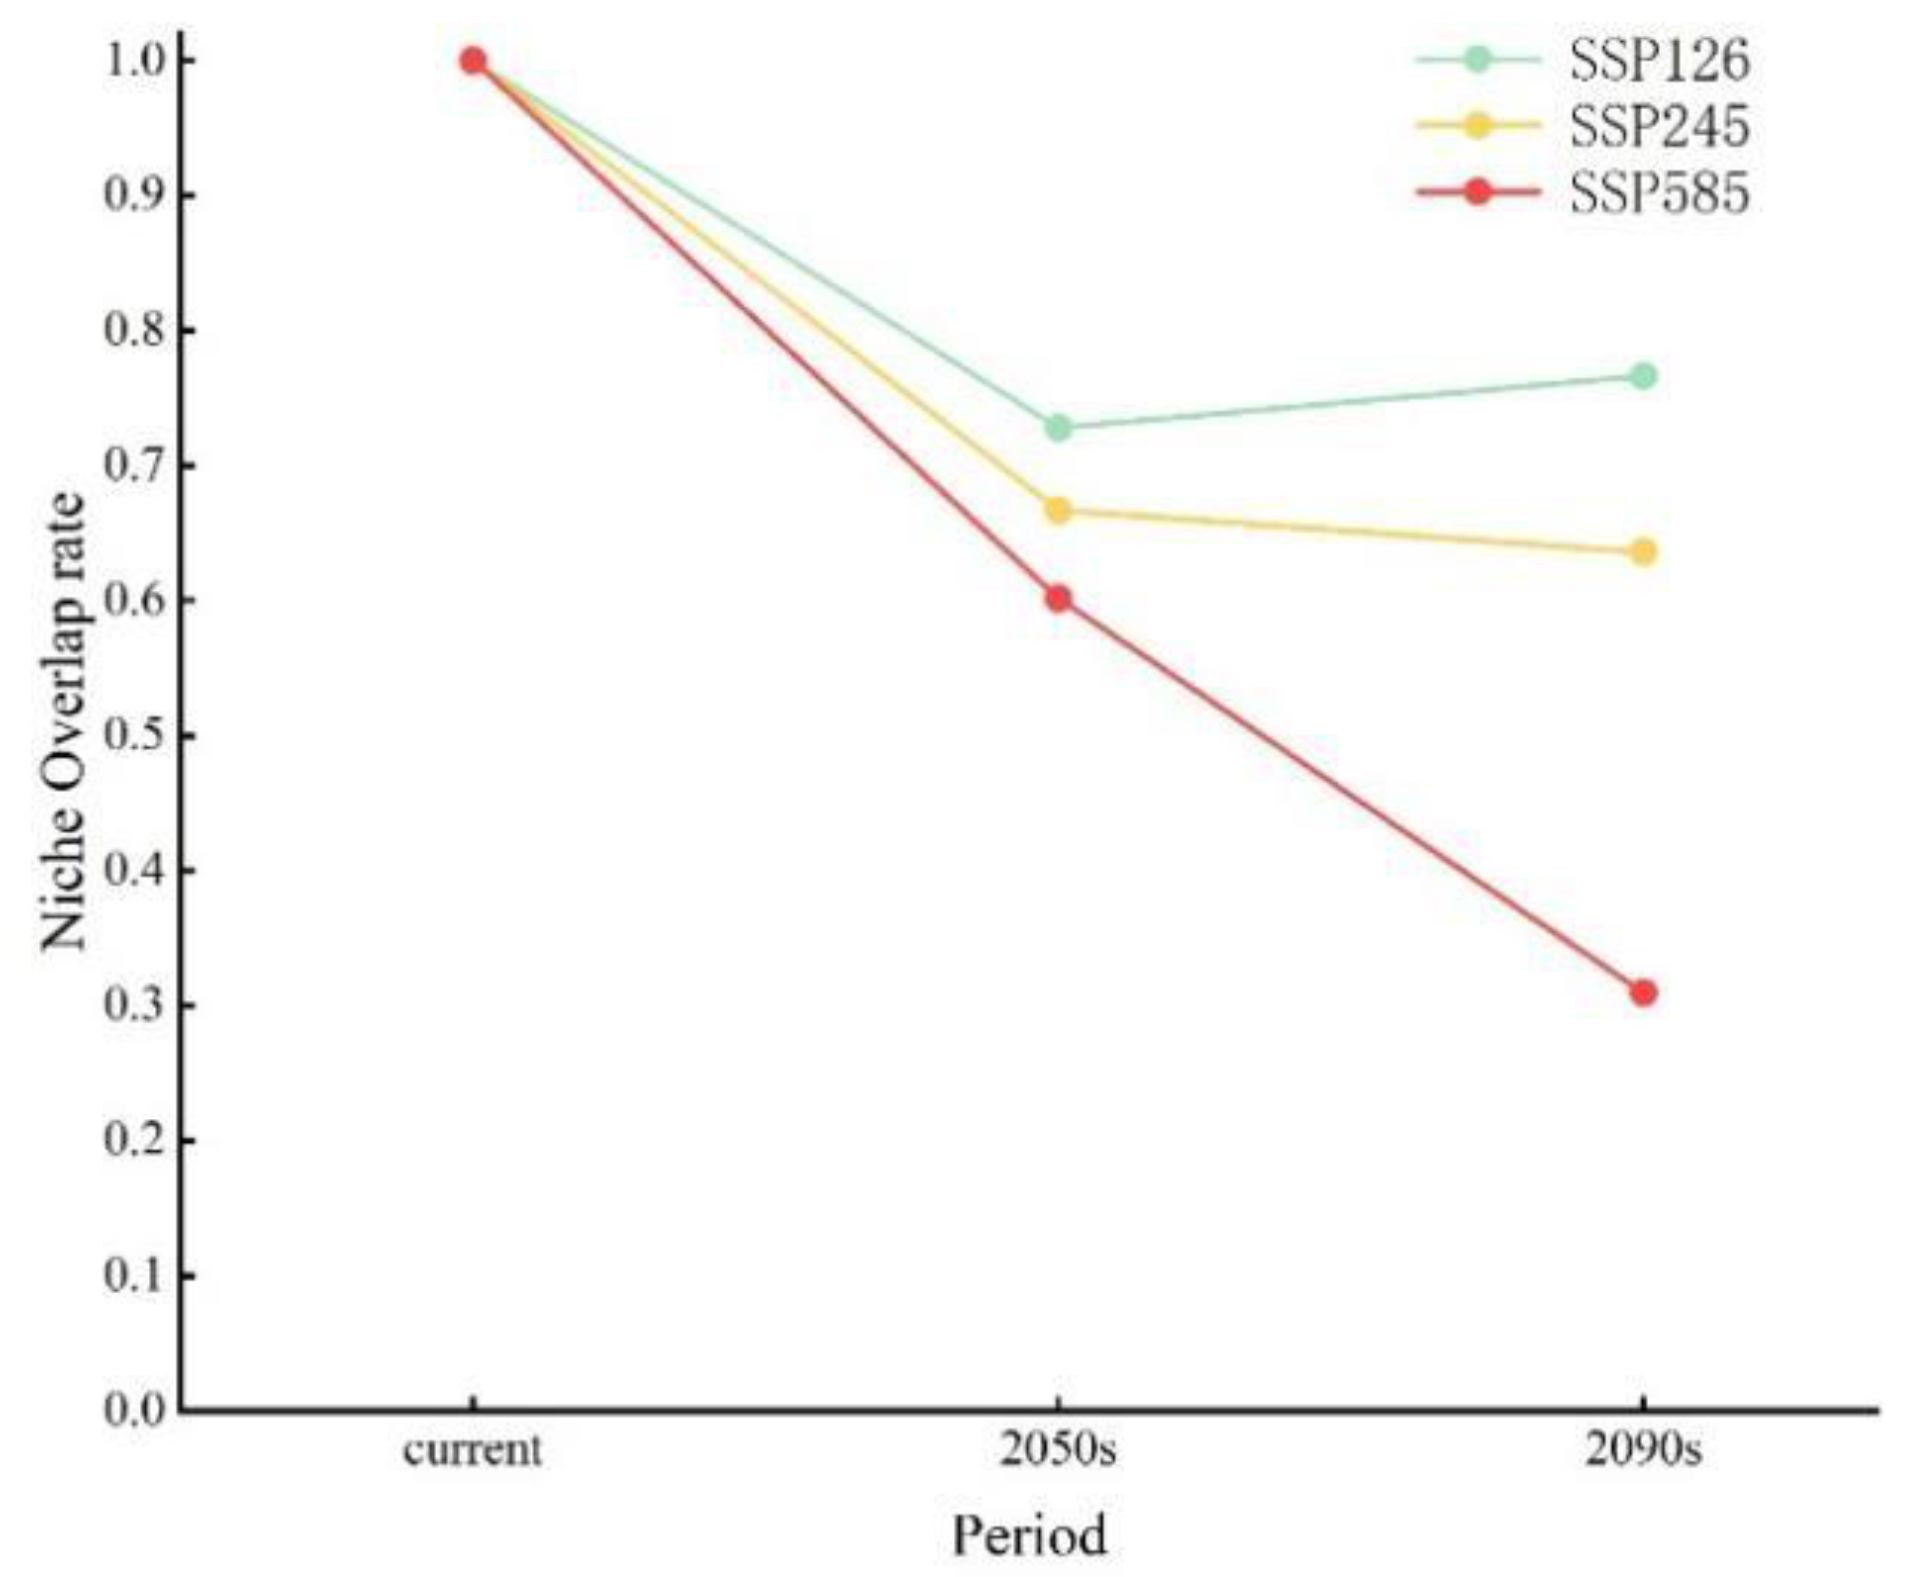
Q. mongolica niche became increasingly evident. Under the SSP585 climate scenario, a significant decline in the niche overlap rate was observed, exhibiting a near-linear decrease. Notably, the niche migration of
Q. mongolica was particularly pronounced in the 2090s, resulting in a niche overlap rate of merely 31% compared to the preceding period (
Figure A2).
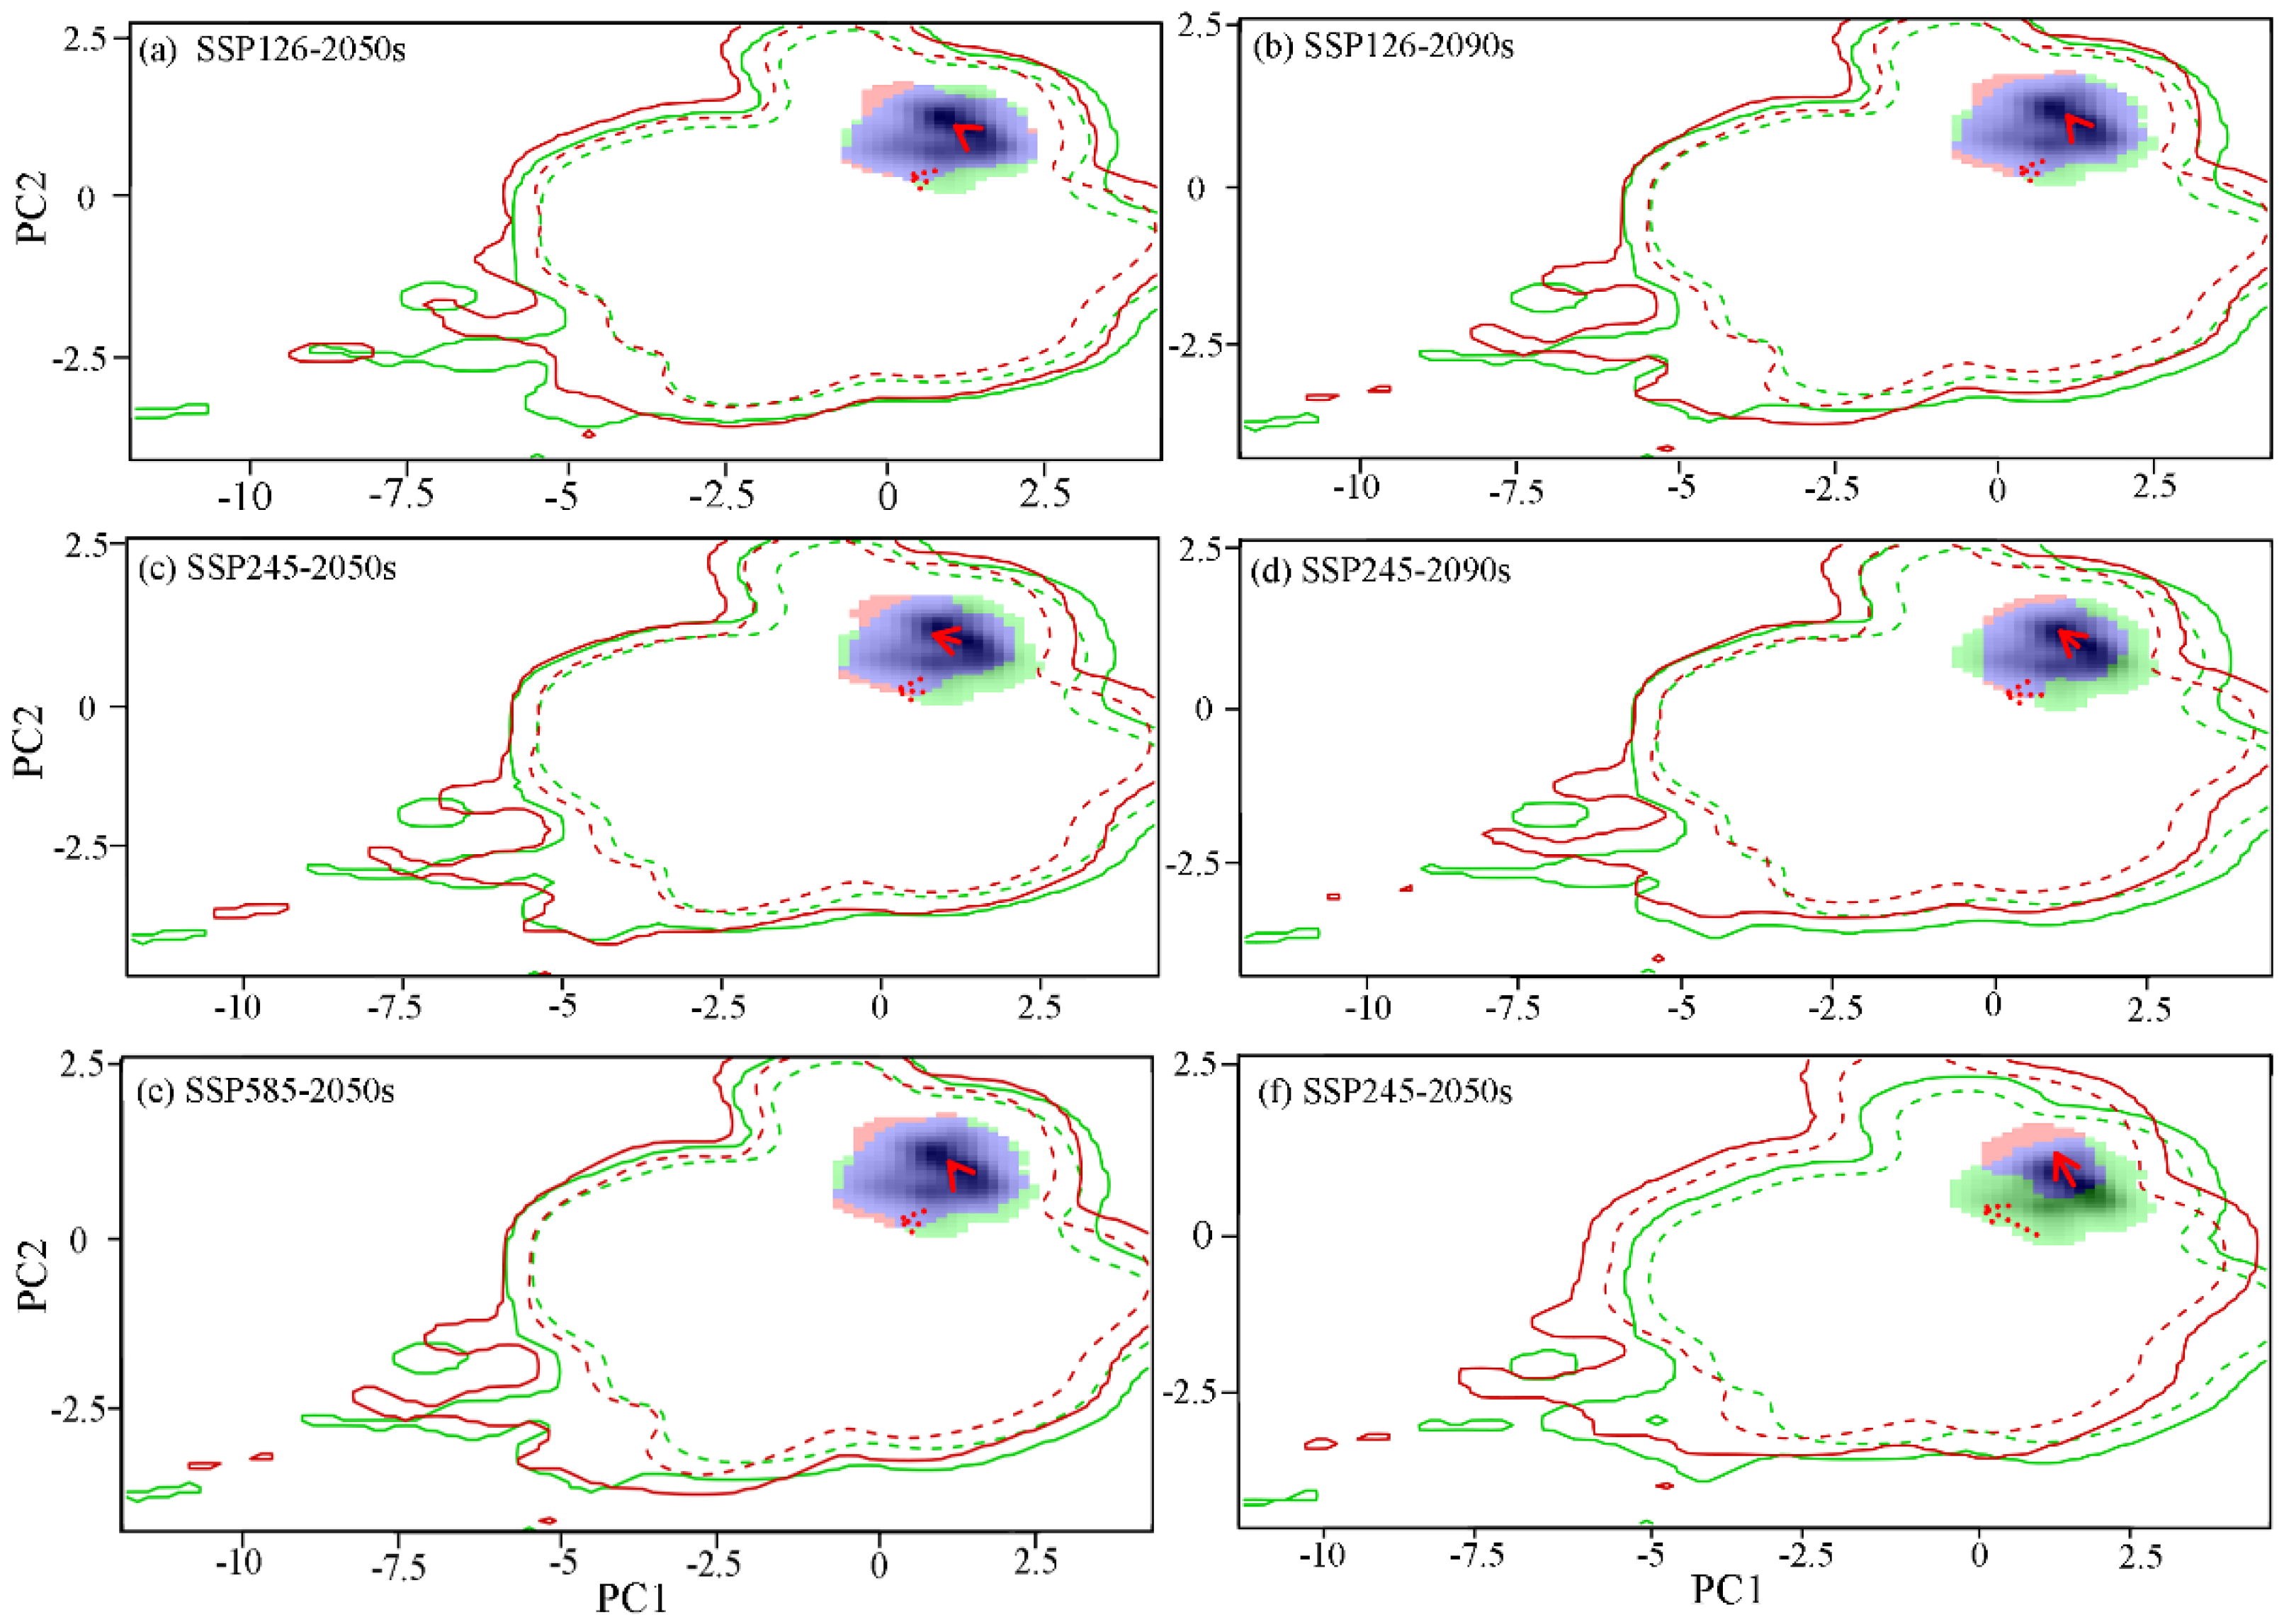
The results of principal component analysis (PCA) revealed that the annual average temperature and the highest temperature in the hottest month were the primary factors influencing the niche changes of
Q. mongolica. These two principal components collectively accounted for 76.58~78.41% of the variance in environmental factors within the study area (PC1: 56.38 ~58.77%; PC2: 19.16~20.2%). Furthermore, it was predicted that the future climate niche center would shift towards areas with milder annual averages and less extreme temperatures during the hottest months (
Figure 6).
4. Discussion
Utilizing data on the actual geographical distribution and ecological factors of Q. mongolica, we employed the Biomod2 platform integrated with ArcGIS spatial analysis to delve into the potential suitable habitats for Q. mongolica under current climatic conditions. This approach further allowed us to foresee the future changes in the distribution range and center of these potential habitats within China. During model selection, the RF, GBM, FDA, GLM, and ANN models exhibited superior predictive accuracy. Notably, the combined accuracy of these five individual models far surpassed any single model, achieving AUC and TSS values of 0.985 and 0.936 respectively, thereby enhancing our capacity to predict the distribution and shifts of Q. mongolica.
Climatic factors like temperature extremes, topographical variables, human interventions, and spatial limitations each exert varying degrees of influence on the dispersal of
Q. mongolica [
34]. The results of rigorous model screening indicate that the peak temperature in the hottest month, the nadir temperature in the coldest month, and altitude are the chief determinants of suitable habitats.
Q. mongolica thrives best in areas situated below 1,500 m above sea level, with the maximum temperature during the peak growing season not exceeding 30 °C, a condition where its growth is sluggish and bud preservation rates are compromised [
35]. Additionally, the minimum temperature in the coldest month should fall between -15 °C and -31 °C; deviations from this range may pose risks of dendromancy or frost damage to the Mongolian oak. The predicted potential distribution area and its primary influencing factors align closely with past records in academic literature [
34,
36], thereby further authenticating the precision of our combined modeling approach. Notably, the nine soil factors evaluated in this study exhibited negligible impact on the growth and dispersal of
Q. mongolica, suggesting that this species does not harbor stringent requirements for soil conditions and possesses a broad adaptability range.
Under the varying climatic scenarios of SSP126, SSP245, and SSP585,
Q. mongolica exhibited varying degrees of potential habitat loss. Specifically, under the SSP126 scenario, the total suitable area for
Q. mongolica initially decreased but subsequently increased. This shift was attributed to significant changes in the average hottest month's temperature (bio5) in low latitudes during the 2050s, which propelled the suitable habitat northward. However, by the 2090s, there was no significant variation in the average hottest month's maximum temperature (bio5). Existing studies indicate that as global warming persists, precipitation patterns in Northeast China are anticipated to undergo significant fluctuations, accompanied by an increase in extreme precipitation events [
37]. This excessive precipitation may counteract the northward shift caused by the rising temperature in the hottest month, thereby contributing to the expansion of
Q. mongolica's suitable habitat in low latitudes during the 2090s. According to current projections under the three climate scenarios (SSP126, SSP245, SSP585), the total habitat loss of
Q. mongolica is predicted to be 45%, 76%, and 91% by 2100, respectively. In the event of a climate change trajectory exceeding the severity of the SSP585 scenario, it is expected that the suitable habitat for
Q. mongolica will gradually diminish in northern China.
This study employed the ecospat software to delve into the niche characteristics of Q. mongolica across various climatic settings, both presently and in the future. A notable observation was the diminishing overlap between the present and predicted niche spaces for Q. mongolica as climate change intensifies. This trend suggests that the climatic niche will evolve in response to changing environmental conditions. Among the scenarios considered, SSP585 represented the most severe climate scenario, with the lowest niche overlap. In this setting, Q. mongolica is predicted to encroach on niches occupied by species residing at higher altitudes and latitudes, while its original niche may be usurped by species at lower altitudes. Temperature emerges as the primary driver of niche changes in Q. mongolica, and if climate warming persists or intensifies, the species' ecological niche could become completely distinct from its current one.
It is postulated that amidst the impacts of global warming, species will tend to migrate towards higher latitudes or altitudes to mitigate the effects of climate change [
38]. In this investigation, the currently predicted optimal habitats for
Q. mongolica are predominantly located at higher altitudes. However, merely migrating to higher altitudes may not suffice to adapt to climate warming, and it is more plausible that
Q. mongolica will migrate towards higher latitudes. Across the three future climate scenarios simulated in this study, as climate change intensifies, the area of suitable habitats for
Q. mongolica exhibited a diminishing trend, accompanied by a shift in the centroid towards higher latitudes. Interestingly, under the SSP126 climate scenario, the suitable habitat area for
Q. mongolica slightly expanded in the 2090s compared to the 2050s. This particular trend signifies that
Q. mongolica has a degree of resilience against climate change, suggesting that a moderate increase in warmth and humidity can aid in the expansion of its optimal habitats. Conversely, a more significant reduction in the suitable habitat area and a more distant migration of the distribution center towards higher latitudes are indicative of a more significant impact of climate change. It is worth noting that the phased climate change parameters employed in this study did not precisely determine the extent to which
Q. mongolica responds to climate warming.
As global warming intensifies, the distribution range of Mongolian oak (Quercus mongolica) in China is narrowing, posing a threat of extinction. A comprehensive understanding of this species' changing distribution patterns is essential for conserving Q. mongolica resources and fostering responsible introduction and cultivation practices. To mitigate the decline of Q. mongolica in China, we must prioritize the protection of existing highly suitable habitats. This involves enhancing in-situ conservation efforts, manually intervening to correct unreasonable stand structures, and initiating ecological introduction and restoration measures.
5. Conclusions
This study has developed a robust combined model, integrating Random Forest (RF), Gradient Boosting Machine (GBM), Functional Data Analysis (FDA), Generalized Linear Model (GLM), and Artificial Neural Network (ANN), to precisely predict the distribution of potentially suitable habitats for Q. mongolica. The model exhibits remarkable fitting accuracy. Presently, highly suitable habitats for Q. mongolica are concentrated along the Daxing'an Mountains, Zhangguangcai Mountains, Changbai Mountains, and coastal regions. Moderately suitable areas are situated in the transitional zone between forests and grasslands, adjacent to these highly favorable locations.
Among various environmental factors, key determinants of Q. mongolica's habitat distribution includes the hottest month's temperature, the highest temperature, the coldest month's temperature, the lowest temperature, and altitude. As we brace for global warming in the 21st century, the potential habitat of the Mongolian oak may shift northward. Consequently, climate change is expected to result in the loss of habitats in coastal watersheds and low-latitude regions in Northeast China. Under three distinct climate scenarios, the projected habitat loss for Q. mongolica is anticipated to range between 45% and 91% by 2090. To address this pressing issue, it is imperative to strengthen the conservation efforts for existing Mongolian oak resources in highly suitable habitats. Additionally, manual interventions should be implemented to address unfavorable stand structures, and ecological introductions and restoration measures must be undertaken to mitigate the impact of climate change on this important species.
Author Contributions
Conceptualization, Lei Liu and Fengzi Li; methodology, Lei Liu; software, Lei Liu; validation, Long Hai., Rula Sa and Fengzi Li; formal analysis, Lei Liu; investigation, Lei Liu; resources, Minglong Gao; data curation, Lei Liu; writing—original draft preparation, Lei Liu; writing—review and editing, Fengzi Li; visualization, Zirui Wang; supervision, Zirui Wang and Niu Tie; project administration, Long Hai; funding acquisition, Rula Sa. All authors have read and agreed to the published version of the manuscript.
Funding
This research was funded by “opening foundation of the 2023 Grassland Talent Introduction Project”, grant number No. 2021GG0370.
Data Availability Statement
Dataset available on request from the authors.
Acknowledgments
The authors are very grateful to the editors and anonymous reviewers for their valuable time and advice on this manuscript.
Conflicts of Interest
The authors declare no conflicts of interest.
Table A1.
Environmental involved in models.
Table A1.
Environmental involved in models.
| Environmental Type |
Code |
Environmental Variabl |
Environmental Type |
Code |
Environmental Variabl |
| Top Soil Variables |
T-GRAVE |
Topsoil Gravel Content (%vol) |
Bioclimatic Variables |
Bio1 |
Annual Mean Temperature ( °C) |
| |
T-OC |
Topsoil Organic Carbon (%weight) |
|
Bio3 |
Isothermality (°C) |
| |
T-PH-H2O |
Topsoil pH (H2O) (-log(H+)) |
|
Bio5 |
Max Temperature of Warmest Month (°C) |
| |
T-BS |
Topsoil Base Saturation |
|
Bio6 |
Min Temperature of Coldest Month (°C) |
| |
T-ECE |
Topsoil ECE (dS/m) |
|
Bio12 |
Annual Precipitation (mm) |
| |
T-ESP |
Topsoil Sodicity (ESP) (%) |
|
Bio14 |
Precipitation of Driest Month (mm) |
| |
T-TEB |
Topsoil TEB (cmol/Kg) |
|
Bio15 |
|
| |
T-CLAY |
Topsoil CLAY (%wt) |
Terrain Variables |
ELEV |
Elevation (m) |
| |
T-USDA-CLASS |
Topsoil USDA Texture Classification (name) |
|
|
|
Figure A1.
Importance of participating in modeling environmental factors.
Figure A1.
Importance of participating in modeling environmental factors.
Figure A2.
MESS analysis of suitable area of Q. mongolica in different periods.
Figure A2.
MESS analysis of suitable area of Q. mongolica in different periods.
References
- Cuena-Lombraña, A.; Fois, M.; Fenu, G.; Cogoni, D.; Bacchetta, G. The impact of climatic variations on the reproductive success of Gentiana lutea L. in a Mediterranean mountain area. Int. J. Biometeorol. 2018, 62, 1283–1295. [Google Scholar] [CrossRef]
- Zhang, K.; Zhang, Y.; Tao, J. Predicting the Potential Distribution of Paeonia veitchii (Paeoniaceae) in China by Incorporating Climate Change into a Maxent Model. Forests 2019, 10, 190. [Google Scholar] [CrossRef]
- Fallis, A. G. Climate change 2013: the physical science basis.
- Niu, S.L.; Wan, S.Q.; Ma, P. Adaptation and mitigation of climate change by terrestrial ecosystems and biodiversity. Bull. Chin. Acad. Sci. 2009, 421–427. [Google Scholar] [CrossRef]
- Pacifici, M.; Visconti, P.; Butchart, S.H.M.; Watson, J.E.M.; Cassola, F.M.; Rondinini, C. Species’ traits influenced their response to recent climate change. Nat. Clim. Chang. 2017, 7, 205–208. [Google Scholar] [CrossRef]
- Moraitis, M.L.; Valavanis, V.D.; Karakassis, I. Modelling the effects of climate change on the distribution of benthic indicator species in the Eastern Mediterranean Sea. Sci. Total. Environ. 2019, 667, 16–24. [Google Scholar] [CrossRef]
- XuZhonglin; PengHuanhua; PengShouzhang The development and evaluation of species distribution models. Acta Ecol. Sin. 2015, 35. [CrossRef]
- Phillips, S.J.; Anderson, R.P.; Schapire, R.E. Maximum entropy modeling of species geographic distributions. Ecol. Model. 2006, 190, 231–259. [Google Scholar] [CrossRef]
- Breiman, L. Random forests. Mach. Learn. 2001, 45, 5–32. [Google Scholar] [CrossRef]
- Ripley, B.D. Pattern Recognition and Neural Networks; Cambridge University Press: Cambridge, UK, 2007. [Google Scholar]
- McCullagh, P. Generalized linear models. Eur. J. Oper. Res. 1984, 16, 285–292. [Google Scholar] [CrossRef]
- Friedman, J.H. Multivariate Adaptive Regression Splines. Ann. Stat. 1991, 19, 1–67. [Google Scholar] [CrossRef]
- Hastie, T.; Tibshirani, R.; Buja, A. Flexible Discriminant Analysis by Optimal Scoring. J. Am. Stat. Assoc. 1994, 89, 1255–1270. [Google Scholar] [CrossRef]
- Vayssières, M.P.; Plant, R.E.; Allen-Diaz, B.H. Classification trees: An alternative non-parametric approach for predicting species distributions. J. Veg. Sci. 2000, 11, 679–694. [Google Scholar] [CrossRef]
- Nix, H.A.; Busby, J. BIOCLIM, a bioclimatic analysis and prediction system. Division of Water and Land Resources: Canberra 1986, 6, 8–9. [Google Scholar]
- Elith, J.; Leathwick, J.R.; Hastie, T. A working guide to boosted regression trees. J. Anim. Ecol. 2008, 77, 802–813. [Google Scholar] [CrossRef] [PubMed]
- Juni. Simulation of suitable habitat distribution of Magnolia officinalis based on Ensemble Model. Journal of Sichuan Agricultural University 2019, 37(04), 481–489. [CrossRef]
- Thuiller, W.; Lafourcade, B.; Engler, R.; Araújo, M.B. BIOMOD-a platform for ensemble forecasting of species distributions. Ecography 2009, 32, 369–373. [Google Scholar] [CrossRef]
- Duque-Lazo, J.; Navarro-Cerrillo, R.M.; van Gils, H.; Groen, T.A. Forecasting oak decline caused by Phytophthora cinnamomi in Andalusia: Identification of priority areas for intervention. For. Ecol. Manag. 2018, 417, 122–136. [Google Scholar] [CrossRef]
- Hao, T.; Elith, J.; Guillera-Arroita, G.; Lahoz-Monfort, J.J. A review of evidence about use and performance of species distribution modelling ensembles like BIOMOD. Divers. Distrib. 2019, 25, 839–852. [Google Scholar] [CrossRef]
- Shabani, F.; Kumar, L.; Ahmadi, M. A comparison of absolute performance of different correlative and mechanistic species distribution models in an independent area. Ecol. Evol. 2016, 6, 5973–5986. [Google Scholar] [CrossRef]
- CHENKeyi; ZHANGHuiru; LEIXiangdong . Spatial pattern of Quercus mongolica in natural secondary forest. Acta Ecol. Sin. 2018, 38, 3462–3470. [CrossRef]
- Lee, K. C. The resource status and management strategy of Quercus mongolica. Investigation and design of forestry in Inner Mongolia 1996, 1, 14–16. [Google Scholar]
- Yang, L, W, X. Y., Zhang, Hang., et al. Allelopathy of the aqueous extract from the dead leaves of Quercus mongolica on orchids. Chin. J. Agron. 2021, 37, 71–76. [CrossRef]
- Mao, Y.-X.; Zhang, H.-D.; Wang, R.-Z.; Yan, T.-W.; Wei, W.-J.; Yun, L.-L.; Pan, W.-L.; You, W.-Z. [Responses of radial growth of Quercus mongolica to stand density and climatic factors in a mountainous area of eastern Liaoning Province, China]. 2021, 32, 3477–3486. [Google Scholar] [CrossRef] [PubMed]
- Ma, C.X.; Zhou, G.S.; Song, X.Y. Effects of temperature increase, light duration and nitrogen addition on the main phenology of Quercus mongolica. Journal of Applied Ecology 2022, 11, 1–11. [Google Scholar]
- Vanagas, G. Receiver operating characteristic curves and comparison of cardiac surgery risk stratification systems. Interact. Cardiovasc. Thorac. Surg. 2004, 3, 319–322. [Google Scholar] [CrossRef]
- Dormaan, C.F.; Elith, J.; Buchman, C. Collinearity: a review of methods to deal with it and a simulation study evaluating their performance. Ecograghy 2013, 36, 27–46. [Google Scholar] [CrossRef]
- Gama, M.; Crespo, D.; Dolbeth, M.; Anastácio, P.M. Ensemble forecasting of Corbicula fluminea worldwide distribution: Projections of the impact of climate change. Aquat. Conserv. Mar. Freshw. Ecosyst. 2017, 27, 675–684. [Google Scholar] [CrossRef]
- Allouche, O.; Kadmon, T.R. Assessing the Accuracy of Species Distribution Models: Prevalence, Kappa and the True Skill Statistic (TSS). Journal of Applied Ecology 2006, 43, 1223–1232. [Google Scholar] [CrossRef]
- Wu, Y.N.; Ma, Y.J.; Liu, W.L. BIOMOD-based simulation of Plateau pika distribution in the Qinghai Lake River Basin. Journal of Zoology 2017, 52(03), 390–402. [Google Scholar]
- Guo, K.Q.; Jiang, X.L.; Xu, G.B. The potential suitable area of Cyclobalanopsis and the influence of climate change on its distribution. Journal of Ecology 2021, 40, 2563–2574. [Google Scholar]
- Elith, J.; Kearney, M.; Phillips, S. The art of modelling range-shifting species. Methods Ecol. Evol. 2010, 1, 330–342. [Google Scholar] [CrossRef]
- Tan, X.; Zhang, L.; Zhang, A.P. Response of distribution pattern of relict plant Tsuga longibracteata to future climate change. Journal of Ecology 2018, 38, 8934–8945. [Google Scholar]
- Mao, Y.-X.; Zhang, H.-D.; Wang, R.-Z.; Yan, T.-W.; Wei, W.-J.; Yun, L.-L.; Pan, W.-L.; You, W.-Z. [Responses of radial growth of Quercus mongolica to stand density and climatic factors in a mountainous area of eastern Liaoning Province, China]. . 2021, 32, 3477–3486. [Google Scholar] [CrossRef] [PubMed]
- The Chinese Academy of Sciences Flora of the People’s Republic of China editorial board. Flora of the People’s Republic of China. Beijing: Science Press, 1984.
- Chu, Z.; Guo, J.; Zhao, J. Impacts of future climate change on agroclimatic resources in Northeast China. J. Geogr. Sci. 2017, 27, 1044–1058. [Google Scholar] [CrossRef]
- Shen, Y.; Wang, G. Key findings and assessment results of IPCC WGI fifth assessment report. Journal of Glaciology & Geocryology 2013, 35, 1068–1076. [Google Scholar] [CrossRef]
|
Disclaimer/Publisher’s Note: The statements, opinions and data contained in all publications are solely those of the individual author(s) and contributor(s) and not of MDPI and/or the editor(s). MDPI and/or the editor(s) disclaim responsibility for any injury to people or property resulting from any ideas, methods, instructions or products referred to in the content. |
© 2024 by the authors. Licensee MDPI, Basel, Switzerland. This article is an open access article distributed under the terms and conditions of the Creative Commons Attribution (CC BY) license (https://creativecommons.org/licenses/by/4.0/).
