Preprint
Article

Impact of Wetting and Drying Cycles on the Hydromechanical Properties of Soil and Stability of the Earth Infrastructure

Altmetrics

Downloads

66

Views

47

Comments

0

A peer-reviewed article of this preprint also exists.

Submitted:

03 September 2024

Posted:

03 September 2024

You are already at the latest version

Alerts
Abstract
The earth infrastructure is the backbone of the global economy, connecting people, enhancing quality of life, and promoting health and safety. However, its vulnerabilities are becoming apparent due to climate change, mainly through frequent wetting and drying (wd) cycles. This study aimed to assess the impact of controlled w-d cycles on the hydromechanical properties of clayey and silty sand soils and its implications for the performance of a typical flood embankment. Volumetric changes were monitored during the w-d cycles. Soil water characteristic curve (SWCC), saturated hydraulic conductivity (ksat), effective cohesion (c’) and effective angle of internal friction (ϕ’) were measured at 1 and 10 w-d cycles. The results indicated that the 10 w-d cycles decreased the saturated moisture content and a flatter SWCC compared to the 1 w-d cycle for clayey soil. The ksat was also significantly higher at 10 w-d cycles than the 1 w-d cycle for clayey soil. An insignificant difference was found in both SWCC and ksat at 1 and 10 w-d cycles for silty sand soil. The ϕ’ for the clayey soil decreased from 28.5 to 20.1 as the wd cycles increased from 1 to 10, while the c’ remained unchanged at 10 kN/m2. On the other hand, for the silty sand soil, the ϕ’ increased from 34.6 to 37.5 with an increase in w-d cycles from 1 to 10, and the c’ remained constant at 1 kN/m2. Numerical modelling of transient water flow coupled with slope stability analysis revealed the dependence of flood embankment performance on the soil's hydromechanical properties and the flooding duration. These findings underscore the need for proactive measures to mitigate landslide risks in regions prone to frequent w-d cycles, thereby ensuring the safety and resilience of slopes and associated infrastructure.
Keywords: 
Subject: Engineering  -   Civil Engineering

1. Introduction

Climate-related disasters, such as floods, significantly threaten human well-being. They cause financial losses, harm to infrastructure, disruption of daily life, and the potential for loss of life. Climate change is projected to worsen these issues in the UK by changing the seasonal pattern of wet and dry periods and increasing the severity of seasonal cycles. Research in geotechnical and geological engineering has demonstrated that cyclic wetting and drying (wd) notably impacts soil hydromechanical properties, resulting in decreased slope strength and durability. This phenomenon occurs when soil is directly exposed to the atmosphere during seasonal variations in precipitation and evapotranspiration [1]. Recent studies have emphasised the significant and irreversible structural damage caused by wd cycles in geomaterials. For instance, swelling minerals in soft soils during wetting and drying can lead to changes in volume and, ultimately, to desiccation cracking [2]. Recent research has comprehended the effects of wd cycles on soils, indicating that w-d cycles lead to cracks in the soil structure mainly due to the non-uniform growth in volumetric strain [3]. Consequently, these cycles compromise the strength and rigidity of the soil and result in the progressive failure of the earth's structures.
During the wd cycles, the soil’s structure undergoes significant changes [1]. This manifests two primary effects on the soil's characteristics. Firstly, it causes the soil's strength to deteriorate [4,5,6,7,8]. Secondly, it impacts soil water characteristics and hydraulic conductivity [9,10]. For example, research by Xu et al. [4] and Li et al. [5] examined the strength decay laws of expansive soils and clays under w-d cycles. They all concluded that the soil cohesion would significantly decrease as the number of wd cycles increased. Gowthaman et al. [11] found that the unconfined compressive strength of soil treated with microbially produced calcium carbonate precipitation decreased with increasing w-d cycles. Additionally, Rasul et al. [12] observed that samples undergoing w-d showed noticeably more permanent deformation and had lower robust modulus values than samples that did not undergo wd. During wd cycles, Stirling et al. [13] observed a dramatic reduction in deviator stress at failure. Several other studies [14,15] also yielded similar outcomes. Zhao et al. [15], using consolidated undrained triaxial tests, found that the clayey soil's undrained elastic modulus, undrained shear strength, cohesion, and angle of internal friction decrease during wetting-drawing, freezing-thawing, and wetting-drawing and freezing-thawing cycles, with the reduction being most pronounced during the latter two.
The hydraulic characteristics of soil, including soil-water characteristics and permeability, in addition to soil shear strength, play a crucial role in slope stability [13]. These characteristics are influenced by factors such as soil particle size distribution, soil structure, and environmental elements like wetting-drying cycles, which can cause shrinkage, swelling, crack formation, and changes in pore distribution [16,17,18]. Zhang et al. [16] investigated the soil-water characteristic curve (SWCC) and saturated hydraulic conductivity of soil under different overlying stresses and wetting and drying cycles. Their findings revealed that wetting and drying cycles led to a decrease in the soil's saturated moisture content, an increase in the air-entry value, and a flatter SWCC. Moreover, the saturated hydraulic conductivity of the soil increased with an increase in wetting and drying cycles. Ng and Daniel [17] observed lower saturated water content and hysteresis with increasing wetting and drying cycles. Jing et al. [18] tested loess's SWCC and unsaturated permeability, explicitly considering the effect of wd cycles. They found lower water retention and higher unsaturated permeability with increasing wd cycles. Wen et al. [19] reported that the size of the hysteresis loops decreases with increasing drying-wetting cycles, almost identical after four. The estimated drying air-entry value decreases with the drying number and remains almost unchanged in the fourth and fifth drying. While studying sandy clay derived from Durham lower boulder clay, Stirling et al. [13] found decreased deviator stress at failure and soil suction at a given water content with increasing wd cycles. While previous studies have focused on the influence of wetting and drying cycles on soil hydraulic characteristics, revealing their significant effects, only a limited number of studies have explored the impact of wd cycles on both the hydraulic and mechanical properties of soil simultaneously.
England and Wales have approximately 35,000 km of estuarine and river flood embankments. The annual budget for maintenance and new construction of these embankments is about £450 million. These flood embankments must perform effectively during extreme flood events [20]. The long-term performance of flood embankments depends on the changes in hydromechanical characteristics of soil with wetting and drying cycles. The stability of the flood embankments during the flooding events can be investigated using a combination of transient seepage and slope stability analyses, considering time-dependent hydromechanical characteristics of soil [21]. Zhao [22] conducted numerical simulations coupling transient seepage and slope stability analysis to assess the effect of changes in soil strength and hydraulic characteristics of soil with w-d cycles. The study reported that the soil's strength parameter continuously deteriorates with increased wetting-drying cycles, and the soil water characteristic curve exhibits a hysteresis effect. The combination of these factors results in an overall decreasing trend of the slope safety factor, with a decrease of nearly 43%. Hassan et al. [23] conducted transient seepage and slope stability analyses using 2D finite element methods and time-history measurements on sandy and silty sand soils. They observed that fine particles increase pore water pressure and reduce the factor of safety. Despite few studies, research showing the performance of flood embankments in the long-term incorporating the impact of wetting and drying cycles on hydromechanical characteristics of soil are scarce. The objectives of the present study are as follows:
  • Evaluate the impact of controlled wetting and drying cycles on the soil's water characteristics curve and saturated hydraulic conductivity.
  • Assess the impact of controlled wetting and drying cycles on the effective shear strength of soil.
  • Perform a long-term stability analysis of a model flood embankment based on the hydromechanical properties of the soil measured above.

2. Materials and Methods

2.1. Materials

This study utilised two distinct soil types: fine-grained and coarse-grained soils. Following BS 1377-1 [24], the soils were dried in an oven at a constant temperature of 105°C for at least 24 hours to obtain the bulk soil. The soil was consistently turned throughout the drying process to prevent localised drying. The oven-dried soil was subsequently granulated and sieved through a 2 mm sieve, which was ready for testing. The soil particle size distribution was measured using a wet-sieving and a hydrometer analysis [25]. Particle size distribution analysis of the fine-grained soil revealed a substantial clay content of 60%, accompanied by 37% silt and 3% sand. In contrast, the coarse-grained soil exhibited a lower clay content of 12%, along with 28% silt and a notably higher 60% sand (Figure 1a). Furthermore, the study encompassed the measurement of the soils' consistency limits, including liquid limit, plastic limit, and plasticity index. Liquid and plastic limits were measured using the method outlined in [25]. The fine-grained soil demonstrated a liquid limit of 53% and a plastic limit of 22%, resulting in a plasticity index of 31%, while the coarse-grained soil showcased a lower liquid limit of 32%, a plastic limit of 26%, and a smaller plasticity index of 7%. As per the Unified Soil Classification System, the fine-grained soil was classified as CH, denoting clayey soil, and the coarse-grained soil as SM, representing silty sand. Standard Proctor compaction tests were conducted by BS 1377-4 [26] to establish the relationship between moisture content and dry density of the soil. The standard proctor test results demonstrated that the clayey soil displayed a maximum dry density of 1665 kg m-3 and an optimum moisture content of 18%, whereas the silty sand exhibited values of 1686 kg m-3 and 17.6%, respectively (Figure 1b).

2.2. Samples Preparation

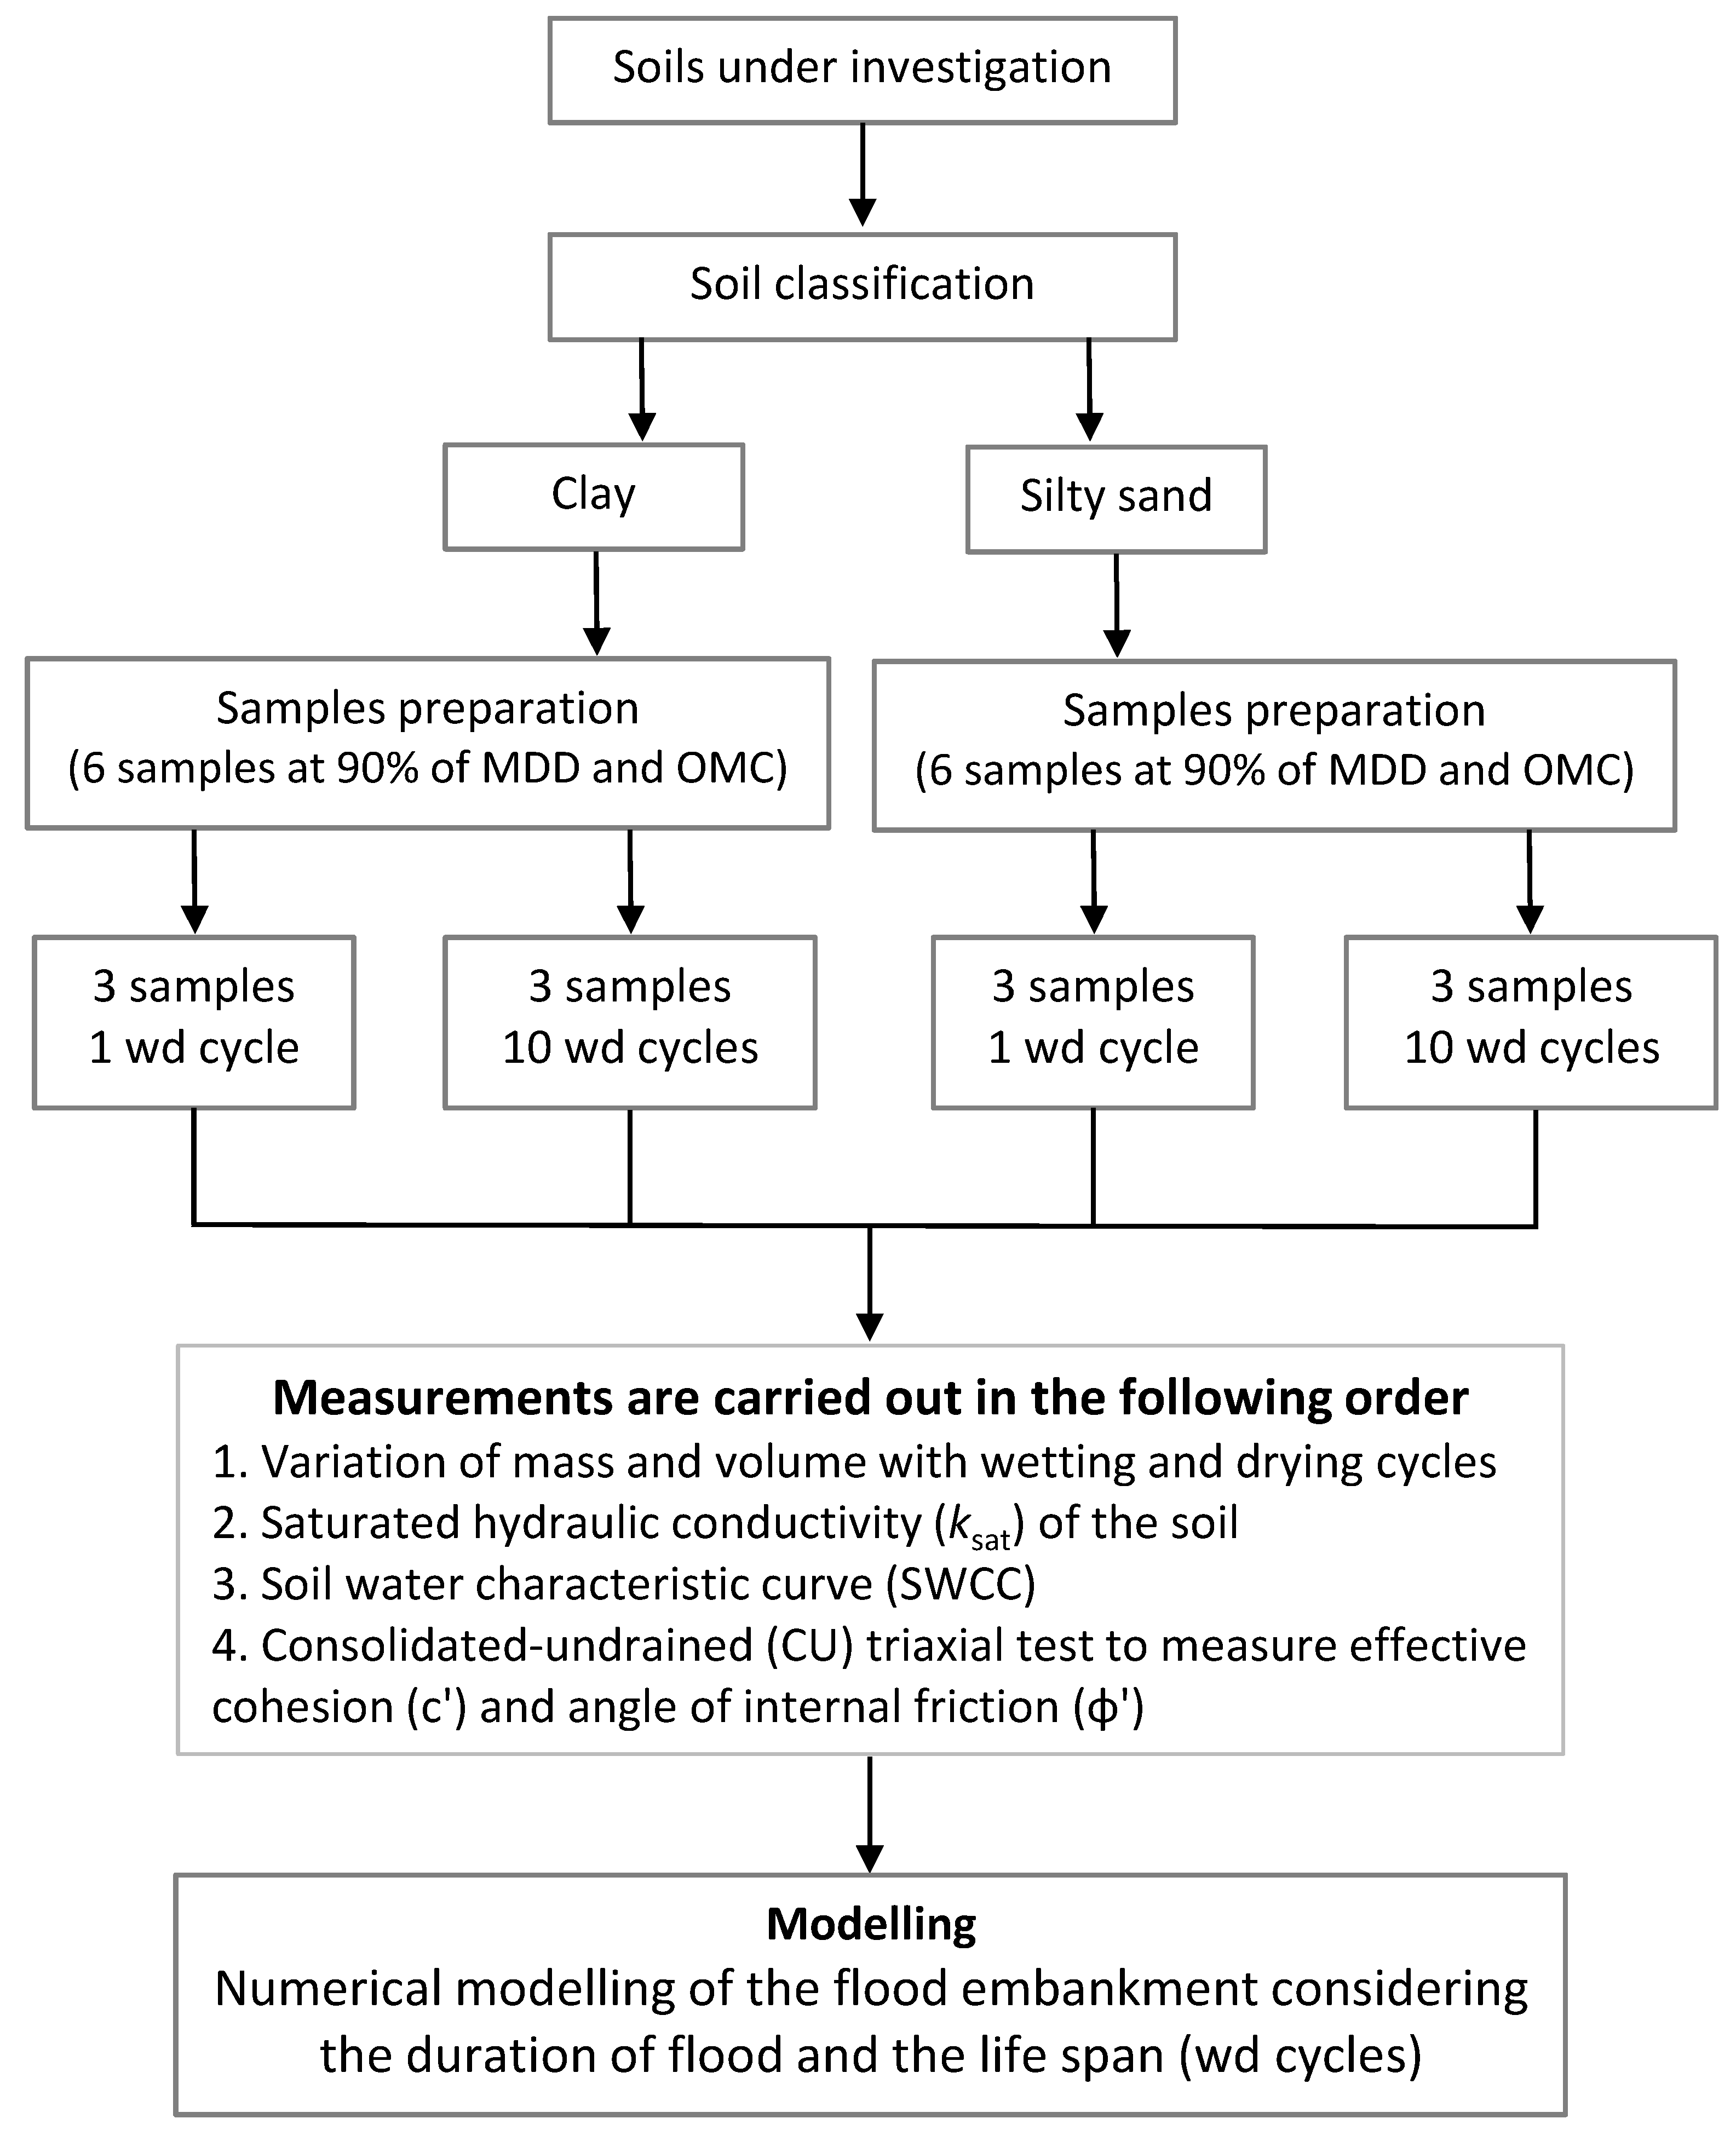
A total of 12 soil samples were prepared, with 6 samples for each type of soil at 90% of maximum dry density and optimum moisture content. Each soil sample had a diameter of 50 mm and a height of 100 mm, and they were prepared using a split stainless-steel mould. The samples were compressed into four layers within the mould to achieve the required dry density. After compaction, the samples were removed from the mould and placed in sealed plastic bags covered with plastic films for 48 hours at a room temperature of 25±1 °C to reach moisture equilibrium. The study flow chart is shown in Figure 2.

2.3. Application of Wetting and Drying Cycles

The clay and silty sand samples were divided into two sets of three. One set underwent a single wetting and drying cycle, while the other set underwent ten cycles, as indicated in Figure 2. Throughout the wetting and drying cycles, continuous monitoring was conducted to observe changes in volume and mass. The soil samples were saturated by enveloping them in a rubber membrane, placing them in a split plastic core, and leaving the top exposed while resting the bottom on a porous stone for soaking. The soil samples were enclosed in a split plastic core to safeguard them from damage and free swelling during saturation. The saturation process involved immersing half of the samples in water to facilitate capillary rise. The samples were kept saturated until the rate of sample weight change became negligible, typically taking an average of 5 days. Following saturation, the soil samples were extracted from the split plastic cores and stored for 48 hours in sealed plastic bags at a room temperature of 25±1 °C to achieve moisture equilibrium. Subsequently, the soil samples were dried at 25 °C, with each drying cycle typically lasting 5 to 6 days. The dried soil samples were again stored in sealed plastic bags for 48 hours at 25±1 °C to ensure moisture equilibrium. It is important to note that oven drying, commonly used in previous research, was avoided for soil drying due to the potential for sample cracking.

2.4. Measurement of Volumetric Change

The volumetric behaviour during the wd cycles was analysed by conducting volume measurements on soil samples after each cycle. These were measured on the specimens using an electronic Vernier calliper with an accuracy of 0.005 mm. Measurements of the specimens' diameter (i.e., d1, d2, and d3) and height (i.e., h1, h2, and h3) were made at three separate cross-sections evenly spaced on their surface. The measurements were made gently and carefully to avoid disturbing the specimens, particularly the fragile and damp ones on saturation. The volume of the specimens and the volumetric strain (εv) for each wd cycle were calculated using the average diameter and height measurement values. Using Eq. 1, the specimens' volumetric strain (εv) was computed.
εv = (VNV0) ∕ V0 × 100%
where V0 is the initial volume of the specimen and VN is the volume of the specimen after N cycles of wetting and drying. Positive εv indicates swelling, while negative εv refers to shrinkage.

2.5. Measurement of Saturated Hydraulic Conductivity (ksat)

To measure the saturated hydraulic conductivity of the soil samples after the required wetting and drying treatment, the falling head method was followed following BS 1377-6:1990 [27]. A fully saturated soil sample was placed in a permeameter and securely connected to a standpipe filled with water. The initial water head (h₀) was recorded at the start. The valve was then opened to allow water to flow through the soil sample, and the timer was started. The water head (h₁) was measured at regular intervals until it dropped to a lower level (h₂), and the time taken for this change was recorded. The length (L) and cross-sectional area (A) of the soil sample, along with the cross-sectional area of the standpipe (Aₛ), were measured. Using these measurements, the saturated hydraulic conductivity (ksat) was calculated using the following formula:
k s a t = A s L A t l n h 0 h 2
To ensure accuracy, the test was repeated three times for each soil sample, and the results were averaged, thus obtaining a reliable measurement of the soil's saturated hydraulic conductivity.

2.6. Measurement of Soil Water Characteristic Curve (SWCC)

After the measurement of ksat, the soil water characteristic curves (SWCC) were measured using the Whatman 42 no. filter paper method. The filter paper is attached to each end of the sample, and then the sample is wrapped in a PVC film and aluminium foil to avoid the loss of moisture content. The samples were placed in a desiccator for one week to equalise the sample's moisture and the filter paper. The ASTM D-5298-93 [28], which stipulates seven days of storage as necessary for moisture stabilisation between soil and paper, served as the basis for the time the samples were kept covered in PVC film and aluminium foil. After a week, the filter paper was removed from the sample and weighed precisely on an enclosed analytical balance to one 10-thousandth gram. The entire procedure was performed in 3 to 5 seconds [28]. The filter paper was then dried in an oven. This whole procedure is repeated for different moisture contents of the sample. For a metric potential equal to zero, the saturated moisture was used, calculated by the indirect method for porosity, given by equation 3.
θ s = 1 γ s γ p
where θs is the saturated moisture content, γs and γp are soil bulk and particle density, respectively.
Calibration curves for Whatman Grade 42 filter paper are frequently employed to calculate the value of matric suction, as given below [29].
For u > 47 % ψ = 10(6.05 - 2.48 log(u))
For u ≤ 47 % ψ = 10(4.84 - 0.0622u)
where the matric potential (ψ) in kPa is estimated by the correlation with the moisture content of the filter paper (u).
The measured SWCCs were fitted with the van Genuchten model [30].

2.7. Measurement of Effective Shear Strength of Soil

After conducting soil water characteristic curve (SWCC) measurements, the samples underwent testing in a triaxial cell under consolidated-undrained (CU) conditions. Cell pressures of 50, 100, and 200 kPa were selected for each wetting and drying treatment to assess the effective shear strength parameters. It is crucial to emphasise that how the specimen is positioned within the triaxial cell significantly influences test outcomes. The correct alignment and preparation of the specimen are pivotal in ensuring precise and representative measurements. The mounting procedure directly influences factors such as stress distribution, boundary conditions, and the specimen’s reaction to loading. Any errors or deficiencies during specimen installation may introduce stress concentrations, boundary effects, and non-uniform stress distribution, ultimately distorting the observed response. Therefore, meticulous care must be taken to align the specimen, achieve proper saturation, and apply appropriate confining pressure to minimise such effects and obtain reliable and representative results in triaxial testing [31]. Initially, the samples were saturated in the triaxial cell to reach the B-Value ≥ 0.95. The B value is defined as.
B = u σ c
Where Δu is the change in pore water pressure and Δσc is the change in cell pressure.
After reaching full saturation, the specimens were consolidated by maintaining a uniform back pressure (BP) and increasing the cell pressure (CP) until the difference between CP and BP equalled the desired consolidation pressure. The samples underwent isotropic consolidation at the required confining pressure. Subsequently, the consolidated samples were subjected to an undrained shearing stage. The samples were sheared until the axial strain reached 20% under a 0.01 mm/min shearing rate. The Mohr-Coulomb failure criteria were employed using the peak values of deviator stress to calculate the effective cohesion and angle of internal friction of soil.

2.8. Evaluating the Performance of Flood Embankment

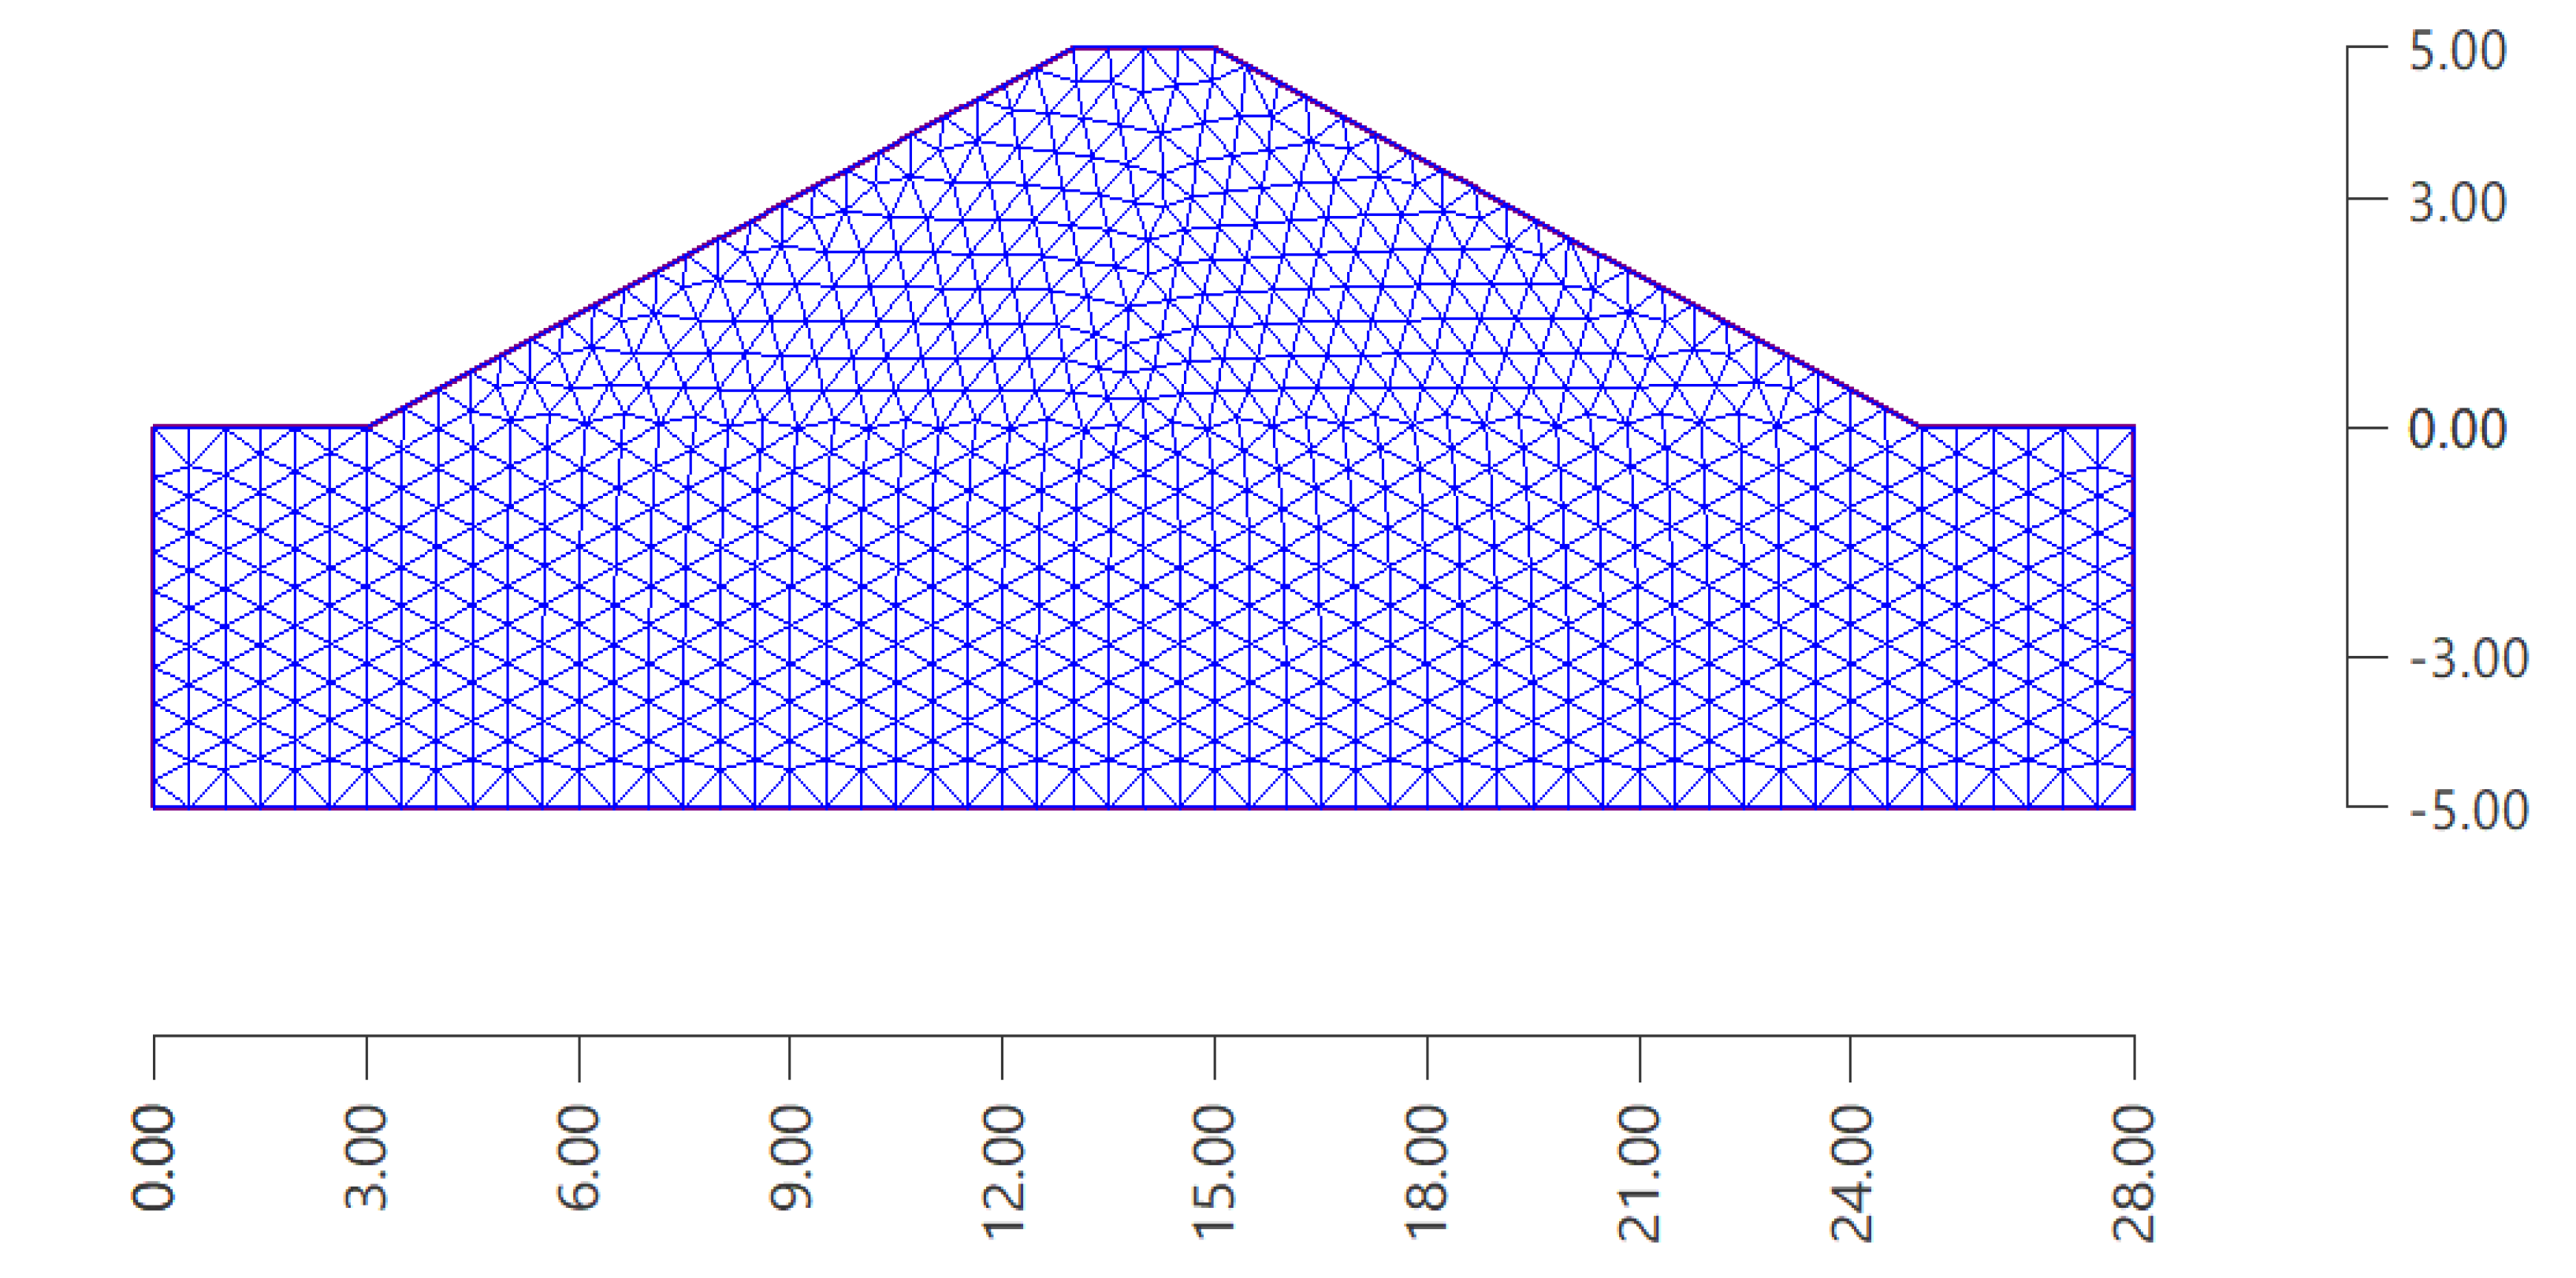
The performance analysis of the flood embankment under wetting and drying cycles and the duration of flooding was conducted using the “Water Flow” and “Slope Stability” modules of the Geo5 software. The flood embankment's geometry is illustrated in Figure 3. Boundary conditions were set based on the location and characteristics of the embankment. The upstream face in contact with the river was assigned the pore pressure type boundary condition, utilising the water table height. The downstream face was prescribed a seepage type of boundary condition. Additionally, a pore pressure type of boundary condition was defined on the vertical surface at the foot of the downstream face, indicating a confined water flow. Impermeable boundary conditions were set at the bottom boundary of the domain and along the embankment crest, signifying no flow across these boundaries.
The Water Flow module utilised transient water flow analysis based on the finite element method to calculate pore water pressures in the embankment. Input parameters such as the SWCC’s van Genuchten model [30] parameters, ksat, and the duration of flooding were considered. Pore water pressures were calculated before and after flooding at 1, 5, and 30 days.
Subsequently, the Slope Stability module computed the embankment's factor of safety (FOS) using Bishop's method, taking into account the unit weight of soil, effective cohesion, the effective angle of internal friction of soil, and the pore water pressures calculated in the Water Flow module.

3. Results

3.1. Volumetric Behaviour of Soils under Wetting and Drying Cycles

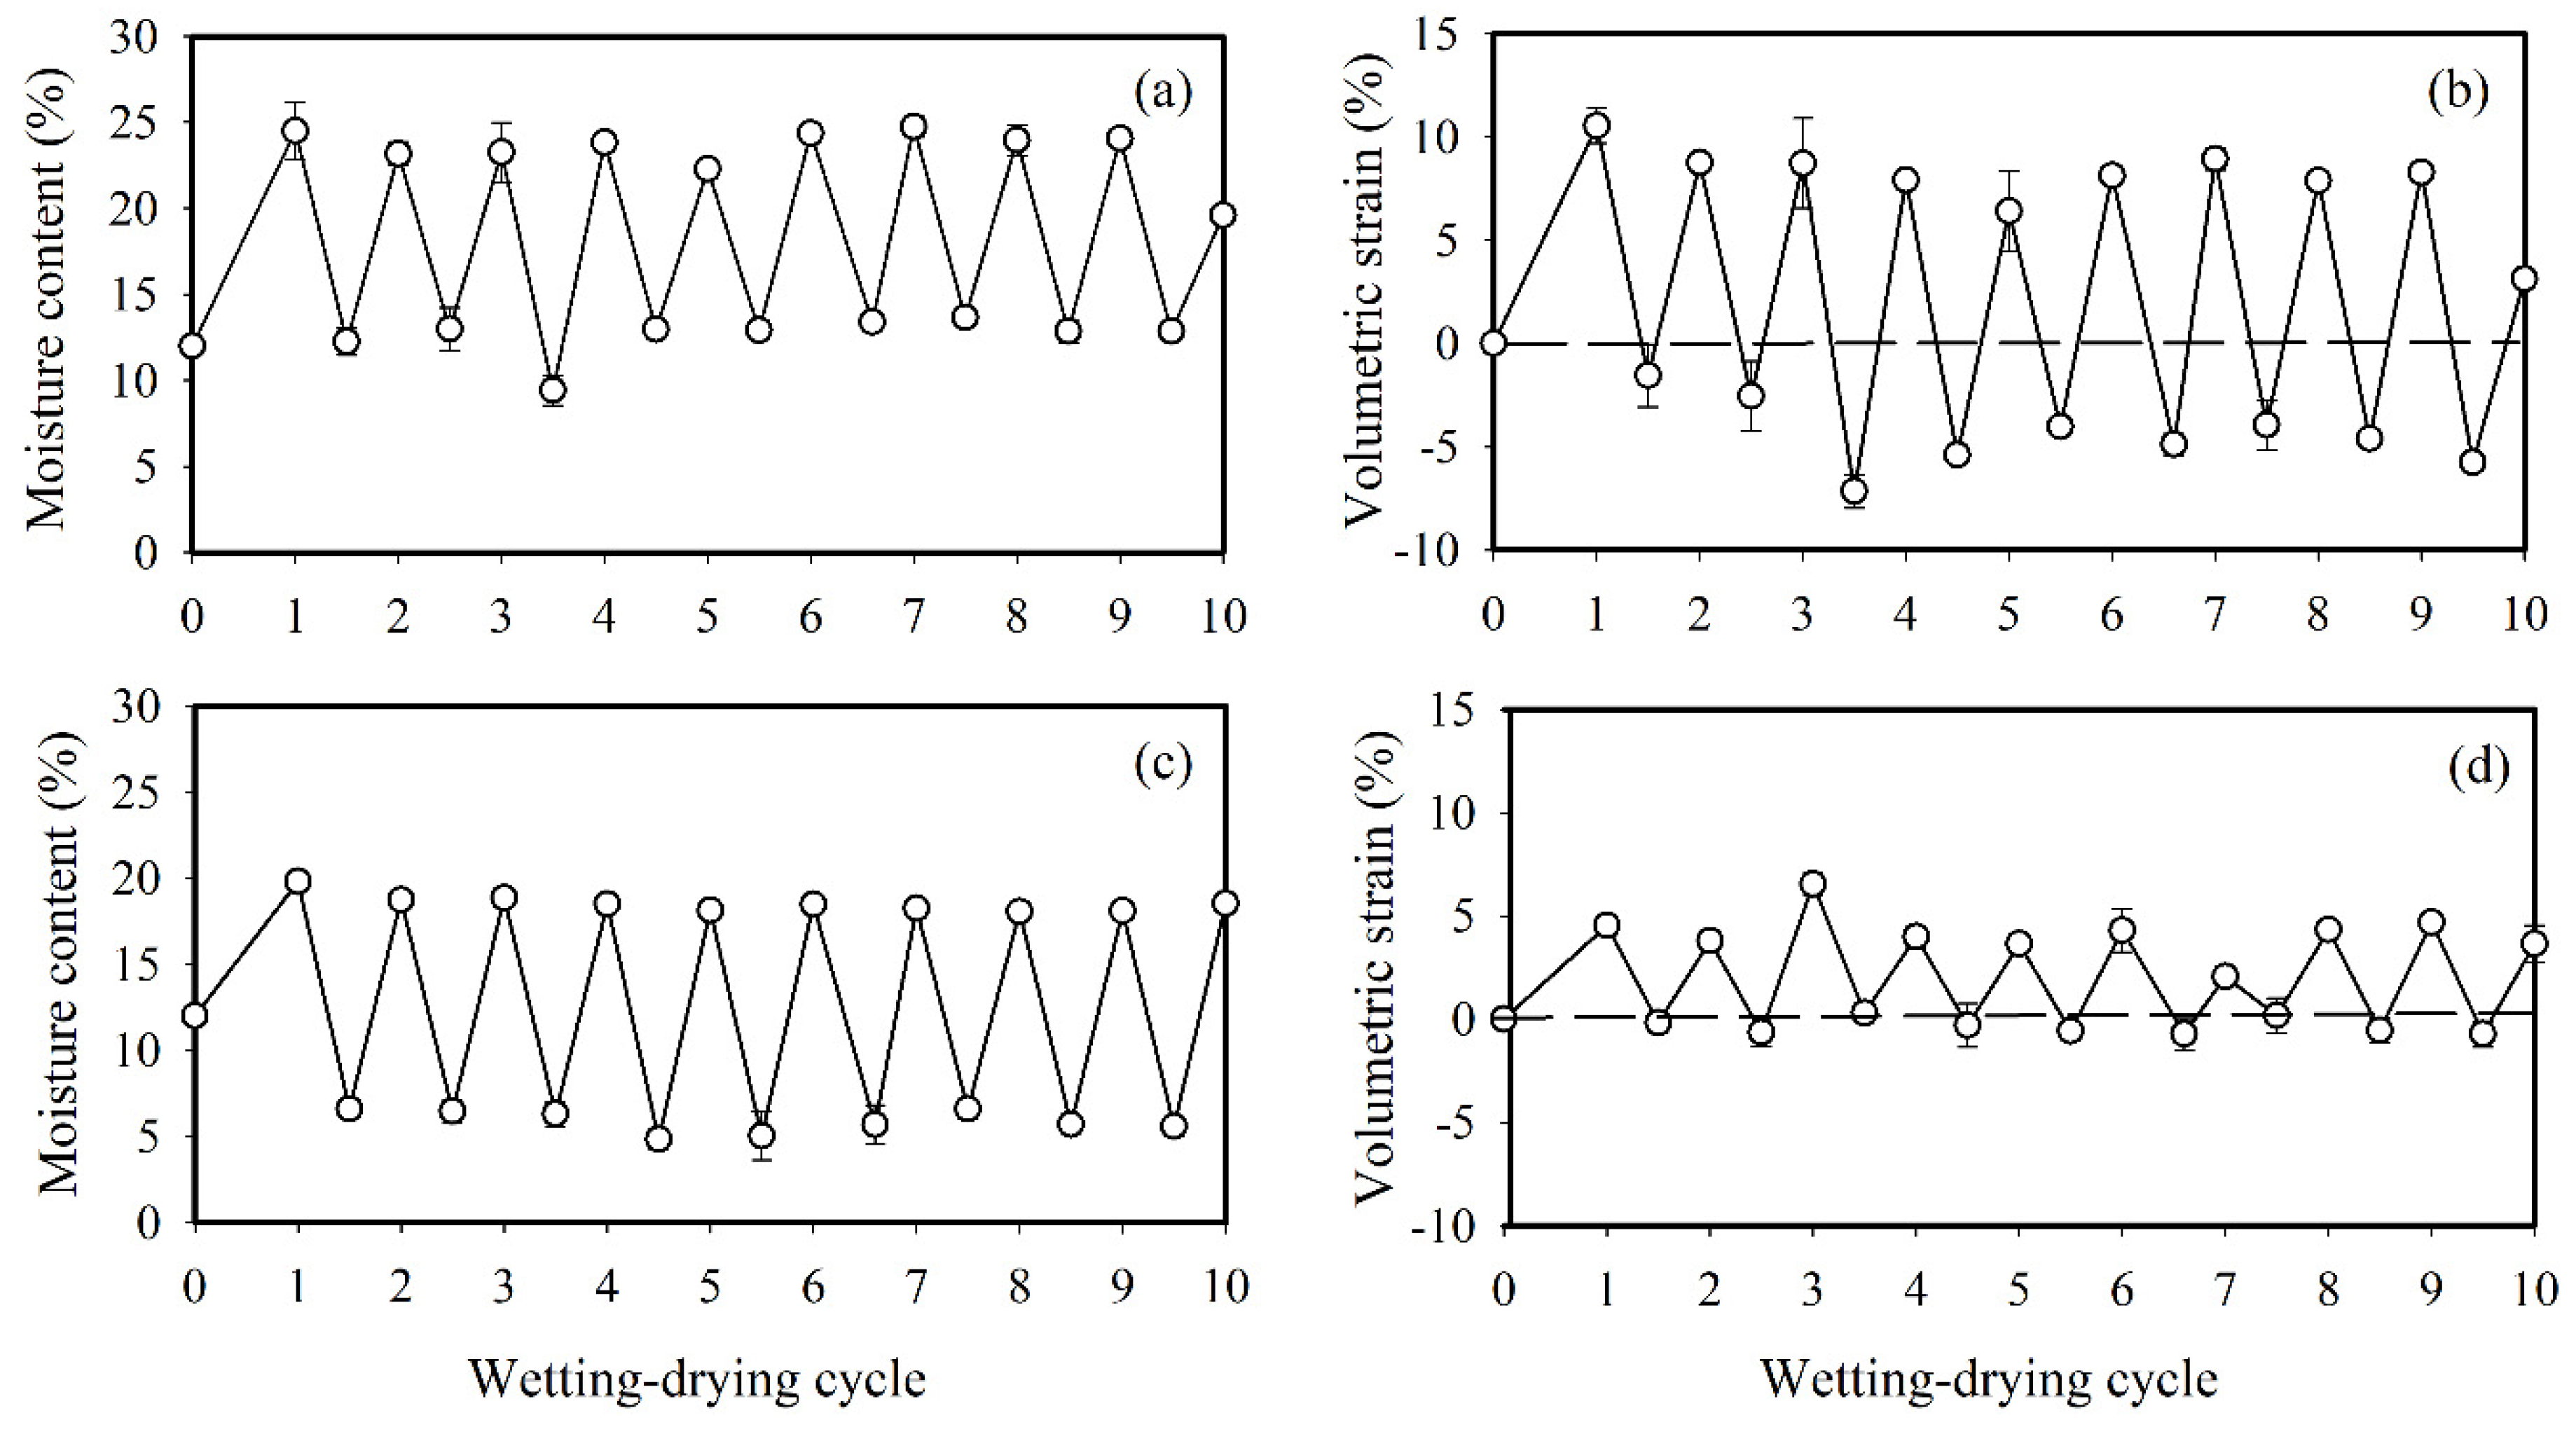
Throughout the wetting and drying cycles, soil samples were analysed for volume change. The saturated moisture content for clayey soil was found in the range of 23 to 25%, which is significantly higher than that for silty sand, which was around 18%. For the drying stage, the moisture content for clayey soil was targeted at 12%, whereas for silty sand, it was 5%. This is equivalent to a matric suction of −1500 kPa (wilting point). The volumetric strain varied between −7 to 11% for clayey soil, whereas for silty sand, it only fluctuated between −1 to 5% during wetting and drying cycles. These findings illustrate the notable shrinkage and swelling of the clay soil samples during wetting and drying (wd) cycles, while the silty sand exhibited less pronounced changes in volume (Figure 4).

3.2. Hydraulic Characteristics of Soils under Wetting and Drying Cycles

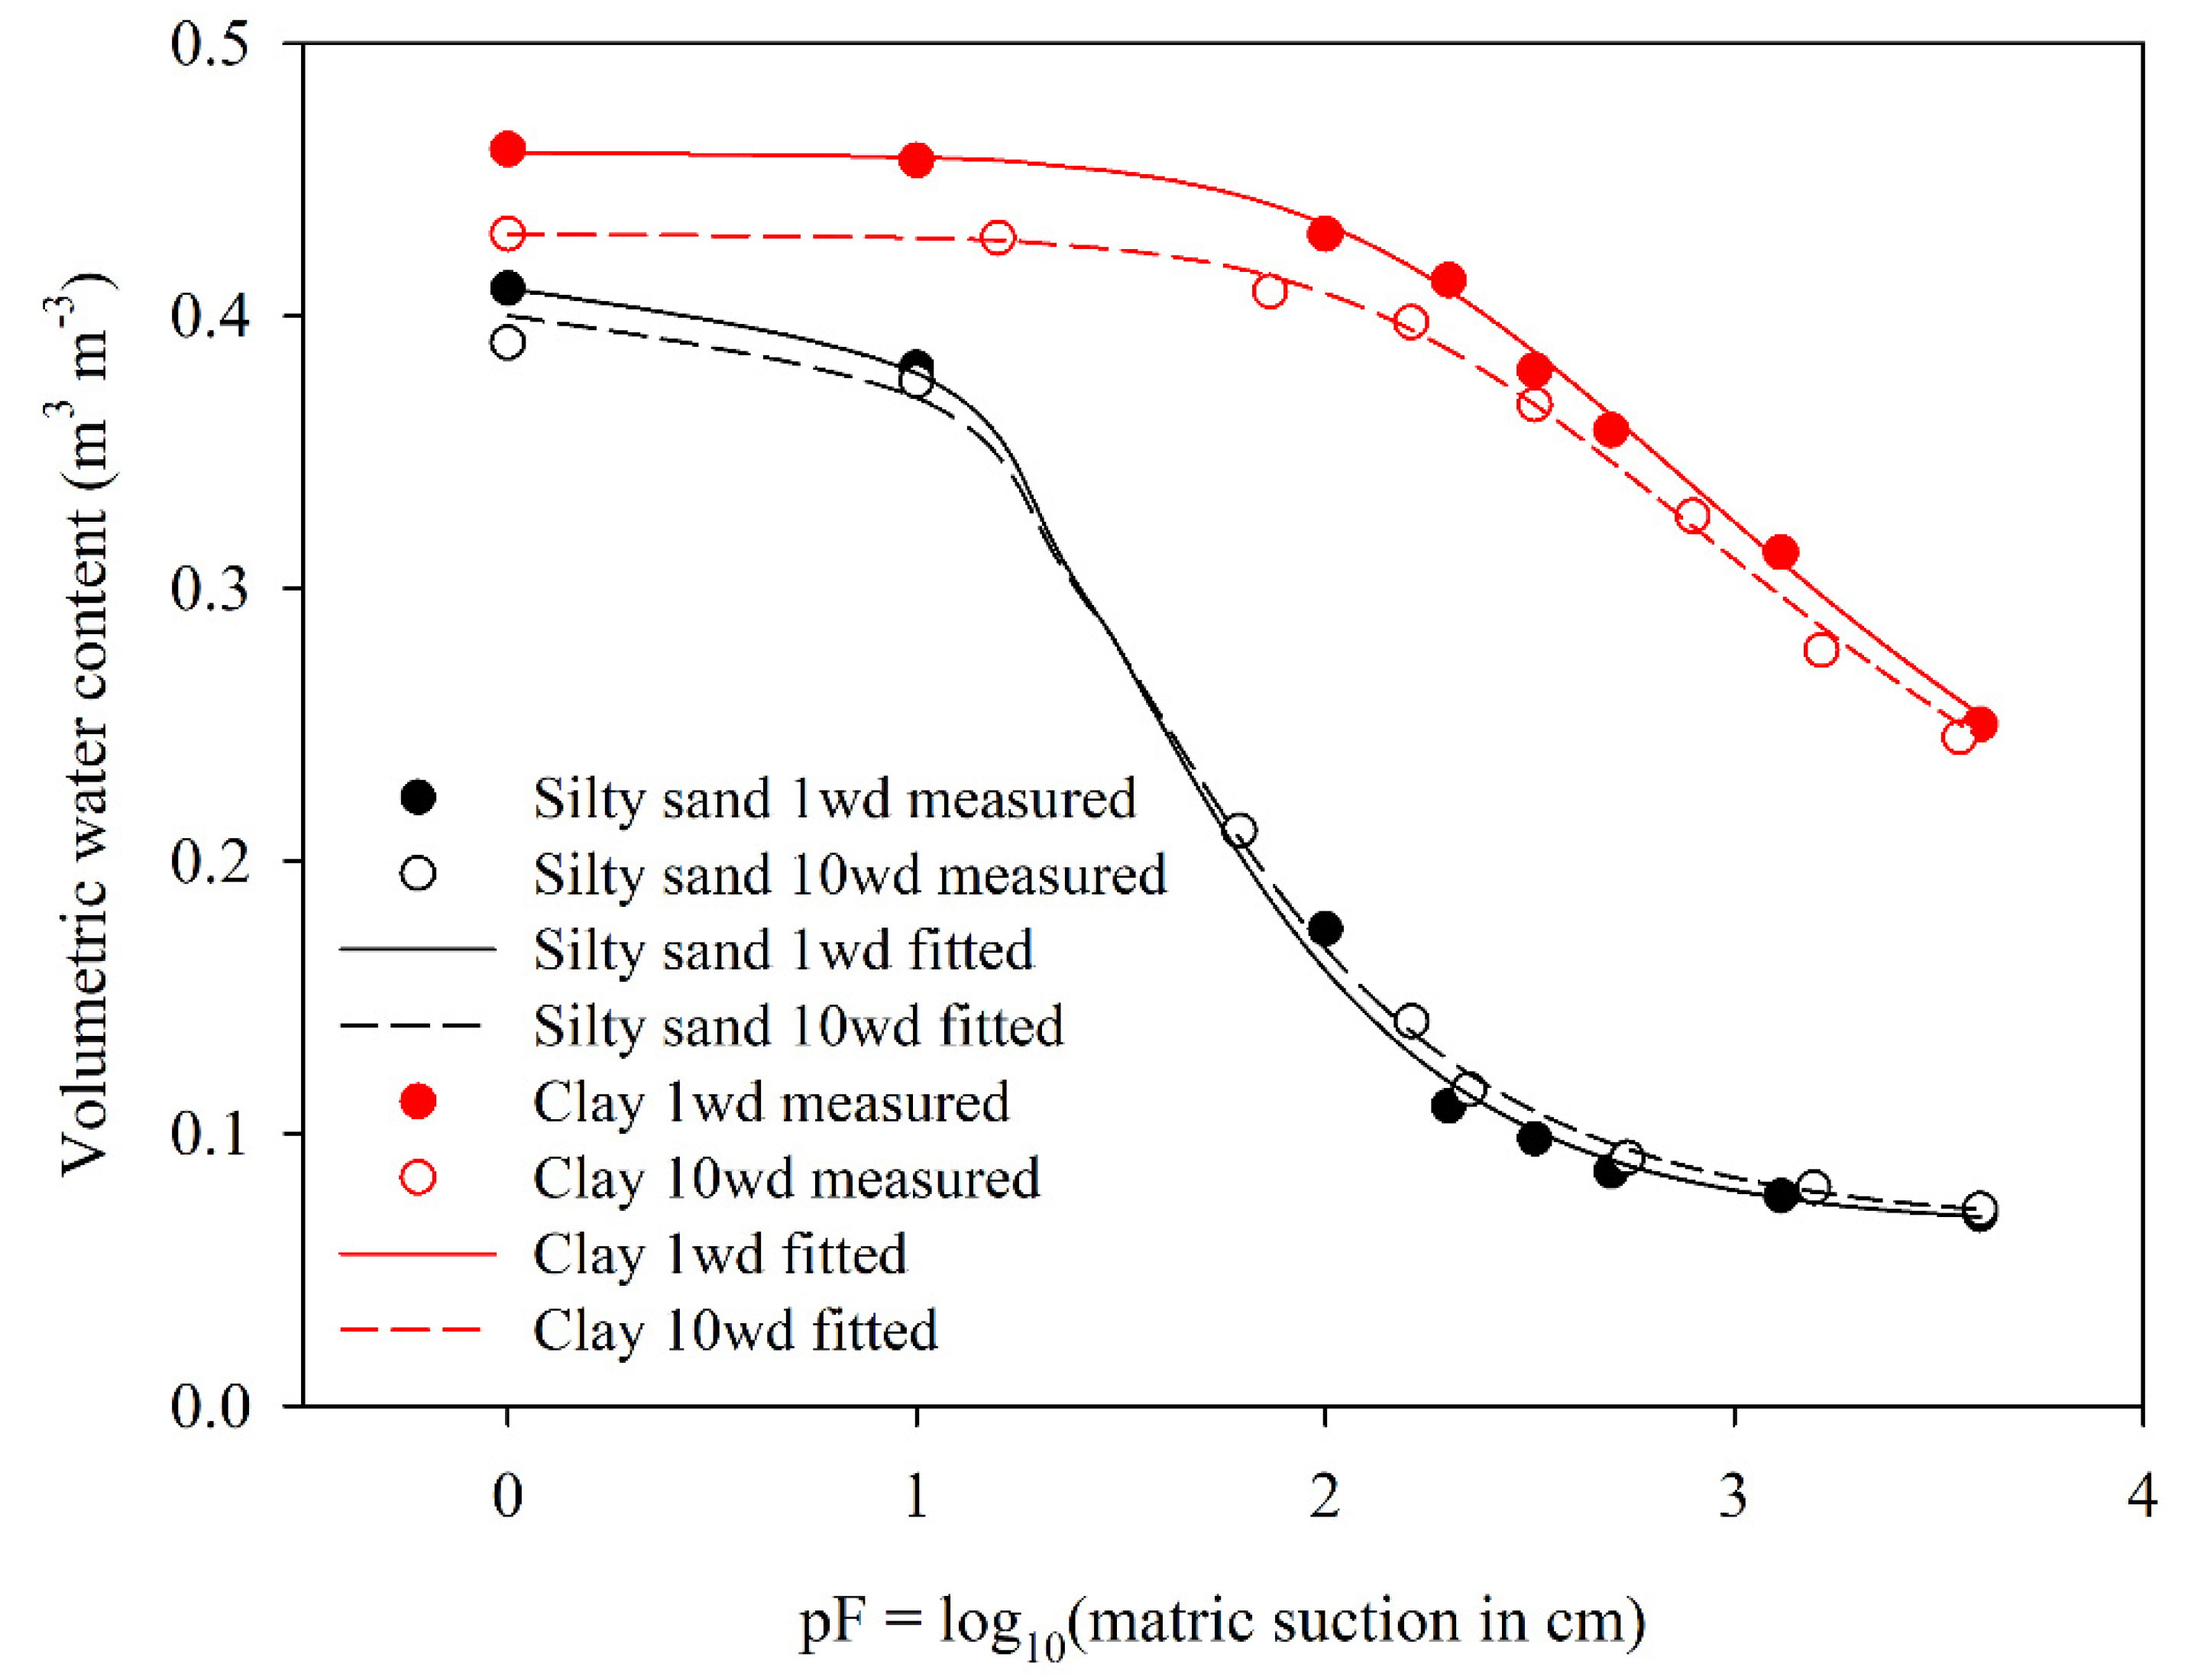
The clayey soil's average saturated hydraulic conductivity (ksat) at 1 w/d cycle was measured as 0.0051 m/d. Following 10 wd cycles, this value significantly increased to 0.0331 m/d. The average ksat was measured for silty sand soil as 1.061 and 1.032 m/d at 1 and 10 wd cycles, respectively. The measured soil water characteristic curves (SWCC) - average for three soil samples per treatment - are shown in Figure 5. The saturated moisture content for the clayey soil at 10 wd cycles was significantly lower than the 1 wd cycle. However, this difference narrowed down with increasing suction. The measured soil water characteristic curves for silty sand soil were similar irrespective of wetting and drying treatment (Figure 5). The van Genuchten model [30] parameters for the fitted soil water characteristic curves are given in Table 1.

3.3. Shear Strength of Soil under Wetting and Drying Cycles

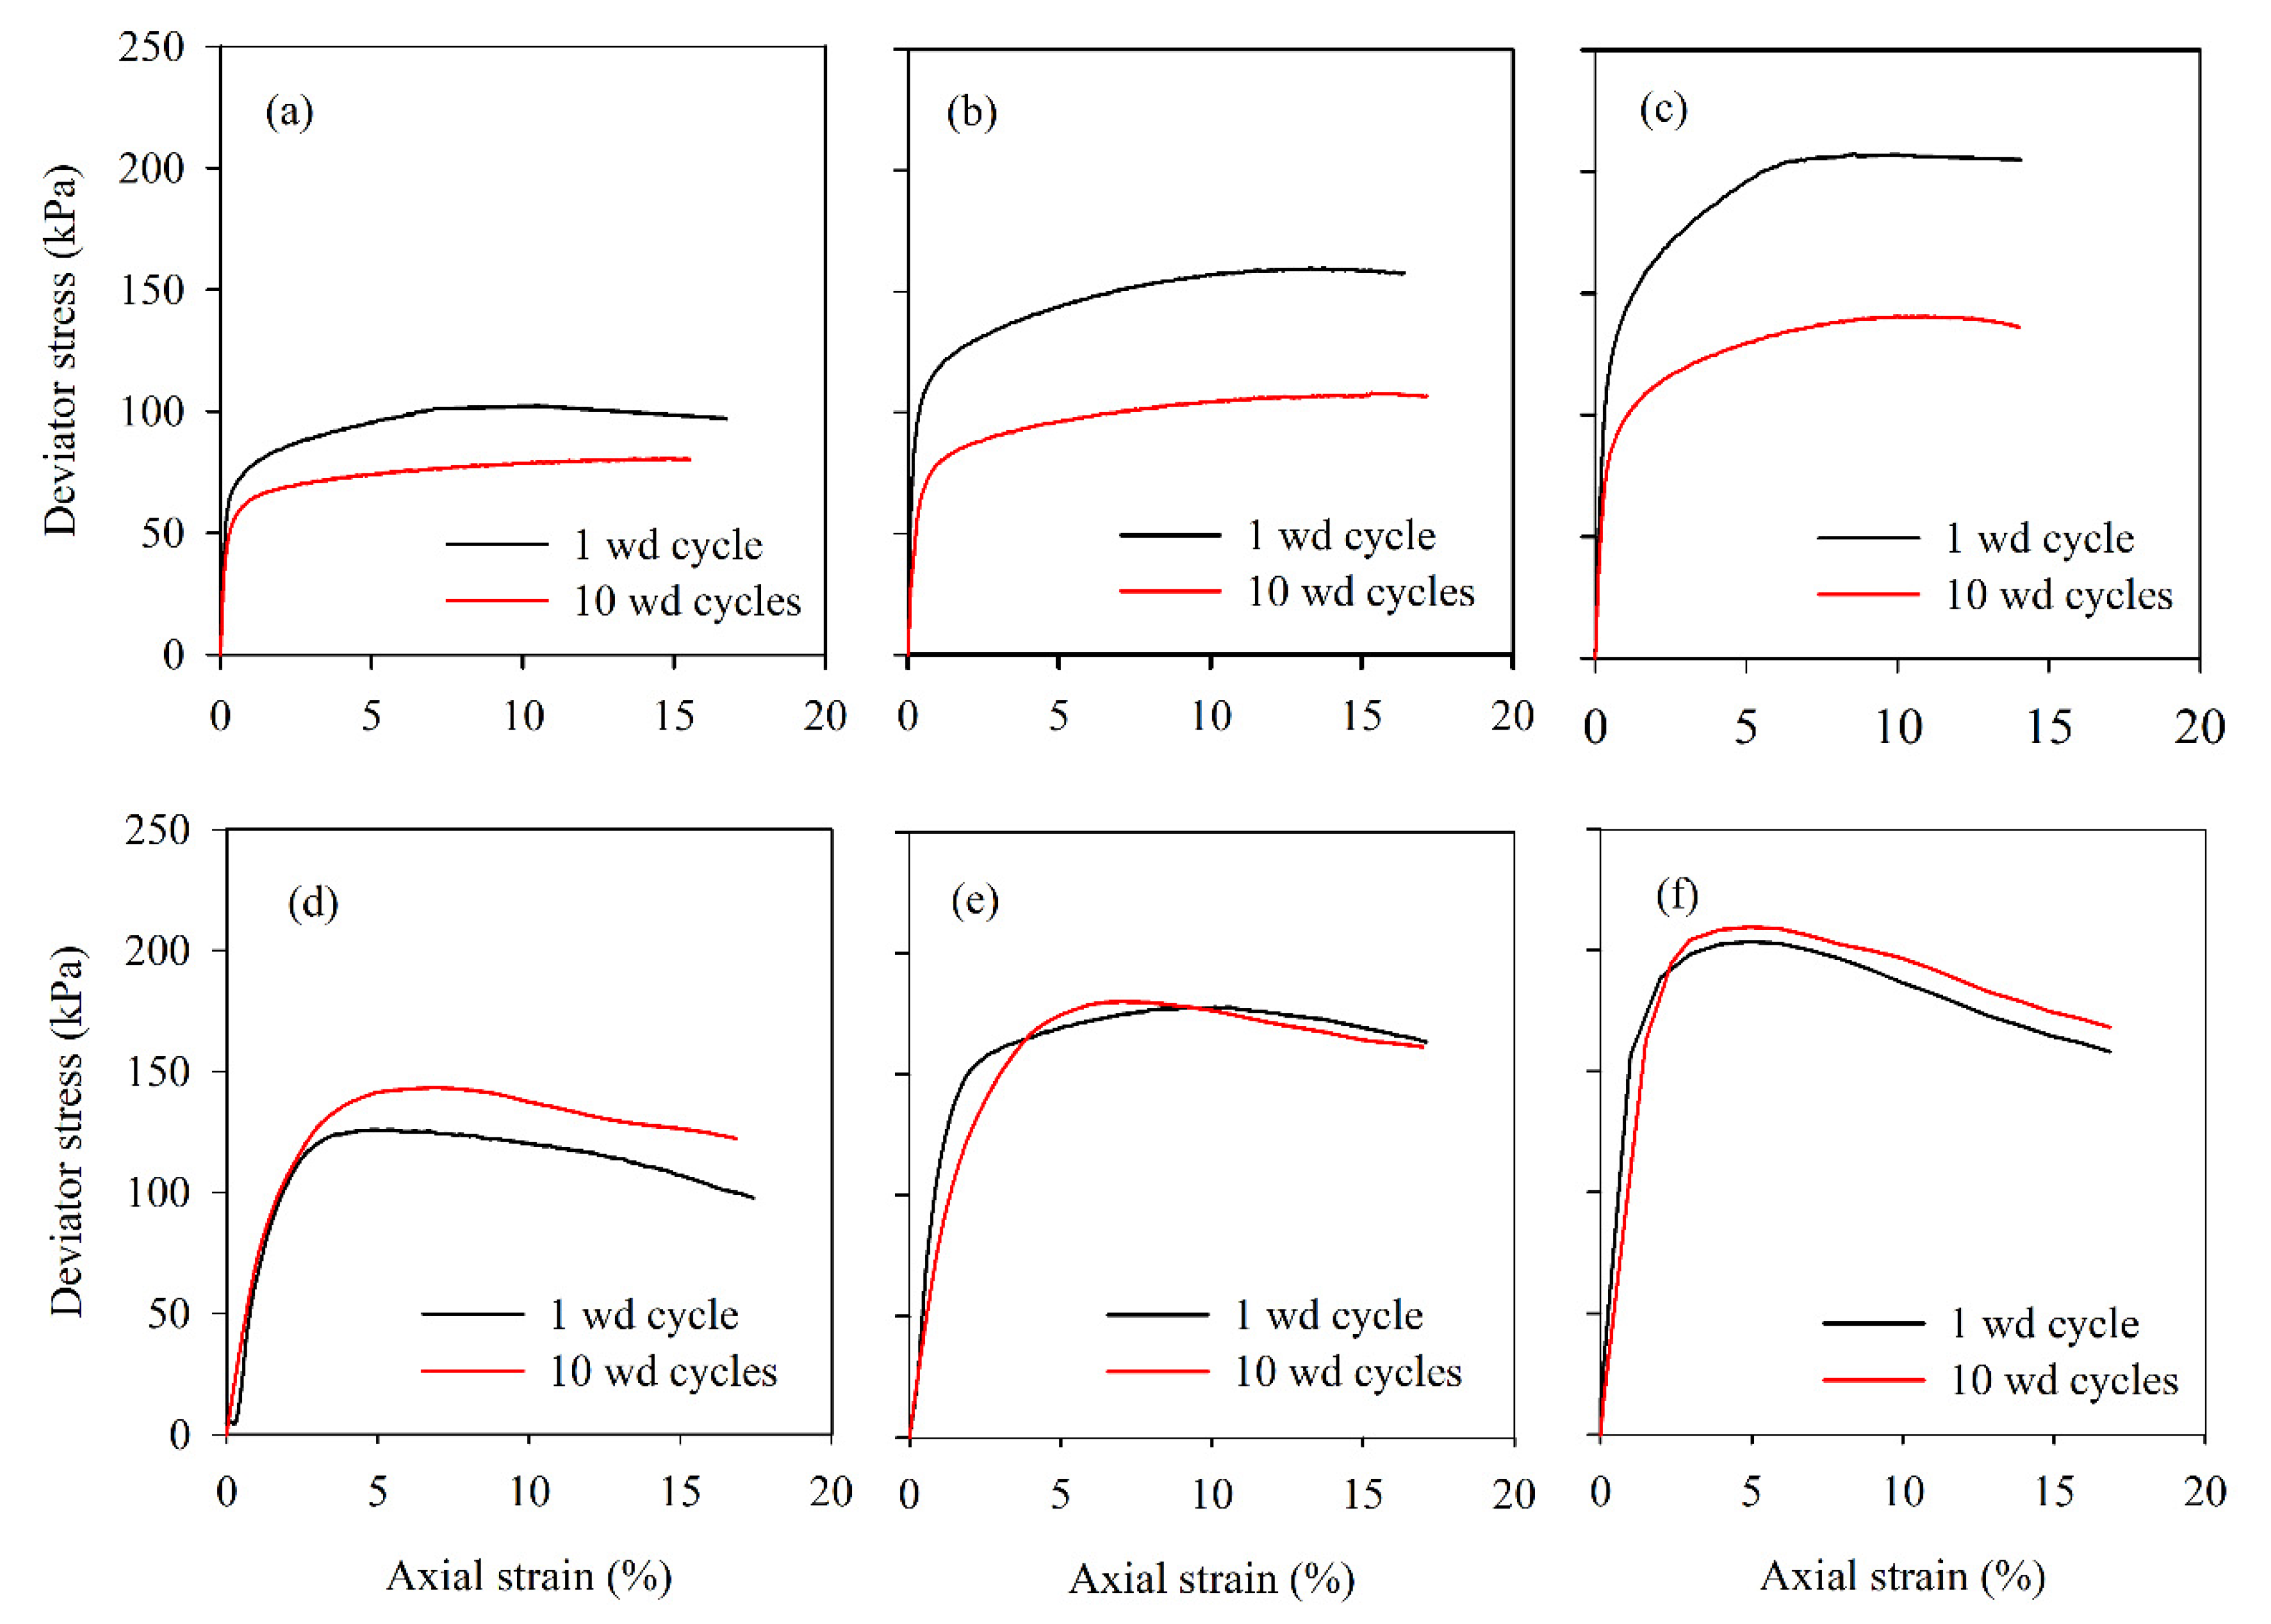
Figure 6 illustrates the deviator stress as a function of axial strain under confining pressures of 50, 100, and 200 kPa for both clayey and silty sand soils. The peak deviator stress increased with increasing applied confining pressures. The stress-strain responses for the clayey soil demonstrated strain-hardening behaviour, while the behaviour for the silty sand soil is characterised by strain-softening. Notably, the peak deviator stress for the clayey soil after 1 wetting and drying cycle were 102, 159 and 207 kPa under cell pressures of 50, 100, and 200 kPa, respectively. Following 10 wetting and drying cycles, the peak deviator stress decreased to 70, 112 and 135 kPa, indicating soil deterioration due to increased wetting and drying cycles. Additionally, the variation of deviator stress under confining pressure for silty sand is represented in Figure 5d, e, and f. The peak deviator stress values for the silty sand after 1 wetting and drying cycle were 121, 176 and 202 kPa under cell pressures of 50, 100 and 200 kPa, respectively. After 10 wetting and drying cycles, these values increased slightly to 143, 180, and 215 kPa under the same cell pressures.
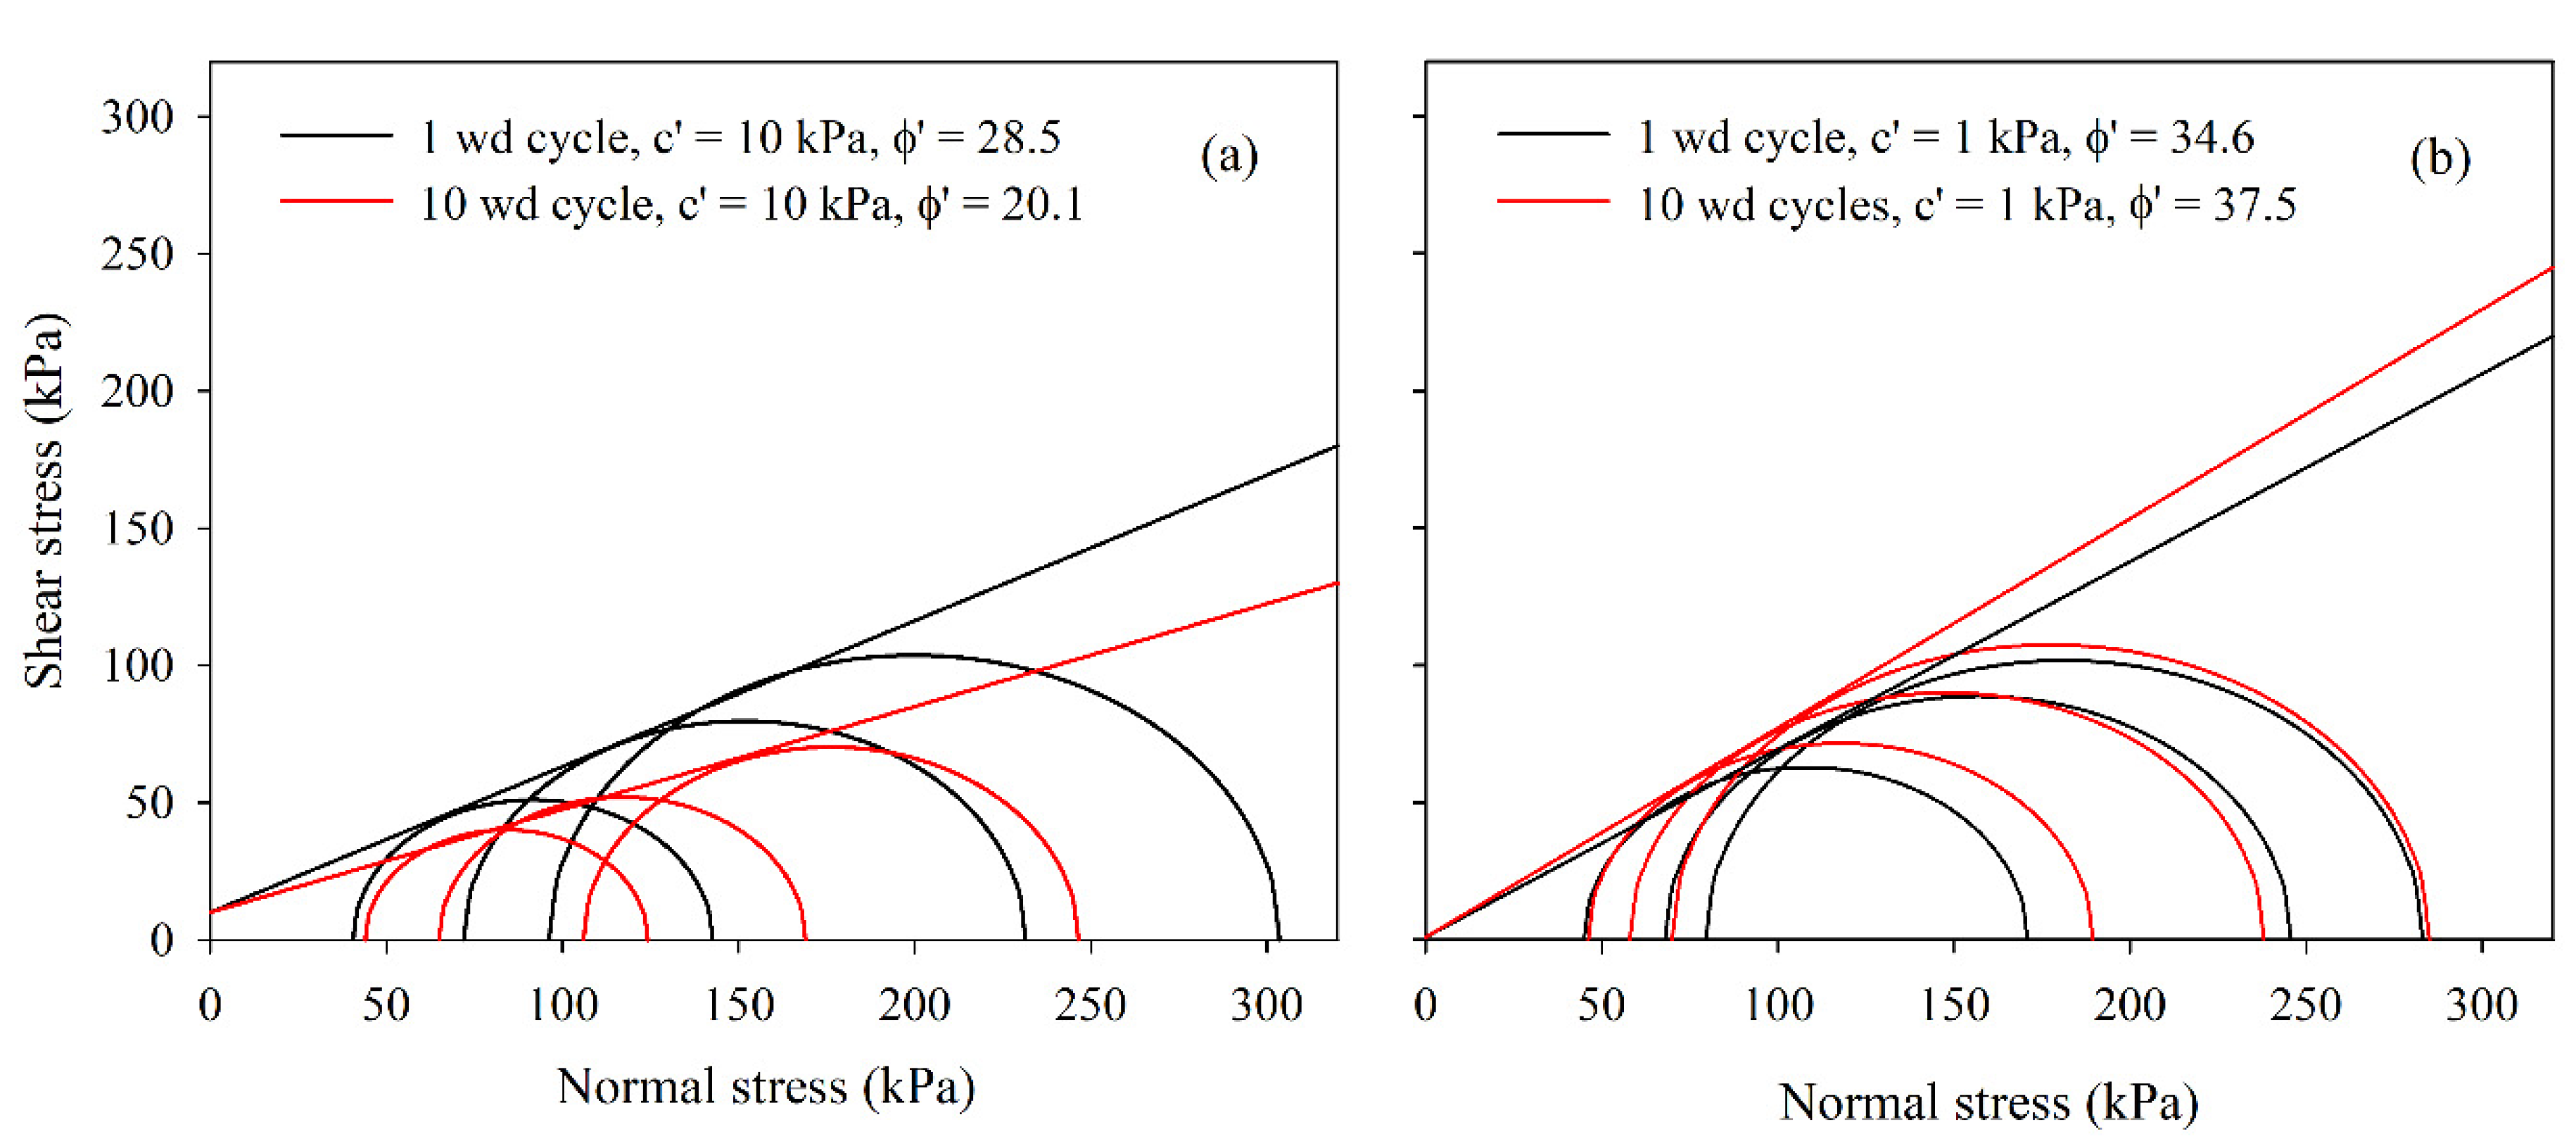
The analysis involved using Mohr circles to determine the effective cohesion and angle of internal friction and examined the impact of wetting and drying cycles, as illustrated in Figure 7. The results indicated that the effective cohesion of clayey soil was 10 kPa, which did not change with wd cycles. However, the effective angle of internal friction decreased, with values ranging from 28.5 degrees at the onset to approximately 20.1 degrees after 10 wetting and drying cycles, representing a 29% reduction in the soil's internal friction angle. In contrast, the effective cohesion for silty sand was 1 kPa, while the effective angle of internal friction increased from 34.6 to 37.5 degrees over 10 wetting and drying cycles. These fluctuations underscore the dynamic nature of soil behaviour in response to changes in moisture content, impacting its stability and resistance to deformation across successive wetting and drying cycles. A comprehensive understanding of these variations is essential for predicting and managing potential soil instability issues in engineering and construction applications.

3.4. Performance of Model Flood Embankment under Wetting and Drying Cycles

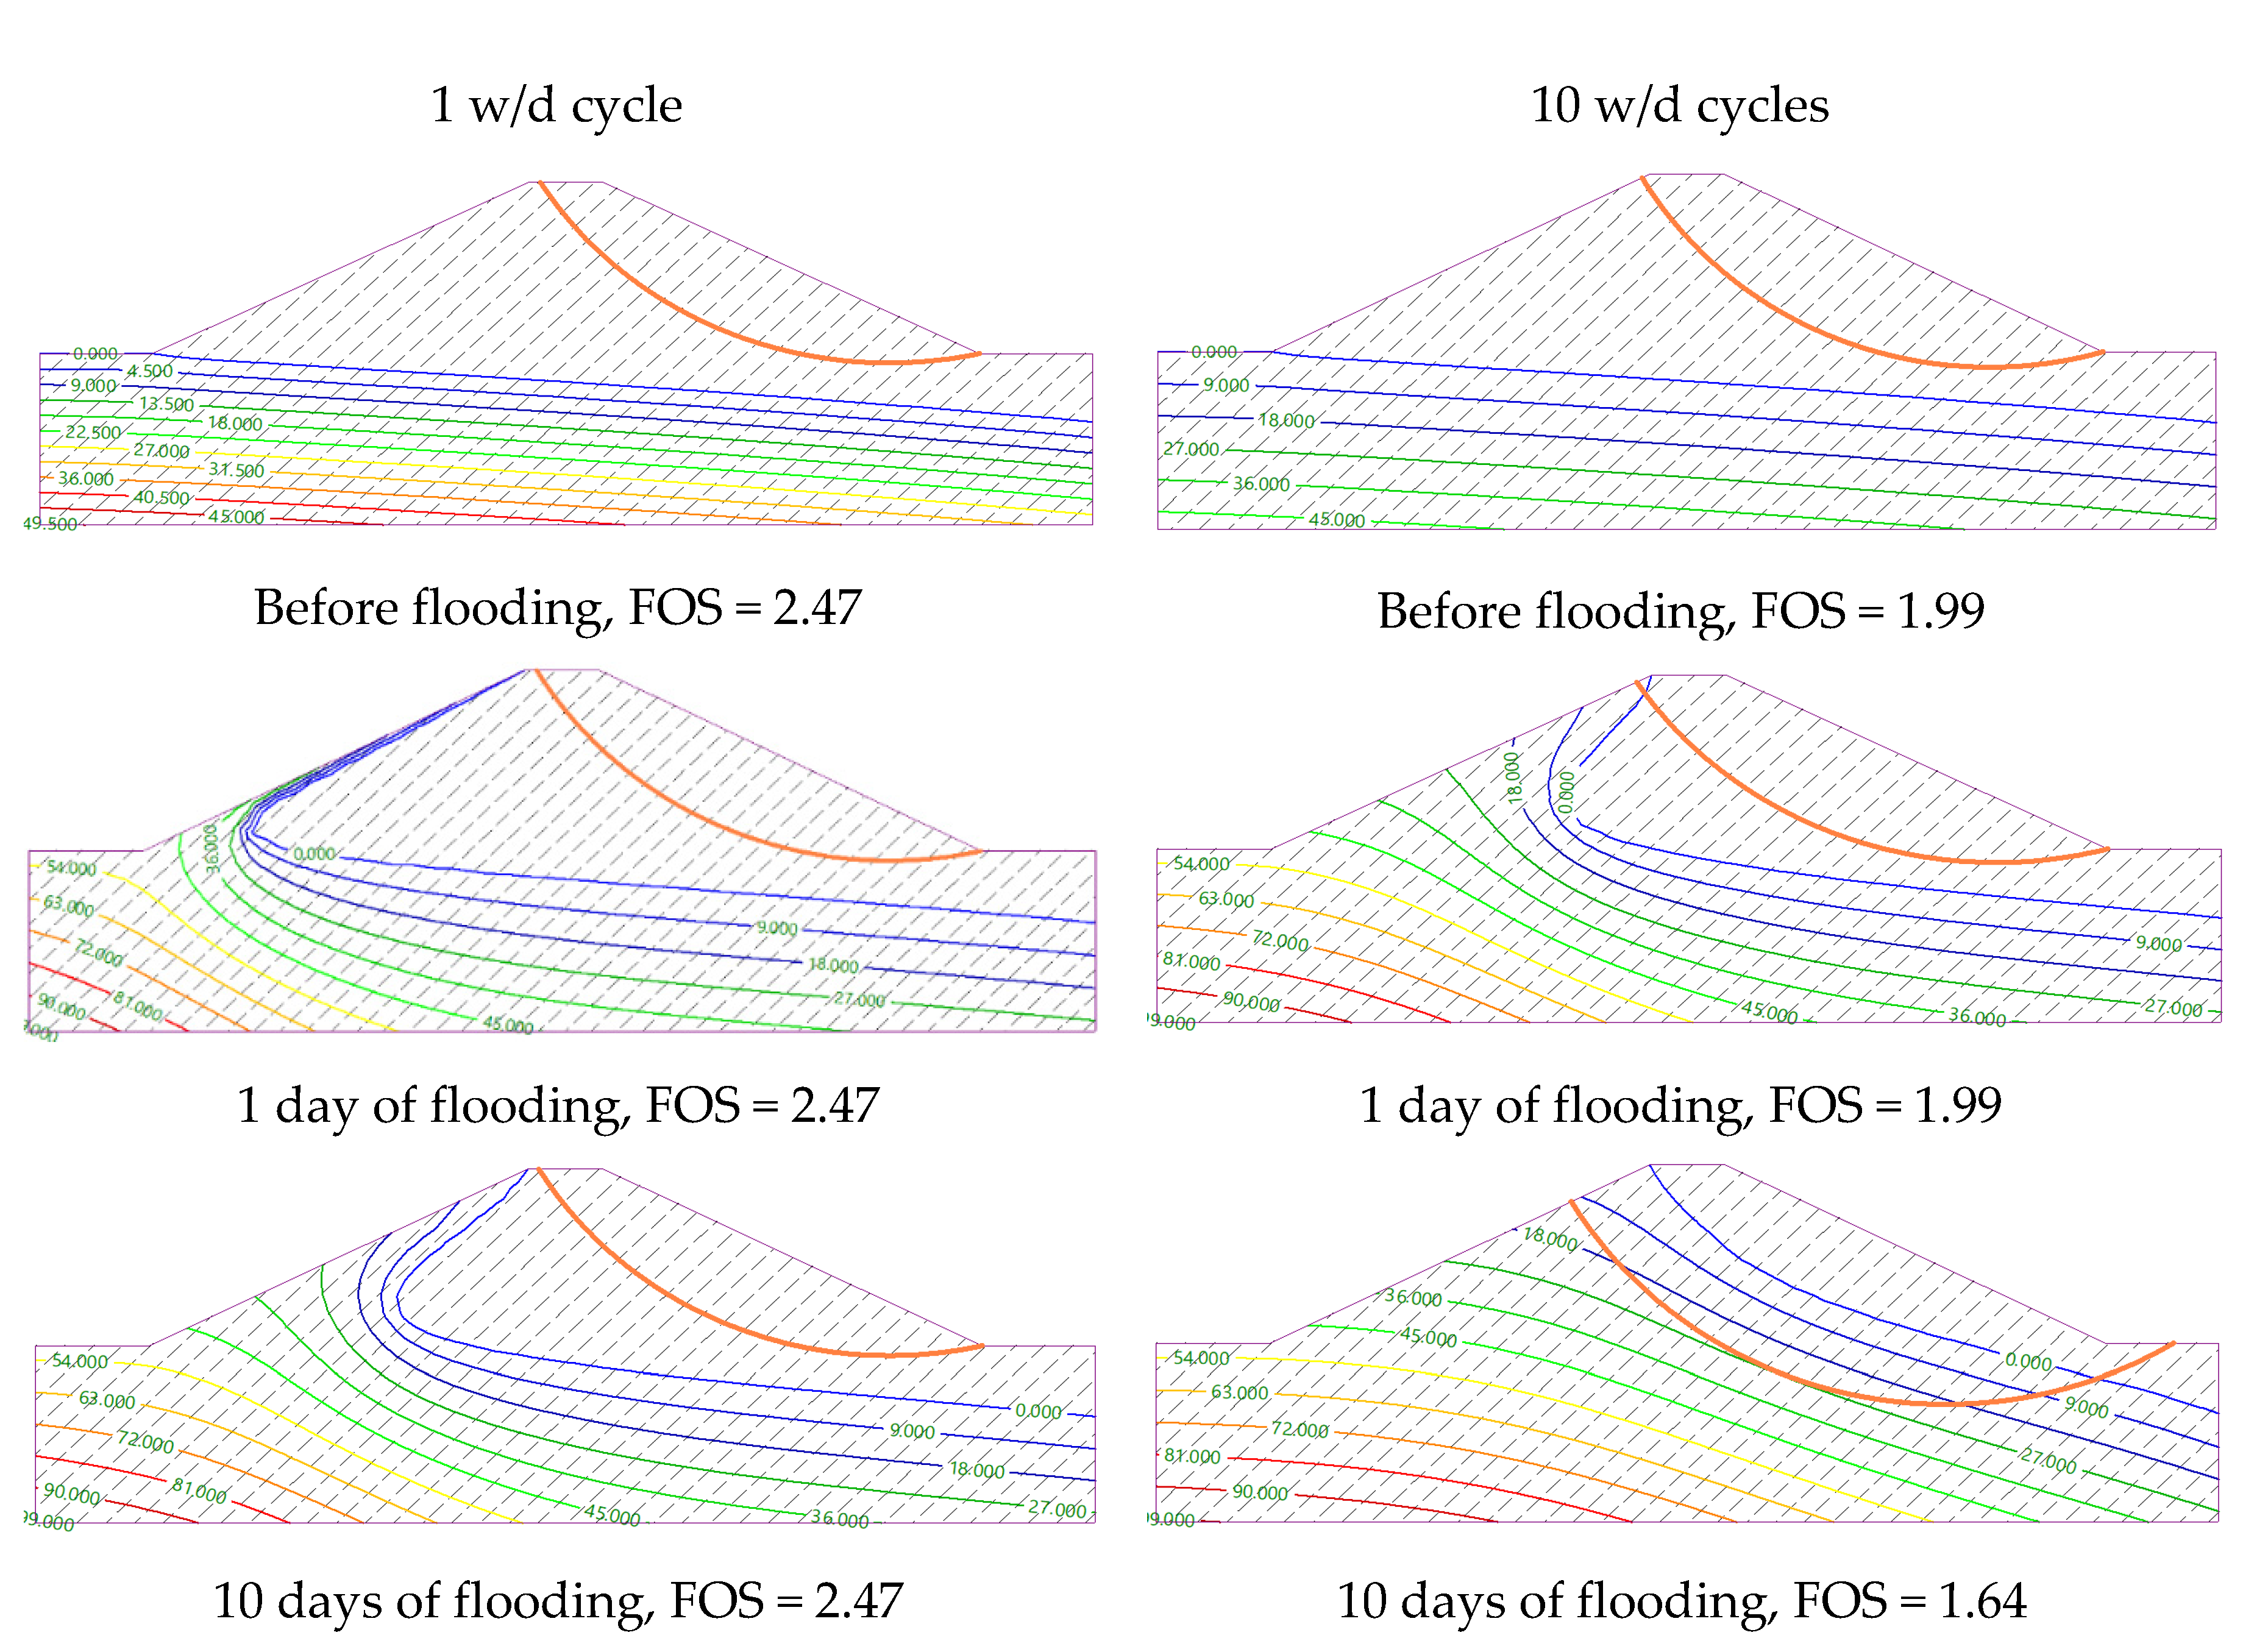
The initial factor of safety for a newly constructed clayey embankment was determined to be 2.47. The duration of flooding to the crest level on both days 1 and 10 did not affect the factor of safety of the newly constructed embankment, primarily due to the relatively impervious nature of the clayey soil. After being exposed to 10 wetting and drying cycles, the factor of safety of the deteriorated clayey embankment was found to be 1.99 before flooding, indicating a 20% reduction compared to the newly constructed embankment. With ten days of flooding to the crest level, the factor of safety of the deteriorated embankment was further reduced to 1.64, reflecting a 34% reduction in total (Figure 8). This decline is attributed to the loss of shear strength, soil suction, and increased saturated hydraulic conductivity of the soil due to wetting and drying cycles.
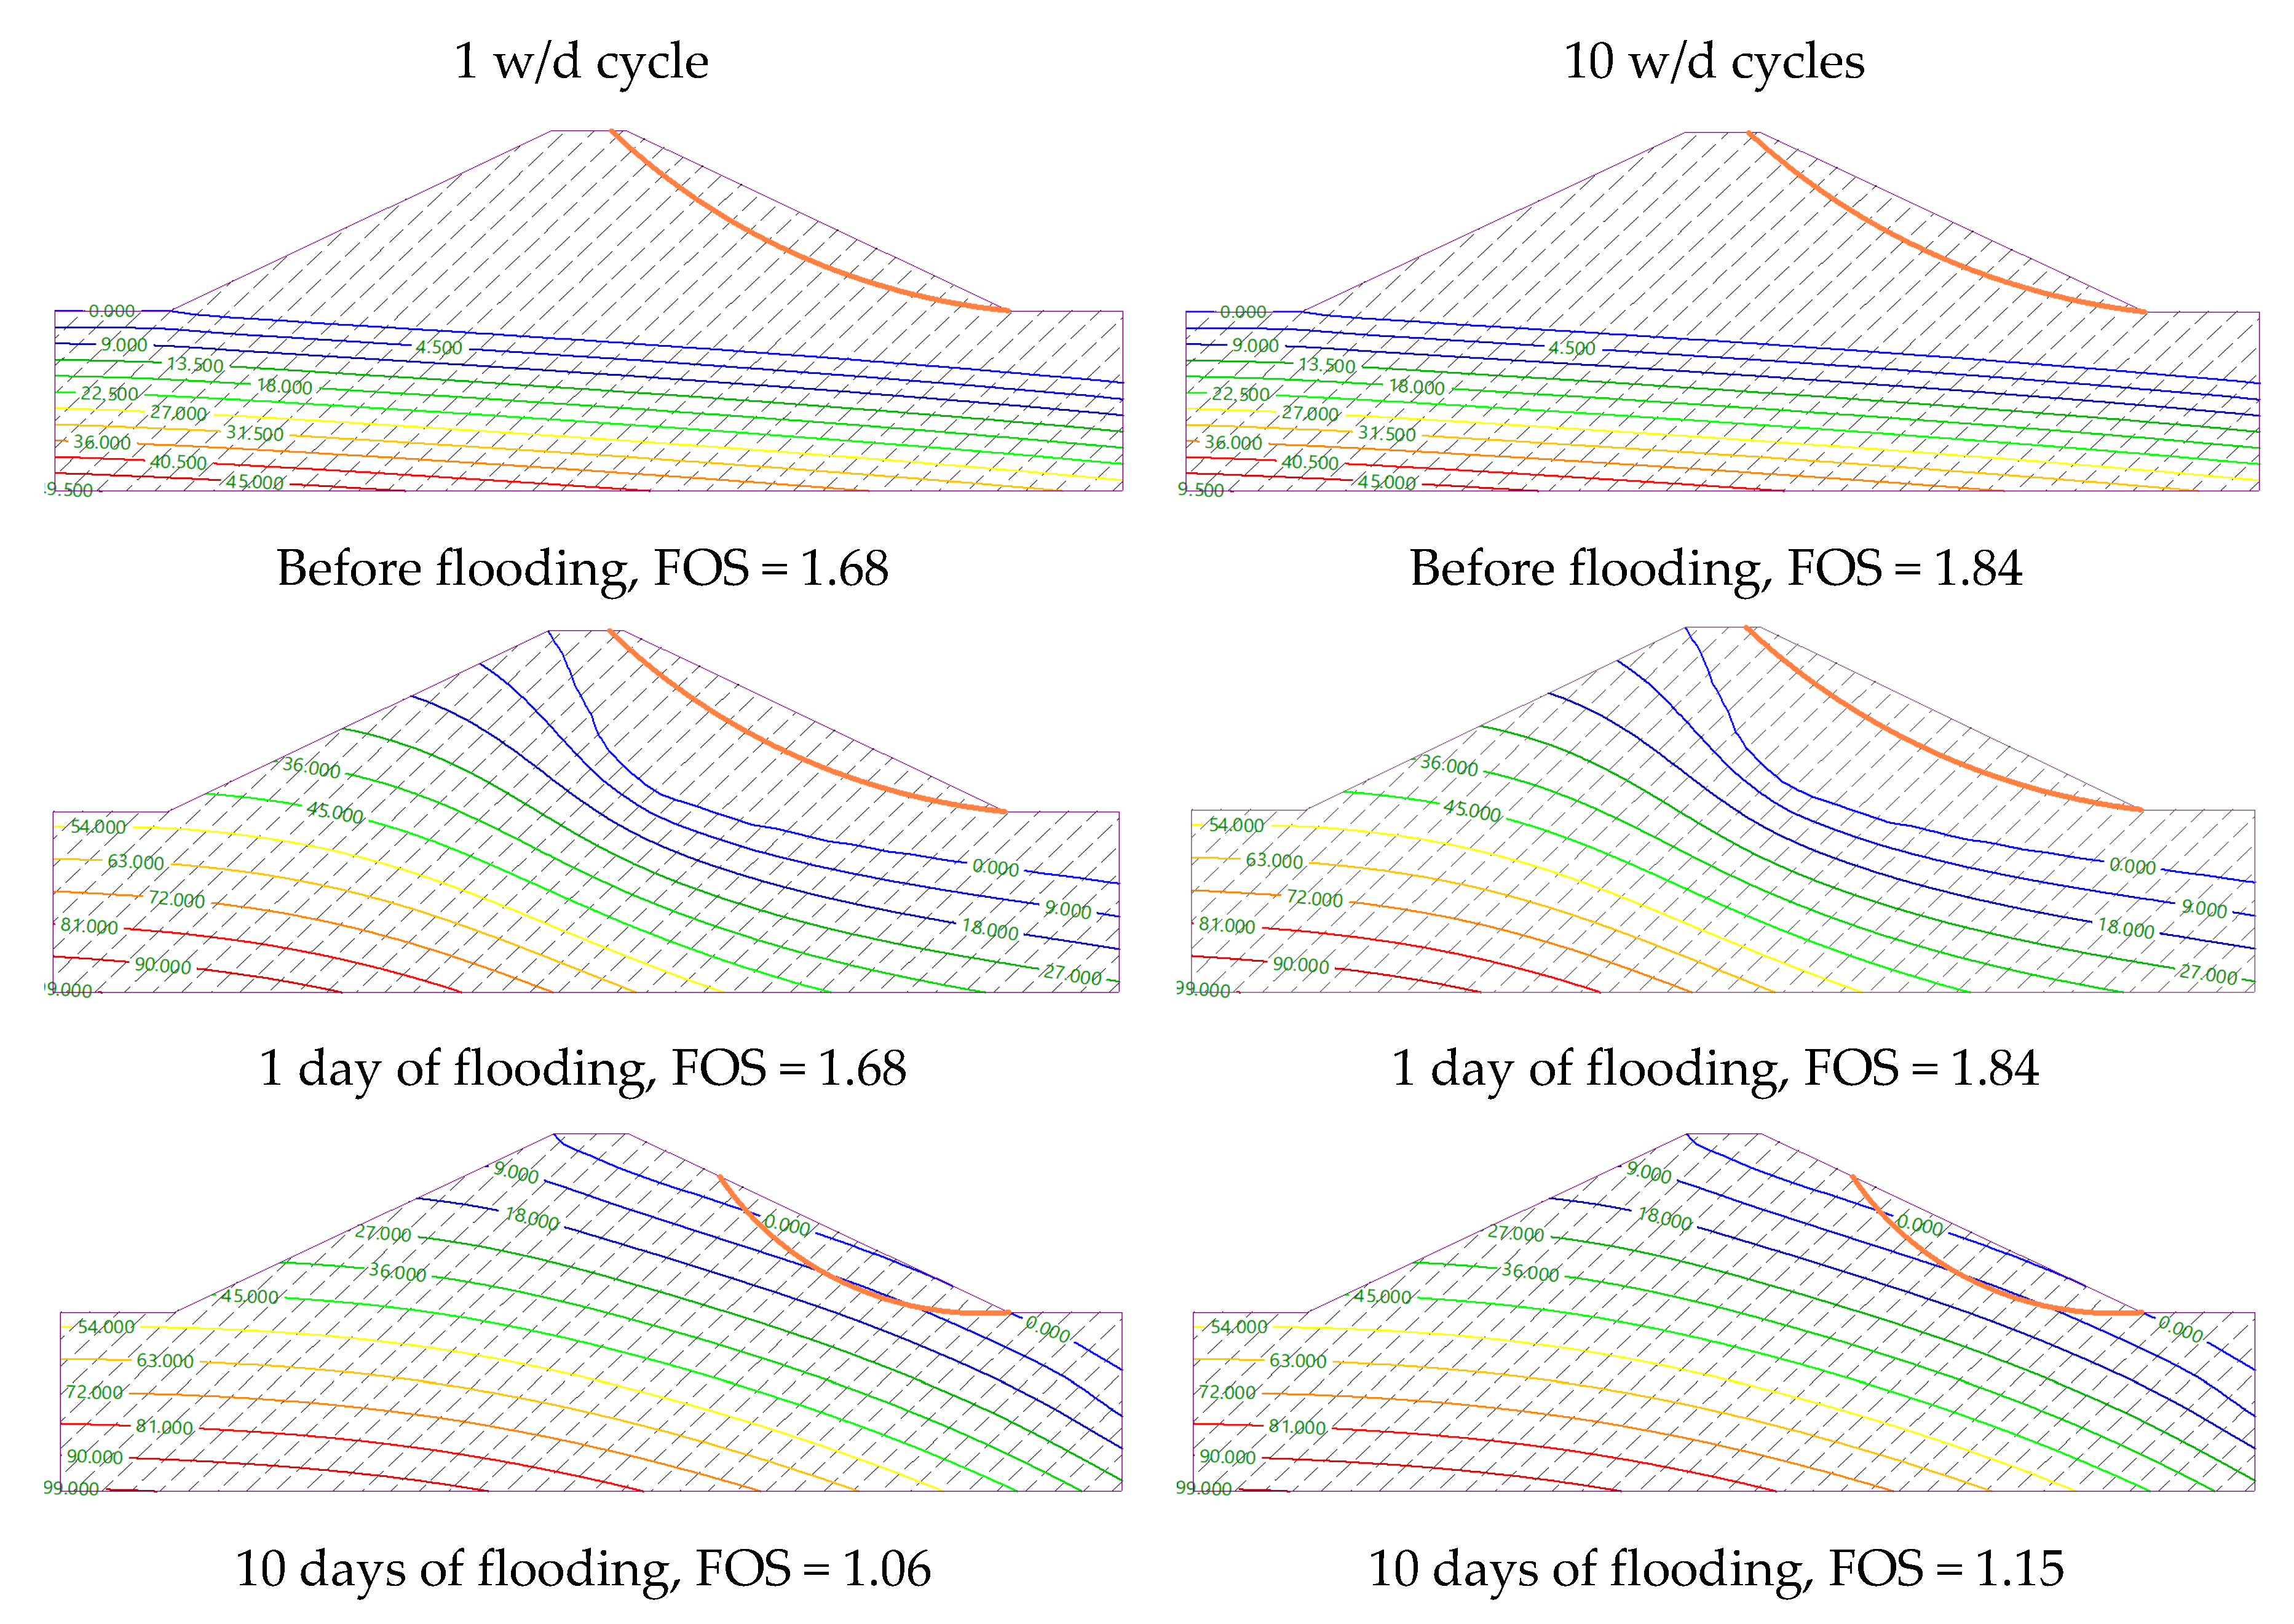
The initial factor of safety for a recently constructed embankment consisting of silty sand was calculated to be 1.68, and this value remained unchanged when the embankment was subjected to flooding at the crest level on day 1. However, after 10 days of flooding at the crest level, the factor of safety decreased to 1.06, representing a 37% decrease in stability between dry and saturated conditions. Subsequently, following ten wetting and drying cycles, simulating an aged embankment, the factor of safety rose to 1.84, indicating a 10% increase. This improvement can be attributed to the consolidation and compaction of the silty sand soil resulting from the wetting and drying process. Notably, the impact of flooding on the silty sand embankment appears to be consistent, regardless of whether the embankment is newly constructed or aged (Figure 9).

4. Discussion

The work presented in this paper provides evidence that cracking in clayey soil due to the action of wetting and drying [3] and the resultant loss of strength and water retention capacity, along with increased permeability, is a precursor to the initiation of progressive failure. In contrast, silty sand soil gets compacted and consolidated with wetting and drying cycles, which improves its shear strength and slope stability.
The clay soil samples exhibited significant swelling and shrinkage during wetting and drying (wd) cycles, leading to permanent changes in pore structure and crack formation. In contrast, silty sand soil showed considerably less shrinkage and swelling during wd cycles. Wetting gradually increased the number and size of intra- and inter-aggregate pores [32]. The evolution of soil microstructure during wetting is closely related to the wetting conditions. Under unconfined conditions, soil aggregates expanded and broke into smaller pieces, mainly increasing intra-aggregate pore sizes [33]. In confined wetting, inter-aggregate pores gradually closed, while intra-aggregate pores increased in volume [34,35]. Conversely, soil suction increased during drying, and overall volume decreased primarily due to significant shrinkage of macropores, while micropores remained unchanged or slightly increased [36]. Repeated wd cycles caused cumulative damage to the soil, leading to the enlargement of localized weak zones and the development of cracks at the mesoscopic scale [37]. This is supported by Stirling et al. [13], who demonstrated that successive wetting and drying caused the development of a progressively increasing network of interconnected micro-scale cracks throughout the soil specimens. Similar results were observed by Azizi et al. [38], when compacted silty clay was exposed to six wetting and drying cycles.
The increasingly porous clayey soil, due to 10 wd cycles, loses the ability to generate the same magnitude of suction at a given water content, as compared to the soil water characteristic curve of the clayey soil at 1 wd cycle. Wetting and drying cycles cause a shift in the soil water characteristics curve for clayey soil, as demonstrated in Fig. 5, but if wetting and drying cycles continue over the same suction range, then the movement in the curves stops after 3–4 cycles [39,40]. The soil water retention behaviour then becomes quite repeatable. However, Stirling et al., [13] showed that if a sample is subject to wetting and drying cycles where the suction is increased beyond that experienced before, the wetting and drying loop shifts downwards. This means that each time drying progresses beyond the prior maximum suction value that an asset has been subject to due to a more extreme drying event than has occurred in its history, an additional deterioration in performance because of suction loss can be expected. The saturated hydraulic conductivity of clayey soil treated with 10 wetting and drying cycles was measured about 5 times higher than that of 1 wetting and drying cycle. Supporting this, Stirling et al., [13] found a clear connectivity between cracking and near-surface saturation and run-off. Similar results were reported by Dixon et al., [41]. They found large variability in hydraulic conductivity in the uppermost 1 m of the clayey embankment, with values in the top 0·8 m having a range from 1 x 10⁻⁴ to 5 x 10⁻¹⁰ m/s (i.e., over five orders of magnitude) and a marked reduction in hydraulic conductivity with depth. Therefore, exposure to weather-driven deterioration affects the near-surface zone for clayey soil, which reduces soil water retention and increases hydraulic conductivity. However, no significant difference in soil water characteristic curves was found for silty sand soil between 1 and 10 wetting and drying cycles (Figure 5). The saturated hydraulic conductivity for the silty sand soil was reduced by 3% at 10 wd cycles compared to 1 wd cycle (Table 1).
Understanding the effective shear strength of soil is crucial for evaluating the long-term stability of foundations, slopes, and other engineering projects, predicting future stability and issuing safety warnings. Our research found that the effective angle of internal friction in clayey soil significantly decreased with more wetting and drying cycles, while the effective cohesion remained relatively unchanged. There is limited research on the drained/effective shear strength of soil influenced by wetting and drying cycles, and existing studies show conflicting results. For example, Zhou et al. [42] found that the internal friction angle fluctuates within a narrow range, with the reduction in cohesion being the primary cause of shear strength degradation during wd cycles. Zhu et al. [43] and Khan et al. [8] reported a decrease in both cohesion and internal friction angle of soil with wd cycles for expansive soils. Hafhouf et al. [44] observed a significant reduction in cohesion but an increase in the internal friction angle of Sebkha soil with wd cycles.
The increase in the angle of internal friction for silty sand from 1 to 10 wetting and drying (w/d) cycles can be attributed to several factors related to soil structure, particle rearrangement, and compaction effects. Initially, silty sand may have a relatively loose structure with more void spaces. As the soil undergoes multiple wd cycles, the particles tend to settle and rearrange more tightly, reducing void spaces and increasing the soil's density. These cycles lead to particle rearrangement, which densifies the soil structure, reducing void spaces and enhancing interparticle friction [21]. Additionally, changes in soil suction during these cycles cause particles to draw closer together, further stabilising the soil. Studies by Nahlawi and Kodikara [45] and Rahardjo et al. [46] support these findings, showing increased soil strength and particle interlocking with repeated wd cycles.
Loss of suction at a given water content, high saturated hydraulic conductivity, crack formation in soils and, hence, reduction in shear strength are significant problems in earth-based infrastructure [47,48]. Shrinkage cracks can cause severe damage to the serviceability of earth-based infrastructure. There is evidence that cracks in slopes can penetrate to a depth of approximately 1 m [47,48] and that a hydrologically distinct layer exists in the top 1·5 m of a clayey slope [49]. In recent years, significant effort has been directed to better analyse ground and climate interactions applicable to a range of earth-based structures [13]. Comparing the two soil types, it is evident from our study that clayey soil embankments initially possess higher stability, as indicated by their higher safety factor (FOS). However, the stability of clayey soil is more adversely affected by wd cycles and prolonged flooding, showing a more significant decline in FOS over time. The weathering process in clay is partly a combination of cracking (and the resultant enhanced surface hydraulic conductivity) and loss of strength due to a reduced ability to generate and maintain suction. This reduction in shear strength can cause down-slope movements, which, if large enough, can result in strain softening and load redistribution. Ultimately, changes in loading or further weather-driven deterioration could lead to slope failure. On the other hand, silty sand soil exhibits lower initial stability but shows greater resilience to wd cycles. Despite this, its FOS declines under prolonged flooding conditions due to the high saturated hydraulic conductivity, suggesting that while silty sand resists wd cycles-related deterioration, its stability is compromised due to increased pore water pressure and reduced effective stress due to prolonged flooding.

5. Conclusions

A laboratory study was conducted to assess the influence of wetting and drying cycles on the hydromechanical properties of clayey and silty sand soils. The comparison of soil deterioration between the two types revealed significant degradation in clayey soil, as opposed to an opposite trend observed in silty sand soil. The deterioration of clayey soil primarily stems from microstructural alterations in the soil fabric, resulting in reduced capacity to generate and sustain suction. Consequently, these changes lead to macrostructural manifestations such as cracking. These modifications in the soil fabric also entail variations in hydraulic conductivity and substantial declines in shear strength, with potential implications for seasonal ratcheting deformations and structural failure. In contrast, silty sand soils show greater resilience to wd cycles, with less pronounced shrinkage and swelling. The increase in the angle of internal friction observed in silty sand with repeated wd cycles is due to particle rearrangement, densification, and enhanced interparticle friction.
The implications of this research may improve our ability to predict deteriorating conditions and evolving failures. This will allow asset owners to strategically invest in proactive remediation, minimising unforeseen failures, enhancing the asset's resilience against climate change, and significantly reducing the associated economic impact.

Author Contributions

Conceptualization, M.N. and S.S.A.S; methodology, M.N., K.S.T. and S.S.A.S.; formal analysis, M.N. and S.S.A.S; investigation, M.N., K.S.T. and S.S.A.S.; writing—original draft preparation, M.N. and S.S.A.S.; writing—review and editing, M.N., K.S.T. and S.S.A.S.; supervision, M.N.; project administration, M.N.; funding acquisition, M.N. and S.S.A.S.; All authors have read and agreed to the published version of the manuscript.

Funding

This research was funded by the PhD Vice Chancellor Scholarship for Kanishka S. Turrakheil at the University of West London.

Institutional Review Board Statement

Not applicable.

Informed Consent Statement

Not applicable.

Data Availability Statement

Due to privacy the data presented in this study are available on request from the corresponding author.

Acknowledgements

We thank the anonymous reviewers for their time and comments. We are also thankful to the University of West London for its generous funding of the vice chancellor PhD scholarship for the first author.

Conflicts of Interest

The authors declare no conflicts of interest.

References

  1. Clarke D, Smethurst JA. Effects of climate change on wetting and drying cycles in engineered clay slopes in England. Q J Eng. Geol. Hydrogeology, 2010;43:473–86. https://doi.org/10.1144/1470-9236/08-106. [CrossRef]
  2. Tang, C.S., Wang, D.Y., Shi, B. and Li, J., 2016. Effect of wetting–drying cycles on profile mechanical behaviour of soils with different initial conditions. Catena, 139, pp.105-116.
  3. Turrakheil, K.S., Shah, S.S.A. and Naveed, M., 2024. Evolution of Soil Pore Structure and Shear Strength Deterioration of Compacted Soil under Controlled Wetting and Drying Cycles. Atmosphere, 15, 843. https://doi.org/10.3390/ atmos15070843. [CrossRef]
  4. Xu, B., Yin, Z., et al. 2011 Experimental study of the factors and laws affecting the strength of expansive soil. Rock and Soil Mechanics, 32(1), pp. 44-50.
  5. Li, X.Y., Hu, H.B. and Guo, W., 2014. Dry-wet circulation intensity attenuation law of subgrade under the condition of clay. Highway Engineer, 164(1), pp.150-152.
  6. Xu, J., Zhou, L., Hu, K., Li, Y., Zhou, X. and Wang, S., 2022. Influence of wet-dry cycles on uniaxial compression behaviour of fissured loess disturbed by vibratory loads. KSCE Journal of Civil Engineering, 26(5), pp.2139-2152.
  7. Niu, Z.L., Xu, J., Li, Y.F., Wang, Z.F. and Wang, B., 2022. Strength deterioration mechanism of bentonite modified loess after wetting–drying cycles. Scientific Reports, 12(1), p.3130. [CrossRef]
  8. Khan, M.A., Hossain, M.S., Khan, M.S., Samir, S. and Aramoon, A., 2017. Impact of wet-dry cycles on the shear strength of high plastic clay based on direct shear testing. In Geotechnical Frontiers 2017 (pp. 615-622).
  9. Zhang, J.R., Xu, Q. and Sun, D.A., 2014. Simulation of soil-water characteristic curves during drying and wetting cycles. Rock and soil mechanics, 35(3), pp.689-695.
  10. Dyer, M., 2004, December. Performance of flood embankments in England and Wales. In Proceedings of the Institution of Civil Engineers-Water Management (Vol. 157, No. 4, pp. 177-186). Thomas Telford Ltd.
  11. Gowthaman, S.; Nakashima, K.; Kawasaki, S. Effect of wetting and drying cycles on the durability of biocemented soil of expressway slope. Int. J. Environ. Sci. Technol., 2022, 19, 2309–2322. [CrossRef]
  12. Rasul, J.M., Ghataora, G.S. and Burrow, M.P., 2018. The effect of wetting and drying on the performance of stabilised subgrade soils. Transportation Geotechnics, 14, pp.1-7.
  13. Stirling, R.A., Toll, D.G., Glendinning, S., Helm, P.R., Yildiz, A., Hughes, P.N. and Asquith, J.D., 2021. Weather-driven deterioration processes affecting the performance of embankment slopes. Géotechnique, 71(11), pp.957-969. [CrossRef]
  14. Tu, Y.; Zhang, R.; Zhong, Z.; Chai, H. The strength behavior and desiccation crack development of silty clay subjected to wetting-drying cycles. Front. Earth Sci. 2022, 10, 852820. [CrossRef]
  15. Zhao, G.T., Han, Z., Zou, W.L. and Wang, X.Q., 2021. Evolution of mechanical behaviours of an expansive soil during drying-wetting, freeze-thaw, and drying-wetting-freeze–thaw cycles. Bulletin of Engineering Geology and the Environment, 80(10), pp.8109-8121. [CrossRef]
  16. Zhang, J., Hu, H., Peng, J., Zhang, Y. and Zhang, A. 2024. Enhanced understanding of subgrade soil hydraulic characteristics: Effects of wetting–drying cycles and stress states on subgrade water migration. Journal of Hydrology, 635, 131165. https://doi.org/10.1016/j.jhydrol.2024.131165. [CrossRef]
  17. Ng, C. and Daniel, P. 2023. Pore structure effects on the water retention behaviour of a compacted silty sand soil subjected to drying-wetting cycles. Eng. Geol. 106963. https://doi.org/10.1016/j.enggeo.2022.106963. [CrossRef]
  18. Jing, J., Hou, J., Sun, W., Chen, G., Ma, Y. and Ji, G. 2022. Study on influencing factors of unsaturated loess slope stability under dry-wet cycle conditions. J. Hydrol. 612 (Part B), 128187. [CrossRef]
  19. Wen, T., Chen, X., Shao, L. 2022. Effect of multiple wetting and drying cycles on the macropore structure of granite residual soil. J. Hydrol. 614, 128583 https://doi.org/ 10.1016/j.jhydrol.2022.128583. [CrossRef]
  20. Chen, X., Quan, Q., Zhang, K. and Wei, J., 2021. Spatiotemporal characteristics and attribution of dry/wet conditions in the Weihe River Basin within a typical monsoon transition zone of East Asia over the recent 547 years. Environmental Modelling & Software, 143, p.105116. [CrossRef]
  21. Ventini, R., Dodaro, E., Pirone, M., Giretti, D., Gragnano, C.G., Fioravante, V., Gottardi, G. and Mancuso, C., 2023, June. Integrated Physical and Numerical Modelling to Study the Hydro-Mechanical Response of a River Embankment. In National Conference of the Researchers of Geotechnical Engineering (pp. 569-577). Cham: Springer Nature Switzerland.
  22. Zhao, Ya. (2022). The Influence of Rainfall and Evaporization Wetting-Drying Cycles on the Slope Stability. Advances in Meteorology. 2022. 1-8. 10.1155/2022/5775424.
  23. Hassan, M.A., Ismail, M.A.M. and Shaalan, H.H., 2022. Numerical modelling for the effect of soil type on stability of embankment. Civil Engineering Journal, 7, pp.41-57. [CrossRef]
  24. BS 1377-1: 2016 Methods of test for soils for civil engineering purposes – Part 1: General requirements and sample preparation.
  25. BS 1377-2: 2022; Methods of Test for Soils for Civil Engineering Purposes—Part 2: Classification Tests and Determination of Geotechnical Properties. The British Standards Institution: London, UK, 2016.
  26. BS 1377-4: 1990 Methods of test for soils for civil engineering purposes – Compaction related tests.
  27. BS 1377-6:1990 - Methods of test for soils for civil engineering purposes. Consolidation and permeability tests in hydraulic cells and with pore pressure measurement.
  28. ASTM Standard D5298-03, 2007, Standard Test Method for Measurement of Soil Potential (Suction) Using Filter Paper, Annual Book of ASTM Standards, Soil and Rock (I), 4(8), ASTM International, West Conshohocken, PA.
  29. Chandler, R.J., Crilly, M.S., Montgomery-Smith, G. 1992. A low-cost method of assessing clay desiccation for low-rise-buildings. Proc Inst Civil Eng. 92, 82-9. [CrossRef]
  30. Van Genuchten, M. Th. 1980. A closed-form equation for predicting the hydraulic conductivity of unsaturated soils. Soil Sci. Soc. Am. J. 44: 892–898. [CrossRef]
  31. Shah, Syed Samran Ali, Abdul Rahim Asif, Waqas Ahmed, Ihtisham Islam, Muhammad Waseem, Hammad Tariq Janjuhah, and George Kontakiotis. 2023. "Determination of Dynamic Properties of Fine-Grained Soils at High Cyclic Strains" Geosciences 13, no. 7: 204. https://doi.org/10.3390/geosciences13070204. [CrossRef]
  32. Tang, C.-S., Cheng, Q., Gong, X., Shi, B. and Inyang, H.I. 2023. Investigation on microstructure evolution of clayey soils: A review focusing on wetting/drying process. J. Rock Mech. Geotech. Eng., 15, 269–284. [CrossRef]
  33. Ye, W.M., Wan, M., Chen, B., Cui, Y. and Wang, J. 2011. Micro-structural behaviors of densely compacted GMZ01 bentonite under drying/wetting cycles. Chin. J. Geotech. Eng., 33, 1173–1177.
  34. Cui, Y.J., Yahia-Aissa, M. and Delage, P.A. 2002. model for the volume change behavior of heavily compacted swelling clays. Eng. Geol., 64, 233–250. [CrossRef]
  35. Liu, Y. 2016. Investigation on the swelling properties and microstructure mechanism of compacted Gaomiaozi bentonite. J. Eng. Geol., 24, 451–458.
  36. Cuisinier, O., Auriol, J.C., Le Borgne, T. and Deneele, D. 2011. Microstructure and hydraulic conductivity of a compacted lime-treated soil. Eng. Geol., 123, 187–193. [CrossRef]
  37. Zhou, R., Wang, B., Han, S., Wang, D. and Zhang, F. 2024. Mechanisms of crack development and strength deterioration in compacted expansive soils under controlled wetting-drying conditions. Eng. Fail. Anal., 159, 108133. [CrossRef]
  38. Azizi, A., Musso, G. and Jommi, C. 2019. Effects of repeated hydraulic loads on microstructure and hydraulic behaviour of a compacted clayey silt. Can. Geotech. J. 57, No. 1, 100–114, https://doi.org/10.1139/cgj-2018-0505. [CrossRef]
  39. Alonso, E. E., Romero, E., Hoffmann, C. and García-Escudero, E. 2005. Expansive bentonite-sand mixtures in cyclic controlled suction drying and wetting. Eng. Geol. 81, No. 3, 213–226. [CrossRef]
  40. Liu, G., Toll, D. G., Kong, L. and Asquith, J. D. 2020. Matric suction and volume characteristics of compacted clay soil under drying and wetting cycles. Geotech. Test. J. 43, No. 2, 20170310. [CrossRef]
  41. Dixon, N., Crosby, C. J., Stirling, R., Hughes, P. N., Smethurst, J., Briggs, K., Hughes, D., Gunn, D., Hobbs, P., Loveridge, F., Glendinning, S., Dijkstra, T. & Hudson, A. 2019. In situ measurements of near-surface hydraulic conductivity in engineered clay slopes. Q. J. Eng Geol. Hydrogeol. 52, No. 1, 123–135. [CrossRef]
  42. Zhou, R.; Wang, B.; Han, S.; Wang, D.; Zhang, F. Mechanisms of crack development and strength deterioration in compacted expansive soils under controlled wetting-drying conditions. Eng. Fail. Anal. 2024, 159, 108133. [CrossRef]
  43. Zhu, R.; Cai, Z.; Huang, Y.; Zhang, C.; Guo, W.; Wang, Y. Effects of wetting-drying-freezing-thawing cycles on mechanical behaviours of expansive soil. Cold Reg. Sci. Technol. 2022, 193, 103422.
  44. Hafhouf, I. and Khelifa, 2023. A. Impact of drying-wetting cycles on shear properties, suction, and collapse of Sebkha soils. Heliyon, e13594. [CrossRef]
  45. Nahlawi, H. and Kodikara, J. 2006. Laboratory Experiments on Desiccation Cracking of Thin Soil Layers. Geotechnical and Geological Engineering, 24, 1641-1664. http://dx.doi.org/10.1007/s10706-005-4894-4. [CrossRef]
  46. Rahardjo, H., Leong, E.C., and Rezaur, R.B. 2004. Effect of antecedent rainfall on pore-water pressure distribution characteristics in residual soil slopes. Journal of Hydrology, 287(1-4), 24-42.
  47. Anderson, M.G., Hubbard, M.G. and Kneale, P.E. 1982. The influence of shrinkage cracks on pore-water pressures within a clay embankment. Q. J. Engng Geol. Hydrogeol. 15, No. 1, 9–14. [CrossRef]
  48. Dyer, M., Utili, S. and Zielinski, M. 2009. Field survey of desiccation fissuring of flood embankments. Proc. Instn Civ. Engrs – Wat. Manage. 162, No. 3, 221–232, https://doi.org/10.1680/wama. 2009.162.3.221.
  49. Ng, C.W.W., Zhan, L.T. and Bao, C.G., Fredlund, D.G. and Gong, B.W. 2003. Performance of an unsaturated expansive soil slope subjected to artificial rainfall infiltration. Géotechnique 53, No. 2, 143–157, https://doi.org/10.1680/geot. 53.2.143.37272. [CrossRef]
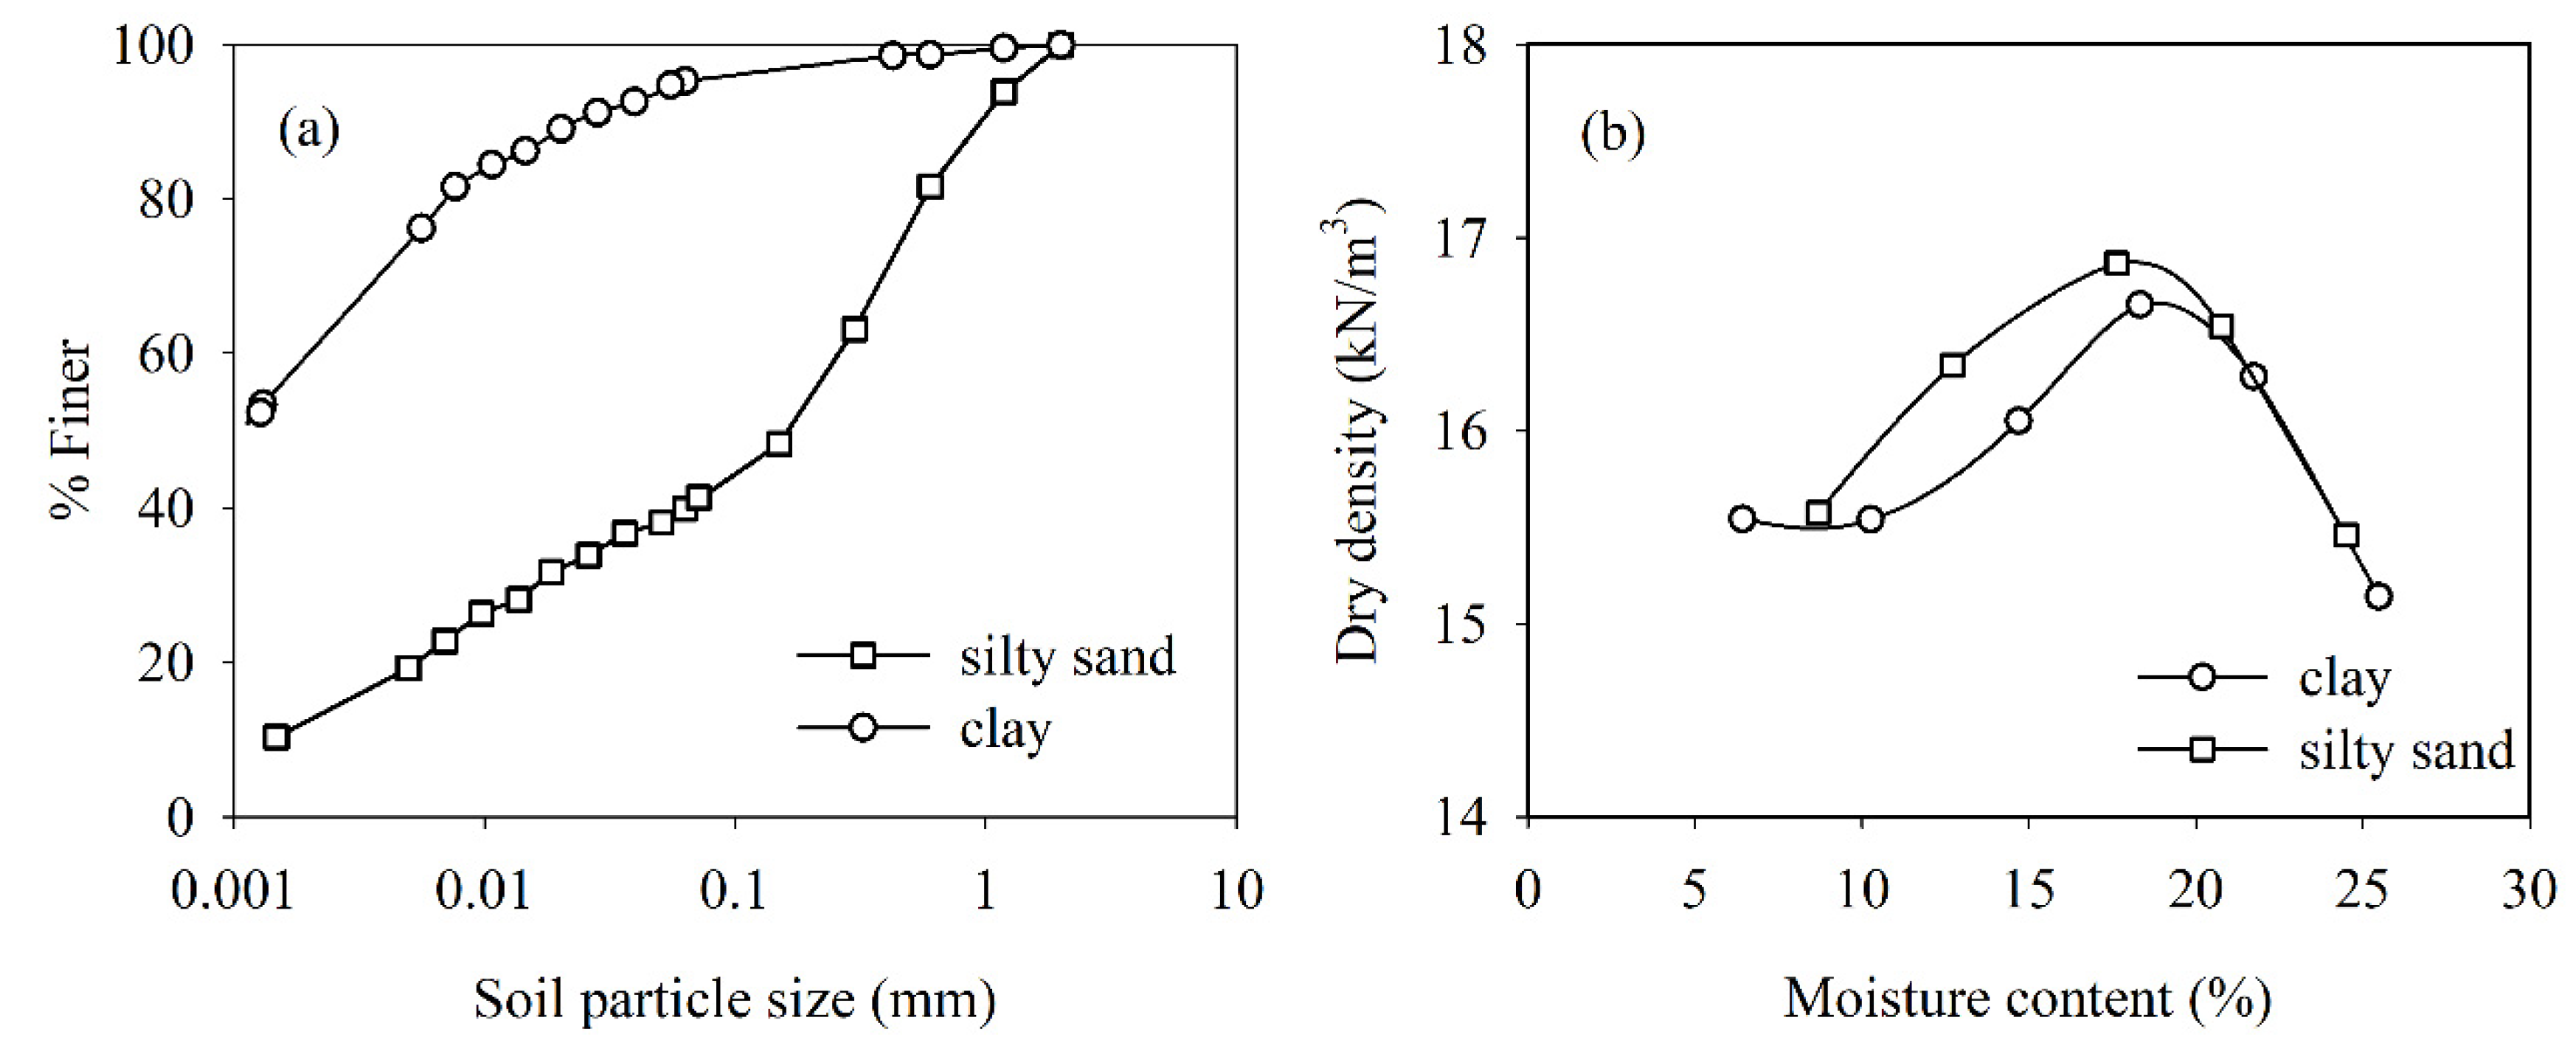
Figure 1. (a) Soil particle size distribution (b) soil compaction characteristics.
Preprints 117081 g001
Figure 2. The study's flow chart. MDD = maximum dry density, OMC = optimum moisture content, and wd = wetting and dry cycles.
Preprints 117081 g002
Figure 3. Flood embankment used for modelling.
Preprints 117081 g003
Figure 4. Average (a) moisture content of clayey soil, (b) volumetric strain of clayey soil, (c) moisture content of silty sand and (d) volumetric strain of silty sand plotted as a function of wetting and drying cycles for the three replicates subjected to 10 wetting and drying cycles.
Preprints 117081 g004
Figure 5. The measured soil water characteristics curves (SWCC) for soils treated with 1 and 10 wetting and drying cycles.
Preprints 117081 g005
Figure 6. Deviator stress (kPa) plotted as a function of axial strain (%) measured using consolidated-undrained triaxial tests for different wetting and drying (wd) cycles under a cell pressure of (a) clay 50 kPa, (b) clay 100 kPa, (c) clay 200 kPa, (d) silty sand 50 kPa, (e) silty sand 100 kPa and (f) silty sand 200 kPa.
Preprints 117081 g006
Figure 7. Mohr-Coulomb failure circles for (a) clay and (b) silty sand soils at 1 and 10 wd cycles.
Preprints 117081 g007
Figure 8. Performance of a flood embankment built with clayey soil under 1 and 10 wetting and drying cycles before flooding and at 1 and 10 days of flooding to the crest level.
Preprints 117081 g008
Figure 9. Performance of a flood embankment built with silty sand soil under 1 and 10 wetting and drying cycles before flooding and at 1 and 10 days of flooding to the crest level.
Preprints 117081 g009
Table 1. Hydromechanical characteristics of soils.
Parameter Clay Silty sand
1 wd cycle 10 wd cycles 1 wd cycle 10 wd cycles
dry density (kN/m3) 16.2 16.2 16 16
saturated density (kN/m3) 18.5 18.5 18 18
initial void ratio (-) 0.67 0.67 0.66 0.65
effective angle of internal friction (deg) 28.5 20.1 34.6 37.5
effective cohesion (kN/m2) 10 10 1 1
saturated hydraulic conductivity (m/d) 0.0051 0.0331 1.061 1.032
van Genuchten parameter, α (1/m) 0.5 0.45 4.5 4.5
van Genuchten parameter, n (-) 1.25 1.19 1.84 1.77
saturated moisture content (m3/m3) 0.46 0.43 0.41 0.40
Disclaimer/Publisher’s Note: The statements, opinions and data contained in all publications are solely those of the individual author(s) and contributor(s) and not of MDPI and/or the editor(s). MDPI and/or the editor(s) disclaim responsibility for any injury to people or property resulting from any ideas, methods, instructions or products referred to in the content.
Copyright: This open access article is published under a Creative Commons CC BY 4.0 license, which permit the free download, distribution, and reuse, provided that the author and preprint are cited in any reuse.
Prerpints.org logo

Preprints.org is a free preprint server supported by MDPI in Basel, Switzerland.

Subscribe

© 2024 MDPI (Basel, Switzerland) unless otherwise stated