Content
1. Introduction – double-well structure of Rydberg potential energy curves
2. Motivation for the study and realistic applications of the results
2.1. Molecular optical clocks and frequency standards for fundamental tests
2.2. Experimental versus ab-initio calculated Rydberg molecular potentials – calculational challenges
2.3. Scheme for dissociation of diatomic molecules – entanglement between objects with rest masses
2.4. Photoassociation of molecules with double-well potentials – cold molecules from cold atoms
2.5. Vibrational and rotational cooling of diatomic molecules
3. Optical-optical double resonance (OODR) method in molecular spectroscopy – assessment and main advantages
3.1. OODR – principle of the method
3.2. Review of OODR experiments in diatomic molecules
3.3. Example of methods alternative to OODR
3.3.1. Laser vaporization and optical resonance (LV-OR)
3.3.2. Laser photoassociation and excitation (pump-and-probe)
3.3.3. Polarization labelling spectroscopy
4. Ab-initio calculated potentials of MeNg molecules – early, recent and future approaches
5. Progress in CdNg spectroscopy of the Rydberg state –recently performed OODR experiments
5.1. Special approach for rotational characterization – direct bond length determination of the state in CdNe
5.2. Advances in the - state characterization in CdAr
5.2.1. Improved determination of the - state inner-well potential
5.2.2. Agreement plot, agreement parameter and new method for the outer-well bond length adjustment
5.2.3. Final approach: The - state complete potential determination
5.3. Perspectives: bound → free emission after OODR excitation of CdAr and ZnAr Rydberg state – characterization of lower lying ‘dark’ states or states inaccessible in direct excitation from the ground state
5.4. Improved determination of inner and outer wells of the - state potential in CdKr
5.5. Practical method for isotopologue selection using OODR - case of CdKr and CdAr
6. Particular spectroscopic applications of Rydberg double-well electronic energy states in diatomic molecules
6.1. Spectroscopy of ‘dark’ state of HgAr
6.2. Molecular wave-packet interferometry with HgAr
7. Conclusions
Acknowledgements
Author Contributions
Disclosure Statement
Table
1. Introduction—Double-Well Structure of Rydberg Potential Energy Curves
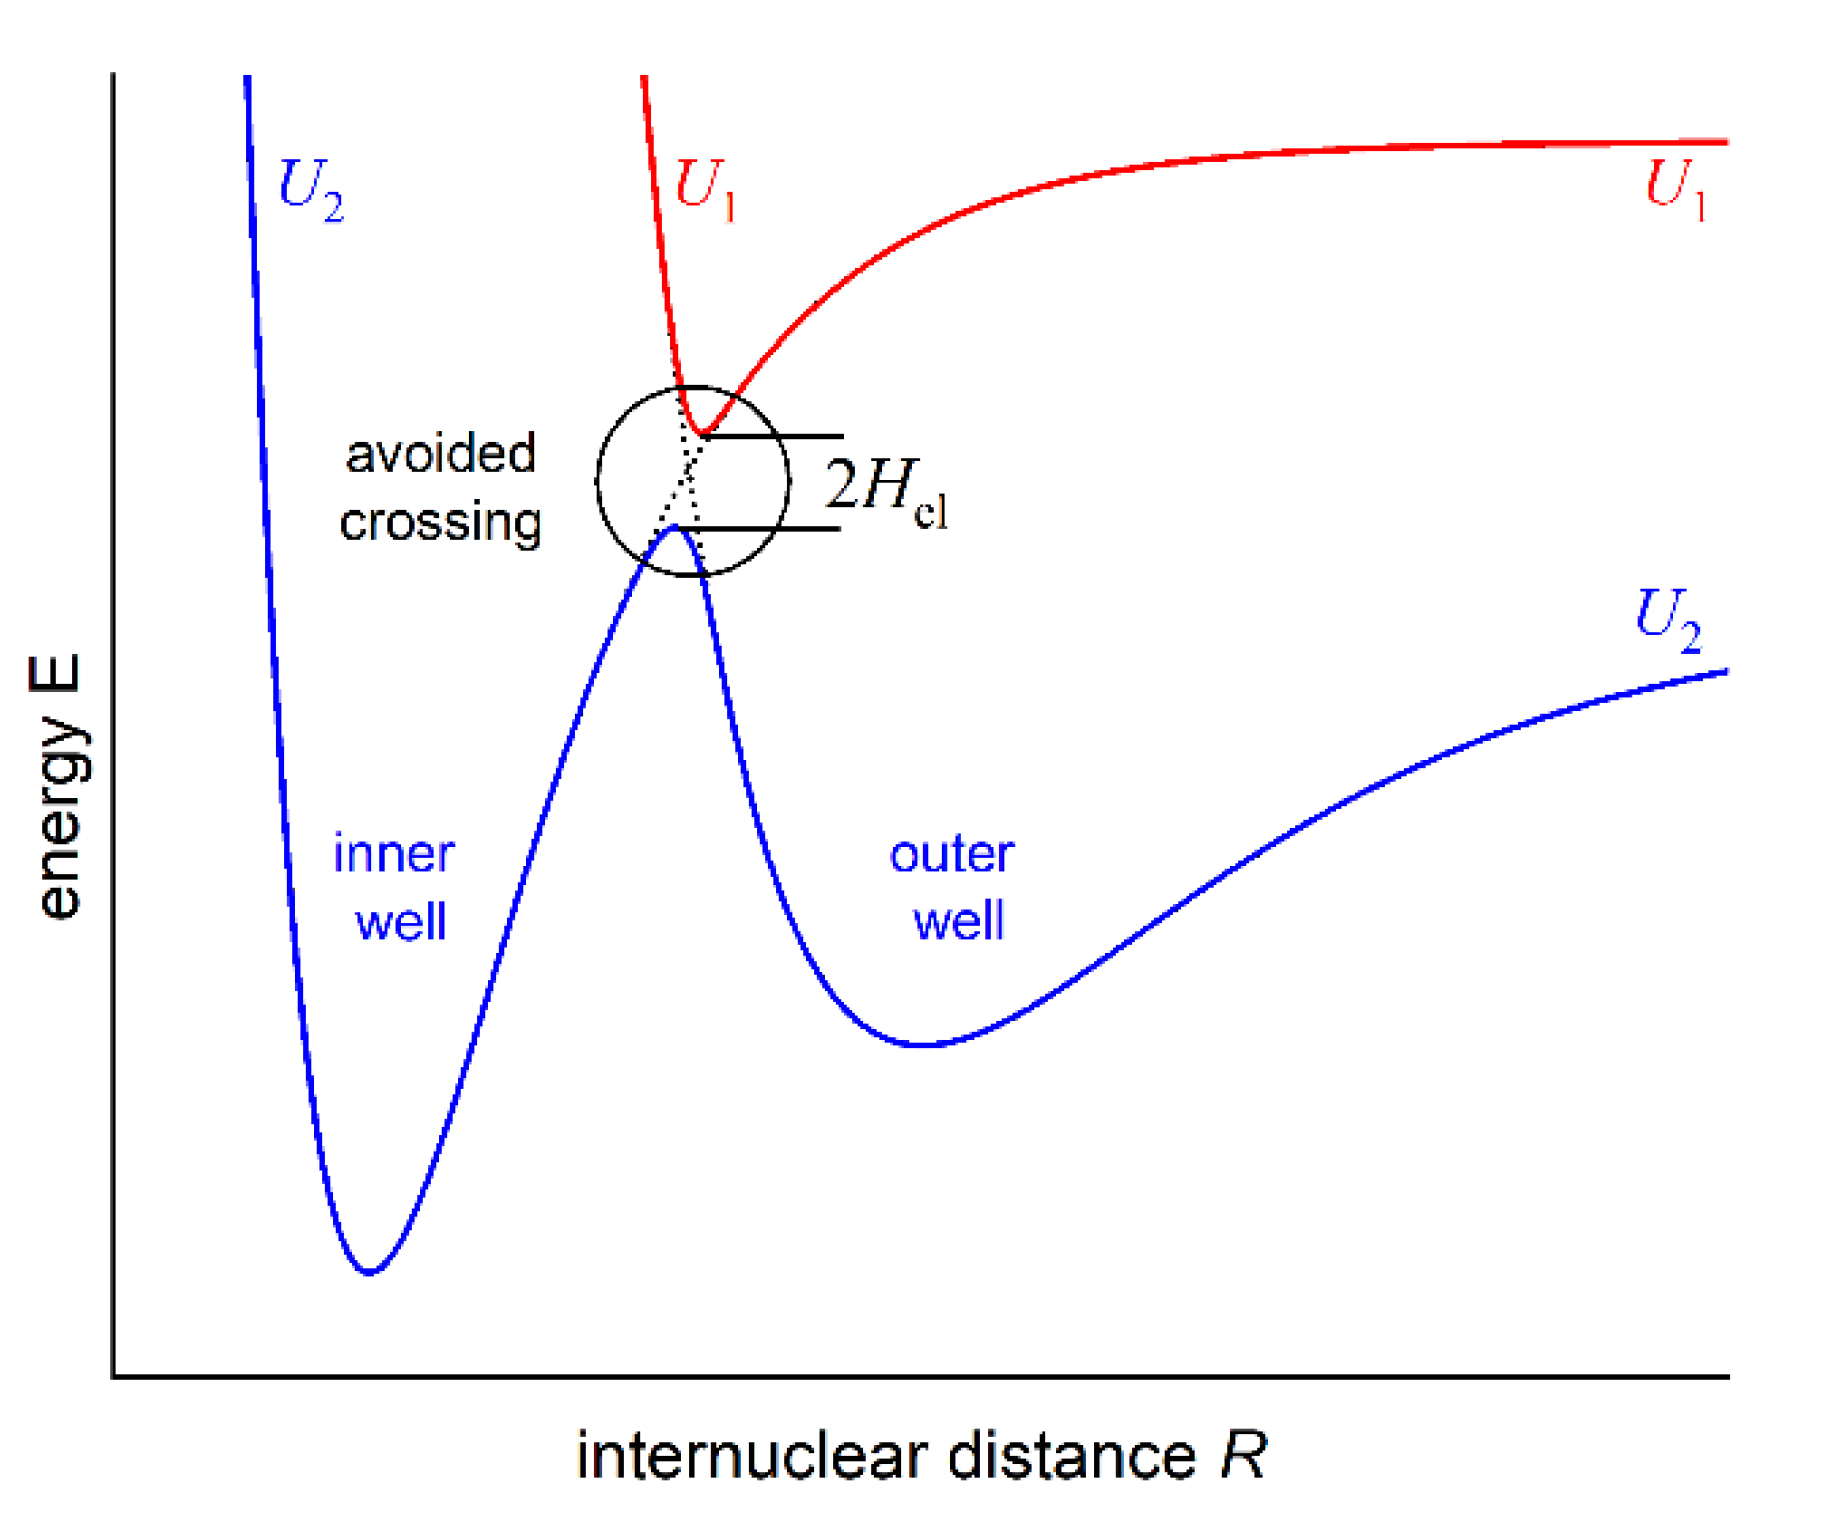
As formulated by von Neumann and Wigner, double-well (or double-minimum) structure of an interatomic potential energy curve (PEC) may have its origin in so-called anti-crossing (or avoided crossing) phenomenon that occurs for two molecular potentials possessing the same symmetry properties [
1]. For two anti-crossed potentials, the Born-Oppenheimer approximation breaks down, the adiabatic representation of electronic states takes over the diabatic one, and the potentials repel themselves (see
Figure 1). It may cause formation of a potential energy barrier that separates two potential wells (or potential minima). In order to facilitate the description, in 1985 Dressler postulated so-called adiabaticity parameter [
2]:
, where the
electronic matrix element that couples the diabatic states and gives rise to a double-well state is compared with the vibrational constant
in the upper of the two adiabatic states (description consistent with
Figure 1). Strongly avoided (adiabatic) or weakly avoided (non-adiabatic) case dominates when
or
, respectively.
Rydberg character of an electronic energy state of diatomic molecule may be manifested by the undulations of its PEC. It happens when one of the atoms is excited into its Rydberg state and the other atom experiences interactions with the Rydberg electron at relatively large internuclear distances (
R), where the Rydberg state possesses consecutive lobes, see Refs. [
3] and [
4], and references therein.
As far as 12-group MeNg (Me=Zn, Cd, Hg and Ng=noble gas atom) van der Waals (vdW) molecules are concerned: early
ab initio calculations of PECs of the lower-lying
and
1),
2) Rydberg states in ZnNg
[
5], CdNg
[
6], [
7] and HgNg
[
8] showed that the potential barrier is not formed for Ng=He, it is formed in the neighbourhood of a single well for Ng=Ne and it is formed separating two potential wells for Ng=Ar, Kr and Xe manifesting a double-well character of the above mentioned Rydberg state potentials (e.g. refer to
Figure 4 in
Section 3.1). The findings were corroborated in a number of experiments performed for ZnAr [
9], CdNe [
10], [
11], CdAr [
12,
13,
14,
15,
16,
17,
18], CdKr [
14], [
16], [
19], [
20] HgNe [
21,
22,
23] and HgAr [
22], [
24], [
25], and recently in more detailed
ab initio studies performed for ZnAr [
3] and CdAr [
4] up to the
and
asymptotes, respectively, where the double-well character of the PECs was obtained for all the considered
Rydberg states.
However, the above mentioned low-lying Rydberg states are well-separated from each other excluding any (anti-) crossings of PECs. Already in 1986 it was suggested by Duval et al. [
24] that the energy barrier of the lowest Rydberg state of HgAr molecule may be correlated with the maximum of the Rydberg electron density; later similar claim was addressed to the lowest Rydberg state of HgNe [
21]. In the 1990s it was shown by Onda et al. [
22], [
23] that the properties of the PECs derived from the OODR spectra of the
Rydberg states of HgNe and HgAr correlate with the Rydberg electron density. Inspired by the
ab initio study of Rydberg states performed by Yiannopoulou et al. [
26] for small diatomic molecules, the extensive
ab initio calculations [
3], [
4] have supported the observation that the double well structure (with the potential barrier present) of the
Rydberg state in ZnAr and CdAr, respectively, as the one possessing
symmetry, does not result from the anti-crossing with other electronic state (note: the
is degenerate with the
state correlating with the same
or
atomic asymptote in Zn or Cd, respectively). In this case, the formation of the potential barrier has different origin. Similarly as in the case of the so-called Rydberg molecules [
27] it can be attributed to the low-energy scattering of the electron (
) being in the Rydberg state of Zn or Cd atom from the ground-state Ng atom. This is a consequence of a model proposed by Fermi [
28] and Omont [
29] (see also Greene and collaborators [
30], [
31]) who considered interaction of Rydberg
and the perturbing ground-state atom in a first approximation as the low-energy
s-wave (and
p-wave [
29]) scattering leading to the energy shift that depends on
R and is proportional to Rydberg
density, i.e. atomic Rydberg wavefunction squared, namely
where
is the
s-wave scattering length depending on (classical) momentum
of Rydberg electron in state
[
29]. Rydberg molecule is assumed here to be on
z-axis, where
and
are zero. The model of
- Ng interaction as
scattering from Ng, is more accurate for highly excited – Rydberg molecules [
27], [
31]. As a consequence of this
s-wave scattering, when at least one of the molecular constituents (e.g. Zn or Cd atom) is excited into the Rydberg state, PECs of the Rydberg
states exhibit undulations outside the inner potential well that reproduce the oscillations of the Rydberg
density along the internuclear axis [
3], [
4].
The description presented above is based on formal division of the MeNg molecule in to three subsystems:
cation, ground-state Ng atom and Rydberg electron
. Outside the inner potential well, i.e. for sufficiently large
R, the dominating contribution to the interaction energy between
and Ng is due to the charge-induced dipole interaction, whereas the
-
interaction is dominated by Coulomb charge-charge one; interaction between Rydberg electron
and Ng atom is described by the generalized Fermi potential [
28], [
29] considered above. In case of the
- Ng pair, also the dispersion interaction is present. However, this contribution to the interaction energy is smaller than in the case of the ground state of MeNg, mainly due to the smaller polarizability of
cation in comparison to the Me atom. This interpretation is applicable for the
and
Rydberg states in a variety of MeNg molecules as suggested in Refs. [
3], [
4], [22-24] and [
21] for ZnAr, CdAr, HgAr and HgNe, respectively.
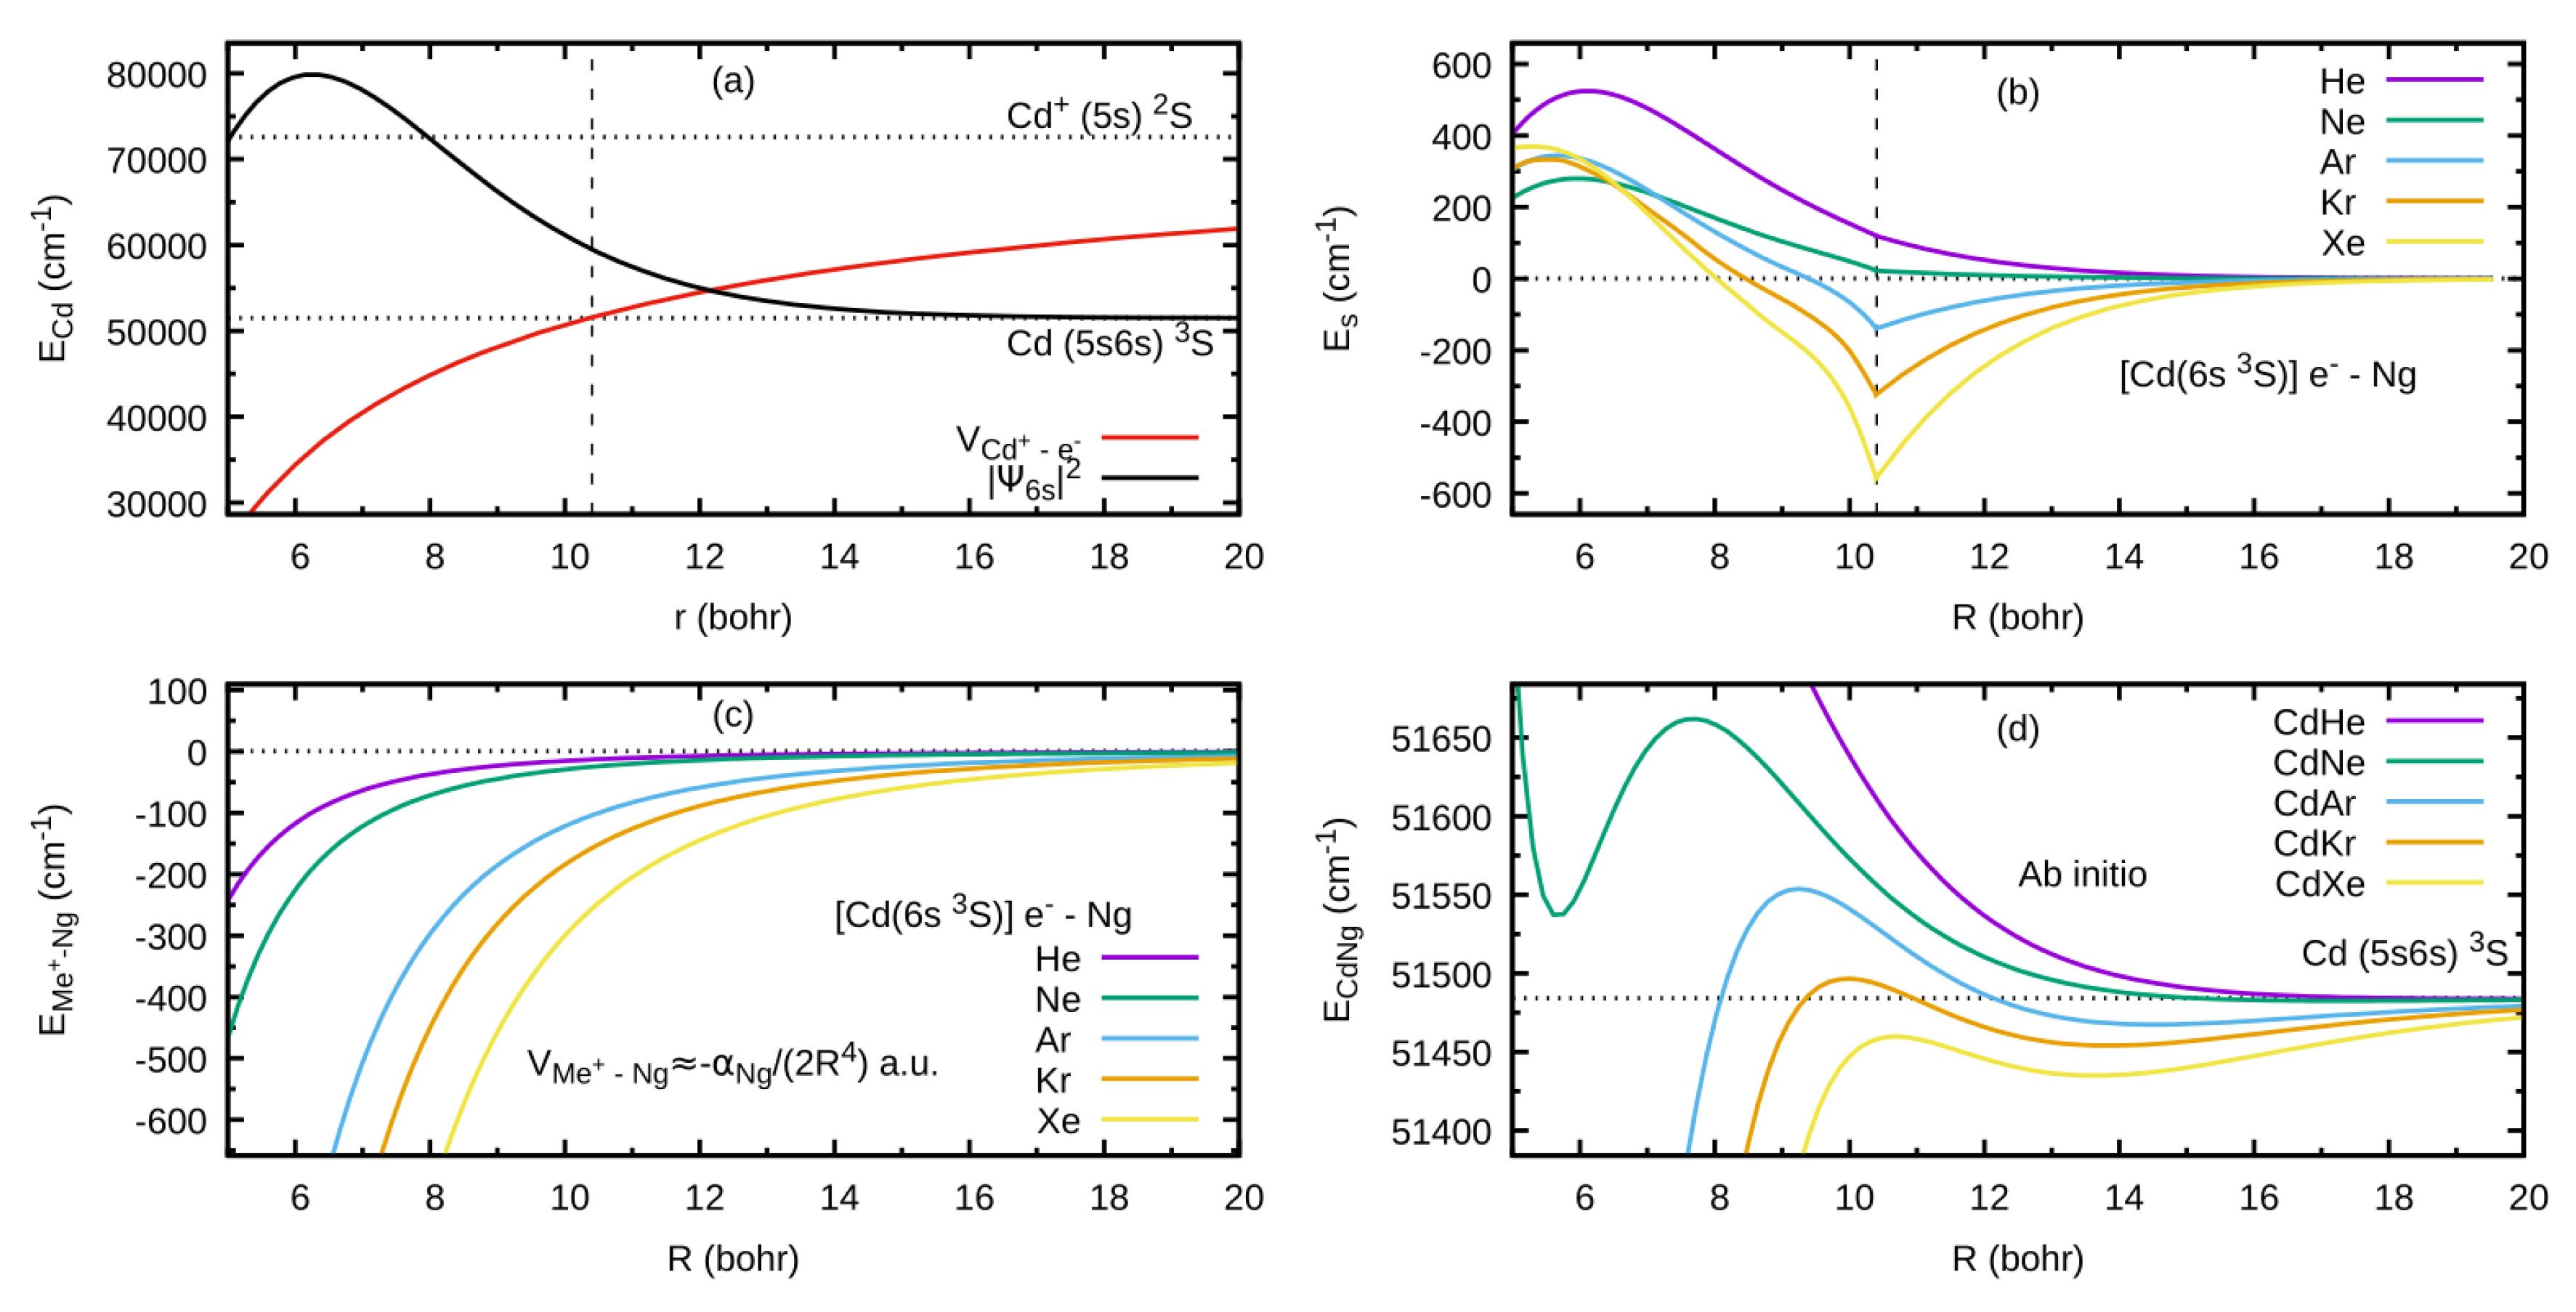
As an example developed for the review, let consider formation of the outer well and the energy barrier in the
state of CdNg molecule. In this case, Cd atom in the lowest Rydberg state
is perturbed by the appearance of the ground-state Ng atom. In
Figure 2(a) the interaction between
ion and the Rydberg electron
(here: classical point charge
) is presented along with
atomic orbital of Cd, where the values of the orbital are in arbitrary units and they do not correspond to the values provided on the vertical axis; plots are based on results of
ab initio calculations taken from Ref. [
4], whereas energy levels of Cd atom are taken from [
32]. From
Figure 2(a) the classically allowed region for the Rydberg electron can be established, here
10.4 bohr (
5.50
)
3), as well as the classical momentum of Rydberg electron
corresponding to this region. Interaction between Rydberg electron
and ground-state Ng atom is in first approximation determined by the Fermi potential [
28],[
29] leading to the energy shift
given by Eq. (1), presented in
Figure 2(b) for the
Cd state. Cusps on the border of the classical region in
Figure 2(b) result from the fact that the scattering length
from Eq. (1) is described semi-classically, where for the classically forbidden region the value of
in the limit
was adopted [
27],[
28]. Low-energy electron scattering from Ng atoms data for generation of the
Es(
R) in
Figure 2(b) was taken from Refs. [
33,
34,
35,
36,
37].
Figure 2(c) presents the charge
- induced dipole (on Ng) interaction that dominates in the region of large-enough
R of the
- Ng subsystem, where Ng static dipole polarizabilities
, that determine the
- Ng interaction, were taken from Ref. [
38].
Figure 2(d) collects the
-state PECs of CdNg molecules taken from Refs. [
39],[
40] and shows the internuclear region around the outer wells and the energy barriers. In a first approximation, the sum of the
Cd asymptote of
Figure 2(a) and of the subsystem interactions
- Ng and
- Ng of
Figure 2(b),(c) should mimic the behavior of the actual PECs of CdNg molecules from
Figure 2(d). It should be kept in mind that the simplified model of the Rydberg molecules works well for highly-excited states [
27], and at the same time, the lowest Rydberg state of CdNg molecules is considered here. Anyway, some intuitions derived from the simplified description may be picked up even in such a case [
3],[
4]. It is seen from
Figure 2(b),(d) that the position of energy barrier of the
E 3Σ1+ state may be ascribed to a situation in which the outside lobe of the Rydberg atomic orbital seen in the
Figure 2(a) is accompanied with the positive value of the scattering length
for momentum
large enough leading to the positive energy shifts
. Positions of the top of the energy barrier of PECs of CdNg molecules are shifted with respect to the maximum of the square of the Rydberg atomic orbital towards larger distances due to the attractive
- Ng interaction of
Figure 2(c). At the same time the negative values of the scattering length
in the
limit for Ng=Ar, Kr, Xe along with relatively large attractive
- Ng forces, see
Figure 2(b),(c), results in formation of the outer well seen in ab initio PECs in
Figure 2(d). In the case of Ng=He, Ne, the positive values of scattering length
and relatively weak attractive
- Ng forces lead to almost purely repulsive
4) PECs outside the energy barrier. Thus, it is evident that the properties of PECs of the lowest Rydberg state of CdNg may be qualitatively described within simplified model of Rydberg molecules.
2. Motivation for The Study and Realistic Applications of the Results
Results gained in basic-science research frequently result in practical applications and technological development. Technological achievements serve society and broadly understood human activities, including economic development, but also assist in pushing of basic-science concepts forward thereby, closing the circle between basic research and practical applications. This universal statement can be easily employed in basic research reviewed here and devoted to acquiring knowledge on irregular double-well molecular potentials of Rydberg electronic states leading to description of complexity of interatomic interactions. To illustrate this, we will mention only few from the rich diversity of examples where knowledge on molecular potentials led to significant progress towards their applicability. We focus on: creation of entanglement between atoms – a step towards the concept of quantum computer, laser photoassociation and invention of methods for vibrational and rotational cooling leading to creation of cold molecules in the ultimately coolest energy level, allowing, among others, to develop molecular clocks and frequency standards. Also, we cannot leave out something that theorists appreciate greatly - impressive advances in ab-initio calculation methods that subsequently allows to credibly confront theoretical and experimental results.
2.1. Molecular Optical Clocks and Frequency Standards for Fundamental Tests
Frequency standards and optical clock transitions have been suggested as a tool for testing fundamental forces in search for New Physics beyond the Standard Model [
42], for laboratory search of dark-matter [
43,
44,
45,
46,
47] to explore possible variations in the fundamental constants of nature [
43], [47–49] and variations in the proton-to-electron mass ratio [50–53], for searching and establishing constraints of the electron’s electric dipole moment [
48], [
54,
55,
56,
57].
12-group Me closed-shell atoms have attracted an attention as the possible candidates for optical lattice clocks based on Hg [
48], [
58,
59,
60], Cd [
60,
61,
62,
63] and Zn [
60], [
61] due to presence of long-live atomic levels, ultra-narrow optical transitions, very small black-body radiation shift of the
‘clock transition’ and reduced susceptibility to the blackbody radiation as compared to Sr- or Yb-based clocks. Consequently, they serve as promising alternatives to the currently operational Sr and Yb clocks [
61], [
63].
This automatically directs one to possibility of considering molecules as candidates for optical clocks and, indeed, there are examples of molecular clocks constructed using
[
64],
[
65], and proposals for clocks based on molecular ions
and
as an active media [
66], [
67]. So far, molecular clocks based on 12-group atoms are somewhat elusive. However, just recently, weakly bonding vdW diatomic molecules containing Zn or Cd and opened-shell alkali–metal (Li, Na, K, Rb, Cs, Fr) or alkaline–earth–metal (Be, Mg, Ca, Sr, Ba, Ra) atoms - due to their considerable permanent electric dipole moments and high chemical reactivity - were considered within
ab initio approach for the potential use in the chemistry experiments and ultracold physics [
68] that might lead to proposals for molecular optical clocks. Other homo-atomic weakly bound molecules,
[
69] and
[
70], were proposed to serve as suitable media to construct optical clocks based on optical Rabi frequency induced by magnetic coupling and long vibrational coherence driven by off-resonant Raman process, respectively, or working as THz lattice clock in
based on pure molecular vibrations [
71].
2.2. Experimental Versus Ab-Initio Calculated Rydberg Molecular Potentials - Calculational Challenges
Frequently, a comparison of the results of
ab-initio calculated molecular potentials with those from experimental studies shows large discrepancies for both ground- and excited-state potentials, including these of Rydberg-states with complex, double-well, shape. In majority of our studies of 12-group MeNg [11-13], [15-17], [
19], [
20] and
[
72], [
73] molecules the discrepancies manifested themselves to varying degrees. The problem was closely analysed in recent articles on the calculations of Rydberg-state potentials of CdAr [
4] and ZnAr [
3] molecules. In general, at present time exact
ab initio calculations of many electron systems such as 12-group MeNg and
are impossible, where the main source of inaccuracy is due to deficiencies in description of the electron correlation. Apart from the requirements for sufficient computer power to be used, the requirements of the proper description of the excited states within
ab initio calculations are the following: 1º adequate atomic basis set that efficiently describes considered states including electron correlation (and relativistic) effects, 2º (quasi)-relativistic description starting from reference function usually obtained within single- or multiconfiguration self-consistent field (SCF) method, and taking into account: 3º multireference character of the electronic state using e.g. complete active space SCF (CASSCF) method (usually in case of the excited electronic states), 4º dynamic correlation as thorough as possible, 5º spin-dependent relativistic effects (spin-orbit, spin-spin couplings). Dynamic electron correlation for the multi-reference CASSCF function is usually calculated with CAS second-order perturbation theory (CASPT2) or multi-reference configuration interaction (MRCI) method. Alternatively, due to the fact that the ground state of MeNg molecules is dominated by a single-electron configuration, the excited states may be calculated with equation-of-motion (EOM) method performed for the single-reference coupled clusters (CC) function of the ground state. If very accurate results are needed one may consider the inclusion of hyperfine-structure interactions (if present), effects of finite nuclear mass (beyond Born-Oppenheimer approximation) or QED effects.
More accurate ab initio calculations stimulated requirements for more precise experiments investigating the molecular energy structures with better spectral resolution. The stimulation works both ways and was exceptionally challenging for Rydberg electronic states.
2.3. Scheme for Dissociation of Diatomic Molecules - Entanglement Between Objects With Rest Masses
In 1995, Fry and coworkers published a proposal for experimental realization of Bohm’s spin-1/2 particle version [
74], [
75] of the Einstein-Podolski-Rosen (E-P-R) experiment [
76] for two
atoms, each with nuclear spin
, that are produced in an entangled state with total nuclear spin zero [
77]. It was proposed that the entanglement is possible to achieve by laser dissociation of vibrationally and rotationally cold isotopologue of the
dimer produced in a supersonic expansion beam, using spectroscopically selective stimulated Raman process. The measurement of nuclear spin correlations between the two
atoms in the entangled state is achieved by detection of the atoms using spin-state selective two-photon excitation-ionization scheme. In order to realize the idea, one needs to explore, theoretically and experimentally, the ro-vibrational energy structure of electronic energy states involved in the process of selective dissociation, including subtle irregularities in the interatomic potentials. Proposal of Fry and coworkers followed earlier suggestion for a test of so-called Bell inequalities [
78]. Configuration of the electronic energy states in
allowed to formulate similar proposal for two
atoms obtained by laser dissociation of isotopologue of the
dimer [
79] which is presently realized experimentally in our laboratory.
Except for 12-group
and
isotopologues, the E-P-R experiment and tests of the Bell inequalities was also designed for
molecule [
80] and
isotopologue [
81], both produced in supersonic beams. Some aspects of the two-atoms entanglement phenomenon were experimentally realized for
[
82], [
83] and
[
84], [
85] molecules dissociated using laser and electron beams, respectively. General discussion on the quantum-entanglement-related aspects of the dissociation process of homo- (
,
,
,
) and heteronuclear (HCl) diatomic molecule experiments was reported by Esquivel and coworkers [
86] where, in particular, the electronic entanglement during a dissociation process is shown to be associated, among others, with spatial electronic density in function of
R, and consequently, to be dependent on the exact shape of corresponding interatomic potential.
2.4. Photoassociation of Molecules With Double-Well Potentials—Cold Molecules From Cold Atoms
In different branches of atomic and molecular physics there is rapidly growing interest in long-range forces acting between atoms interacting in a variety of traps and photoassociation (PA) of cold molecules [
87,
88,
89].
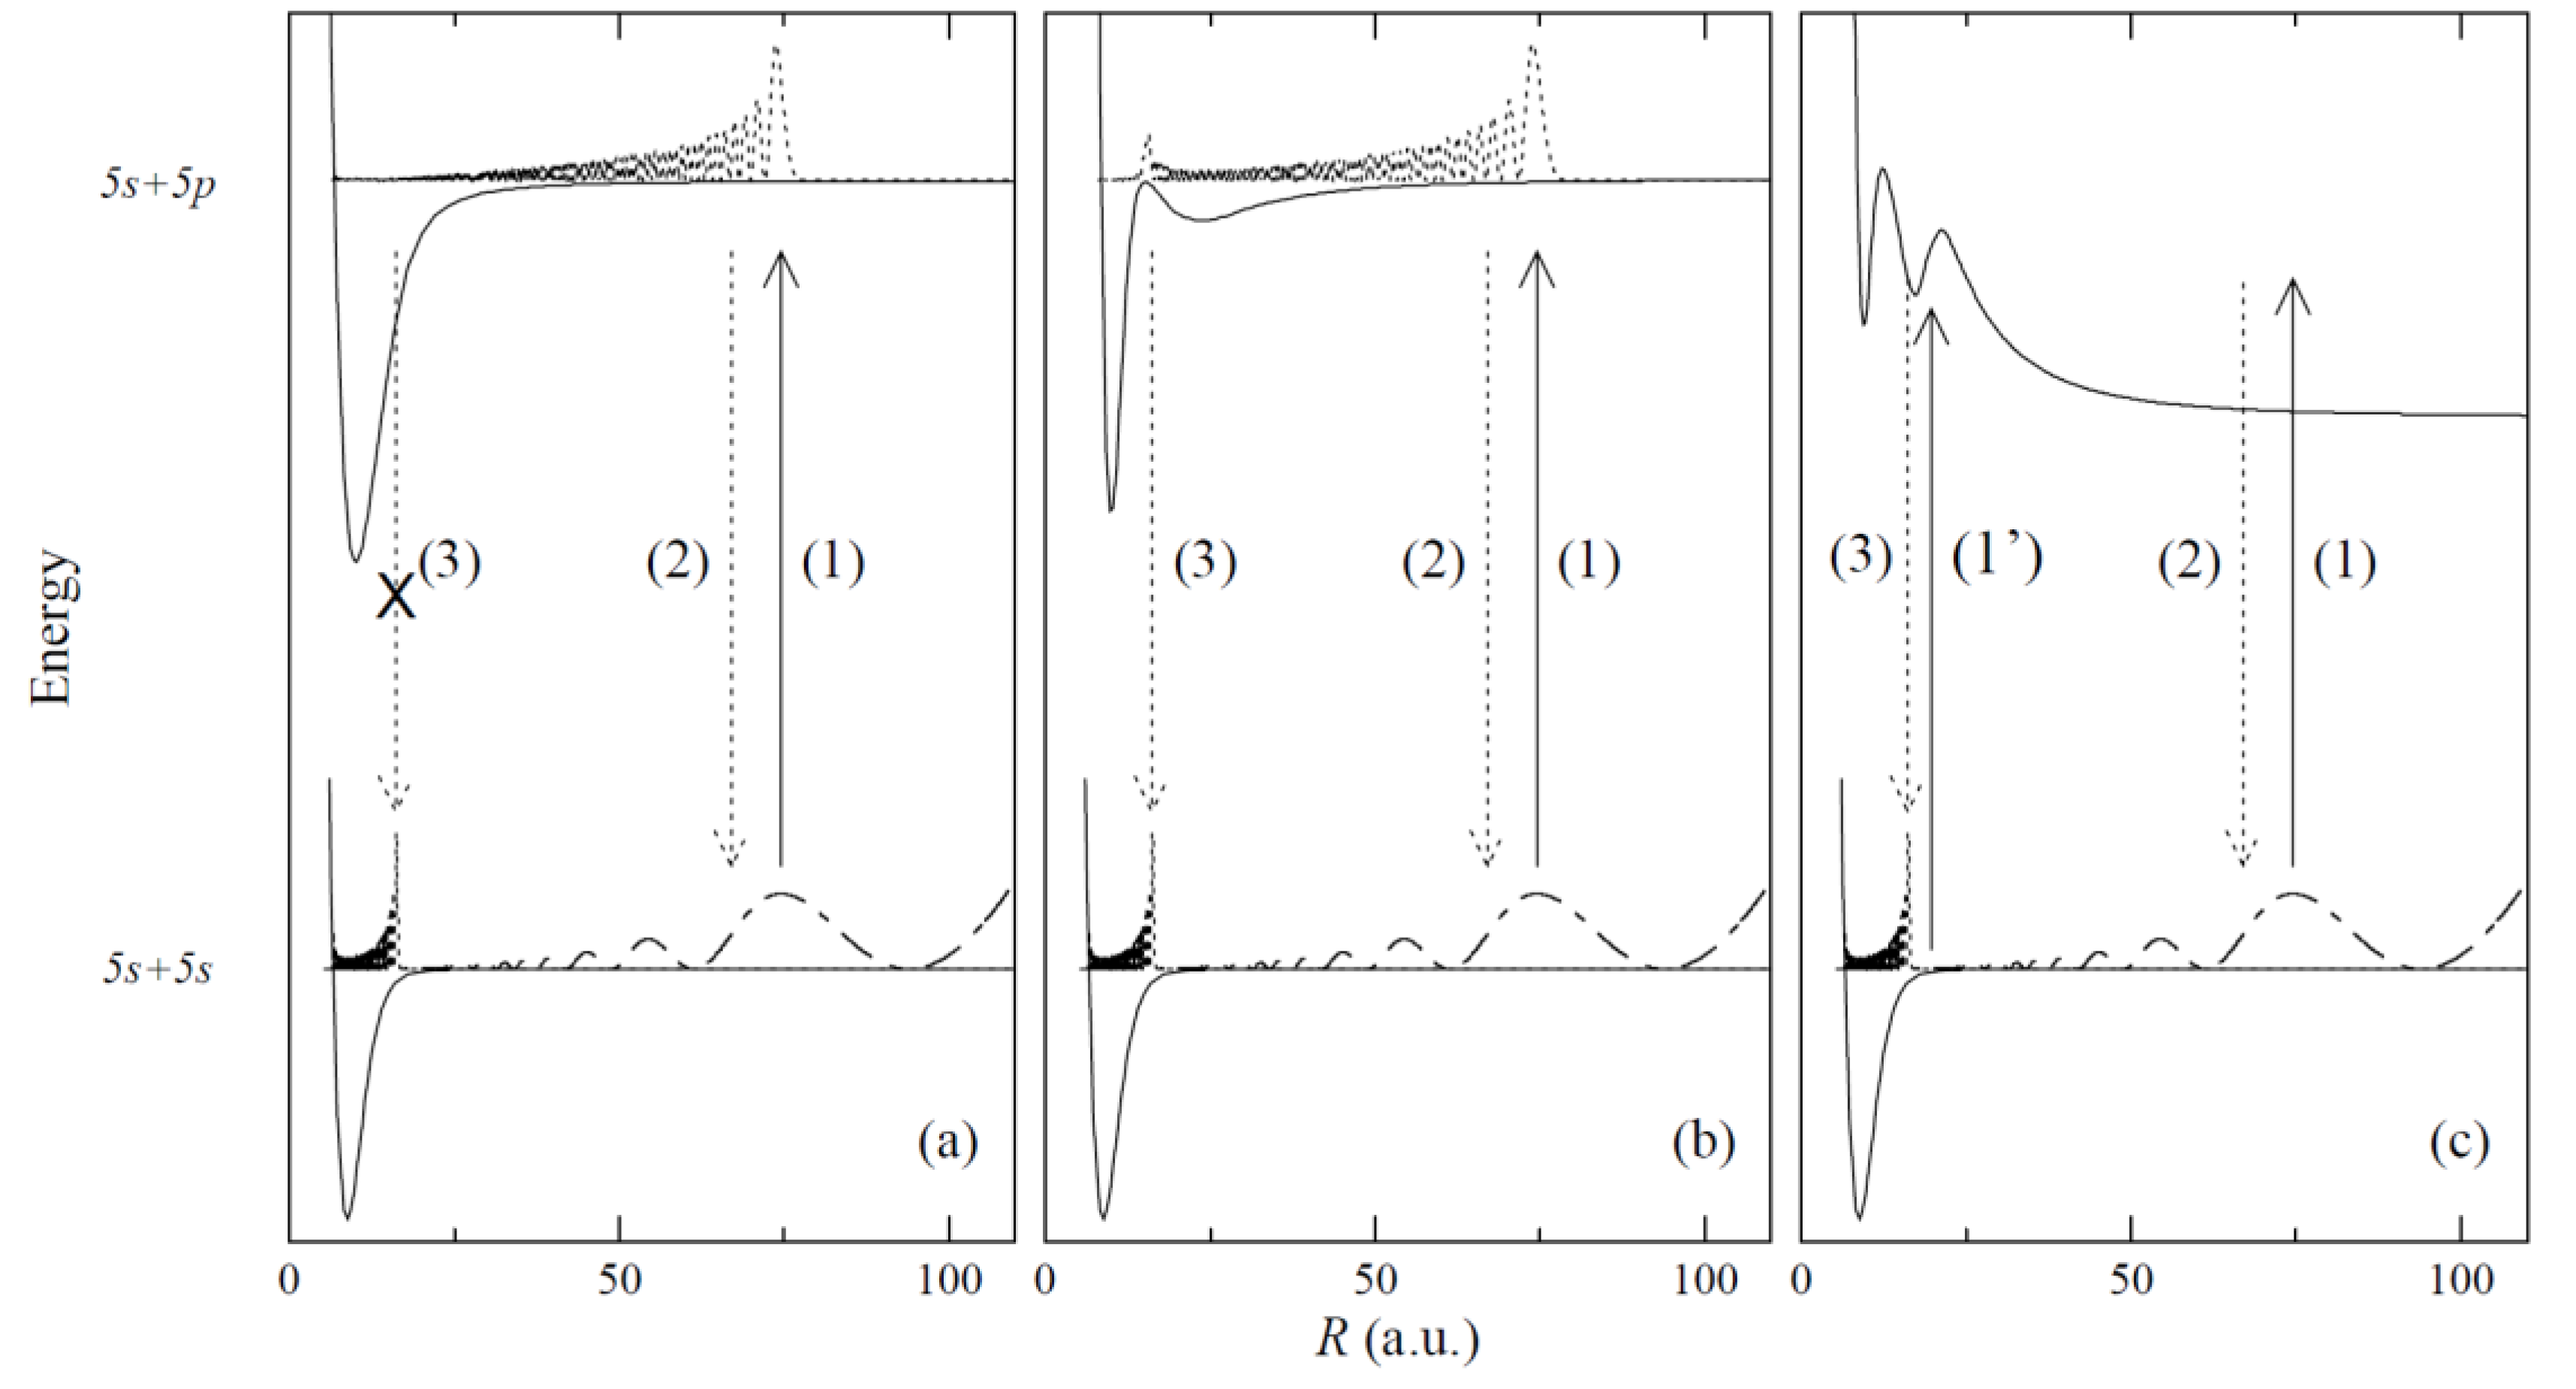
The recent advances in laser cooling and optical trapping techniques as well as one- and two-step PA processes of cold molecules have been largely responsible for the renewed interest in the studies of the interatomic potentials including those with complex (e.g. double-well) structure, with distinct barriers present and specific behaviour in the long-range region of
R [
90] (see
Figure 3). For a long time now, molecular energy states with double-well potentials have been considered as particularly suitable for PA experiments [
91], [
92]. Knowledge of the complex shape of the interatomic potentials (including higher-lying Rydberg potentials) facilitates an optimum design of the PA schemes. Among the various available techniques, molecular spectroscopy of diatomic molecules has proved to be the most effective and precise way to obtain information about the interaction between atoms in the molecule being created usually in a cold environment of atomic trap.
It is important to emphasize here that knowledge on the interatomic potentials allowed to design also unique schemes for PA processes. For example, using the
double-well state in
it was possible to propose its formation
via PA and application for cold-physics experiments [
93]. Proposal for PA of ultra-long range rotating Rydberg molecules was also recently reported [
94]. The proposal specified different steps to calculate the wave functions and the transition matrix elements so, they could be transferred to other Rydberg molecules involving different atomic species or molecular coupling cases.
2.5. Vibrational and Rotational Cooling of Diatomic Molecules
Exploration of electronic and ro-vibrational energy structures in molecules provides a source of information to elaborate schemes for cooling of molecular degrees of freedom: external - translation, and internal - vibration and rotation [
95], [
96]. The cooling process can be realized in a variety of atomic or molecular traps and, in case of atomic traps, it usually follows a process of creation of molecules (e.g. through PA, see
Section 2.4). Internal cooling of molecules is also possible to realize in molecular beams (e.g. free-jet or supersonic) where vibrations and rotations are partly frozen out due to properties of the expansion itself. With respect to interatomic potentials involved in the process, including those of a complex character, it is important that for an efficient cooling process electronic transition with good properties, in terms of lifetime, coupling strength, laser accessibility and losses of molecules from the cooling scheme, is chosen. Moreover, the cooling electronic transition should be as ‘closed’ as possible with the assumption that after excitation spontaneous emission returns the largest possible fraction of molecular population to the initial electronic state. Consequently, it imposes one of favourable conditions: position of the excited-state potential minimum
which should be as close as possible to that of the ground-state potential
) i.e.,
. The condition assures highly diagonal Franck-Condon (F-C) factors i.e. domination of
transitions, where
is a vibrational quantum number.
The above-mentioned conditions allowed to propose theoretical schemes for cooling and experimentally realize them for homoatomic (e.g. [
81], [
95], [
97,
98,
99,
100]) and heteroatomic (e.g. [
95], [
101,
102,
103,
104]) molecules. Caesium dimer
was the first homoatomic molecule for which the cooling scheme was proposed. Its external and internal cooling in supersonic beam was based on the
transition [
97]. It was followed by experimental realization in a trap using the
transitions (with the
state possessing double-well structure) [
95], [
98], reaching the absolute ground-state
level [
98], where
is a rotational quantum number. Proposals for vibrational and rotational cooling of 12-group
[
99] and
[
81], [
100] were based on the
and
transitions, respectively. The
transition was proposed for cooling down internal degrees of freedom in
[
81], [
100]. Among heteroatomic molecules, frequently possessing large permanent electric dipole moments which is desirable in manipulation by means of static and/or time-dependent electric fields, experimental realization of vibrational and rotational cooling was reported for kinetically cold NaCs in a magneto-optical trap [
95], [
101] using the
transitions and achieving vibrational cooling from
to
. Moreover, theoretical schemes for direct vibrational and rotational cooling of TlCl [
102], AgH, AgD [
103], and
[
104] were proposed employing the
,
and
transitions, respectively, as well as highly diagonal F-C factors patterns.
3. Optical-Optical Double Resonance (OODR) Method in Molecular Spectroscopy—Assessment and Main Advantages
3.1. OODR—Principle of the Method
This article describes, in a broader context of similar methods, molecular spectroscopy experiments in which molecules are sequentially excited using spatially overlapping two laser beams. This sequential excitation method, called optical-optical double-resonance (OODR), is a special case of two-photon spectroscopy in which two visible or ultraviolet wavelength photons of different frequencies resonantly excite a molecule from an initial level () to a final level () via a real intermediate level (). The OODR process is also called double optical resonance, step-by-step excitation, or stepwise, two-step or two-colour excitation.
OODR method provides possibility of excitation of higher-lying molecular electronic energy states to which excitation from the ground state using one-step process is not possible as the energy of excitation is too high (deep UV or VUV) or symmetry of the excited state forbids the direct excitation from the ground state. This way, OODR paves the way for investigation of higher-lying Rydberg molecular states or, in case of homoatomic molecules, for study molecular states that possess the same symmetry as the ground state from which the excitation originates. As a good example from our laboratory is spectroscopy of a
gerade Rydberg energy state in
while the
state was excited from the
ground state
via the
intermediate state [
105].
Another advantage of OODR, that makes it an extremely useful spectroscopic tool, is a possibility to adequately choose an intermediate state in order to excite different parts of the final-state potential. This approach was employed in studies of 12-group-MeNg molecules: HgNg [
21,
22,
23,
24,
25] and CdNg [
10,
11,
12,
13,
14,
15,
16,
17], [
106].
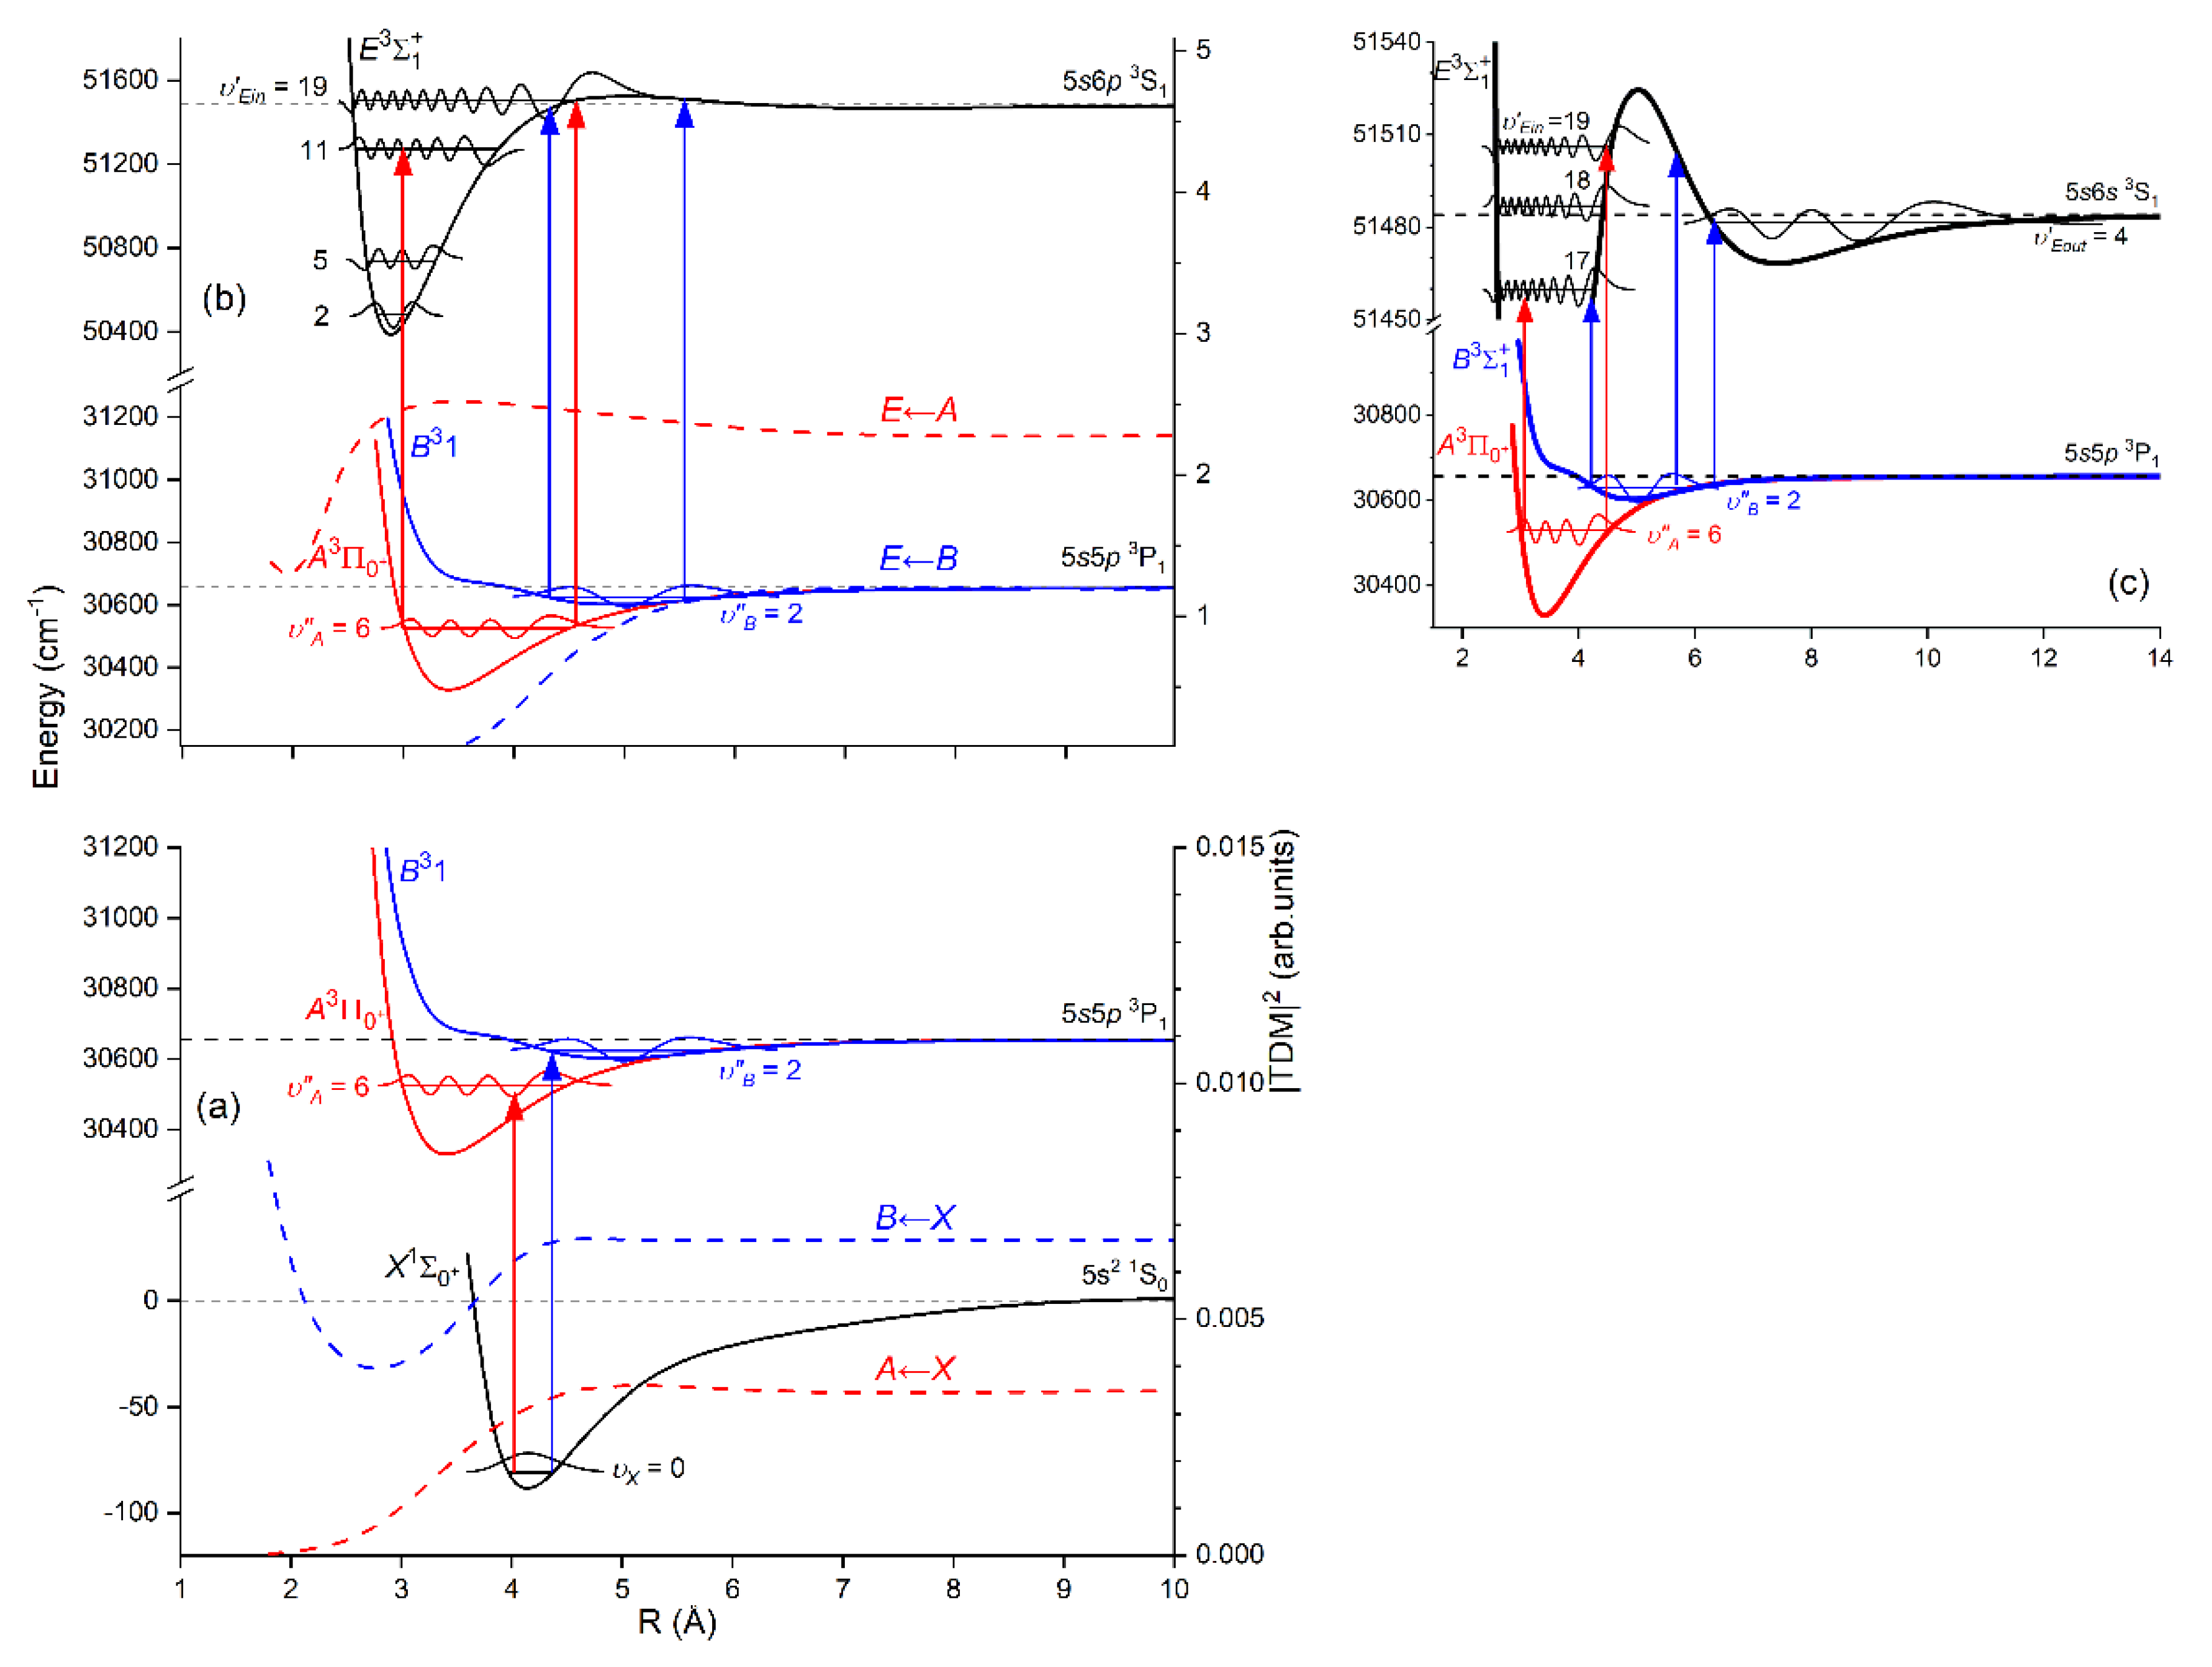
Figure 4 illustrates OODR method using example of the
or
transition in CdAr
5). The molecule is excited in the first resonant optical transition from the
ground state to one of the
or
state using the chosen
or
vibrational transition, respectively. The second resonant optical transition is a matter of choice. As the final
Rydberg state possesses a double-well structure, its potential can be probed using
or
transitions starting from either the
or
state, respectively. Using the
state as an intermediate, only the
- state inner well (
) can be probed whereas excitation
via the
state offers an exploration of the
-state outer well (
) along with the potential barrier exploring free
bound transitions (note: using excitation
via the
state a limited number of transitions to the
near the dissociation limit can also be realized). Electronic transition dipole moments squared
shown in
Figure 4 constitute supporting information which part of the
-state PEC can be probed in the chosen transition.
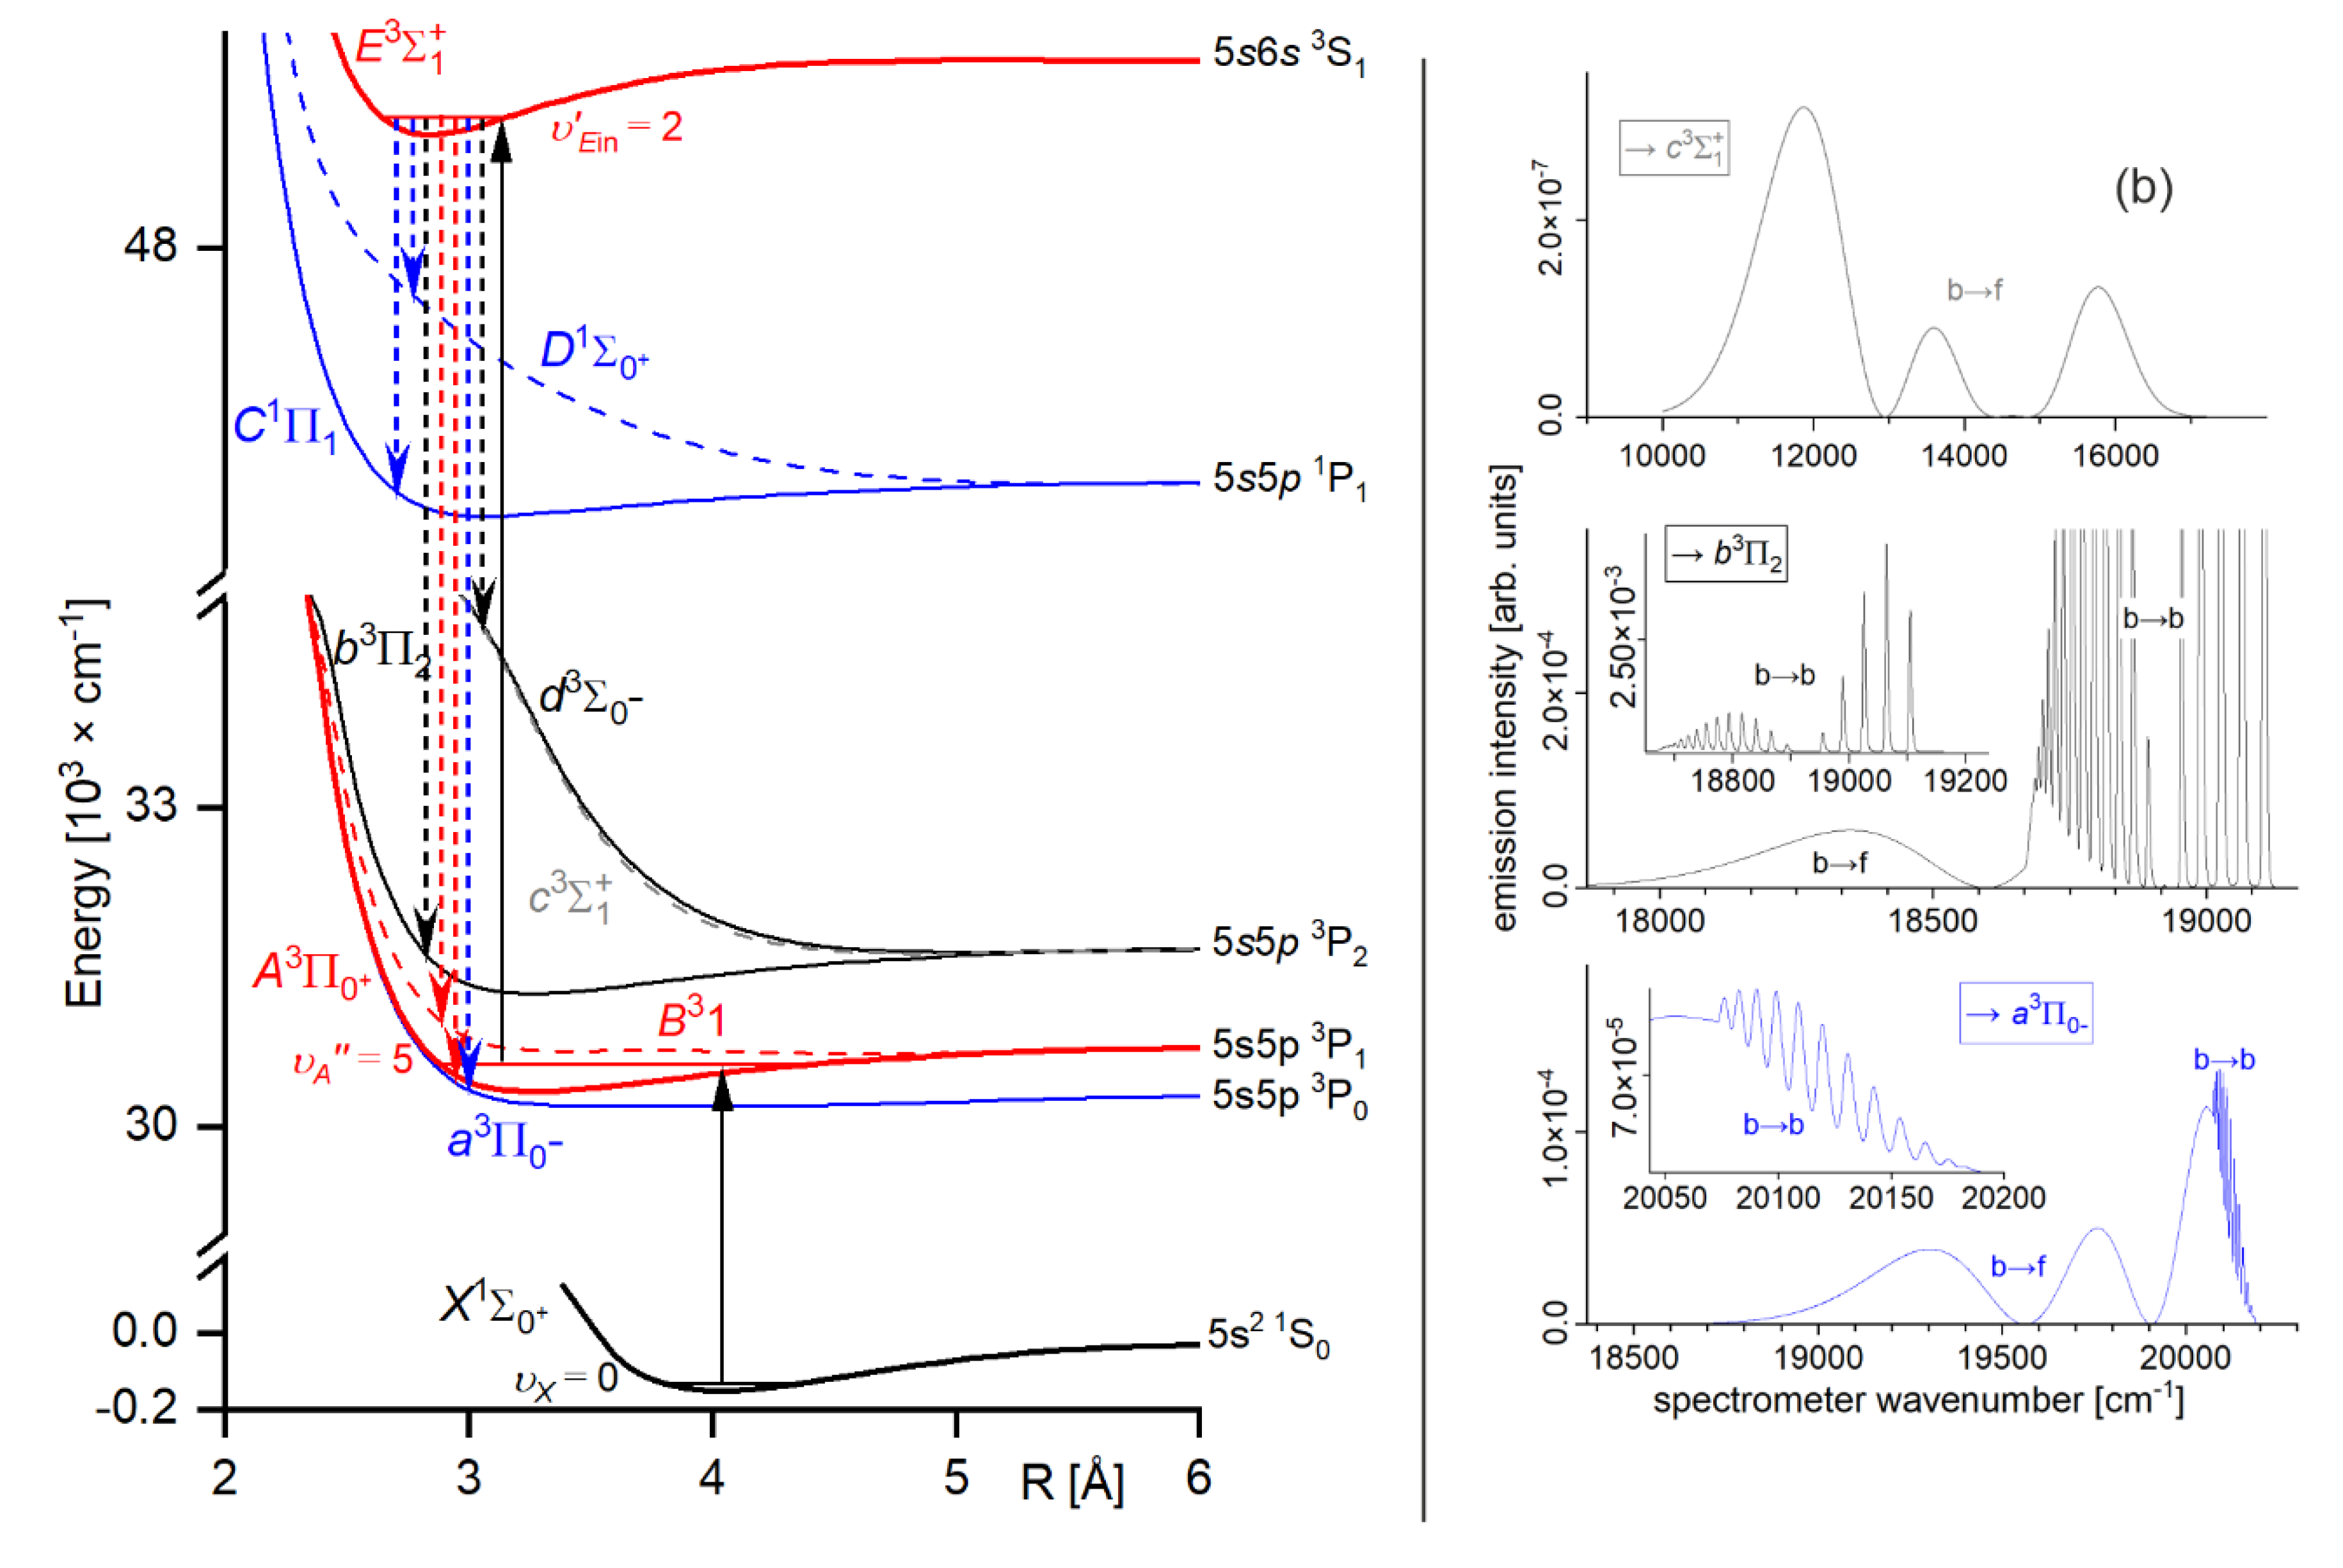
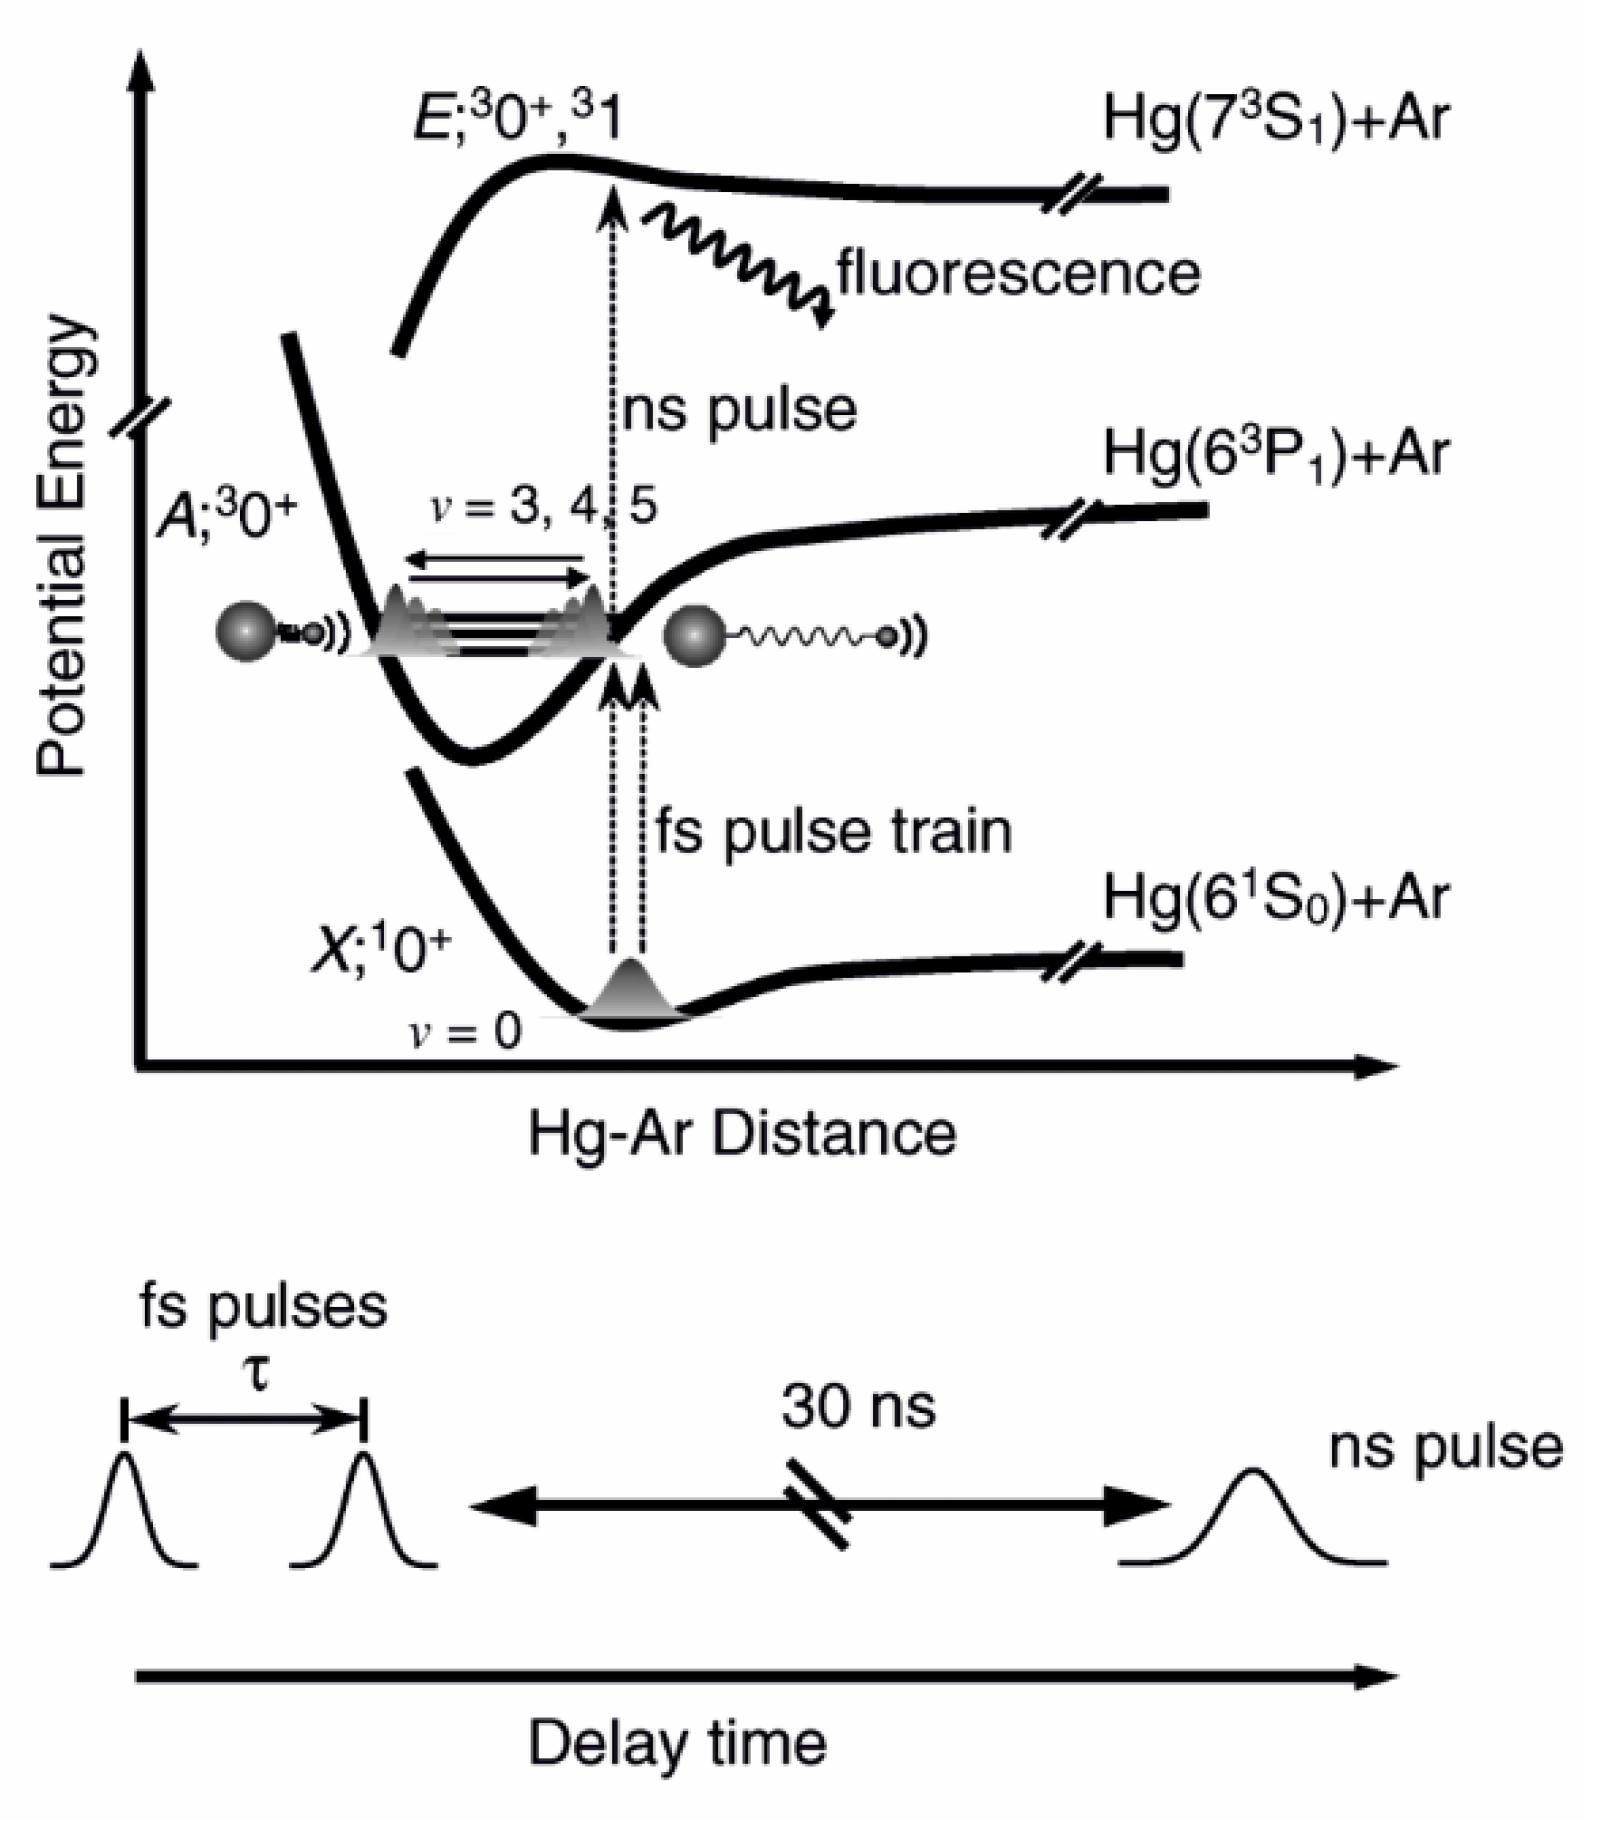
Figure 4.
Illustration of optical-optical double resonance (OODR) method applied in molecular excitation. Potential energy curves (PEC) (solid lines) of the
,
,
and
states in CdAr, and electronic transition dipole moments squared
(dashed lines) are plotted according to the recent result published by Krośnicki et al. [
4].
are plotted for (a) first step of OODR: the
and
transitions, and (b) second step of OODR: the
and
transitions. Examples of vibrational transitions (a)
and (b)
used in OODR are shown with vertical lines. Intensity of the vibrational transition depends on
along with so-called
overlap integrals (a)
and (b)
for the first and second transition, respectively, where
is an electric dipole operator,
are electronic eigenfunctions, and
are
-level vibrational eigenfunctions (shown for each vibrational level). (c) Details of the second excitation.
Ab-initio calculated height of the potential barrier is somewhat larger than that obtained from experiment (see
Figure 15). Experimental positions of
and
and
levels are also depicted.
3.2. Review of OODR Experiments in Diatomic Molecules
Since late 1970s and early 1980s OODR method has been employed in spectroscopy of higher-lying (Rydberg) electronic energy states of a variety of diatomic molecules which were produced in quartz cells, heat-pipe ovens, specially designed furnaces or molecular beams, including supersonic jets.
As the first, alkali diatomic homoatomic molecules have been investigated in heat-pipe ovens. Bernheim and coworkers spectroscopically studied the
and
Rydberg states in
, and provided molecular constants and quantum defects for
,
and
Rydberg series [107-110]. Xie and Field performed studies of the
,
,
and
states in other isotopologue,
[
111]. In Na
2, the
state was directly observed by Li and Field [
112], whereas the
and
so-called ‘shelf’ states were investigated by Sanli et al. [
113] and Saaranen et al. [
114]. In 1999, OODR spectroscopy of Li
2 and Na
2 Rydberg states was comprehensively characterized and discussed in a review article of Li and Lyyra [
115]. For
four Rydberg states
,
and
were studied by Kim et al. [
116], while for Rb
2 Arndt et al. observed and analysed the
state [
117] and double-well of the
state [
118]. Studies of Rydberg states in heteroatomic diatoms employing OODR were performed, among others, by Jabbour and Huennekens for the
state in NaK [
119] and Chu et al. for the
double-well state in NaH [
120], both in heat-pipe ovens, by Bernath and Field for the
and
states in CaF [
121], and Ludwigs and Royen for the
state in BaCl [
122] both produced in a Broida-type furnaces, and by Field et al. for the
and
states in BaO [
123] produced in a specially designed apparatus [
124].
A number of experiments, similar as reported from our lab in this review, employing OODR combined with molecular beams has been performed in studies of Rydberg states, among others, by Donovan and coworkers who investigated the
and
ion-pair states in I
2 using a pulsed beam of iodine with He as a carrier gas [
125], by Michalak and Zimmermann studying the
,
,
,
,
,
and
states in KAr vdW molecule expanded in a supersonic continuously working (cw) jet [
126], by Bouloufa et al. who investigated the
state in LiH produced in an effusive cw beam [
127], by Kleimeno et al. studying the
and
states in Ne
2 vdW molecule expanded in a pulsed supersonic beam [
128], and by Sunahori et al. who investigated the
state in BC free radical produced in a discharge free jet pulsed expansion [
129]. In all of the above OODR schemes, the Rydberg state excitation was realized from the electronic ground state
via an adequately and carefully chosen intermediate state.
The family of vdW molecules described in this article refers to MeNg, where Me is a 12-group metal atom (Me=Hg, Cd, Zn) and Ng is a noble gas atom. In
early experiments, excitation of the Rydberg states in MeNg has been realized using OODR and reported for HgNe [21-23], HgAr [
22], [
24], [
25], CdNe [
11], CdAr [
17], [
106] and CdKr [
20]. Rydberg energy states of other MeNg molecules have not been explored using OODR, but it is worthwhile to mention here that laser vaporization - optical resonance (LV-OR) method (see
Section 3.3.1) has been employed in case of ZnAr [
9]; as an alternative to OODR, LV-OR has also been used in an investigation of Rydberg states in CdAr [
18].
Analysing those
early experiments, one has to note that employing OODR a number of Rydberg electronic energy states has been reached. From among HgNg (Ng=Ne, Ar) molecules, the first one that has been investigated is the
double-well triplet state in HgAr
6). The
state was excited from the ground state
via the
or
intermediate state and characterized using LIF excitation spectra [
24]. The authors found the inner and outer potential wells to be 1430±7
and 38±7
deep, respectively. The same intermediates,
and
, were used to excite the triplet Rydberg series of the
states in HgNe [
21], [
22], the
Rydberg state in HgAr [
22] and the singlet Rydberg series of the
states in HgNe [
23]. Studies of Onda et al. [
22], [
23] showed that for HgNe a distinct potential barrier in the
and
occurs for
and is accompanied with the inner well located (almost) entirely above the dissociation limit. For
relatively deep inner well
appears along with small energy barrier
for singlet state, whereas for triplet state the energy barrier is expected at slightly larger
. For the
state in HgAr only the inner potential well was characterized and found to be 1602±4
deep (the outer, shallower potential well was not located).
Early studies of CdNg (Ng=Ne, Ar, Kr) molecules in which OODR was employed has been performed by Czajkowski et al. [
106], and Koperski and Czajkowski [
11], [
17], [
20]. For all of three molecules, potential of the
state was investigated in CdNe [
11], CdAr [
17] and CdKr [
20] using excitation from the
via the
or
intermediate state allowing to perform first-time studies of different parts of the
-state potential exploring bound
bound and free
bound transitions, however, with limited spectral resolution. From those studies it was concluded that the
- state potential in CdNe, CdAr and CdKr possesses a distinct potential barrier which, in CdAr and CdKr, separates inner (deep) and outer (shallow) potential wells (for the
state in CdNe, an evidence of the outer well was not found and the potential barrier was located entirely above the
asymptote). It was also concluded that the outer well in CdAr and CdKr may accommodate 8 (
=0-7) and 7 (
=0-6) vibrational levels, respectively.
3.3. Example of Methods Alternative to OODR
3.3.1. Laser vaporization - optical resonance (LV-OR)
In general,
laser vaporization - optical resonance (LV-OR) method relies on utilizing a vaporization laser pulse (commonly second or third harmonic of 1064 nm Nd:YAG laser, 690 nm Ti:Sa laser, or 308 nm XeCl excimer laser) in the first-step of the excitation. It is usually used to overcome obstacles associated with heating a metal sample in the reservoir before the expansion to assure sufficient metal partial vapour pressure (typical values are 250-350 mbar) to produce molecules during adiabatic expansion to the vacuum. For most of the metal elements, the heating temperature should exceed 1300 K creating considerable difficulties. Laser vaporization itself produces a number of metal atoms in their metastable electronic states. For example, for ZnAr (
) [
9] and CdAr (
) [
18], during the expansion the metastable metal atoms form molecules with a carrier gas (argon) in electronic states, such as the
or
, which may serve as intermediate states in LV-OR process. Consequently, characterisation of the
Rydberg state in ZnAr and the
Rydberg state in CdAr was performed using supersonic expansion beams and LIF excitation spectra recorded using the
,
and
second-step transitions, respectively.
The problem with LV-OR method relies on highly non-selective excitation process that is realized in the first-step of excitation (LV) which produces a considerable amount of intermediate states, such as the
,
,
and
,
,
. Consequently, usually more than one intermediate state may participate in the second-step of the excitation causing difficulties in proper interpretation of the LIF excitation spectra. Such particular case can be found in the above mentioned investigation of the
state in ZnAr (e.g.
Figure 1 in Ref. [
9]) where two distinct
-progression to the
state are present. In the interpretation of the recorded spectrum the authors assumed that
‘the two series of vibrational progressions correspond to transitions from of different levels to the F-C favoured levels of the upper state’ and the
- state potentials were represented by respective Morse functions. Unfortunately, in analogous study of the
state in CdAr no corresponding spectrum was presented [
18].
As compared to OODR, another disadvantage associated with LV-OR relies on the fact that it makes impossible to choose the most appropriate intermediate-state in order to study different parts of the final-state interatomic potential.
Despite of the above-mentioned disadvantages, LV-OR method was employed using supersonic expansion beams also in studies of other MeNg and Me
2 (Me = 2-, 11- or 13-group atom) molecules, for example MgNg (Ng=Ne, Ar, Kr, Xe) [130-134], AgNg (Ng=Ar, Kr, Xe) [
135], AuAr [
136], AlNg (Ng=Ar, Kr, Xe) [
137], [
138], InNg (Ng=Ar, Kr, Xe) [
139], [
140], Be
2 [
141], Ba
2 [
142], and Ga
2 [
143].
3.3.2. Laser Photoassociation and Excitation (Pump-And-Probe)
Another frequently used technique that allows to study Rydberg electronic states in molecules, especially those without stable or very weakly bound ground electronic state, is so-called
pump-and-probe method. The method has been widely used in the investigation of 12-group homoatomic Hg
2 [
144], [
145] and Zn
2 [146-149] dimers, and heteroatomic HgZn [150-153] and HgCd [
154] excimers in search of media for potential tuneable laser working in UV and based on vdW molecules and exciplexes. These unstable diatomic molecules have repulsive ground-state potentials exhibit shallow vdW minima with depths in the range 220-550
[
155,
156,
157,
158]. Consequently, in temperatures higher than 270-380 K they cannot exists in their ground states, so excitation to their Rydberg states has to be re-arranged creating considerable population of their low-lying metastable states while maintain their vapour partial pressure at the necessary level.
Pump-and-probe method employed in those studies relied on irradiation of hot atomic vapour in a quartz cell by two laser pulses. The cell contained Hg, Zn, Zn-Hg mixture or Cd-Hg amalgam for investigation of Hg
2, Zn
2, HgZn, HgCd, respectively. The cell was heated up to 600-1100 K, depending on its content, to ensure metal vapour partial pressure in the range of 600-2200 mbar. The first laser (pump) pulse is close to the resonance transition from the
atomic ground state to the lowest-lying
manifold. As a result of the process of three-body collisions
and collisional relaxation that followed them,
homoatomic or
heteroatomic metal dimer in a metastable
,
,
or
state is created in
,
, HgZn or HgCd, respectively (for HgZn [
153] and Hg
2 [
72], see
Figure 5). The consecutive laser (probe) pulse excites corresponding molecule from the metastable ‘reservoir’ to the higher-lying Rydberg state after which a resulting LIF is recorded while tuning the probe-laser frequency. Several Rydberg states were investigated providing spectroscopic characterization for the
,
and
states in Hg
2 [
144], [
145], the
and
,
,
states in Zn
2 [
146,
147,
148,
149], the
,
,
,
and
states in HgZn [150–153], as well as the
and
states in HgCd [
154], some of them having a complex double-well structure in their Rydberg-state potential.
Instead of hot atomic ensemble in a cell or in heat-pipe oven, pump-and-probe experiments can be carried out for cold or ultracold atoms in atomic traps (magneto-optical, all-optical etc.). Knowledge on the interatomic potentials, especially those with ‘exotic’ irregular structure, thus enabling PA of cold or ultracold homo- and heteroatomic diatomic molecules, is highly required. Formation of cold
through PA in the
double-well excited state [
159], [
160], and in the ground state through PA in the
long-range state [
160] were reported. Also, giant, so-called Rydberg macrodimers, i.e. 1-
-sized cold
molecules correlating with the
, dissociation asymptotes
was produced from two Cs Rydberg atoms [
162]. Cold
molecules were formed through PA in the
state with potential barrier [
163] and in the ground state through two-photon PA in the
or
state
via state [
164]. Formation of cold
through
level of the
state short-range PA to the
state with potential barrier [
165] was performed. Among heteroatomic molecules, formation of ultracold dipolar LiCs in the lowest ro-vibrational levels
by PA into the
state and decay to the
state was reported [
166]. In each of the above cases, when cold molecules were formed in one of their excited electronic state, the PA was followed by an ionization using carefully chosen molecule
molecular ion electronic transition using tuneable laser radiation. It allowed a precise vibrational spectroscopy of very dense
levels close to the dissociation limit in a long range of
R.
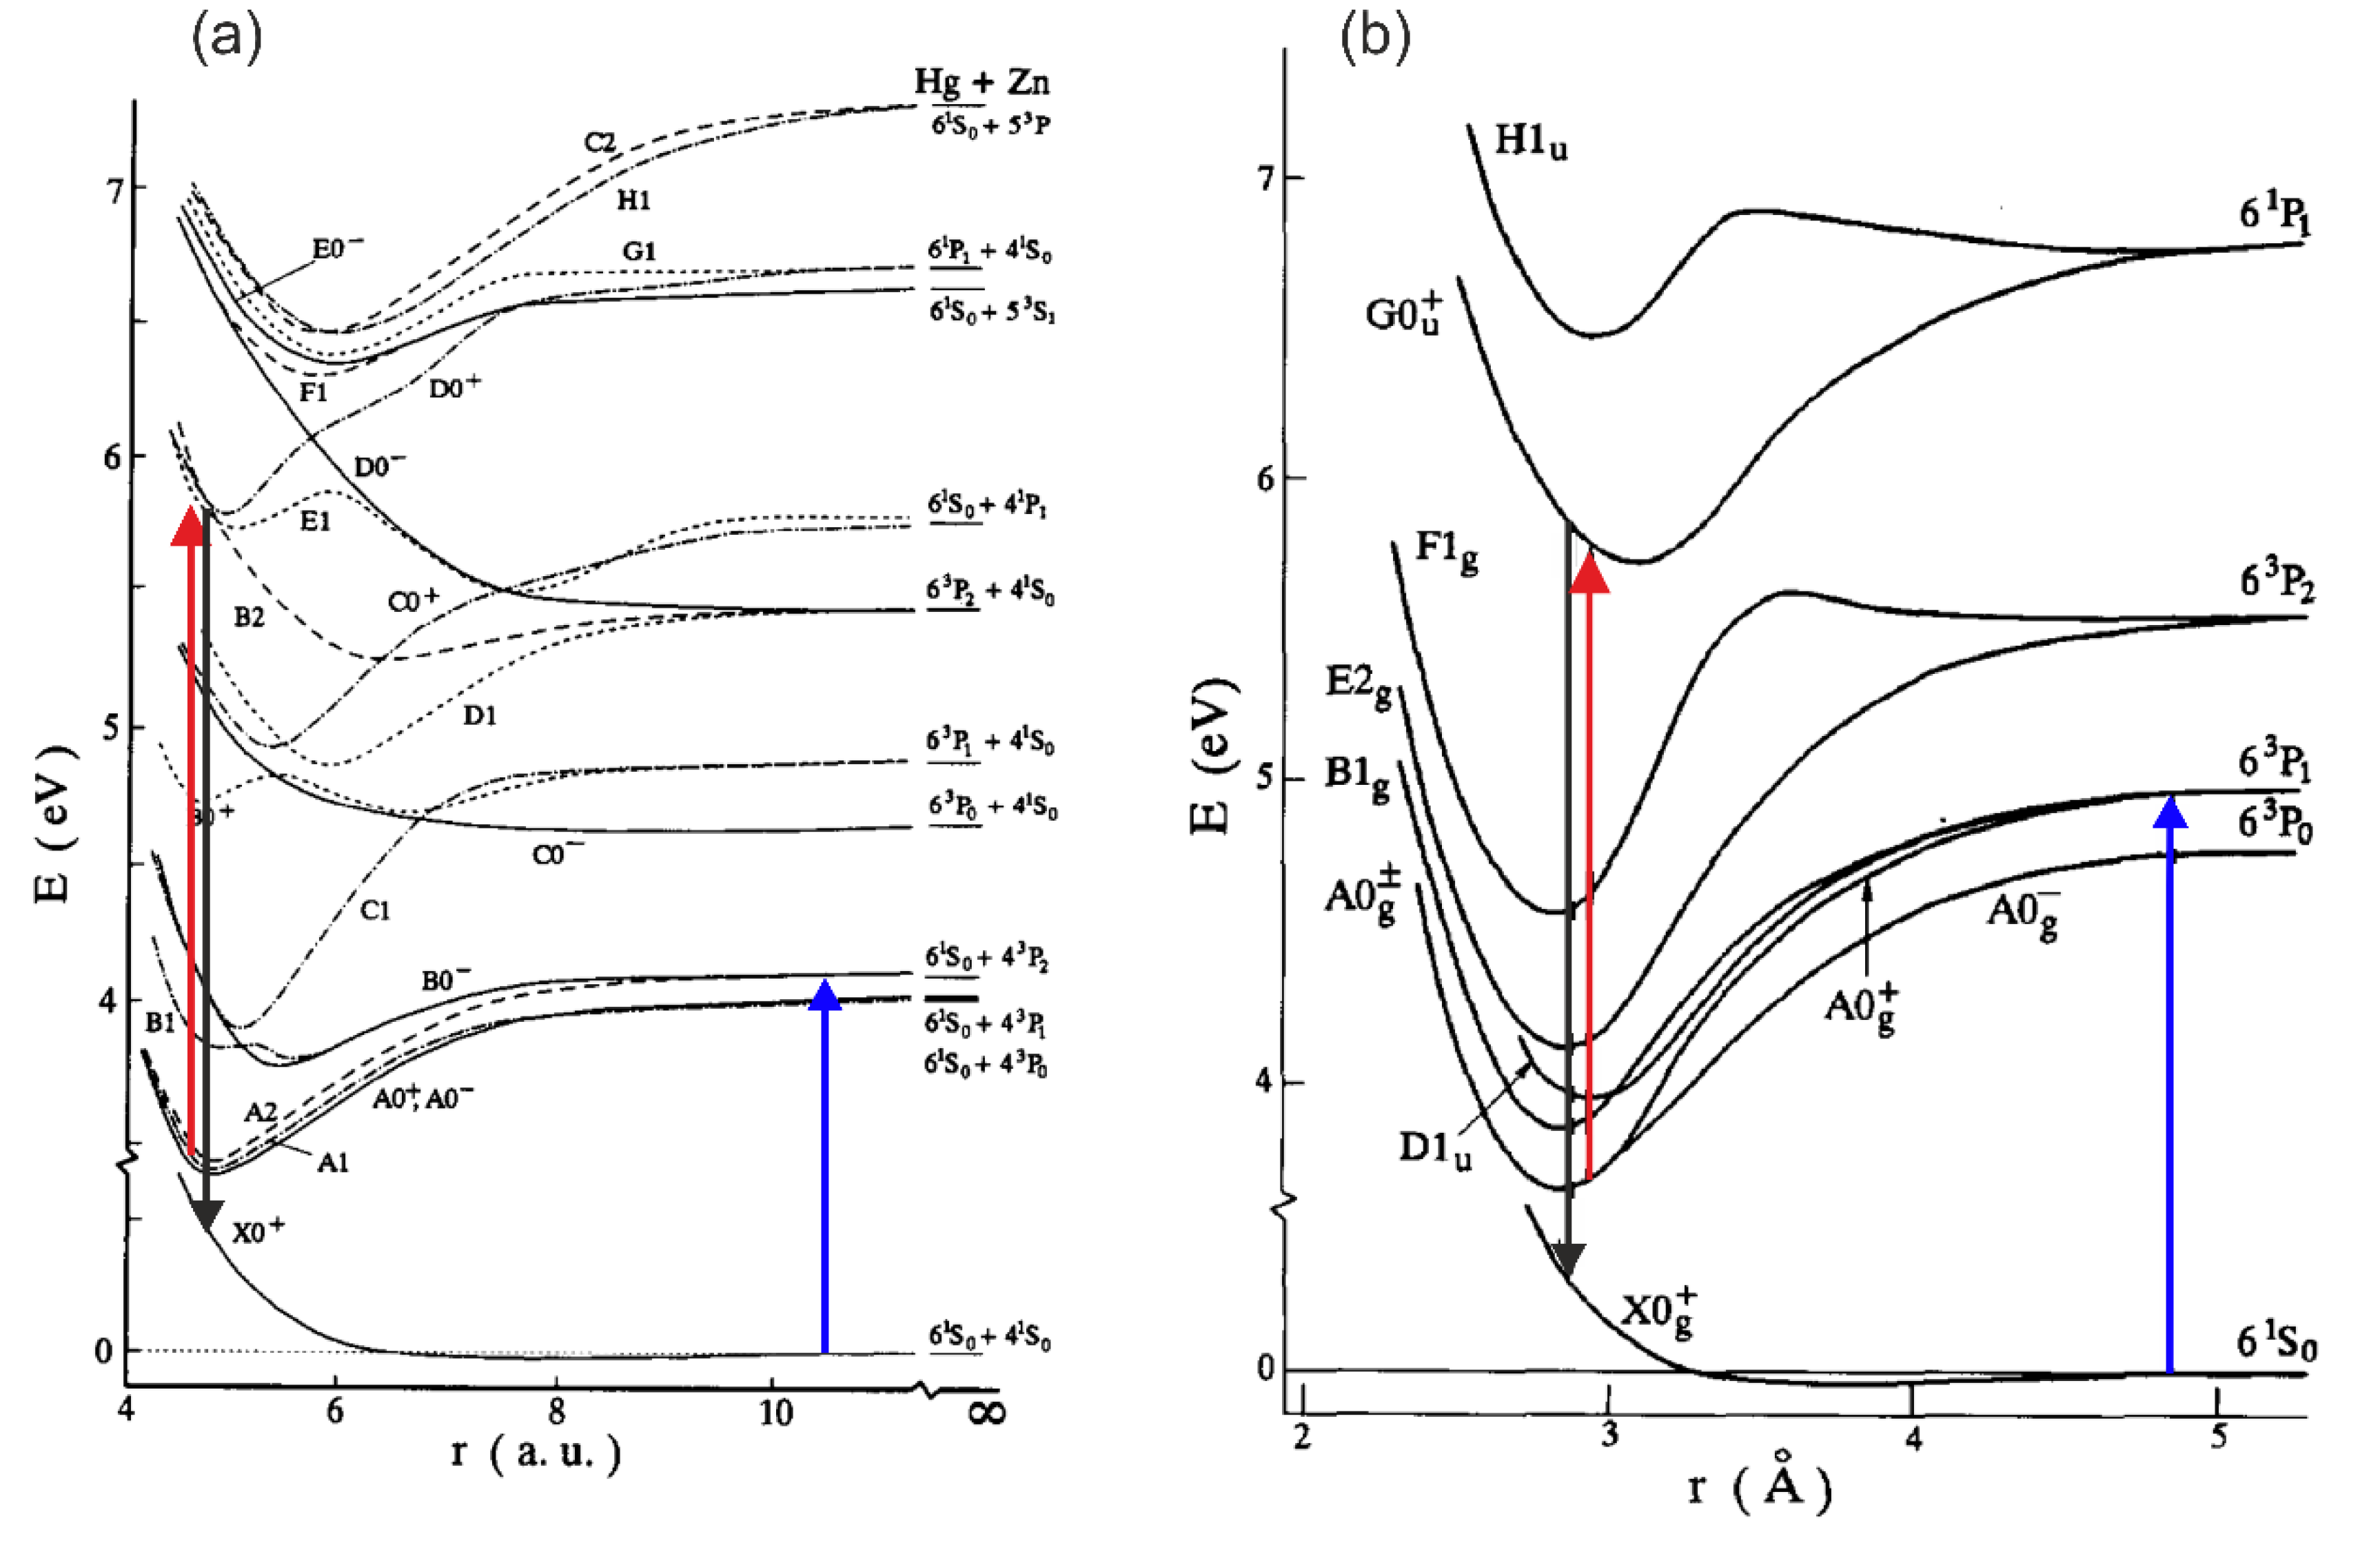
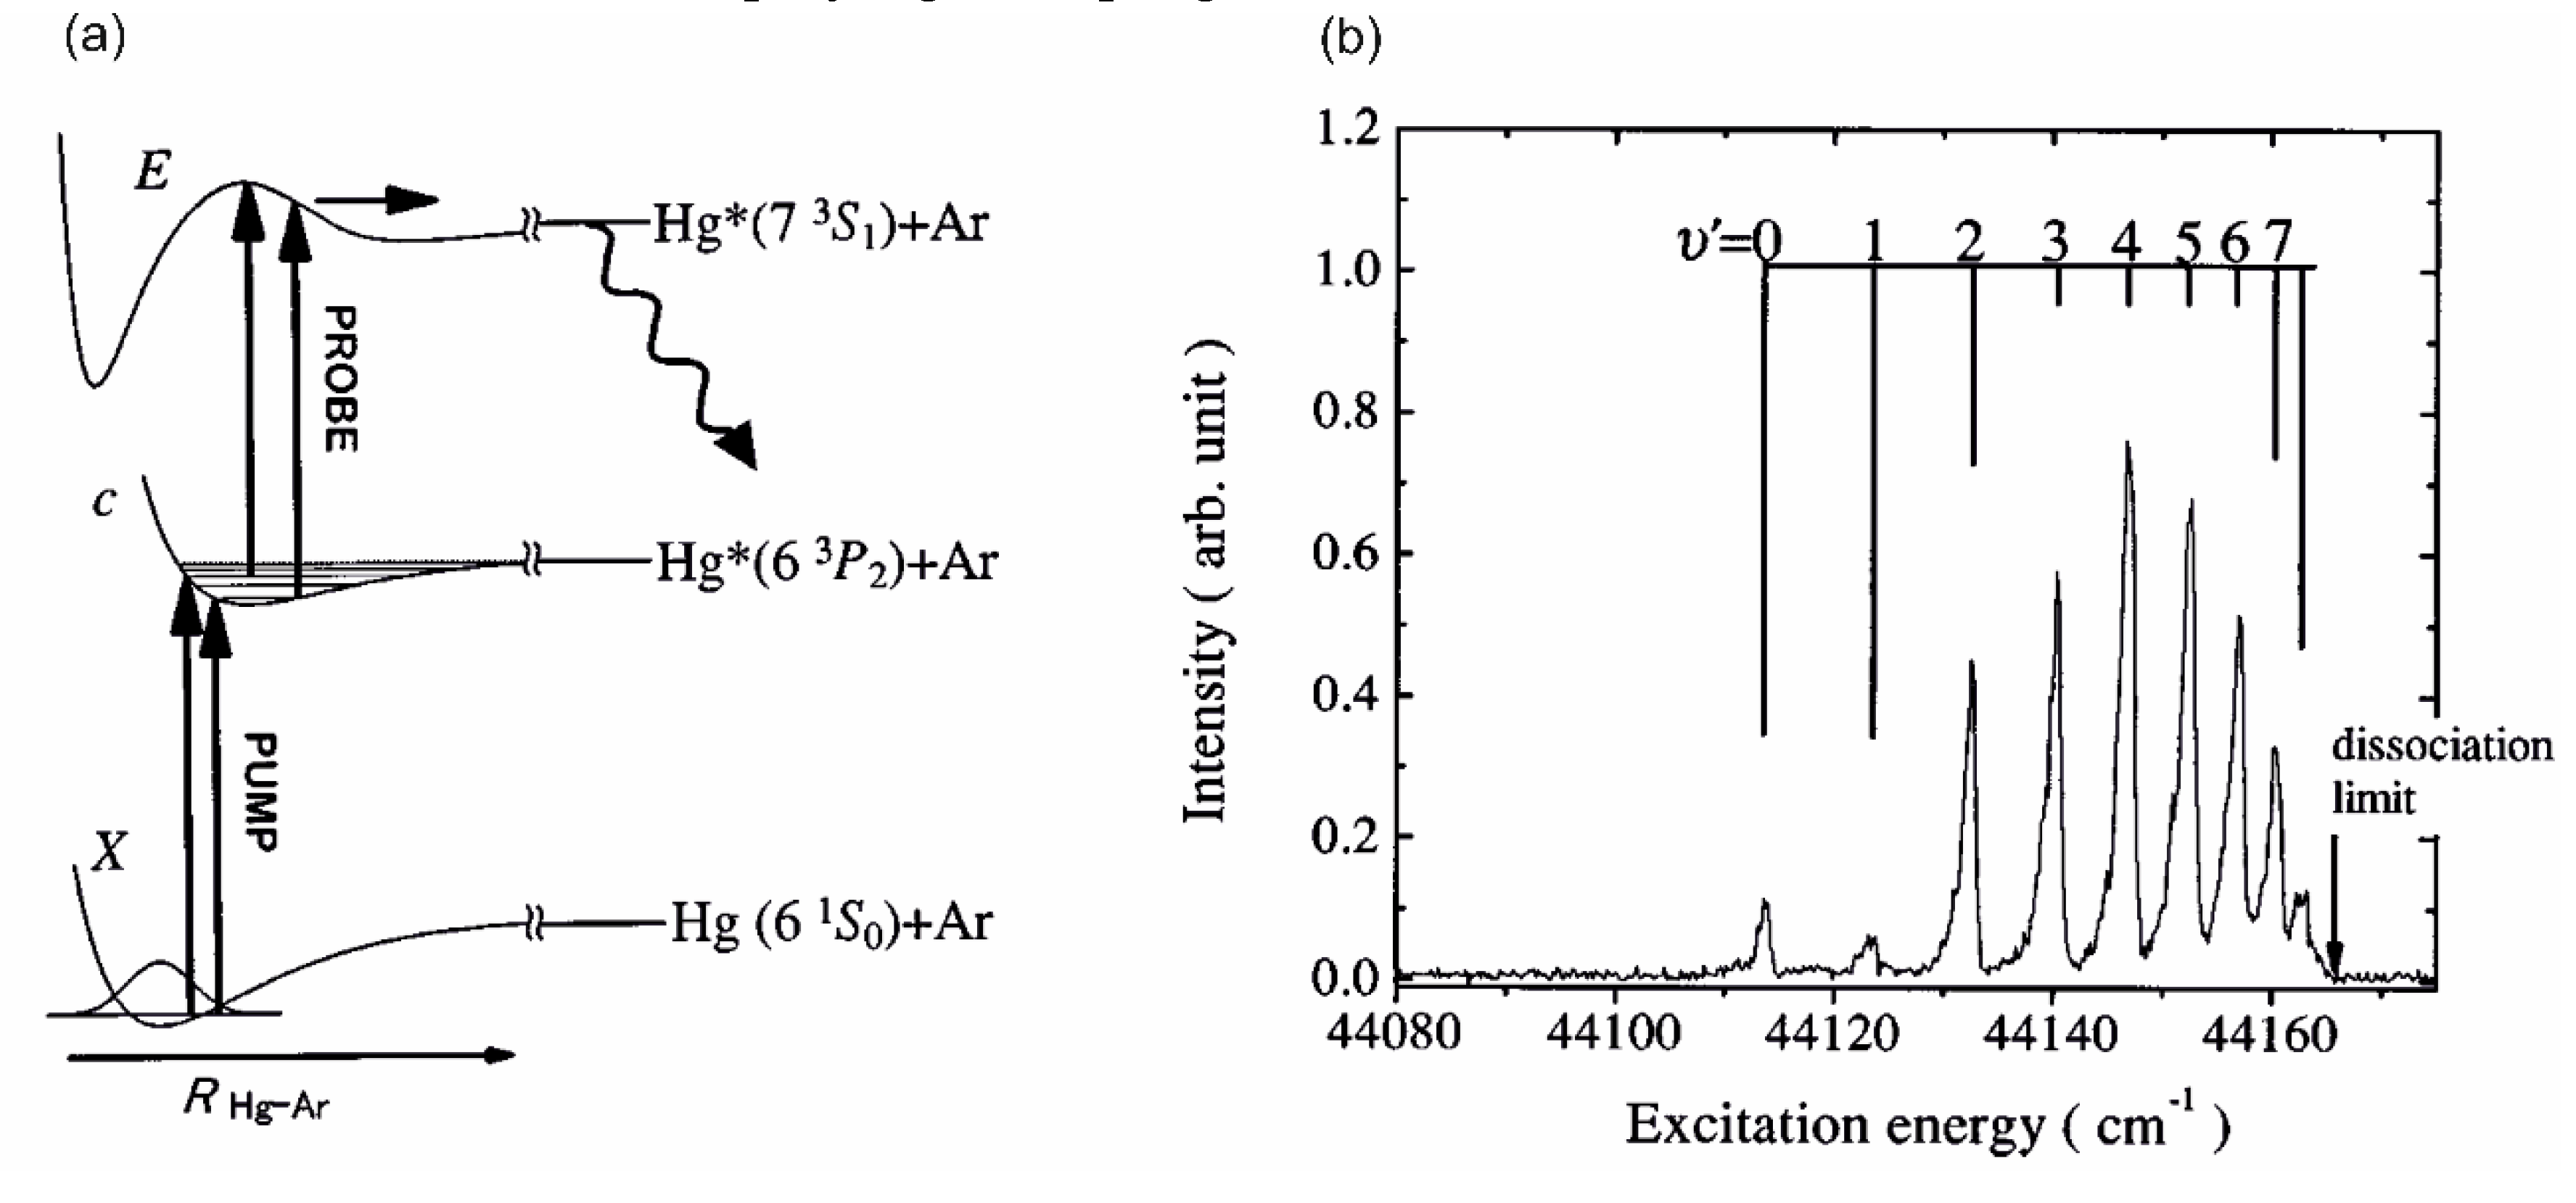
Figure 5.
Diagram of interatomic potentials for (a) HgZn (from Ref. [
153], under permission of Elsevier Science B.V.) and (b) Hg
2 (from Ref. [
72], under permission of Elsevier Science B.V.) showing the relevant pump (blue arrows), probe (red arrows) and LIF (black arrows) processes. Arrows are added to the original figure. Note: 1 a.u. = 0.5292
.
3.3.3. Polarization Labelling Spectroscopy
Very interesting alternative to OODR is
polarization labelling spectroscopy (PLS) method [
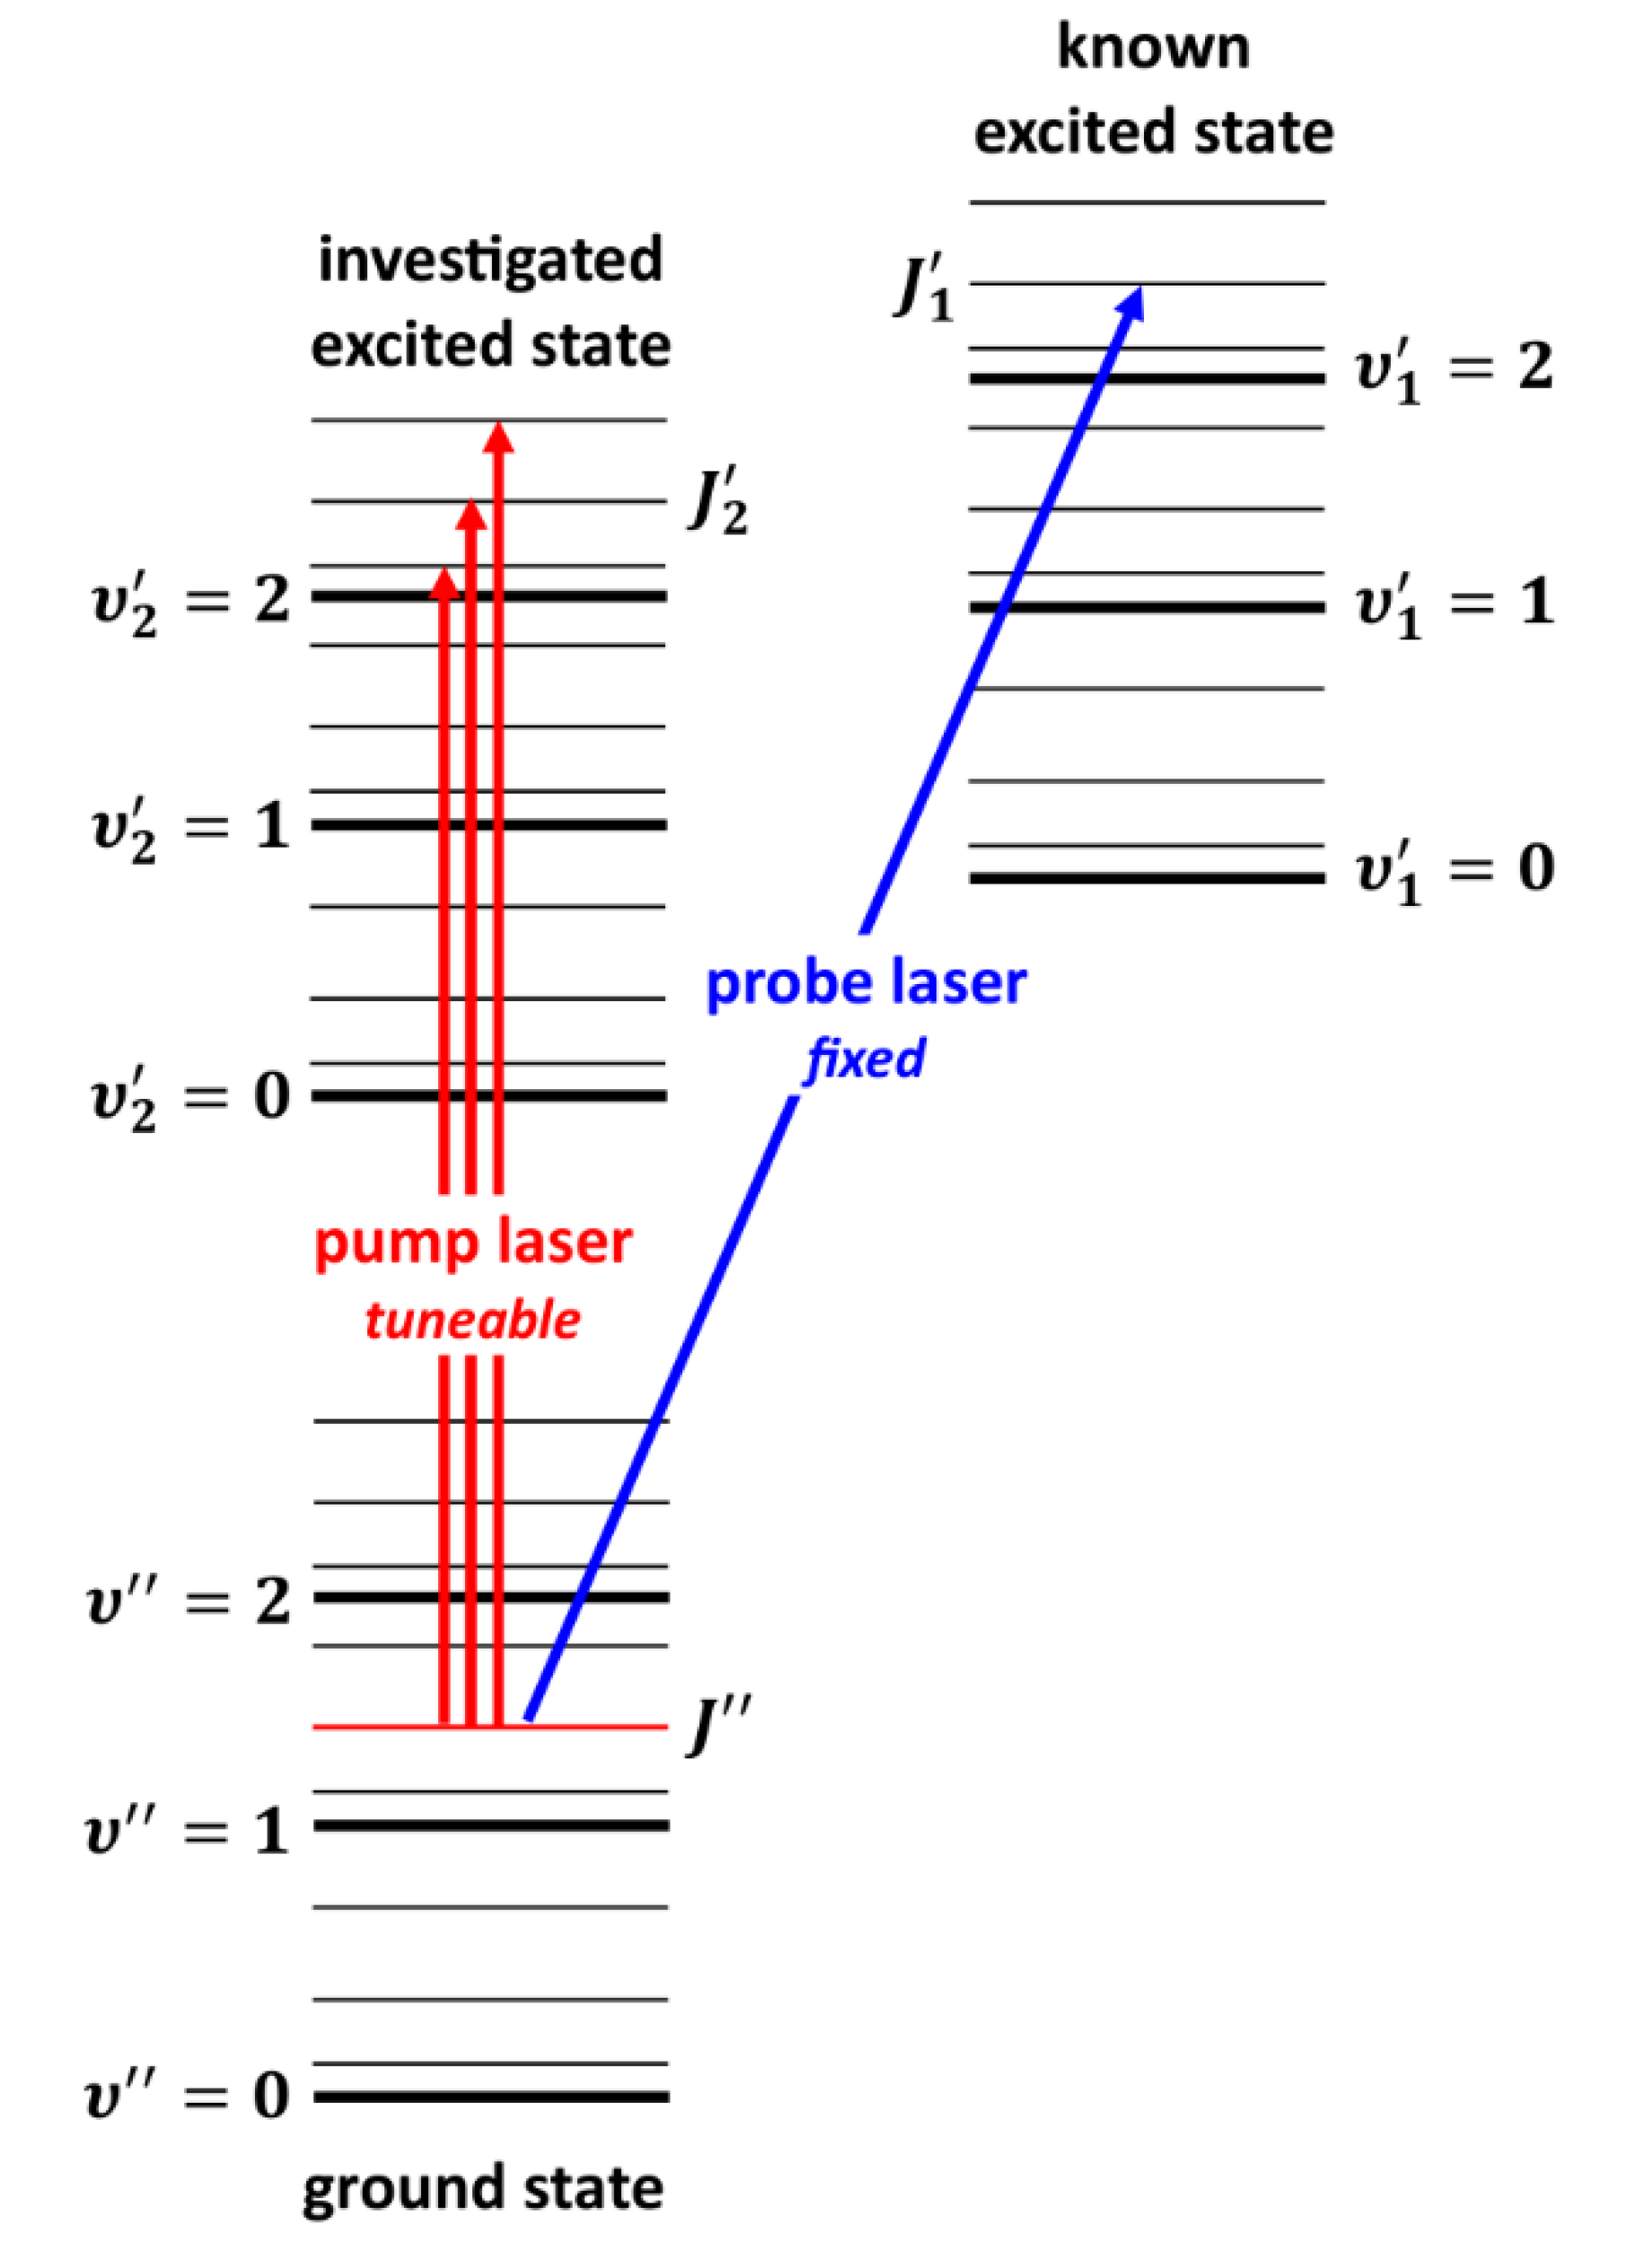
167] which allows to simplify spectra of diatomic molecules and investigate, among others, higher-lying molecular states, including those with complex nature. A V-type optical double-resonance version of PLS relies on using two lasers: fixed-frequency probe-laser and tuneable-frequency pump-laser (see
Figure 6). The frequency of the linearly polarized, weak probe-laser is set in resonance with known ro-vibrational molecular transitions
. The frequency of circularly or linearly polarized pump-laser is tuned across the studied band system. At the frequencies at which the transition induced by the pump-laser
shares the same lower level
with the probe-laser transition, the probe-laser beam changes its polarization. The change is detected with a set of crossed polarizers placed in the path of the probe-laser beam on both sides of the molecular sample. Tuning the pump-laser frequency over the excited-state
- progression
provides the desired polarization labelling spectrum, simplified by the fact that it originates from a few ground-state levels with fixed and known
quantum numbers.
PLS method has been employed in characterization of potentials of electronic states with double-minima in alkali metal homoatomic dimers:
in K
2 (
n=5) [
168] and in Na
2 (
n=4) [
169],
and
in Li
2 [
170],
in Rb
2 [
93],
in Cs
2 [
171], and in heteroatomic dimers:
in NaK [
172],
in KCs
[
173], and
in NaRb [
174], all produced in heat-pipe ovens.
4. Ab-Initio Calculated Potentials of MeNg Molecules—Early, Recent and Future Approaches
Interatomic potentials of 12-group MeNg molecules (Me=Zn, Cd, Hg), including those of Rydberg electronic energy states, have been ab-initio calculated by a number of researchers bringing information on their PECs, respective absorption oscillator strengths and TDMs. The ab initio results were frequently confronted with the experimental outcomes, in some cases allowing to perform successful experiments by correct choice of excitation and/or emission spectral regions associated with studied molecular electronic transitions.
The interatomic potentials of higher-lying electronic energy states of CdNg molecules including Rydberg states correlating with the
and
Cd asymptotes, and
or TDMs were theoretically studied by Czuchaj and Sienkiewicz [
175]
7), Czuchaj and Stoll [
6], Czuchaj et al. [
7] and Krośnicki and collaborators [
39], [
40], Krośnicki et al. [
4], Li et al. [
177], where in Refs. [
4] and [
177] Rydberg states were calculated up to the
asymptote. The spin-orbit (s-o) effect was not included in Ref. [
6] (in fact, in Ref. [
6] s-o interaction was included only for
Cd levels using a semi-empirical approach
8). Calculations of Refs. [
4], [
6], [
7], [
39], [
40] resulted in a double-well structure of the
and
- state potentials; it should be noted that in Ref. [
4] all the considered Rydberg states of
symmetry up to the
asymptote exhibit double-well character.
As far as the methods of calculation are concerned, in Ref. [
175] the semiempirical pseudopotential method, where CdNg molecule was treated as two-electron system by placing
and total Ng into cores, while in Ref. [
6] valence
ab-initio CASSCF/CASPT2 [
178] calculations for CAS
were executed with
and
cores replaced by semi-empirical [
179] and quasi-relativistic [
180] pseudopotentials, respectively
9). In Ref. [
7] large scale valence
ab initio CASSCF/CASPT2 [
178] calculations were performed for CAS
with
and
cores simulated by energy-consistent effective-core pseudopotentials (ECP), including scalar-relativistic effects and s-o interaction within the valence shell [
180], [
181]. Finally, in Refs. [
39] and [
40] the calculations were performed with CASSCF/CASPT2 level of theory [
178] for CAS
with
and
cores replaced by ECPs [
180], [
182]. Ground state PECs in Refs. [
39] and [
40] were calculated with coupled clusters method CCSD(T) [
183], [
184]. It is noted that in Refs. [
39] and [
40] the internally-contracted MRCI method [
185], [
186] was used for better description of the wavefunctions taken for the calculations of TDMs.
With respect to recent
ab initio calculations of CdAr interatomic potentials, in 2019 Krośnicki et al. [
4] reported on the relatively unexplored area of low-lying Rydberg states of vdW molecules. They performed first-time fully
ab initio calculations on interatomic potentials of the Rydberg states of CdAr lying above the
,
asymptotes, reaching the
,
,
,
and
,
asymptotes. All the calculated PECs of the Rydberg states of
symmetry exhibited undulations resulting in their double-well character (see also
Section 1). Main calculations were performed with restricted active space (RAS) SCF [
187] method followed by RAS second-order perturbation theory (RASPT2) [
188] for RAS (5
s–1
e//5
p5
d6
s6
p7
s–1
h)
10); s-o interaction was included
via RAS state interaction (RASSI) method [
189]. Wherever it was possible, the selected states were recalculated with CASSCF/CASPT2 [190-193] as well as with CCSD(T) [
194] methods. In Ref. [
4] the results of CCSD(T) calculations have served as the benchmarks for the assessment of the RASSCF/RASPT2 counterparts.
In other recently performed calculations of CdNg potentials of Li et al. [
177], only singlet potential curves of CdNg, up to the
Rydberg state, and corresponding
fs and TDMs were calculated. Surprisingly, no conclusion was provided in Ref. [
177] about double-well character of the
- Rydberg state potentials. Excitation energies in Ref. [
177] were calculated with EOM-CCSD method [195-198]. The corresponding PECs of the excited states were obtained by adding the EOM-CCSD excitation energies to the ground state PEC obtained with CCSD(T) method, and with quasirelativistic energy-consistent small-core ECPs [
182] along with large atom-centred basis sets and with midbond functions. Towards such results the experimental verification is highly needed. The respective experimental approach is planned in our laboratory in order to meet the demand.
To ensure a complete view on the calculations of Rydberg-state interatomic potentials of 12-group MeNg molecules, those for ZnNg and HgNg are reviewed below.
Large scale quasirelativistic valence
ab initio CASSCF/CASPT2 for CAS
calculations of the
and
- Rydberg state potentials of ZnNg correlating with the
and
Zn asymptotes, respectively, were performed by Czuchaj et al. [
5] and Krośnicki and collaborators [
39], [
40]. In the calculations of Ref. [
5], the
and
cores were replaced by ECP [
180], [
199] which also accounted for scalar-relativistic effects and s-o interaction. Result of the calculations shown that the
and
- state potential curves in ZnAr, ZnKr and ZnXe exhibit shallow second minima at larger
Rs. In Refs. [
39], [
40] calculations were made similarly as for CdNg described above with the
and
cores replaced by ECP and s-o and relativistic effects taken into account.
Recent
ab initio calculations of ZnNg interatomic potentials are those performed by Kędziorski et al. for ZnAr [
3], Li et al. for ZnNg [
200] and Li et al. for ZnHe [
201]. In Ref. [
3] PECs were
ab-initio calculated up to Rydberg state correlating with the
Zn asymptote. The state-average (SA) CASSCF [
190] was employed for CAS
. Dynamic correlation effects were accounted for
via multi-state (MS) CASPT2 [
193]. The s-o interaction was included
via restricted active space state interaction method (RASSI-SO)
11). In Ref. [
200], only singlet interatomic potentials of ZnNg, including the
Rydberg state, and corresponding TDMs, F-C factors
, and spectroscopic constants were calculated with EOM-CCSD method as in Ref. [
177] with no conclusion about double-well character of the
state. Calculations reported in Ref. [
200] were executed using method similar to that employed in Ref. [
177]. Finally, in Ref. [
201] ZnHe Rydberg state potentials were
ab-initio calculated up to the
asymptote using multireference configuration interaction plus Davidson correction (MRCI+Q) method [
185], [
202] on the top of CASSCF calculations with CAS
; s-o coupling was included.
Large scale valence
ab initio CASSCF/CASPT2 [
178] for CAS
calculations of the Rydberg
and
- state potentials of HgNg correlating with the
and
Hg asymptotes, respectively, were performed by Czuchaj et al. [
8]. In the calculations, the
and
cores were simulated by energy-consistent pseudopotentials [
180], [
181] which also accounted for scalar-relativistic effects and s-o interaction. Result of the calculations shown that the
and
- state potential curves in HgAr, HgKr and HgXe exhibited shallow second minima at larger
Rs.
As it was mentioned above, the main source of the inaccuracies of the
ab initio calculations of excited states of MeNg molecules is due to deficiencies in description of the electron correlation. Thus, future approach of capturing of electron correlation will be probably based on EOM-CC methods, where the level of the approximation should go beyond the CCSD one. The need of higher level of CC approximation was shown e.g. in Ref. [
3], where the results of CCSD calculations were less accurate in comparison with the MS-CASPT2 counterparts. First works reporting EOM-CC calculations for excited states of MeNg molecules were already published by Li et al. [
177], [
200], where the non-iterative triples were taken into account indirectly by adding EOM-CCSD excitation energies to the CCSD(T) total energies of the ground state of MeNg molecule. Detailed comparison of these recent results of
ab initio calculations [
177], [
200] with experimental data is needed.
5. Progress in CdNg Spectroscopy of the
Rydberg State—Recently Performed OODR Experiments
Since 2015, in our lab we have been performing a series of experiments involving characterization of the Rydberg state in CdNe, CdAr and CdKr molecules. The experiments brought very interesting results and conclusions that moved forward ways to characterize Rydberg states and/or employ subtleties of the method to extract interesting spectroscopic characteristics that had been impossible to be deduced earlier. Results of the experiments were frequently confronted with those from available outcomes of ab initio calculations.
In this review we present progress that has been made to the present [
10], [12-15], [
19], [
203]. The presentation is
supplemented with extended analyses and discussions. We also present
other ab-initio and experimental results representing original evidence and analyses that constitute the most interesting advances in the Rydberg state theoretical and experimental characterization in CdNg molecules. The progress should be compared with previous studies of others that are reviewed in Section 3.2 and 3.3, and in Section 5 below.
5.1. Special Approach for Rotational Characterization—Direct Bond Length Determination of the
State in CdNe
In case of heavy molecules, rotational spectroscopy imposes higher demand on the spectral bandwidth of the laser that is employed to resolve the relatively dense rotational energy structure. In OODR experiment the demand is imposed on two lasers tuned to both optical transitions.
Until 2022, the spectroscopical characterization of the
Rydberg state potential of CdNe molecule has been performed only once [
11]. It did not involve rotational resolution approach. Very recently, using OODR process, Urbańczyk et al. [
10] first-time demonstrated a selective
- excitation in the energy structure of the
state - a smart approach that allowed to perform rotational characterization with laser possessing a limited spectral bandwidth. The OODR experiment employed the
path of the excitation.
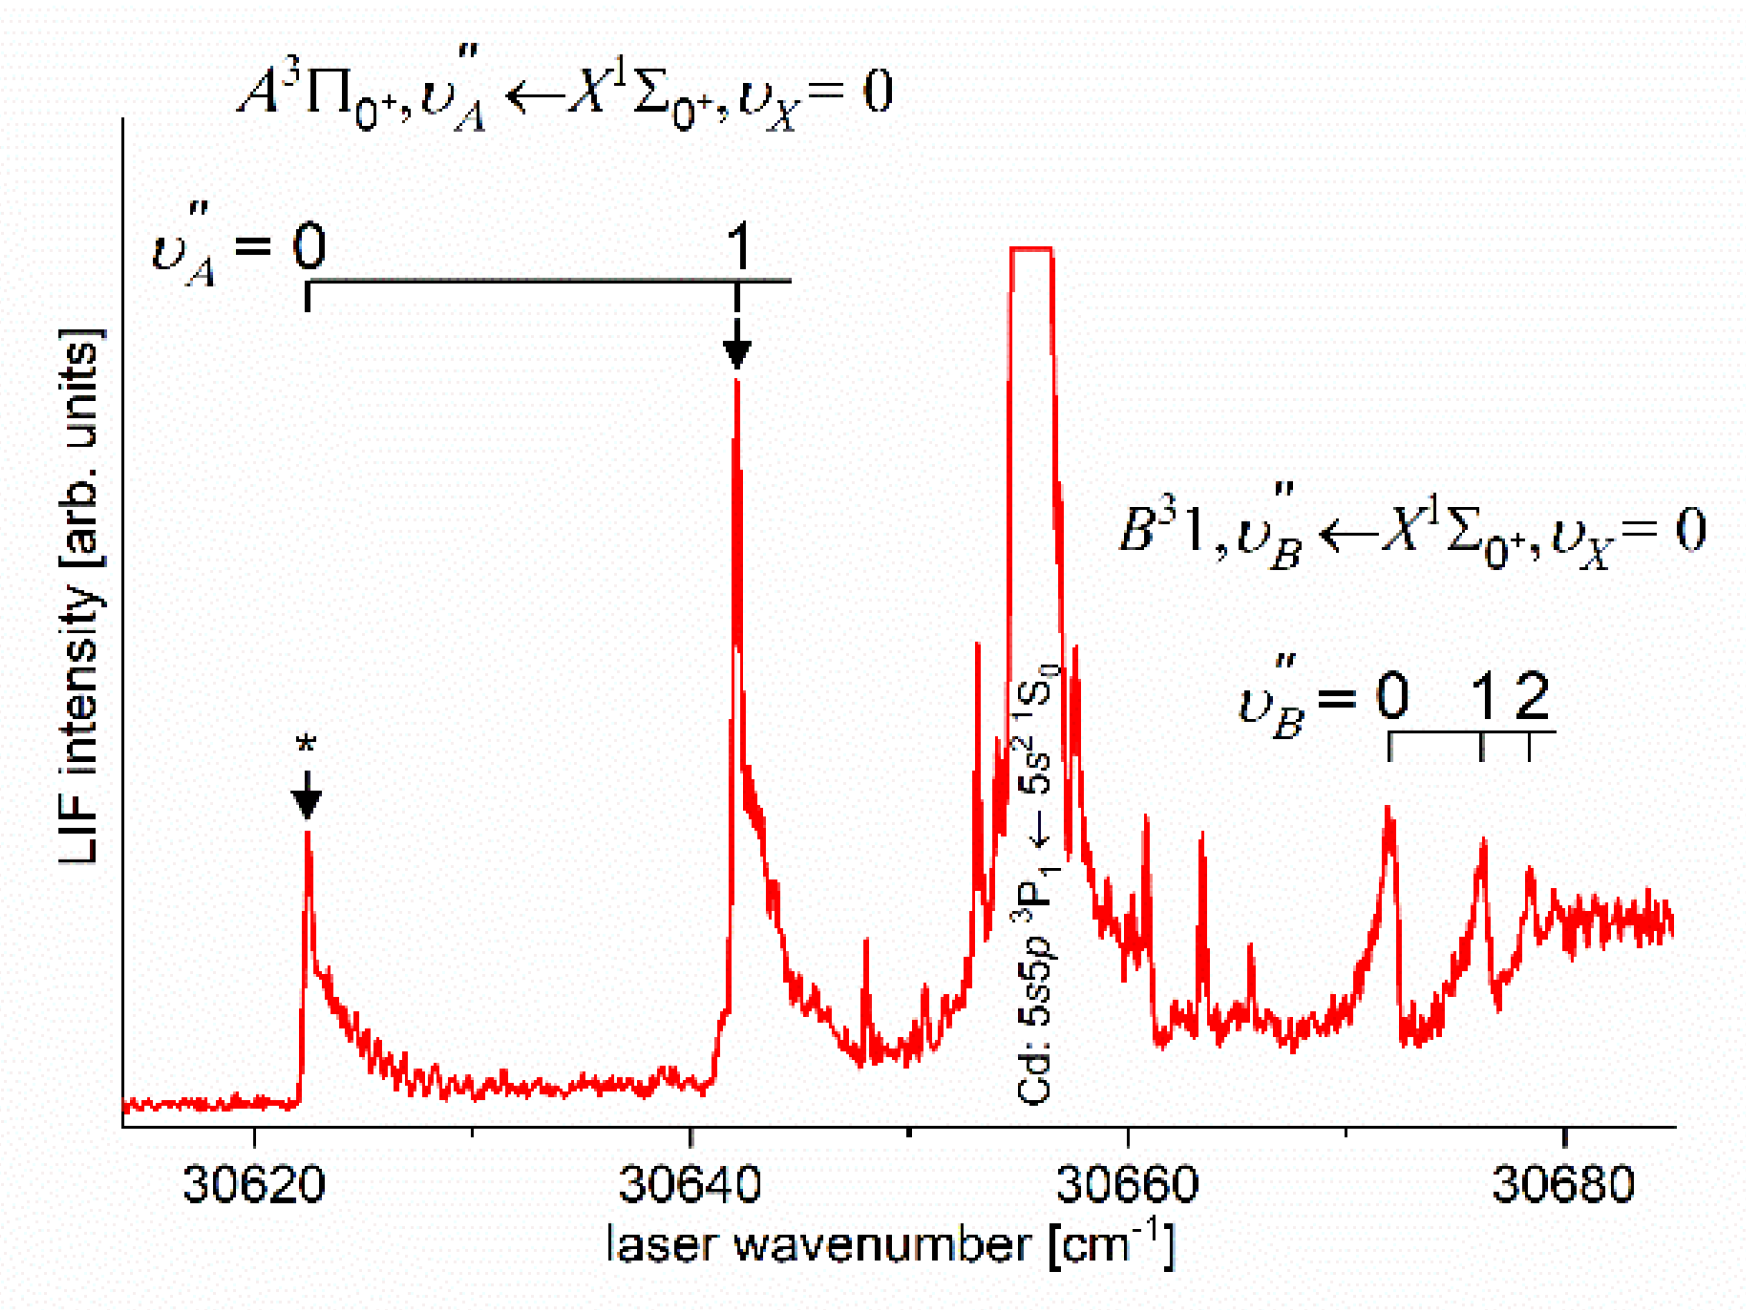
As the first step in OODR process, the
vibrational transitions were used. The corresponding low-resolution LIF excitation spectrum is shown in
Figure 7 [
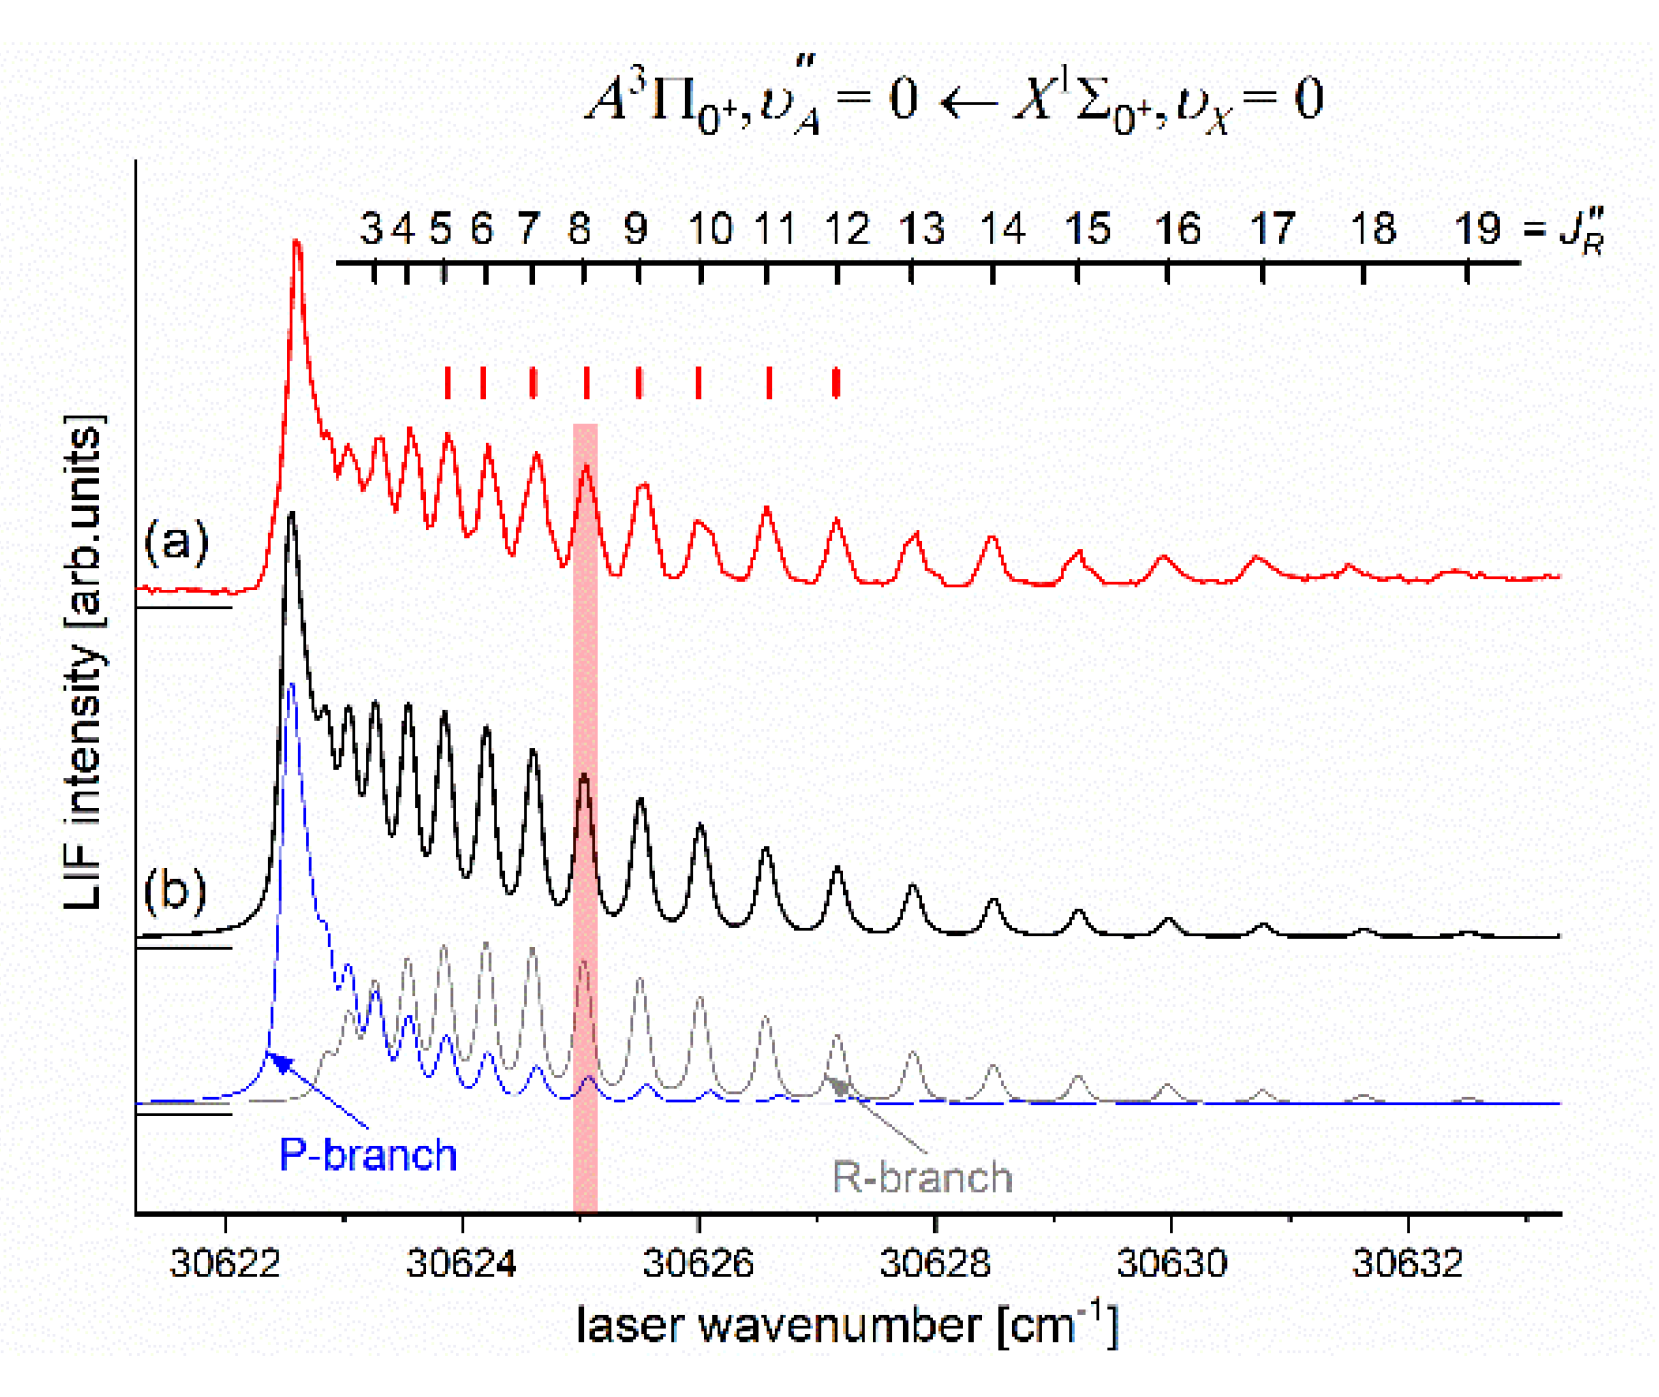
204], whereas profile of the
transition is shown in
Figure 8. It reveals partly resolved rotational structure that, after simulation, was interpreted as pronounced transitions of R-branch
and condensed transitions of P-branch
which constitutes the band head and partly overlaps R-branch for low
12). Energy separations of R-branch transitions were large enough to selectively chose one rotational transition to the
state with
(FWHM) spectrally broad laser. The excited rotational level in the intermediate state was applied to excite molecules using the
second step OODR transition.
Figure 7.
LIF excitation spectrum recorded using the
and
transitions in CdNe as reported in Ref. [
204], the former being first step of the excitation in OODR process:
that allowed to investigate the
- state potential and, partly, potential barrier. Arrows shows the
that was used as origin for the second transition in OODR. Asterisk depicts vibrational band recorded in higher resolution and shown in
Figure 8.
Figure 8.
(a) LIF excitation spectrum showing profile of the vibrational component recorded using the
first OODR transition in CdNe. (b) Simulation performed using LEVEL [
206] and PGOPHER [
207] programs allowed to determine the
- assignment shown above the spectrum which reveals partly resolved structure of the R-branch (P-branch is also shown). In the simulation
(rotational temperature) and
were assumed (Lorentzian and Gaussian broadenings responsible for laser bandwidth and transversal divergence of molecular beam, respectively) as well as Morse representations of the
and
- state potentials from Ref. [
204]. Positions of
levels used as the intermediates in OODR process (red ticks, compare with
Figure 9) and
vertical bar representing laser bandwidth are depicted.
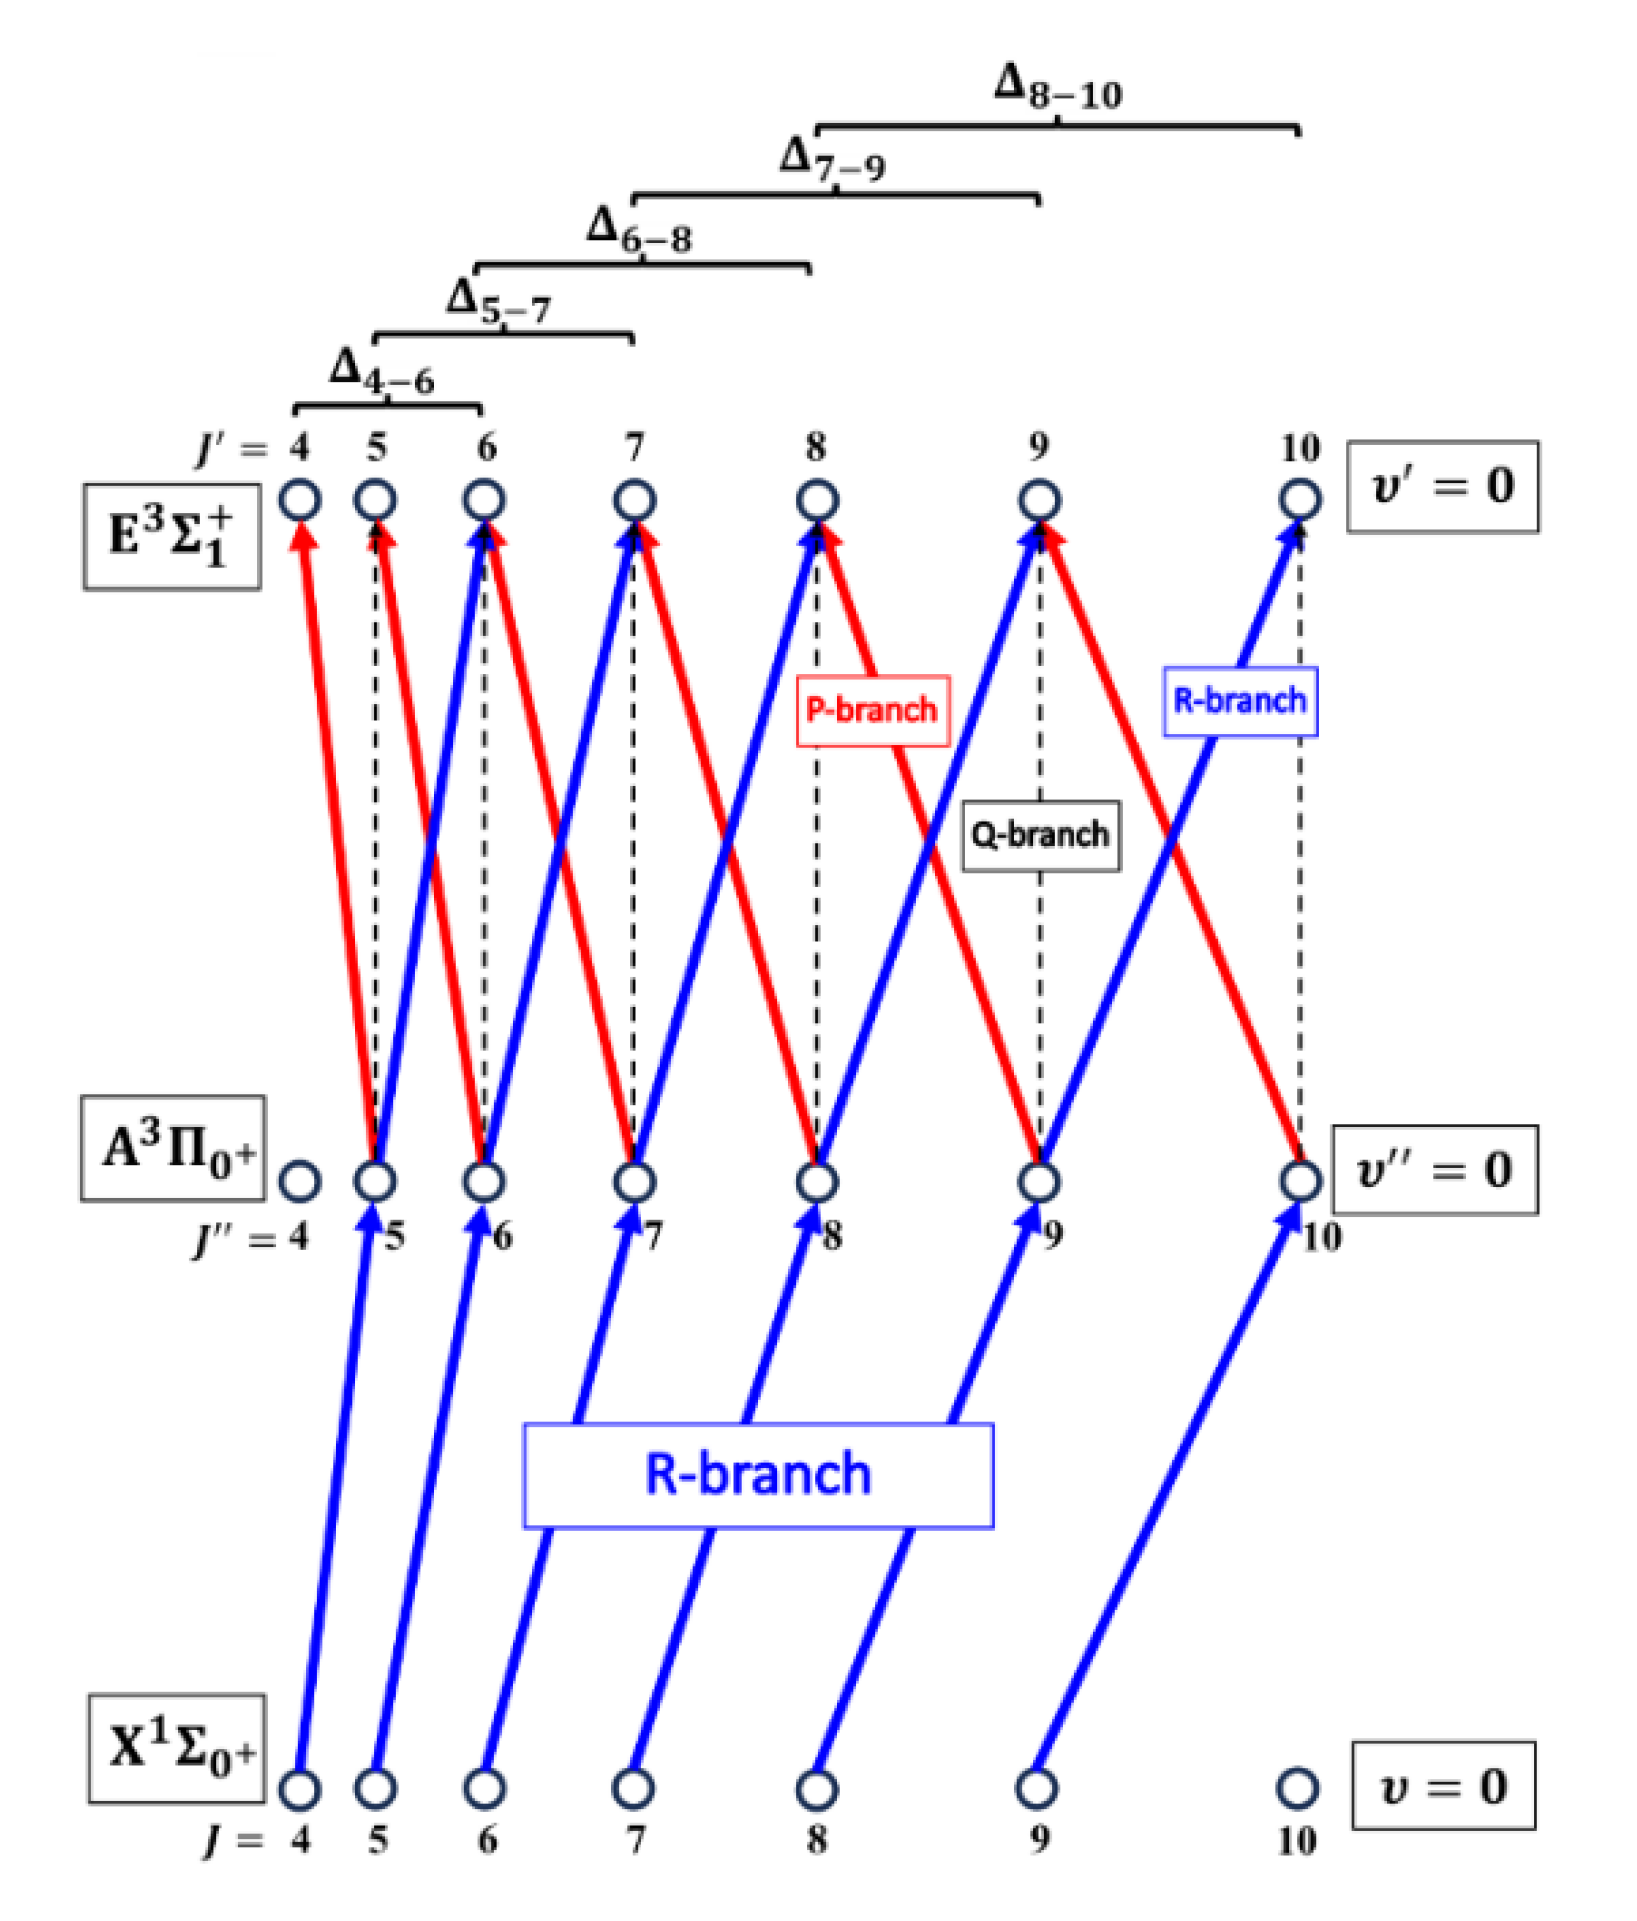
The rotational transitions that were involved in OODR process are schematically shown in
Figure 9. After each R-branch transition in the
first excitation, three P-, Q- and R-branch
,
and
transitions, respectively, were possible in the
second excitation.
Figure 9.
Branches of rotational transitions involved in the realization of the selective excitation in OODR experiment performed in CdNe using the transitions path. Details in text.
Figure 9.
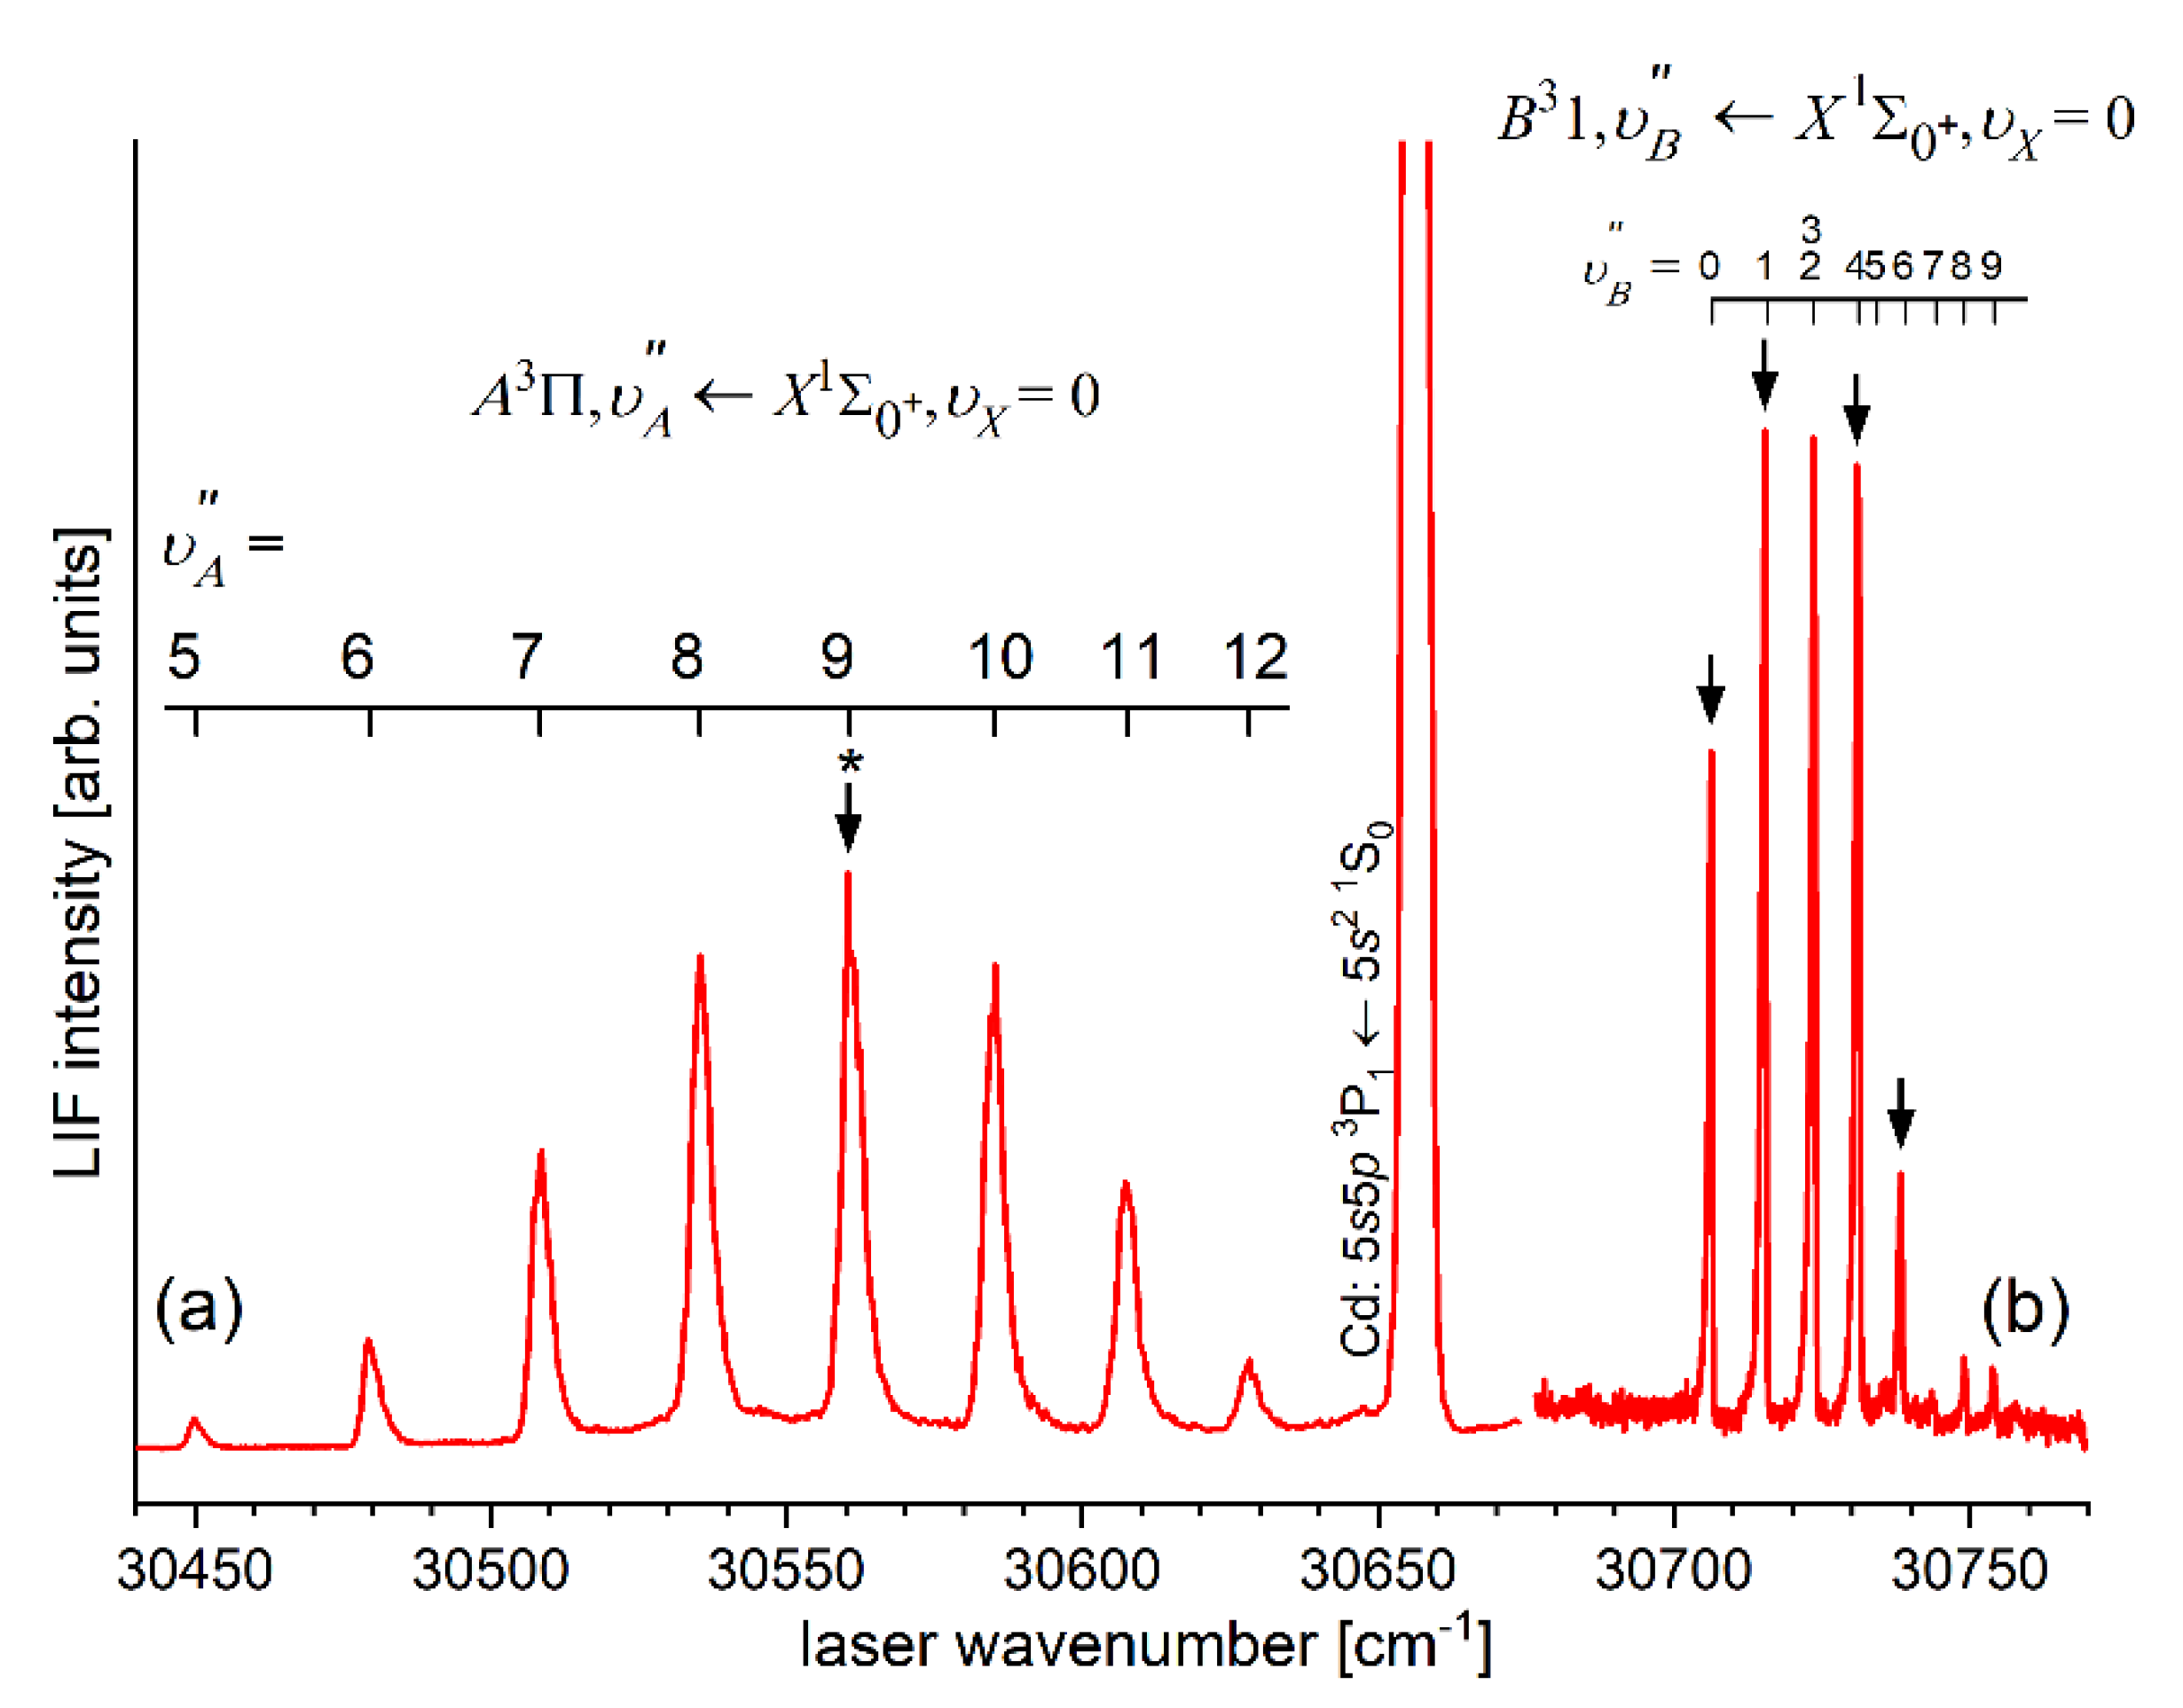
Branches of rotational transitions involved in the realization of the selective excitation in OODR experiment performed in CdNe using the transitions path. Details in text.
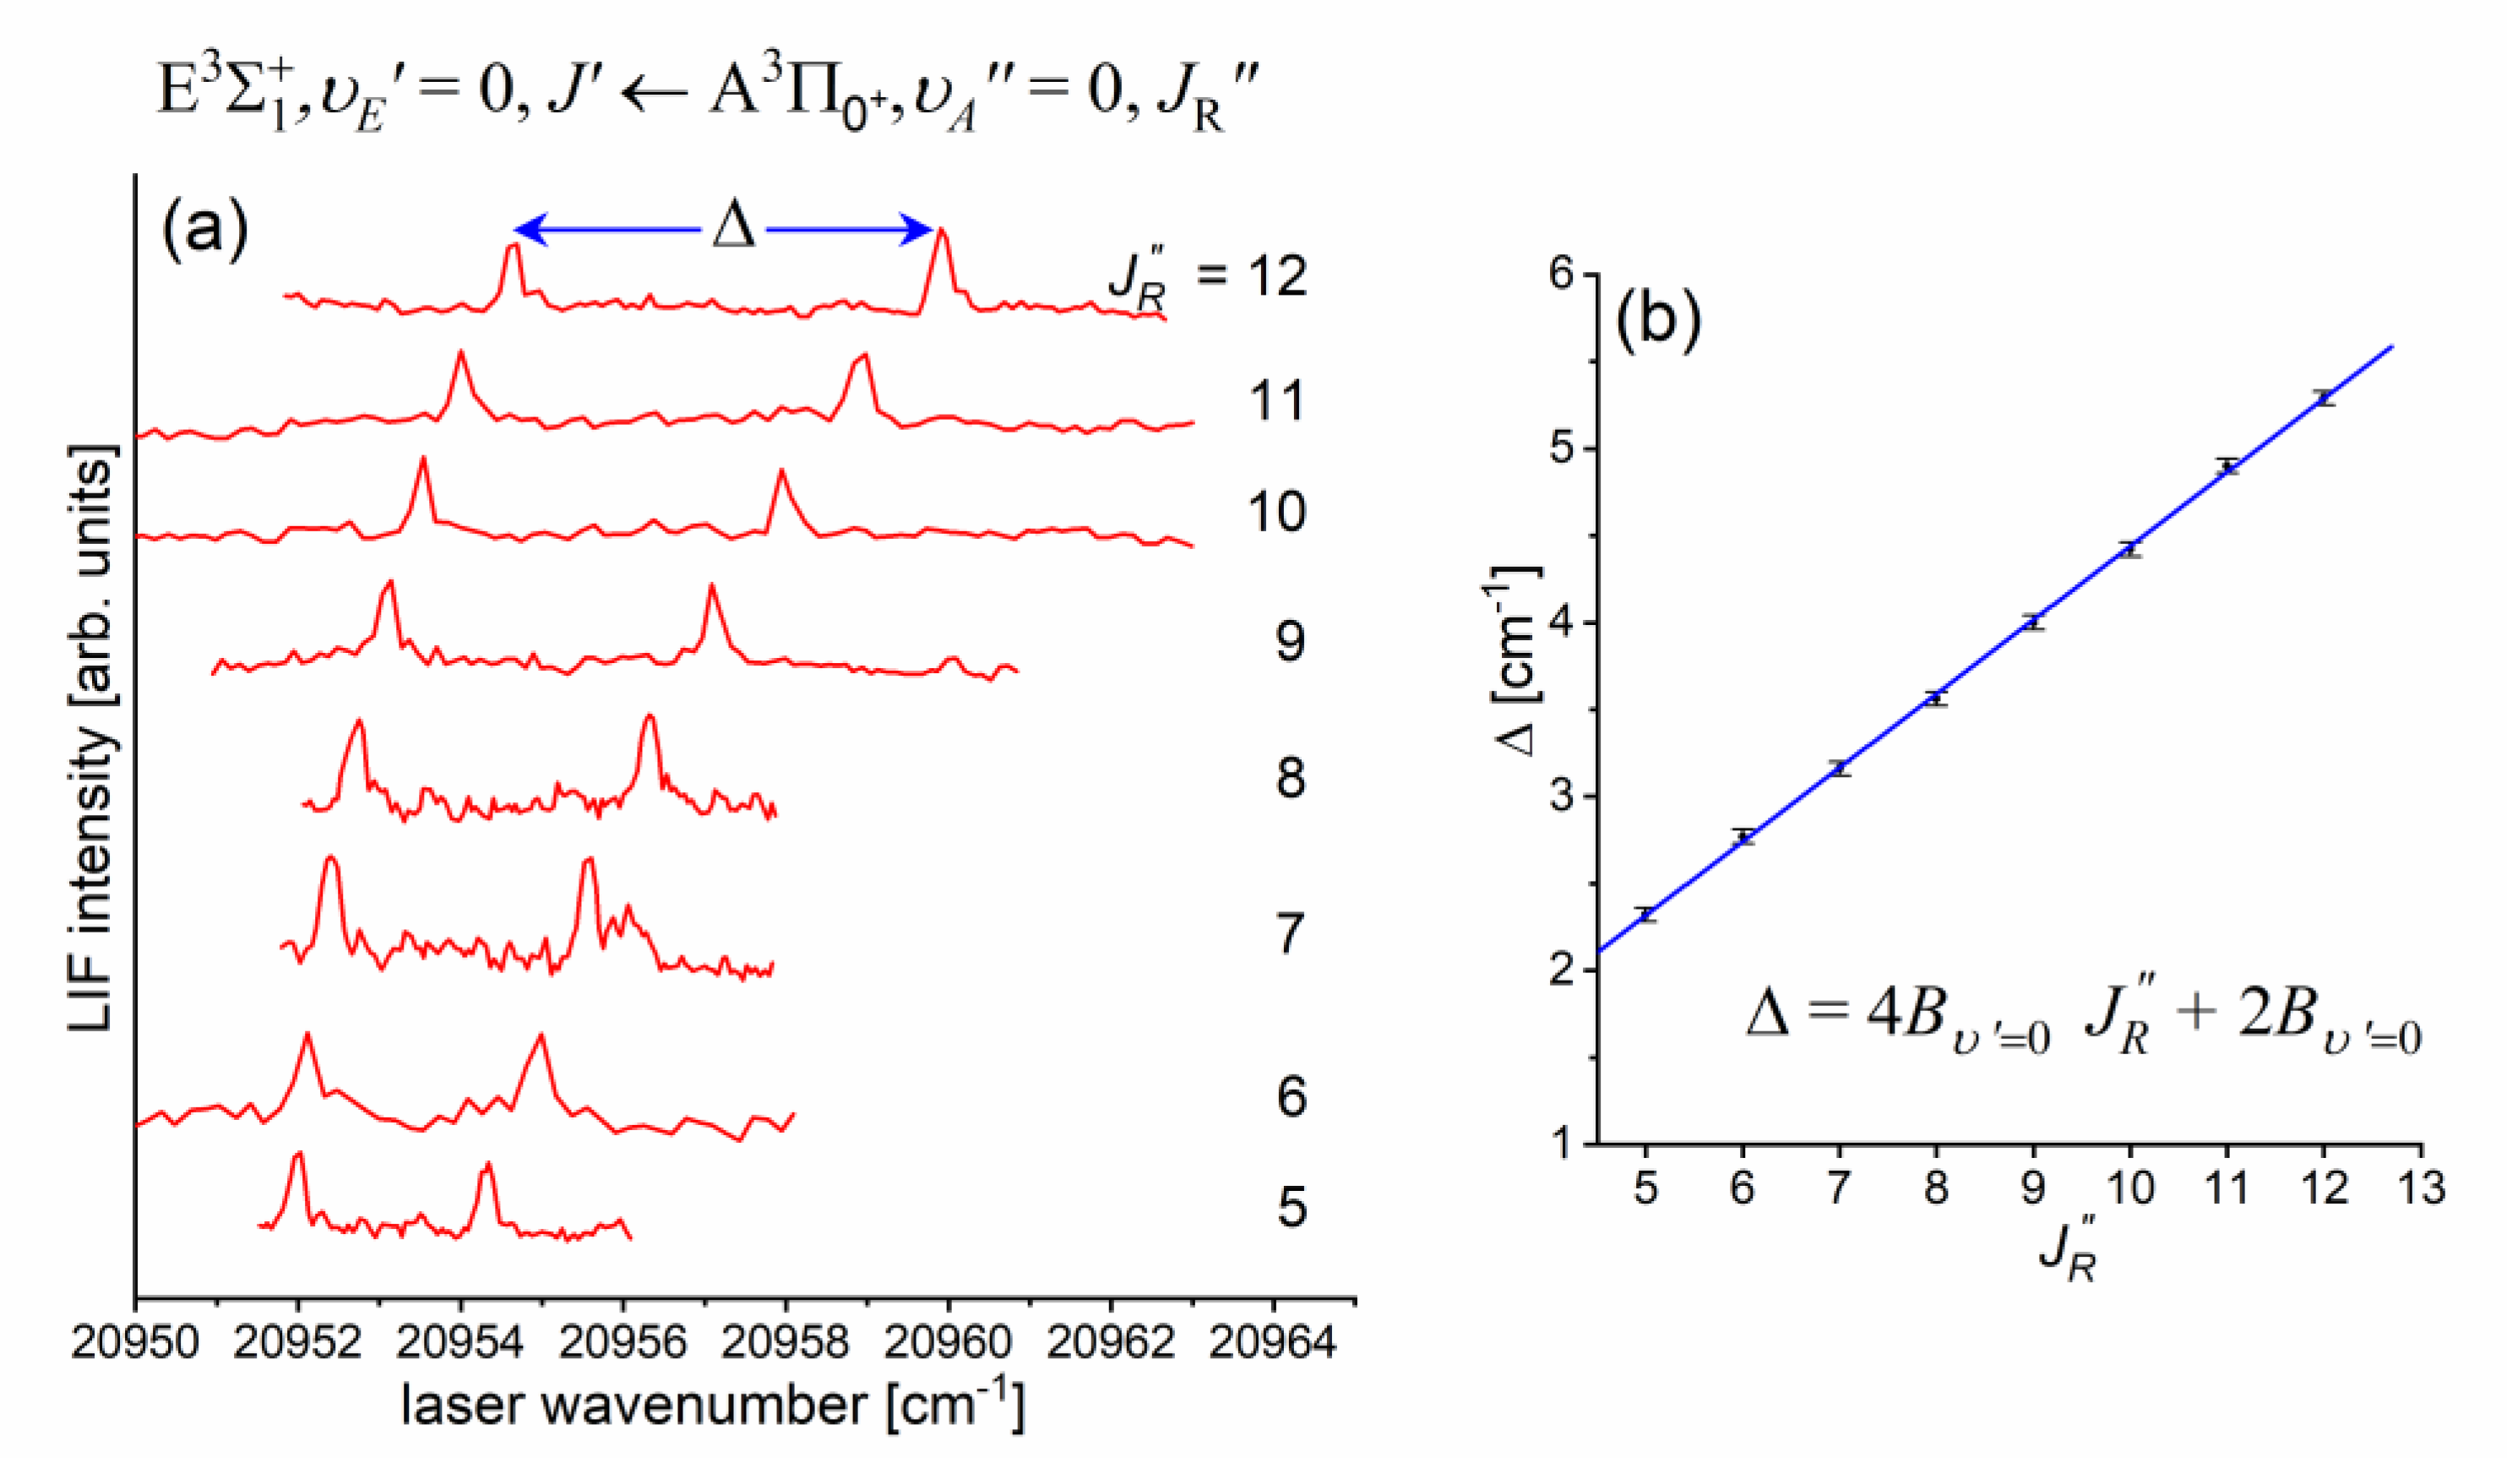
Figure 10(a) presents result of the experiment. LIF excitation spectra were recorded using the
second OODR transition after
were selected in the
first OODR transition as shown in
Figure 8. The
increase linearly with
- see
Figure 10(b) - the observed
dependency allowed to directly determine the
rotational constant. Similar experiment was performed for the
second OODR excitation resulting in determination of the
. The results are collected in
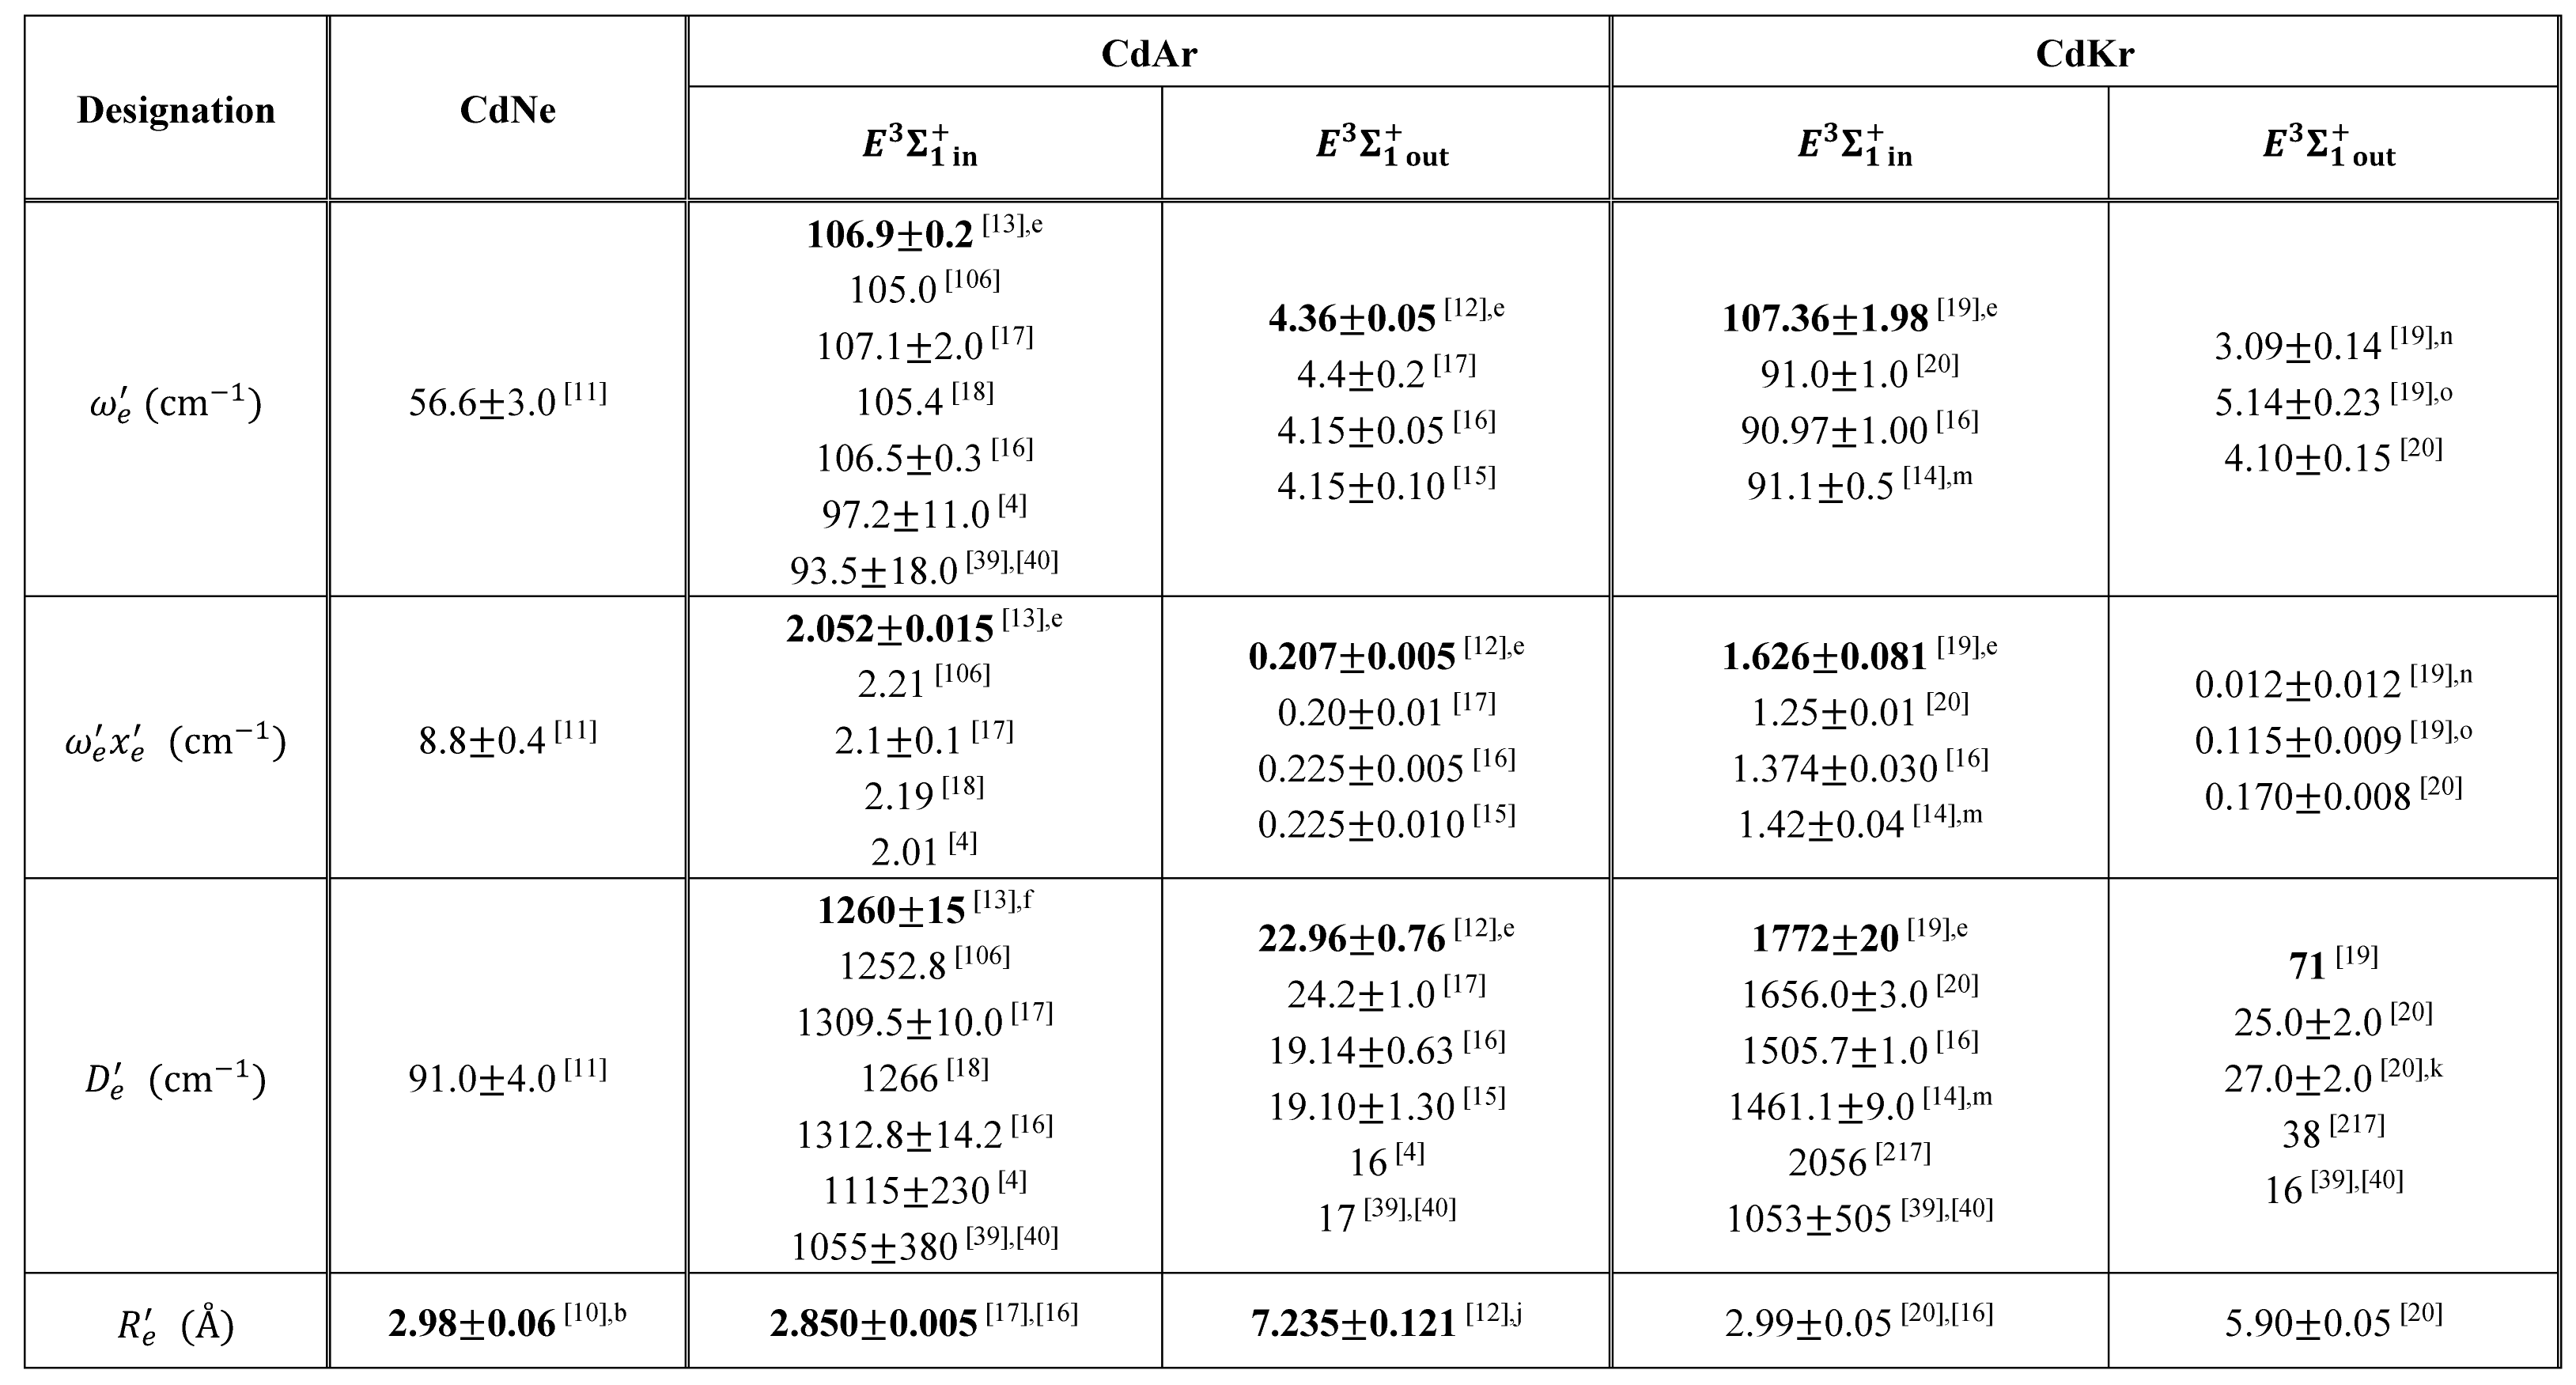
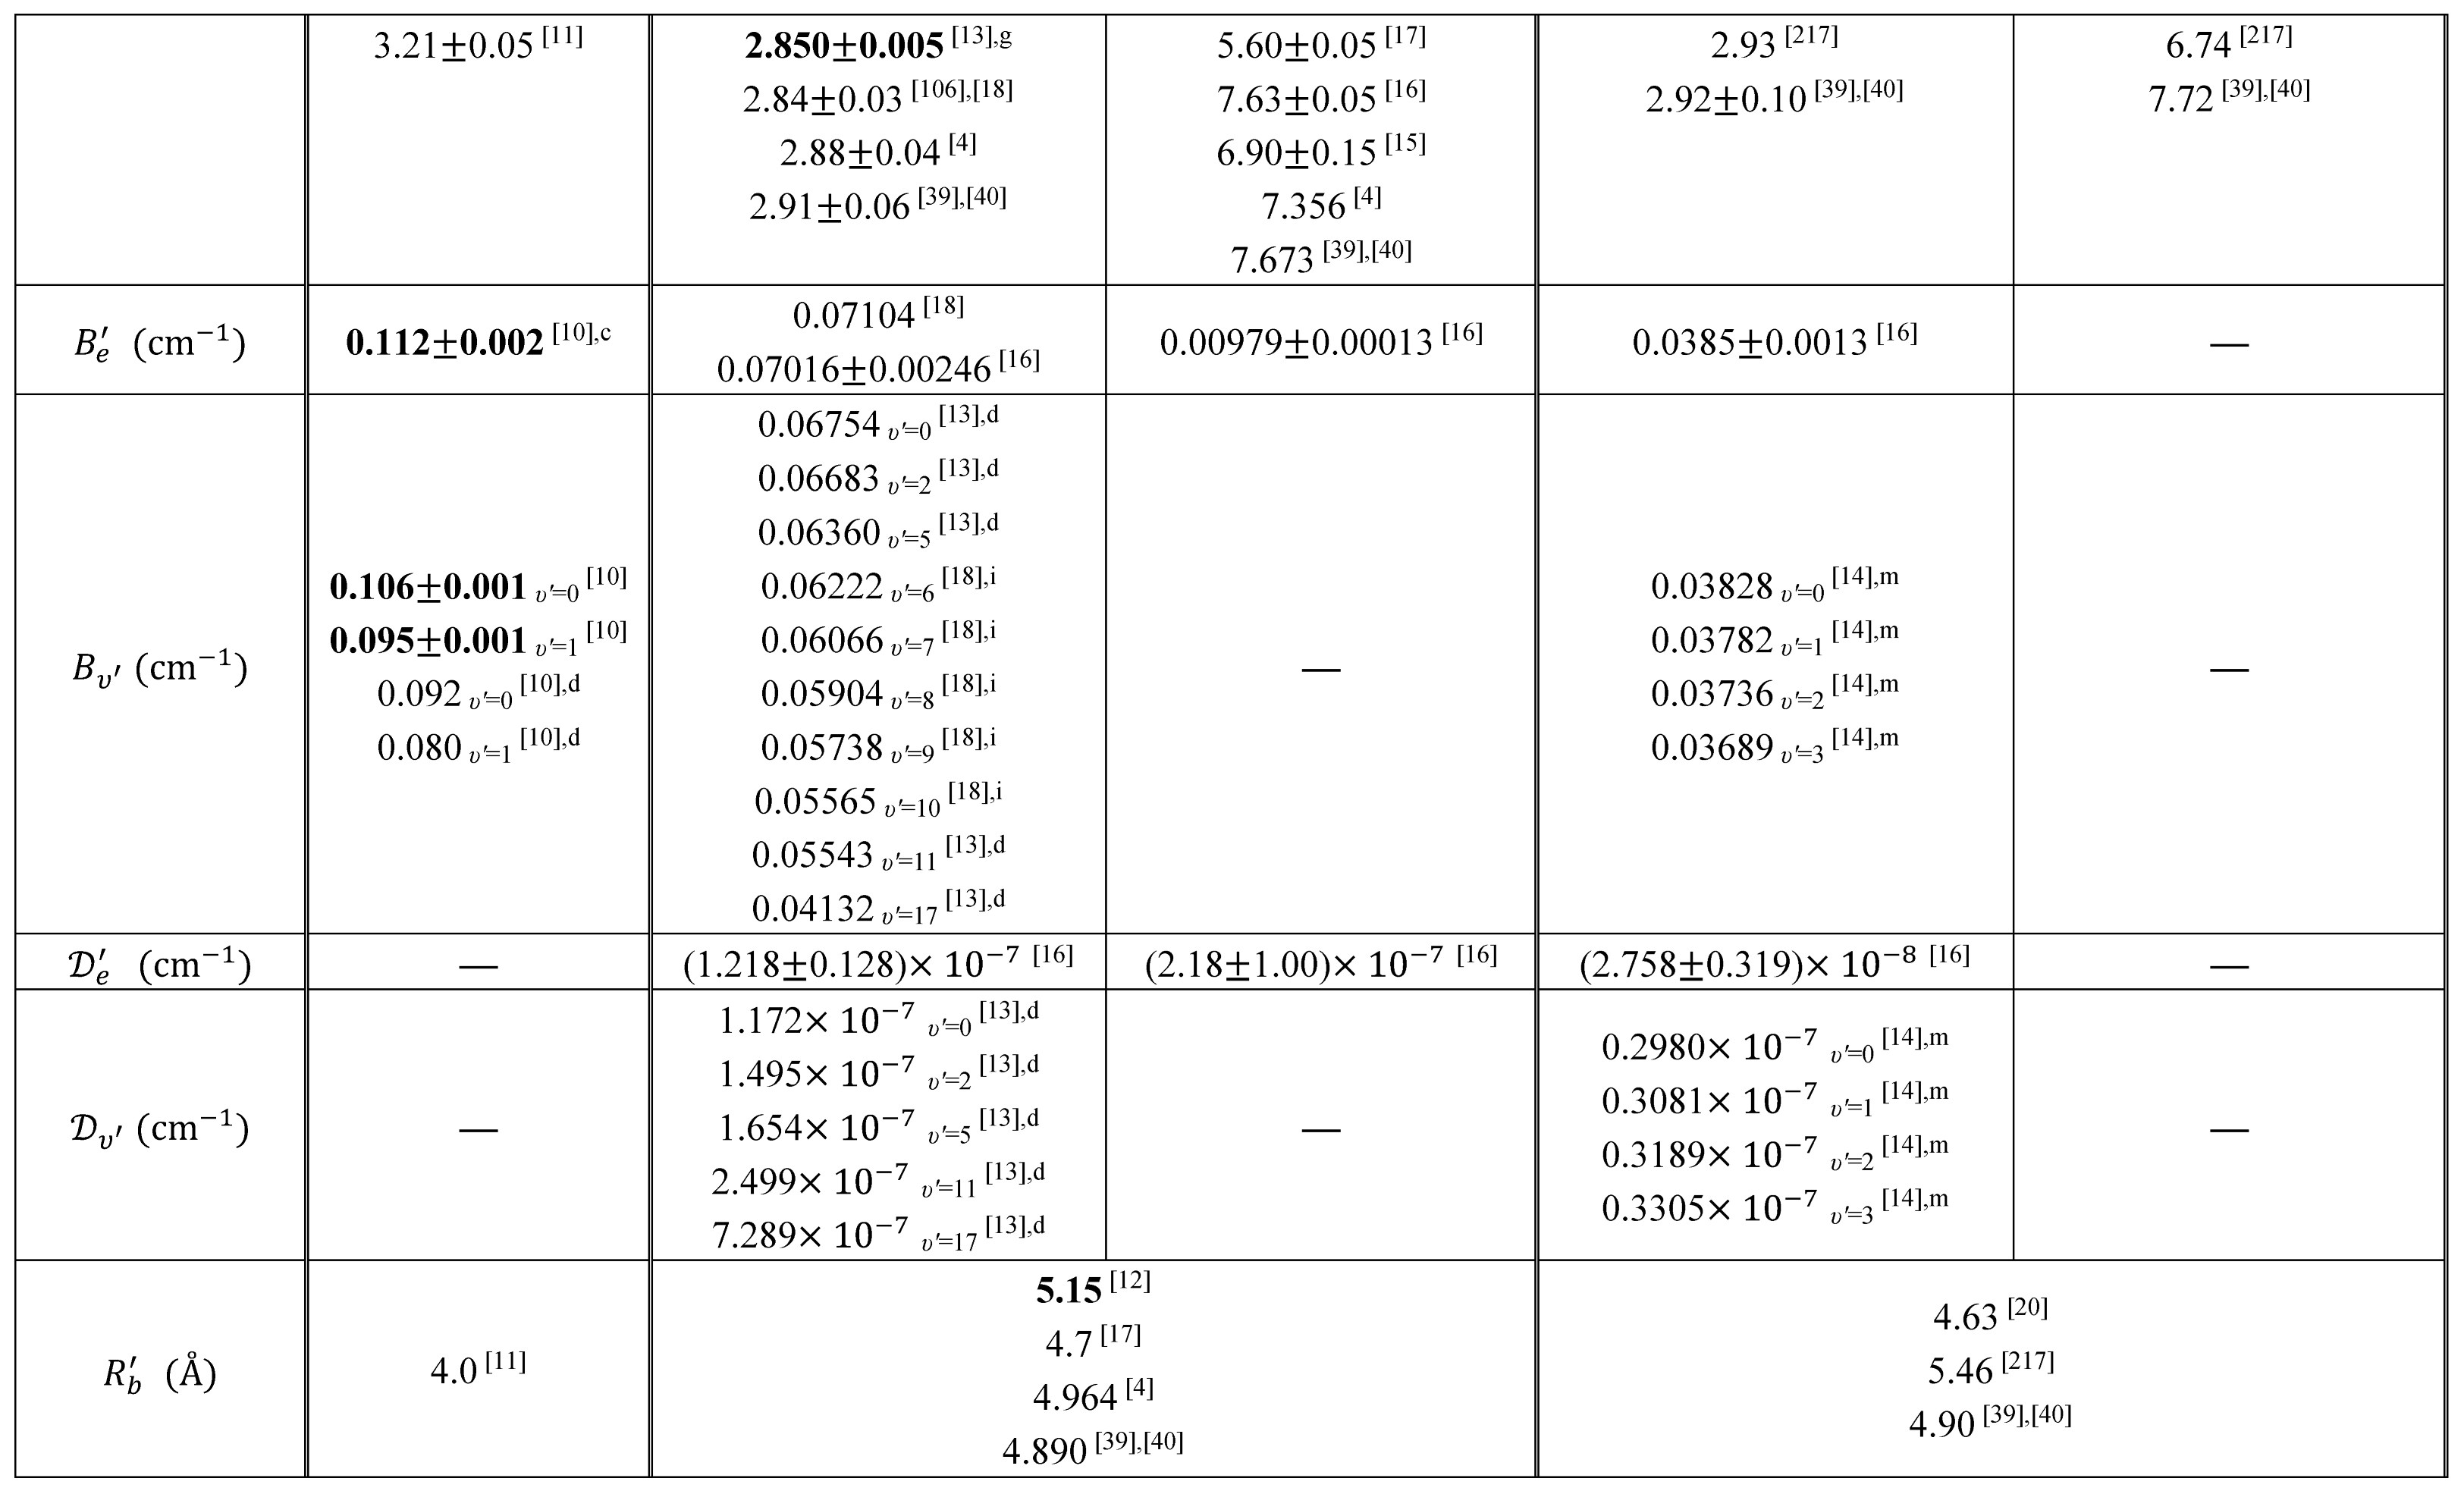
Table 1.
Several essential remarks have to be stated here. Firstly, in the experiment the isotopic structure has not been resolved as vibrational quantum numbers
and
involved in the transitions are small. Secondly, the
transition occurs for
, so according to the selection rules the spectra should contain Q-branch as well. According to Okunishi and coworkers, however, who investigated analogous transition in HgNe [
21], the intensity of Q-branch band-head can be significantly lower with respect to that of P- branch.
Figure 10.
(a) LIF excitation spectra recorded using the
second OODR transition in CdNe, for
selected in the
first OODR transition (see also
Figure 9). (b) Separations
between energies of rotational transition recorded for
and
branches. Linear regression allowed to determine
rotational constant.
Figure 10.
(a) LIF excitation spectra recorded using the
second OODR transition in CdNe, for
selected in the
first OODR transition (see also
Figure 9). (b) Separations
between energies of rotational transition recorded for
and
branches. Linear regression allowed to determine
rotational constant.
Rotational constant
at the equilibrium internuclear distance
is related to
according to the relation
, where
is a constant. Having experimentally determined
and
it is straightforward to calculate
without knowing
and then, using relationship
, where
,
and
are Planck constant, speed of light and reduced mass of CdNe, directly derive the
(see
Table 1).
It is interesting to examine partly rotationally resolved profiles of vibrational bands recorded in LIF excitation spectra of the
second-step OODR transitions when the second excitation was not performed as in
Figure 8, with selection of particular
, but with first-step laser frequency set at the band-head where components of P-branch are very dense.
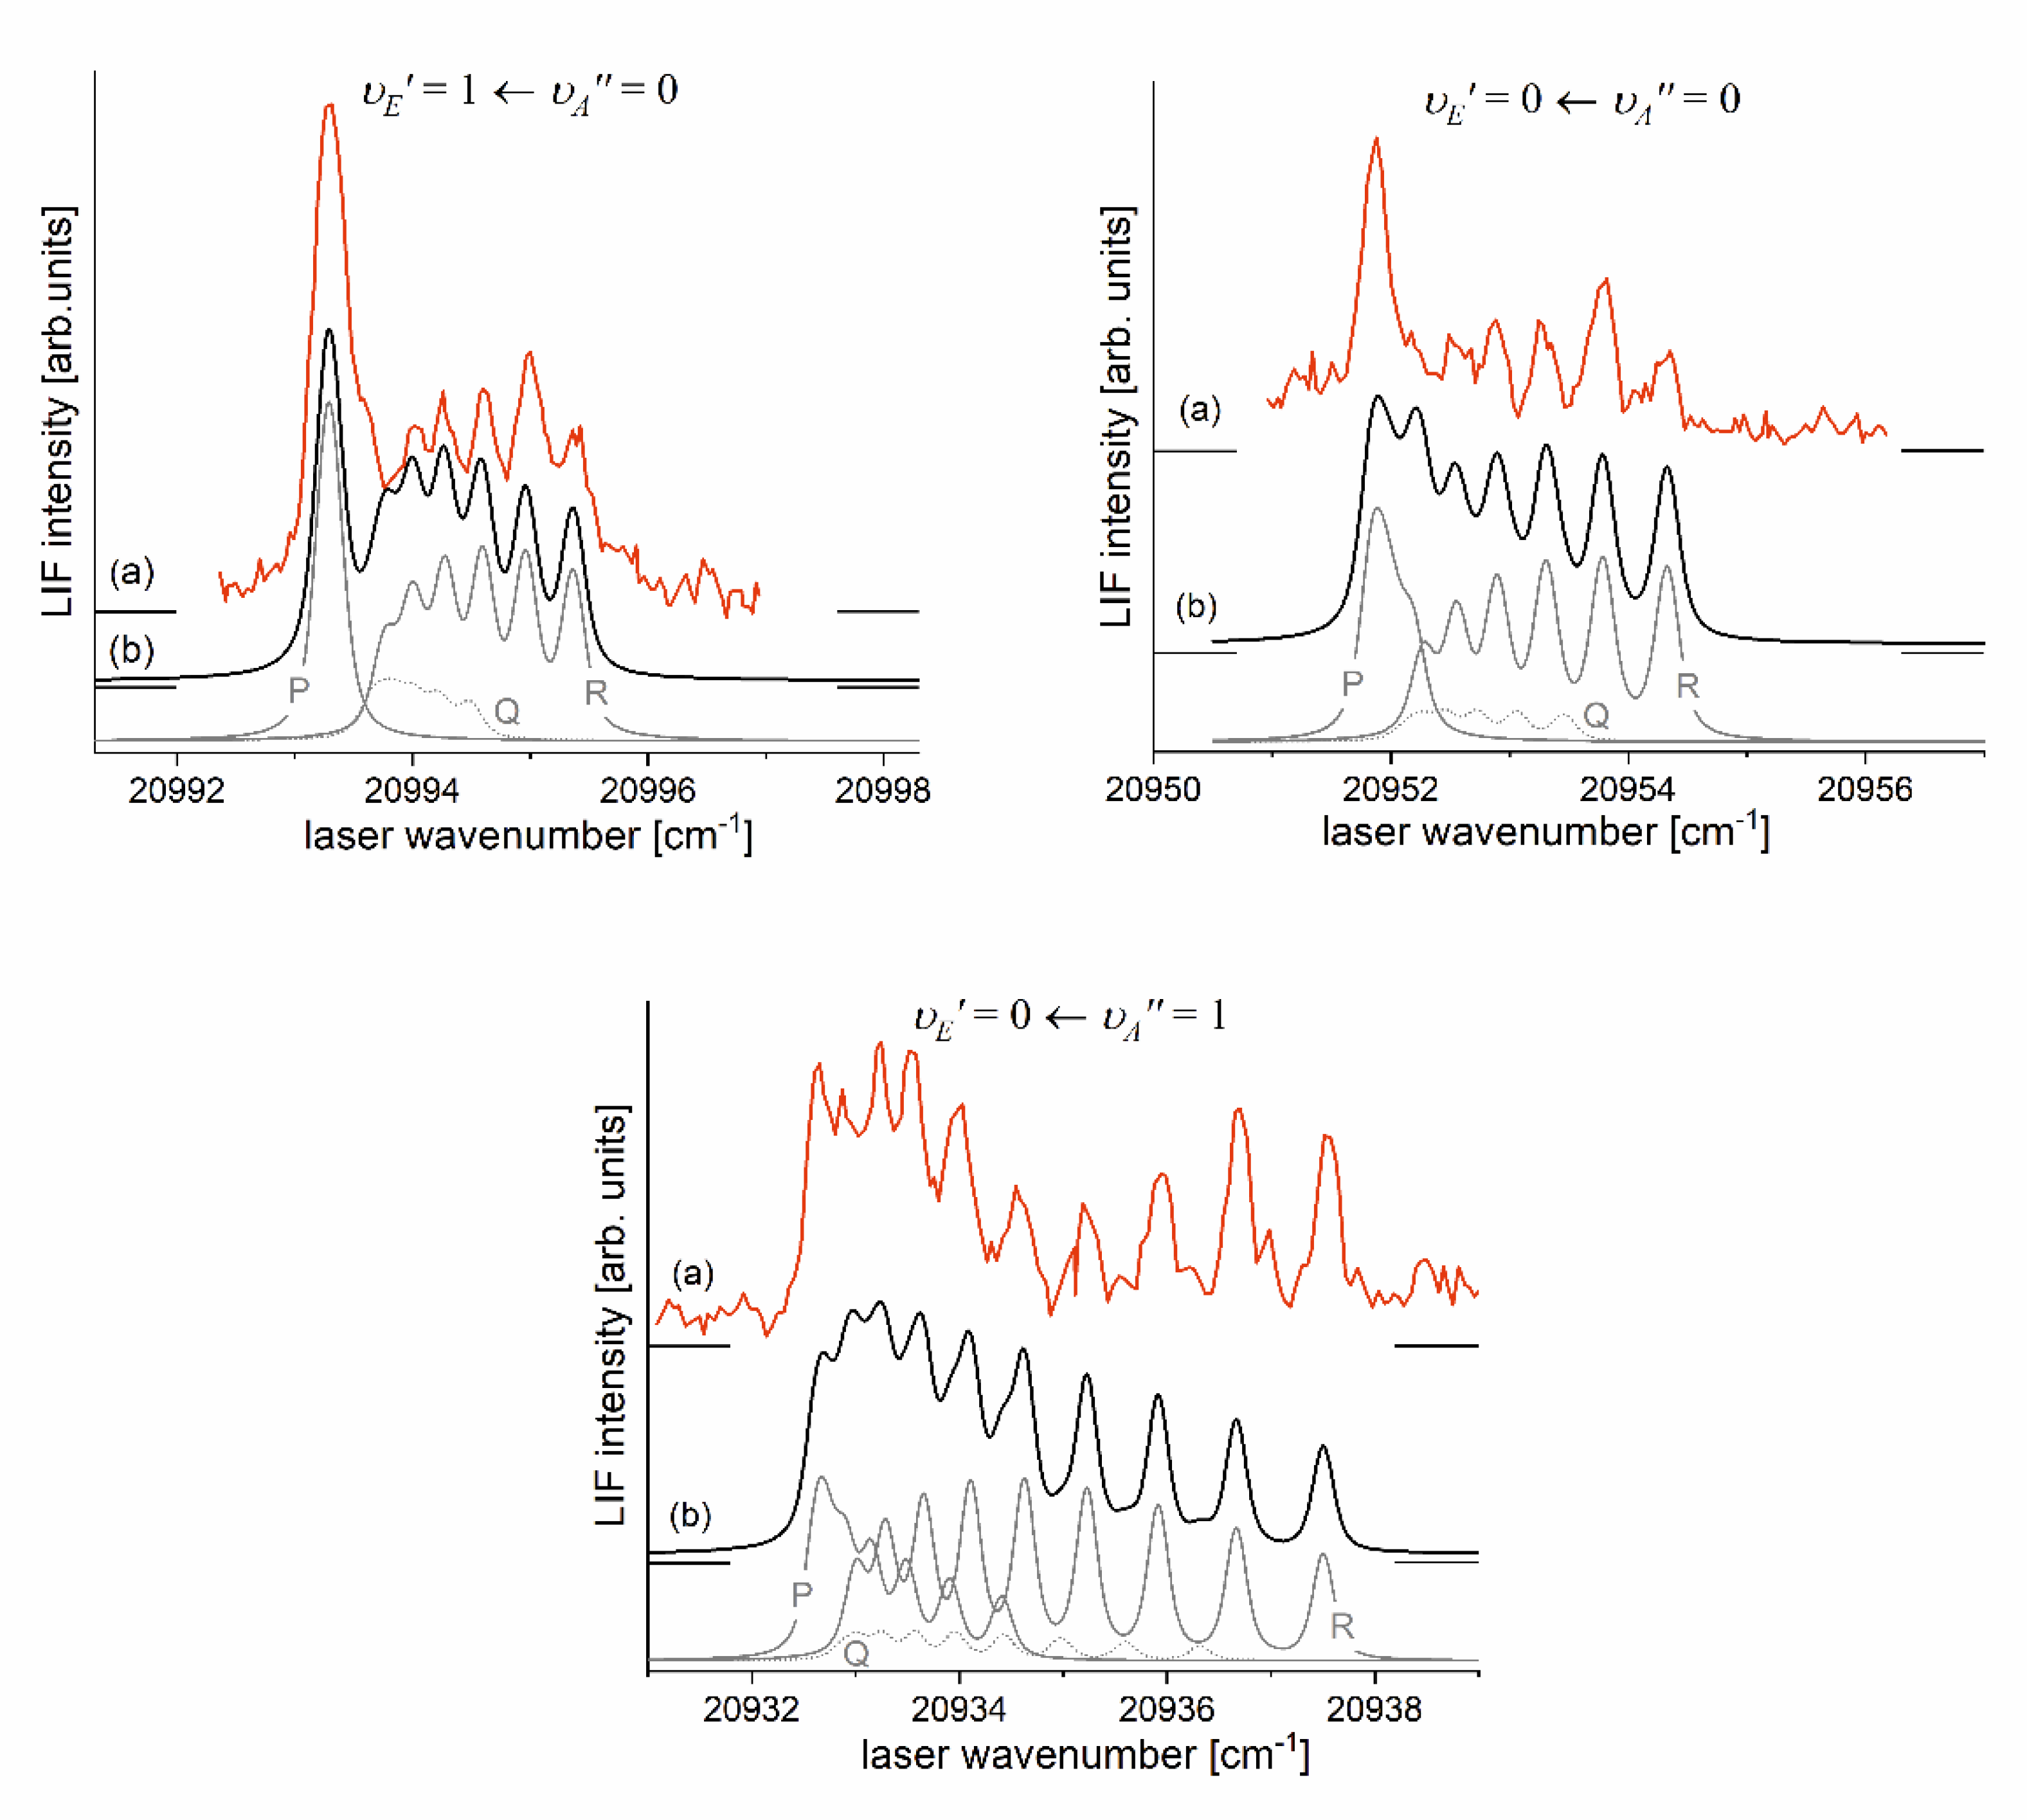
Figure 11 present profiles of the
,
and
transitions and their simulations [
206], [
207] in which rotational constants derived in the above-described analysis were used. Alee simulations show satisfactory agreement with experimental profiles which confirms the correctness of the adopted experimental procedure and interpretation of the obtained results.
Figure 11.
(a) Partly rotationally resolved profiles of vibrational bands recorded in LIF excitation spectra of the
second-step OODR transitions in CdNe. (b) Simulations performed using LEVEL [
206] and PGOPHER [
207] programs: P-, Q-, and R-branches are shown. Intensity of Q-branch is damped as concluded in Ref. [
10]. All simulations performed with assumption:
,
,
depending on the transition and the isotopic shift between included in the simulation CdNe isotopologues (abundances >3%) as approximately one order of magnitude smaller than their rotational structure.
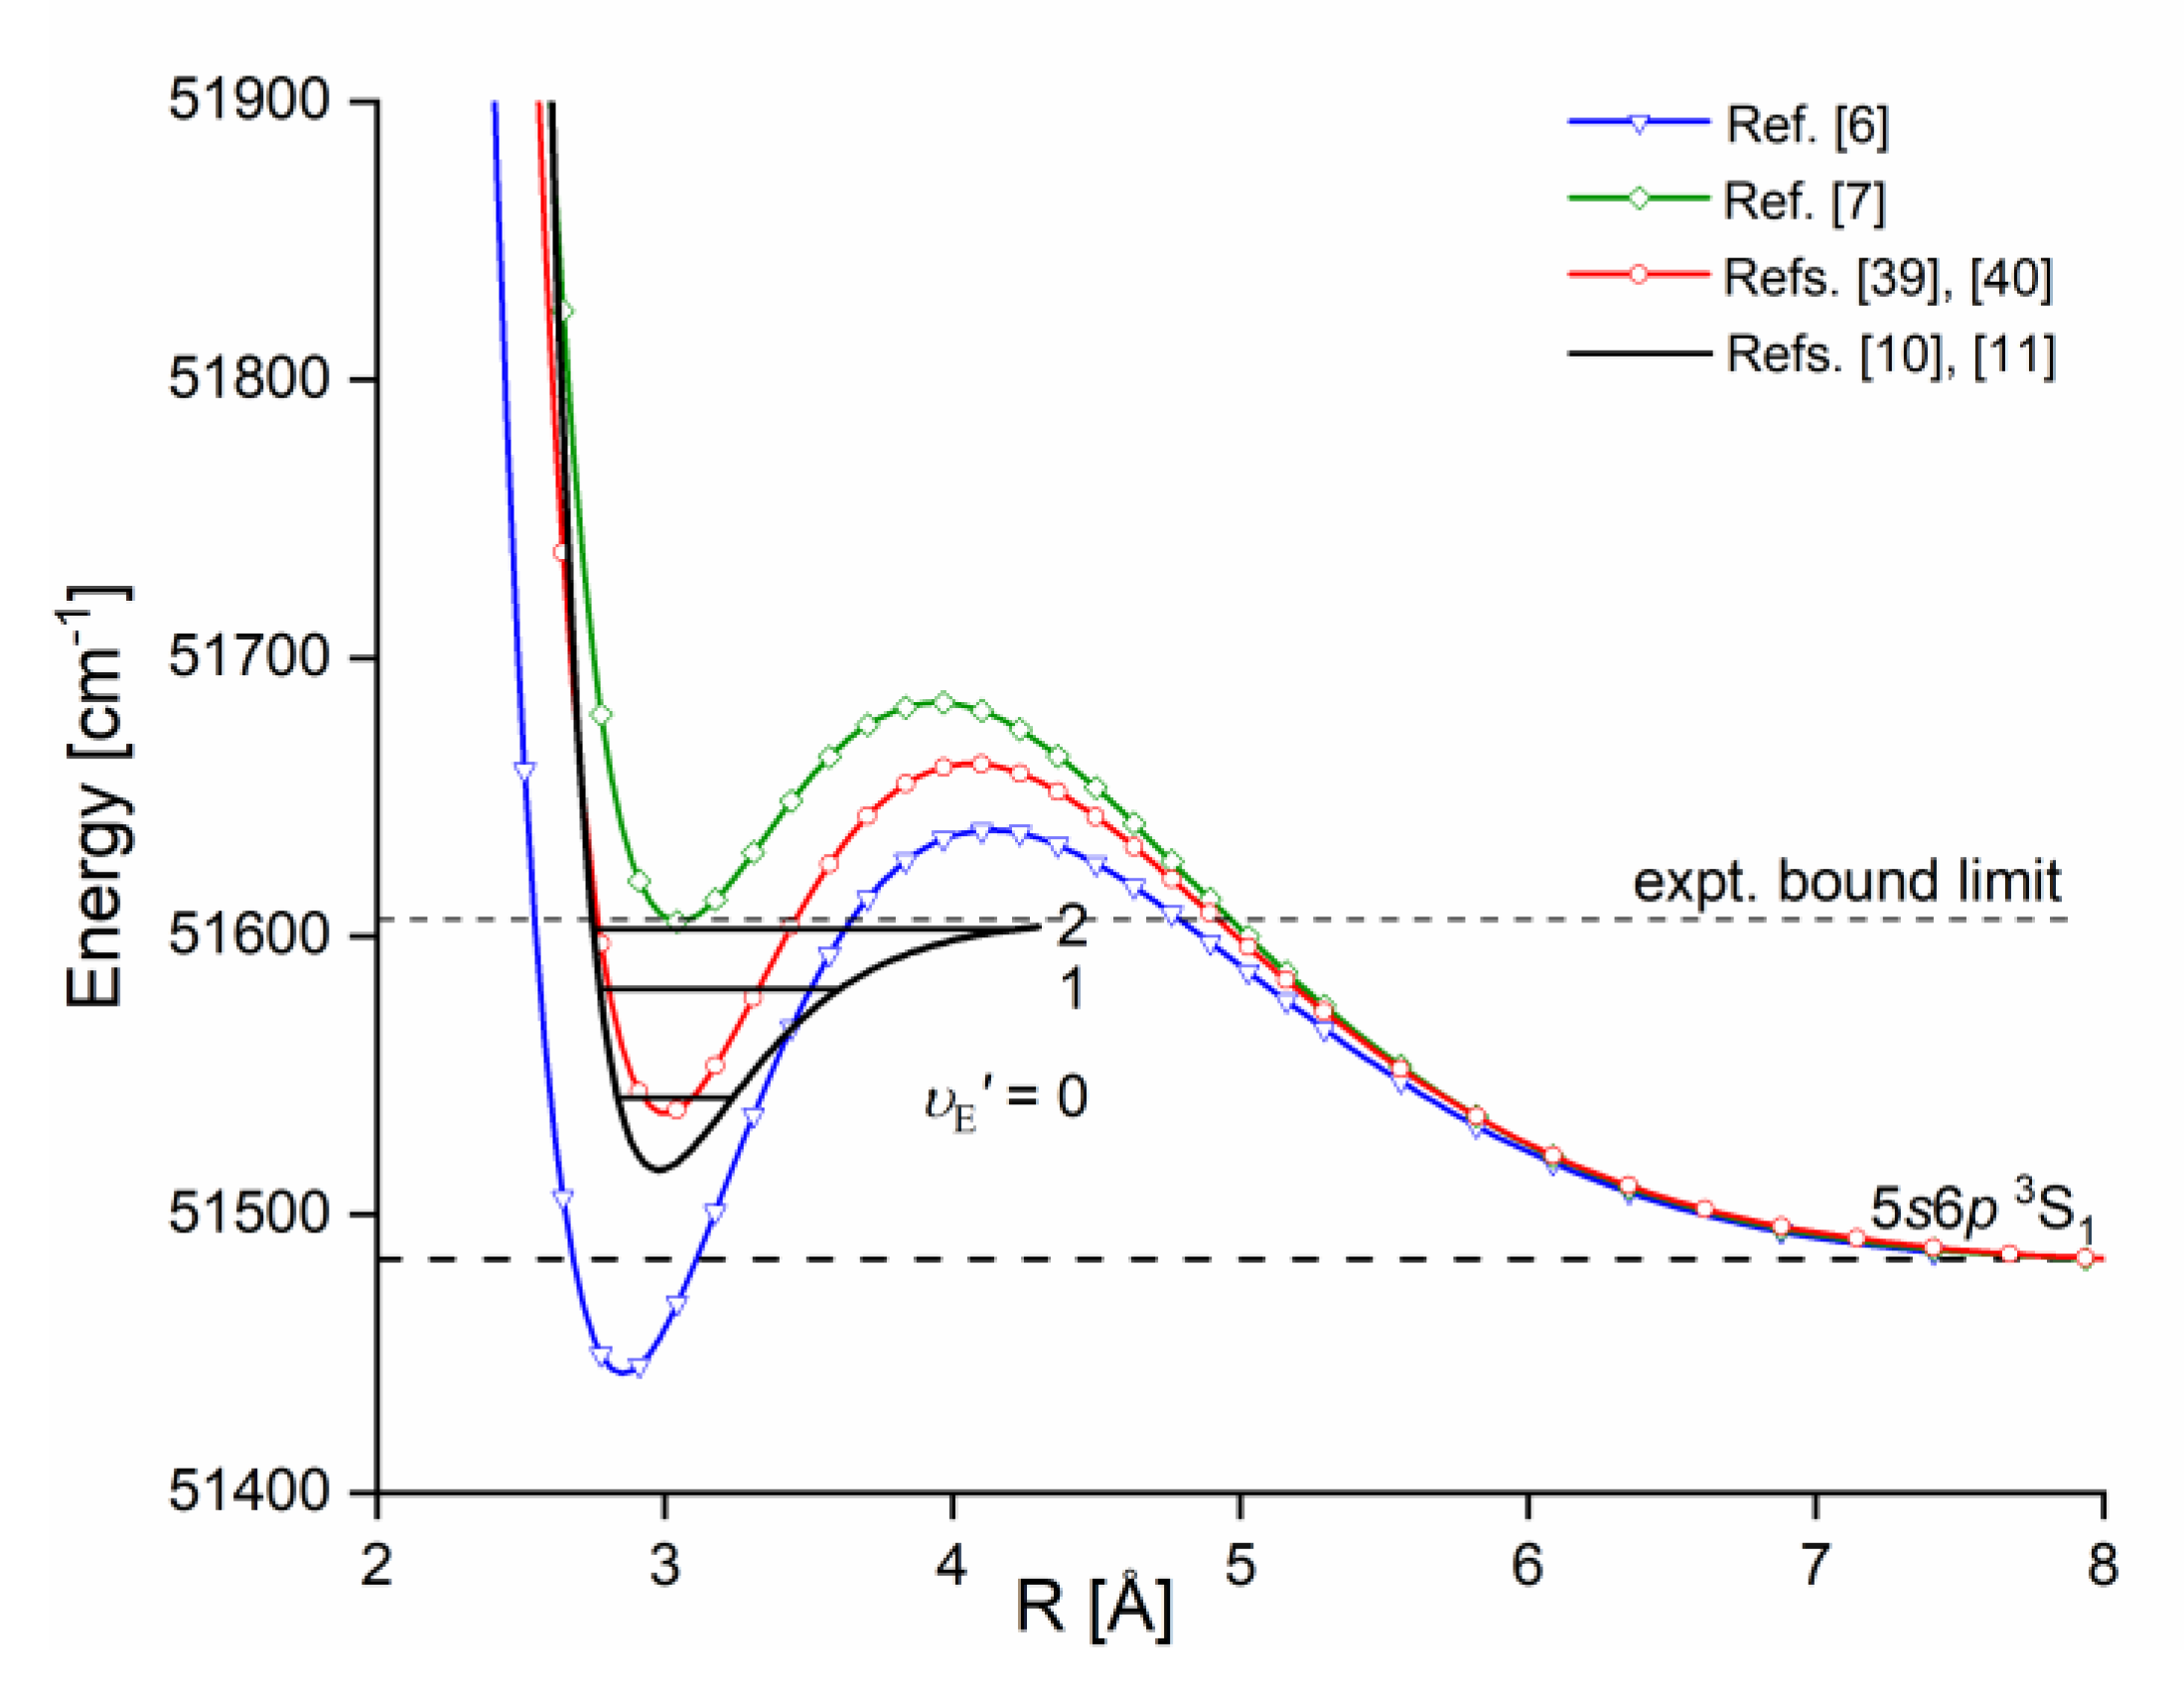
The
Rydberg state potential well in CdNe accommodates three vibrational levels
, as concluded from experiment and its Morse representation, two of them were rotationally investigated providing position of the potential well in
Rs [
10] (see
Figure 12). Height of the barrier estimated from experimentally acquired data [
11] should not exceed 132
above the Cd
asymptote. Additionally, having determined earlier the
well depth [
11], the obtained
- state PEC could be confronted with results of
ab initio calculations [
6], [
7], [
39] and [
40]. From the comparison shown in
Figure 12 may be seen that as far as the
(from the bottom of the well to the top of the potential barrier) and the
bond length of the
- state potential are concerned, the closest to the experimental values (
,
)
13) are that from
ab initio result of Czuchaj et al. [
7] (
,
). However,
ab initio result of Krośnicki and collaborators [
39], [
40] in the closest way reproduces position of the experimentally determined potential above the Cd asymptote. General conclusion may be expressed stating that for this relatively light CdNe molecule experiment-to-
ab-initio-result comparison is moderately satisfactory and Morse potential derived from the experiment and detection of bound🠐bound trandistions does not depart from available
ab-initio calculated PECs.
Figure 12.
The
Rydberg state potential well of CdNe determined experimentally [
10], [
11] (black solid line) represented with a Morse function compared with results of
ab initio calculations: Czuchaj and Stoll [
6] (blue: empty triangles and line), Czuchaj et al. [
7] (green: empty squares and line) and Krośnicki and collaborators [
39], [
40] (red: empty circles and line). Positions of
levels supported by the potential well are depicted:
,
as observed in the experiment. Energy limit beyond which no bound
bound transitions were observed is depicted.
5.2. Advances in the
- StateCharacterization in CdAr
5.2.1. Improved Determination of the
- State Inner-Well Potential
By 2018, the inner well of the
Rydberg state potential (
) of CdAr molecule (see
Figure 4) has been investigated as a whole twice, in 1992 [
106], and in 2003 [
17]. In both studies, pronounced
vibrational progression has been recorded using the
second OODR transition. The experiments allowed to characterize the inner well potential and representing it with a Morse function stating at the same time that the Morse representation is not adequate close to the dissociation limit [
106] or while approaching the potential barrier [
17] (note: in Ref. [
106] the potential barrier and outer well were not identified from experimental data).
Also, profiles of several
vibrational bands of the
[
18] and
[
16] transition were recorded in two experiments performed employing LV-OR and OODR methods, respectively. Bennet and Breckenridge reported high resolution spectra of
bands [
18] as well as
and respective
rotational constants. Urbańczyk et al. [
16] recorded partly isotopically resolved
bands, which allowed for, limited however, rotational characterization of the
- state inner potential well. Both characterizations were consistent with each other.
In very recent experiment of Urbańczyk et al. [
13], the
- state inner well was reinvestigated and
progression was recorded with higher accuracy and with spectrally narrower laser than that in Ref. [
17].
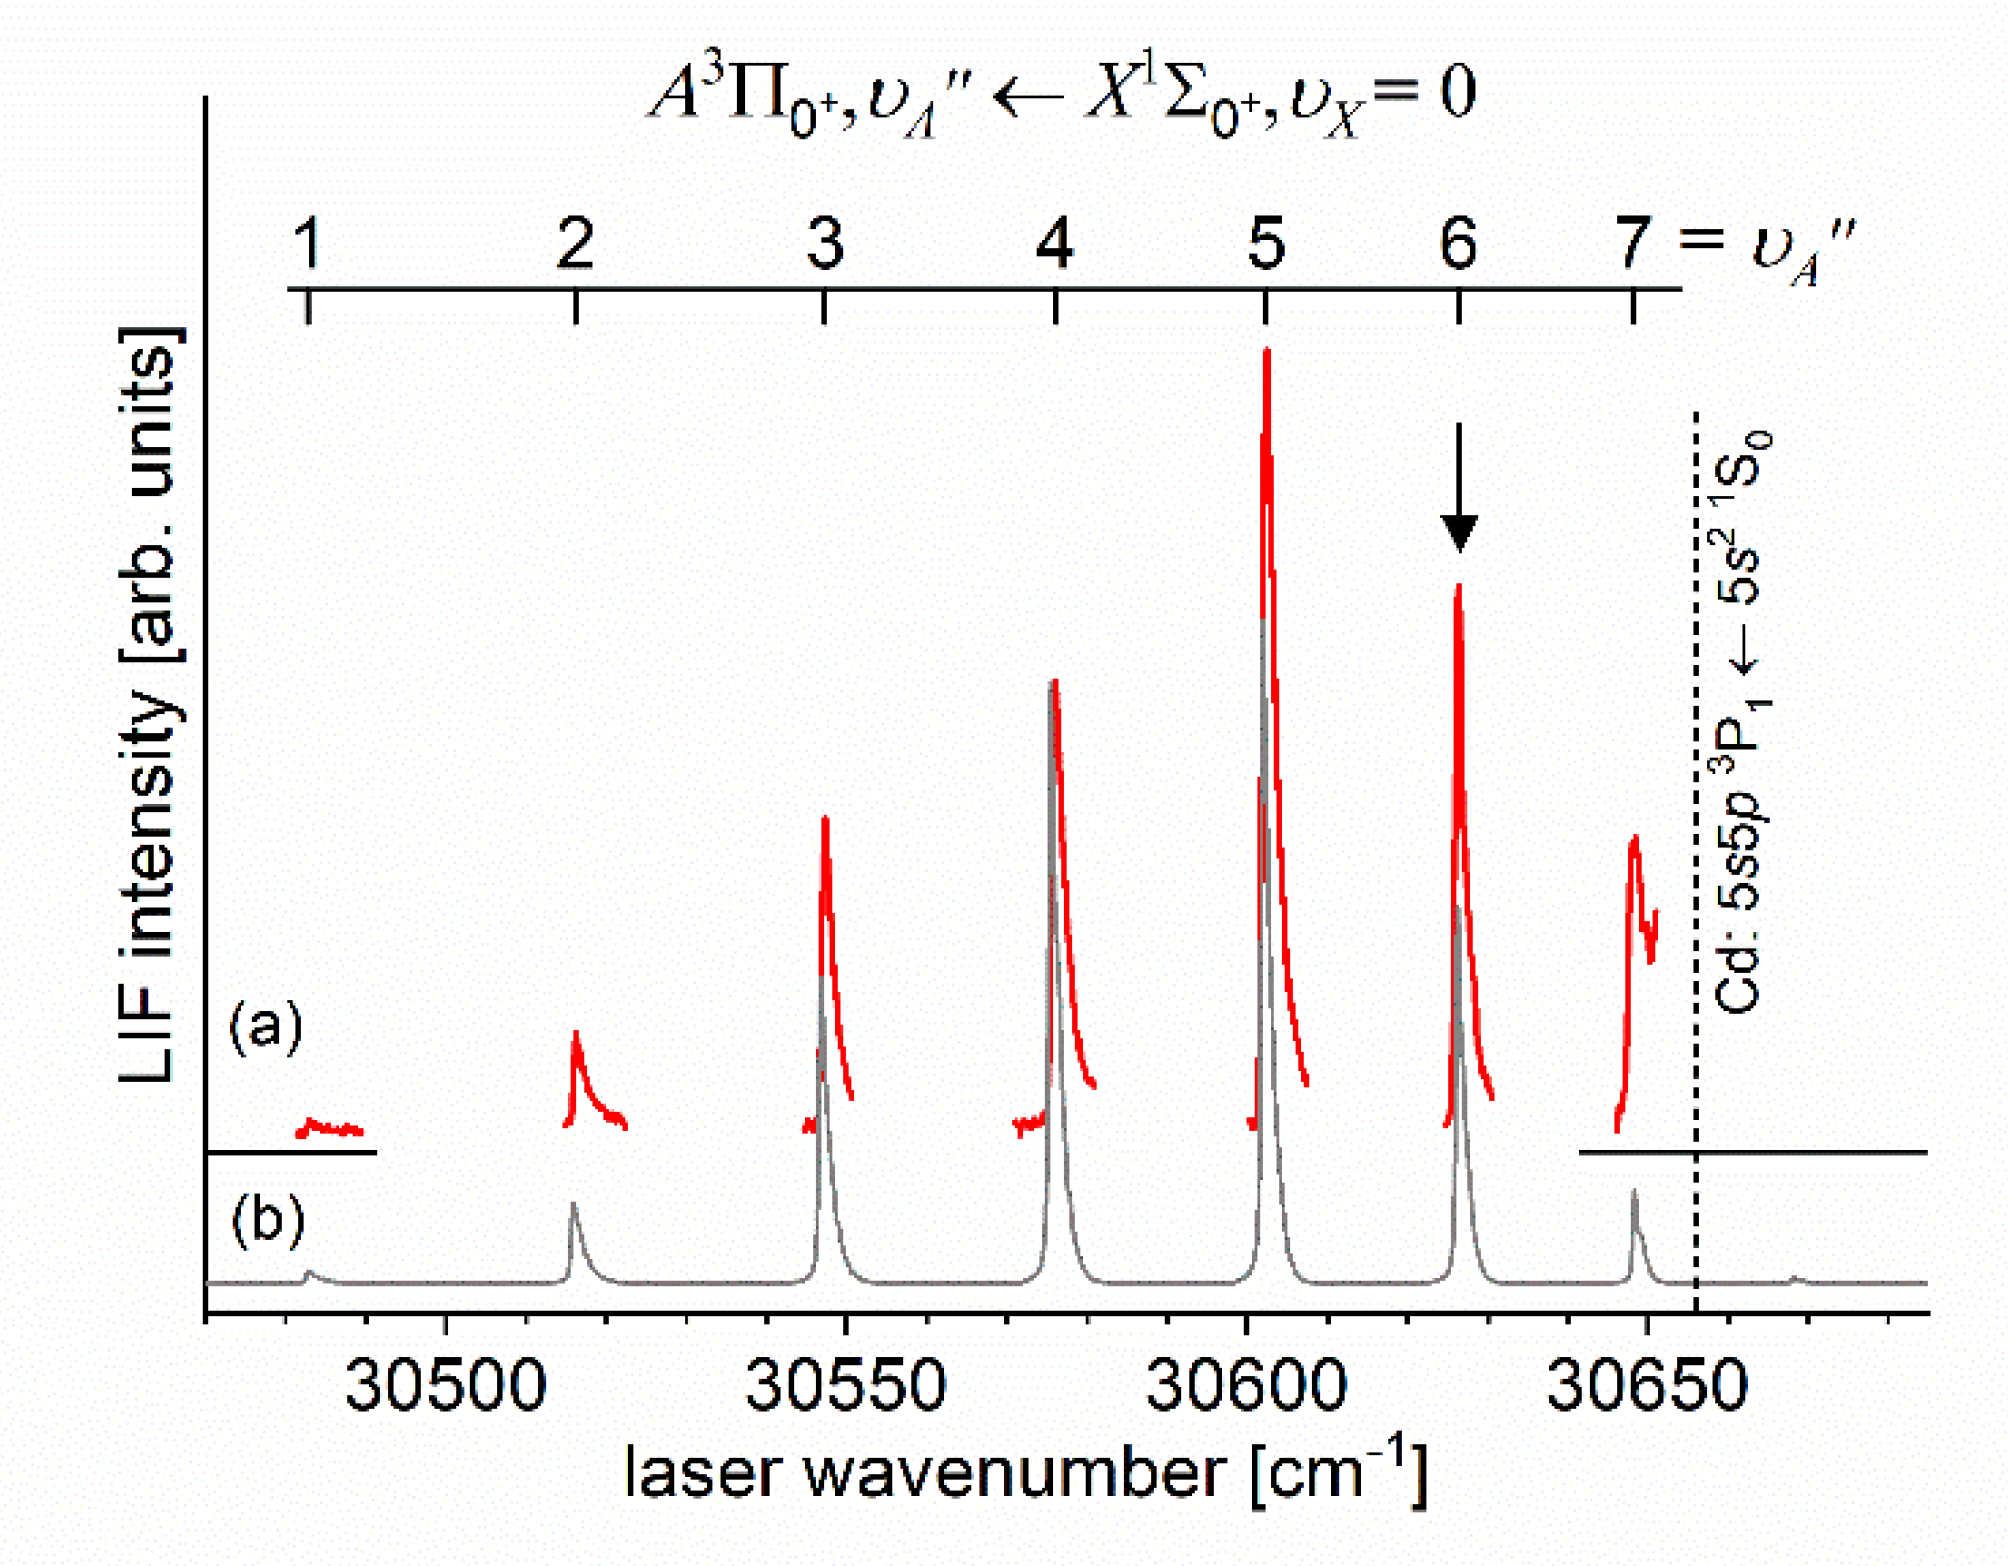
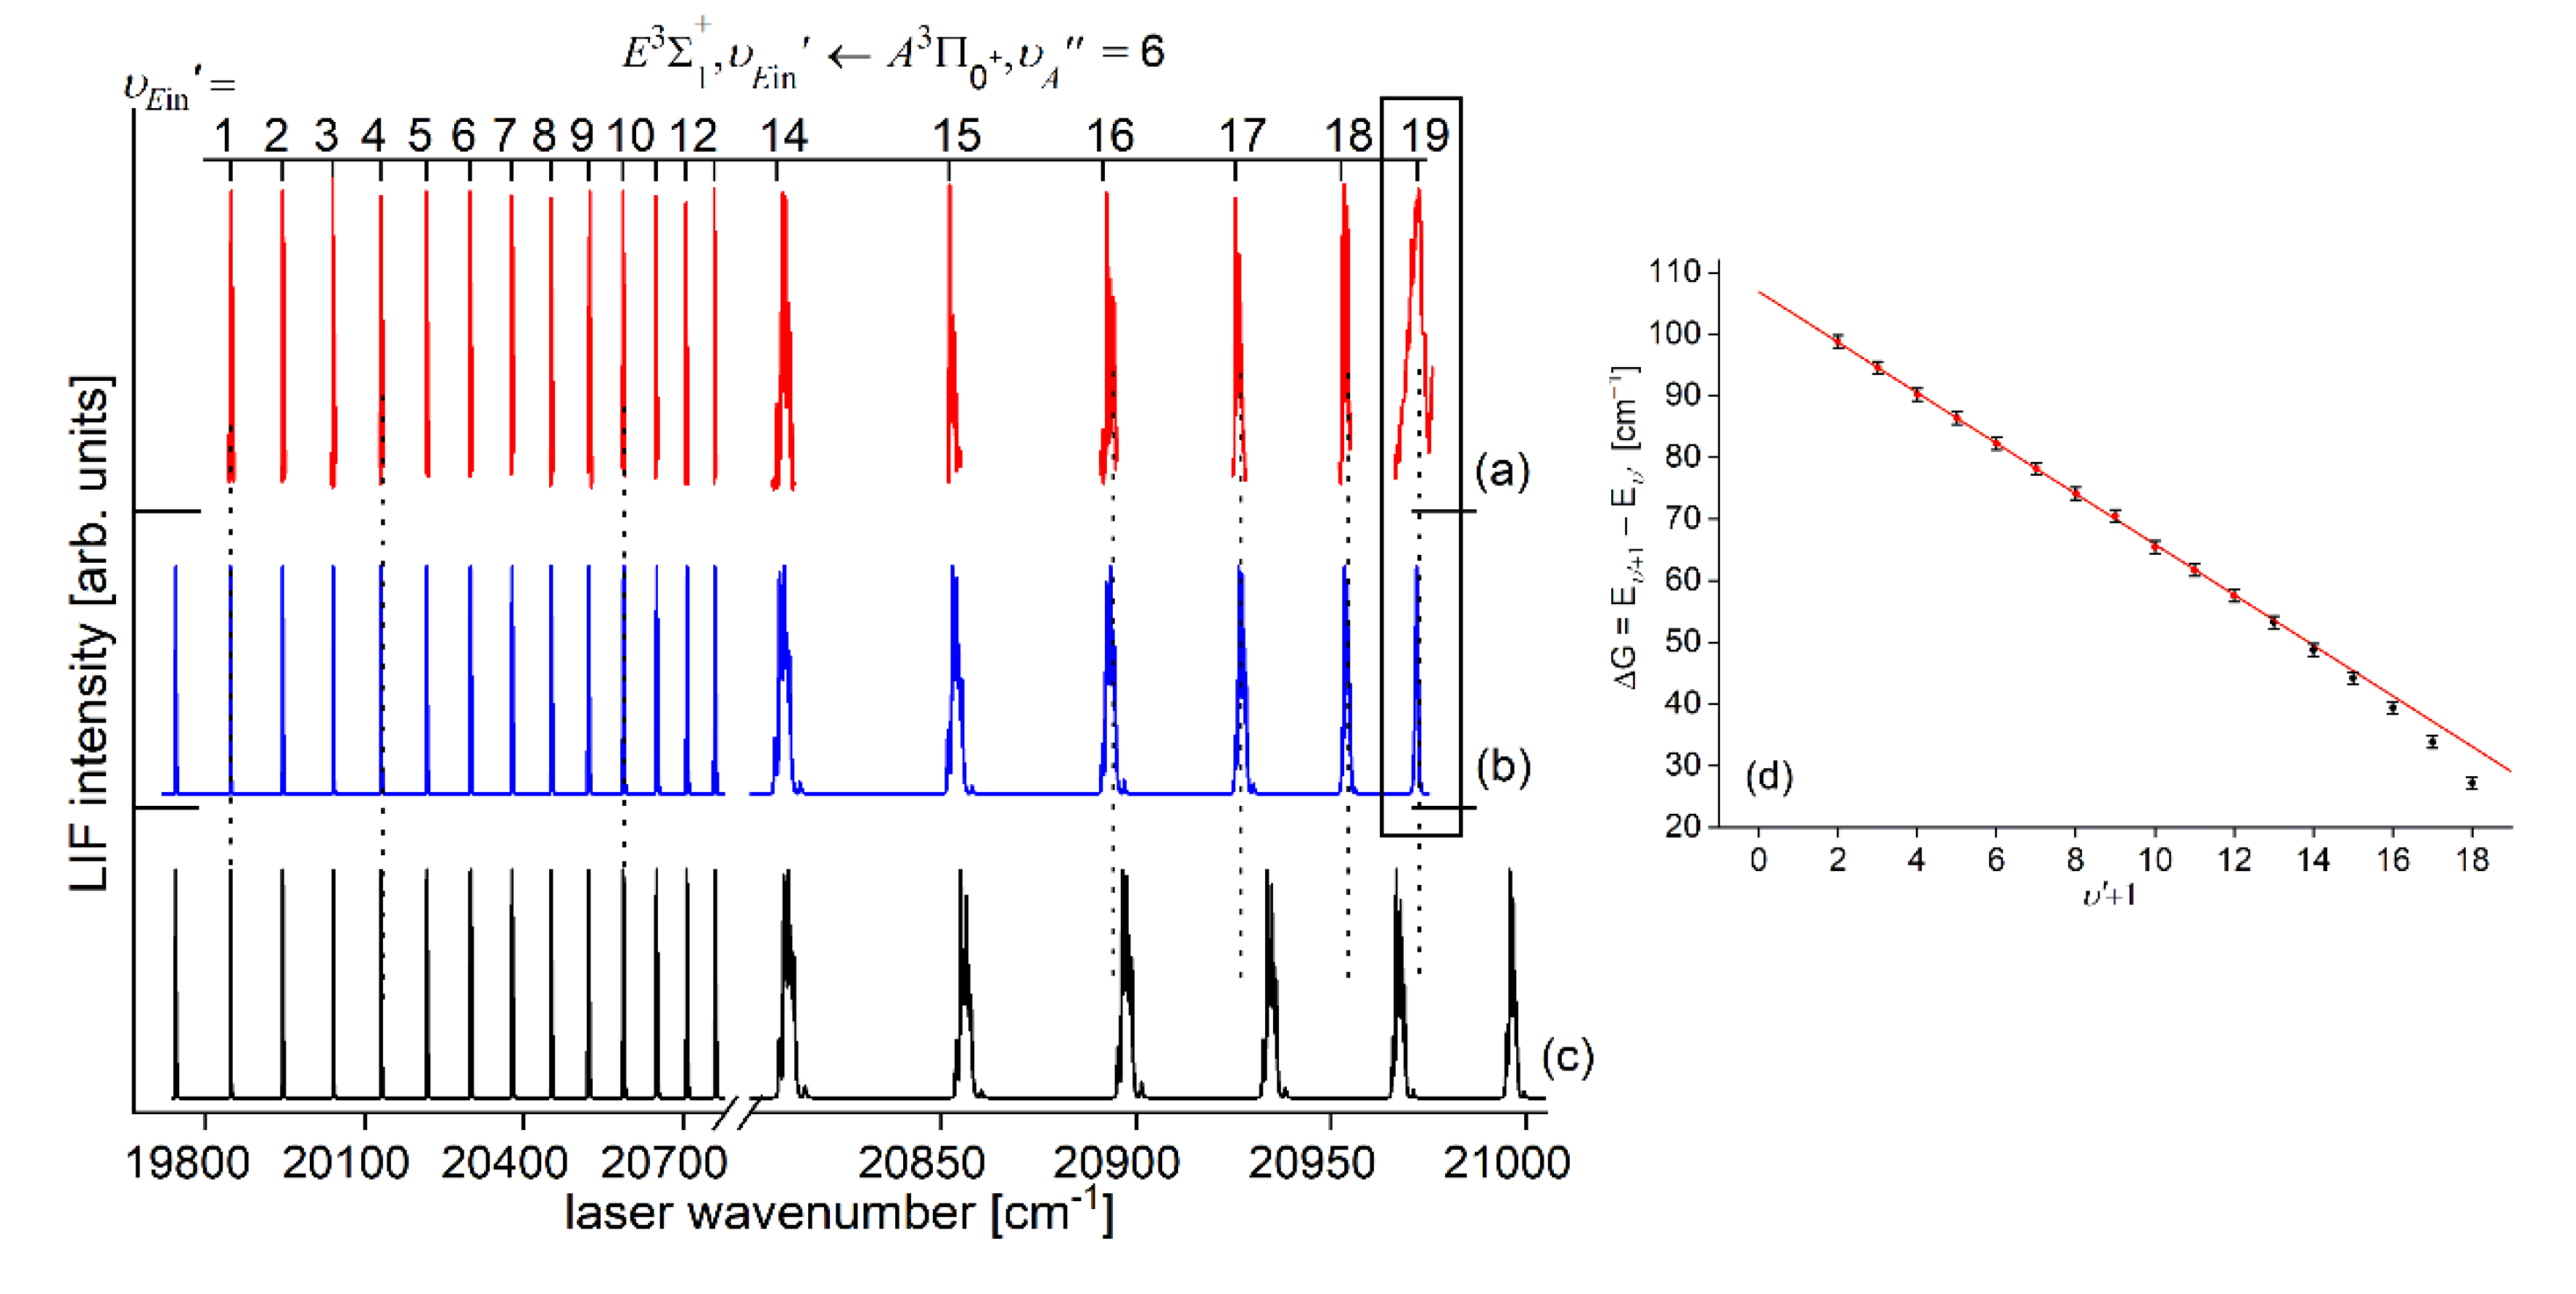
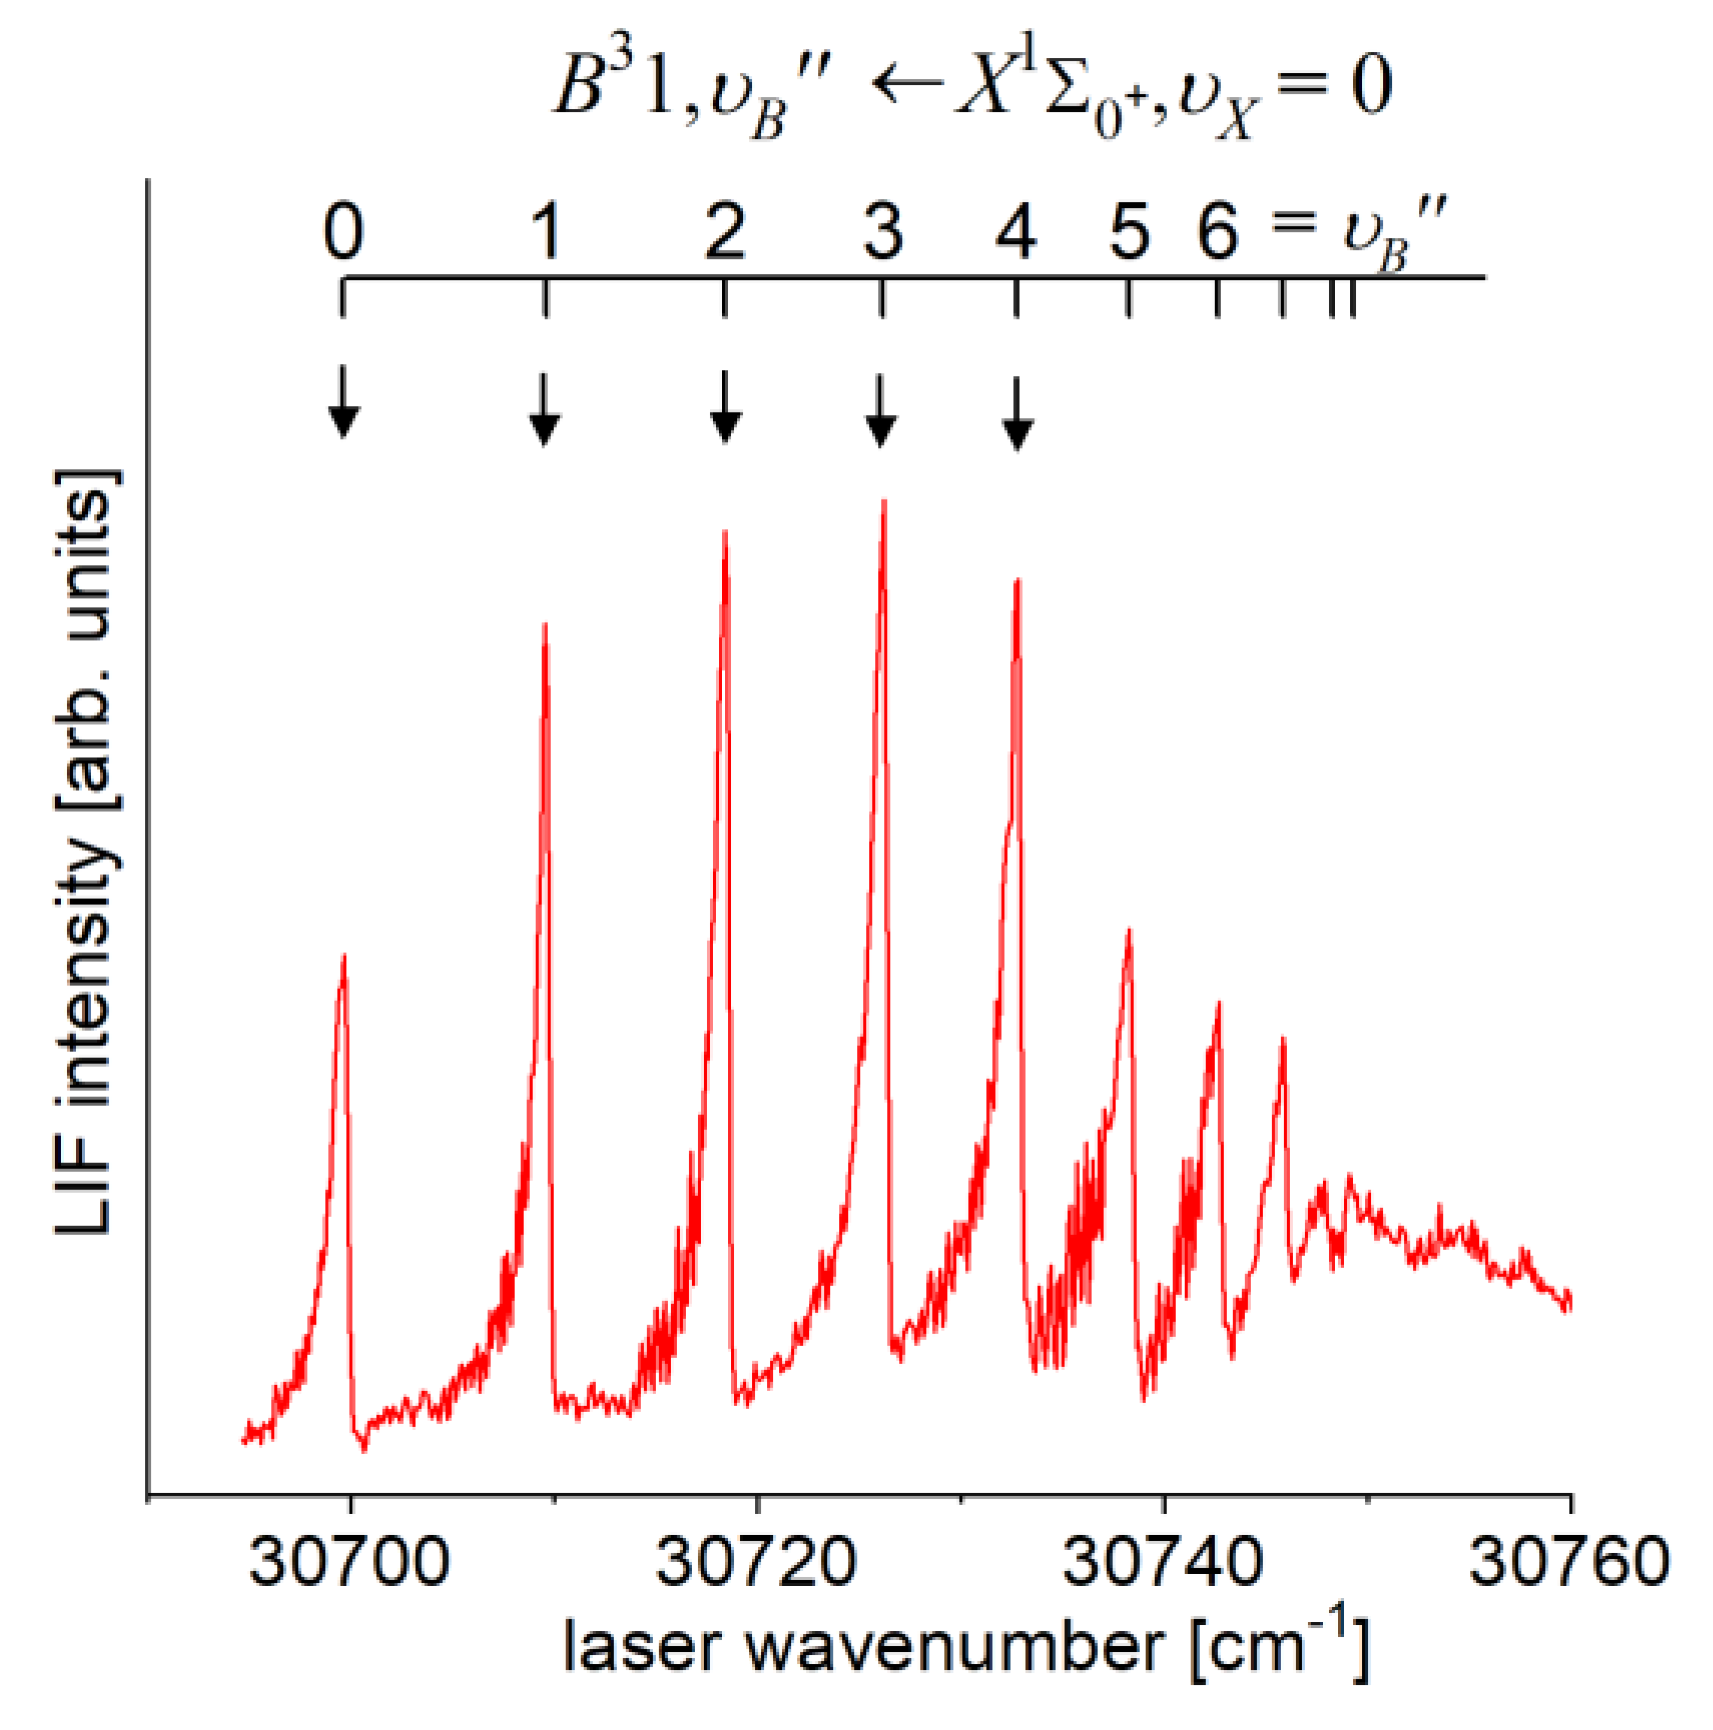
Figure 13 and
Figure 14 present LIF excitation spectra recorded using transitions corresponding to first- (
) and second-step (
) of OODR process, respectively.
It is crucial to notice here, that mutual positions of the
- and
-state potentials allow (providing proper choice of
) to record a whole vibrational progression termination at all
supported by the
- state potential inner well. This gives an opportunity to characterize the inner well in the best possible way. The improvement in Ref. [
13] was achieved by thorough analysis and simulation of the spectrum: more consistent characterization of the inner well based on inverted perturbation approach (IPA) [
208]. Moreover,
vibrational bands were recorded with higher resolution, which provided their more reliable rotational characterization (see
Figure 17 below). To complete the inner well characterization, free
bound (
transitions were included in the analysis (see
Figure 16 below).
Figure 13.
(a) LIF excitation spectrum recorded using the
transition in CdAr, being first step of excitation in OODR process:
that allowed to investigate the
- state inner well and, partly, potential barrier. (b) Simulation performed using LEVEL [
206] and PGOPHER [
207] programs and data derived from analysis of the experimental spectrum [
13]. Arrow shows the
that was used as origin for the second transition in OODR. Also
band recorded with (see
Figure 17(B)) higher resolution was used in, among others, in isotopologues selection experiment (see
Section 5.4). Position of the atomic transition in Cd is depicted.
IPA method starts from the chosen ab-initio or analytical potential expressed in pointwise form, optimizes of specific points in order to obtain the best agreement between vibrational and rotational energy levels determined by solving the Schrödinger equation and energies recorded in experimental spectra. What is important, optimization of the pointwise potential, which possesses more degrees of freedom than e.g. analytical potential, allows for better agreement between the simulated and experimental energies and providing better, more reliable results for PEC representation.
IPA method employed for the
progression concluded with better simulation of the LIF excitation spectrum with the
- state inner well represented by the pointwise potential.
Figure 14 shows a comparison of the
progression recorded in experiment with two simulations: that obtained from IPA method and that with the
- state inner well represented by a Morse function. What is evident from the comparison is an inadequacy of Morse-function representation for approximately
(which is generally acknowledged conclusion a Morse function most adequately representing molecular potential in the vicinity of the bottom of the potential well), the problem that is eliminated by the IPA result. The conclusion is also demonstrated in a respective Birge-Sponer (B-S) plot shown in the inset. The conclusion is in line with the Rydberg character of the
- state and conclusion reached by Krośnicki et al. [
4] showing the presence of maximum in the Rydberg-electron density distribution in the region of the outer wall (i.e., that which is closer to the barrier) in the
- state inner well.
Figure 14.
(a) LIF excitation spectrum of the
progression recorded using the
in CdAr. (b) Simulations performed using representation of the
- state inner well (b) obtained from IPA method and (c) using a Morse function. As figure compares only positions of the vibrational components, their intensities in (a), (b) and (c) were normalized. To make a comparison easier, several last
components were shown in different horizontal scale. Details of the
component, shown in rectangular frame, are shown also in
Figure 16. (d) B-S plot for the
progression presenting a distinct nonlinearity for approx.
.
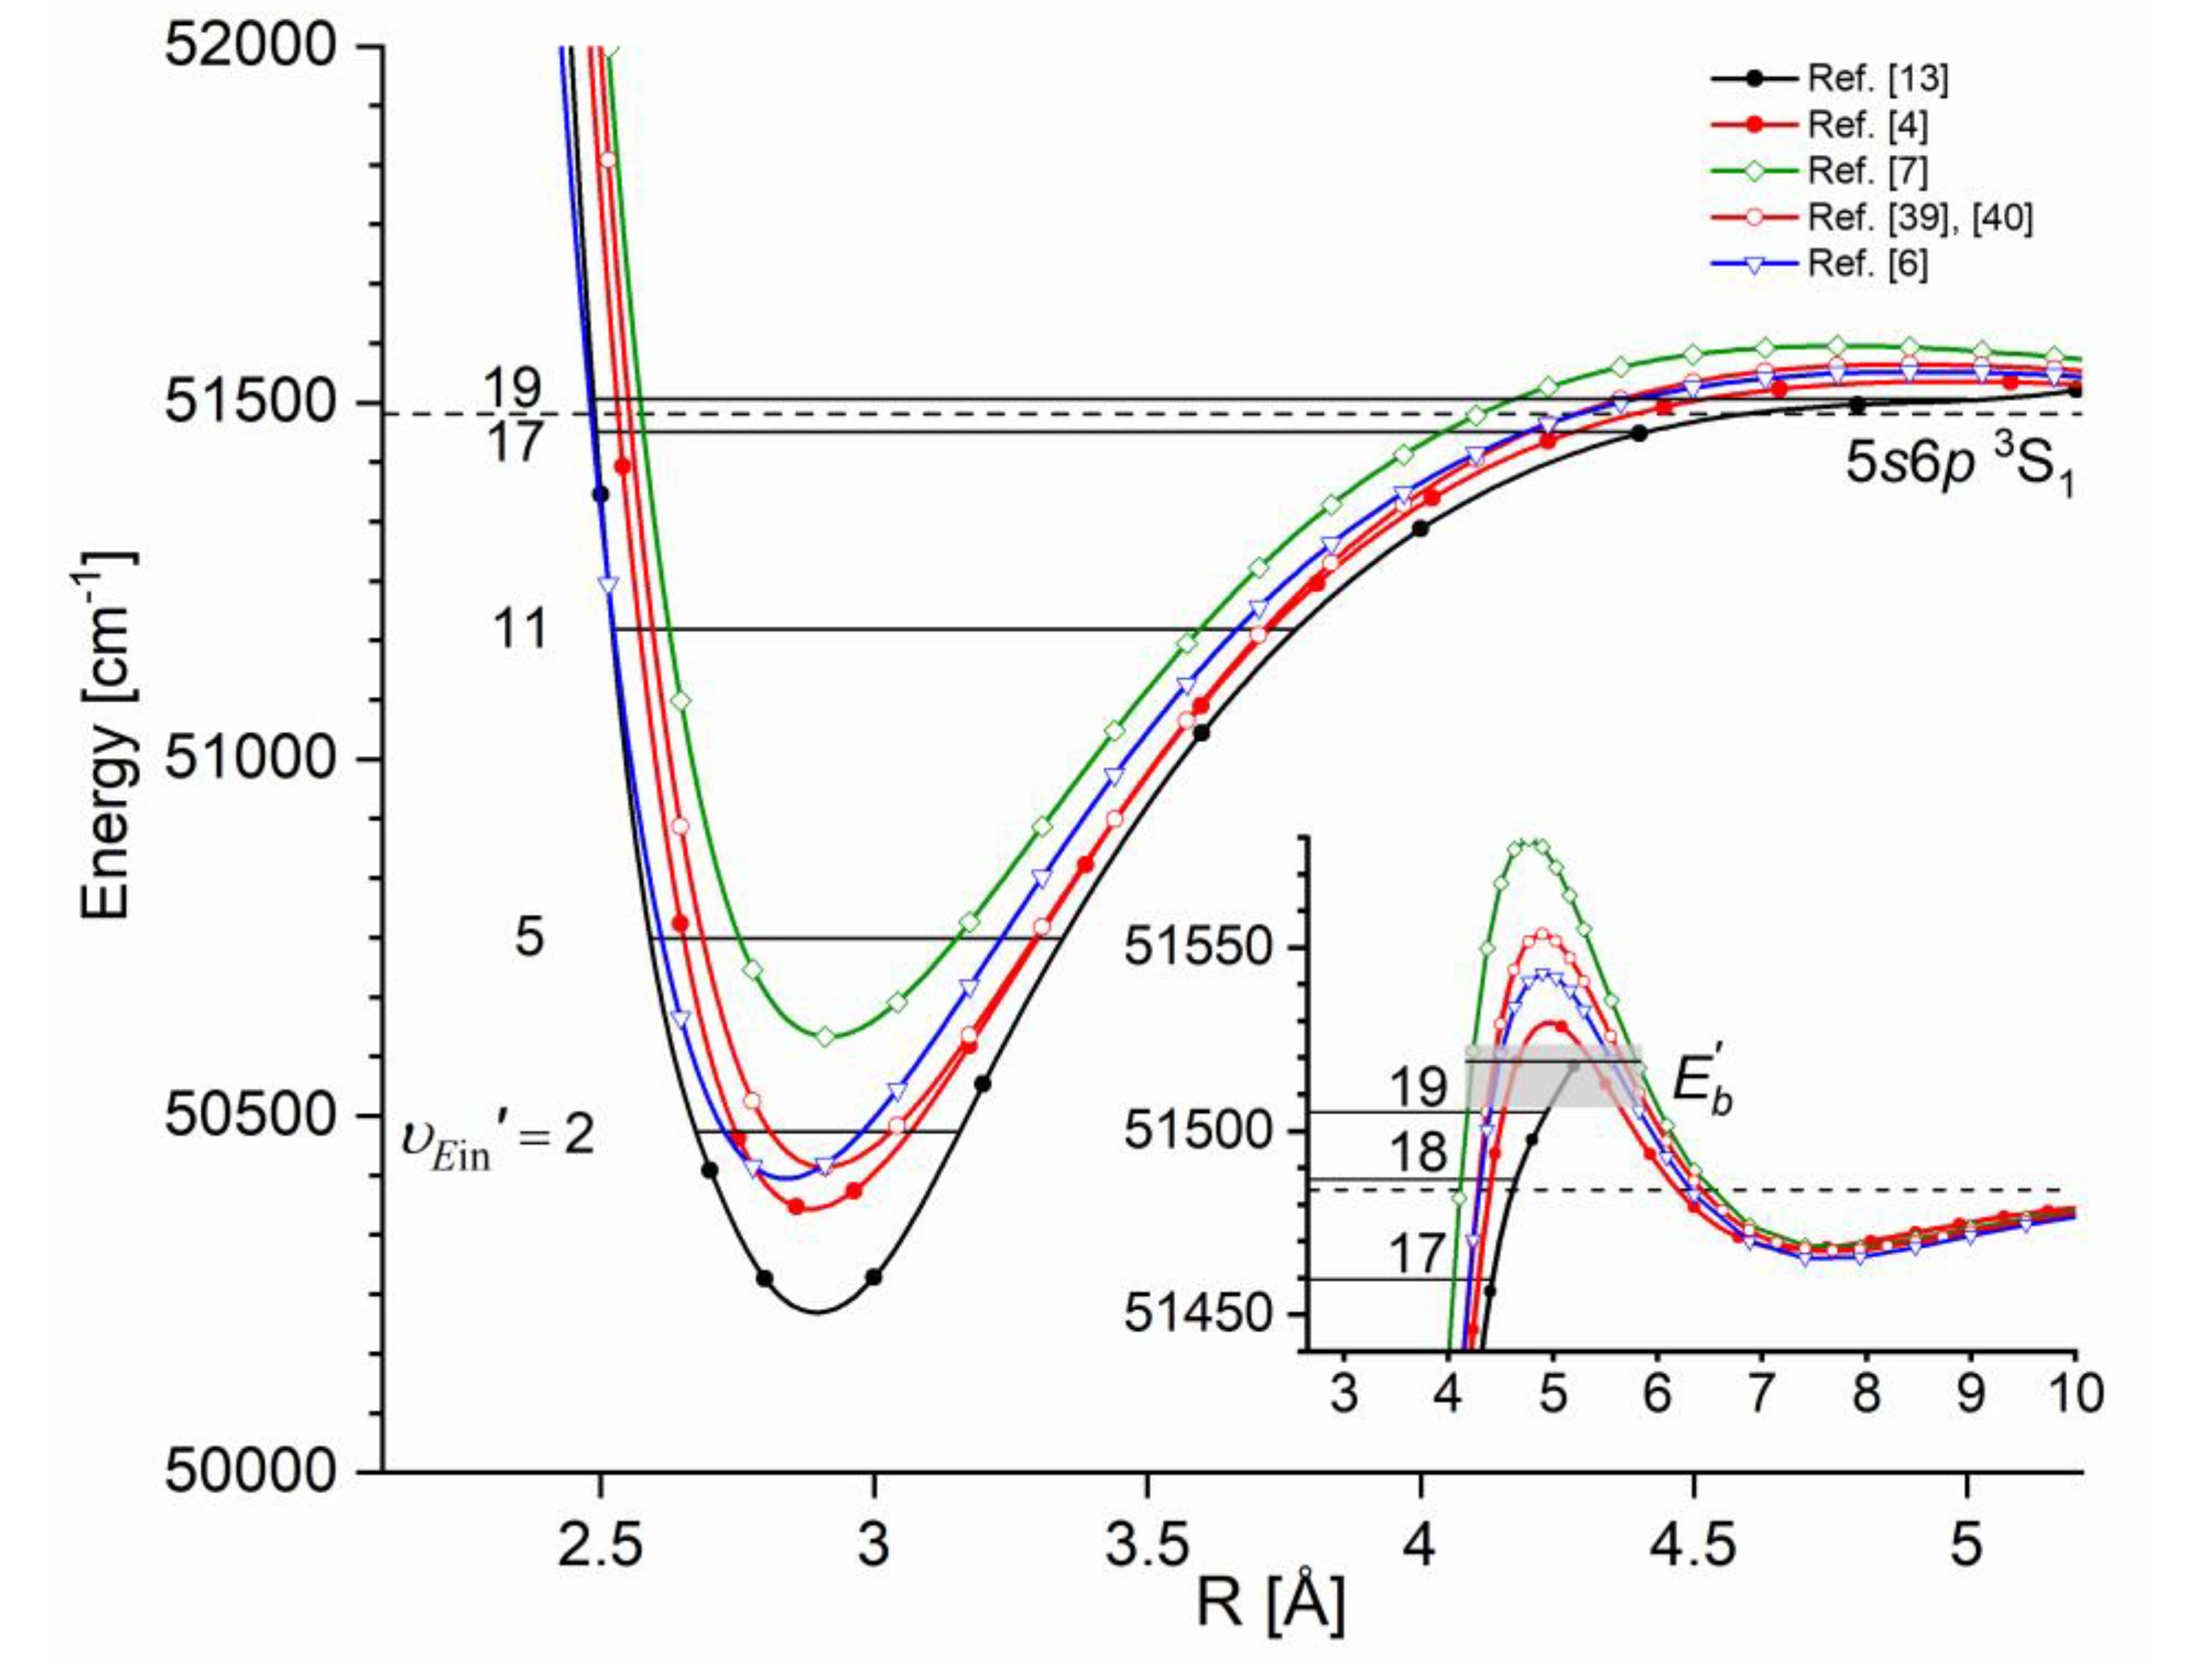
The comparison of the IPA result with available
ab initio inner well representations is shown in
Figure 15. It is evident that the
- state IPA representation of inner well is deeper than depths obtained in all
ab initio results. Additionally, three
ab-initio calculated potentials, i.e. those of Czuchaj and Stoll [
6], and Krośnicki and collaborators [
39], [
40] as well as that, very recent, of Krośnicki et al. [
4] are very close to each other as far as depth of the potential well is concerned. As can be seen from
Figure 14 (and
Figure 15), IPA method, by definition, provided very reliable representation of the
- state inner-well potential. But one has to deal here with more complex i.e. double-well potential, therefore the inner-well potential representation of the
- state should join smoothly with a reliable representation of the potential barrier and representation of the potential outer-well that extends for larger
Rs.
In order to investigate the two crucial joining points, it was necessary to reach the potential barrier in the excitation from both sides i.e. to record
progressions to the highest
in both
and
transitions (refer to in
Figure 4). As far as the former is concerned,
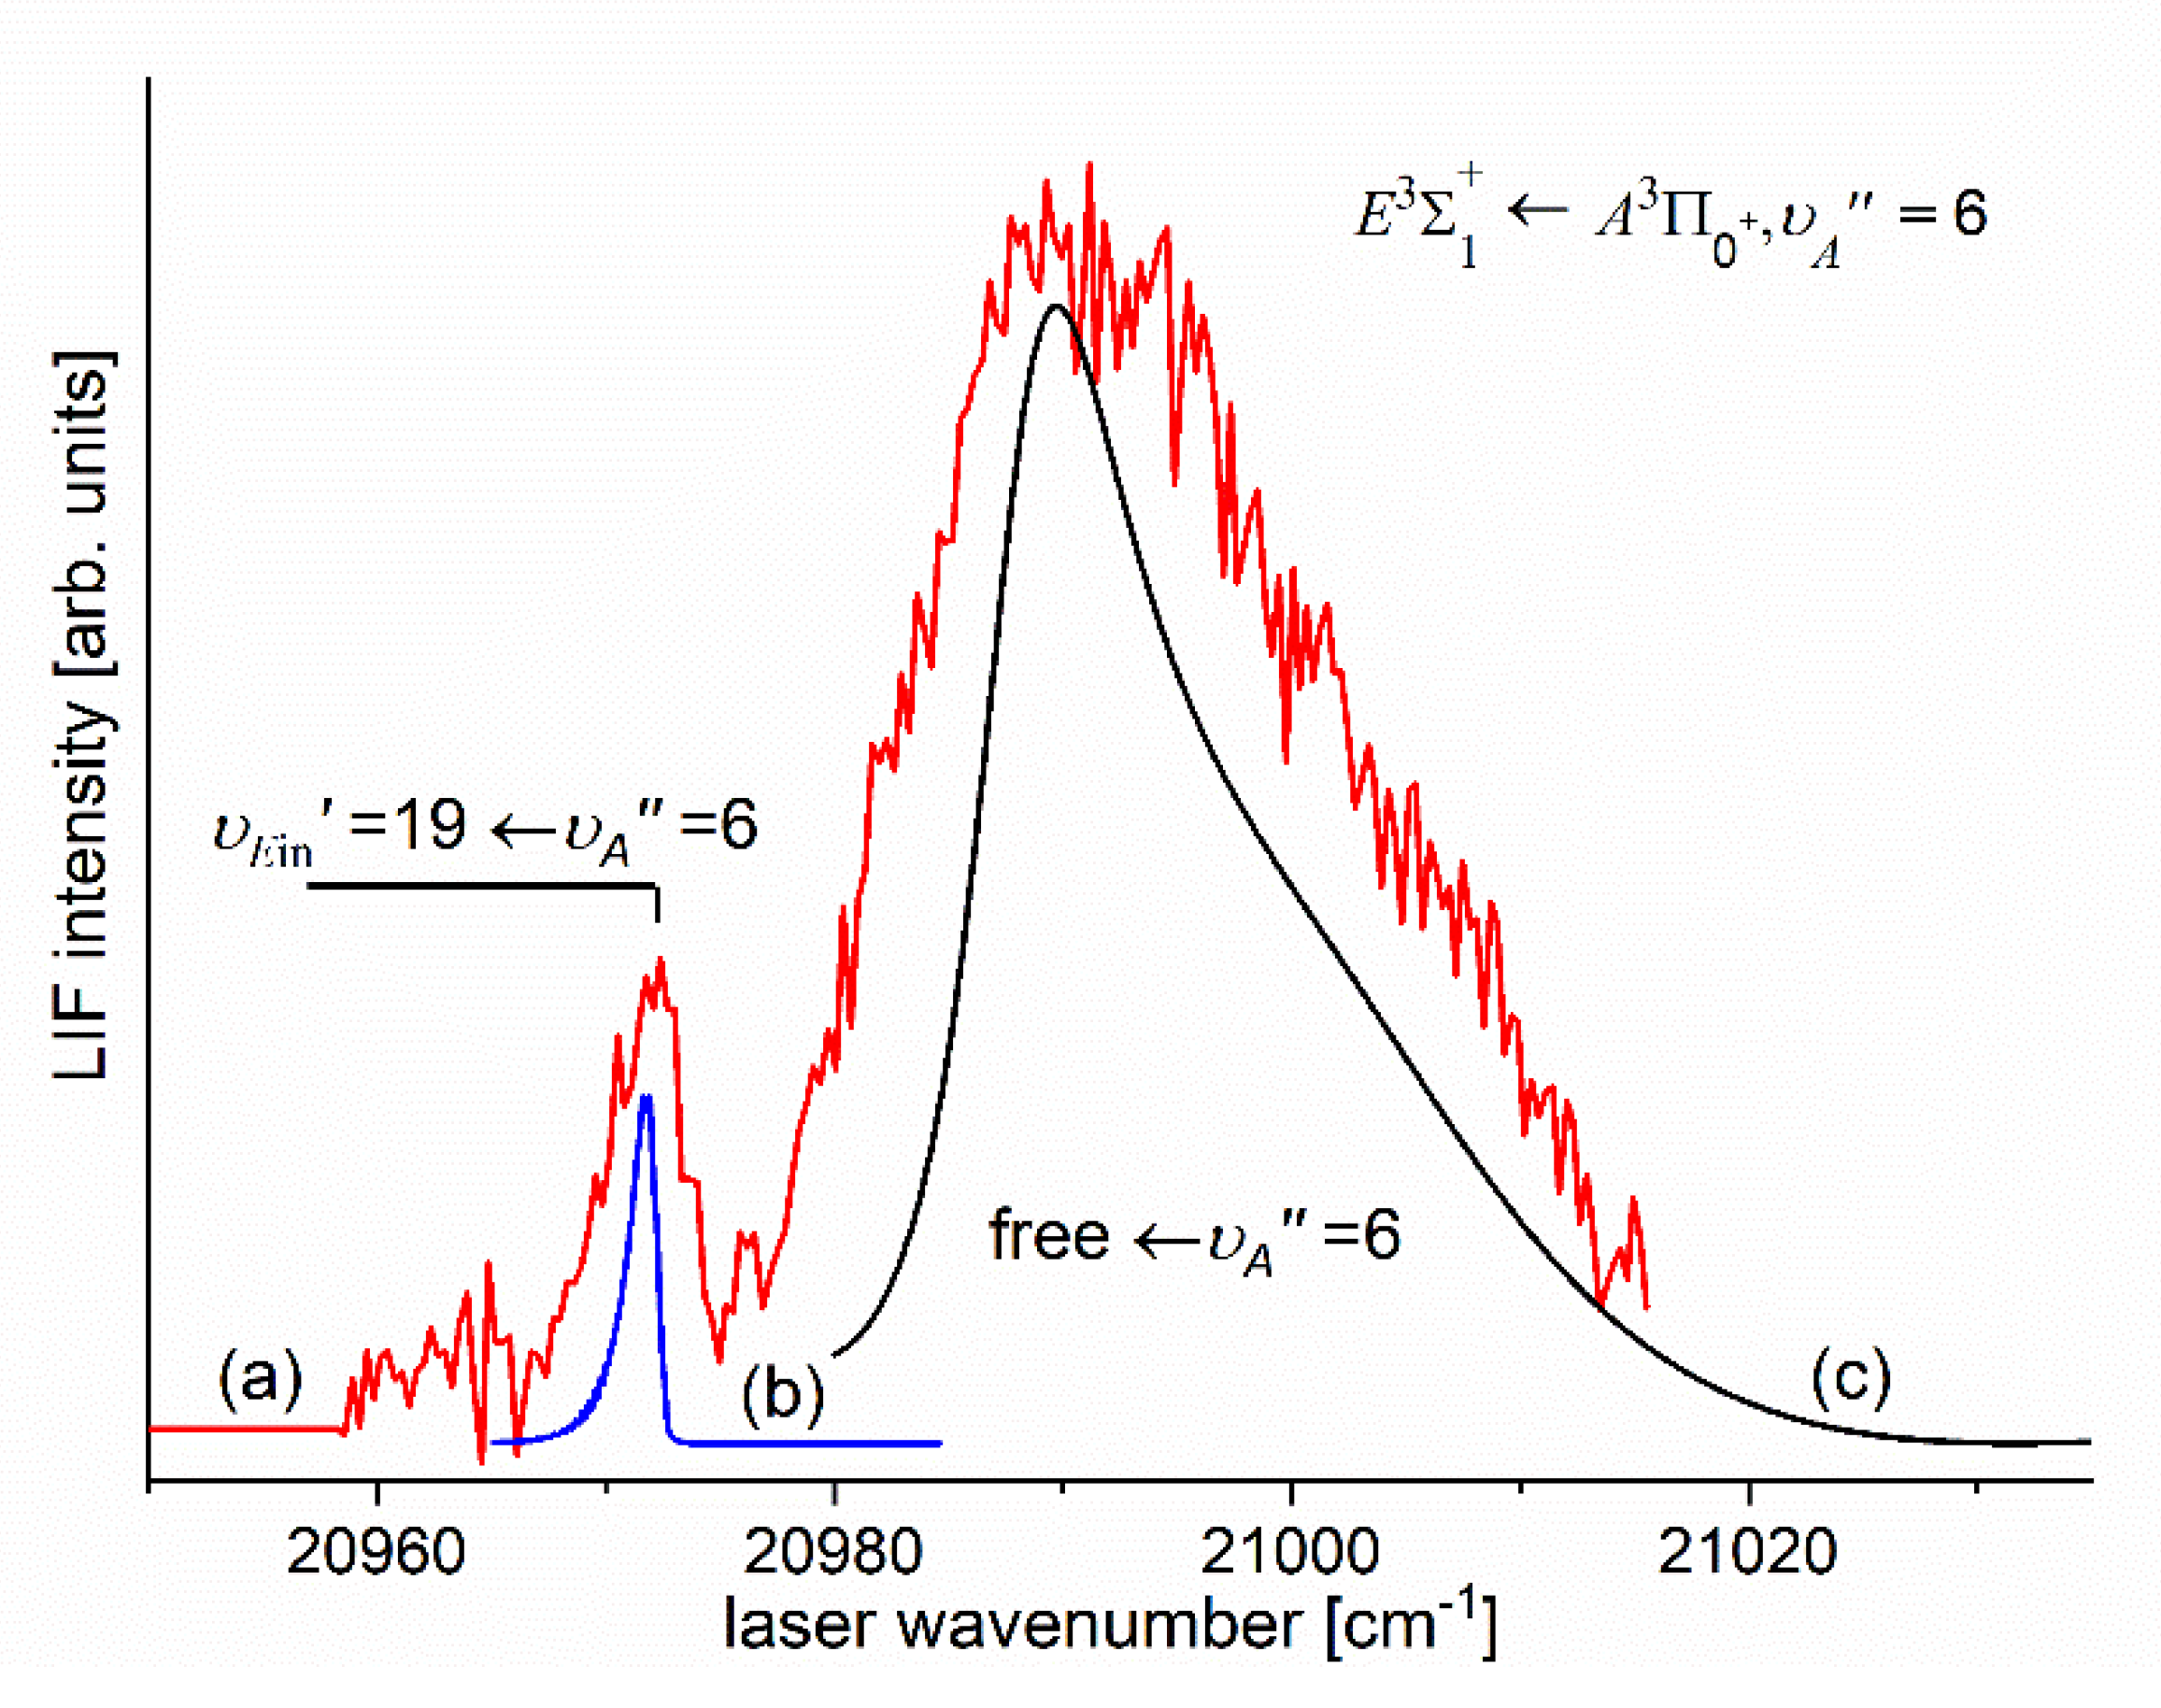
Figure 16 shows the
last quasi-bound
bound transition lying (along with that to
) above the dissociation energy correlating with the
Cd asymptote (see
Figure 15)
14). Also,
Figure 16 shows a wide profile of free
bound transitions starting from
and terminating at the repulsive inner wall of the potential. Simulation of both parts of the spectrum assuming representation of the
- state inner well by IPA result confirmed once again its advantage over that of a Morse function. However, simulation of free
bound transitions shown in
Figure 16(c) had to be shifted by 5
towards larger wavenumbers to reproduce the experimental spectrum – this may suggest that the steepness of the repulsive part of the inner well potential is somewhat smaller than assumed in the simulation. The height of the barrier was estimated to be in the 21.1-39.4
energy interval above the
Cd asymptote (see inset in
Figure 15).
Figure 15.
Comparison of the
- state inner well IPA representation in CdAr (black: full circles and line) with results of most recent
ab initio calculations of Krośnicki et al. [
4] (red: full circles and line), and
ab initio calculations of: Czuchaj and Stoll [
6] (blue: empty triangles and line), Czuchaj et al. [
7] (green: empty squares and line), Krośnicki and collaborators [
39], [
40] (red: empty circles and line). Inset shows vicinity of the potential barrier that separates the inner and the outer wells. Position of three
levels closest to the dissociation energy is shown. Height of the potential barrier
: as estimated in Ref. [
13] (grey rectangle) and as determined in Ref. [
12] (horizontal black line) (see also
Table 1). Note: for the potential barrier and outer well representations see
Figure 23.
Figure 16.
(a) LIF excitation spectrum recorded using the
transition in CdAr [
13] showing the last
quasi-bound
bound transition and profile of free
bound transitions starting from
; (b) and (c) simulations of the bound
bound and free
bound transitions performed using PGOPHER [
207] and BCONT [
209] programs, respectively.
As far as the position of the inner well (
is concerned, it was corroborated in detection and simulation of a series of partly rotationally resolved profiles of vibrational bands of the
transition in
with small admixture of
. A selective isotopologue excitation exploiting the
first-step OODR transition was possible as was shown in
Figure 17(B) and discussed in more detail in
Section 5.4 of this review.
Figure 17(A) presents four recorded profiles corresponding to
vibrational transitions. Simulation of the profiles allowed to determine respective
rotational constants and corroborate the
as that verified also employing IPA method. As already stated, rotationally resolved vibrational profiles were recorded by Bennet and Breckenridge [
18] but they belonged to the
transition after highly nonselective LV process and with assumption of
.
From
Figure 15 it is obvious that, similarly as for the
Rydberg state in CdNe, also in CdAr agreement between experimental and
ab-initio calculated potentials is not entirely satisfactory for both the inner well and the potential barrier. It was necessary to make an effort and characterize the complex
- state double-well potential for all three components: both inner and outer wells and the barrier. It is presented in
Section 5.2.3.
Figure 17.
(A) Partly rotationally resolved profiles of vibrational bands recorded in LIF excitation spectrum of the
second-step OODR transition in
(with small admixture of
); (a) experimental spectra, (b) simulations performed using LEVEL [
206] and PGOPHER [
207] programs with assumption of
5 K (
), and
. (c) Intensities of rotational P-, Q- and R-branches contributing to (b) depicted with colour code as in part for
. Intensity of Q-branch is damped as concluded in Ref. [
10]. (B) Profile of the
first-step OODR transition showing possibility of selective excitation of
with small admixture of
isotopologue (see also
Section 5.4). (a) Experimental LIF excitation spectrum, (b) total simulation of the profile, (c) contributions to the total simulated profile corresponding to different CdAr isotopologues. Vertical blue dashed line and wide bar depict a laser wavenumber of first-step OODR transition and the laser bandwidth, respectively.

5.2.2. Agreement Plot, Agreement Parameter and New Method for The Outer-well
Bond Length Adjustment
Experimental evidence of the existence of the
Rydberg state outer well (
) in CdAr molecule, that corroborated findings of
ab initio calculation, has not been known until 2003. Koperski and Czajkowski [
17] first-time reported presence of the second shallow outer well that was separated from the inner well (
) by the potential barrier. From LIF excitation
bound←bound and free←bound spectra recorded with limited spectral resolution they characterized the outer well and attempted to join the inner and outer wells with arbitrarily chosen polynomial function.
Further investigation [
16] was devoted to detection of the
vibrational bands and was conducted with higher spectral resolution which allowed to partly resolve rotational structure. Moreover, in Ref. [
17], as the result of better spectral resolution than in Ref. [
16], the
-assignment in the spectrum has been changed:
. Consequently, determination of the
well depth (
) and bond length (
) was improved to new values (see
Table 1). Later on, a new method for the
adjustment has been proposed along with revisitation of the
spectrum [
15]. The
vibrational band was additionally recorded and, along with that originating from
, served as input data for the proposal based on the fact that with the
=7.63
[
16] simulation of both spectra, i.e. originating from
and from
, showed considerable disagreement with the experimental ones as far as distribution of intensities of vibrational components is concerned (see traces (a) and (b) in
Figure 18). To resolve the problem so-called
agreement parameter was proposed
where
and
are the normalized experimental and simulated intensities of the
ith vibrational component in LIF excitation spectrum. Such a definition of the
causes that it achieves highest values only for those
for which the intensity distribution of the simulated vibrational components are close to the intensity of the respective components in the experimental spectrum.
Figure 19 shows
agreement coefficient for the
transition originating from (a)
(empty circles) and (b)
(full circles) along with resulting
[
15]. For comparison, also the result of Ref. [
16] is shown. Moreover, the plot in
Figure 19 was augmented with the best result so far showing improvement of the
determination, i.e.
[
12] resulting from accumulation of more experimental data and correction of
- assignment (see next
Section 5.2.3).
Figure 18.
The
vibrational band of CdAr. (a) Experimental spectrum. Simulations performed using PGOPHER program [
207] with the assumption of (b) the
=7.63
[
16], (c) the
=6.90
obtained as a result of new method of bond length adjustment with the help of the
agreement parameter [
15]. In both simulations
and
were used. Note: according to later studies, figure shows wrong
-assignment as it lacks the low-intensity
component that was recorded during investigation of the
transitions [
12] (see
Figure 22) causing correction of the spectroscopical characterization of the
well; it was also illustrated in
Figure 19 and
Figure 20.
Apart from a new method of
agreement coefficient , another method, called
agreement plot was proposed in Ref. [
15] as complementary to e.g., B-S plot with respect to determination of the
and
vibrational constants, and it can be used providing the upper electronic-state potential (to which excitation occurs) is represented by a Morse function. The
agreement plot illustrates the fact that
and
are not independent and there is a number of
pairs resulting in satisfactory simulation of the experimental spectrum (with not resolved rotational structure). Also, the
agreement plot allows to determine the
and
uncertainties in a more reliable way than when using B-S plot. The method of the
agreement plot relies on the calculated value of
P coefficient (see
Figure 20) expressed by the formula
15)
Figure 19.
The
agreement coefficient describing agreement between
experimental and
simulated intensities of the vibrational components in the LIF excitation spectrum recorded using the
transition (see Eq. (2)) for
(black full circles and line) [
15] and
(black empty circles and line) [
15]. The plot is supplemented with recent results of Ref. [
12] which concluded in correction of
- assignment (see
Section 5.2.3) for:
(grey squares and line),
(green squares and line),
(blue squares and line), and
(red squares and line). Symbols with error bars and corresponding rectangles depict
being the results of Refs. [
15] and [
12], and for comparison, Ref. [
16].
where
,
is the separation between the energies of corresponding
:
, where
is the energy of a selected (for example the most intense)
transition in the experimental spectrum, and
is the separation between energies of vibrational components in the experimental spectrum calculated similarly as the
. Next, for each
and
combination, the
were computed (LEVEL program [
206]) and
were determined from the experimental spectrum, leading to
according to Eq. (3). The result for the
transition [
15] is shown in
Figure 20(a) whereas
Figure 20(b) shows the result after recording additional component in the spectrum and change of the
- assignment (see
Section 5.2.3) [
12]. It should be emphasized that each of the
pair for which
results in satisfactory simulation-to-experiment agreement.
Figure 20.
The
agreement plot drawn according to Eq. (3) expressing simulation-to-experiment agreement with respect to the
state of CdAr using LIF excitation spectra of the
transitions for (a)
as in Ref. [
15] and (b)
as in Ref. [
12] after recording an additional component in the spectrum and correction of
-assignemnt (see
Section 5.2.3). Plot shows dependency between
and
vibrational constants. Error bars: uncertainties of the
and
as in Ref. [
16] (red), Ref. [
15] (yellow) and, finally, Ref. [
12] (white).
5.2.3. Final approach: The - State Complete Potential Determination
Thanks to the very recent investigation of LIF excitation spectra recorded using the
transitions [
12], the respective measurement range has been widened as compared to the previous studies [
15] described in
Section 5.2.2. Both, bound
bound and free
bound type of transitions in the excitation spectra have been recorded and involved in the analysis and, moreover, a number of
levels from which the excitation originates was increased from
to
. Consequently, the study became the most complete characterization of the
Rydberg state potential of CdAr performed to date, and together with earlier studies of the
- state inner-well [
13] constitutes the most thorough description of the MeNg Rydberg state potential based on experimental data.
Figure 21 and
Figure 22 present LIF excitation spectra recorded using transitions corresponding to first- (
) and second-step (
) of OODR process, respectively. It is necessary to emphasize that in order to characterize the
- state outer well and the potential barrier, five
were chosen as origins for the second-step excitation (see
Figure 21). It assured very thorough and complete probing of the
outer well and neighbouring barrier
via bound
bound and free
bound transitions to different parts of the
- state potential.
Figure 21.
LIF excitation spectrum recorded using the
transition in CdAr, as reported in Ref. [
210], being the first-step of excitation in OODR process that allowed to investigate the
- state outer well [
12], [
15] and potential barrier [
12] using the
second-step OODR transition. Arrows show
that were used as origins in the second step transition.
Closer look at
Figure 22 reveals a series of bound
bound and free
bound LIF excitation spectra recorded using the
transition and originating from
.
Bound
bound transitions probe the vibrational energy structure in the
well, whereas free
bound transitions terminate on the outer wall of the potential barrier above the dissociation limit (refer to
Figure 4) and provide information on the barrier itself i.e. its position, height and, to a certain degree, its shape.
Figure 22.
LIF excitation spectra (red lines) recorded using (a) the
bound
bound and (b) the
free
bound transition in CdAr, and their respective simulations [
206], [
207], [
209] (black lines). Position
component that was not previously recorded [
15] is depicted (one asterisk). Position of the
vibrational components is shown, proving that the spectrum contains also transitions to
- state inner well. Unlike in other spectra recorded using second-step OODR transition and presented in this review, here laser wavenumbers are given with respect to the
-state asymptote. Energy corresponding to the
Cd asymptote is depicted (vertical dashed line). Inset to (a) shows detail of the very weak
bound
bound transitions with clearly visible
. (c) B-S plot for
progression and with corrected
- assignment providing final values for the
outer well vibrational constants
and
.
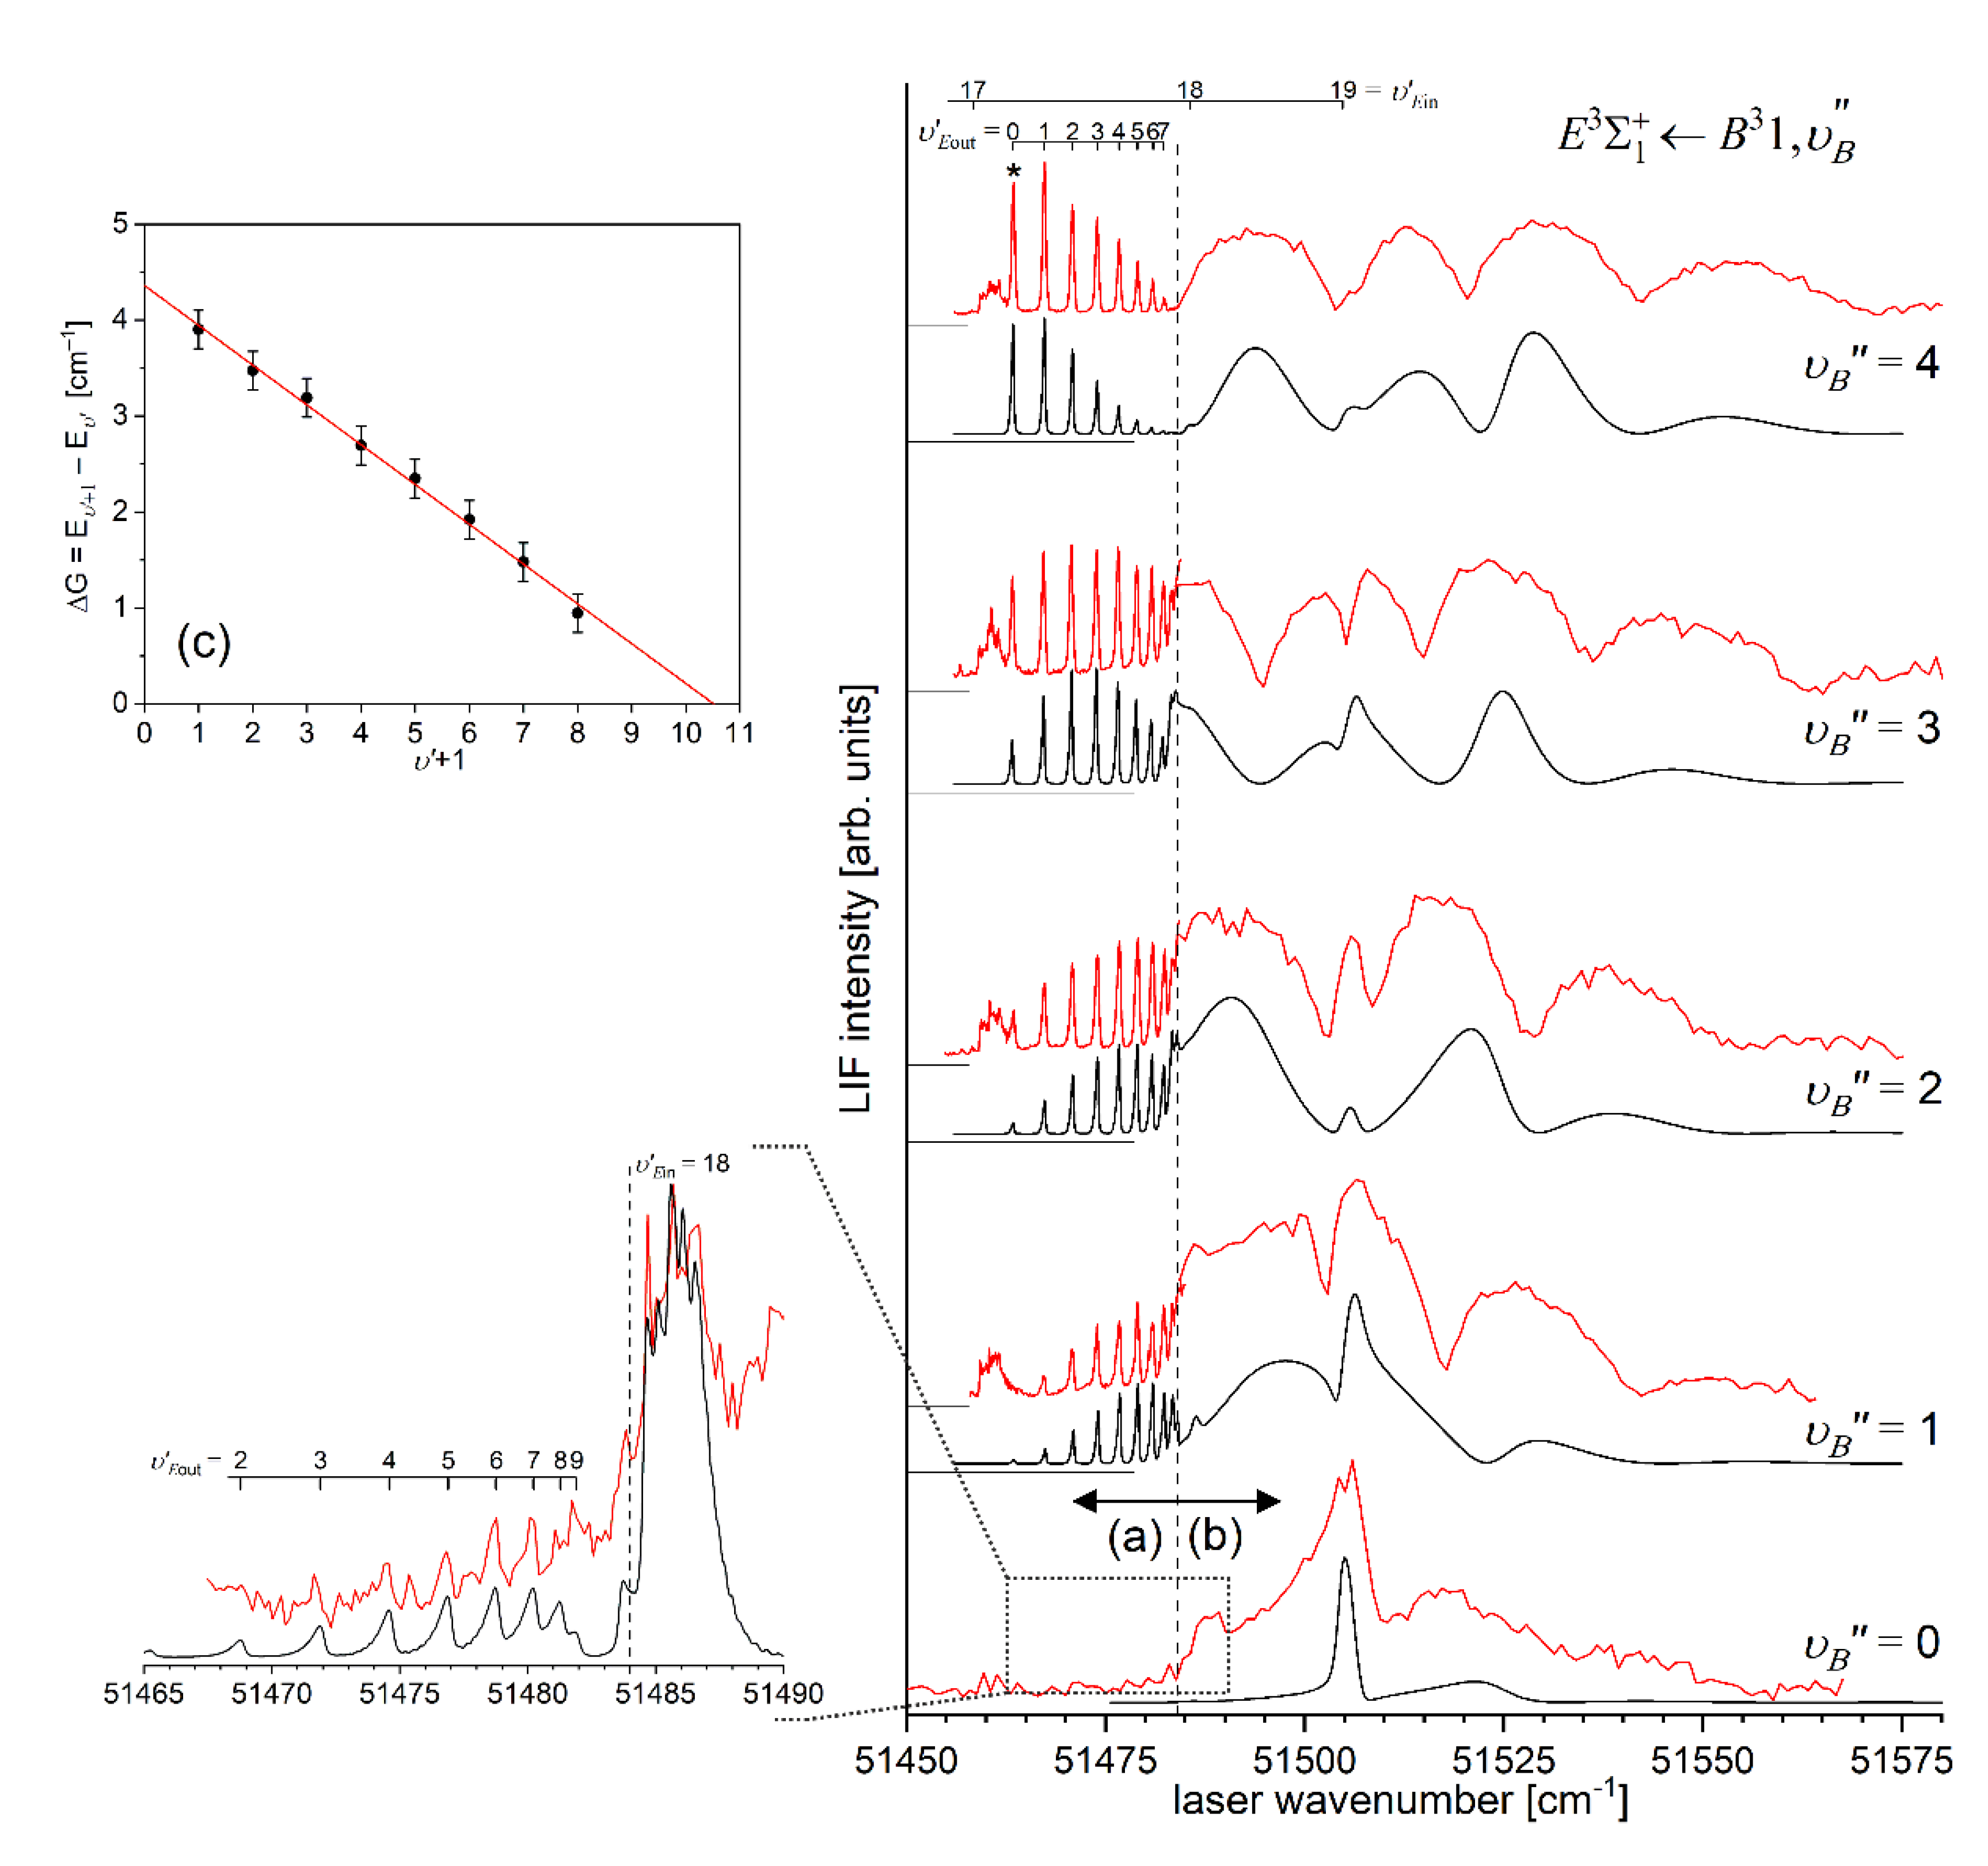
This unique opportunity of simultaneously recording both kind of transitions is due to a relative positions of the
- and
- state potentials. Interpretation of LIF excitation spectra of
bound
bound transitions is straightforward but interpretation of free
bound transitions originating from a given
needs an explanation. As can be seen in
Figure 22(b), spectra of free
bound transitions show undulated structure (oscillations), however, they do not correspond strictly to so-called
reflection nature, as classified by Tellinghuisen [
211], according to which they should ‘reflect’ the radial probability distribution in the initial
level conserving the peak and node count (i.e.
) of the
initial
-level wavefunction. The
reflection spectra (unlike the second type -
interference spectra) are frequently recorded in dispersed emission (also called dispersed fluorescence) from a previously excited
level to the repulsive branch of, most frequently, the ground-state
level, giving opportunity to determine the emitting
-level quantum number [16]
) (see examples for MeNg molecules reported in Refs. [
213], [
214]). However, in this particular case of the
excitation, free
bound transitions terminate on the upper-state repulsive part (i.e. outer wall) of the potential barrier (causing immediate dissociation of the molecule) providing a rare opportunity to its characterization.
As far as spectra of bound
bound transitions are concerned (
Figure 22(a)), entire
- levels vibrational structure in the
- state outer well was probed in the experiment [
12], therefore, B-S plot analysis (
Figure 22(c)) turned out to be very reliable tool to determine
,
and
, i.e. maximum number of
in the outer well. Moreover, as the B-S plot is linear, it was straightforward to propose a Morse representation for the
potential well. In addition, with respect to the earlier analysis of Ref. [
15] (see in
Section 5.2.2 and
Figure 18), here an additional
(previously missing) component in the spectrum has been recorded (see
Figure 22(a) - marked with asterisk). Therefore, the whole approach delivered new vibrational characterization of the
outer well which was compared with that of Ref. [
15] presented in
Figure 20. New
- assignment also affected determination of the
presented in Ref. [
15] (see
Figure 19 and
Table 1).
Analysing spectra of free
bound transitions (
Figure 22(b)) one may notice their departure from pure
reflection character. Following Duval et al. [
24] it can be interpreted as extraneous oscillations in the spectra which possess in fact an
interference structure that results from occurrence of a potential barrier. Also, an influence of lying above the dissociation limit last
level, supported by inner well and excited from the
levels, is evident and this vibrational component overlaps with bound free
transitions.
Additional information of the
- state potential barrier provides experiment and analysis presented in Ref. [
13] (see
Figure 16 in
Section 5.2.1): LIF excitation spectrum recorded using the
transitions that includes a profile of free
bound transitions terminating at the repulsive inner wall of the potential barrier. As already stated, simulation of that profile provided estimation of the height of the barrier (see inset in
Figure 15). Determination of the height of the barrier from the
free
bound transitions [
12] corroborated that previous result [
13] and specified the value as
= 27
(see
Table 1).
A real success of the presented studies relied on first-time determination of entire
- state interatomic potential that consisted of inner well, potential barrier and outer well. It was achieved entirely using experimental data obtained from LIF excitation spectra of bound
bound and free
bound transitions and their simulations assuming a pointwise model potential consisting of three parts corresponding to the three regions - this potential is shown in
Figure 23 and consists of:
- -
, deeper inner well – for
– adopted as the result of IPA method [
13],
- -
-
potential barrier – for
– modification of
ab-initio calculated potential [
4],
, shallower outer well – for
– represented by a Morse function [
12] converted to the pointwise form combined using a cubic spline method. To obtain simulation of the free
bound profiles that satisfactorily reproduce that recorded in the experiment, slight modifications were introduced: 0.01-
and 0.16-
shifts along the
R axis of all
ab-initio points [
4] used to construct the barrier and the IPA-based
- state potential [
13], respectively.
In
Figure 23 the
- state potential of Ref. [
12] is compared with those representations that were obtained earlier with limited sets of experimental data [
15], [
17].
Figure 23.
Comparison of CdAr interatomic potential of the
Rydberg state outer well representations close to the dissociation limit being the result of series of experiments using OODR excitation method: very first investigation of Koperski and Czajkowski [
17] (grey dashed-dotted line), result of Urbańczyk and Koperski [
15] (grey dotted line) and most recent result of Sobczuk et al. [
12] (black solid line) – see also
Table 1. Note: for inner potential well representations refer to
Figure 15. Part of the whole
- state potential representation in the vicinity of the potential barrier as the result of Ref. [
12] is also shown (blue line and points) - see text for details.
Ab-initio calculated potential of Krośnicki et al. [
4] is shown for comparison (red line and points). Potential of the
intermediate state [
16] used in OODR process is also drawn (green solid line). Three ways to execute the excitation using the
transitions are depicted with vertical arrows: (a) quasi-bound
bound to the
, (b) and (c) free
bound terminating at the inner and outer repulsive walls of the potential barrier, respectively, and (d) bound
bound to the
.
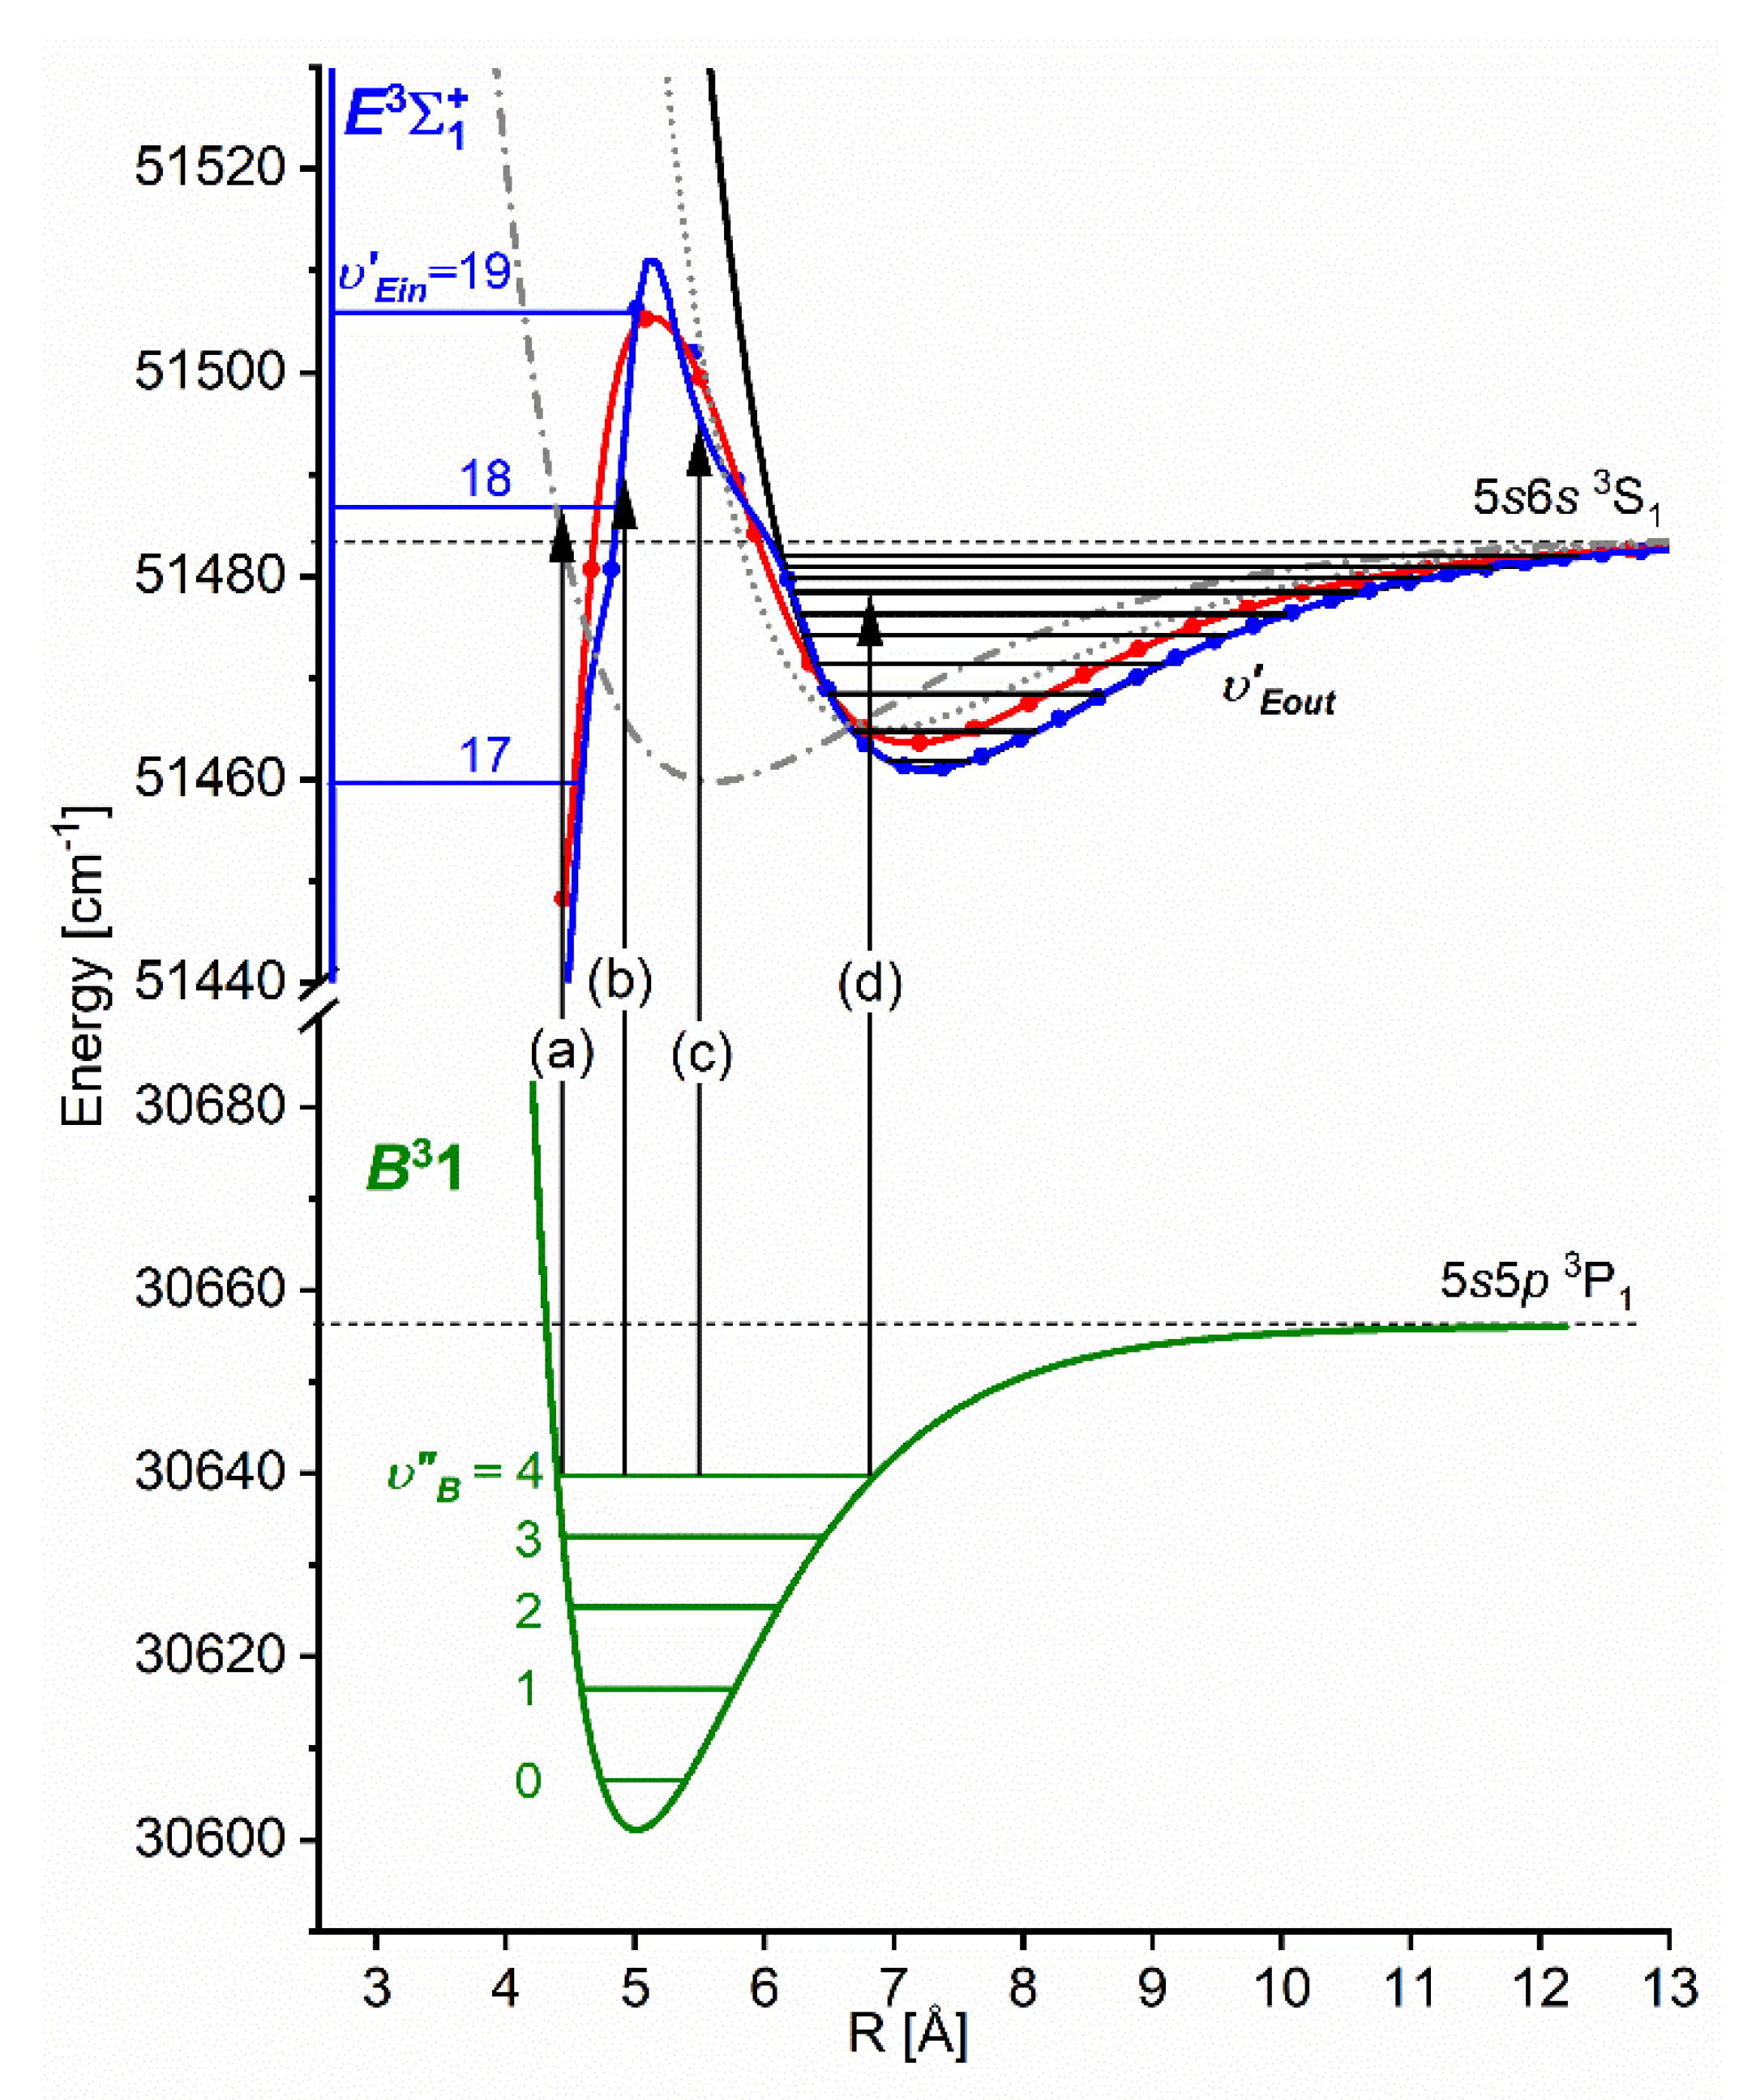
5.3. Perspectives: bound → free Emission after OODR excitation of CdAr (and ZnAr) Rydberg State—Characterization Of Lower Lying ‘Dark’ States Or States Inaccessible In Direct Excitation From The Ground State
Higher-lying, Rydberg, electronic energy state can be exploited, after its excitation, as a source of emission to lower-lying states that: (1) due to the selection rules in excitation cannot be excited from the ground state (consequently called ‘dark’ states) or (2) due to their relative position, certain parts of their PECs can be probed only in emission (not in excitation).
Figure 24 shows a number of electronic energy states of CdAr lying below the
Rydberg state, therefore, after excitation of a selected
-state
level, corresponding number of emission channels occurs and the emission terminates on those states giving rise to bound
→free or bound
→bound transitions, depending where the emission terminates, on the repulsive or bound part of the respective molecular potential, respectively. The analysis of the dispersed emission spectra (recorded with spectrometer or monochromator) allows to determine the shape of the potential on which the emission terminated.
The approach presented above for the
Rydberg state in CdAr as a source of multichannel emission after OODR process down to the ‘dark’ electronic states has also been demonstrated for the
Rydberg state in ZnAr [
203]. More versatile study, i.e. simulations supported by experiment, has been performed for the
Rydberg state of HgAr by Duval et al. [
24].
Figure 24.
(a)
Ab-initio calculated interatomic potentials of CdAr electronic energy states [
4] used to illustrate OODR process of excitation of the
from the
via the
(vertical solid arrows) followed by emission to several lower-lying molecular states allowing characterization of their potentials using bound
→free and bound
→bound transitions. (b) Examples of simulation of dispersed emission spectra [
206], [
207], [
209] with bound
→free (b
→f) and bound
→bound (b
→b) transitions from the
to the
,
and
electronic ‘dark’ states which would serve as data to determine their PECs [
203].
5.4. Improved Determination of Inner and Outer Wells of the
- StatePotential in CdKr
By 2018, the
Rydberg double-well state potential of CdKr molecule was investigated as a whole only once, in 2004 [
20]. In that study, pronounced
and
progressions to vibrational energy structure of the inner well were recorded using the
and
transitions, respectively. Also,
progression to the outer well and fraction of free
bound (
) transitions to the repulsive wall of the potential barrier were recorded using the
transition. Analysis of the experimental spectra allowed for limited characterization of the inner and outer
- state potential wells. Both potential wells were individually represented with a corresponding Morse function stating at the same time that Morse representations are not adequate close to the dissociation limit or the potential barrier.
In the next study, the
vibrational band has been recorded and simulated focusing on its isotopic and rotational structures [
16]. Simulation of the band [
207] allowed to perform a limited rotational characterization by determination of respective rotational constants (see
Table 1).
In 2019, very thorough and as complete as possible investigation of the CdKr inner
and outer
potential wells has been conducted performing a series of experiments in a relatively large spectral region by recording LIF excitation spectra that probed vibrational and isotopic structures of both
and
in different ranges of
and
, respectively [
19]. Both, the
and
intermediate states were used in OODR process (see the
[
215] and (b)
[
216] transitions used in OODR first-step excitation –
Figure 25) and the following transitions were recorded:
- -
to the inner potential well (see
Figure 26(a),(c)):
- -
to the outer potential well (see
Figure 27(a)-(d)):
Figure 25.
LIF excitation spectra recorded using the (a)
[
215] and (b)
[
216] transitions in CdKr, both being first-steps of the excitation in OODR processes:
and
that allowed to investigate the inner
and outer
potential wells. Arrows show the
and
that were used as origins for the second-step OODR transition. Asterisk depicts the
vibrational band recorded with higher resolution (see
Figure 29) and used, among others, in isotopologues selection experiment (see
Section 5.4). Note: irregular i.e., non-Morse behaviour of
levels is due to double-well character of the
- state potential [
216].
[
215] and (b)
[
216] transitions in CdKr, both being first-steps of the excitation in OODR processes:
and
that allowed to investigate the inner
and outer
potential wells. Arrows show the
and
that were used as origins for the second-step OODR transition. Asterisk depicts the
vibrational band recorded with higher resolution (see
Figure 29) and used, among others, in isotopologues selection experiment (see
Section 5.4). Note: irregular i.e., non-Morse behaviour of
levels is due to double-well character of the
- state potential [
216].
Figure 26(a),(c) presents LIF excitation spectra recorded using transitions terminating at the energy structure of
levels probed from both, the
and
intermediate levels, respectively, this way extending accessibility of the excitation to all
levels (from 0 to 28) supported by the
well. Before simulation of both spectra, it was concluded that the
well characterizes itself with a distinct non- Morse behaviour close to the dissociation limit. As can be seen in
Figure 26(e), B-S plot reveals non-linear component for
that prevent representation of the
well with a Morse function. Therefore, to solve the problem, with finding a proper representation for the
, IPA methodology [
208] was employed. This approach allowed to arrive at simulations, presented in
Figure 26(b),(d), that reconstruct both spectra satisfactorily as far as positions of the components in
and
progressions are concerned, including their partly resolved isotopic structure for high
. As for the
and
transitions in CdKr, in the simulations only FC-F factors were taken into account concluding with relatively good agreement between simulated and recorded intensities of vibrational components including their isotopic structure.
Figure 26.
Experimental LIF excitation spectra terminating at the vibrational energy structure of the
- state inner potential well in CdKr, recorded using (a)
and (c)
transitions, with intensities of the spectrum in (a) normalized due to large spectral region in which the total spectrum for
was recorded, (different dye lasers used and carrier gas pressures were applied). (b) Simulation of positions only and (d) simulation of positions and intensities performed assuming the
potential representation as the result of IPA method using (b) LEVEL [
206] and (d) LEVEL and PGOPHER [
207] programs, assuming (d)
and
. (e) B-S plot for the
(full squares) and
(empty squares) progressions showing distinct nonlinearity for
. Size of points in the plot equals error bars for
.
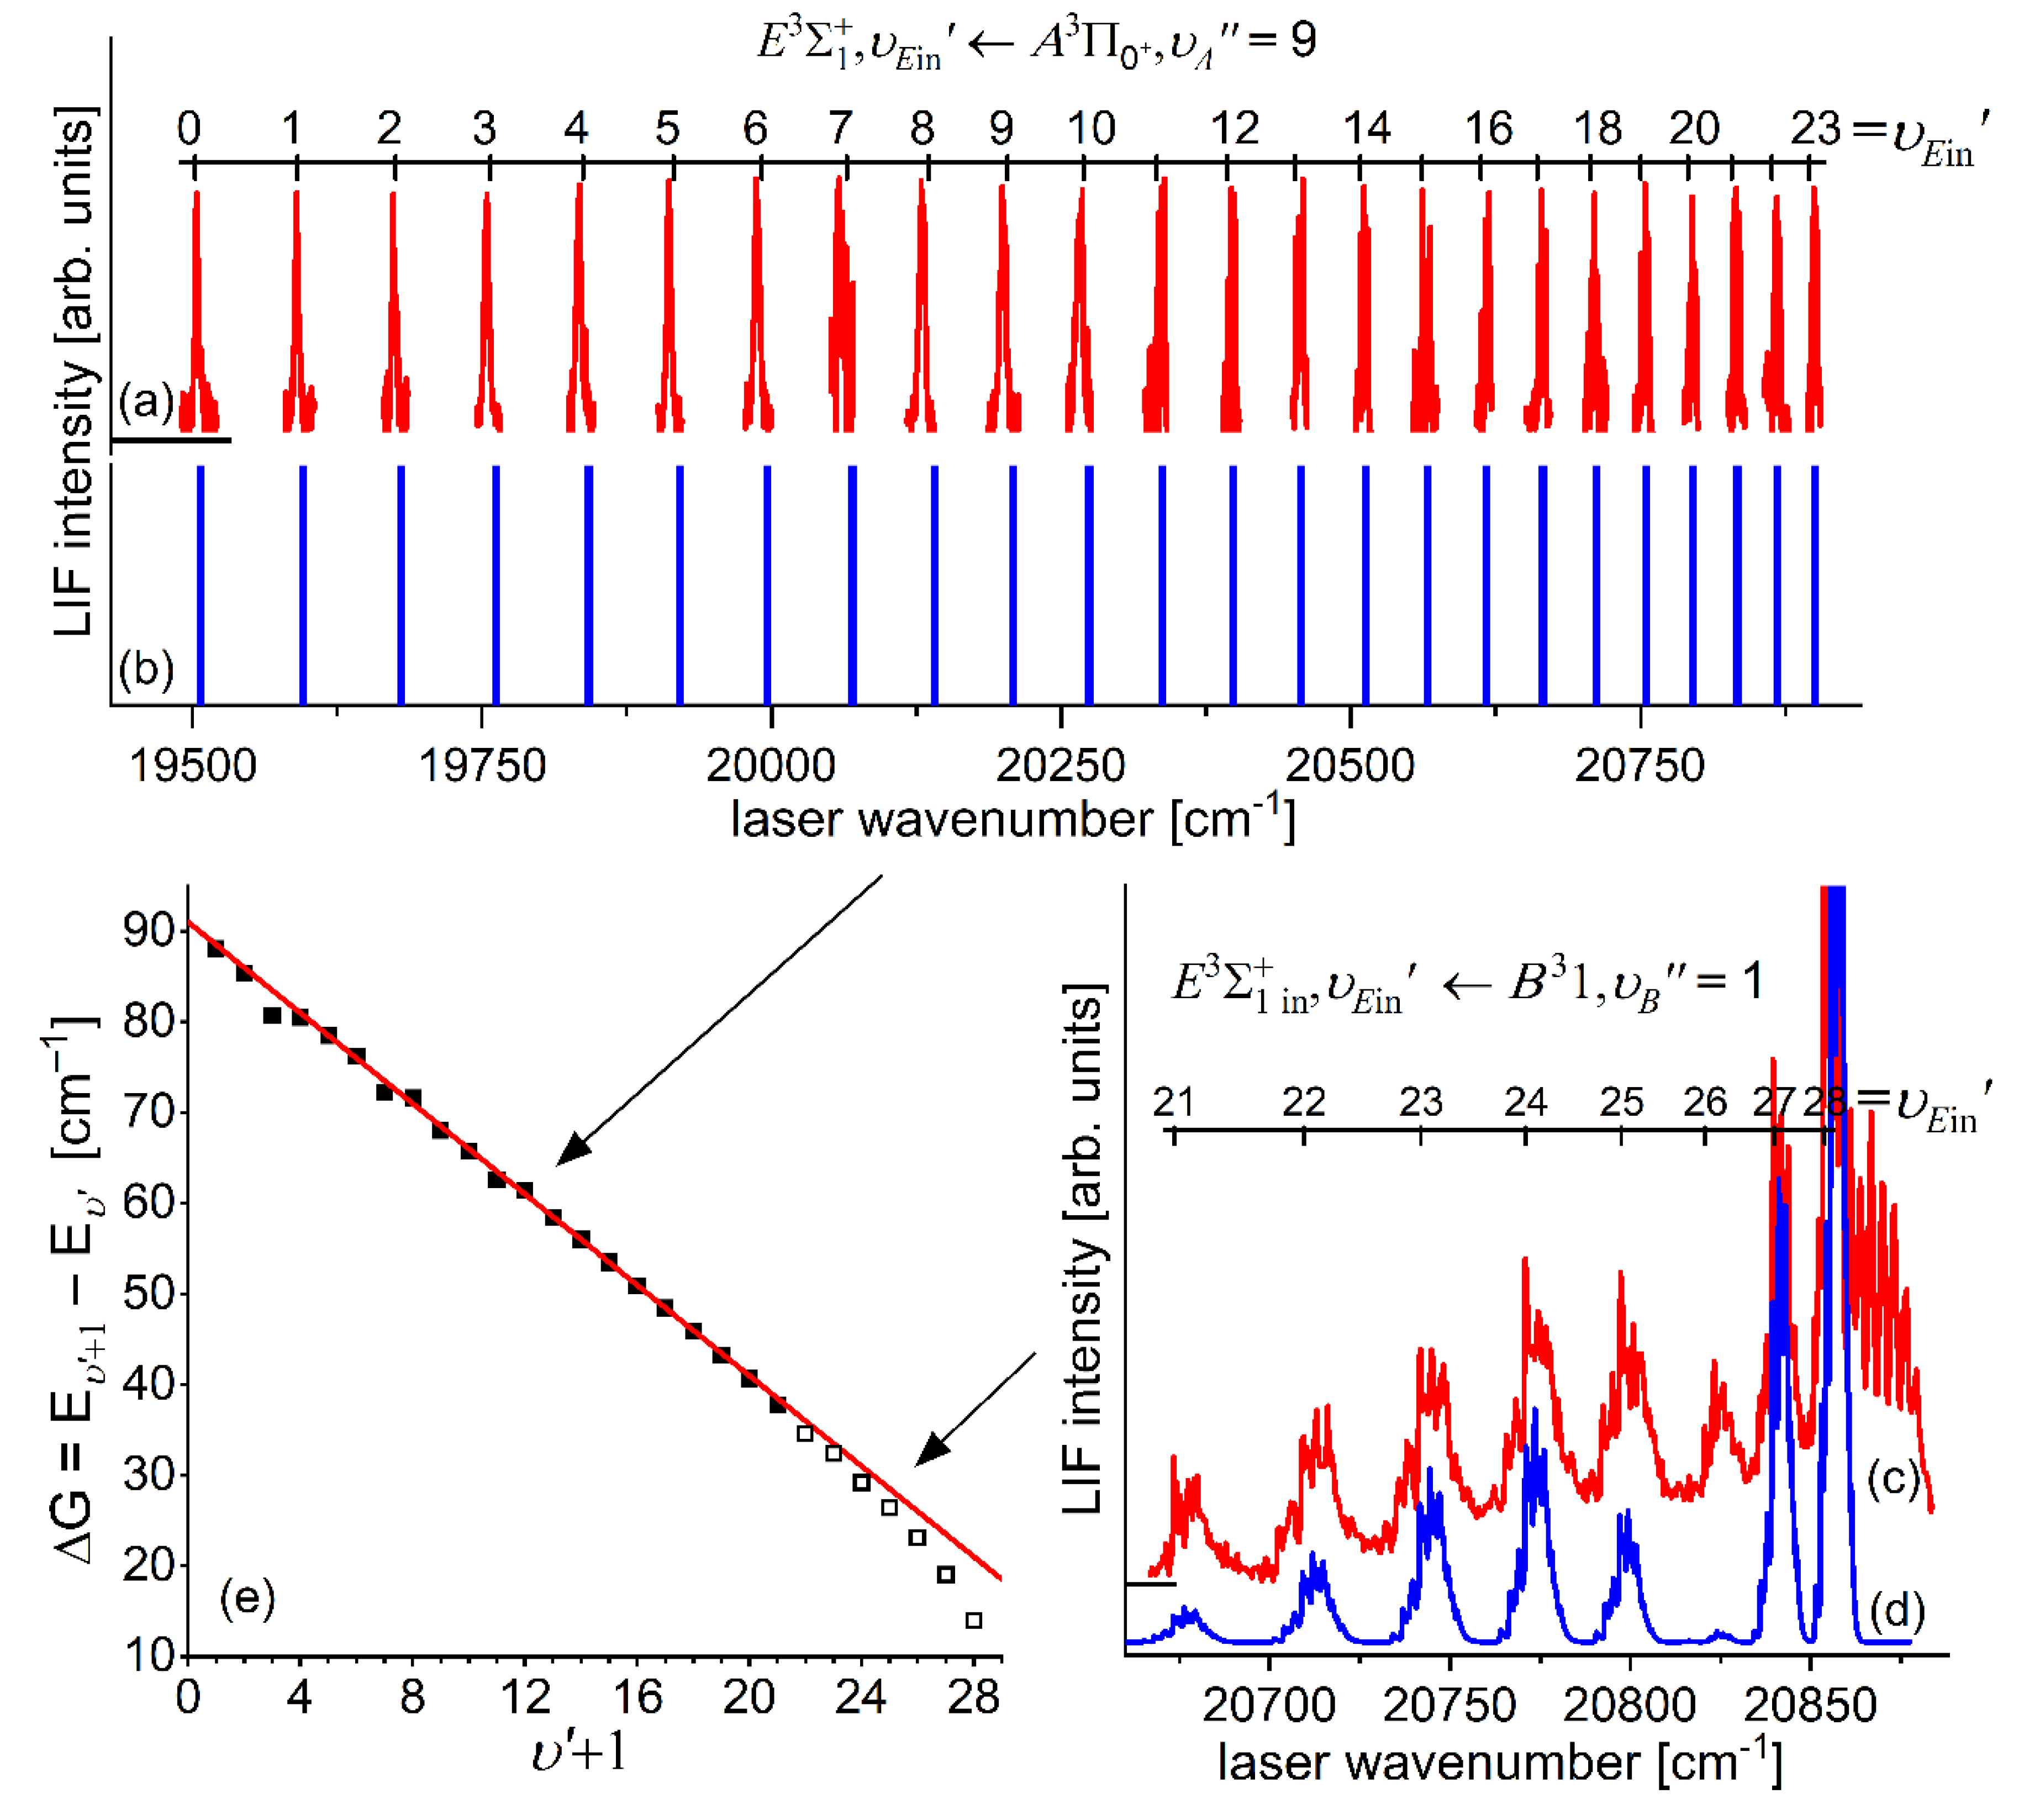
The
- state outer well was probed using LIF excitation spectra recorded using the
,6 second-step transitions of OODR process (note that in the first study [
20] only one
progression was recorded with poor spectral resolution). The spectra are shown in
Figure 27(a)-(d). As can be easily concluded,
progressions of the
transition overlaps with
progressions of the
transition which makes the analysis more difficult. However, two separate simulations for each
with assumed representations of the
and
potential wells as these derived from IPA methodology (for
representation derived from spectrum shown in
Figure 26 was used), and
- state representation from Ref. [
216]) revealed satisfactory reconstruction of the recorded spectra. It is important to notice that the simulations were performed without TDM function for the transition, and intensities of vibrational components were assumed to have arbitrary values. Additionally, as the
- state potential also possesses a double-well structure (which was concluded from
ab initio calculation [
40] and experimental studies [
216]), small change in its shape would have a significant impact on the shape of
- level wavefunctions and consequently, on intensities of
and
transitions.
Figure 28 presents representation of the
Rydberg state potential in CdKr that was derived from the LIF excitation spectra of the
and
transitions (see
Figure 26(a),(c)), and the
transition (see
Figure 27(d)) using IPA methodology. The approach was justified by a nonlinearity of B-S plots that were constructed for
(
Figure 26(e)) and
(
Figure 27(e)) vibrational energy structures supported by
- state inner and outer potential wells, respectively, and immediate conclusion that neither inner nor outer well cannot be represented by a Morse function. IPA representation is compared with two results of
ab initio calculations: that of 2008 [
39], [
40] and most recent [
217] showing their disagreement with the experimental result calling for additional studies using both, calculational and experimental approaches (note: most recent
ab initio result shows noticeable improvement as compared to the earlier one).
Figure 27.
LIF excitation spectra (red traces) terminating at the
vibrational energy structure of the
- state outer well and most upper-lying
levels of the
- state inner well in CdKr, recorded using the
and
, respectively starting at (a)
, (b)
,
, and
. Simulations of the
and
spectra (blue and grey traces, respectively) performed using LEVEL [
206] and PGOPHER [
207] programs in which
,
and
- state representations were taken from Refs. [
19] and [
216], and
and
were assumed. (e) B-S plot drawn for the
potential well in CdKr based on the
transition shown in (d) in which strong nonlinearity is present, and two regions, A (
) and B (
), each of linear behaviour, can be extracted.
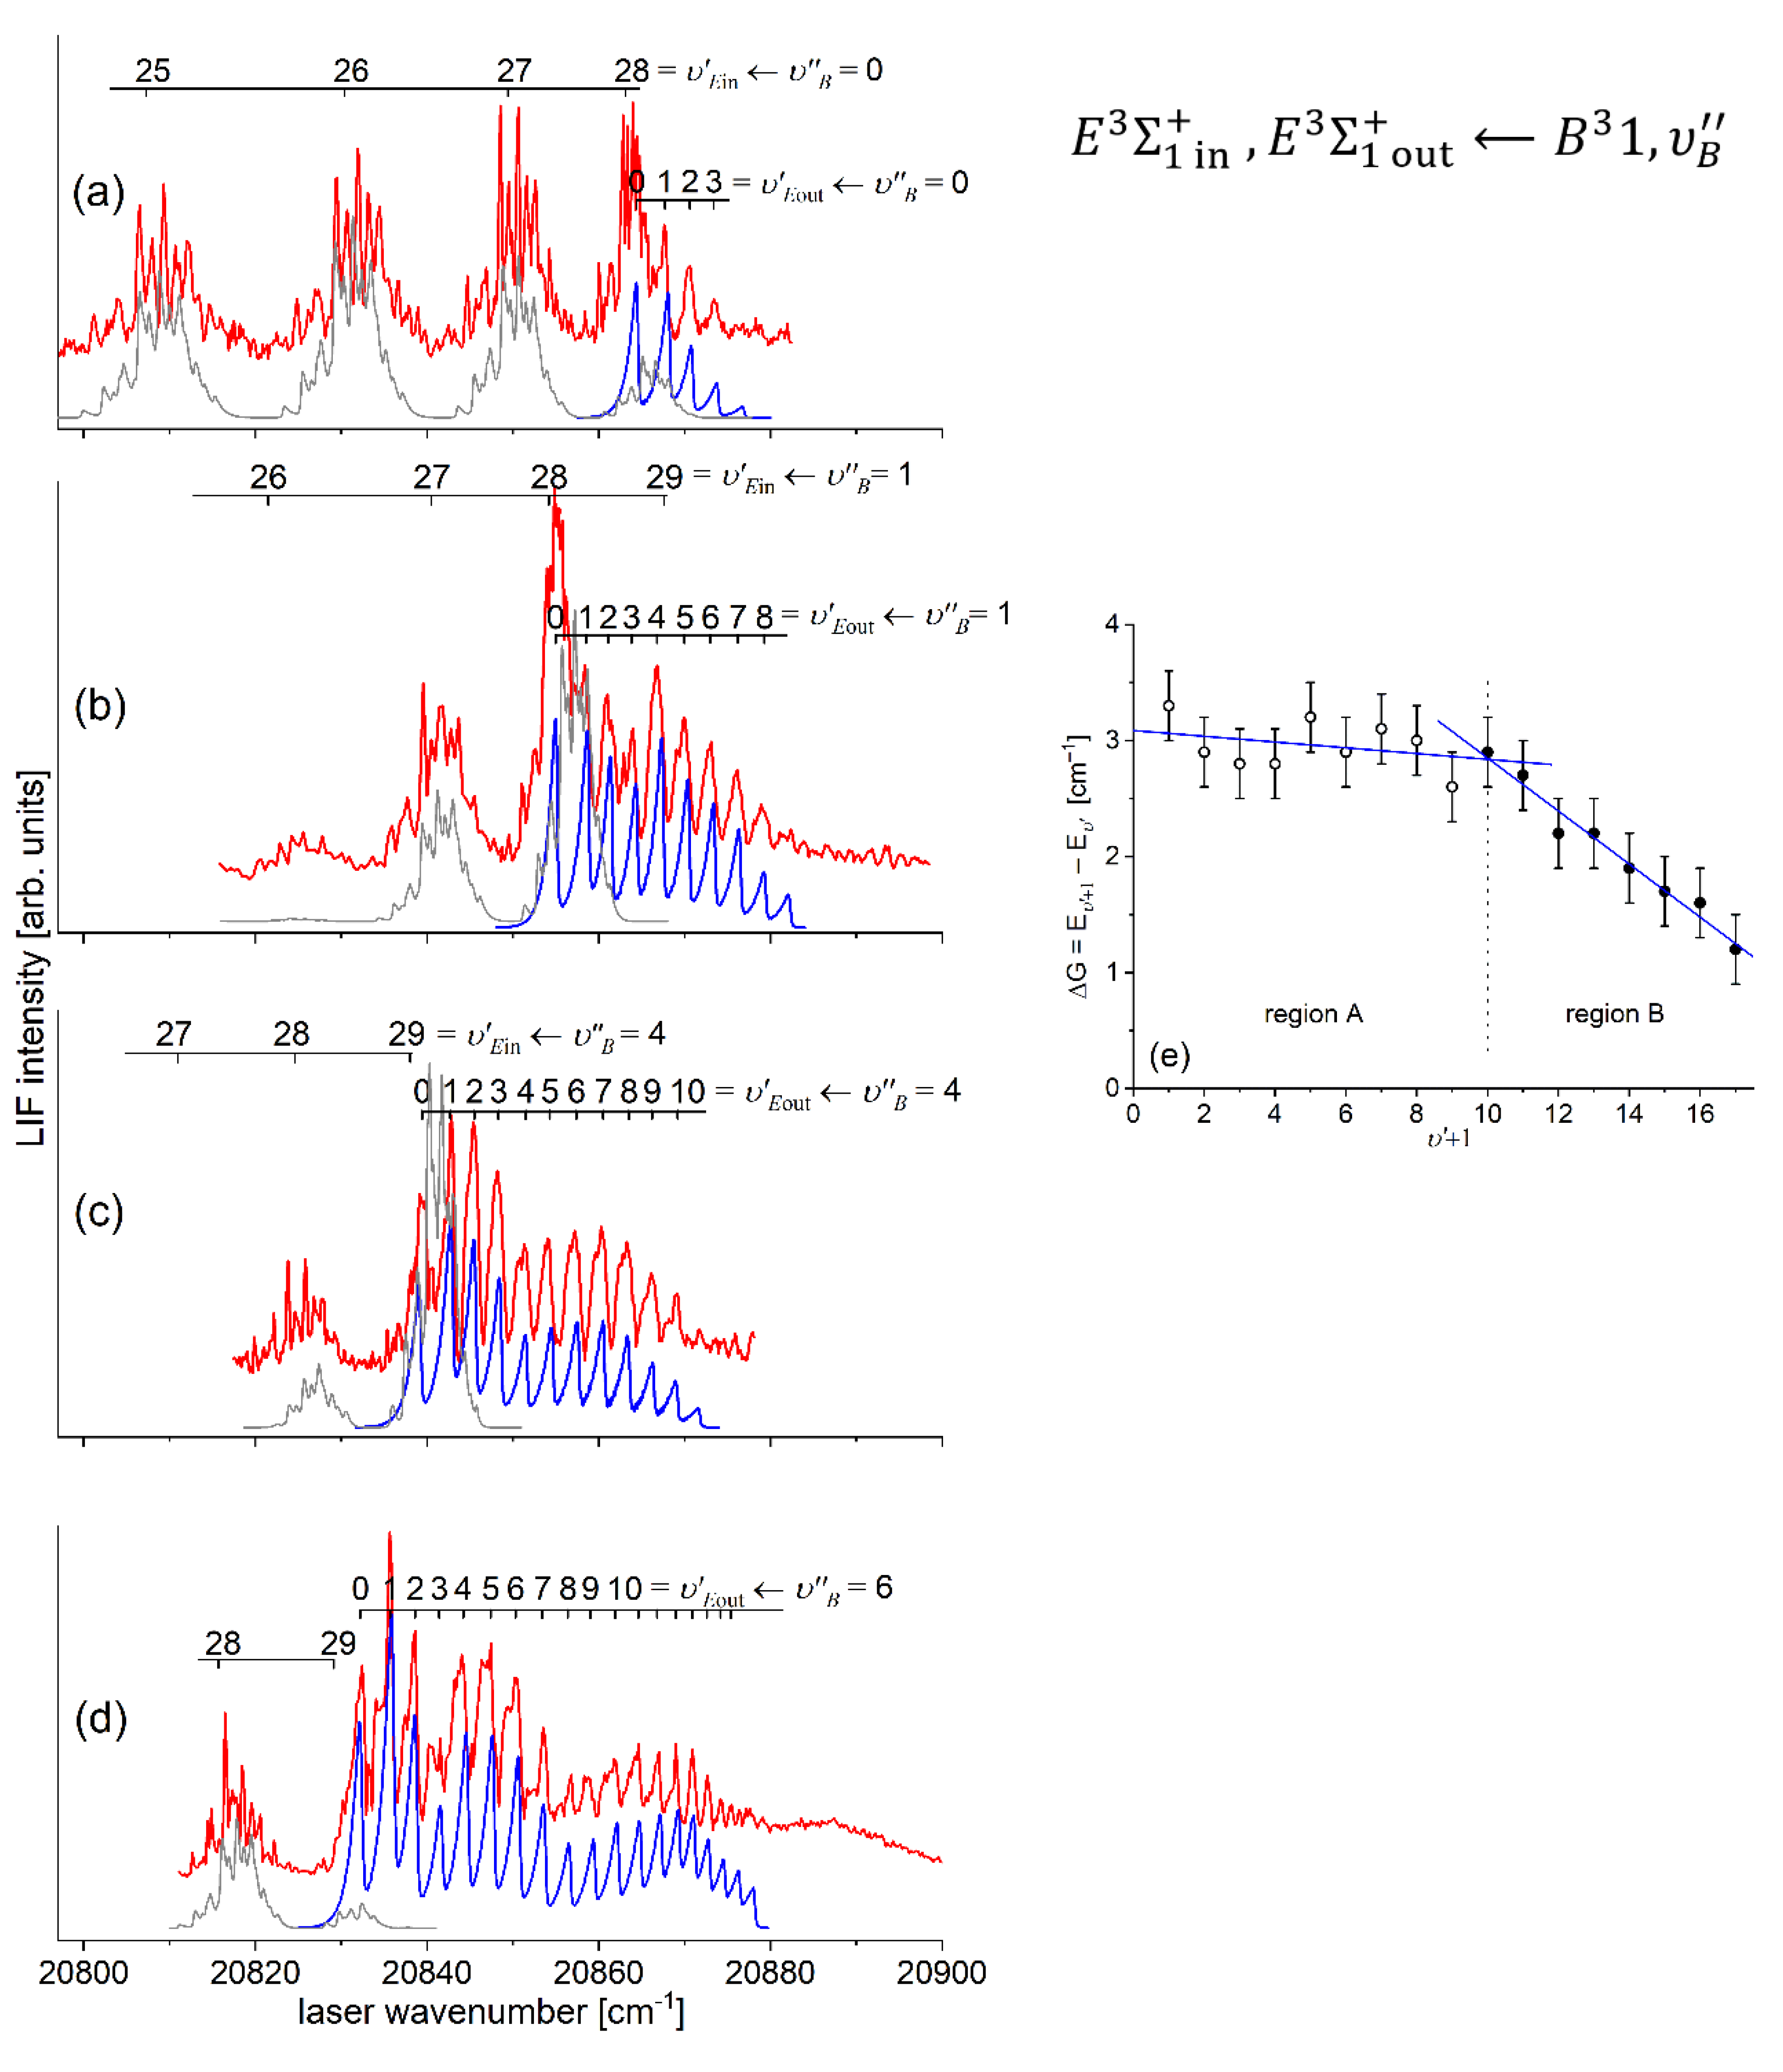
Figure 28.
Representations of the
Rydberg state potential of CdKr with inset showing details of the potential barrier and outer potential well close to the dissociation limit.
(red line and circles) and
(red line and squares) potential wells representations as results of IPA methodology and analysis of spectra in
Figure 26(a),(c) and
Figure 27(d), respectively. Morse representation of the
being the result of B-S plot analysis in
Figure 26(e) is also presented (blue solid line). The experimentally determined representations are compared with two results of
ab initio calculations showing their considerable difference: that of 2008 performed by Krośnicki and collaborators [
39], [
40] (black line and empty circles) and most recent performed by Krośnicki et al. [
217] (black line and full circles). Estimated height of the potential barrier
is shown with red horizontal line. For comparison, also result of the first experimental study is included [
20] (grey solid lines). Ranges of
and
excited from the
and analysed [
19] are shown (grey rectangles).
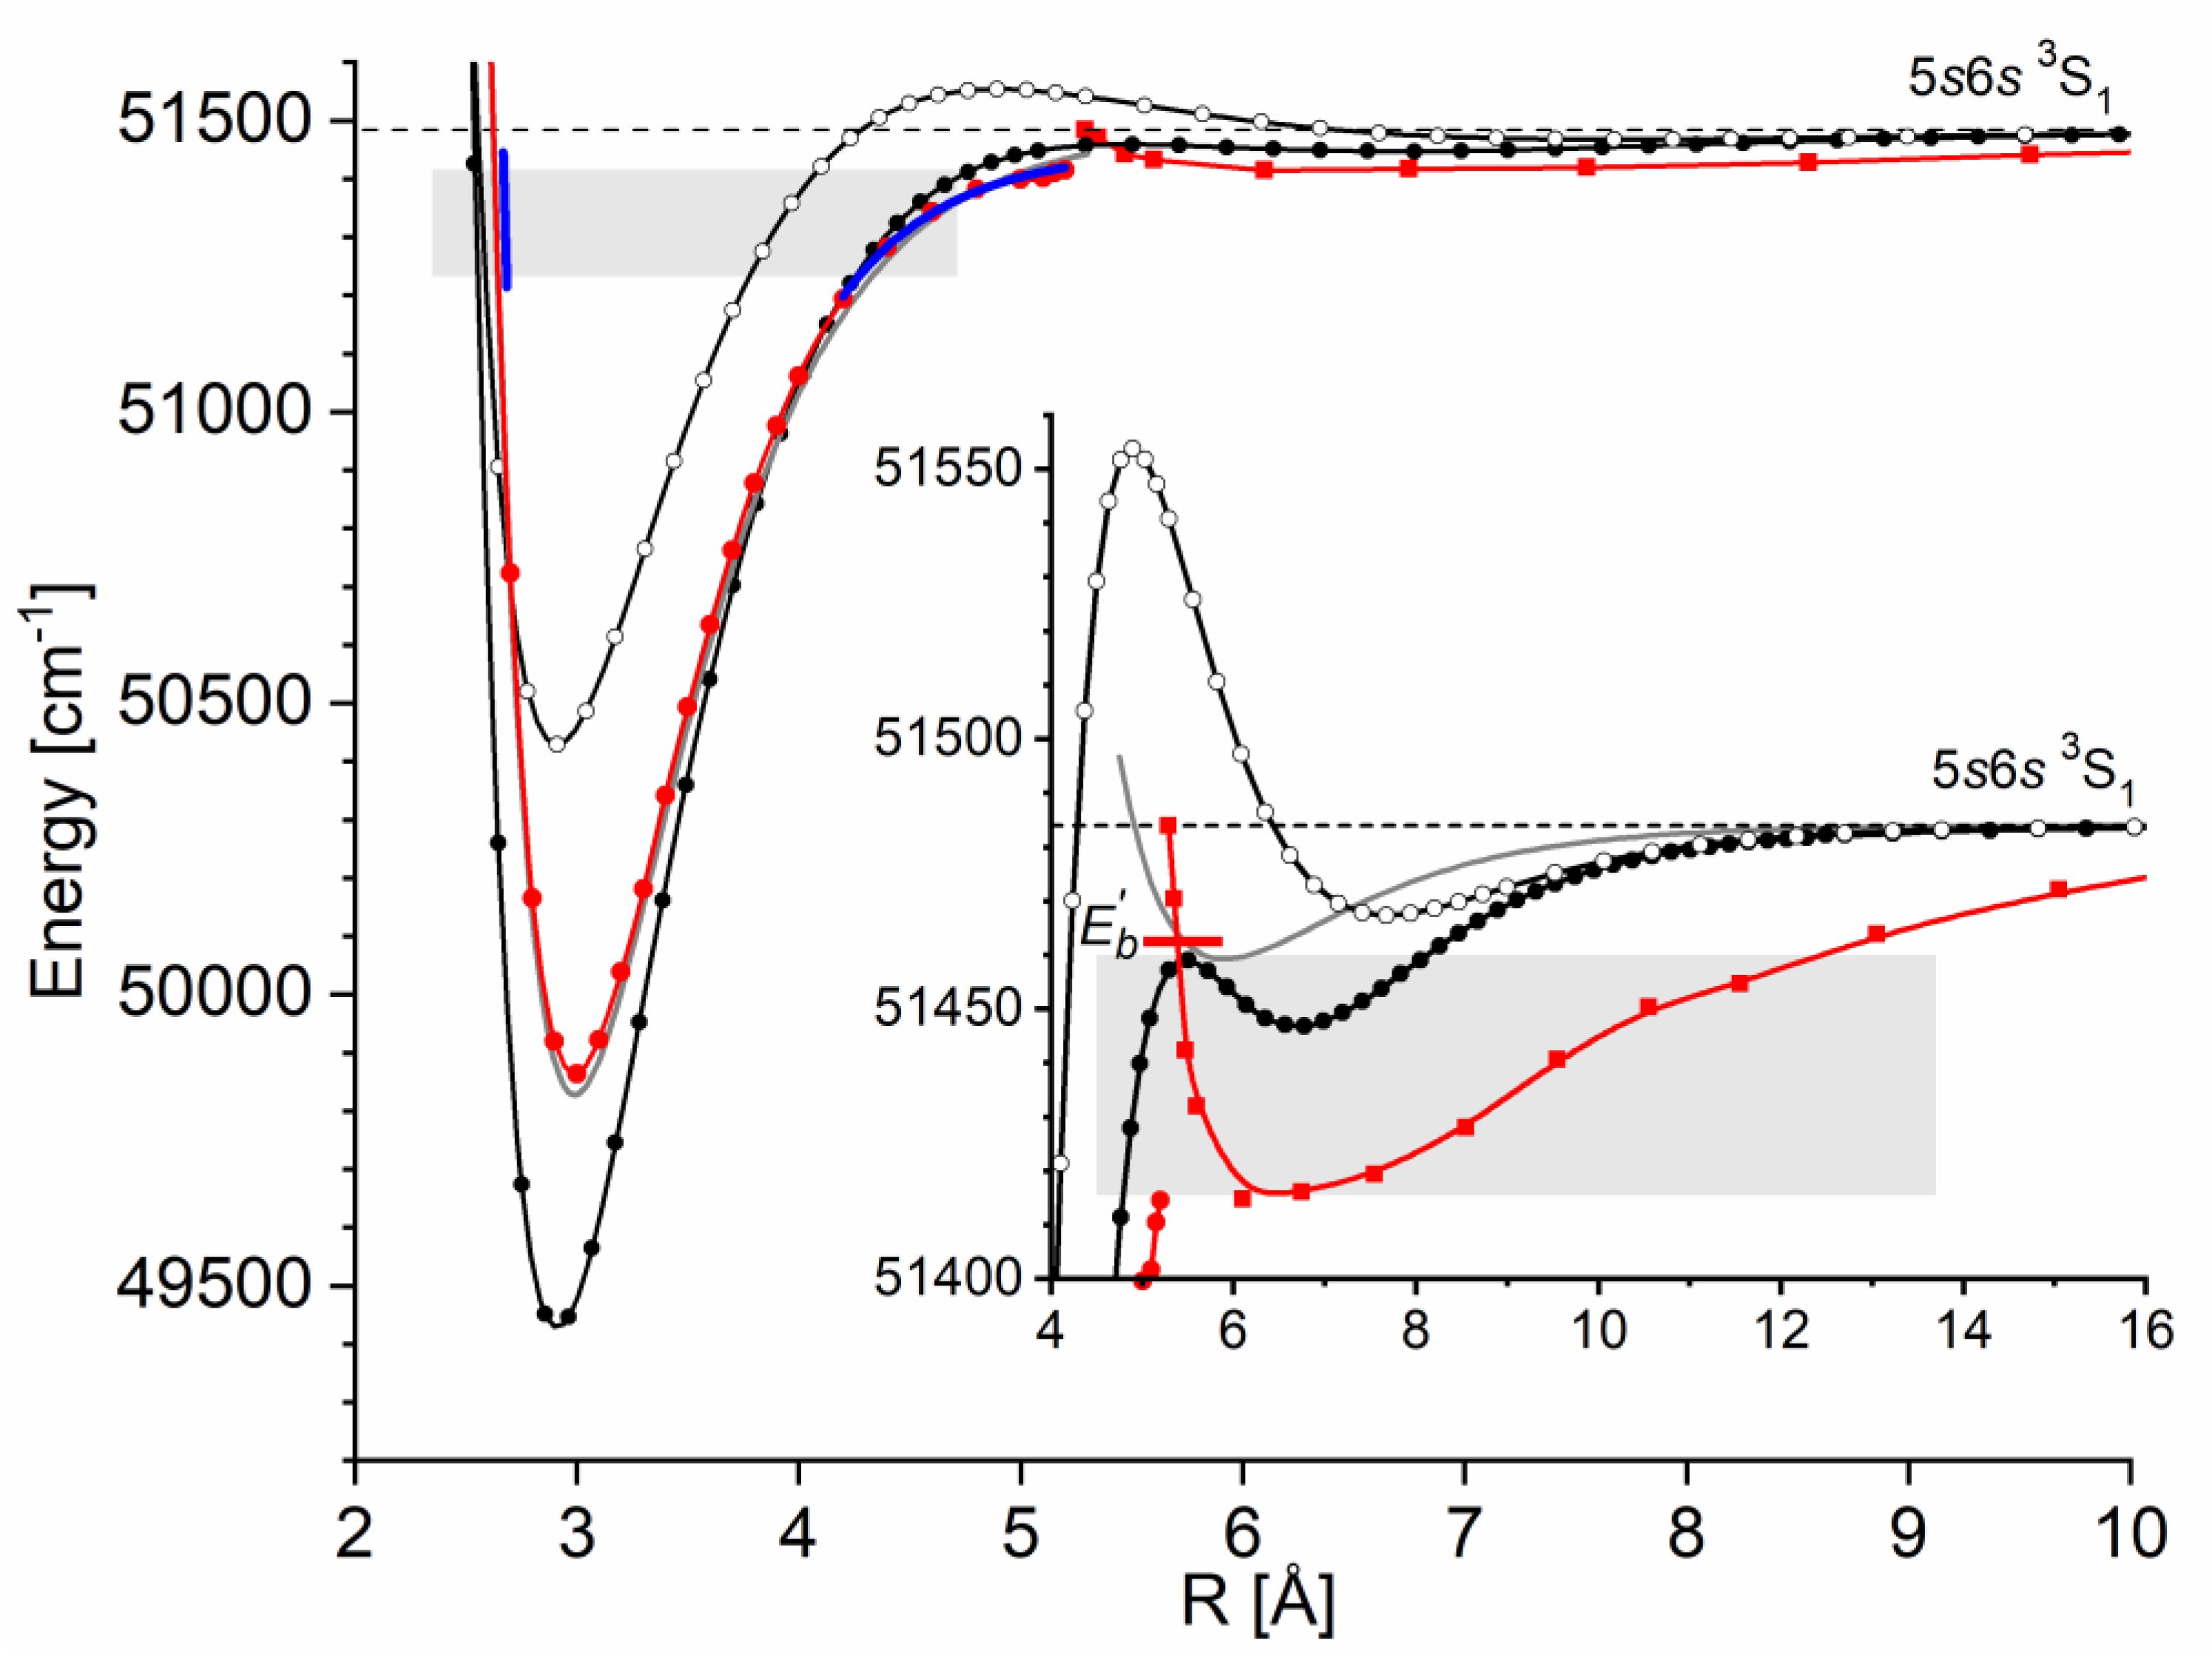
Special attention has to be paid on all three aspects of the problem: depth of two potential wells and height of the potential barrier. As can be seen in
Figure 28, experimentally determined depth of the inner well [
19] falls between both
ab initio results whereas depth of the outer well is significantly larger than both
ab-initio calculated. The comparison is supplemented with the first experimental result [
20] which for the inner well is close to the IPA potential (Table 3 in Ref. [
19]) but for the outer well not surprisingly departs largely from that obtained using IPA method (Table 5 in Ref. [
19]) as obtained from a smaller data set as argued above (for detailed spectroscopic data see
Table 1). Unfortunately, from the recorded spectra it was not possible to conclude either the shape of the
- state potential near the barrier nor the shape of barrier itself. However, the highest
observed in the
spectrum possesses the energy that is 3
above the top of the barrier that has been recently
ab-initio calculated [
217]. This suggests that the actual height of the barrier is somewhat larger. This can be additionally supported by the presence of a broad band (see
Figure 27(d)) spanning over approx. 20
(i.e. between 51462
and 51483
with respect to
- state dissociation energy) that has been interpreted based on the hypothesis of unresolved
vibrational transitions supported by the
- state potential above the barrier and below the dissociation limit correlating with the
Cd asymptote.
5.5. Practical Method for Isotopologue Selection Using OODR - Case of CdKr and CdAr
In general, the isotopologue-selective excitation could be possible providing the isotopic shift in chosen vibrational components is sufficiently large. It has been demonstrated with a proper choice of a wavenumber of the laser with sufficiently narrow spectral bandwidth in OODR first-step excitation which can lead to a isotopologue-selective excitation in the intermediate state. Thanks to this approach, selected isotopologues could be excited contributing subsequently to intensity of LIF signal originating from the final state after OODR second-step excitation.
In
Section 5.2.1 the isotopologue selection in excitation has been suggested in case of the
first-step OODR transition in CdAr where only two isotopologues,
and
, were excited with the former predominating (see
Figure 17(B)). Then, result of the isotopologues selection has been demonstrated in the subsequent
second-step OODR transitions (see
Figure 17(A)) showing possibility of increasing resolution of rotational structures in the recorded spectra due to limited number of isotopologues excited. Note: CdAr possesses 6 out of 24
isotopologues with considerable abundance
, i.e.
(and
are Cd and Ar mass numbers, respectively).
The isotopologue selection in the excitation has also been convincingly demonstrated for CdKr using the
first- and, subsequent,
second-step OODR transitions.
Figure 29(A) presents the
profile with considerably large isotopic shift (the shift increases with increasing
) between
isotopologues. From
Figure 29(A) is evident that the possibility of excitation of selected isotopologues is most favourable for
for which sole
can be excited (see position-1 in
Figure 29(A)). However, as in the experiment natural abundances of Cd and Kr were used, abundance of
in molecular beam is relatively small, i.e.
that resulted in small signal-to-noise ratio (SNR) (see
Figure 29(B)). SNR is much better for other positions of
. This is the case with
, in position-2, for which
and small admixture of
are excited, or for
, in position-4, for which excitation of most abundant
with relatively very small admixtures of four other isotopologues. Note: CdKr possesses 22 out of 48 isotopologues with considerable abundance
(i.e.
).
Simplification of LIF excitation spectra by reducing number of excited isotopologues allows to partly resolve their rotational structure and facilitates their simulation. In some cases, such as discussed here, for vibrational components recorded at the
second-step OODR transitions it would be difficult (or even impossible) to achieve partial resolution of rotational structure without applying the proposed approach. Using sufficiently narrow spectral bandwidth laser in the first-step excitation has also an impact on the distribution of the populations of the excited
intermediate-state rotational levels. In other words, if OODR first-step excitation laser
is sufficiently spectrally narrow, only a selected group of rotational levels
(from
to
) in
level is populated. It is evident that by narrowing the
spectral bandwidth, one can restrict the range of
in the intermediate state without manipulating of
. Consequently, also LIF excitation spectrum originated as the result of the
transition contains contribution only from the selected range of
. Illustration of the problem is presented in
Figure 29(C) where profiles of LIF excitation spectra recorded using the
transitions in
with small admixture of
(see
Figure 29(A):
in position-2). Simulations of the profiles were performed with assumption of strictly specified
and ranges of excited
from
to
(see figure caption).
It is evident that due to the isotopic shift between different isotopologues of the investigated CdNg molecules, even for relatively rich isotopic composition, by employing laser with sufficiently small spectral bandwidth is possible to select one or few isotopologues in OODR first-step excitation. Limiting number of isotopologues participating in the LIF signal as the result of OODR second-step excitation leads to simplification of the recorded spectra originating from considerably dense rotational energy structure allowing to partly resolve and simulate rotational profiles.
Figure 29.
(A): (a) Profile of LIF excitation spectrum recorded using the
transition in CdKr. (b) Total simulation of the profile performed using PGOPHER [
207] program, assuming
and
as well as
and
rotational constants, and transition energies calculated using LEVEL [
206] program for the
[
16] and
- state [
215] potential characteristics. (c) Individual contributions to (b) that originate from different
isotopologues with abundances larger than 1%. (d) Positions of
laser wavenumber of OODR first-step excitation used in (B); examples of
are represented with blue vertical dashed lines and rectangles. (B): Profiles of LIF excitation spectra recorded using the
OODR second-step transition for different
depicted in (A)-(d), i.e. for different combinations of
isotopologues excited. For simulation shown with black line (in position-2) refer to (C). (C): (a) Profiles of LIF excitation spectra recorded using the
transitions in
(with small admixture of
) – excitation in position-2:
shown in (A). (b) Simulations performed using PGOPHER [
207] program, assuming
,
(for
),
), and
, as well as
and
rotational constants, and transition energies calculated using LEVEL [
206] program for the
[
16] and
- state [
16] potential characteristics,. (c) Simulated distributions of P-, Q- and R-branch components depicted with colour code as in part for
. Intensity of Q-branch is damped as concluded in Ref. [
10].
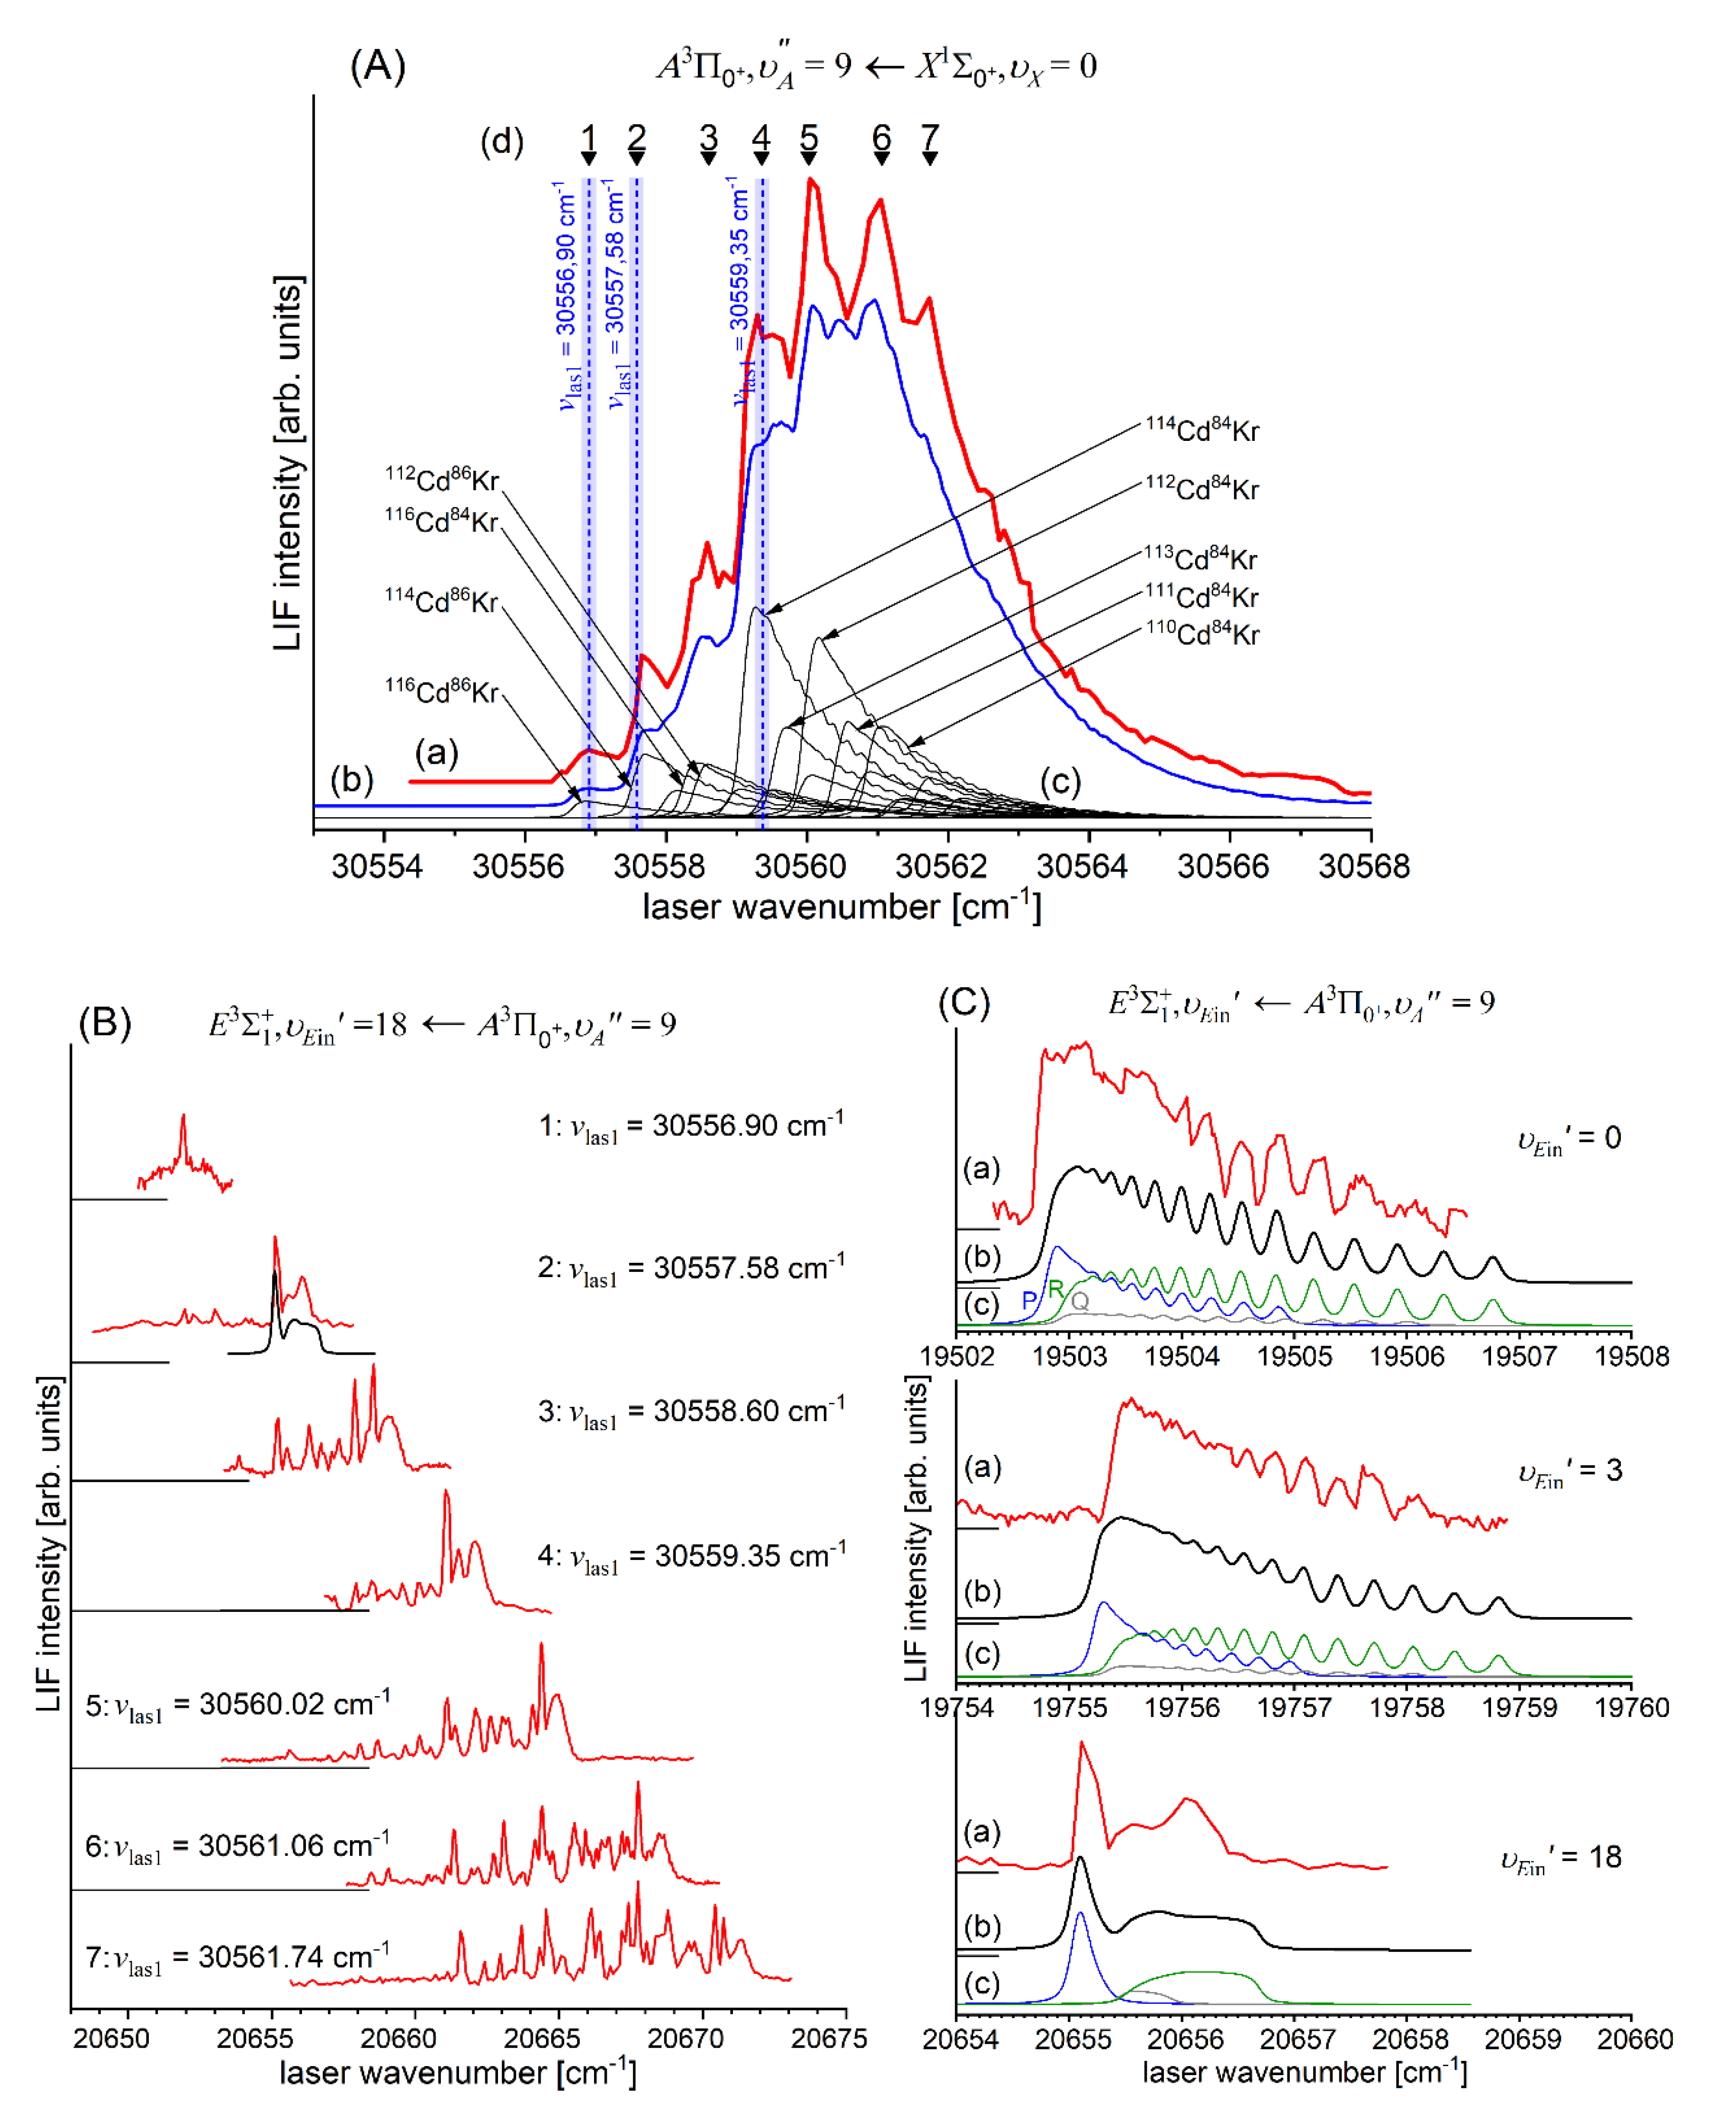
6. Particular spectroscopic Applications of Rydberg Double-Well Electronic Energy States In Diatomic Molecules
A number of current spectroscopic applications of the results related to knowledge on potentials of the higher-excited (Rydberg) electronic energy states of homo- and heteroatomic molecules has been reviewed in
Section 2. Here, the review is concluded with two interesting applications that employ HgAr vdW molecule in supersonic beams. The reason the HgAr is being mostly used in such demonstrations, is a relative ease of production of Hg carried with Ar in a supersonic expansion (Hg temperature and Ar pressure corresponding to 400 K and 1-3 bar, respectively) that, in effect, constitutes an efficient source of ro-vibrationally cold HgAr mostly in
ground-state levels.
6.1. Spectroscopy of ‘dark’ state of HgAr
A very interesting application has been presented by Amano and coworkers [
25] and aimed at spectroscopy of so-called ‘dark’ state (see
Figure 30, notation of molecular states after Ref. [
25]). That was first observation of the
state of HgAr that after excitation from the
ground state does not emit back; it is caused by the fact that it correlates with the
atomic level to which the dipole transition from the
level is strictly forbidden. This property partly transfers from atomic levels to the respective molecular states:
excitation may occur but emission is supressed due to the long fluorescence lifetime. To overcome the obstacle, the authors used a sequence of the pump- and probe-laser pulses. The first, pump-laser pulse, tuned to the
progression preceded the probe-laser pulse tuned to the
transition. The knowledge on the
Rydberg double-well state that was acquired from the study of Duval and coworkers [
24], allowed to time-adjusting the pump-laser pulse, so it terminated at the outer wall of the potential barrier separating the two wells. Consequently, the molecule dissociated and the
atomic fluorescence was recorded displaying
- progression in the
‘dark’ state.
Figure 30.
(a) Scheme of the double-resonance technique for the detection of the ‘dark’ intermediate
vibrational levels of the
state in HgAr using probe-laser excitation to the potential barrier in the
Rydberg state. (b)
excitation spectrum of the HgAr vdW complex plotted against the pump wavenumber (from Ref. [
25] under permission of American Institute of Physics).
6.2. Molecular Wave-Packet Interferometry with HgAr
Molecular wave-packet interferometry demonstrated with a high-precision was reported by Ohmori and coworkers [
218]. The wave packet was created in the
state of HgAr molecule using two time-delayed (
) femtosecond (300 fs) pulses with wavelength centred at 254.2 nm (see
Figure 31, notation of molecular states after Ref. [
218]). The centre wavelength of the pulses was selected so that the
vibrational eigenstates of the
state were coherently superimposed, and two molecular wave-packets were created sequentially near the outer turning point of the
- state PEC. A probe-laser nanosecond pulse was delayed by 30 ns with respect to the femtosecond pulses, tuned to the
transition, and used for LIF detection of the
- state population. Due to its spectral bandwidth the probe-laser covered a small number of rotational lines (
) with either
,
, or
vibrational bands of the
transition. It allowed to observe the interferograms (with almost 100% fringe contrast) for the populations of the
vibrational levels as a function of the
delay-time which was tuned with sub-10 ns stability and resolution.
Figure 31.
Pump-control-probe scheme for detection of the populations of the
,
vibrational levels created by a double-laser pulse from the
,
vibrational level (from Ref. [
218] under permission of The American Physical Society).
Figure 31.
Pump-control-probe scheme for detection of the populations of the
,
vibrational levels created by a double-laser pulse from the
,
vibrational level (from Ref. [
218] under permission of The American Physical Society).
7. Conclusions
Recent progress in studies of Rydberg double-well electronic energy states of 12-group CdNg (Ng=Ne, Ar, Kr) vdW molecules produced in molecular beams and investigated using techniques of laser spectroscopy such as OODR has been presented and analysed.
As a representative illustration we quote the progress that has been made to the present [
10], [12-15], [
19], [
203] as well as other supplementing results representing the most interesting advances in the
Rydberg state characterization in CdNg molecules showing a real added value to the review:
- -
ab-initio analysis of formation of the outer well and the energy barrier in the
state of MeNg molecules presented in
Section 1;
- -
newly recorded experimental spectra, e.g. presented in
Figure 11 (
transition in CdNe) and
Figure 22 (
transition in CdAr);
- -
-
new simulations of rotational profiles, e.g. presented in
Figure 11 (
transition in CdNe),
Figure 17 (
transition in CdAr), and
Figure 29 (
transitions in
);
new analyses of experimental spectra, e.g. presented in
Figure 19 (
transitions in CdAr) and
Figure 20 (
transitions in CdAr);
- -
preliminary study of dispersed emission spectra recorded using the
transitions in CdAr and their simulations presented in
Figure 32 below.
Several examples of recent achievements and interesting approaches for rotational characterization, therefore, direct bond-length determination in both potential wells, improved determination of potential representations for inner and outer potential wells, and the barrier that separates them have been described. It allowed determination of the complete Rydberg-state potential energy curves using recorded freebound and boundbound excitation spectra.
Concept of so-called agreement plot and agreement parameter employed for more comprehensive vibrational characterization of the energy structure supported by electronic energy state as well as for determination of the molecular bond length from modelling od distributions of F-C factors in excitation spectra have also been introduced.
As a practical approach, method for isotopologue selection for rich isotopic and spectroscopically dense molecular energy structure using OODR has been demonstrated as useful method for considerable simplification of vibrational and rotational analyses.
Bound→free and bound→bound dispersed emission spectra after OODR excitation of selected Rydberg state has been presented via simulation as a perspective for characterization of lower lying ‘dark’ states or other electronic energy states inaccessible in a direct excitation from the ground state.
The presentation and analyses have been performed in a broader context of Rydberg states of MeNg and Me2 diatomic molecules which interatomic potentials possess complex (for example double-well) structure and including variety of spectroscopic methods of their investigations such as laser vaporization-optical resonance and pump-and-probe methods or polarization labelling spectroscopy.
Importance of current state-of-the-art applications of Rydberg states with irregular potentials in photoassociation, vibrational and rotational cooling, molecular clocks, frequency standards or molecular wave-packet interferometry has been emphasized.
All spectroscopic characteristics of the
Rydberg state in CdNe, CdAr and CdKr determined in presented studies of these molecules performed in the Authors’ laboratory are collected in
Table 1 where they are compared with experimental results of other studies and with results of
ab initio calculations; suggestions for recommended values are also shown.
Tentative estimates of the errors of
ab initio values of the
- state inner potential well characteristics are shown in
Table 1. Errors are extrapolated from the analyses presented in Ref. [
3] for the two dominating sources of errors, i.e. incompleteness of the basis sets and deficiency in description of the electron correlation. The latter factor appears to be the main source of errors. The errors due to remaining factors were estimated by the magnitude of error due to deficiency in description of the electron correlation. Estimation of the errors of the characteristics of energy barrier and outer potential well needs further analysis that goes beyond the scope of this review. Similarly, the estimates of errors of the results of
ab initio calculations performed for CdKr and presented in Ref. [
217] need further analysis.
Considering future research plans on CdNg molecules, one has to postulate new ab initio calculations related to interatomic potentials of low-lying, non-Rydberg electronic energy states. It has been indicated that deficiencies in the description of the electron correlation could be main source of the inaccuracies of ab initio calculations of excited states of MeNg molecules. Also, it has been pointed out that future approaches of capturing electron correlation will most likely be based on EOM-CC methods, where the level of the approximation should go beyond the CCSD method. This would provide better theory-to-experiment agreement in the future research not only for Rydberg but also lower-lying electronic state.
As far as experimental studies are concerned, it is necessary to point out that so far they have mainly been based on the analysis of bound
bound and free
bound LIF excitation spectra. Future detection of both bound
→bound and bound
→free dispersed emission spectra can provide additional information about shape of PECs of the electronic energy states. In our laboratory we plan to carry out experiments with detection of dispersed emission spectra of CdNg molecules, spectra that correspond to transitions originating from both non-Rydberg electronic states (
,
) and low-lying Rydberg states (
.
Figure 32 presents preliminary result showing an example of the dispersed emission spectrum recorded for CdAr molecule after laser excitation of
level in the
state along with its simulation.
Figure 32.
Dispersed emission spectrum corresponding to the
transitions in CdAr molecule (a) recorded using the SpectraPro HRS 750 spectrometer (Teledyne Princeton Instruments) equipped with a CCD camera with an image intensifier (PIMAX 4) and diffraction grating with 1200 grooves/mm. (b) Simulation of the dispersed emission spectrum from (a) performed using LEVEL [
206] and PGOPHER [
207] programs and assuming parameters of the
and
- state potentials from Refs [
219] and [
14], respectively, as well as Gaussian broadening responsible for spectrometer spectral throughput
. (c) Simulation of the recorded background signal associated with the excitation laser beam at the
transition. (d) Simulated [
206], [
207] distribution of transitions to different
in the
ground state originating from
in the
state performed for
.
Disclosure statement
The authors report there are no competing interests to declare. The authors declare no conflict of interest.
Author Contributions
Conceptualization, J. Koperski; Methodology, T. Urbańczyk, A. Kędziorski, M. Krośnicki and J. Koperski; Software, T. Urbańczyk, A. Kędziorski and M. Krośnicki; Formal Analysis, T. Urbańczyk and A. Kędziorski; Investigation, T. Urbańczyk, A. Kędziorski, M. Krośnicki and J. Koperski; Data Curation, T. Urbańczyk and A. Kędziorski; Writing – Original Draft Preparation, J. Koperski, A. Kędziorski and T. Urbańczyk; Writing – Review & Editing, J. Koperski; Visualization, T. Urbańczyk and A. Kędziorski; Supervision, J. Koperski; Project Administration, J. Kperski; Funding Acquisition, J. Koperski.
Acknowledgments
This work was partly supported by the National Science Centre Poland under OPUS grants UMO-2011/01/B/ST2/00495 and UMO-2015/17/B/ST4/04016. The experimental studies was carried out using research infrastructure purchased with the funds of the European Union in the framework of the Smart Growth Operational Programme, Measure 4.2, under grant ‘ATOMIN 2.0 - Atomic scale science for the innovative economy’, POIR.04.02.00-00-D001/20.
Notes
| 1) |
It is necessary to focus the Reader’s attention on the fact that throughout the article the notation of the electronic energy states mostly follows that from original references. Consequently, two notations are present in the article: (or ) and (or) corresponding to description at short and long Rs or Hund’s cases (a) and (c), respectively; molecular quantum numbers: S - total spin, and - projections on the internuclear axis of the total orbital angular momentum and the total angular momentum, respectively; gerade (g) or ungerade (u) symmetry for homoatomic molecules. |
| 2) |
For , electronic energy states of diatomic molecules correlate with atomic asymptotes; in order to unify the notation, for homoatomic and heteroatomic (including MeNg) molecules with one excited atom only asymptote corresponding to the excited Me atom is shown; for homoatomic and heteroatomic molecules with both excited atoms both asymptotes are given. |
| 3) |
Note that R is a distance between Me and Ng atomic nuclei (i.e., internuclear distance) while r is a distance between the Rydberg electron and Me atomic nucleus. |
| 4) |
Ab-initio calculated PECs of Rydberg states from Refs. [ 39] and [ 40] for CdHe and CdNe exhibit in fact very shallow outer wells of depth with respect to the corresponding and atomic asymptotes. |
| 5) |
According to the study presented in Ref. [ 4], symmetry of the state in CdAr changes with R. For small R, i.e. in the region of the repulsive branch, state possesses ‘pure’ symmetry, in the vicinity of the potential-well minimum it possesses mostly symmetry, and at larger R the symmetry is ‘half-and-half’ mixed. Similarly for remaining CdNg molecules [ 213]. Therefore, for the state, notation will be kept throughout the review. The remark is also valid for ZnAr [ 3] and HgNg [ 8] molecules. |
| 6) |
In fact, the inner and outer wells of the double-well state in HgAr was assigned by Duval et al. [ 24] as and wells, respectively in order to properly distinguish between excitation to or emission from these inner and outer wells. In fact, in their earlier study the two, inner and outer, wells were treated as separate and electronic energy states with the state of unknown origin. |
| 7) |
Czuchaj and Sienkiewicz [ 175] reported PECs up to electronic Rydberg states correlating with the and asymptotes. |
| 8) |
S-o interaction was also included in calculations presented in Ref. [ 175]. |
| 9) |
CAS is spanned by all many-electron functions in which two ‘active’ electrons are distributed on the active molecular orbitals of the predominant Cd character. The remaining electrons occupy closed shells or are represented by pseudopotentials. Similar denotations of the CAS’s will be used hereafter. |
| 10) |
Here RAS (5s–1e//5p5d6s6p7s–1h) active space is spanned by the many-electron states in which only the single excitations are allowed from the doubly occupied molecular orbital of predominant Cd 5s character into 5p5d6s6p7s counterparts. The remaining electrons occupy closed shells. |
| 11) |
In Ref. [ 3] the detailed analysis of the accuracy of the results of ab initio calculations was performed with the emphasis on the important role of midbond functions. |
| 12) |
As can be seen in Figure 8, contribution from P-branch outside the band head is negligibly small (which is also in accordance with analysis of Kvaran et al. [ 205]) so, it has not been considered in the present consideration. |
| 13) |
The experimental well depth is defined as seen in Figure 12, from the bottom of the well to the energy beyond no bound bound transitions were observed [ 11]. |
| 14) |
and are regarded as quasi-bound resonant vibrational levels lying above the dissociation energy and supported by the presence of the potential barrier. |
| 15) |
The coefficient is calculated to construct the agreement plot as so-called heatmap plot. Consequently, the important become the numerical (dimensionless) value of . While and are expressed in , is also expressed in . Parameters in Eq. (3) were selected that is always in the range from 0 to 100, therefore, the denominator 0.01 was added to introduce this upper restriction. So that is dimensionless, parameter 0.01 in the denominator as well as 1 in the numerator had to be expressed in as well. |
| 16) |
This type of spectra are associated with ‘Condon internal diffraction’ phenomenon introduced by E. U. Condon [ 212]. |
References
- J. von Neumann, J. and E.P. Wigner, Über das Verhalten von Eigenwerten bei adiabatischen Prozessen, Phys. Z. 1929, 30, 467-479. [CrossRef]
- K. Dressler, in Photophysics and Photochemistry above 6 eV, ed. F. Lahmani (Elsevier, Amsterdam, 1985), pp. 327-341.
- Kędziorski, J.P Zobel, M. Krośnicki, and J. Koperski, Rydberg states of ZnAr complex, Mol. Phys. 2022, 120, e2073282. [CrossRef]
- M. Krośnicki, A. Kędziorski, T. Urbańczyk, and J. Koperski, Rydberg states of the CdAr van der Waals complex, Phys. Rev. A 2019, 99, 052510. [CrossRef]
- E. Czuchaj, M. Krośnicki, and H. Stoll, Quasirelativistic valence ab initio calculation of the potential curves for the Zn-rare gas van der Waals molecules, Chem. Phys. 2001, 265, 291-299. [CrossRef]
- E. Czuchaj and H. Stoll, Calculation of ground- and excited-state potential energy curves for the Cd-rare gas complexes, Chem. Phys. 1999, 248, 1-16. [CrossRef]
- E. Czuchaj, M. Krośnicki, and H. Stoll, Quasirelativistic valence ab initio calculation of the potential-energy curves for Cd-rare atom pairs, Theor. Chem. Acc. 2001, 105, 219-226. [CrossRef]
- E. Czuchaj, M. Krośnicki, and H. Stoll, Quasirelativistic valence ab initio calculation of the potential energy curves for the Hg-rare gas atom complexes, Chem. Phys. 2001, 263, 7-17. [CrossRef]
- R.R. Bennett and W.H. Breckenridge, Spectroscopic characterization of the a3Π0−, b3Π2 and E3Σ+ states of ZnAr, J. Chem. Phys. 1990, 92, 1588-1597. [CrossRef]
- T. Urbańczyk, J. Sobczuk, and J. Koperski, Rotational characterization of the E3Σ1+(5s6s 3S1) Rydberg state of CdNe van der Waals complex via selective J-excitation in OODR process, Spectrochim. Acta A 2022, 264, 120248. [CrossRef]
- J. Koperski and M.A. Czajkowski, Spectroscopical characterization of CdNe van der Waals complex in the E1(3Σ+) Rydberg state, Chem. Phys. Lett. 2002, 357, 119-125. [CrossRef]
- J. Sobczuk, T. Urbańczyk, and J. Koperski, The lowest-lying Rydberg state of CdAr van der Waals complex: The improved characterization of the interatomic potential, Spectrochim. Acta A 2022, 282, 121655. [CrossRef]
- T. Urbańczyk, M. Krośnicki, A. Kędziorski, and J. Koperski, The E3Σ1+(63S1)⟵A3Π0+(53P1) transition in CdAr revisited: The spectrum and new analysis of the Rydberg state interatomic potential, Spectrochim. Acta A 2018, 196, 58-66. [CrossRef]
- T. Urbańczyk, J. Dudek, and J. Koperski, Isotopologue-selective excitation studied via optical-optical double resonance using the E3#x3A3;1+(63S1)⟵A3Π0+(53P1)⟵ X1Σ0+(51S0) transitions in CdAr and CdKr van der Waals complexes, J. Quant. Spectrosc. Radiat. Transf. 2018, 212, 32-38. [CrossRef]
- T. Urbańczyk and J. Koperski, The E3Σ+(63S1)-state interatomic potential of CdAr in the long range region revisited: A new method for bond length adjustment, Chem. Phys. Lett. 2015, 640, 82-86. [CrossRef]
- T. Urbańczyk, M. Strojecki, and J. Koperski, Structure of vibrational bands of the E3Σ+(63S1)⟵A3Π0+(53P1), B3Σ1+(53P1) transitions in CdAr and CdKr studied by optical-optical double resonance method, Chem. Phys. Lett. 2011, 503, 18-24. [CrossRef]
- J. Koperski and M. Czajkowski, The structure of the lowest electronic Rydberg state of CdAr complex determined by laser double resonance method in a supersonic jet-expansion beam, Spectrochim. Acta A 2003, 59, 2435-2448. [CrossRef]
- R.R. Bennett and W.H. Breckenridge, Van der Waals bonding in the lowest electronic states of MgAr, ZnAr, CdAr, and HgAr: Spectroscopic characterization of the b3Π2 and e3Σ+ states of the CdAr molecule, J. Chem. Phys. 1992, 96, 882-890. [CrossRef]
- T. Urbańczyk and J. Koperski, Spectroscopy of CdKr van der Waals complex using OODR process: New determination of the E3Σ1+(5s6s 3S1) Rydberg state potential, Chem. Phys. 2019, 525, 110406. [CrossRef]
- J. Koperski and M. Czajkowski, Electronic structure of the CdKr lowets Rydberg state determined from laser-excitation spectra using supersonic beam and double optical resonance method, Phys. Rev. A 2004, 69, 042509. [CrossRef]
- M. Okunishi, K. Yamanouchi, K. Onda, and S. Tsuchiya, Interatomic potential of the HgNe van der Waals complex in the E(3Σ+) Rydberg state, J. Chem. Phys. 1993, 98, 2675-2681. [CrossRef]
- K. Onda, K. Yamanouchi, M. Okunishi, and S. Tsuchiya, Interatomic potentials of triplet s-Rydberg series of HgNe and HgAr van der Waals dimers, J. Chem. Phys. 1994, 101, 7290-7299. [CrossRef]
- K. Onda and K. Yamanouchi, Interatomic potentials of singlet s-Rydberg series of a HgNe van der Waals dimer: Evidence for stabilization by superexchange interaction, J. Chem. Phys. 1995, 201, 1129-1140. [CrossRef]
- M.-C. Duval, O.B. D’Azy, W.H. Breckenridge, C. Jouvet, and B. Soep, The structure of several electronic states of the HgAr complex as determined by laser double resonance in a supersonic jet, J. Chem. Phys. 1986, 85, 6324-6334. [CrossRef]
- K. Amano, K. Ohmori, T. Kurosawa, H. Chiba, M. Okunishi, K. Ueda, Y. Sato, A.Z. Devdariani, and E.E. Nikitin, c⟵X laser excitation spectrum of the HgAr vdW complex, J. Chem. Phys. 1998, 108, 8110-8113. [CrossRef]
- Yiannopoulou, G.-H. Jeung, S.J. Park, H.S. Lee, and Y.S. Lee, Undulations of the potential energy curves for highly excited electronic states in diatomic molecules related to the atomic orbital undulations, Phys. Rev. A 1999, 59, 1178-1186. [CrossRef]
- J.P. Shaffer, S.T. Rittenhouse, and H.R. Sadeghpour, Ultracold Rydberg molecules, Nat. Commun. 2018, 9, 1965. [CrossRef]
- E. Fermi, Sopra lo Spostamento per Pressione delle Righe Elevate delle Serie Spettrali, Nuovo Cim. 1934, 11, 157-166. [CrossRef]
- Omont, On the theory of collisions of atoms in Rydberg states with neutral particles, J. Phys. (Paris) 1977, 38, 1343-1359. [CrossRef]
- N. Y. Du and C. H. Greene, Interaction between a Rydberg atom and neutral perturbers, Phys. Rev. A 1987, 36, 971(R)-974(R). Erratum: Phys. Rev. A 1987, 36, 5467. DOI: 10.1103/PhysRevA.36.5467. [CrossRef]
- C.H. Greene, A.S. Dickinson, and H.R. Sadeghpour, Creation of polar and nonpolar ultra-long-range Rydberg molecules, Phys. Rev. Lett. 2000, 85, 2458-2461. [CrossRef]
- Kramida, Yu. Ralchenko, J. Reader and NIST ASD Team (2023). NIST Atomic Spectra Database (ver. 5.11), [Online]. Available: https://physics.nist.gov/asd [2024, June 26]. National Institute of Standards and Technology, Gaithersburg, MD. [CrossRef]
- J. E. Sienkiewicz and W. E. Baylis, Low-energy elastic e−−Xe scattering: the effect of exchange in the polarisation potential, J. Phys. B: At. Mol. Opt. Phys. 1989, 22, 3733-3746. [CrossRef]
- M. Kurokawa, M. Kitajima, K. Toyoshima, T. Kishino, T. Odagiri, H. Kato, M. Hoshino, H. Tanaka, and K. Ito, High-resolution total-cross-section measurements for electron scattering from Ar, Kr, and Xe employing a threshold-photoelectron source, Phys. Rev. A 2011, 84, 062717. [CrossRef]
- Y. Cheng, L. Y. Tang, J. Mitroy, and M. S. Safronova, All-order relativistic many-body theory of low-energy electron-atom scattering, Phys. Rev. A 2014, 89, 012701. [CrossRef]
- K. Fedus, Markov Chain Monte Carlo Effective Range Analysis of Low-Energy Electron Elastic Scattering from Xenon, Braz. J. Phys. 2016, 46, 1-9. [CrossRef]
- Y. Cheng, S. Liu, S. B. Zhang, and Y.-B. Tang, Relativistic coupled-cluster-theory study for low-energy electron scattering with argon, Phys. Rev. A 102, 2020, 012824,. [CrossRef]
- P. Schwerdtfeger and J. K. Nagle, 2018 Table of static dipole polarizabilities of the neutral elements in the periodic table, Mol. Phys. 2018, 117, 1200-1225. [CrossRef]
- M. Strojecki, M. Krośnicki, J. Koperski, Repulsive and bound parts of the interatomic potentials of the lowest singlet electronic energy states of the MeRg complexes (Me=Zn, Cd; Rg=He, Ne, Ar, Kr, Xe), J. Mol. Spectrosc. 2009, 256, 128-134. [CrossRef]
- M. Strojecki, M. Krośnicki, M. Łukomski, and J. Koperski, Excitation spectra of CdRg (Rg=He, Ne, Xe) complexes recorded at the D1Σ0+⟵X1Σ0+ transition: From the heaviest CdXe to the lightest CdHe, Chem. Phys. Lett. 2009, 471, 29-35. [CrossRef]
- K.M. Jones, E. Tiesinga, P.D. Lett, and P.S. Julienne, Ultracold photoassociation spectroscopy: Long range molecules and atomic scattering, Rev. Mod. Phys. 2006, 78, 483-536. [CrossRef]
- J. Miller, A molecular clock for testing fundamental forces, Phys. Today 2019, 72, 18-21. [CrossRef]
- Y.V. Stadnik and V.V. Flambaum, Can dark matter induce cosmological evolution of the fundamental constants of nature?, Phys. Rev. Lett. 2015, 115, 201301. [CrossRef]
- C.J. Kennedy, E. Oelker, J.M. Robinson, T. Bothwell, D. Kedar, W.R. Milner, G.E. Marti, A. Drevianko, and J. Ye, Precision metrology meets cosmology: Improved constraints on ultralight dark matter from atom-cavity frequency comparisons, Phys. Rev. Lett. 2020, 125, 201302. [CrossRef]
- M. Filzinger, S. Dörscher, R. Lange, J. Klose, M. Steinel, E. Benkler, E. Peok, C. Lisdat, and N. Huntemann, Improved limits on the coupling of ultralight bosonic dark matter to photons from optical atomoc clock comparison, Phys. Rev. Lett. 2023, 130, 253001. [CrossRef]
- P. Wcisło, P. Morzyński, M. Bober, A. Cygan, D. Lisak, R. Ciuryło, and M. Zawada, Experimental constraint on dark matter detection with optical atomic clocks, Nat. Astron. 2017, 1, 0009. [CrossRef]
- P. Wcisło, P. Ablewski, K. Beloy, S. Bilicki, M. Bober, R. Brown, R. Fasano, R. Ciuryło, H. Hachisu, T. Ido, J. Lodewyck, A. Ludlow, W. McGrew, P. Morzyński, D. Nicolodi, M. Schioppo, M. Sekido, R. Le Targat, P. Wolf, X. Zhang, B. Zjawin, M. Zawada, New bounds on dark matter coupling from a global network of optical atomic clocks, Sci. Adv. 2018, 4, eaau4869. [CrossRef]
- H. Hachisu, K. Miyagishi, S.G. Porsev, A. Derevianko, V.D. Ovsiannikov, V.G. Pal’chikov, M. Takamoto, and H. Katori, Trapping of neutral mercury atoms and prospects for optical lattice clocks, Phys. Rev. Lett. 2008, 100, 053001. [CrossRef]
- K. Beloy, A.W. Hauser, A. Borschevsky, V.V. Flambaum, and P. Schwerdtfeger, Effect of α variation on the vibrational spectrum of Sr2, Phys. Rev. A 2011, 84, 062114. [CrossRef]
- M. Kajita, G. Gopakumar, M. Abe, and M. Hada, Elimination of the Stark shift from the vibrational transition frequency of optically trapped 174Yb6Li molecules, Phys. Rev. A 2011, 84, 022507. [CrossRef]
- D. DeMille, S. Sainis, J. Sage, T. Bergeman, S. Kotochigova, and E. Tiesinga, Enhanced sensitivity to variation of memp in nolecular spectra, Phys. Rev. Lett. 2008, 100, 043202. [CrossRef]
- D. Hanneke, B. Kuzhan, and A. Lunstad, Optical clocks based on molecular vibrations as probes of variation of the proton-to-electron mass ratio, Quantum Sci. Technol. 2021, 6, 014005. [CrossRef]
- T. Zelevinsky, S. Kotochigova, and J. Ye, Precision test of mass-ratio variations with lattice-confined ultracold molecules, Phys. Rev. Lett. 2008, 100, 043201. [CrossRef]
- M.G. Kozlov and A. Derevianko, Proposal for a sensitive search for the electric dipole moment of the electron with matrix-isolated radicals, Phys. Rev. Lett. 2006, 97, 063001. [CrossRef]
- E.R. Meyer and J.L. Bohn, Electron electron-dipole-moment searches based on alkali-metal- or alkaline-earth-metal-bearing molecules, Phys. Rev. A 2009, 80, 042508. [CrossRef]
- V.S. Prasannaa, A.C. Vutha, M. Abe, and B.P. Das, Mercury monohalides: suitability for electron dipole moment searches, Phys. Rev. Lett. 2015, 114, 183001. [CrossRef]
- M. Verma, A.M.Jayich, and A.C. Vuhta, Electric dipole moment searches using clock transitions in ultracold molecules, Phys. Rev. Lett. 2020, 125, 153201. [CrossRef]
- K. Yamanaka, N. Ohmae, I. Ushijima, M. Takamoto, and H. Katori, Frequency ratio of 199Hg and 87Sr optical lattice clocks beyond the SI limit, Phys. Rev. Lett. 2015, 114, 230801. [CrossRef]
- J.J. McFerran, L. Yi, S. Mejri, S. Di Manno, W. Zhang, J. Guena, Y. Le Coq, and S. Bize, Neutral atom frequency reference in the deep ultraviolet with fractional uncertainty = 5.7×10⁻¹⁵, Phys. Rev. Lett. 2012, 108, 183004. [CrossRef]
- V.D. Ovsiannikov, S.I. Marmo, V.G. Palchikov, and H. Katori, Higher-order effects on the precision of clocks of neutral atoms in optical lattices, Phys. Rev. A 2016, 93, 043420. [CrossRef]
- V.A. Dzuba and A. Derevianko, Blackbody radiation shift for the 1S0− 3P0 optical clock transition in zinc and cadmium atoms, J. Phys. B 2019, 52, 215005. [CrossRef]
- Yamaguchi, M.S. Safronova, K. Gibble, and H. Katori, Narrow-line cooling and determination of the magic wavelength of Cd, Phys. Rev. Lett. 2019, 123, 113201. [CrossRef]
- S.G. Porsev and M.S. Safronova, Calculation of higher-order corrections to the light shift of the 5s2 1S0−5s5p 3P00 clock transition in Cd, Phys. Rev. A 2020, 102, 012811. [CrossRef]
- J. Ye, L.S. Ma, and J.L. Hall, Molecular iodine clock, Phys. Rev. Lett. 2001, 87, 270801. [CrossRef]
- S.M. Foreman, A. Marian, J. Ye, E.A. Petrukhin, M.A. Gubin, O.D. Mücke, F.N.C. Wong, E.P. Ippen, and F.X. Kärtner, Demonstration of a HeNe/CH4 – based optical molecular clock, Opt. Lett. 2005, 30, 570-572. [CrossRef]
- S. Schiller, D. Bakalov, and V.I. Korobov, Simplest molecules as candidates for precise optical clocks, Phys. Rev. Lett. 2014, 113, 023004. [CrossRef]
- J.-Ph. Karr, H2+ and HD+: Candidates for a molecular clock, J. Mol. Spectrosc. 2014, 300, 37-43. [CrossRef]
- K. Zaremba-Kopczyk and M. Tomza, Van der Waals molecules consisting of a zinc or cadmium atom interacting with an alkali-metal or alkaline-earth-metal atom, Phys. Rev. A 2021, 104, 042816. [CrossRef]
- M. Borkowski, Optical lattice clocks with weakly bound molecules, Phys. Rev. Lett. 2018, 120, 083202. [CrossRef]
- S.S. Kondov, C.-H. Lee, K.H. Leung, C. Liedl, I. Majewska, R. Moszynski, and T. Zelevinsky, Molecular lattice clock with long vibrational coherence, Nat. Phys. 2019, 15, 1118-1122. [CrossRef]
- K.H. Leung, B. Iritani, E. Tiberi, I. Majewska, M. Borkowski, R. Moszynski, and T. Zelevinsky, Terahertz vibrational molecular clock with systematic uncertainty at the 10−14 level, Phys. Rev. X 2023, 13, 011047. [CrossRef]
- W. Kedzierski, J. Supronowicz, A. Czajkowski, M.J. Hinek, J.B. Atkinson, and L. Krause, The rotationally resolved G0u+⟵A0g+ electronic spectrum of the (202Hg)2 excimer, Chem. Phys. Lett. 1994, 218, 314-319. [CrossRef]
- T. Urbańczyk, M. Strojecki, M. Krośnicki, A. Kędziorski, P.S. Żuchowski, and J. Koperski, Interatomic potentials of metal dimers: probing agreement between experiment and advanced ab initio calculations for van der Waals dimer Cd2, Int. Rev. Phys. Chem. 2017, 36, 541-620. [CrossRef]
- D. Bohm, A suggested interpretation of the quantum theory in terms of ‘hidden’ variables. I, Phys. Rev. 1952, 85, 166-179. [CrossRef]
- D. Bohm, A suggested interpretation of the quantum theory in terms of ‘hidden’ variables. II, Phys. Rev. 1952, 85, 180-192. [CrossRef]
- Einstein, B. Podolsky, and N. Rosen, Can quantum-mechanical description of physical reality be considered complete?, Phys. Rev. 1935, 47, 777-780. [CrossRef]
- E.S. Fry, Th. Walther, and S. Li, Proposal for a loophole-free test of the Bell inequalities, Phys. Rev. A 1995, 52, 4381-4395. [CrossRef]
- J.S. Bell, On the Einstein Podolsky Rosen paradox, Physics 1964, 1, 195-200. [CrossRef]
- T. Urbańczyk, M. Strojecki, M. Krośnicki, and J. Koperski, Entangled cadmium atoms – from the method of production to the test of Bell inequalities, Opt. Appl. 42, 433-2012, 441. [CrossRef]
- T.K. Lo and A. Shimony, Proposed molecular test of local hidden-variables theories, Phys. Rev. A 1981, 23, 3003-3012. [CrossRef]
- T. Urbańczyk, M. Strojecki, and J. Koperski, Exploration of the molecular ro-vibrational energy structure: on the perspective of Yb2 and Cd2 internal cooling, and 171Yb – version of Einstein-Podolsky-Rosen experiment, Mol. Phys. 2018, 116, 3475-3486. [CrossRef]
- J. Vigué, P. Grangier, G. Roger, and A. Aspect, Polarization of calcium atomic fluorescence due to a coherence effect in the photodissociation of Ca2 molecules, J. Physique Lett. 1981, 42, 531-535. [CrossRef]
- P. Grangier, A. Aspect, and J. J. Vigué, Quantum interference effect for two atoms radiating a single photon, Phys. Rev. Lett. 1985, 54, 418-421. [CrossRef]
- J. Robert, F. Zappa, C.R. de Carvalho, G. Jalbert, R.F. Nascimento, A. Trimeche, O. Dulieu, A. Medina, C. Carvalho, and N.V. de Castro Faria, Experimental evidence of twin metastable H(22S) atoms from dissociation of cold H2 induced by electrons, Phys. Rev. Lett. 2013, 111, 183203. [CrossRef]
- Medina, G. Rahmat, G. Jalbert, R. Cireasa, F. Zappa, C.R. de Carvalho, N.V. de Castro Faria, and J. Robert, Slow metastable H(22S1/2) from dissociation of cold H2 induced by electrons, Eur. Phys. J. 2012, 66, 134. [CrossRef]
- R.O. Esquivel, N. Flores-Gallegros, M. Molina-Espíritu, A.R. Plastino, J.C. Angulo, J. Antolín, and F.S. Dehesa, Quantum entanglement and the dissociation process of diatomic molecules, J. Phys. B: At. Mol. Opt. Phys. 2011, 44, 175101. [CrossRef]
- P.D. Lett, P.S. Julienne, and W.D. Phillips, Photoassociative spectroscopy of laser-cooled atoms, Ann. Rev. Phys. Chem. 1995, 46, 423-452. [CrossRef]
- F. Masnou-Seeuws and P. Pillet, Formation of ultracold molecules (T≤200 μK) via photoassociation in a gas of laser cooled atoms, Adv. At. Mol. Opt. Phys. 2001, 47, 53-127. [CrossRef]
- K.M. Jones, E. Tiesinga, P.D. Lett, and P.S. Julienne, Ultracold photoassociation spectroscopy: Long-range molecules and atomic scattering, Rev. Mod. Phys. 2006, 78, 483-536. [CrossRef]
- M.-L. Almazor, O. Dulieu, F. Masnou-Seeuws, R. Beuc, and G. Pichler, Formation of ultracold molecules via photoassociation with blue detuned laser light, Eur. Phys. J. D 2001, 15, 355-363. [CrossRef]
- E. Tiemann, Cold molecules, in: Interactions in Cold Gases. From Atoms to Molecules, eds. M. Weidemüller and C. Zimmermann, Wiley, New York, 2003, pp. 175-214.
- W. C. Stwalley, Ph. L. Gould, and E. E. Eyler, Ultracold Molecule Formation by Photoassociation, in Cold Molecules. Theory, Experiment, Applications, CRC, Boca Raton, 2009, pp. 206-263.
- Pashov, P. Kowalczyk, and W. Jastrzębski, Double-minimum 31Σu+ state in Rb2: Spectroscopic study and possible applications for cold-physics experiments, Phys. Rev. A 2019, 100, 012507. [CrossRef]
- Thomas, C. Lippe, T. Eichert, and H. Ott, Photoassociation of rotating ultra-long range Rydberg molecules, J. Phys. B: At. Mol. Opt. Phys. 51, 2018, 155201,. [CrossRef]
- M. Hamamda, P. Pillet, H. Lignier, and D. Comparat, Ro-vibrational cooling of molecules and prospects, J. Phys. B: At. Mol. Opt. Phys. 2015, 48, 182001. [CrossRef]
- R. Horchani, Laser cooling of internal degrees of freedom of molecules, Front. Phys. 2016, 11, 113301. [CrossRef]
- J.T. Bahns, W.C. Stwalley, and P.L. Gould, Laser cooling of molecules: A sequential scheme for rotation, translation, and vibration, J. Chem. Phys. 1996, 104, 9689-9697. [CrossRef]
- Manai, R. Horchani, M. Hamamda, A. Fioretti, M. Allegrini, H. Lignier, P. Pillet, and D. Comparat, laser cooling of rotation and vibration by optical pumping, Mol. Phys. 2013, 111, 1844-1854. [CrossRef]
- Th. Walther, in Interactions in Ultracold Gases: From Atoms to Molecules, eds. M. Weidemuller and C. Zimmermann, Wiley-VCH, Weinheim, 2003, pp. 405-406.
- T. Urbańczyk and J. Koperski, Ro-vibrational cooling of diatomic molecules Cd2 and Yb2: rotational energy structure included, Mol. Phys. 2020, 118, e1694712. [CrossRef]
- Wakim, P. Zabawa, M. Haruza, and N.P. Bigelow, Luminorefrigeration: vibrational cooling of NaCs, Opt. Expr. 2012, 20, 16083-16091. [CrossRef]
- X. Yuan, S. Yin, Y. Shen, Y. Liu, Y. Lian, H.-F. Xu, and B. Yan, Laser cooling of thallium chloride: A theoretical investigation, J. Chem. Phys. 2018, 149, 094306. [CrossRef]
- C. Li, Y. Li, Z. Ji, X. Qiu, Y. Lai, J. Wei, Y. Zhao, L. Deng, Y. Chen, and J. Liu, Candidates for direct laser cooling of diatomic molecules with the simplest 1Σ − 1Σ electronic system, Phys. Rev. A 2018, 97, 062501. [CrossRef]
- Q.-S. Yang, S.-C. Li, Y. Yu, and T. Gao, Theoretical study of the feasibility of laser cooling the 24Mg35Cl molecule including hyperfine structure and branching ratios, J. Phys. Chem. A 2018, 122, 3021-3030. [CrossRef]
- T. Urbańczyk, M. Krośnicki, and J. Koperski, Observation of gerade Rydberg state of Cd2 van der Waals complex cooled in free-jet expansion beam and excited using optical-optical double resonance method, Spectochim. Acta A 2021, 253, 119500. [CrossRef]
- M. Czajkowski, R. Bobkowski, and L. Krause, Pump-and-probe studies of the E1(63S1)⟵A0+(53P1) excitation spectrum of CdAr in a supersonic beam, Phys. Rev. A 1992, 45, 6451-6458. [CrossRef]
- R.A. Bernheim, L.P. Gold, P.B. Kelly, T. Tipton, and D.K. Veirs, A spectroscopic study of the G1Πg state of7Li2 by pulsed optical-optical double resonance, J. Chem. Phys. 1981, 74, 2749-2754. [CrossRef]
- R.A. Bernheim, L.P. Gold, P.B. Kelly, C. Tomczyk, and D.K. Veirs, A study of the E1Σg+ and F1Σg+ states of7Li2 by pulsed optical-optical double resonance, J. Chem. Phys. 1981, 74, 3249-3254. [CrossRef]
- R.A. Bernheim, L.P. Gold, P.B. Kelly, T. Tipton, and D.K. Veirs, A study of the E1Σg+ state of 7Li2 by pulsed optical-optical double resonance spectroscopy, J. Chem. Phys. 1982, 76, 57-60. [CrossRef]
- R.A. Bernheim, L.P. Gold, and T. Tipton, Rydberg states of 7Li2 by pulsed optical-optical double resonance spectroscopy: Molecular constants of 7Li2+, J. Chem. Phys. 1983, 78, 3635-3646. [CrossRef]
- X. Xie and R.W. Field, Perturbation facilitated optical-optical double resonance spectroscopy of the 6Li2 33Σg+, 23Πg, 13Δg, b3Πu, anda3Σu+ states, J. Mol. Spectrosc. 1986, 117, 228-244. [CrossRef]
- L. Li and R.W. Field, Direct observation of high-lying3Πg states of the Na2 molecule by optical-optical double resonance, J. Phys. Chem.1983, 87, 3020-3022. [CrossRef]
- Sanli, X. Pan, S. Magnier, J. Huennekens, A.M. Lyyra, and E.H. Ahmed, Measurement of the Na2 51Σg+⟶ A1Σu+ and 61Σg+⟶ A1Σu+ transition dipole moments using optical-optical double resonance and Autler-Townes spectroscopy, J. Chem. Phys. 2017, 147, 204301. [CrossRef]
- M. Saaranen, D. Wagle, E. McLaughlin, A. Paladino, S. Ashman, and B. Bayram, Time-resolved double-resonance spectroscopy: Lifetime measurement of the 61Σg+(7,31) electronic state of molecular sodium, J. Chem. Phys. 2018, 149, 204302. [CrossRef]
- L. Li and A.M. Lyyra, Triplet states of Na2 and Li2 by perturbation facilitated optical-optical double resonance spectroscopy, Spectrochim. Acta A 1999, 55, 2147-2178. [CrossRef]
- J.T. Kim, H. Wang, C.C. Tsai, J.T. Bahns, W.C. Stwaley, G. Jong, and A.M. Lyyra, Observation of the 43Σg+, 33Πg, 23Δg and b3Πustates of 39K2 by perturbation facilitated optical-optical resonance spectroscopy, J. Chem. Phys. 1995, 102, 6646-6652. [CrossRef]
- P.T. Arndt, V.B. Sovkov, J. Ma, X. Pan, D.S. Beecher, J.Y. Tsai, Y. Guan, A.M. Lyyra, and E.H. Ahmed, The Rb2 31Πg state: Observation and analysis, J. Chem. Phys. 2018, 149, 224303. [CrossRef]
- P.T. Arndt, V.B. Sovkov, J. Ma, X. Pan, D.S. Beecher, J.Y. Tsai, Y. Guan, A.M. Lyyra, and E.H. Ahmed, Experimental study of the 61Σg+ state of the rubidium dimer, Phys. Rev. A 2019, 99, 052511. [CrossRef]
- Z.J. Jabbour and J. Heunnekens, A study of the predissociation of NaK molecules in the 61Σ+state by optical-optical double resonance spectroscopy, J. Chem. Phys. 1997, 107, 1094-1105. [CrossRef]
- C.-C. Chu, H.-Y. Huang, T.-J. Whang, and C.-C. Tsai, Observation of double-well potential of NaH C1Σ+ state: Deriving the dissociation energy of its ground state, J. Chem. Phys. 2018, 148, 114301. [CrossRef]
- P.F. Bernath and R.W. Field, Optical-optical double-resonance spectroscopy of CaF, J. Mol. Spectrosc. 1980, 82, 339-347. [CrossRef]
- H. Ludwigs and P. Royen, OODR spectroscopy of BaCl. Rotational analysis of the G2Σ+, Chem. Phys. Lett. 1994, 223, 95-98. [CrossRef]
- R.W. Field, G.A. Capelle, and M.A. Revelli, Optical-optical double resonance laser spectroscopy of BaO, J. Chem. Phys. 1975, 63, 3228-3237. [CrossRef]
- R.W. Field, A.D. English, T. Tanaka, D.O. Harris, and D.A. Jennings, Microwave optical double resonance spectroscopy with a CW dye laser: BaO X1Σ and A1Σ, J. Chem. Phys. 1973, 59, 2191-2203. [CrossRef]
- R.J. Donovan, K.P. Lawley, Z. Min, T. Ridley, and A.J. Yarwood, Two-color bound-free-bound spectroscopy as a route to ion-pair states in iodine, Chem. Phys. Lett. 1994, 226, 525-531. [CrossRef]
- R. Michalak and D. Zimmermann, Laser-spectroscopic investigation of higher excited electronic states of the KAr molecule, J. Mol. Spectrosc. 1999, 193, 260-272. [CrossRef]
- N. Bouloufa, L. Cabaret, P. Luc, R. Vetter, and W.T. Luh, An optical-optical double resonance experiment in LiH molecules: Lifetime measurements in the C state, J. Chem. Phys. 2004, 121, 7237-7242. [CrossRef]
- E. Kleimenov, O. Zehnder, and F. Merkt, Spectroscopic characterization of the potential energy functions of Ne2 Rydberg states in the vicinity of the Ne( 1S0)+Ne(p′) dissociation limits, J. Mol. Spectrosc. 2008, 247, 85-99. [CrossRef]
- F.X. Sunahori, R. Nagarajan, and D.J. Clouthier, Optical-optical double resonance, laser induced fluorescence, and revision of the signs of the spin-spin constants of the boron carbide (BC) free radical, J. Chem. Phys. 143, 2015, 224308,. [CrossRef]
- Wallace and W.H. Breckenridge, Spectroscopic characterization of the X1Σ+ and C1Π states of the MgNe molecule, J. Chem. Phys. 1993, 98, 2768-2773. [CrossRef]
- R.R. Bennett, J.G. McCaffrey, I. Wallace, D.J. Funk, A. Kowalski, and W.H. Breckenridge, A laser spectroscopic study of the X1Σ0+−C1Π1 transition of MgAr: evidence for Λ-type doubling, J. Chem. Phys. 1989, 90, 2139-2147. [CrossRef]
- J.G. Kaup, A.W.K. Leung, and W.H. Breckenridge, Spectroscopic characterization of the metastable 3pπ 3Π0−,0+ valence states and the 4s3Σ+ Rydberg states of the MgKr and MgXe van der Waals molecules, J. Chem. Phys. 1997, 107, 10492-10505. [CrossRef]
- J.G. McCaffrey, D.J. Funk, and W.H. Breckenridge, Characterization of the first excited 1Π1 and the ground X1Σ+ states of MgXe. I. Analysis of the 1Π1⟵X1Σ+ bound-bound transitions, J. Chem. Phys. 1993, 99, 9472-9481. [CrossRef]
- J.G. McCaffrey, D.J. Funk, and W.H. Breckenridge, Characterization of the first excited 1Π1 and the ground X1Σ+ states of MgXe. I. Analysis of the 1Π1⟶X1Σ+ bound-free emission spectra, J. Chem. Phys. 1994, 100, 955-971. [CrossRef]
- L.R. Brock and M.A. Duncan, Photoionization spectroscopy of Ag-rare gas van der Waals complexes, J. Chem. Phys. 1995, 103, 9200-9211. [CrossRef]
- A.M. Knight, A. Stangassinger, and M.A. Duncan, Photoionization spectroscopy of Au-Ar, Chem. Phys. Lett. 1997, 273, 265-271. [CrossRef]
- J.M. Gardner and M.I. Lester, Resonant photoionization spectroscopy of refractory metal-rare gas complexes: AlAr, Chem. Phys. Lett. 1987, 137, 301-305. [CrossRef]
- C.L. Callender, S.A. Mitchell, and P.A. Hackett, Interatomic potentials for van der Waals complexes of group 13 metal atoms: AlAr, AlKr, and AlXe, J. Chem. Phys. 1989, 90, 5252-5261. [CrossRef]
- W.M. Fawzy, R.J. LeRoy, B. Simard, H. Niki, and P.A. Hackett, Determining repulsive potentials of InAr from oscillatory bound⟶continuum emission, J. Chem. Phys. 1993, 98, 140-149. [CrossRef]
- C.L. Callender, S.A. Mitchell, and P.A. Hackett, Interatomic potentials for van der Waals complexes of group 13 metal atoms: InAr, InKr, and InXe, J. Chem. Phys. 1989, 90, 2535-2543. [CrossRef]
- J.M. Merritt, V.E. Bondybey, and M.C. Heaven, Beryllium dimer – caught in the act of bonding, Science 2009, 324, 1548-1551. [CrossRef]
- M.A. Lebeault, J. Viallon, V. Boutou, and J. Chevaleyre, Vibrational structure of the (2)1Σu+−X(1)1Σg+ transition of the Ba2 molecule, J. Mol. Spectrosc. 1988, 192, 179-182. [CrossRef]
- G.M. Greetham and A.M. Ellis, Laser-induced fluorescence spectroscopy of the gallium dimer: evidence for a 3Πu electronic ground state, J. Mol. Spectrosc. 2003, 222, 273-275. [CrossRef]
- R.J. Niefer, J. Supronowicz, J.B. Atkinson, and L. Krause, Laser-induced fluorescence from the H, I, and J states of Hg2, Phys. Rev. A 1987, 35, 4629-4638. [CrossRef]
- Czajkowski, W. Kedzierski, J.B. Atkinson, and L. Krause, Rotational analysis of the H11u⟵A0g±(1,0) bands of (202Hg)2, J. Mol. Spectrosc. 1997, 181, 1-10. [CrossRef]
- W. Kedzierski, J.B. Atkinson, and L. Krause, The3Σg+43P,43P⟵ 3Σu+43P,41S vibronic spectrum of Zn2, Chem. Phys. Lett. 1994, 222, 146-148. [CrossRef]
- W. Kedzierski, J.B. Atkinson, and L. Krause, Laser-induced Fluorescence from the3Πu(43D) state of Zn2, Chem. Phys. Lett. 1991, 181, 427-430. [CrossRef]
- W. Kedzierski, J.B. Atkinson, and L. Krause, Laser Spectroscopy of the3Σu+43P,43P state of Zn2, Chem. Phys. Lett. 1992, 200, 103-107. [CrossRef]
- W. Kedzierski, J.B. Atkinson, and L. Krause, Laser-induced fluorescence from the3Πu 43P,43P state of Zn2, Chem. Phys. Lett. 1993, 215, 185-187. [CrossRef]
- E. Hegazi, J. Supronowicz, G. Chambaud, J.B. Atkinson, W.E. Baylis, and L. Krause, Laser-Induced Fluorescence from the E1 and F1 states of the HgZn Excimer, Phys. Rev. A 1989, 40, 6293-6299. [CrossRef]
- E. Hegazi, J. Supronowicz, J.B. Atkinson, and L. Krause, Laser-induced fluorescence spectra of the HgZn excimer: Transitions involving the E0−, A1, A0−, and B0− states, Phys. Rev. A 1990, 42, 2734-2740. [CrossRef]
- E. Hegazi, J. Supronowicz, J.B. Atkinson, and L. Krause, Laser-induced fluorescence from the F0− state of the HgZn excimer, Phys. Rev. A 1990, 42, 2745-2750. [CrossRef]
- J. Supronowicz, E. Hegazi, J.B. Atkinson, and L. Krause, Fluorescence and excitation spectra of the D0+, E1, and G1 states of the HgZn exciplex, Chem. Phys. Lett. 1994, 222, 149-155. [CrossRef]
- J. Supronowicz, J.B. Atkinson, and L. Krause, Laser spectroscopy of some HgCd spin-orbit states, Phys. Rev. A 1994, 50, 3719-3726. [CrossRef]
- M. Krośnicki, M. Strojecki, T. Urbańczyk, A. Pashov, and J. Koperski, Interatomic potentials of the heavy van der Waals dimer Hg2: A ‘test-bed’ for theory-to-experiment agreement, Phys. Rep. 2015, 591, 1-31. [CrossRef]
- E. Czuchaj, F. Rebentrost, H. Stoll, and H. Preuss, Potential energy curves for the Zn2 dimer, Chem. Phys. Lett. 1996, 255, 203-209. [CrossRef]
- J.R. Bieroń and W.E. Baylis, Potential energy curves of HgCd and spectroscopic constants of group IIB metal dimers, Chem. Phys. 1995, 197, 129-137. [CrossRef]
- J.R. Bieroń and W.E. Baylis, Calculation of the potential energy curves of the HgZn dimer, Mol. Phys. 2000, 98, 1051-1055. [CrossRef]
- A. Fioretti, D. Comparat, A. Crubellier, O. Dulieu, F. Masnou-Seeuws, and P. Pillet, Formation of cold Cs2 molecules through photoassociation, Phys. Rev. Lett.1998, 80, 4402-4405. [CrossRef]
- M. Vatasescu, O. Dulieu, C. Amiot, D. Comparat, C. Drag, V. Kokoouline, F. Masnou-Seeuws, and P. Pillet, Multichannel tunnelling in the Cs2 0g− photoassociation spectrum, Phys. Rev. A 2000, 61, 044701. [CrossRef]
- D. Comparat, C. Drag, B. Laburthe Torla, A. Fioretti, P. Pillet, A. Crubellier, O. Dullieu, and F. Masnou-Seeuws, Formation of cold Cs2 ground state molecules through photoassociation in the 1u pure long-range state, Eur. Phys. J. D 2000, 11, 59-71. [CrossRef]
- H. Saβmannshausen and J. Deiglmayr, Observation of Rydberg-atom macrodimers: micrometer-sized diatomic molecules, Phys. Rev. Lett. 2016, 117, 083401. [CrossRef]
- A.N. Nikolov, E.E. Eyler, X.T. Wang, J. Li, H. Wang, W.C. Stwaley, and P.L. Gould, Observation of ultracold ground-state potassium molecules, Phys. Rev. Lett. 1999, 82, 703-706. [CrossRef]
- A.N. Nikolov, J.R. Ensher, E.E. Eyler, H. Wang, W.C. Stwaley., and P.L. Gould, Efficient production of ground-state potassium molecules at sub-mK temperatures by two-step photoassociation, Phys. Rev. Lett. 2000, 84, 246-249. [CrossRef]
- R.R. Carollo, J.L. Carini, E.E. Eyler, P.L. Gould, and W.C. Stwaley, Short-range photoassociation from the inner wall of the lowest triplet potential of 85Rb2, J. Phys. B: At. Mol. Opt. Phys. 2016, 49, 194001. [CrossRef]
- J. Deiglmayr, M. Repp, A. Grochola, K. Mörtlbauer, C. Glück, O. Dulieu, J. Lange, R. Wester, and M. Weidemüller. Formation of ultracold dipolar molecules in the lowest vibrational levels by photoassociation, Faraday Discuss. 2009, 142, 335-349. [CrossRef]
- R. Ferber, J. Jastrzębski, and P. Kowalczyk, Line intensities in V-type polarization labelling spectroscopy of diatomic molecules, J. Quant. Spectrosc. Radiat. Transfer 1997, 58, 53-60. [CrossRef]
- W. Jastrzębski, W. Jaśniecki, P. Kowalczyk, R. Nadyak, and A. Pashov, Spectroscopic investigation of the double-minimum 21Σu+ state of the potassium dimer, Phys. Rev. A 2000, 62, 042509. [CrossRef]
- Pashov, W. Jastrzębski, W. Jaśniecki, V. Bednarska, and P. Kowalczyk, Accurate potential curve for the double minimum 21Σu+ state of Na2, J. Mol. Spectrosc. 2000, 203, 264-267. [CrossRef]
- M.K. Kubkowska, A. Grochola, W. Jastrzębski, and P. Kowalczyk, The C1Πu and 21Σu+ states in Li2: Experiment and comparison with theory, Chem. Phys. 2007, 333, 214-218. [CrossRef]
- W. Jastrzębski, P. Kowalczyk, J. Szczepkowski, and A. Pashov, The double minimum E(3)1Σu+ state in Cs2, Spectrochim. Acta A 2024, 320, 124597. [CrossRef]
- Pashov, W. Jastrzębski, and P. Kowalczyk, An improved description of the double minimum 61Σ+ state of NaK by an IPA potential energy curve, J. Phys. B: At. Mol. Opt. Phys. 2000, 33, L611-L614. [CrossRef]
- J. Szczepkowski, A. Grochola, W. Jastrzębski, and P. Kowalczyk, Experimental investigation of the 61Σ+ ‘shelf’ state of KCs, Chem. Phys. Lett. 2014, 614, 36-40. [CrossRef]
- Kortyka, W. Jastrzębski, and P. Kowalczyk, Experimental characterization of the double minimum 61Σ+ state in NaRb, Chem. Phys. Lett. 2005, 404, 323-326. [CrossRef]
- E. Czuchaj and J. Sienkiewicz, Pseudopotential calculation of the adiabatic potentials and oscillator strengths of cadmium-rare-gas pairs, J. Phys. B: At. Mol. Phys. 1984, 17, 2251-2268. [CrossRef]
- H.-J. Werner et al., MOLPRO, version 2002.6, a package of ab initio programs, 2003. Available from: http://www.molpro.net.
- L. Li, J. Xue, D. Liu, Y. Chen, Y. Wang, R. Ma, and B. Yan, Spectroscopic constants and transition properties of the singlet states of van der Waals molecules CdRG (RG=He,Ne,Ar,Kr,Xe,Rn), Mol. Phys. 2023, 121, e2211908. [CrossRef]
- H.-J. Werner, Third-order multireference perturbation theory The CASPT3 method, Mol. Phys. 1996, 89, 645-661. [CrossRef]
- G. Igel-Mann, Semiempirische Pseudopotentiale: Untersuchungen an Hauptgruppenelementen und Nebengruppenelementen mit abgeschlossener d-Schale, Doktorarbeit, Universität Stuttgart, 1987.
- Nicklass, M. Dolg, H. Stoll, and H. Preuss, Ab initio energy-adjusted pseudopotentials for the noble gases Ne through Xe: Calculation of atomic dipole and quadrupole polarizabilities, J. Chem. Phys. 1995, 102, 8942-8952. [CrossRef]
- D. Andrae, U. Häussermann, M. Dolg, and H. Preuss, Energy-adjusted ab initio pseudopotentials for the second and third row transition elements, Theor. Chim. Acta 1990, 77, 123-141. [CrossRef]
- D. Figgen, G. Rauhut, M. Dolg, and H. Stoll, Energy-consistent pseudopotentials for group 11 and 12 atoms: adjustment to multi-configuration Dirac-Hrtree-Fock data, Chem. Phys. 2005, 311, 227-244. [CrossRef]
- C. Hampel, K.A. Peterson, and H.-J. Werner, A comparison of the efficiency and accuracy of the quadratic configuration interaction (QCISD), coupled cluster (CCSD), and Brueckner coupled cluster (BCCD) methods, Chem. Phys. Lett. 1992, 190, 1-12. [CrossRef]
- P.J. Knowles, C. Hampel, and H.-J. Werner, Coupled cluster theory for high spin, open shell reference wave function, J. Chem. Phys. 1993, 99, 5219-5227. [CrossRef]
- P.J. Knowles and H.-J. Werner, An efficient method for the evaluation of coupling coefficients in configuration interaction calculations, Chem. Phys. Lett. 1988, 145, 514-522. [CrossRef]
- H.-J. Werner and P.J. Knowles, An efficient internally contracted multiconfiguration-reference configuration interaction method, J. Chem. Phys. 1988, 89, 5803-5814. [CrossRef]
- P.-Ǻ. Malmqvist, A. Rendell, and B.O. Roos, The restricted active space self-consistent-field method, implemented with a split graph unitary group approach, J. Phys. Chem. 1990, 94, 5477-5482. [CrossRef]
- P.-Ǻ. Malmqvist, K. Pierloot, A.R.M. Shahi, C.J. Cramer, and L. Gagliardi, The restricted active space followed by second-order perturbation theory method: Theory and application to the study of CuO2 and Cu2O2 systems, J. Chem. Phys. 2008, 128, 204109. [CrossRef]
- P.-Ǻ. Malmqvist, B.O. Roos, and B. Schimmelpfennig, The restricted active space (RAS) state interaction approach with spin-orbit coupling, Chem. Phys. Lett. 2002, 357, 230-240. [CrossRef]
- B.O. Roos, P.R. Taylor, and P.E.M. Sigbahn, A complete active space SCF method (CASSCF) using a density matrix formulated super-CI approach, Chem. Phys. 1980, 48, 157-173. [CrossRef]
- K. Andersson, P.-Ǻ. Malmqvist, B.O. Roos, A.J. Sadlej, K. Wolinski, Second-order perturbation theory with a CASSCF reference function, J. Phys. Chem. 1990, 94, 5483-5488. [CrossRef]
- K. Andersson, P.-Ǻ. Malmqvist, B.O. Roos, Second-order perturbation theory with a complete active space self-consistent field reference function, J. Chem. Phys. 1992, 96, 1218-1226. [CrossRef]
- J. Finley, P.-Ǻ. Malmqvist, B.O. Roos, L. Serano-Andrés, The multi-state CASPT2 method, Chem. Phys. Lett. 1998, 288, 299-306. [CrossRef]
- J.D. Watts, J. Gauss, R.J. Bartlett, Coupled-cluster methods with noniterative triple excitations for restricted open-shell Hartree-Fock and other general single determinant reference functions. Energies and analytical gradients, J. Chem. Phys. 1993, 98, 8718-8733. [CrossRef]
- H. Sekino and R.J. Bartlet, A linear response, coupled-cluster theory for excitation energy, Int. J. Quantum Chem. 1984, 26, 255-265. [CrossRef]
- J.F. Stanton and R.J. Bartlett, The equation of motion coupled-cluster method. A systematic biorthogonal approach to molecular excitation energies, transition probabilities, and excited state properties, J. Chem. Phys. 1993, 98, 7029-7039. [CrossRef]
- S.R. Gwaltney, M. Nooijen, and R.J. Bartlett, Simplified methods for equation-of-motion coupled-cluste excited state calculations, Chem. Phys. Lett. 1996, 248, 189-198. [CrossRef]
- T. Korona and H.-J. Werner, Local treatment of electron excitations in the EOM-CCSD method, J. Chem. Phys. 2003, 118, 3006-3019. [CrossRef]
- M. Dolg, U. Wedig, H. Stoll, and H. Preuss, Energy-adjusted ab initio pseudopotentials for the first row transition elements, J. Chem. Phys. 1987, 86, 866-872. [CrossRef]
- L. Li, J. Xue, Y. Liu, and B. Yan, Ab initio study on the singlet states of ZnRG (RG=He, Ne, Ar, Kr, Xe, Rn) molecules, Spectrochim. Acta A 2023, 287, 122091. [CrossRef]
- L. Li, C. Li, and B. Yan, The spectroscopic and transition properties of ZnHe: MRCI+Q study including spin-orbit coupling, J. Quant. Spectrosc. Radiat. Transf. 2023, 297, 108482. [CrossRef]
- K.R. Shamasundar, G. Knizia, and H.-J. Werner, A new internally contracted multi-reference configuration interaction method, J. Chem. Phys. 2011, 135, 054101. [CrossRef]
- J. Dudek, A. Kędziorski, J.P. Zobel, M. Krośnicki, T. Urbańczyk, K. Puczka, and J. Koperski, Bound⟶free and bound⟶bound multichannel emission spectra from selectively excited Rydberg states in the ZnAr and CdAr van der Waals complexes, J. Mol. Struct. 2020, 1222, 128840. [CrossRef]
- J. Koperski and M. Czajkowski, Improved spectroscopic characterization of the ground X0+(1Σ+) and lowest excited A0+(3Π), B1(3Σ+) and D1(1Π) energy states of CdNe complex in a wide range of internuclear separations, Eur. Phys. J. D 2000, 10, 363-377. [CrossRef]
- Kvaran, D.J. Funk, A. Kowalski, and W.H. Breckenridge, Spectroscopic characterization of the X(10+) and A(30+) states of CdNe, CdAr, CdKr, and CdXe, J. Chem. Phys. 1988, 89, 6069-6080. [CrossRef]
- R.J. Le Roy, LEVEL: A computer program for solving the radial Schrodinger equation for bound and quasibound levels, J. Quant. Spectrosc. Radiat. Transf. 2017, 186, 167-178. [CrossRef]
- C.M. Western, PGOPHER: A program for simulating rotational, vibrational and electronic spectra, J. Quant. Spectrosc. Radiat. Transf. 2018, 186, 221-242. [CrossRef]
- Pashov, W. Jastrzębski, and P. Kowalczyk, Construction of potential curves for diatomic molecular states by the IPA method, Comput. Phys. Commun. 2000, 128, 622-634. [CrossRef]
- R.J. LeRoy and G.T. Kraemer, BCONT 2.2. A computer program for calculating bound⟶continuum transition intensities for diatomic molecules, University of Waterloo Chemical Physics Research Report CP-650R2, 2004.
- T. Urbańczyk and J. Koperski, Profiles of (υ′;υ′′=0) bands recorded in excitation spectra using b30u+⟵X10g+ transitions in Cd2 and B31⟵X10+ transitions in CdAr, Mol. Phys. 2014, 112, 2486-2494. [CrossRef]
- J. Tellinghuisen, Reflection and interference structure in diatomic Franck-Condon distributions, J. Mol. Spectrosc. 1984, 103, 455-465. [CrossRef]
- E.U. Condon, Nuclear motions associated with electron transitions in diatomic molecules, Phys. Rev. 1928, 32, 858-872. [CrossRef]
- J. Koperski, Potential energy curve of the X0+(1Σ+) ground state of HgAr determined from A0+(3Π)⟶X0+ and B1(3Σ+)⟶X0+ fluorescence spectra, Chem. Phys. 1996, 211, 191-201. [CrossRef]
- M. Strojecki and J. Koperski, LIF dispersed emission spectra and characterization of ZnRg (Rg=Ne, Ar, Kr) ground-state potentials, Chem. Phys. Lett. 2009, 479, 189-194. [CrossRef]
- J. Koperski, M. Łukomski, and M. Czajkowski, Laser spectroscopy of CdKr molecules in ultraviolet region, Spectrochim. Acta A 2002, 58, 2709-2724. [CrossRef]
- J. Koperski, T. Urbańczyk, M. Krośnicki, and M. Strojecki, free⟵bound and bound⟵bound profiles in excitation spectra of the B31⟵X10+ transition in CdNg (Ng=noble gas) complexes, Chem. Phys. 2014, 428, 43-52. [CrossRef]
- M. Krosnicki, A. Kędziorski, T. Urbańczyk, and J. Koperski, Valence and Rydberg states of CdKr within ab initio approach, in preparation, manuscript in preparation.
- K. Ohmori, Y. Sato, E.E. Nikitin, and S.A. Rice, High-precision molecular wave-packet interferometry with HgAr dimers, Phys. Rev. Lett. 2003, 91, 243003. [CrossRef]
- T. Urbańczyk and J. Koperski, Rotational profiles of vibrational bands recorded at the B31(53P1)⟵X10+51S0 transition in CdAr complex, Chem. Phys. Lett. 2014, 591, 64-68. [CrossRef]
|
Disclaimer/Publisher’s Note: The statements, opinions and data contained in all publications are solely those of the individual author(s) and contributor(s) and not of MDPI and/or the editor(s). MDPI and/or the editor(s) disclaim responsibility for any injury to people or property resulting from any ideas, methods, instructions or products referred to in the content. |
© 2024 by the authors. Licensee MDPI, Basel, Switzerland. This article is an open access article distributed under the terms and conditions of the Creative Commons Attribution (CC BY) license (http://creativecommons.org/licenses/by/4.0/).

