Preprint
Article

Causes and Impacts of Flood Events in Emilia-Romagna (Italy) in May 2023

Altmetrics

Downloads

91

Views

60

Comments

0

Submitted:

03 September 2024

Posted:

04 September 2024

You are already at the latest version

Alerts
Abstract
From the evening of 1st May 2023 to 3rd May 2023, severe hydro-meteorological events occurred in the Italian Emilia-Romagna region, particularly in the provinces of Forlì-Cesena, Ravenna, Bologna, Modena, and Reggio Emilia. Additionally, on 16th-17th May, another intense meteorological event occurred, impacting the Romagna provinces. Such events caused extensive flooding, landslides, isolation of many areas, evacuation of numerous families, and significant damages to infrastructure, agriculture, buildings, and essential services. Many hilly municipalities were cut off, and thousands of civilians had to be evacuated, losses of life occurred. The consequences beyond the recorded immediate impacts on infrastructure and life were impressive, and extended to the regional economy, specifically in the Fruit Valley, where, in addition to immediate yield losses, long-term damage to orchard production is expected due to persistent flooding. The civil and cultural building heritage has also been heavily affected, both in the countryside and in inhabited centers. Some of the damage, direct and indirect, caused by flooding on buildings will also see an evolution in the medium to long term that will have to be addressed. This paper analyzes the reasons that led to the atmospheric phenomenon to understand the increasing potential occurrence of similar events from the perspective of climate change. This paper document analyzes the causes and effects of these events, additionally considering the future impacts of similar hazards potentially occurring in the context of climate change. It is crucial indeed to remark how such events, when occurring in high density agricultural areas, have the potential to threat the entire regional production system for extended periods. For example, the alteration of direct physiological processes due to root drowning may compromise production of entire productive agricultural extensions and many years will be required to their replacement.
Keywords: 
Subject: Environmental and Earth Sciences  -   Atmospheric Science and Meteorology

1. Introduction

From the evening of 1 May 2023 until 3 May 2023, the territory of the Emilia-Romagna region has been severely impacted by hydro-meteorological events. The weather conditions were of exceptional statistical intensity, resulting in a serious critical situation, particularly in Forlì-Cesena, Ravenna, Bologna, Modena, and Reggio Emilia. On 16-17 May, a furthermore intense meteorological event occurred that, in addition to affecting the territories of the Romagna mentioned above provinces and that of Bologna hit intensely also the territories of the provinces of Rimini and Pesaro-Urbino in the neighboring Marche region. This situation demands immediate attention and action.
The exceptional weather events have caused numerous floods and landslides, resulting in the isolation of many localities, the evacuation of many families from their homes, and serious damage to linear infrastructure, farms, public and private buildings, water defenses. The time of return to the accumulated rainfall recorded by the instruments at the ground, meeting the WMO standards, - has been shown in some cases much more than 500 years, especially in the basins of Senio, Lamone, and Montone. It is not easy to estimate, probably in the order of a few thousand years, the probability of occurrence of the two events of extremely high magnitude and so close - May 2-3 and 16-17. The succession of these two events brought the consequences highlighted in this study since the surface coverings were already saturated after the first meteoric event, and the most superficial horizons of the soils were almost completely impermeable
The events resulted in a total flooded area of approximately 58 km2, with an average flood height of 11 cm. Notably, 10% of the area, equivalent to almost 6 km2, experienced flood heights exceeding 68 cm. The deepest depths were found near the rivers Ronco east of Forlì and Savio north of Cesena. The largest flooded areas were in the flattest regions, with depths mainly less than one meter [1].
It should be immediately pointed out that the area studied does not present significant bibliographical references of the physiographic evolution, contrary to what emerges from the literature present in the hilly and Emilian portion of the regional territory [2,3,4,5,6,7]. In its current configuration, the study area’s physiography is relatively recent and results from repeated variations of the equilibrium relationships between sea level, solid inputs from watercourses, the extent of subsidence, and, not least, human action. In the present physical configuration of the landscape, traces of both natural and man-made evolution are, in fact, evident, especially in the last century brought about by man.
Among the most apparent and most important in shaping the morphological structure are the palaeo-rifts, the flood cones of different ages but nevertheless current, the dune belts testifying to the rapid eastward propagation of the coastline, and finally, the identification of those particularly depressed areas that were the site of marsh or lagoon basins.
Morphological escarpments are also signs that outline the landscape and distinguish areas of clear transition between different depositional environments. In the closed or semi-closed depressions, which have been most affected by the meteo-climate event, there is a low-energy hydrodynamic environment and, therefore fine sediments, silt-clay, and often peaty that are prevalent in natural conditions; they impede the discharge of water to the sea by making it impermeable. The rivers present in the area, although they have a torrential hydraulic character, generally have low outflow rates and, therefore a poor capacity to transport; the process of progressive deposition in the sediment bed, the water tends to rise above the surrounding plain, and during overflows or floods tends to deposit most of the sediment close to the point of departure because it is there that there is the most abrupt decrease in hydrodynamic energy. This created natural dykes; that is why the paleo alvei have high topographic conditions, with soils generally sandy, well-draining, with good carrying capacity.
During the advancing phases of the plain, there were accelerations in the compaction of sediments not sufficiently compensated for by the solid river input, large swampy areas - denoted valleys - were formed. Today almost completely reclaimed, where the outcropping soils present marked clayey-peaty characteristics with high compressibility often associated with more difficult vertical drainage [4].
The most recent physiographic-environmental evolution has then been characterized by the presence of natural and induced subsidence phenomena, the latter linked to human action on the territory. The latter derives from phenomena linked to the weight of large artifacts such as agglomerations of buildings, embankments, etc., the effects of which are, however, very localized. Disruptions to the hydrogeological conditions of the land, on the other hand, have proved to be extensive and of significant magnitude.
The extraction of water, from shallow or medium-depth aquifers to the extent that exceeds possibilities of spontaneous recharging of aquifers themselves, the cultivation of methaniferous water from quaternary deposits, and the draining of water for industrial and agricultural use, and not least, the draining of the aforementioned wetlands, have led to a significant lowering of the ground level over the last half-century, both in relation to the mechanical compaction of sediments no longer affected by the water table, and the oxidation of the peat contained in them.
In the context of this recent and delicate morphological evolution, the necessity for increased resilience is starkly evident in an environment currently dominated by extreme climatic conditions. The recent floods under study underscore the need to enhance our adaptive capacity to maintain and utilize areas that would otherwise be impracticable while preserving their rural culture and the memory of the age-old struggle between land and water.

2. Materials and Events Analysis

2.1. Brief Pedo-Morphological Analysis

The Emilia-Romagna Region’s geomorphology is diverse, featuring mountains to the south and southwest (corresponding to the Apennines), hilly areas in the foothills, and the Po Valley occupying most of the northern and northeastern sectors. The region covers approximately 22,452 km2, including a mountain area of 5635 km2, a hilly area of 6084 km2, and a plain area of 10,733 km2. The Emilia-Romagna Apennines cover over 5,000 km2 in the southern and southwestern parts of the region, with peak altitudes reaching 2165 m above sea level (Monte Cimone in the province of Modena). The Ligurian Domain, which constitutes the upper structural units and is relatively more allochthonous, is present extensively in the Apennines of Emilia, from Pavia to Bologna. These formations, dating back to Upper Jurassic age through to the lower Eocene, consist of tectonic melanges and olistostromes with a high clay content that expands in the presence of water. These formations are overlain by a thick series of calcareous or arenaceous turbidites, which make them susceptible to erosion and landslides. Furthermore, the Epi-ligure Sequence of the Middle Eocene is made up of sandstones that are resistant to degradation processes, except for clay breccias and olistostromes, which have similar lithological characteristics to the Ligurian units. In the Romagna area, turbidite sequences are widely visible [1].

2.2. Synoptic and Mesoscale Analysis of the Event 1-3 May 2023

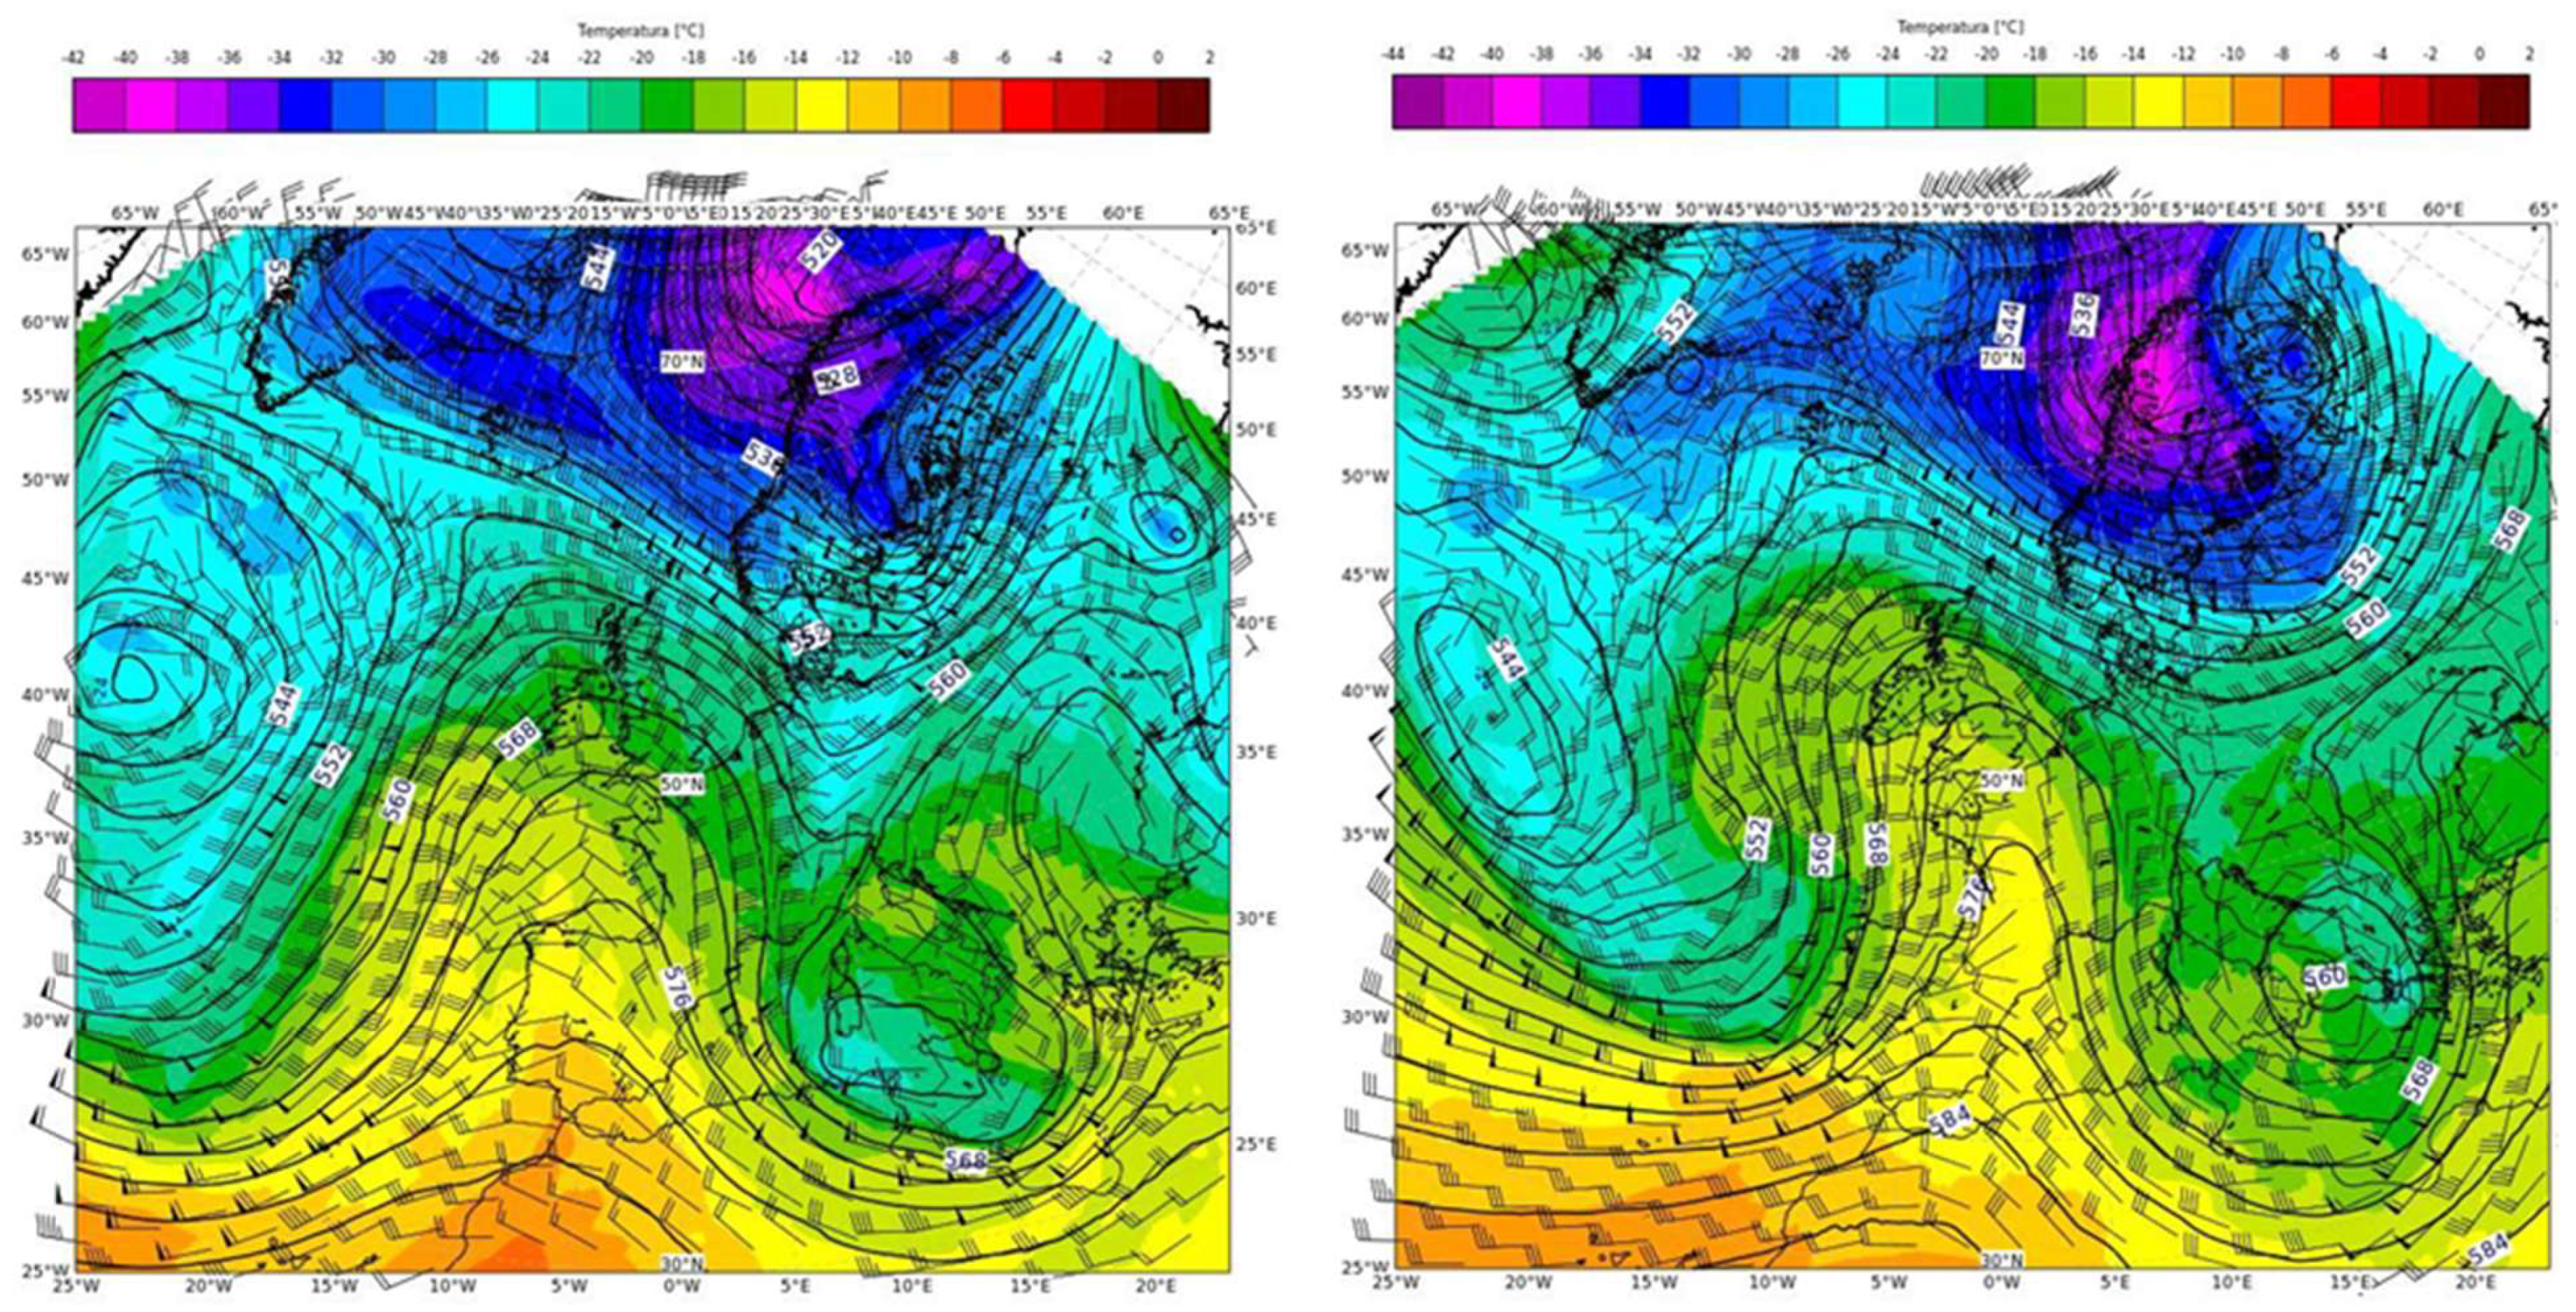
The first extreme precipitation event occurs between 1 and 3 May 2023, when a baric minimum on the ground, previously closed on the Iberian Peninsula, in its evolution towards the East enters into phase with a trough of polar origin at altitude descending through France, leading to the formation of a vast cyclonic circulation at all altitudes over the central Mediterranean. It triggers a second baric minimum in the lower layers which initially isolates itself on the central Tyrrhenian Sea. The blocking action exerted by an anticyclonic promontory of sub-tropical origin present over eastern Europe significantly slows down the eastward evolution of the aforementioned baric minimum, which remains almost stationary with the pivot blocked over central Italy throughout May 2, while a second baric minimum closes over the southern Mediterranean.
The event is associated with a frontal system, the occluded branch of which persists for many hours over Emilia-Romagna. This persistence is due to the continuous feed of very hot air masses of sub-tropical origin and, more significantly, humidity from the South-East. These converge with colder flows in the north-eastern zones, activated both by the Mediterranean cyclogenesis and the slow expansion of an anticyclonic wedge in correspondence with the Alpine region. The occluded branch’s interaction with these weather systems contributes to the prolonged and intense precipitation.
On May 3, the trough evolved, albeit slowly, towards the East, gradually replaced by an anticyclonic promontory expanding from Western Europe to the northern Italian regions, favoring a progressive improvement in Emilia-Romagna (Figure 1).
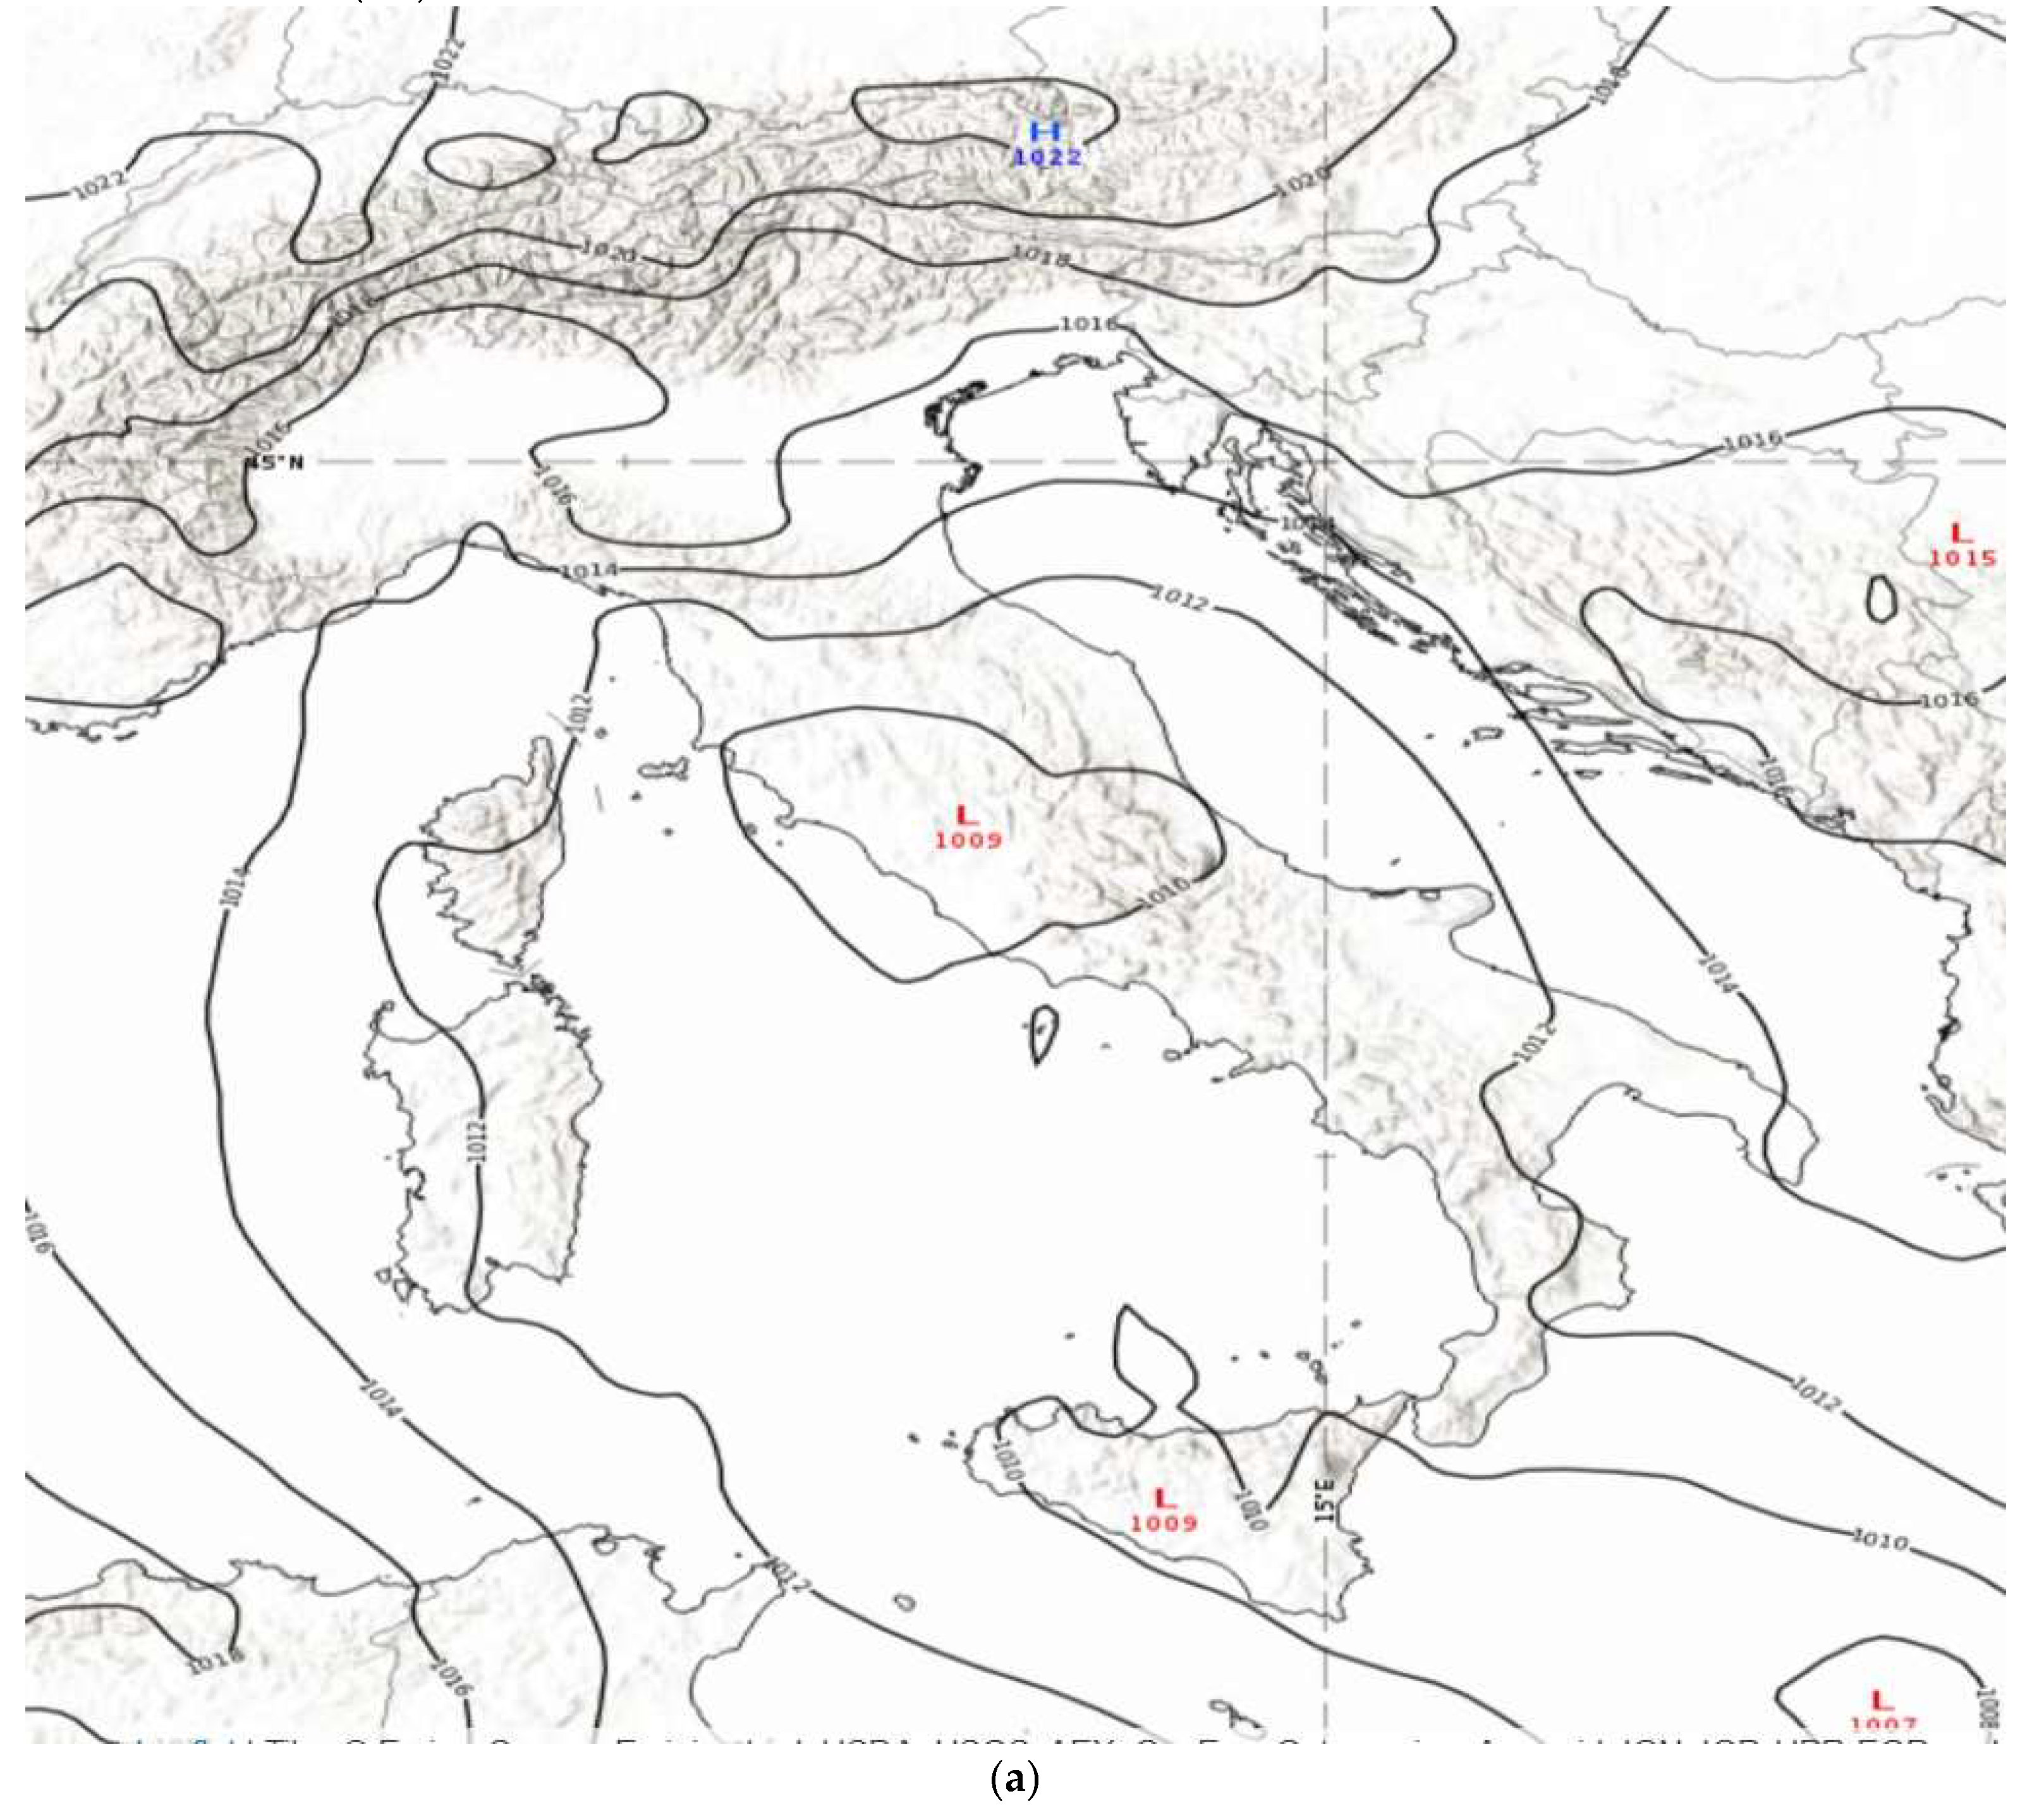
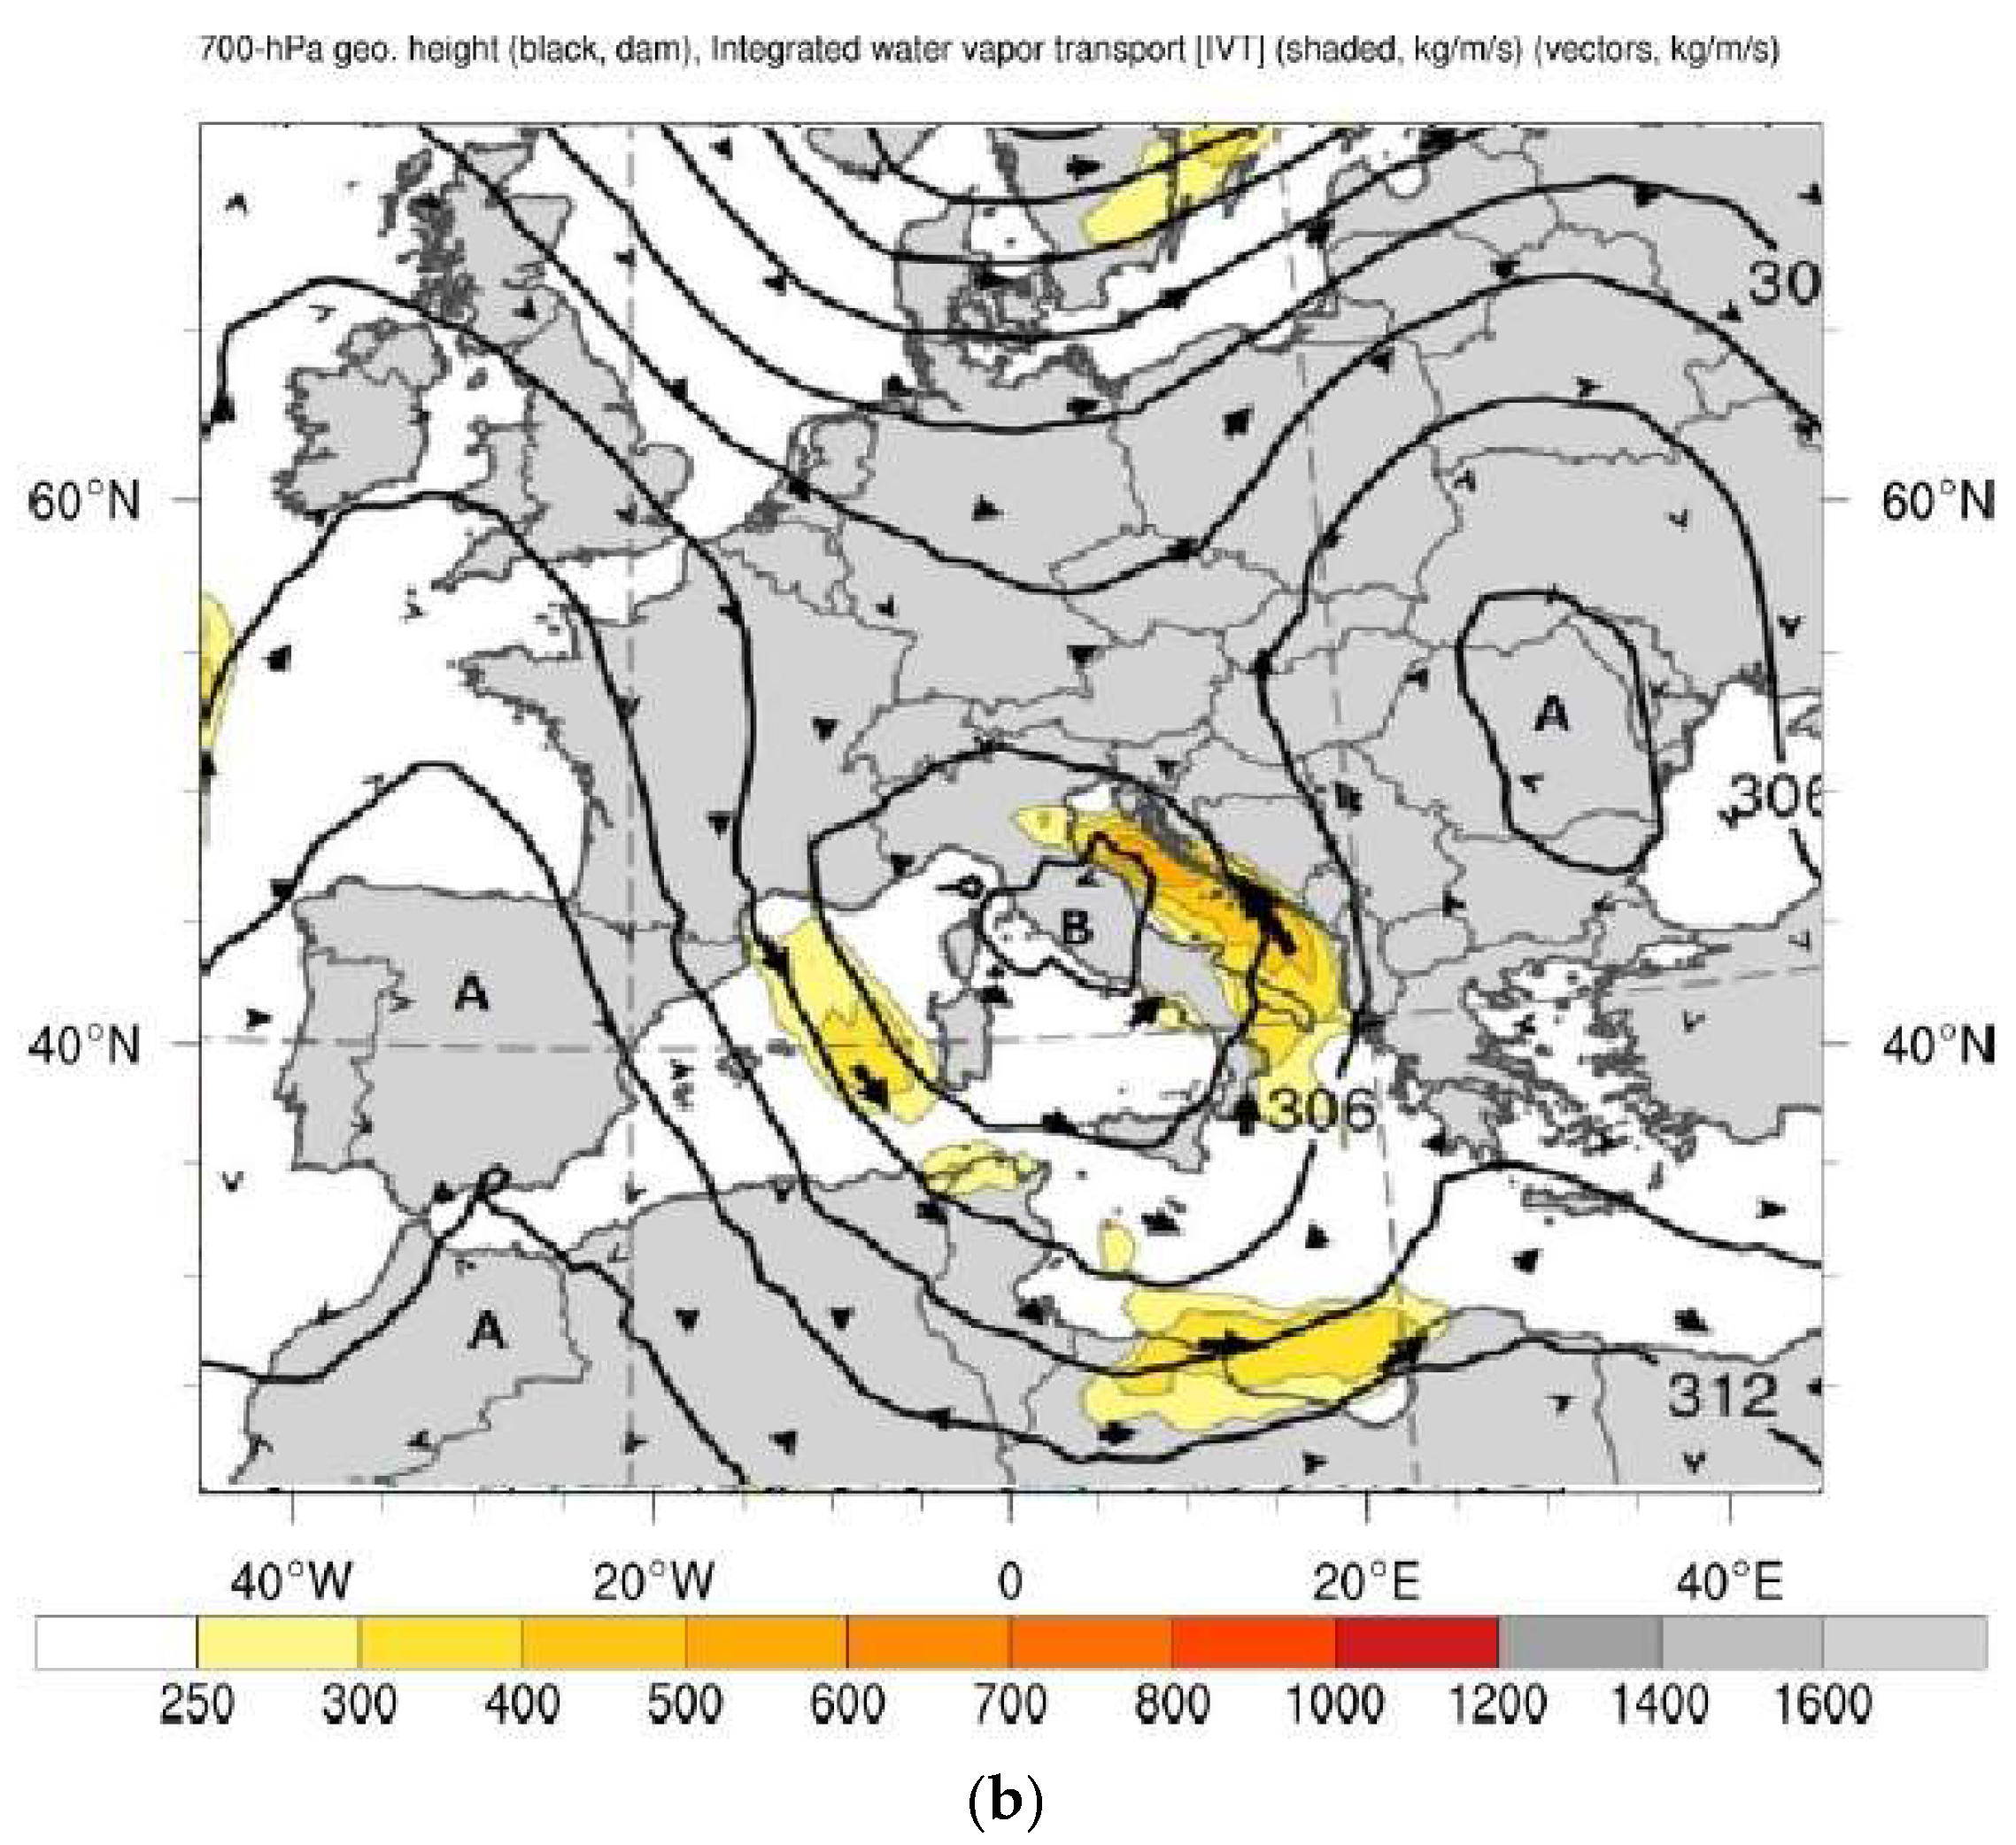
In Figure 2a,b are reported the baric analysis at hour 12 UTC of May 2 2024 at the surface (2a) and at 700 hPa (2b).
At 12 UTC on May 2, the low pressure closed over central Italy and, although not particularly deep, is characterized by a high baric gradient over the area of the Upper Adriatic and the north-eastern Italian regions due to the increase of the pressure in correspondence with the Alpine arc due to the accumulation of colder and denser air coming from central Europe. A maximum of relatively high pressure closes over the eastern Alpine sector (H). The depression over central Italy attracts a mass of warm air extremely rich in water vapor from the southeast (scirocco), represented by high values of Integrated Vapor Transport (IVT, Figure 3), which is channeled along the Adriatic. It enters the Po Valley from the East, then converges with the colder current from the Northeast, forced by increased pressure on the Alps, eastern Emilia, and Romagna. The resulting flow impacts the Apennines, and the orographic barrier increases precipitation upwind due to forced vertical motions (stau). This situation remains stationary for many hours due to the blockage exerted by larger-scale high pressures in the West and East. The IVT is an integrated measurement of the flow of water vapor along the atmospheric column, which combines wind speed and water vapor concentration. It is calculated using wind speed and relative humidity data along different levels of the troposphere according to the relationship:
Preprints 117129 i001
where:
q is the mixing ratio (g/kg), u and v are the horizontal components of wind speed in m/s, p is the atmospheric pressure in hPa, and ps is the surface pressure in hPa.
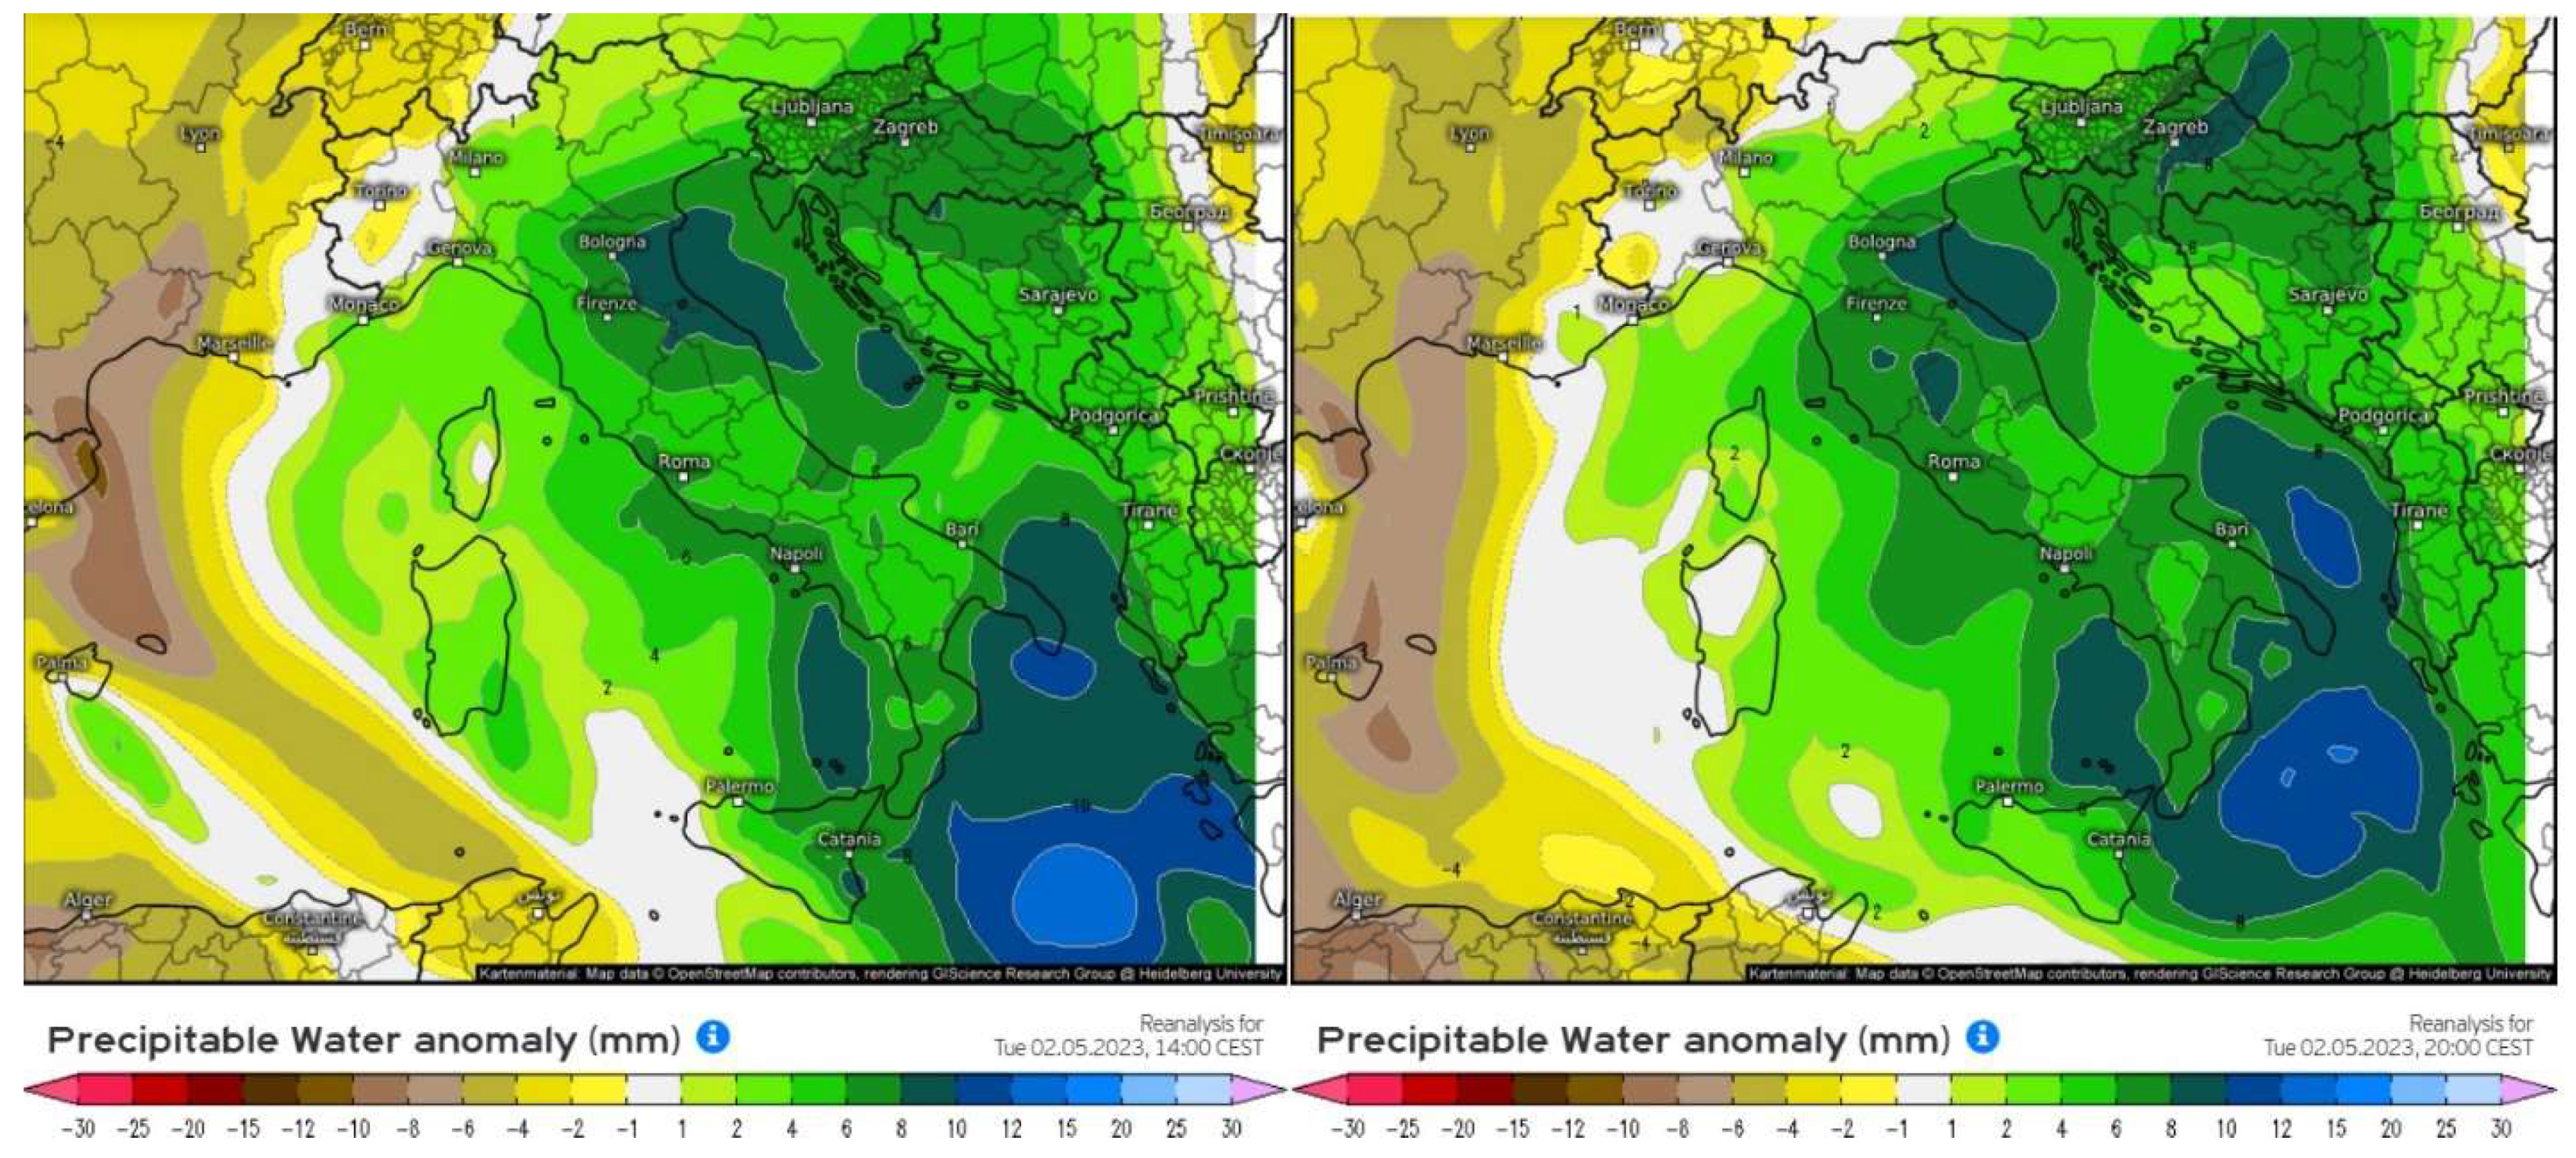
We observed a robust south-eastern flow along the Adriatic Sea with Integrated Vapor Transport (IVT) values exceeding 400 kg/m-1 s-1. This indicated a very humid air mass coming from the central-eastern area of Emilia-Romagna and facing east. The cyclonic vortex remained stationary throughout May 2nd. It slowly moved east in the early hours of Wednesday, May 3rd, and this led to moderate to intense rainfall persisting for many hours in the central-eastern sector of Emilia-Romagna. The event lasted for around 36 uninterrupted hours, resulting in extreme precipitation values in some river basins, considering the climatology of the period. The precipitation was mainly stratiform with low to moderate average hourly intensities (2-5 mm/h), occasionally interrupted by short showers with a maximum rain rate of around 15-20 mm/h, primarily in the mountainous areas. The anomaly values of precipitable water associated with the rise of the south-eastern flow further confirmed the particularly humid and water vapor-rich air mass. “Precipitable water” (PW) provides an absolute measurement of the water content of the air, different from relative humidity, which depends on temperature and the air’s water retention capacity. Anomalies above 30 mm generally indicate an atmosphere prone to producing intense or abundant precipitation if sustained over time. Figure 3 illustrates the anomaly of precipitable water in mm between 12 and 18 UTC over Italy. It shows values between 8 and 10 mm over eastern Emilia and Romagna, indicating the presence of a particularly humid southeasterly flow along the entire Adriatic region.
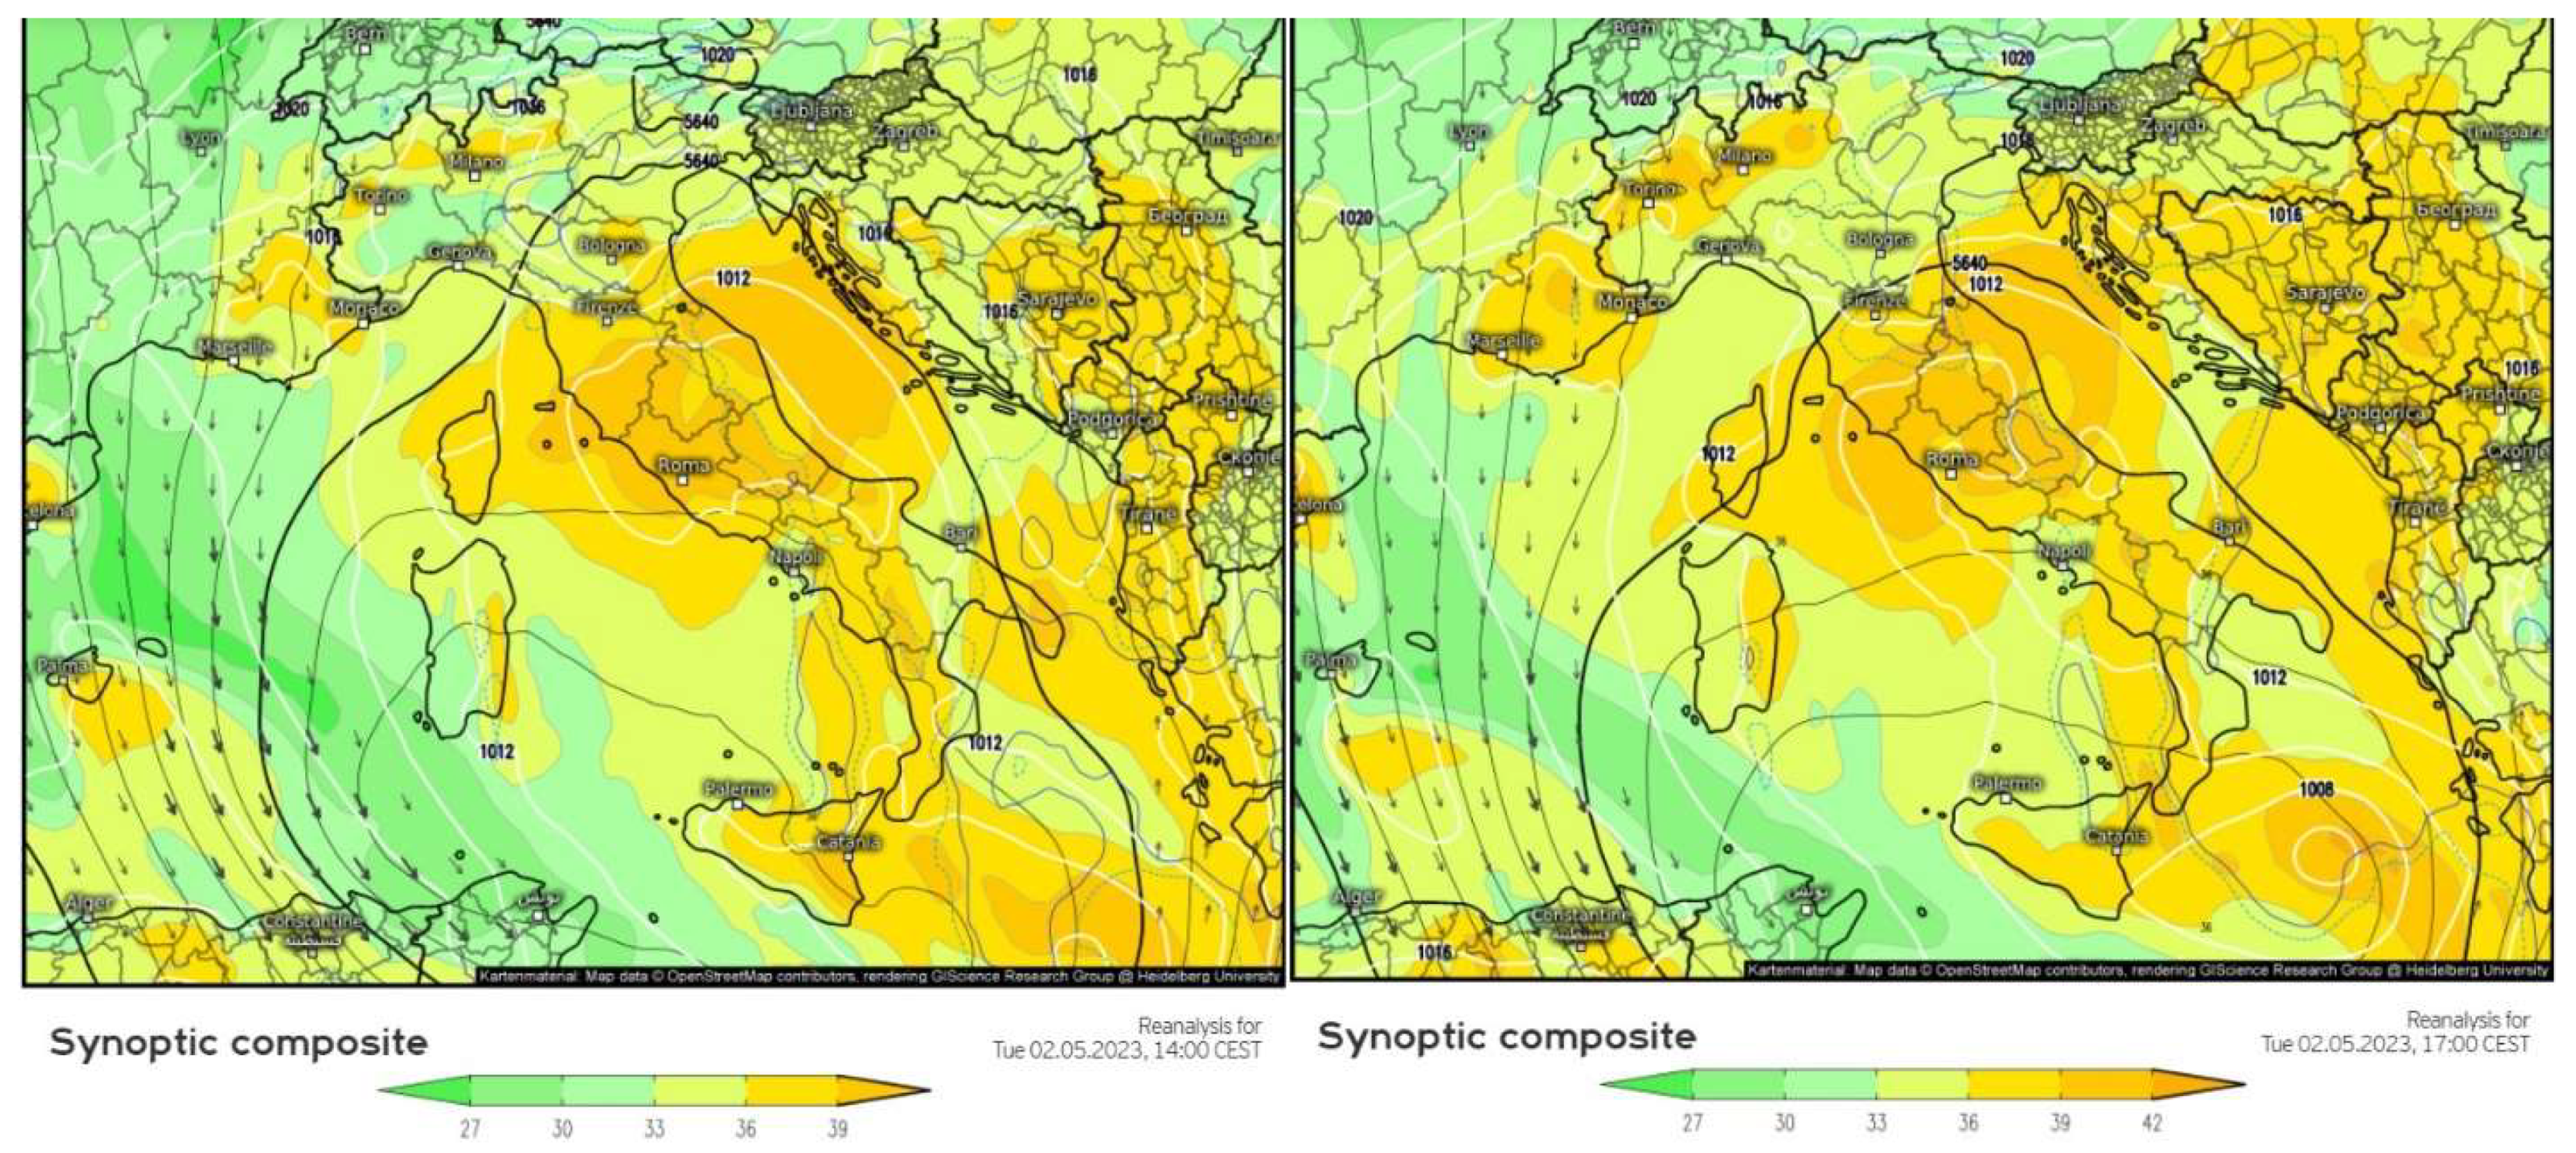
The synoptic composite of Figure 4 summarizes and satisfactorily synthesizes the main components and forcings at the origin of this first extreme precipitation event due to persistence.
In the maps of Figure 4 the white lines represent the isobars, the colored ones indicate the Theta-E values on the isobaric plane of 850 hPa; the black lines indicate the contours of the geopotential height on the 500 hPa isobaric level, while the vectors represent the wind field on the 300 hPa isobaric level. In particular, the advection of high potential equivalent temperature values at 850 hPa which rise up the Adriatic appears to be quite significant, with a boundary with a strong Theta-E gradient which is located over eastern Emilia and Romagna, identifying the presence of a front between a warm and humid air mass and a colder and drier one from the North-East.
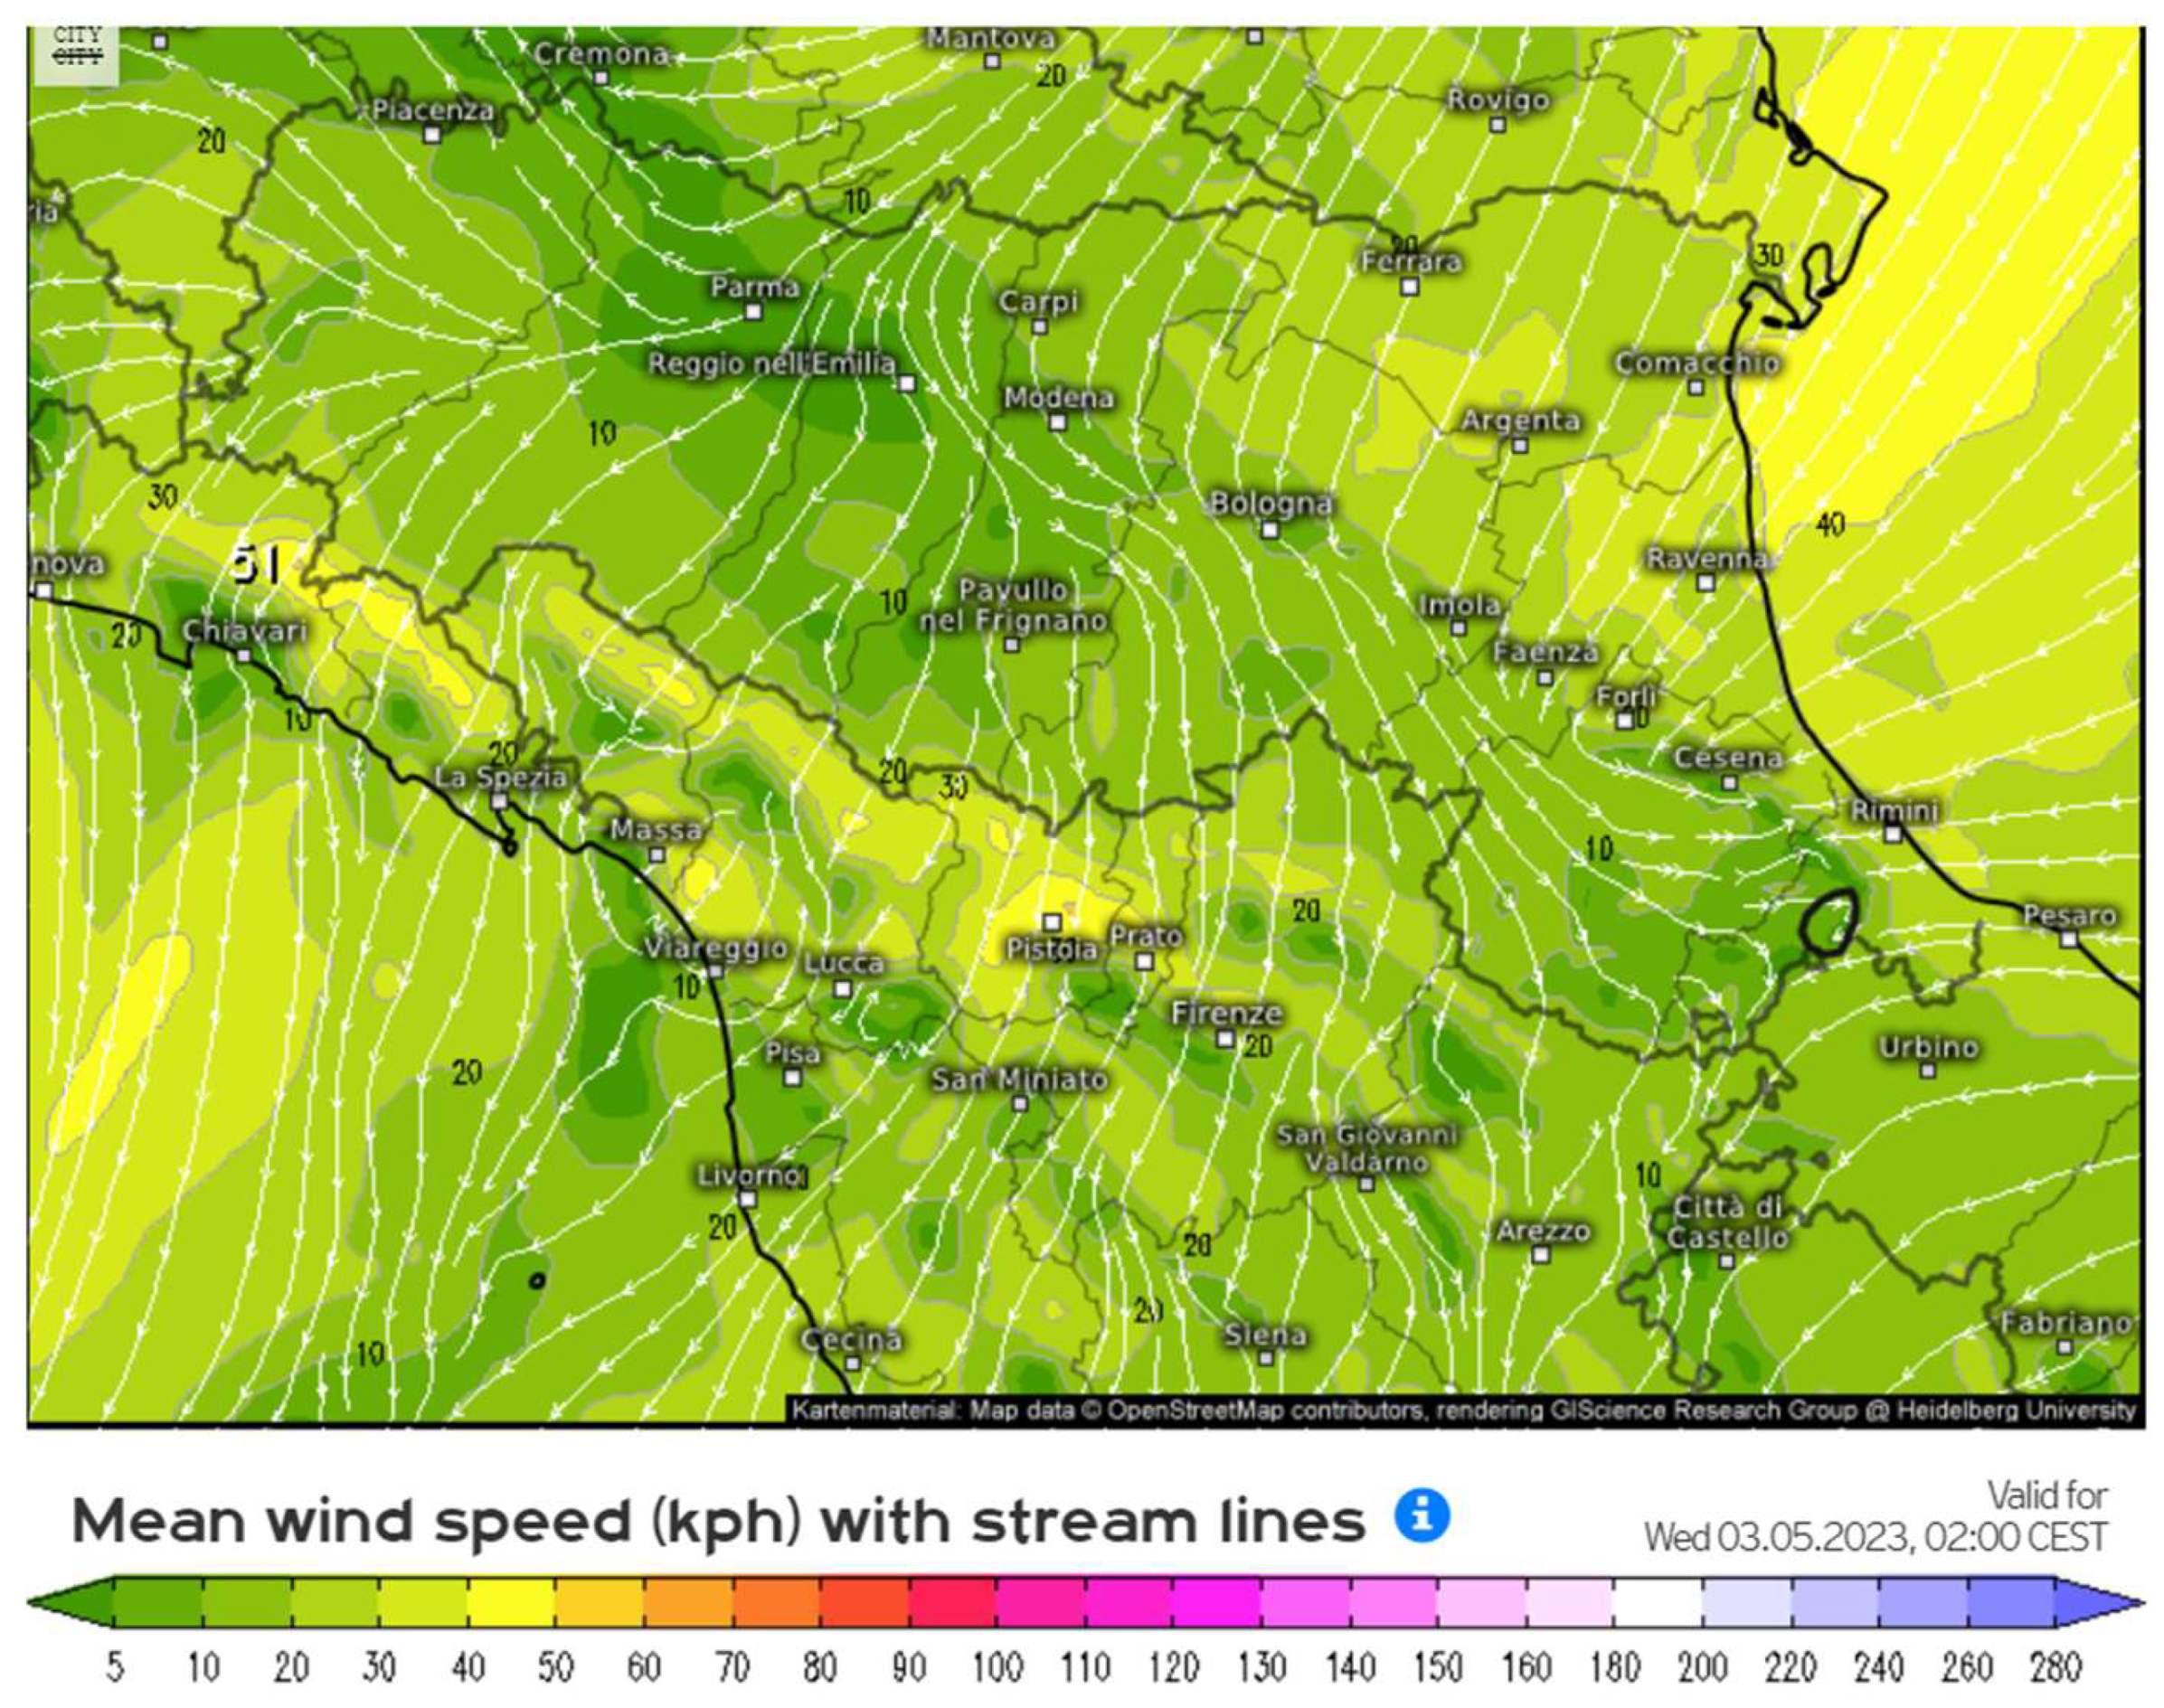
Within the dynamics determined on a synoptic scale, and briefly exposed above, some forcings more attributable to the mesoscale have undoubtedly contributed to increasing the rainfall quantities, in particular on the Apennine belt of eastern Emilia and Romagna. Figure 5 shows an analysis of the wind direction and speed fields at 10 m relating to 02 UTC on 3 May.
We observe a significant synoptic flow originating from the northeast (bora), which, after traversing the Adriatic Sea, infiltrates the coastal strip and the lowland areas of eastern Emilia Romagna, carrying an exceptionally humid air mass. This flow converges with a north-western current at the mesoscale, a result of the Apennine chain’s presence (barrier jet) and exhibits cold air damming characteristics due to the accumulation of moderately cold air upwind of the mountains. The boundary formed by this convergence, which remains stationary for extended periods, further stimulates the formation of precipitating cloud systems due to the convergence of humidity, even without electrical activity. This boundary, particularly active at the foot of the Apennine chain, induces more intense rainfall than in the lower plain areas, adding to the orographic component (stau) and amplifying the accumulations on the middle and lower Apennines.
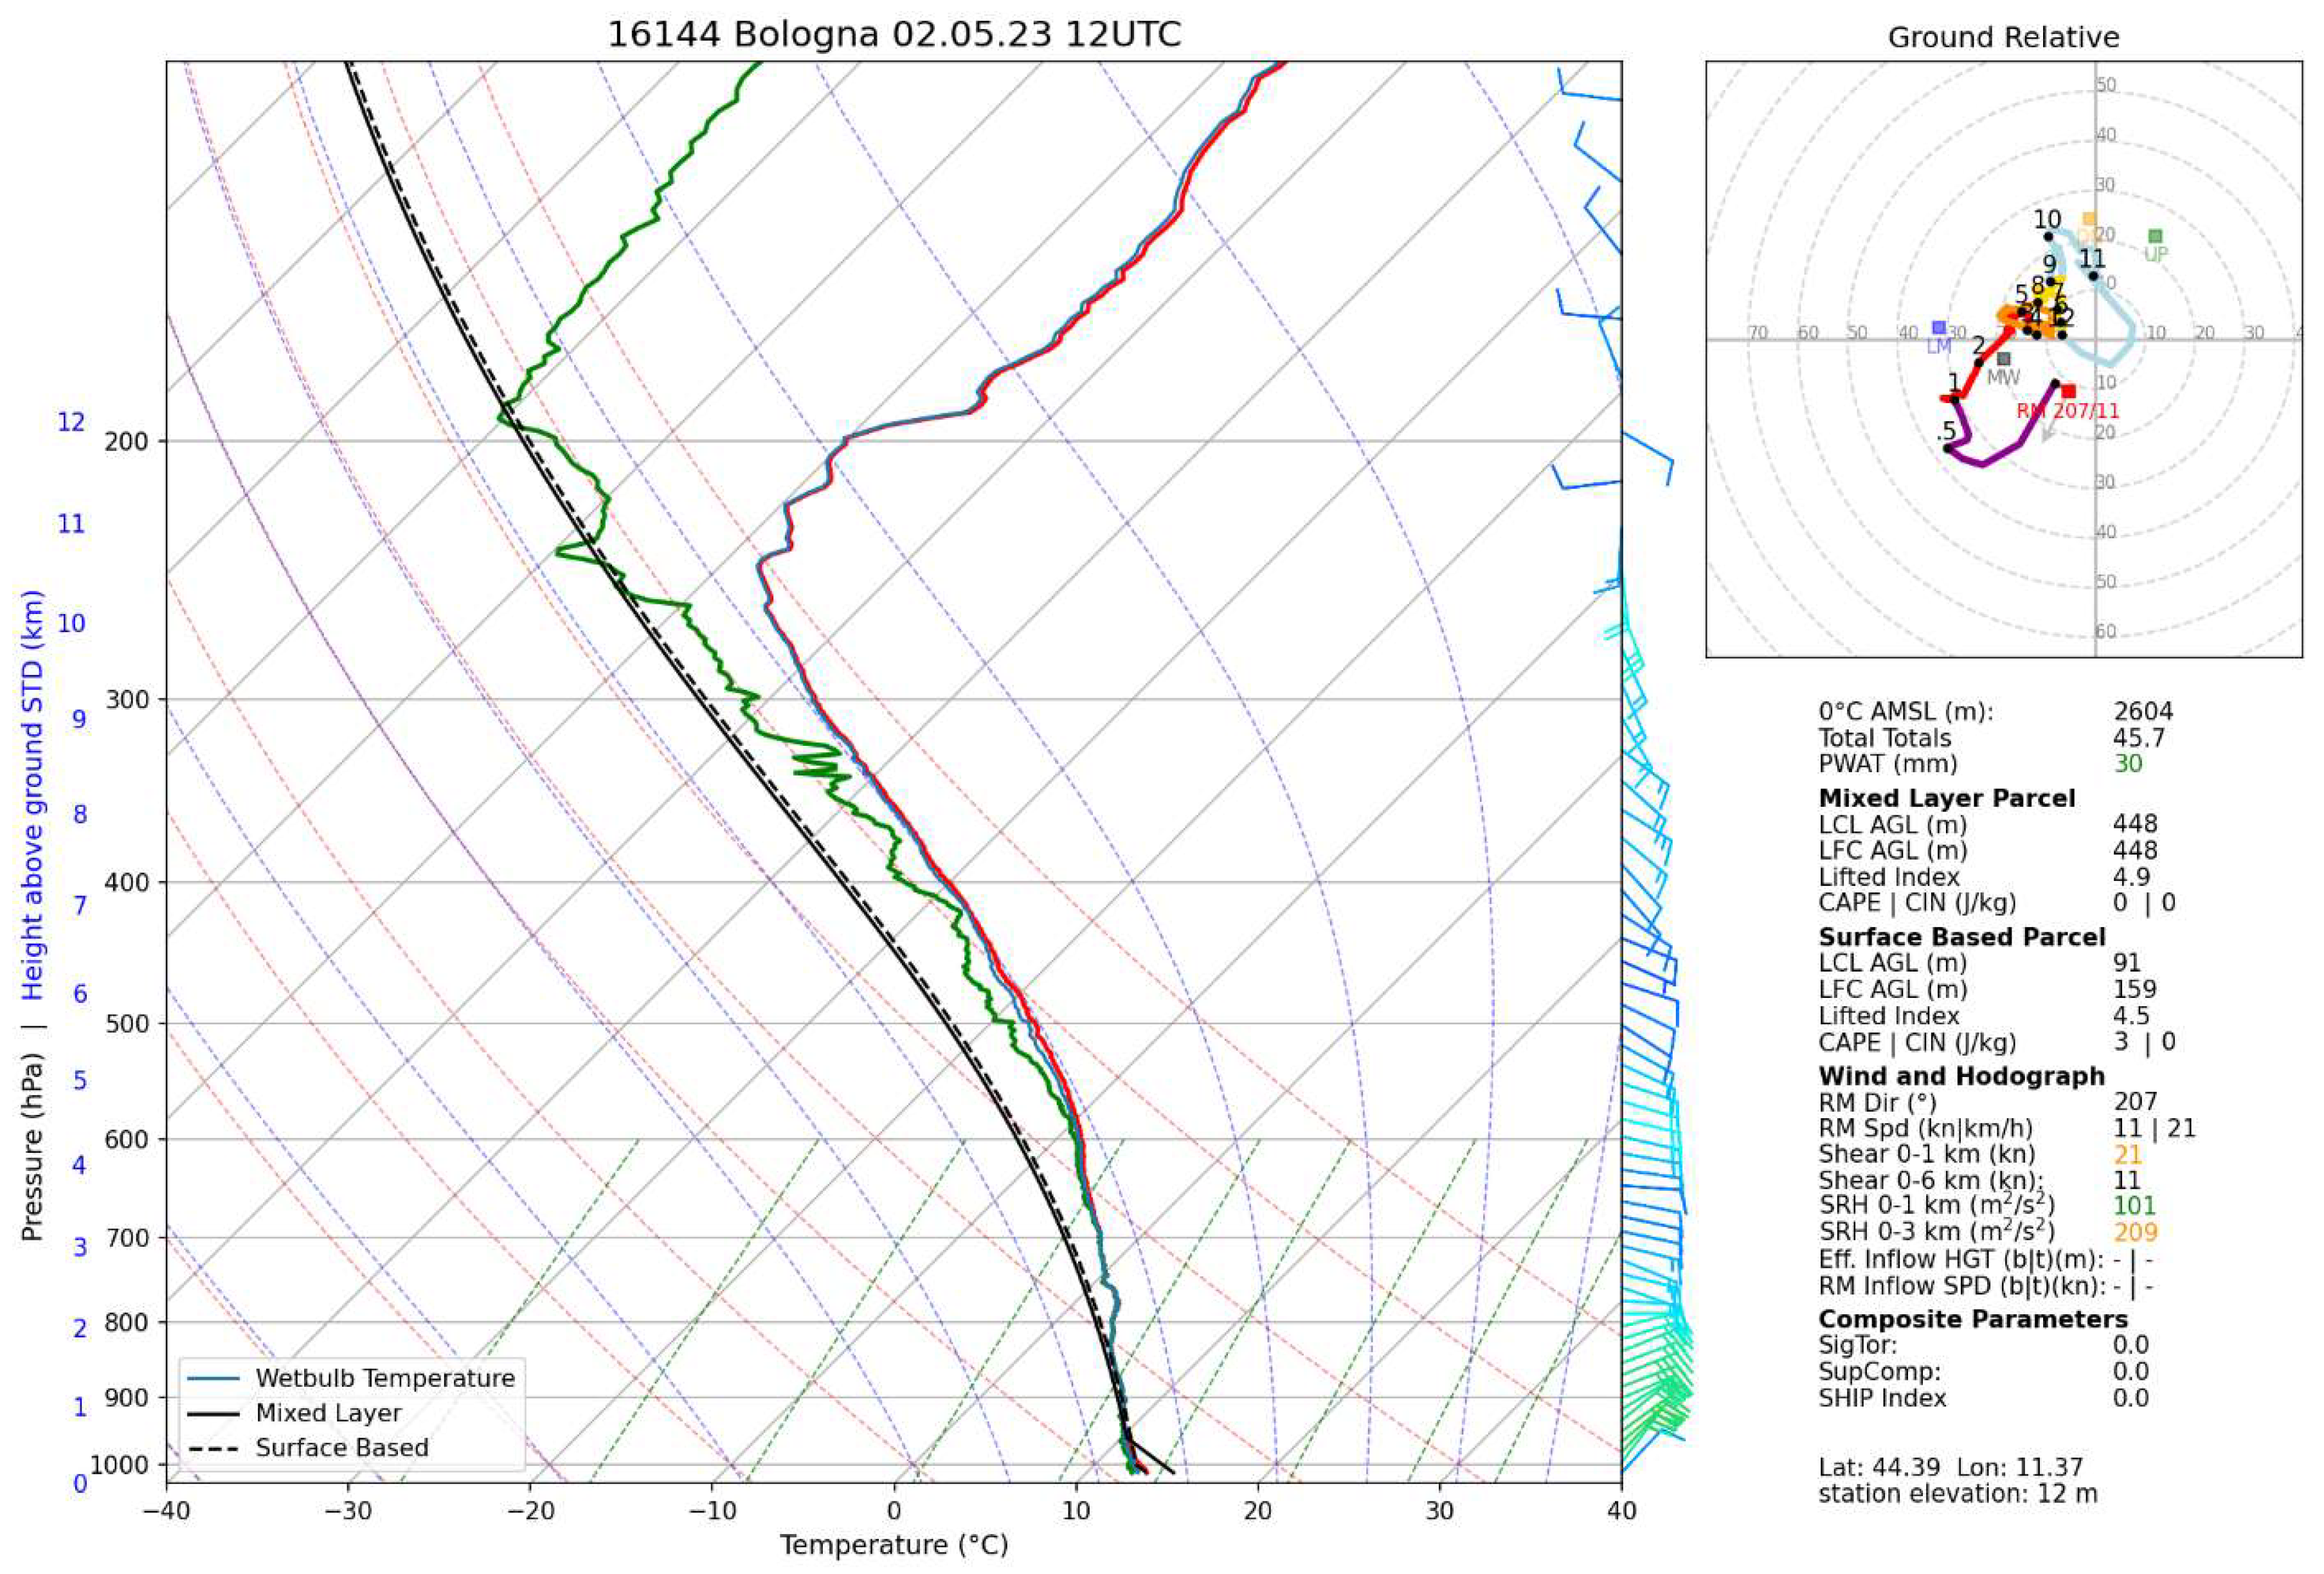
Figure 6 shows the radio sounding at 12 UTC on 2 May 2023, launched at the base of San Pietro Capofiume (BO).
The radio sounding at 12 UTC on 2 May 2023, launched at the base of San Pietro Capofiume (BO), provides a detailed analysis of the following key aspects:
  • The high proximity between the temperature and dew point curves in much of the lower troposphere (up to the isobaric level of 400 hPa) indicates a saturated or nearly saturated environment, prone to the formation of intense cloud cover and associated precipitation.
  • The surface-based condensation level (LCL) is located below 100 m above the ground, suggesting very high relative humidity values with rapid saturation from the lowest layers of the rising air mass.
  • The surface-based Lifted Index, at 4.5°C, indicates prevailing stability, as evidenced by the absence of storm activity. However, in the context of prolonged rainfall of stratiform origin, this stability does not necessarily limit the rainfall.
  • The CAPE (3 J/kg) and the CIN (0 J/kg) are very low, indicating little energy available for convection. This aspect is more consistent with prolonged rain rather than intense thunderstorm activity
  • The precipitable water (PWAT) shows a value of 30 mm, which is moderate in terms of concentrated and short-lived heavy rainfall but also suggests the presence of an adequate quantity of water vapor in the atmosphere to withstand continuous rainfall
  • The hodograph shows a wind characterized by a slight clockwise directional variation with height (veering) with weak or moderate shear. The vertical profile is, however, typical of very disturbed conditions in the area under examination, with south-eastern flows that are distinctly cyclonic and very humid at altitude, which overlap with almost saturated north-eastern currents in the lower layers up to and including the PBL. This type of wind profile favors persistent rainfall caused by stratiform clouds. It is typical of occluded fronts that rise across the Adriatic in the case of Mediterranean cyclogenesis, whose rainfall adds to that induced by the orographic lifting of highly humid air over the Apennines.

2.3. Synoptic and Mesoscale Analysis of the Event 16-17 May 2023

The second extreme precipitation event occurs between 16 and 17 May 2023, being almost a “twin” to the previous one but even more intense and with a slightly different origin, where the convective component takes on greater importance, particularly in the first phase of the event.
From May 15th, a unique synoptic situation unfolds. In the West, an anticyclone forms between the Atlantic and the Iberian Peninsula, while in the East, a vast promontory emerges from the eastern Mediterranean to north-eastern Europe, setting the stage for the extreme precipitation event.
A depression, a key player in the unfolding meteorological drama, inserts itself between the two baric structures. It triggers a deep depression vortex that closes between Tunisia and Sicily, forming a baric minimum on the ground and setting the stage for the extreme precipitation event.
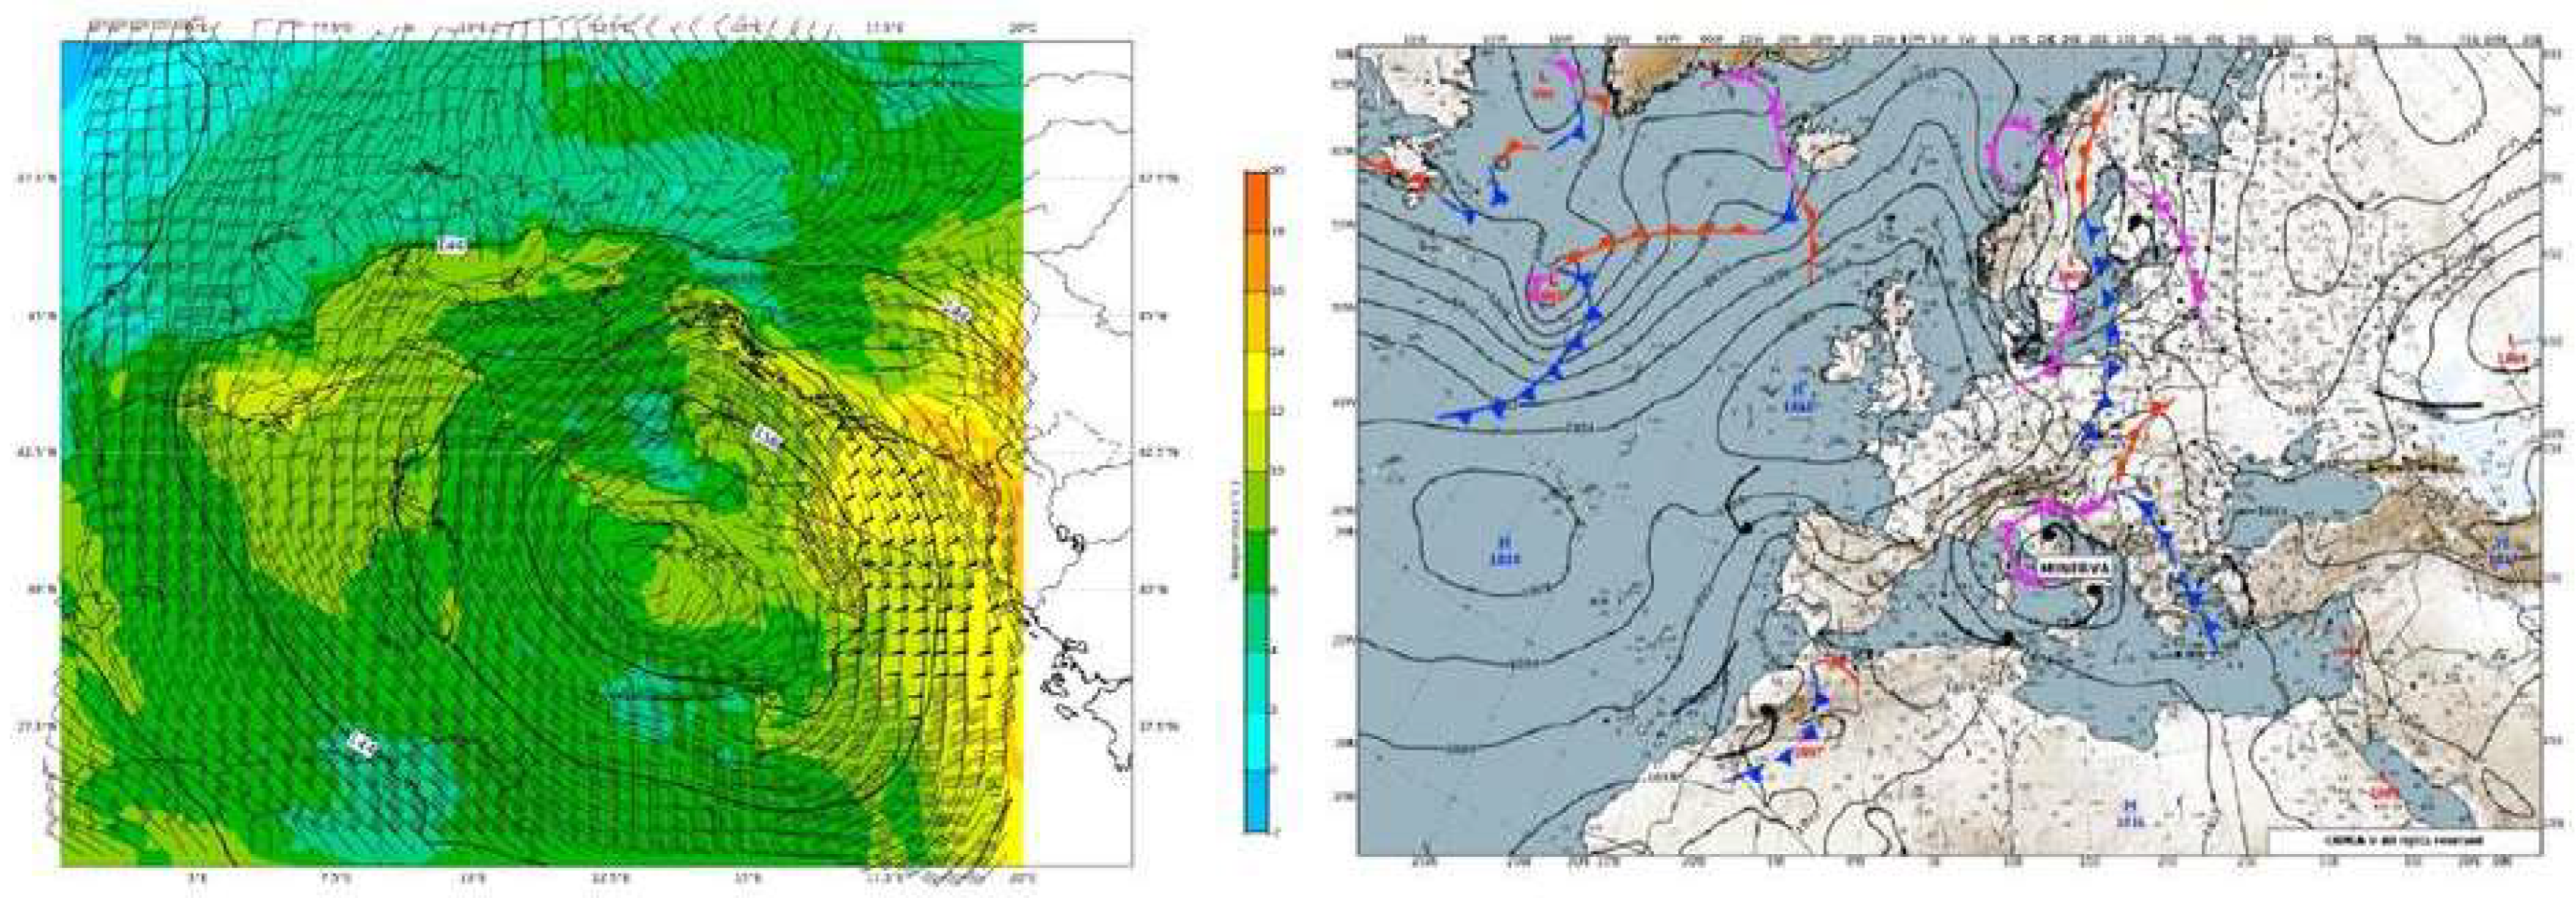
The aforementioned depression vortex, represented by the Meteorological Service of the Air Force with the name “Minerva” (European Storm Naming program), causes conditions of intense instability that first involve the southern regions of the Peninsula, then the central ones, until reaching Emilia-Romagna on 16 and 17 May 2023.
Starting from the night between 15 and 16 May, “Minerva”, in its evolution towards the central Italian regions, triggers an intense cyclonic circulation which recalls extremely humid scirocco currents from the south-eastern Mediterranean towards the Adriatic sector and intense winds of bora which impact on the coasts of the northern Adriatic, more substantial than the event at the beginning of the month, causing a more significant baric gradient (deeper low pressure).
The interaction between these air masses and the confluence of the south-eastern and north-eastern winds on the ground near Romagna renews, but in a more severe form, the same dynamics as the event of 1-3 May, causing intense rainfall, including thunderstorms, especially during the morning of the 16th. The composite of Figure 7 shows the geopotential topography analysis on the 500 hPa isobaric level and the synoptic analysis on the ground during this second event.
For the entire day of May 16th and for a good part of May 17th, the almost stationary depression vortex over central Italy continues to drive perturbed impulses in sequence associated with very humid air masses directed towards the Po Valley, favoring the persistence of precipitation in approximately the same areas already affected by the event at the beginning of the month.
The barrier effect of the Apennine mountains is renewed and once again concentrates rainfall on the windward side (stau), on the hilly areas between Bologna and Romagna. Figure 8 represents the transport of humidity via flow lines at 1000 hPa and the parameter TCW (Total Column Water, i.e., the value integrated on the water column, regarding water vapor and hydrometeors contained in the clouds in kg/m2), which highlights how the air mass attracted by the depression system is considerably rich in water vapor (high TCW values in orange) and enters eastern Emilia and Romagna from the Adriatic via eastern or north-eastern currents.
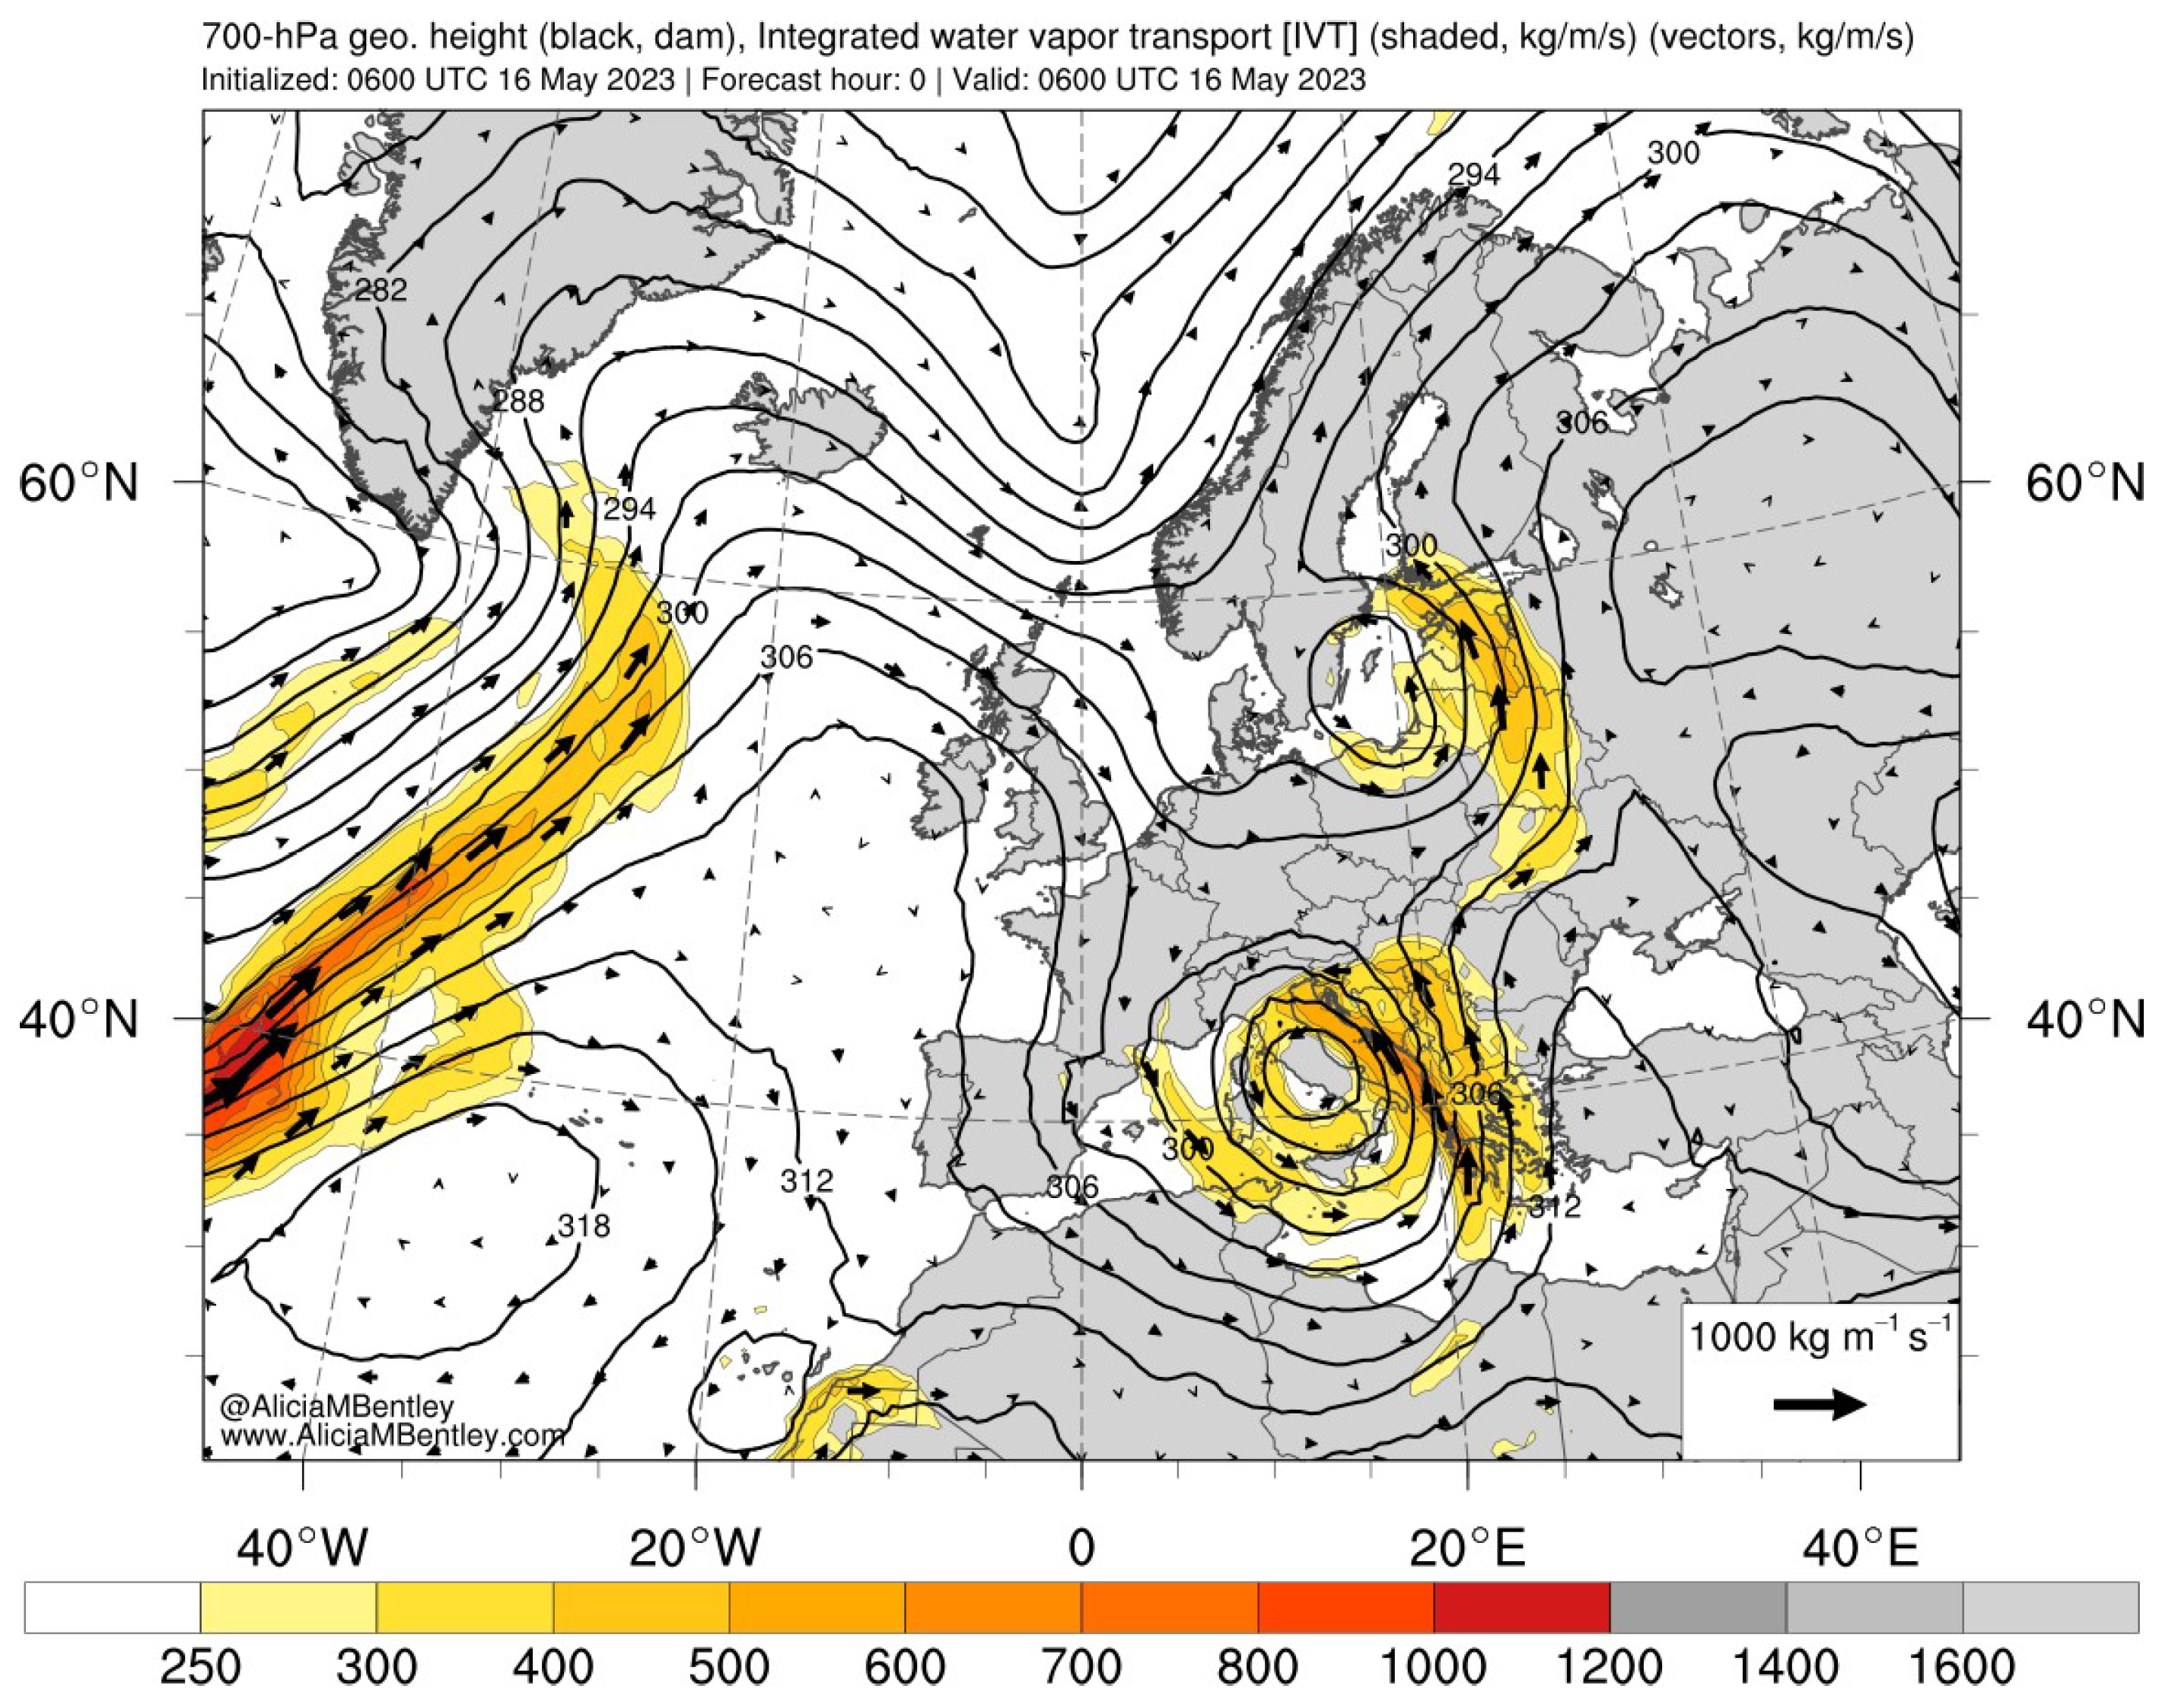
As in the case of the 1-3 May event, in Figure 9 we reconsider the analysis of water vapor transport (IVT).
Along the Adriatic Sea, the entry of a south-eastern flow is repeated, the IVT values of which in this case exceed 600 kg/m-1 s-1 (therefore higher than the event at the beginning of the month), thanks to an air mass even richer in water vapor that enters eastern Emilia and Romagna from the east. The cyclonic vortex, significantly impacting weather patterns, is again not very evolutionary but much more intense than the previous one. Therefore, it favors insistent moderate rainfall but with showers and thunderstorms, particularly on the morning of the 16th. The persistence of the event leads to approximately another 30 hours of abundant rainfall with again extreme accumulations and, in some cases, even higher than those of 1-3 May.
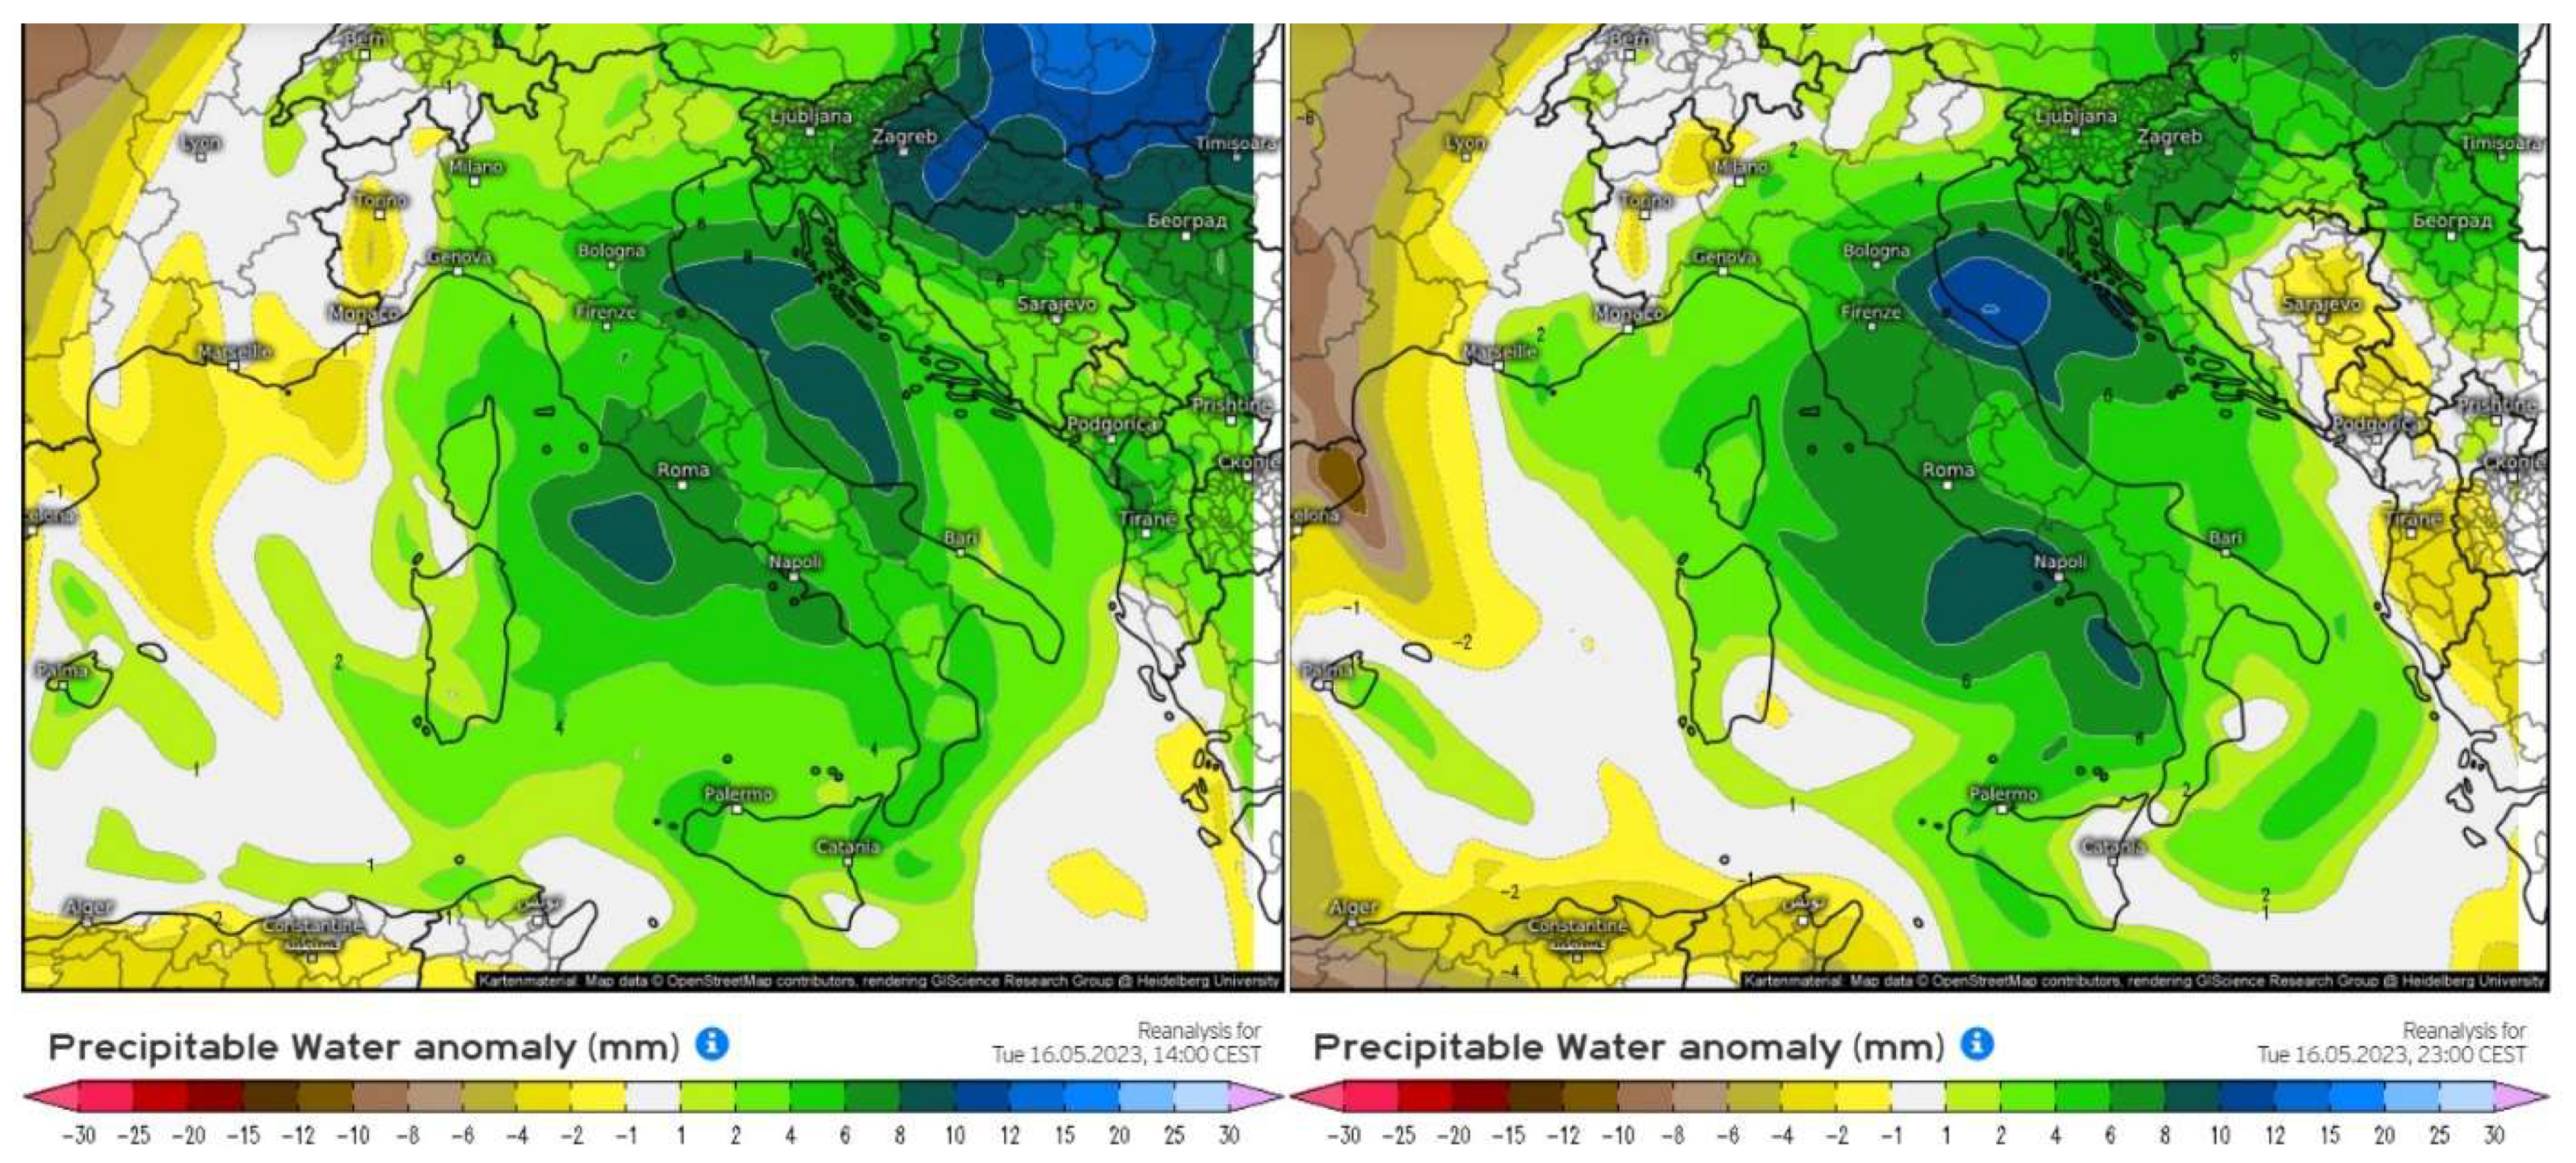
Figure 10 underscores the anomaly of precipitable water, in mm, between 12 and 21 UTC over Italy. The values , ranging between 10 and 12 mm, are particularly significant in eastern Emilia and Romagna, especially in the evening. This anomaly is primarily due to the influence of a somewhat humid south-eastern flow that ascends the Adriatic, carrying the moisture that contributes to the observed conditions.
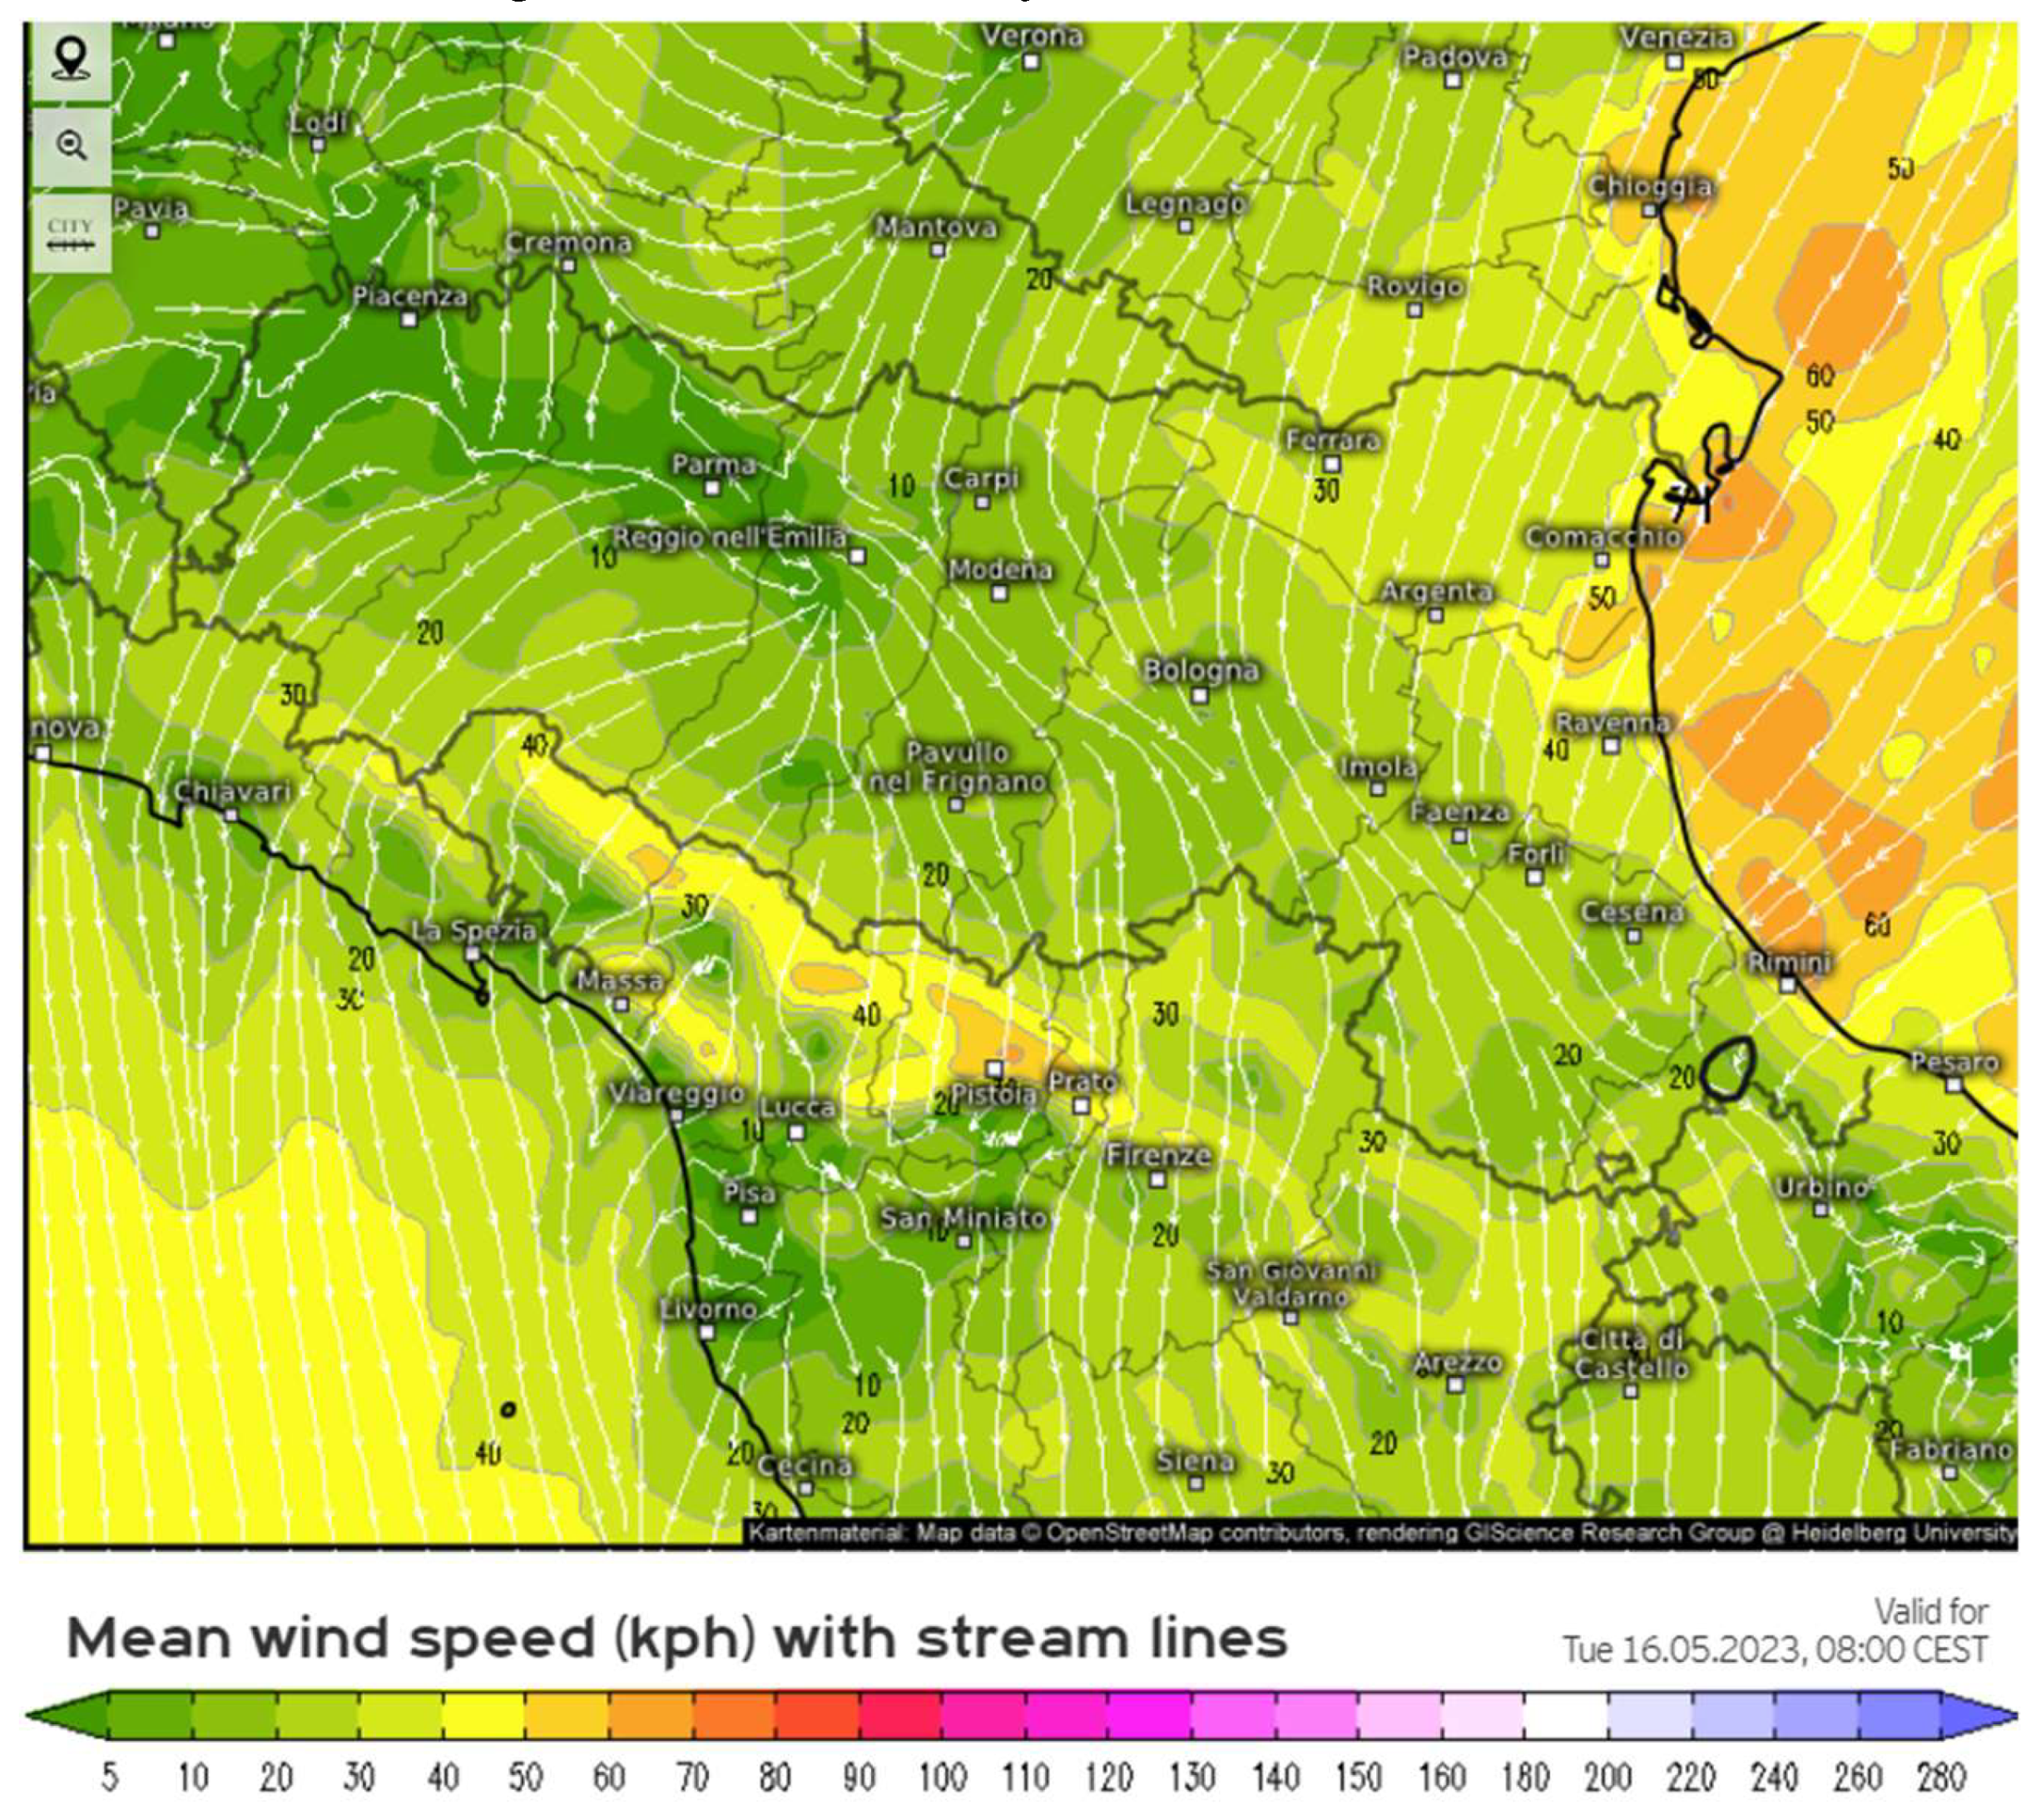
Similarly to what occurred in the event of 1-3 May, a synoptic flow coming from the North-East (bora) is renewed, which from the Adriatic Sea affects the coastal strip and the low plain areas of eastern Emilia Romagna, transporting the highly humid air mass. At the same time, the confluence with a northwest current at the mesoscale (Apennine barrier jet) repeats with an accumulation of moderately cold air upwind of the mountains. Once again, the border remains stationary for many hours, mainly at the foot of the Apennine chain, causing more intense rainfall in approximately the same areas as the previous event, adding to the orographic component (stau). In this situation, the area involved is larger than the episode at the beginning of the month, also affecting the entire Rimini area, which had previously been largely spared. Figure 11 shows an analysis of the wind direction and speed fields at 10 m relating to 08 UTC on May 16th.
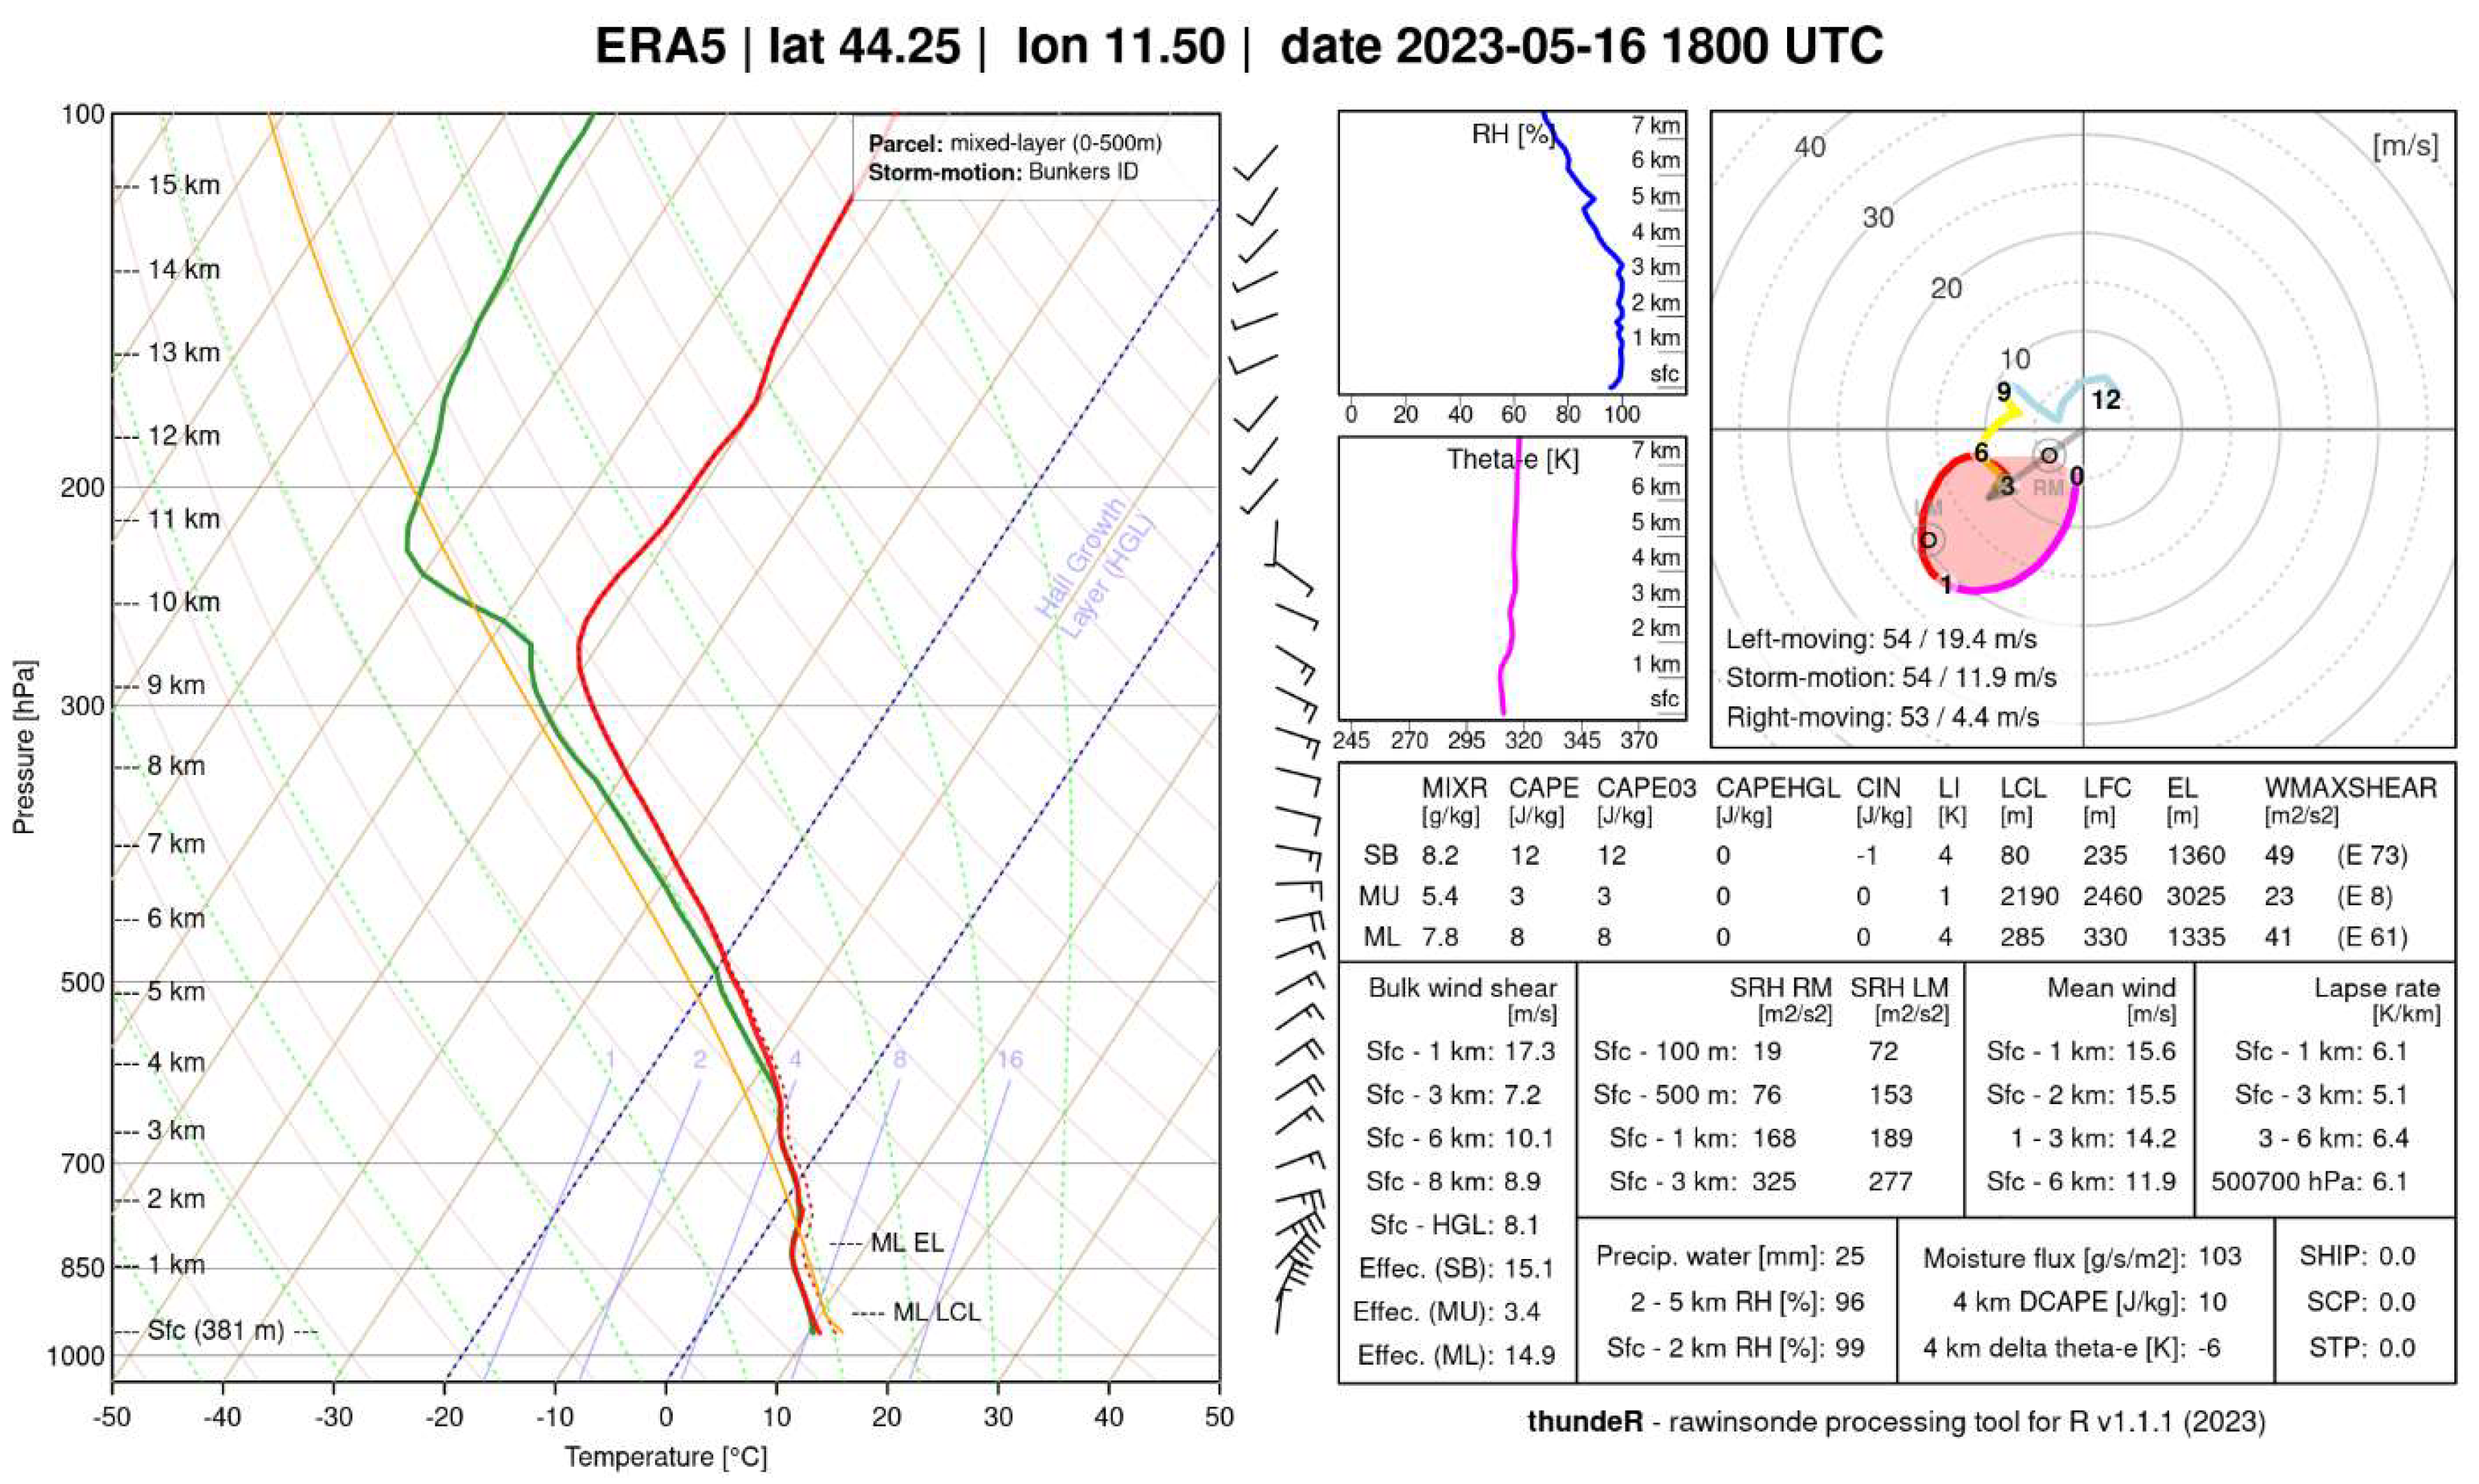
Despite the failure to launch an actual radio sounding at the base of San Pietro Capofiume (BO), the pseudo-sounding through ERA-5 ECMWF reanalysis provides valuable data. This simulated survey is particularly significant as it coincides with the area of Casola Valsenio (RA), one of the most heavily affected areas by the recent heavy rainfall, as shown in Figure 12.
The thermal profile (red curve) and dew point profile (green curve) show substantial overlap in the lower part of the troposphere, indicating high relative humidity in the lower layers, which is favorable for developing intense cloud cover associated with precipitation.
The parcel trace (dashed blue curve) indicates that the lifted air remains warmer than the surrounding environment up to about 700 hPa, suggesting potential instability.
CAPE values are modest (8 J/kg in mixed-layer, 12 J/kg in surface-based), indicating a weak instability, and this suggests that the energy available for lifting the air is limited but still sufficient to support not intense but prolonged convection if supported by the orographic lifting. In this case, the environment is slightly more inclined to trigger convective precipitations than during the early May event when they were completely absent.
The value of 25 mm of precipitable water (PWAT), although not exceptionally high, indicates a good quantity of humidity available in the atmosphere, contributing to persistent precipitations, generally moderate but at times intense, but with the persistence which remains the most characterizing the event. The equivalent potential temperature profile (Theta-E) is relatively high in the lower layers, confirming the presence of warm and very humid air.
The humidity index is 99% in the 0-2 km layer and 96% in the 2-5 km layer, confirming the presence of an extremely humid air mass loaded with water vapor. A Moisture Flux value of 103 g/s/m2 also confirms this.
The surface-based condensation level (LCL) is also found in this event at a level below 100 m above the ground, confirming an extremely humid air mass with rapid saturation from the lowest layers subject to dynamic and orographic lifting.
Again, the hodograph shows a vertical wind profile characterized by a clockwise directional rotation with height (veering) and weak or moderate shear. Also, in this case, the profile is classic of very disturbed conditions in the Apennine and foothills of the Apennines, causing cyclonic and very humid south-eastern flows at high altitudes which overlap with almost saturated north-eastern currents in the lower layers (including the PBL), with a typical wind pattern observed in occluded fronts rising across the Adriatic in the case of Mediterranean cyclogenesis.
In a nutshell, two meteorological events occur in the area that are favorable to prolonged and sometimes intense rainfall in less than two weeks. The second (16-17 May) is more severe and extensive than the first and leaves soils completely saturated even due to further intermittent rainfall that occurred between the two main events.

3. Impacts

3.1. Impacts on the Various Basins

The precipitation data reported below are the result of meticulous readings taken by the meteorological stations within the ARPAE observational network. These stations are strategically located in the various river basins, ensuring comprehensive and accurate data collection.
The precipitation accumulated in the two events for each location has been carefully considered. This comparison is of utmost importance as it provides a clear understanding of the variations in precipitation levels and their impact on the respective basins.
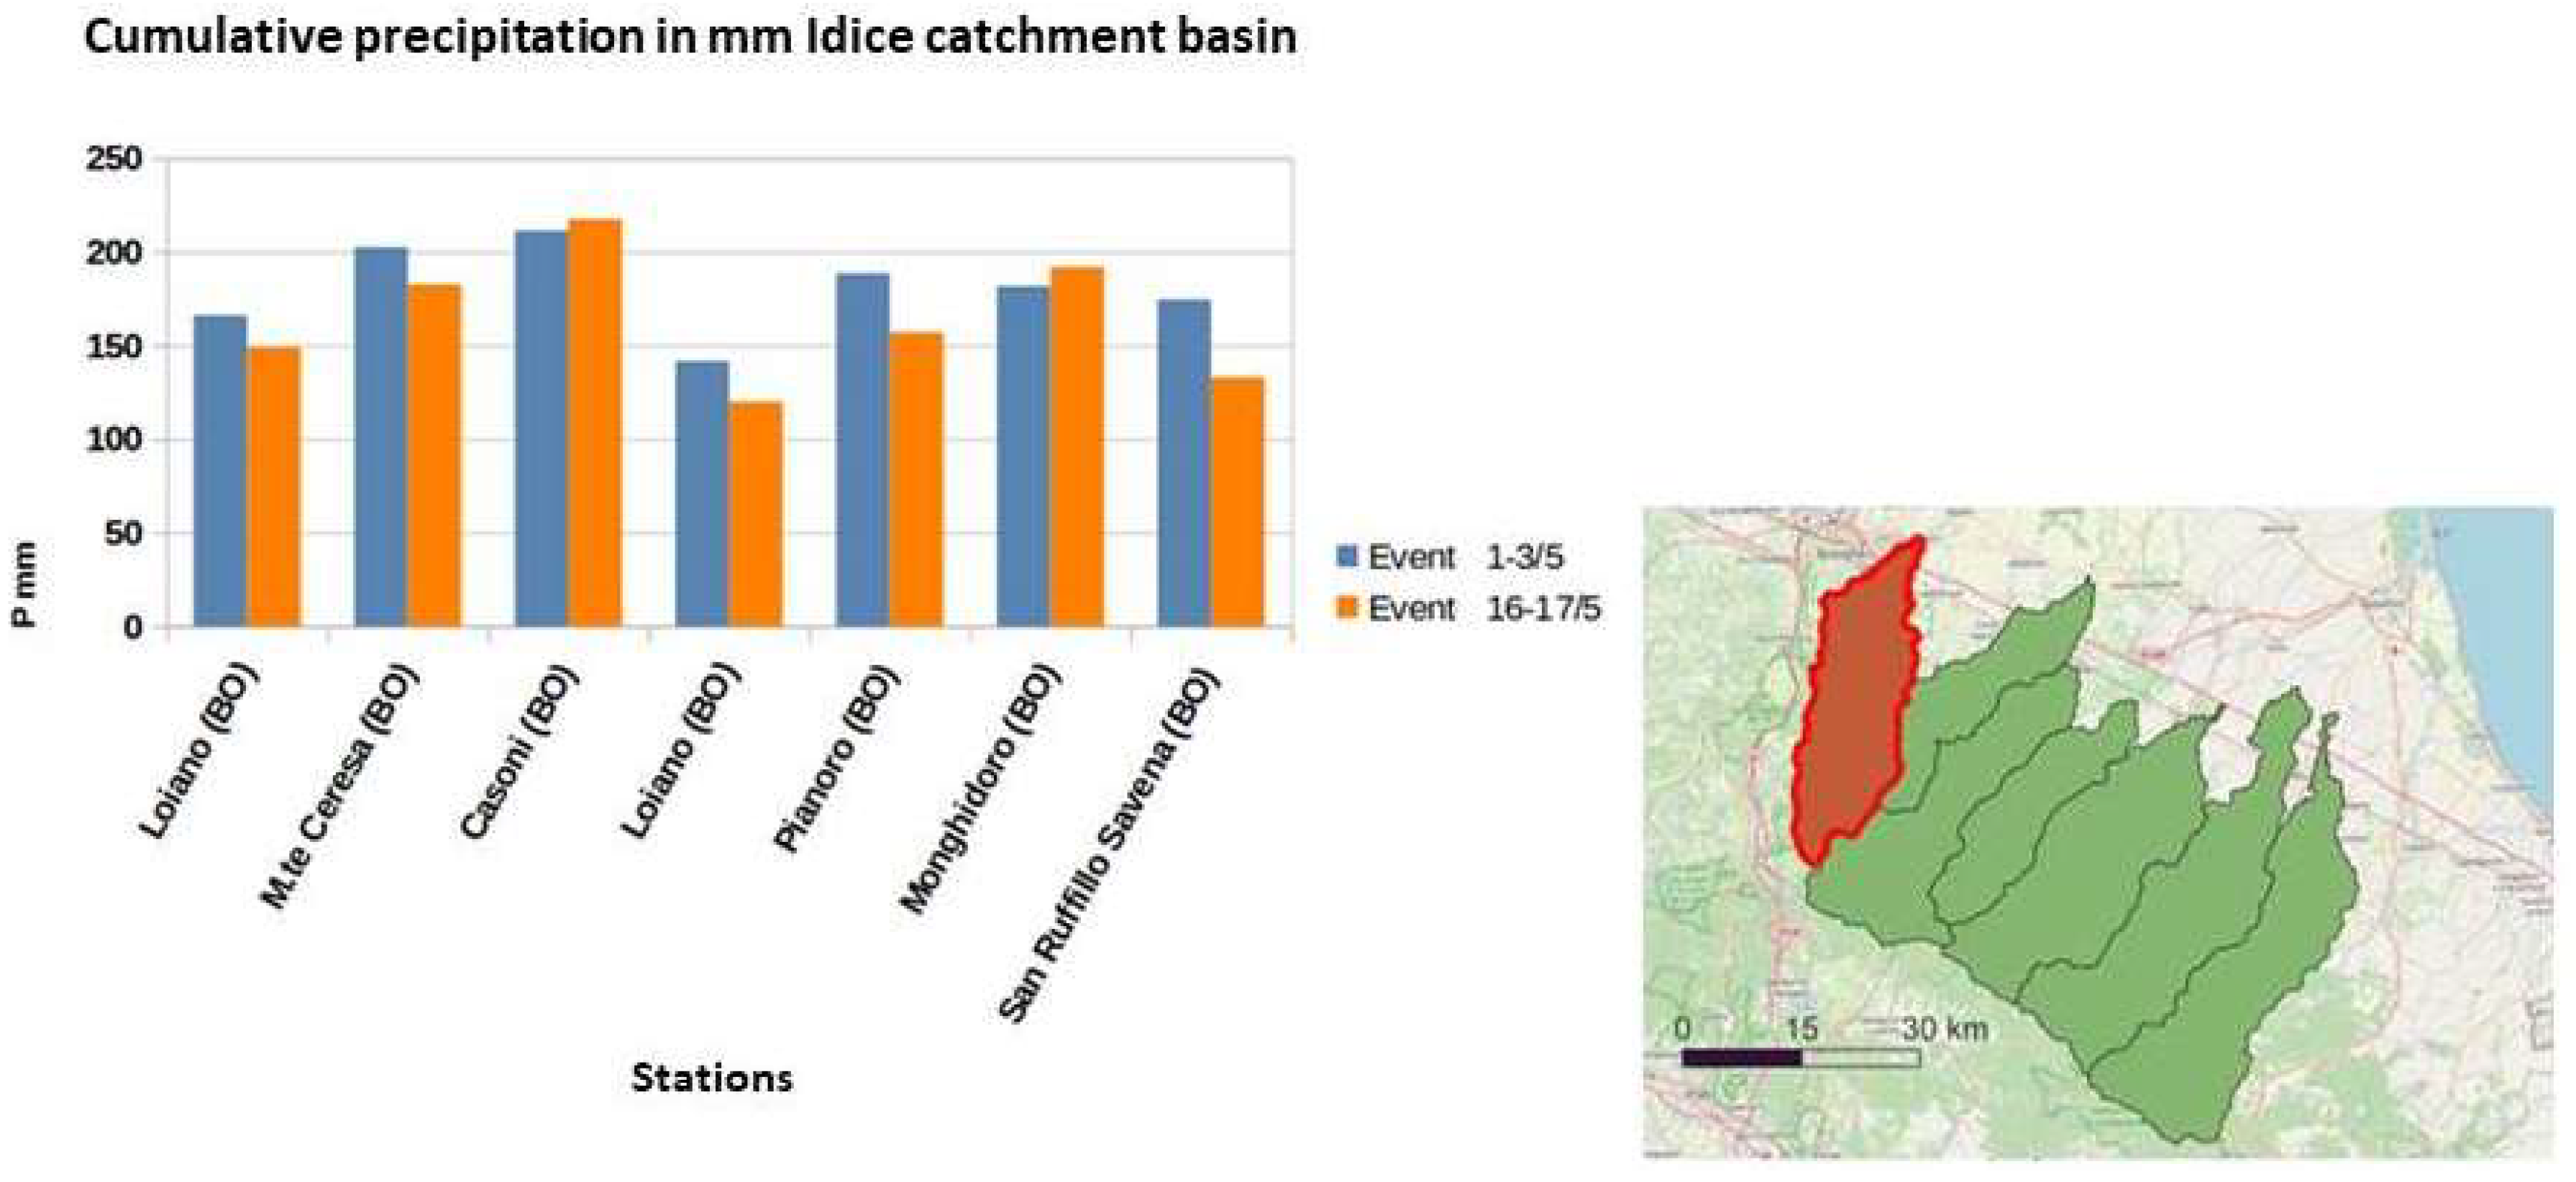
Figure 13 shows the data for the Idice basin.
All seven stations located in the basin above showed cumulative rainfall over 100 mm in both events, with maximums over 200 mm at Casoni di Romagna (BO, 708 m a.s.l.) and over 150 mm at Monte Ceresa (BO, 411 m a.s.l.); Pianoro (BO, 174 m a.s.l.) and Monghidoro (BO, 825 m a.s.l.). Overall, both events resulted in significant rainfall at all stations, but the 1-3 May event was generally more intense than the 16-17 May event, at least in the basin under examination. Casoni di Romagna and Monghidoro recorded the highest rainfall in both events, while there was a general reduction in rainfall between the first and second events at all stations, although the intensity of the second event remained high, with significant rainfall values. In particular, the first event shows vast rainfall accumulations from the lower hills, while in the 16-17 event, the typical altimetric gradient of accumulations was better respected. Figure 14 shows the data for the Lamone basin.
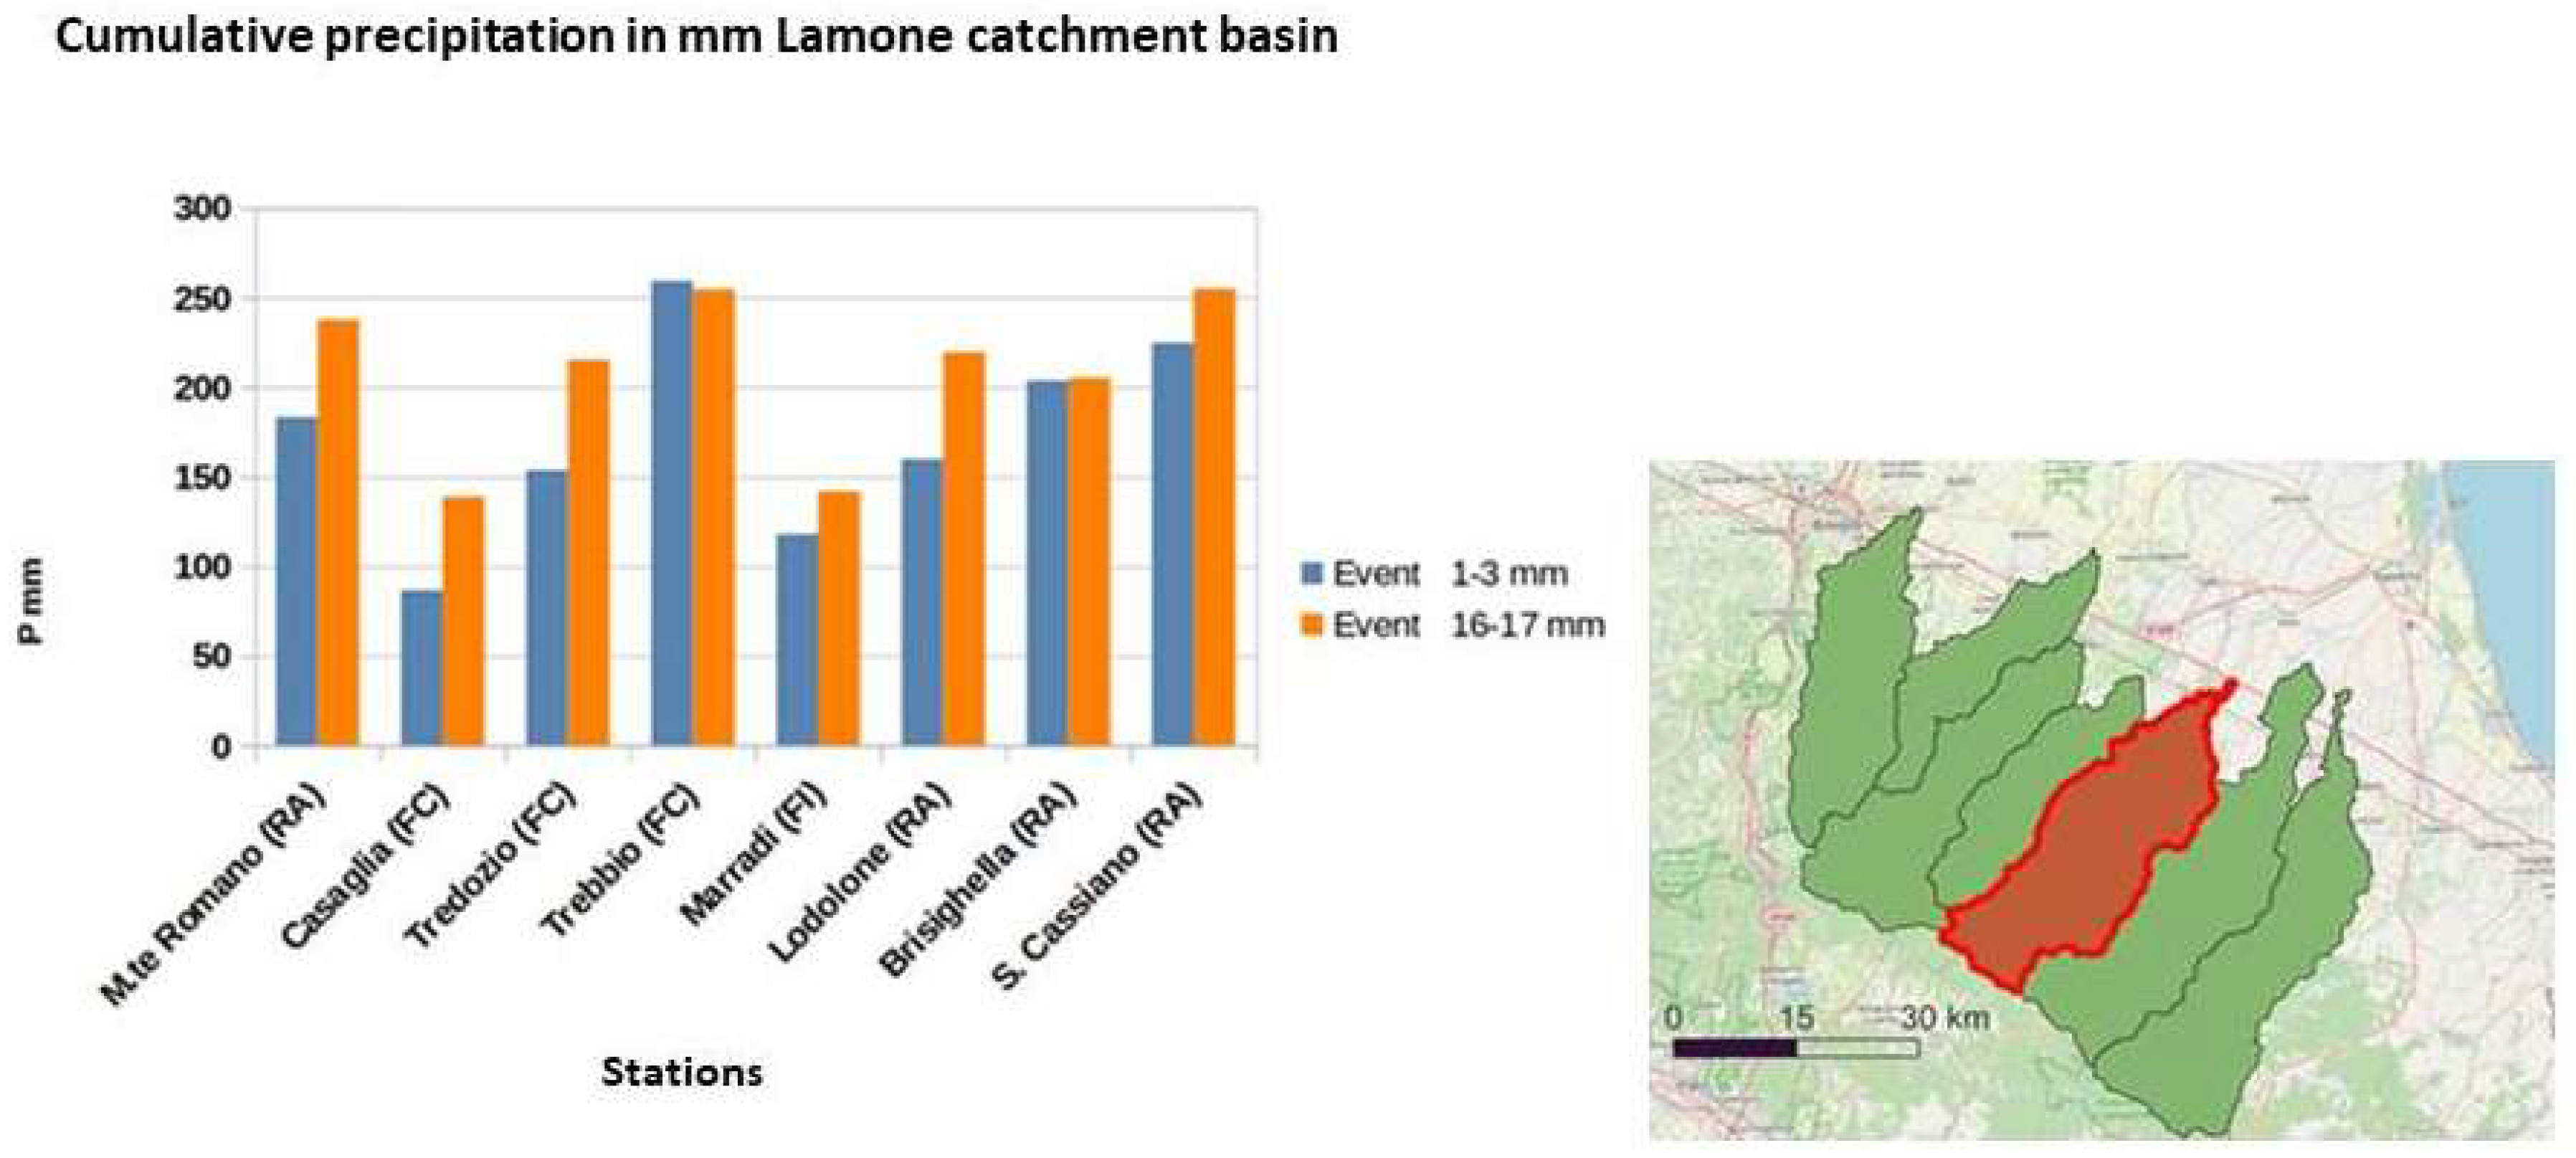
Cumulated rainfall over 150 mm in both events, is evident at Monte Romano (RA, 705 m a.s.l.); Tredozio (FC, 330 m a.s.l.); Trebbio (FC, 570 m a.s.l.); Lodolone (RA, 250 m a.s.l.); Brisighella (RA, 185 m a.s.l.) and San Cassiano sul Lamone (RA, 226 m a.s.l.). Specifically, at Trebbio, 250 mm of accumulation was exceeded in both events, while San Cassiano exceeded the same limit in the 16-17 May event. Extremely high accumulations were also observed in this basin from the lower hills, but unlike the Index basin, the most important event was 16-17 May.
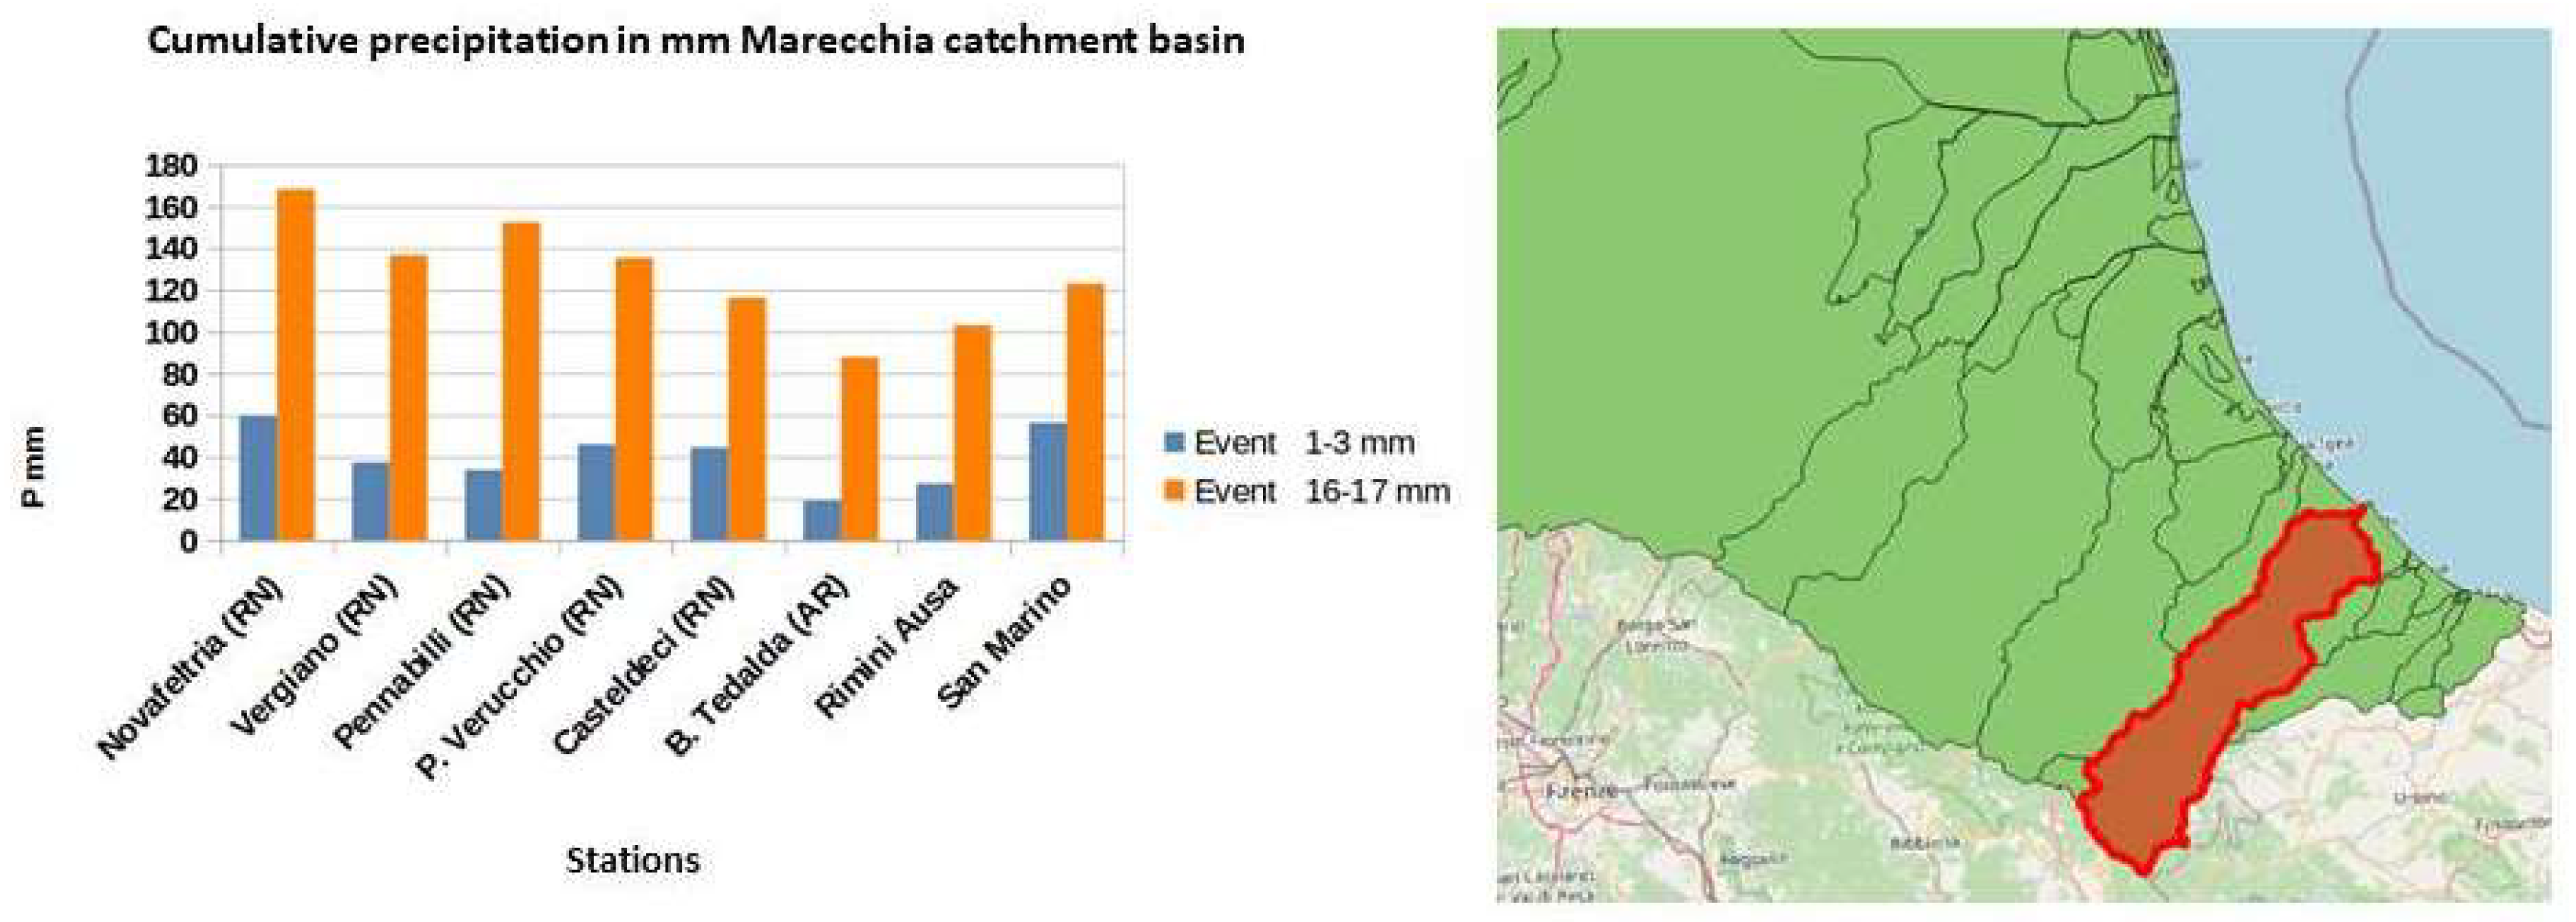
Significant variability, greater than in the Idice basin, is noted between the different stations. This dynamic variability could be attributed to local variations in weather conditions and topography. In the second event, the influence of thunderstorm activity is evident, causing even greater variability in rainfall accumulations. Figure 15 shows the data for the Marecchia basin. The Materi
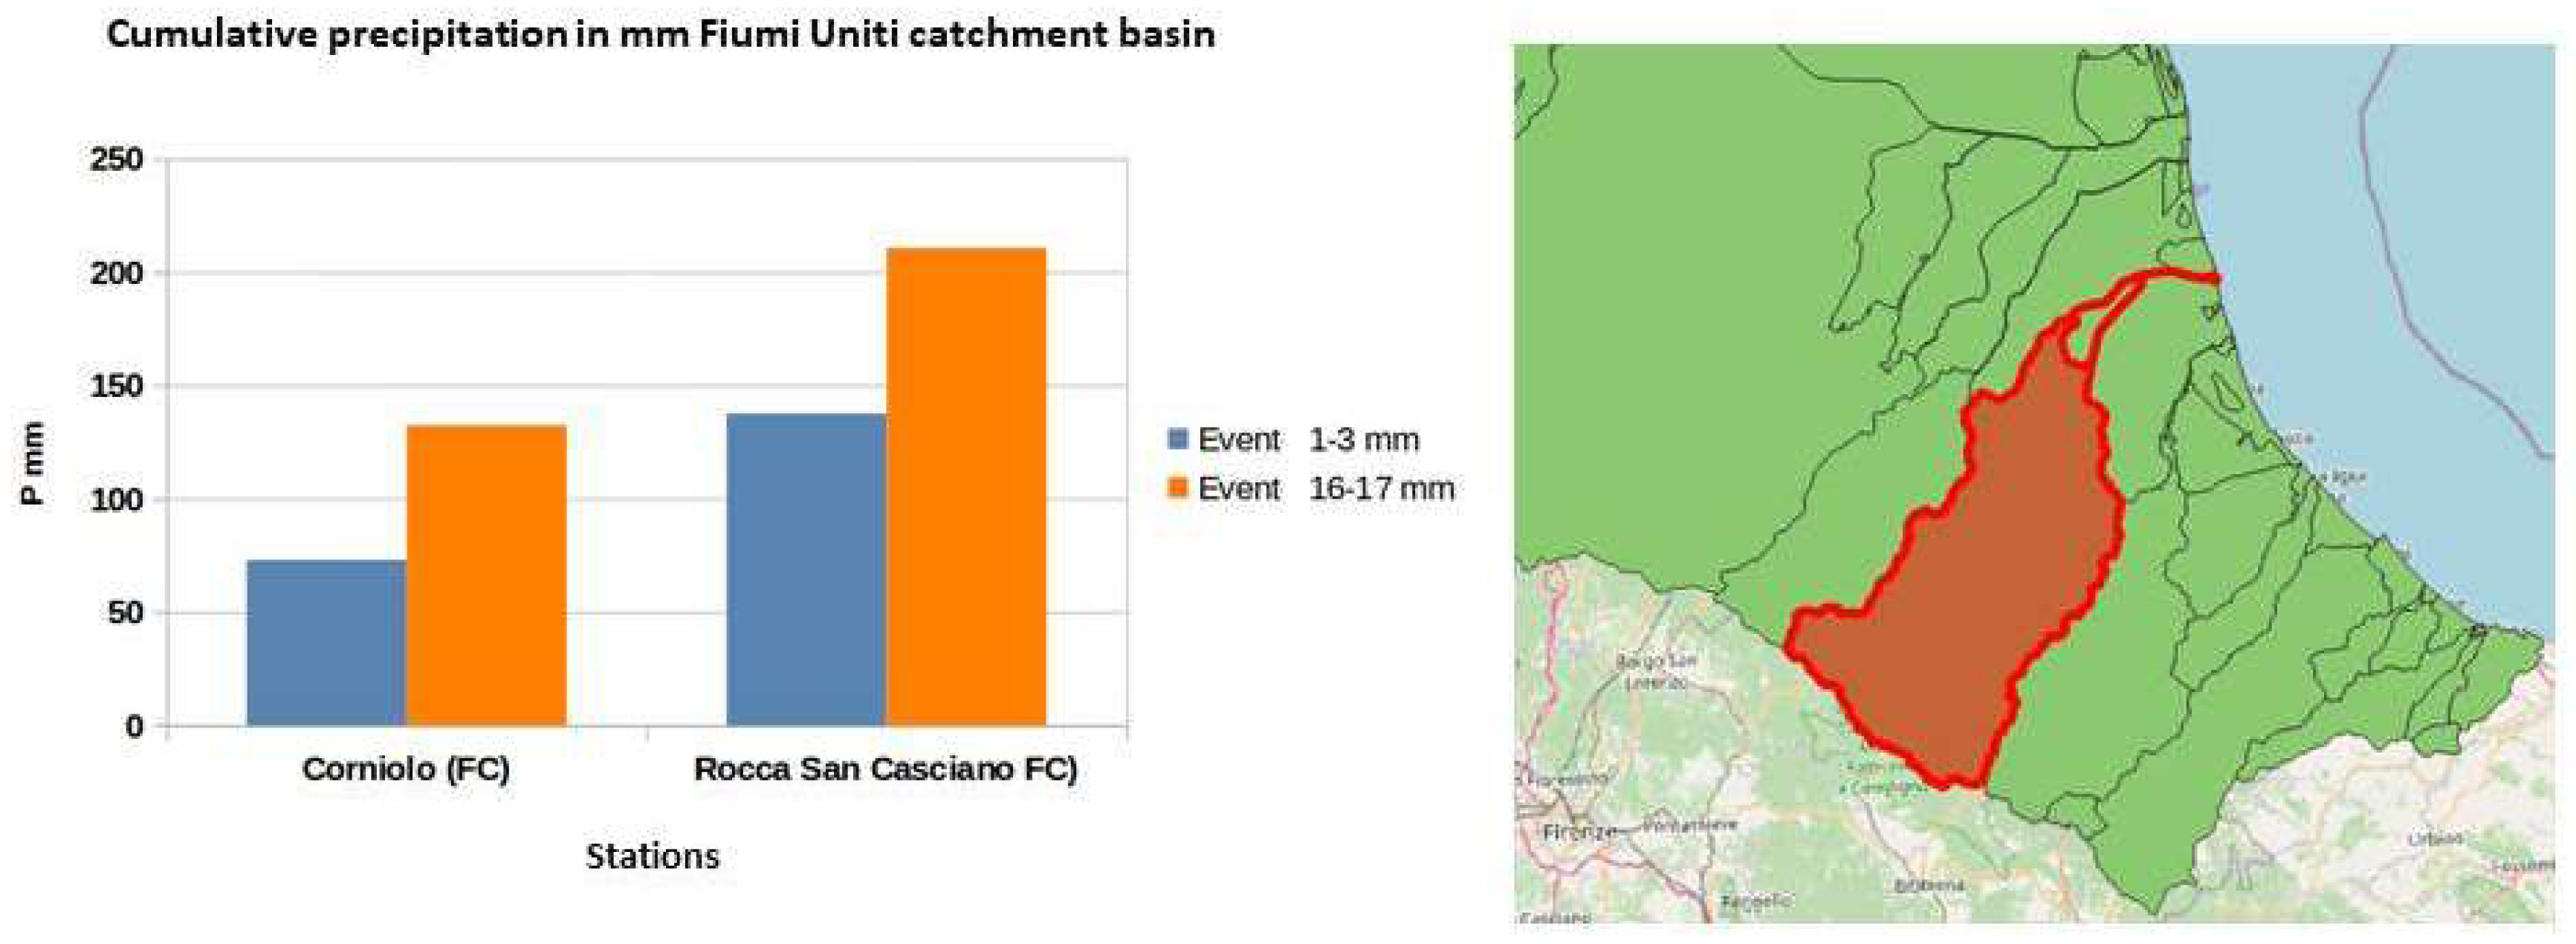
In this case, the clear difference between the two events is evident, with the first substantially sparing the Rimini area, causing rainfall accumulations of no more than 60 mm (Novafeltria, RN 331 mm). In the second event, accumulations exceeded 100 mm everywhere except for the Badia Tedalda station (850 m a.s.l. in the province of Arezzo and therefore less exposed to the north-eastern disturbing currents), with a maximum of 168.5 mm in Novafeltria, while in Pennabilli (RN, 629 m a.s.l.) there was an accumulation of 152.4 mm. In the basin under examination, the non-excessive rainfall of the first event favored less criticality than in other basins in the region due to non-saturated soils. Figure 16 shows the data for the United Rivers basin.
In this case, the most severe event was that of 16-17 May. The most significant aspect concerns the fact that rainfall in both events was significantly higher at Rocca San Casciano (FC, 250 mm) than at Corniolo (FC, 553 mm), subverting the normal altimetric gradient that typically concerns accumulations from stratiform cloudiness. This is likely attributed to the highly humid air masses flowing in from the lower and within the boundary layers, with compact cloudiness and rainfall from deficient levels (LCL at altitudes below 100 m).
This peculiarity also applies to the other basins taken as reference.
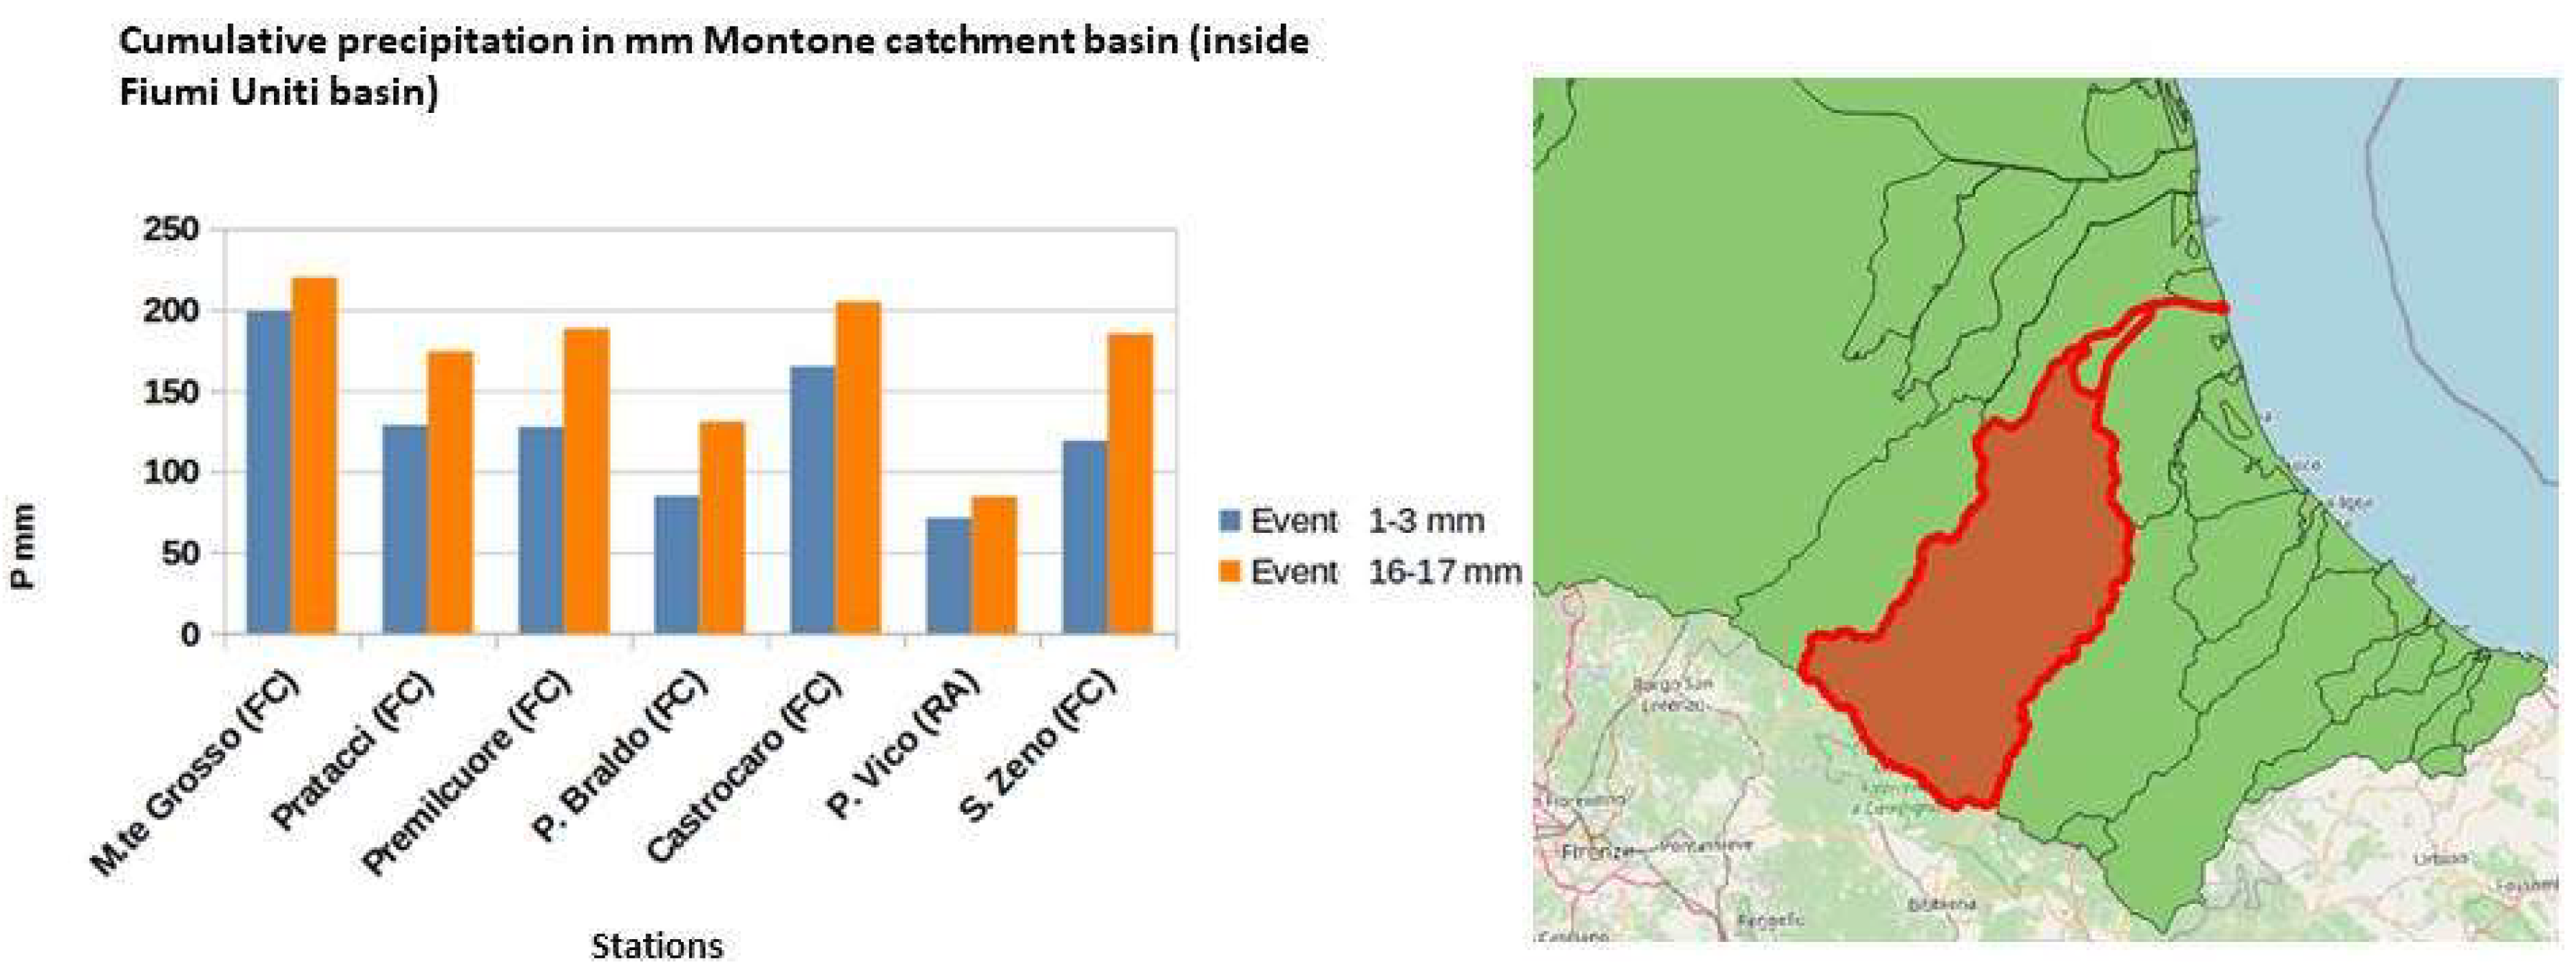
It is worth noting that over 200 mm of rain fell on Rocca San Casciano during the 16-17 May event. Figure 17 shows the data for the Montone basin.
In all the localities of the basin, rainfall was higher during the 16-17 event compared to the 1-3 event, confirming the fact that, proceeding south-eastwards in the direction of the Forlì-Cesena and Rimini basins, the 16-17 event definitely exceeded that of the beginning of the month. The only station not to have reached 100 mm on both occasions is Ponte Vico (20 m a.s.l.) located in a lowland area. In comparison, the 200 mm accumulation was exceeded at Monte Grosso (FC, 670 m a.s.l.) and Castrocaro (FC, 66 mm) in the 16-17 May event. Figure 18 shows the data for the Navile-Savena basin.
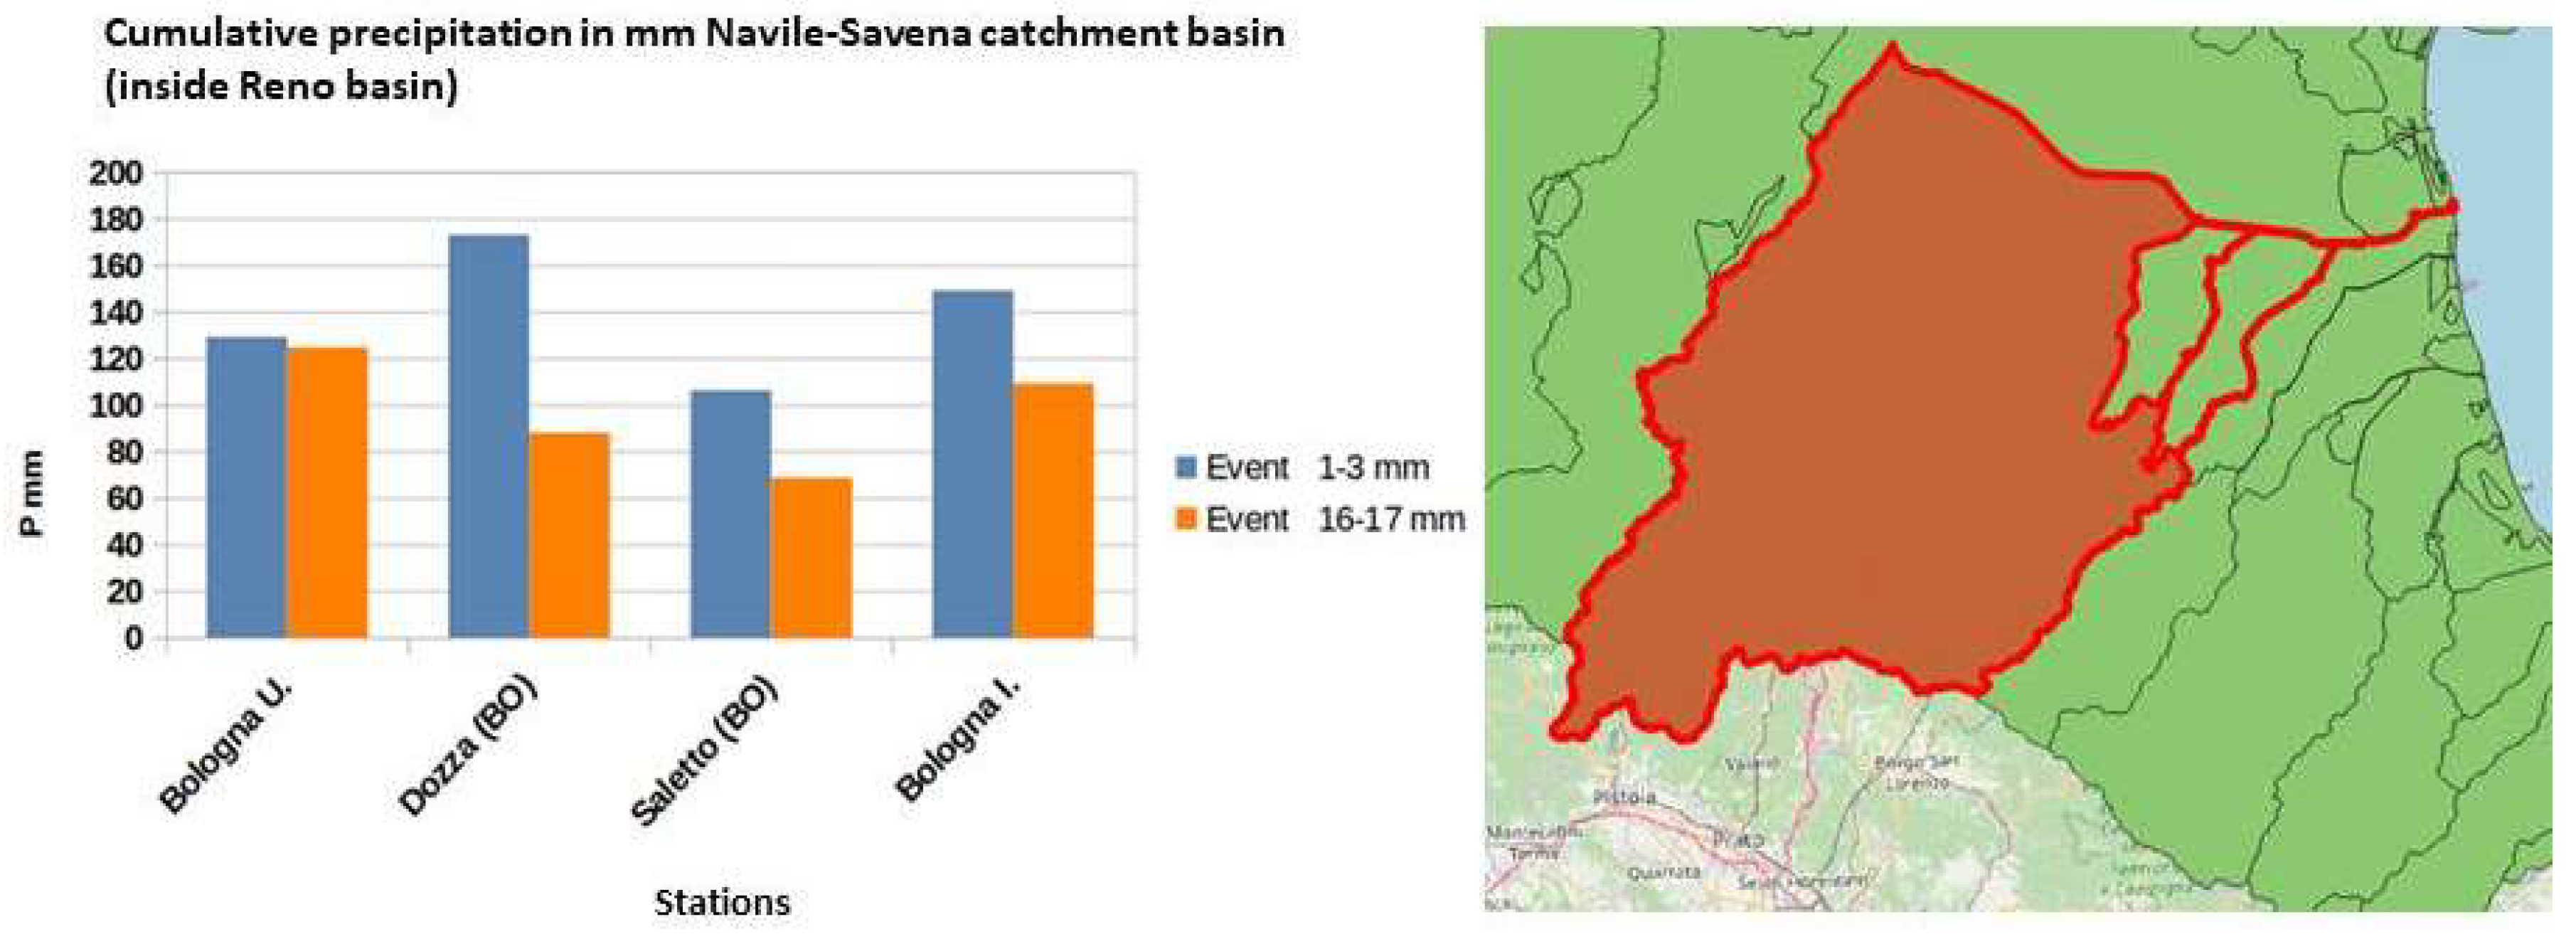
Considering a basin located further west, the 1-3 May event is again the most intense one, with all the Navile-Savena stations showing the highest accumulations on that occasion. The Dozza station (BO, 42 m a.s.l.) exceeded 170 mm, while the Bologna Urbana station (78 m a.s.l.) totaled over 100 mm in both events. In the remaining localities, the 100 mm accumulated was only reached in the first event. Figure 19 shows the data for the Ronco basin.
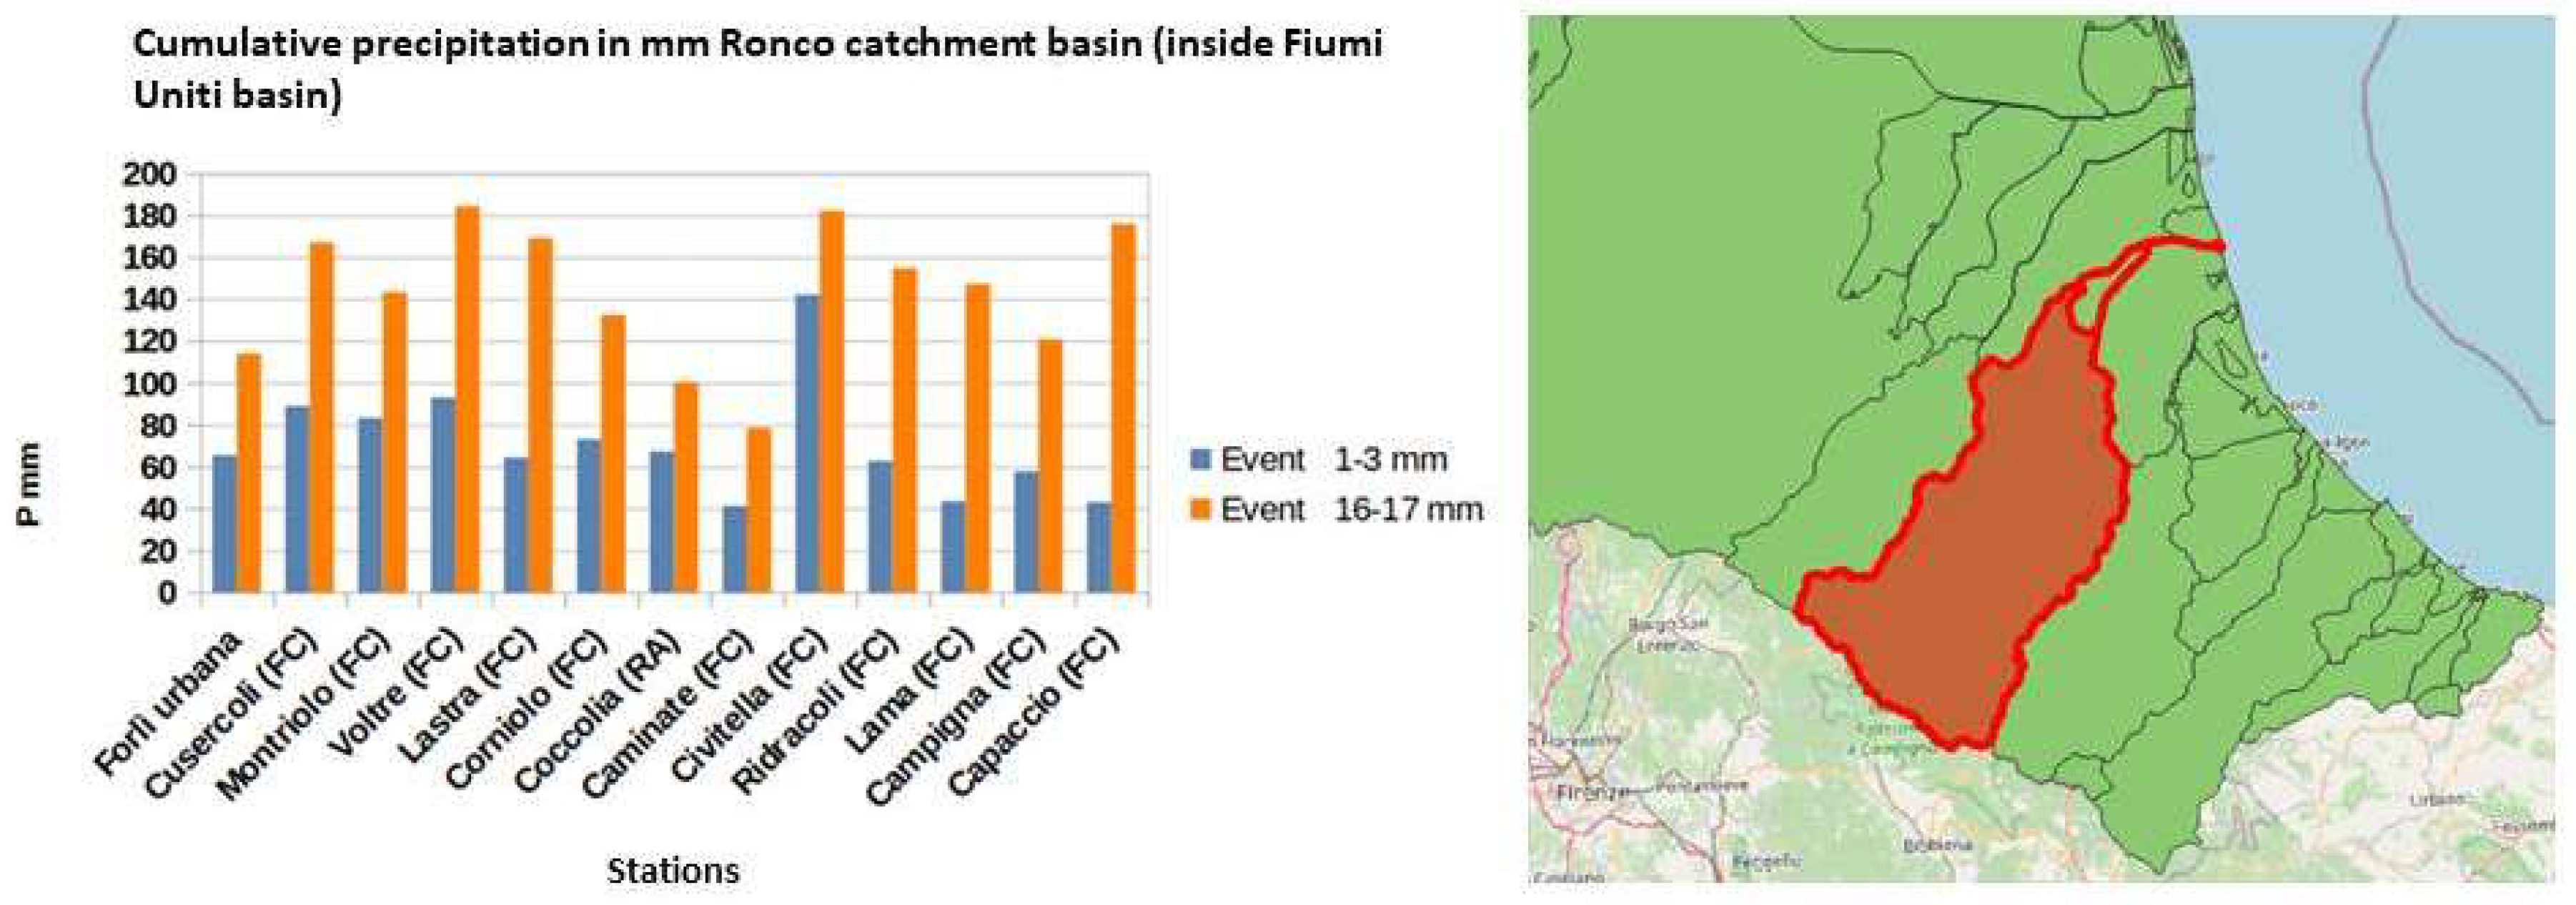
In the basin mentioned above, there was an apparent prevalence of higher accumulations in the 16-17 May event, with many stations seeing the contributions more than double in favor of the latter episode. Maximums of around 180 mm were reached between 16 and 17 May at Voltre (FC, 270 m a.s.l.); Civitella di Romagna (FC, 460 m a.s.l.), and Capaccio (FC, 295 m a.s.l.), which are higher than those totalled at locations located at a higher altitude, a characteristic common to other basins involved. Except for the Civitella di Romagna station, the 1-3 May episode was characterized by inconsistent rainfall accumulations (>60 mm). Figure 20 shows the data for the Samoggia basin.
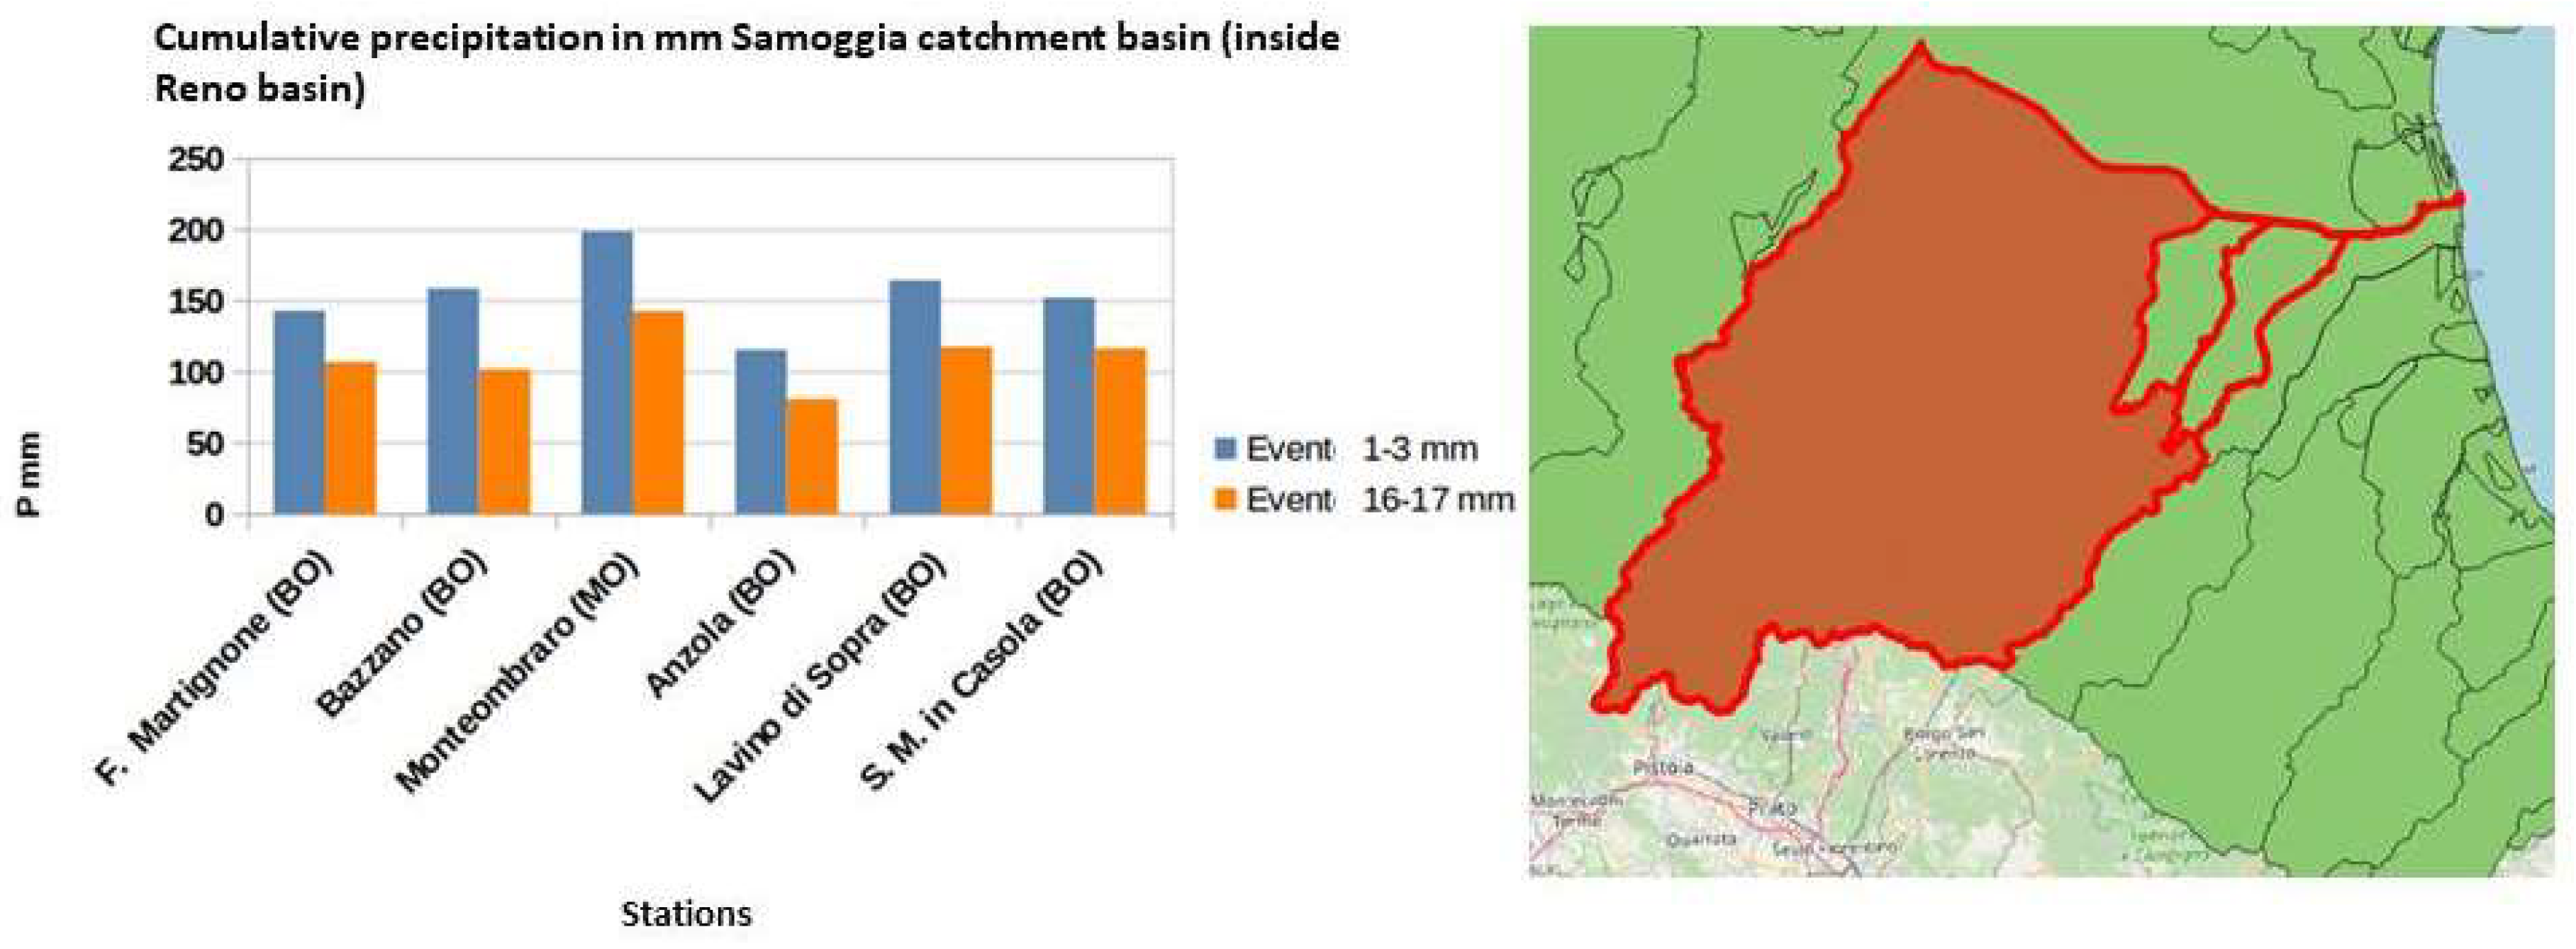
In this basin, in the Bologna area, the episode at the beginning of the month was again more intense at all stations in the area, with an accumulation of 198.4 mm at Monteombraro (BO, 700 m a.s.l.) and accumulations exceeding 150 mm at Bazzano (BO, 82 m a.s.l.), Lavino di Sopra (BO, 75 m a.s.l.) and San Martino in Casola (BO, 125 m a.s.l.). At the same time, the maxima for the 16-17 May event did not reach 150 mm, with an area maximum of 142.4 mm at Monteombraro. The rainfall values recorded show greater consistency, compared to other basins, with the typical altimetric gradient in rainfall where the orographic forcing is prevalent. Figure 21 shows the data for the Santerno basin.
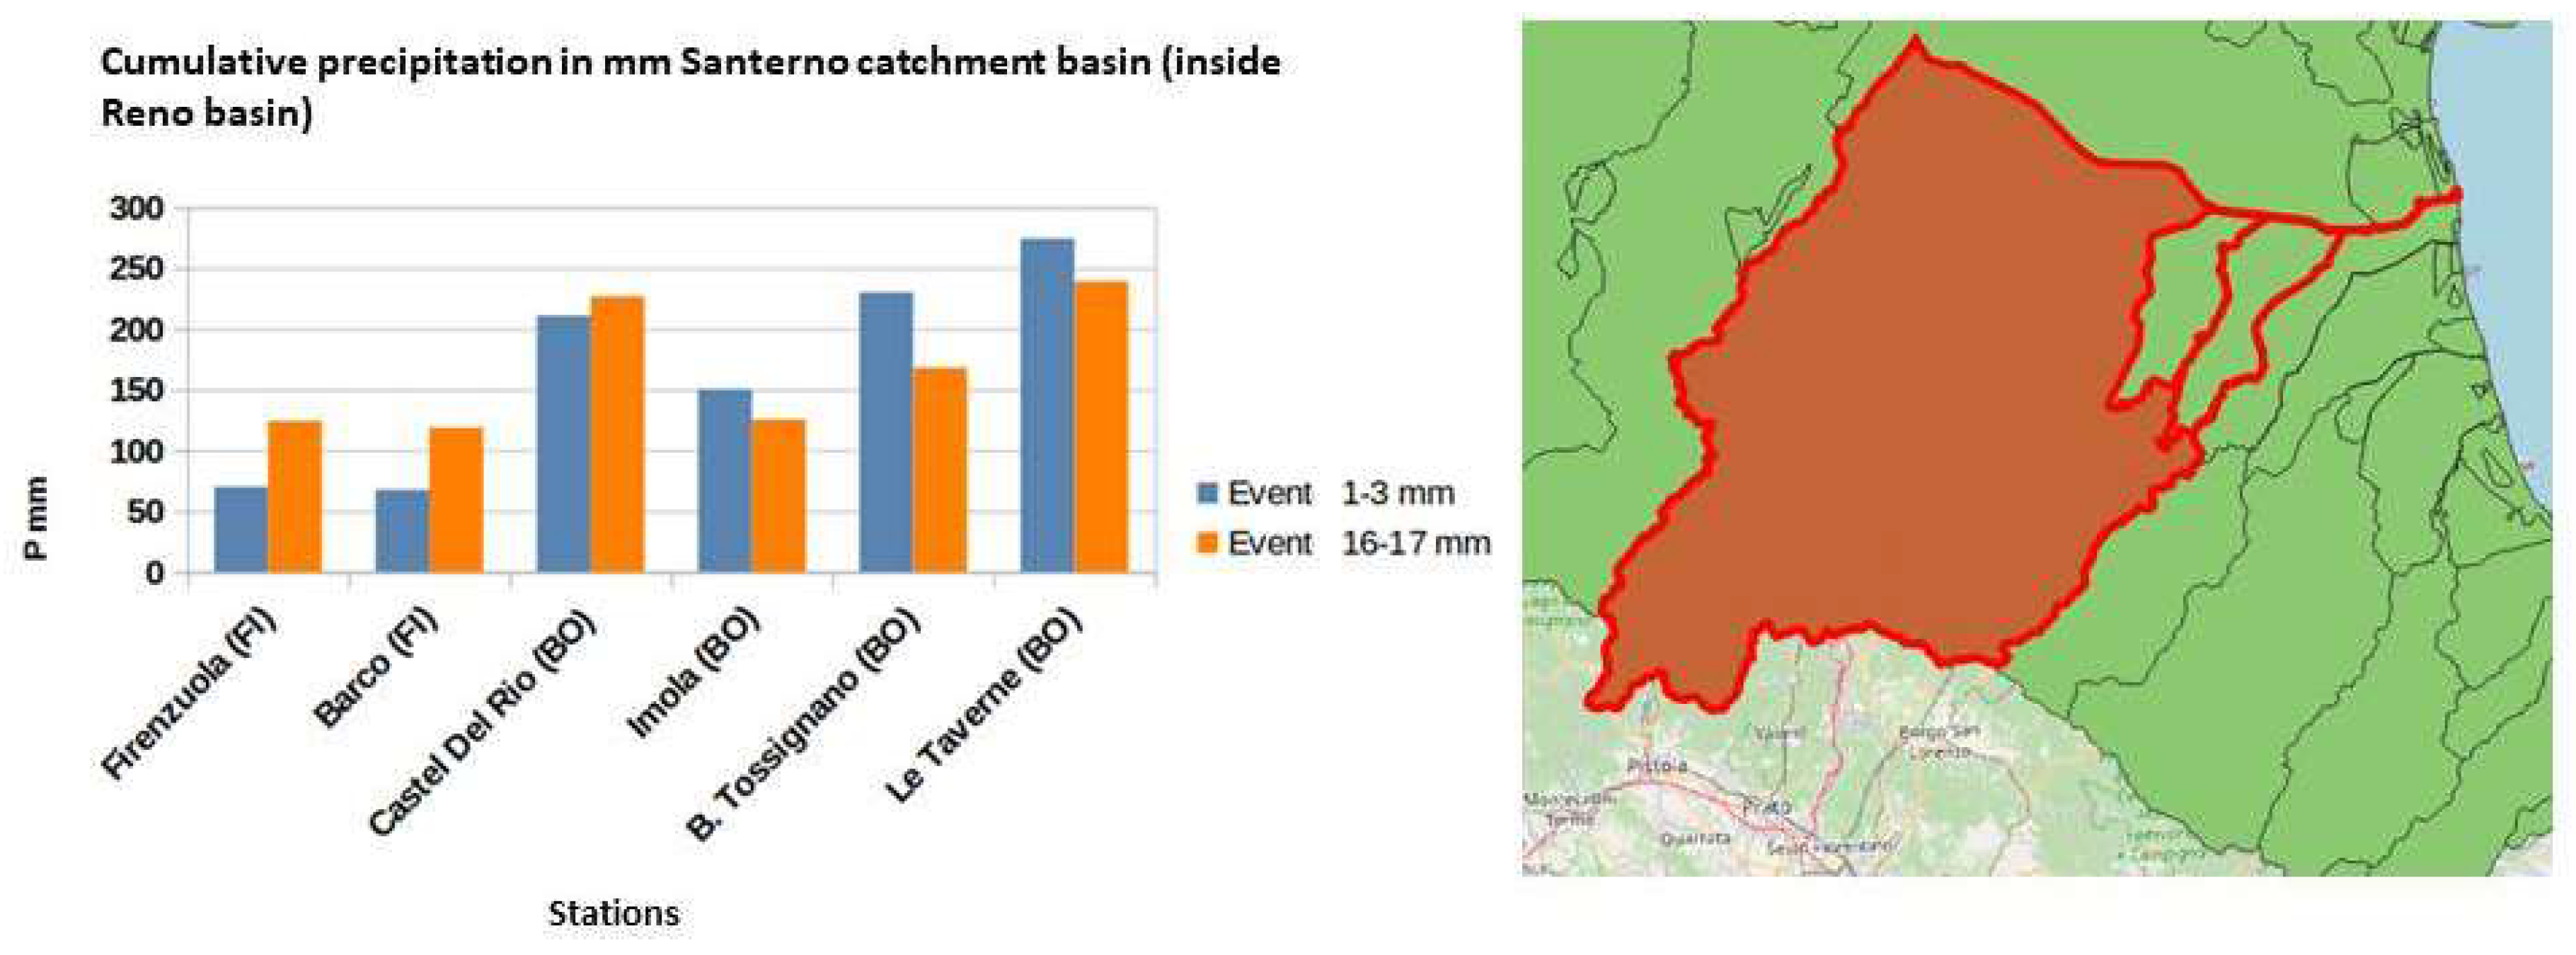
There is no clear distinction between the two events, with some stations seeing the one at the beginning of the month as more critical and others the one on 16-17 May. The most characteristic aspect of the above-mentioned basin concerns the enormous rainfall accumulations observed at some stations: in the 1-3 May event, a good 274.4 mm were totaled at Le Taverne (BO, 486 m a.s.l.); 230.2 mm at Borgo Tossignano (BO, 98 m a.s.l.) and 210.8 mm at Castel Del Rio (BO, 183 m a.s.l.).
The Le Taverne station shows a notable accumulation of 239 mm in the 16-17 May event, followed by 226.6 mm in Castel Del Rio and 168 mm in Borgo Tossignano. The Santerno basin is among those with the most significant accumulations, both partial and total, in the two events in the entire area involved. Figure 22 shows the data for the Savio basin.
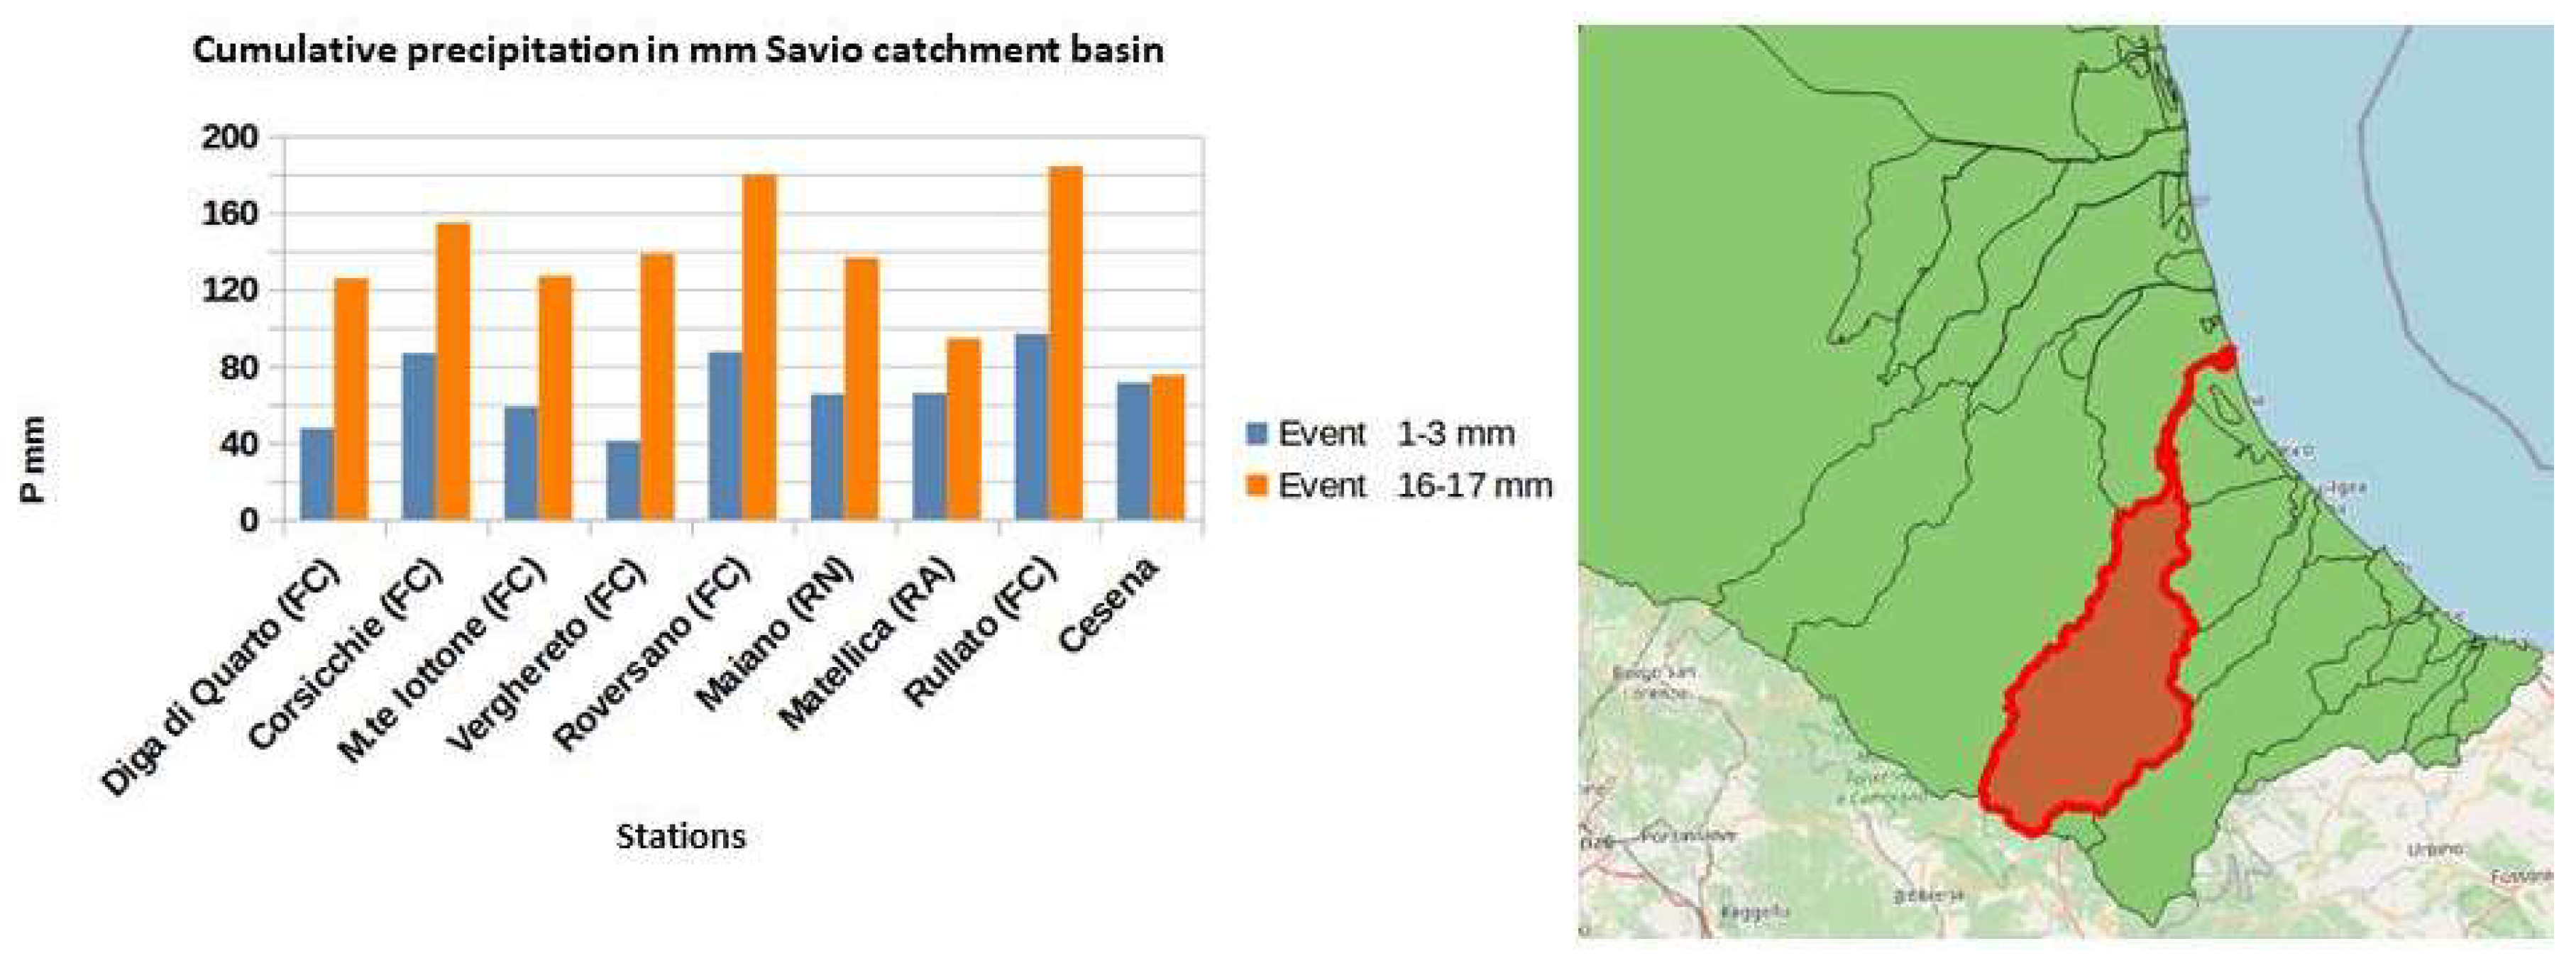
In the Savio basin, the 16-17 event certainly appears more intense at all operational stations, with totals of 184.2 mm at Rullato (FC, 600 m a.s.l.) and 180 mm at Roversano (FC, 175 m a.s.l.) representing the extreme peaks in the area. In the first event, none of the stations reached 100 mm of accumulation. In contrast, in the second, accumulations were exceeded everywhere except Matellica (RA, 19 m a.s.l.) and Cesena Urbana (77 m a.s.l.) for obvious reasons related to the low altimetry of the two localities. Figure 23 shows the data for the Senio basin.
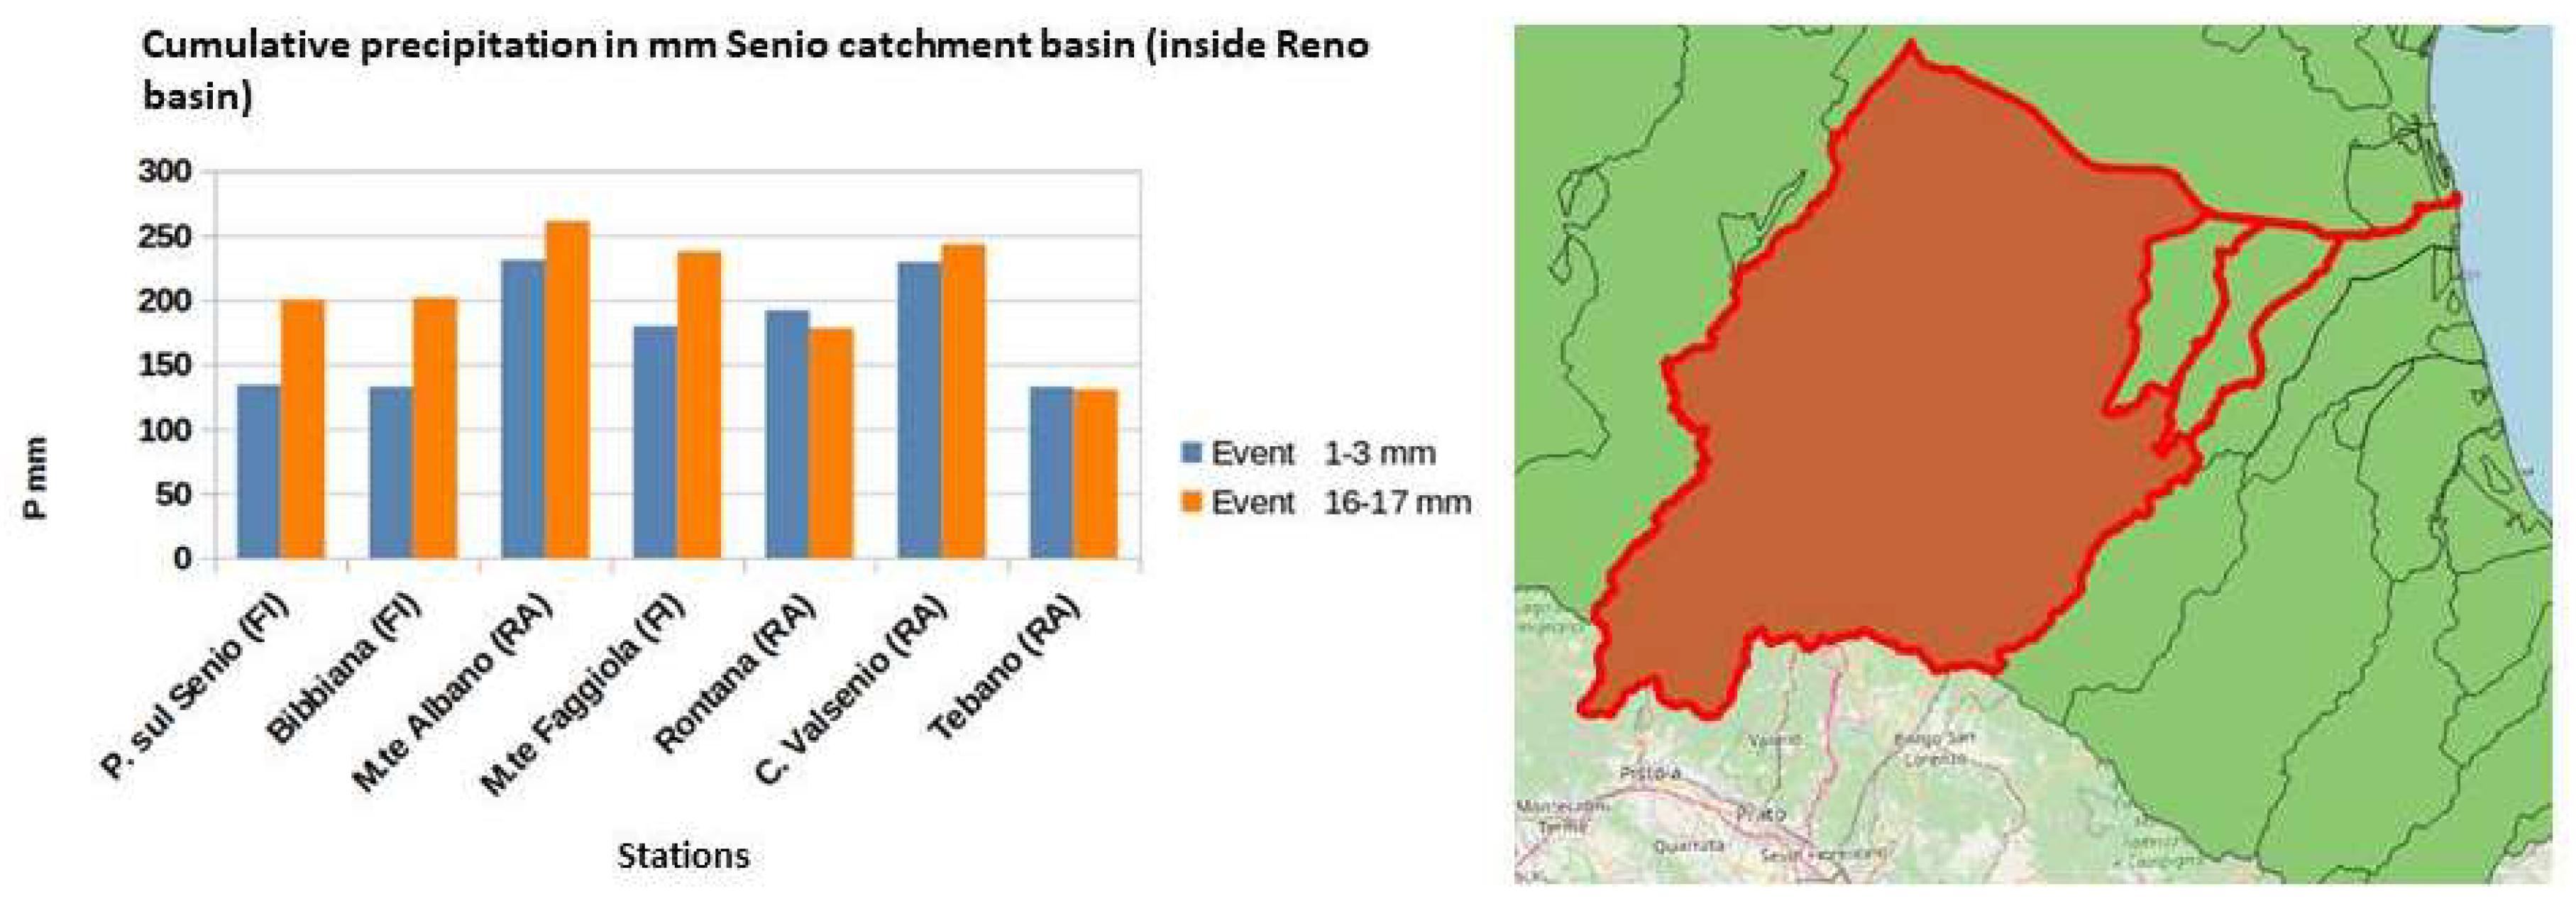
This basin is also among the most affected by heavy rainfall in both events, with a prevalence of more significant accumulations during the 16-17 May event, when 200 mm of rainfall was recorded near Palazzuolo sul Senio (FI, 500 m a.s.l.) and exceeded 200 mm at Monte Albano (RA, 480 m a.s.l., 261 mm), at Casola Valsenio (RA, 154 m a.s.l., 243 mm), at Monte Faggiola (FI, 929 m a.s.l., 237.8 mm) and at Bibbiana (FI, 858 m a.s.l., 201.8 mm). However, the 1-3 May episode was also very significant, with 231 mm accumulated at Monte Albano and 229.4 mm at Casola Valsenio. In both events, at least 130 mm of accumulated rainfall was exceeded everywhere. Finally, Figure 24 shows the data for the Sillaro basin.
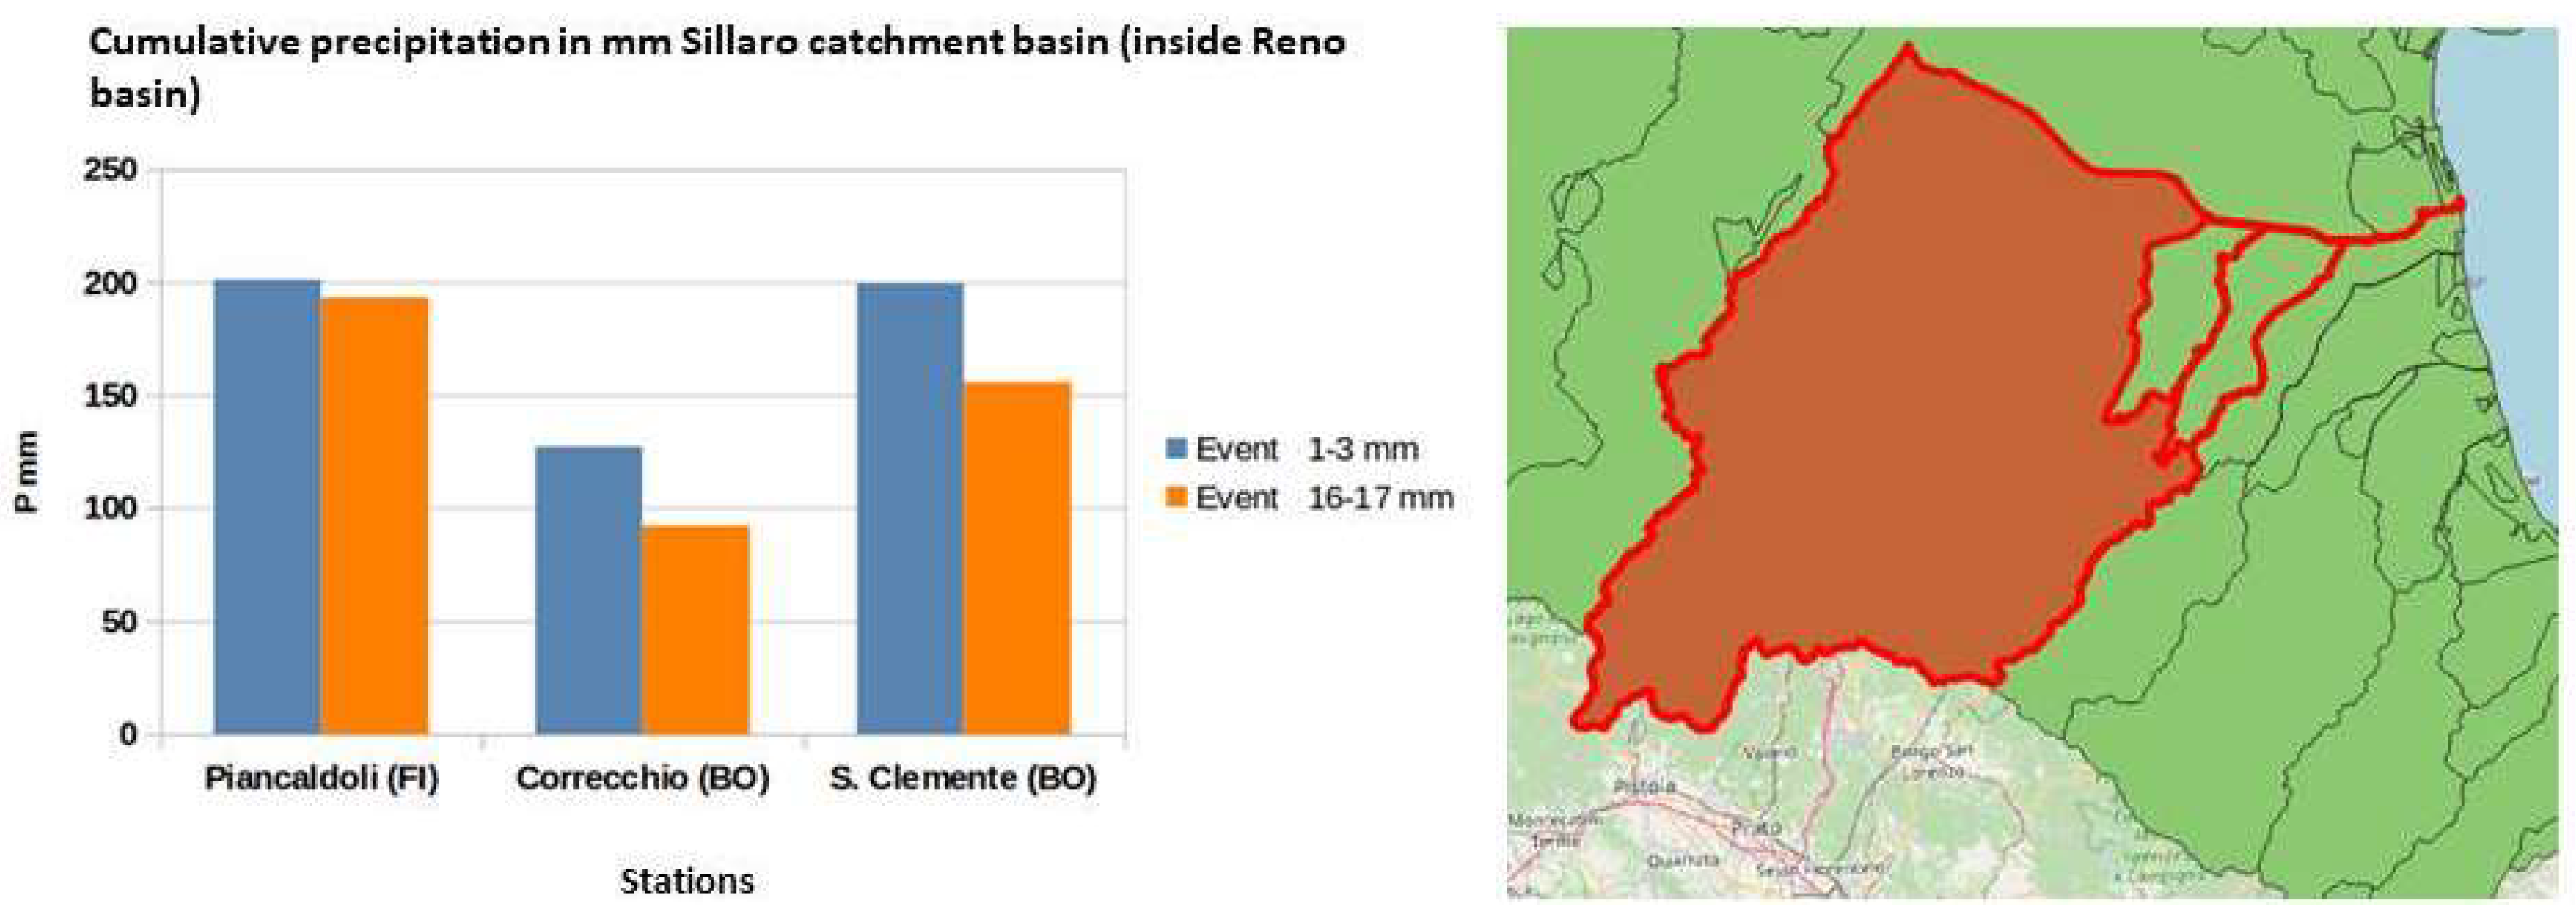
In the basin above, inherent to an area of the Bologna area, a greater consistency of the event at the beginning of the month is noted, as already verified for the westernmost basins of the area considered. In fact, as many as 201 mm were totalled in Piancaldoli (FI, 500 m a.s.l.) and 199.4 mm in San Clemente (BO, 166 m a.s.l.), while the same localities accumulated 193.2 mm and 155.6 mm respectively in the 16-17 May event.
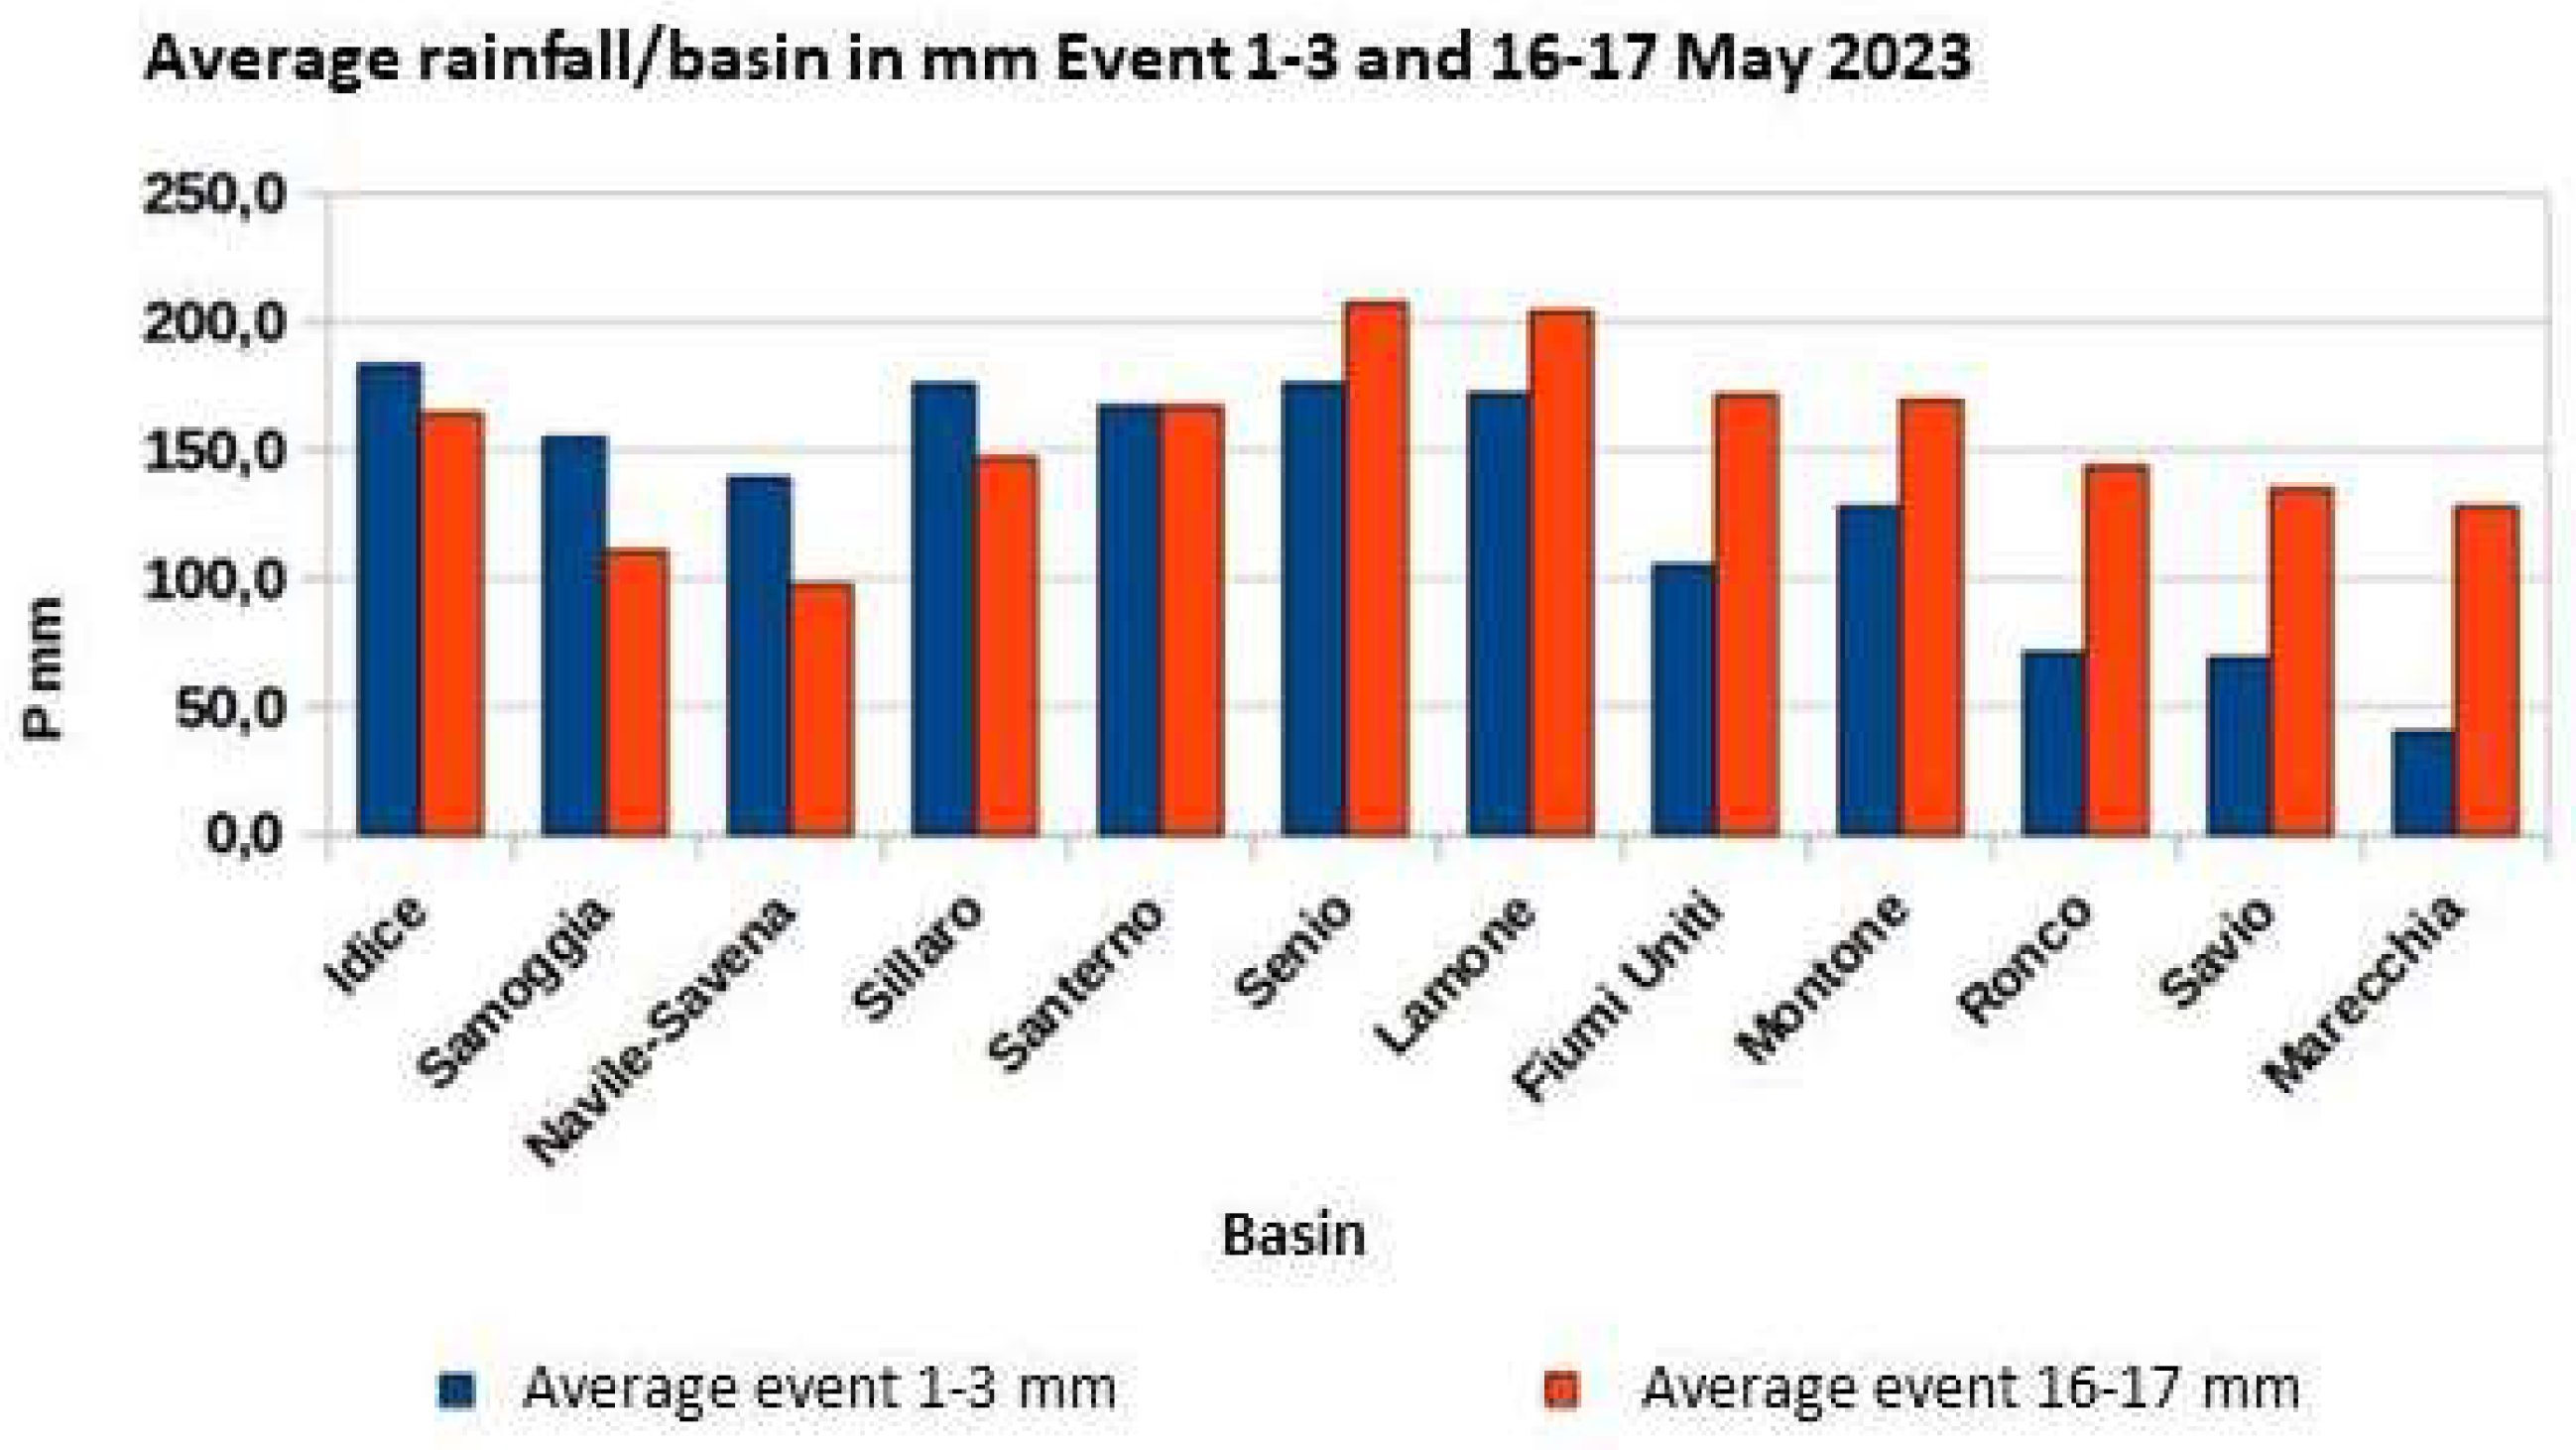
Summarising the precipitation data presented thus far, the graph in Figure 25 shows that each of the two precipitation events had a variable impact depending on the geographical area involved.
As can be seen, on the basins located further to the west, the most significant event in terms of rainfall accumulation is undoubtedly that of 1-3 May, while on the more easterly ones, that of 16-17 May prevails. The Idice, Samoggia, Navile-Savena, and Sillaro basins recorded decidedly more abundant rainfall during the 1-3 May period. The Santerno basin can be considered a watershed, presenting very similar average accumulations in both events. In contrast, for the Senio, Lamone, Fiumi Uniti, Montone, Ronco, Savio, and Marecchia basins, the 16-17 May event clearly prevails. In particular, in the Ronco, Savio, and Marecchia basins, the accumulated rainfall of 16-17 May was, on average, double or sometimes triple that of the 1-3 May period, which was, in these areas, of moderate entity.
The most affected basins were those of the Idice, Sillaro, Santerno, Senio and Lamone, where the average of both events exceeded 150 mm, and with those of the Senio and Lamone presenting the greatest peaks, exceeding 200 mm on average in the 16-17 May event.
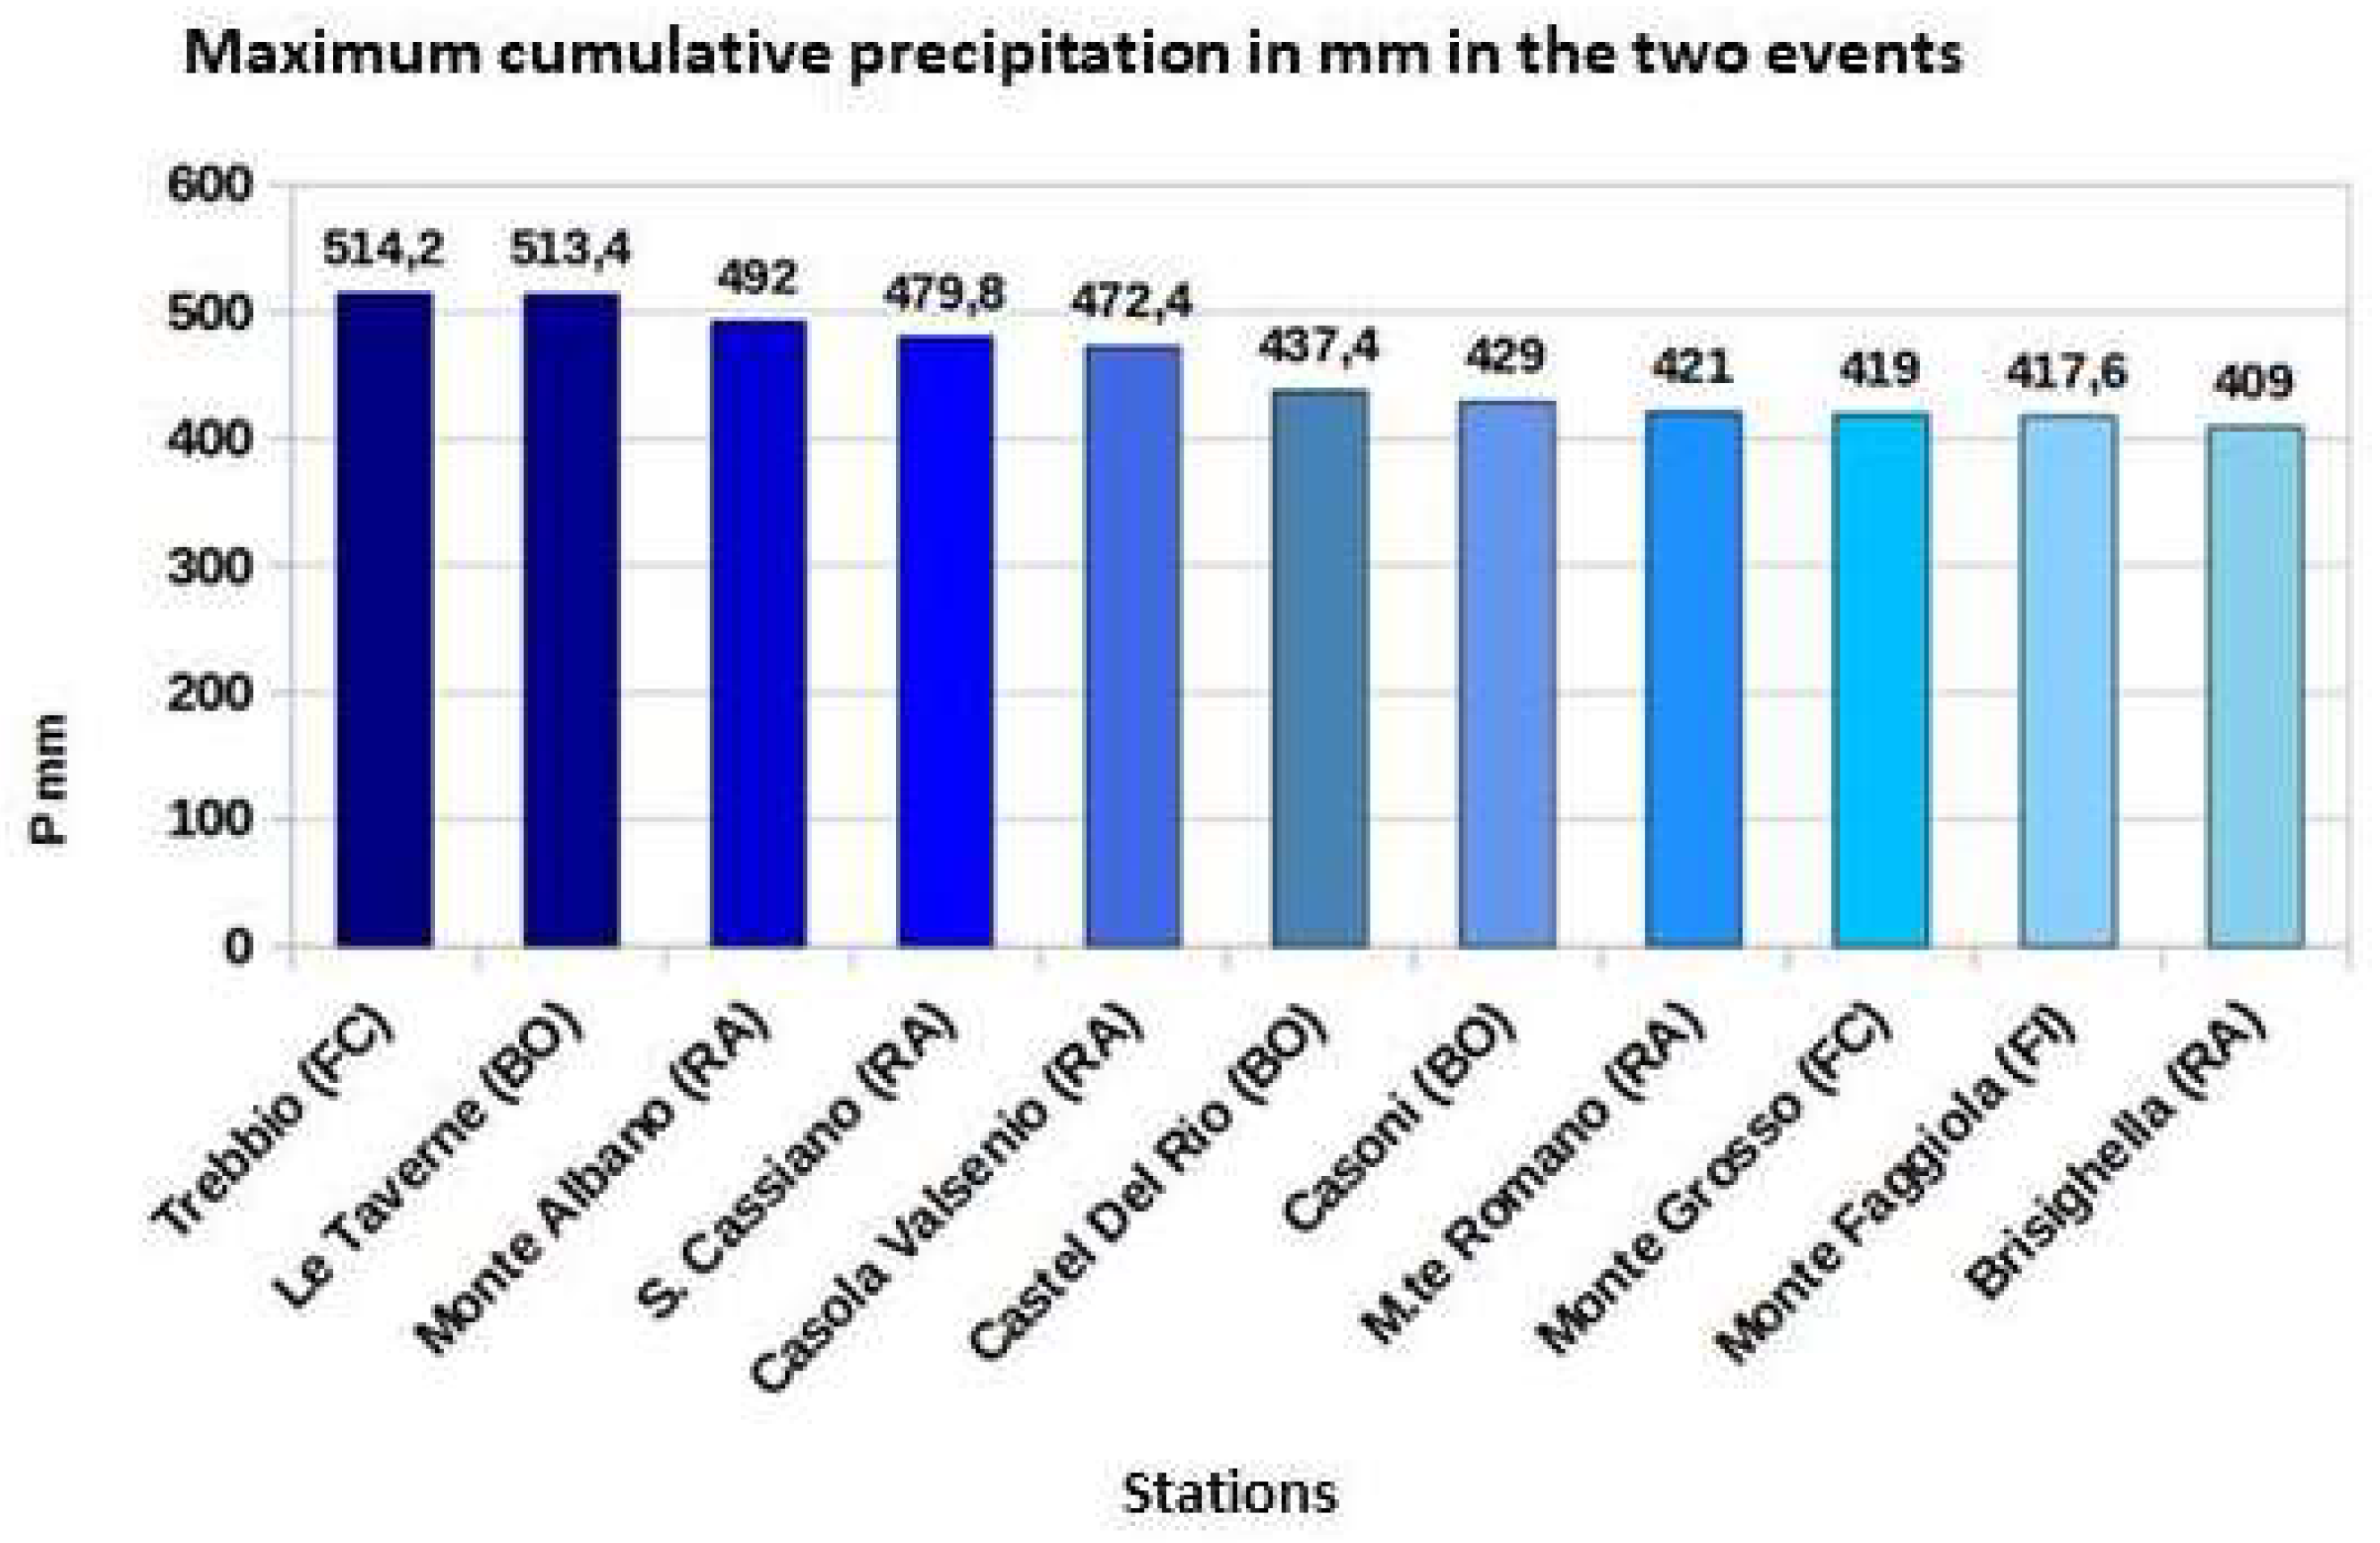
This confirms that the areas of Bologna, Ravenna, and Forlì were the ones affected by the heaviest rainfall, especially the hills starting from the lower hills, as confirmed by the graph in Figure 26.
The stations, without distinction of basin, that accumulated more than 400 mm of rainfall in the two events were considered. Two of them (Trebbio, FC and Le Taverne, BO) exceeded 500 mm of precipitation, which are extreme values for the climatology of the respective areas. Furthermore, it can be seen that the stations with accumulations exceeding 400 mm belonged almost all to the provinces of BO, RA, and FC (here limited to the Forlì area), with the Idice, Sillaro, Santerno, Senio, and Lamone basins certainly most affected.
In May 2023, in addition to the two main rainfall events already mentioned, other ‘minor’ episodes occurred, bringing the rainfall accumulations for the entire month to extreme values, as seen in Table 1.
The four stations considered exceeded 500 mm of monthly rainfall accumulation, with Trebbio (FC) exceeding 600 mm. Based on the monthly climatological values (30-year period 1991-2020), these values are about seven times higher than the norm, while the comparison with the average annual rainfall shows that the accumulated rainfall in May 2023 corresponds to percentages oscillating between 58 and 66% of the annual norm, with the highest peak at Trebbio (FC).

3.2. Impacts on Agri-Food Production

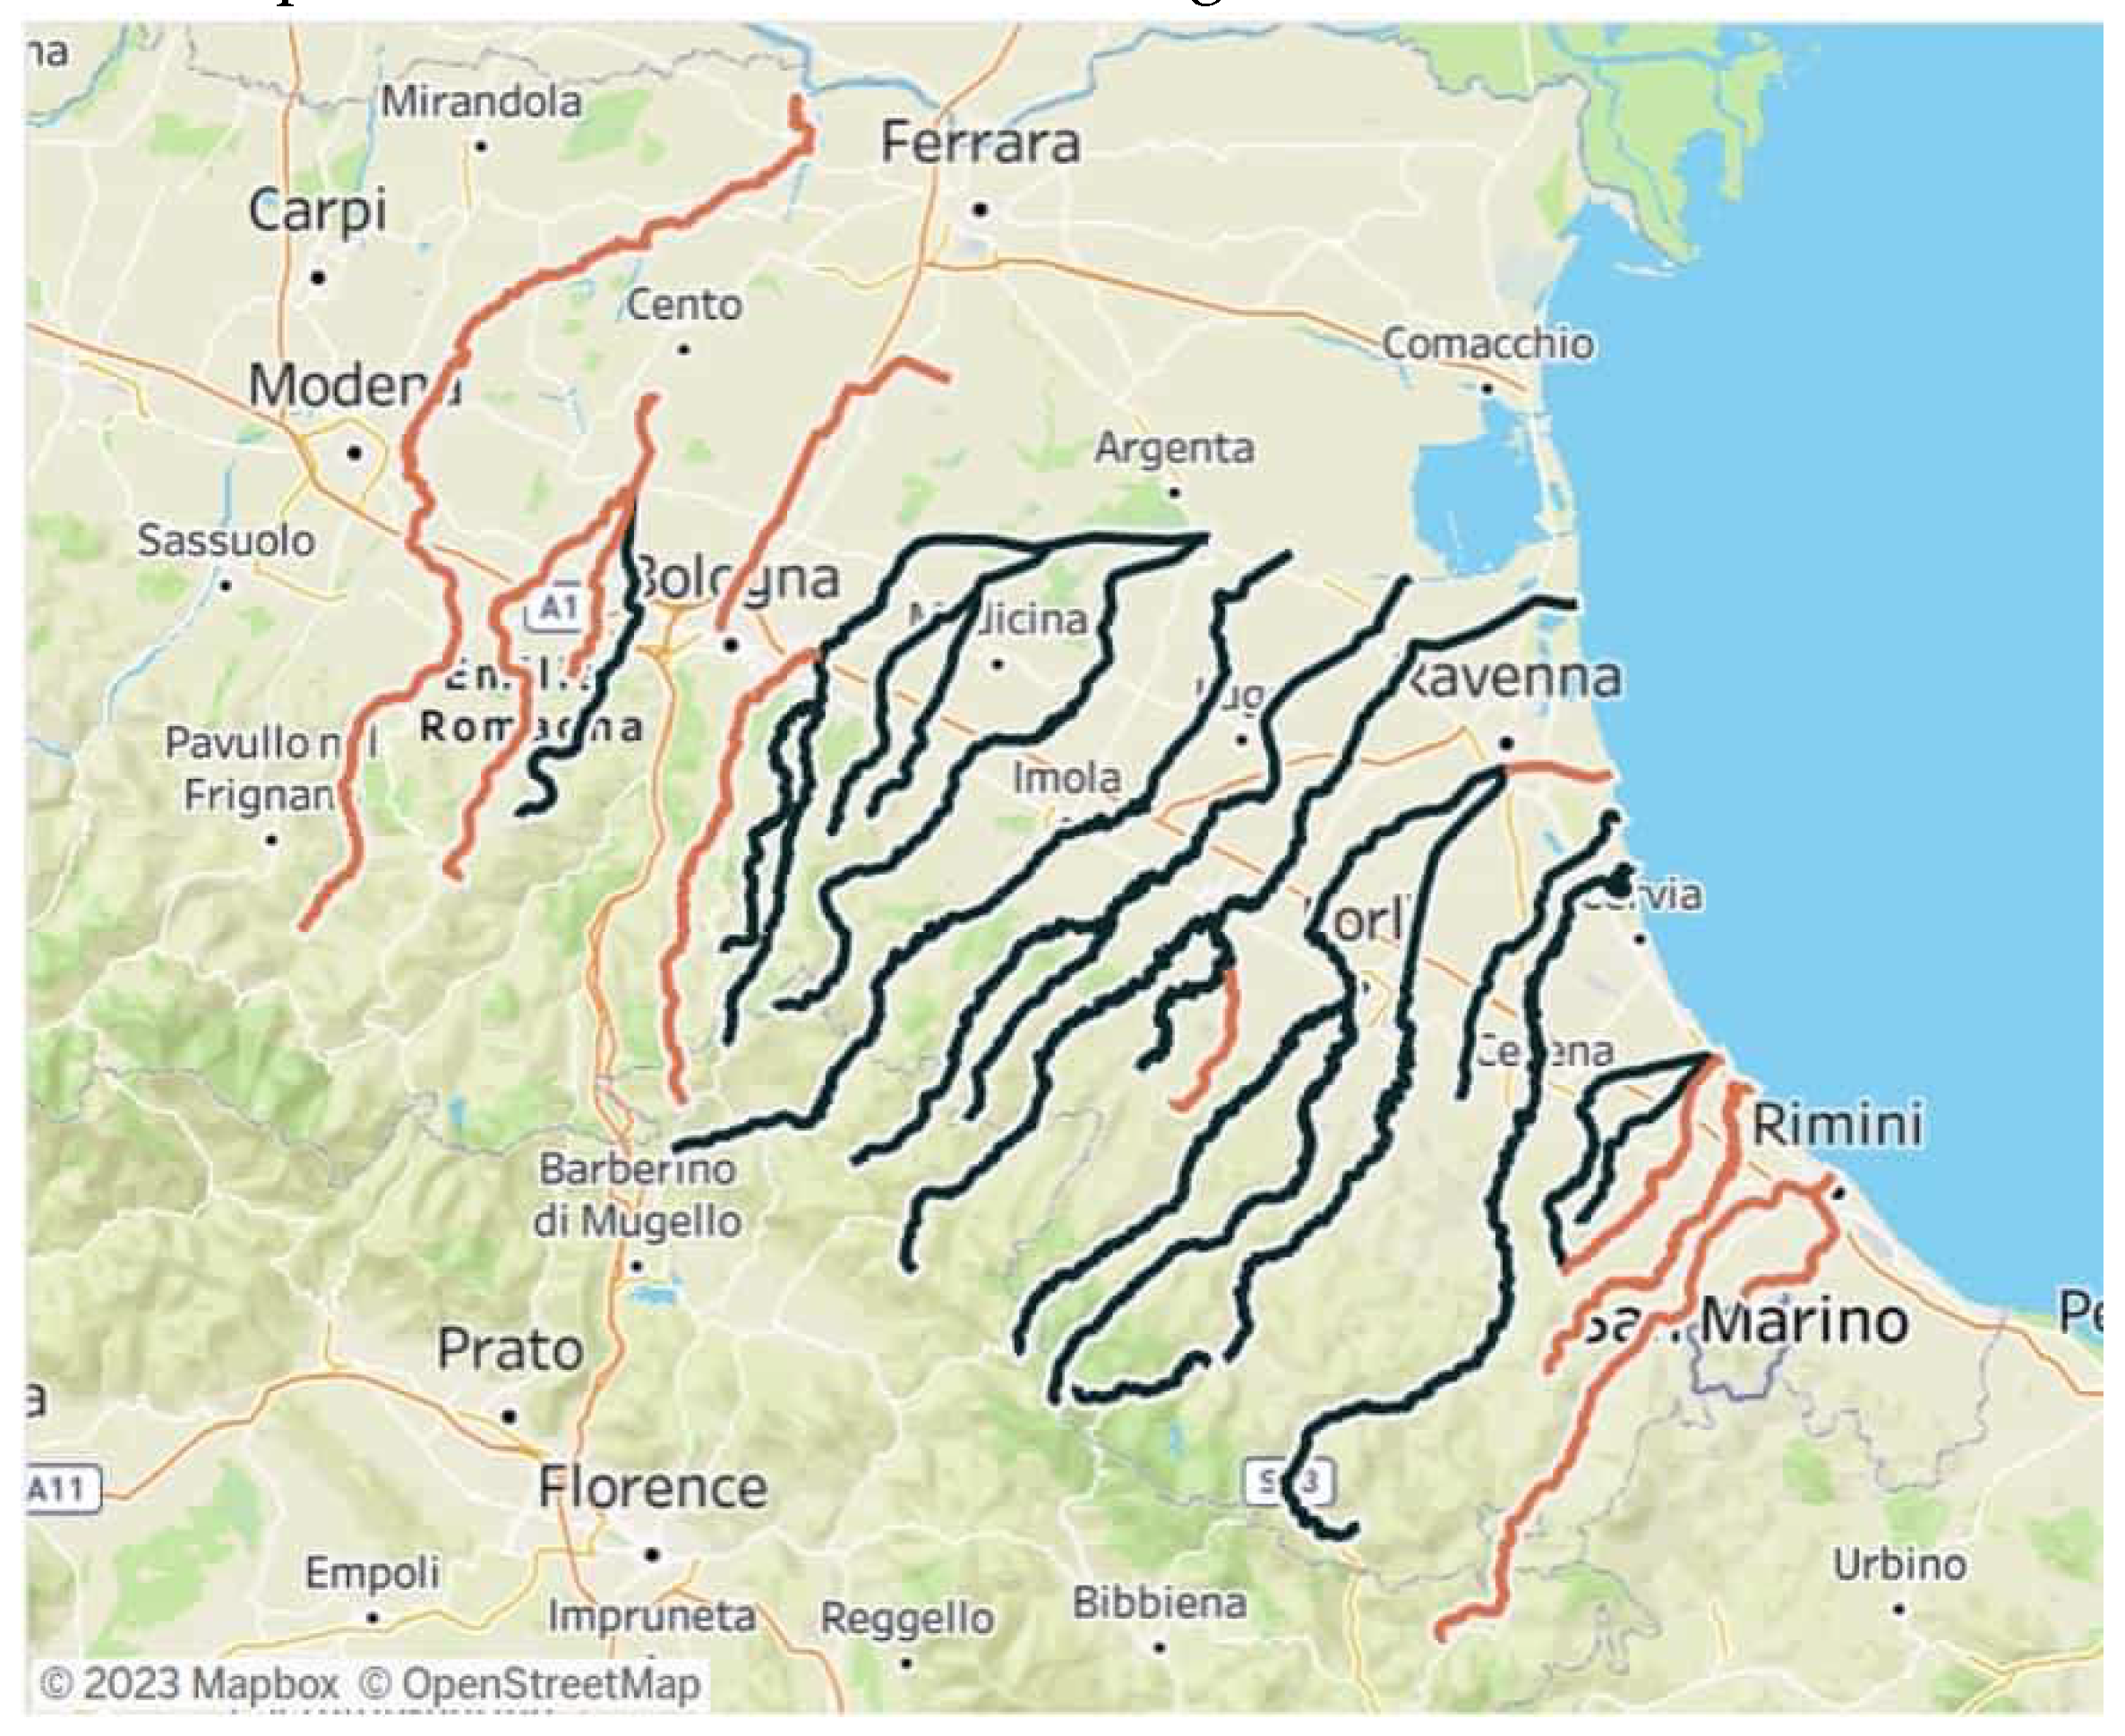
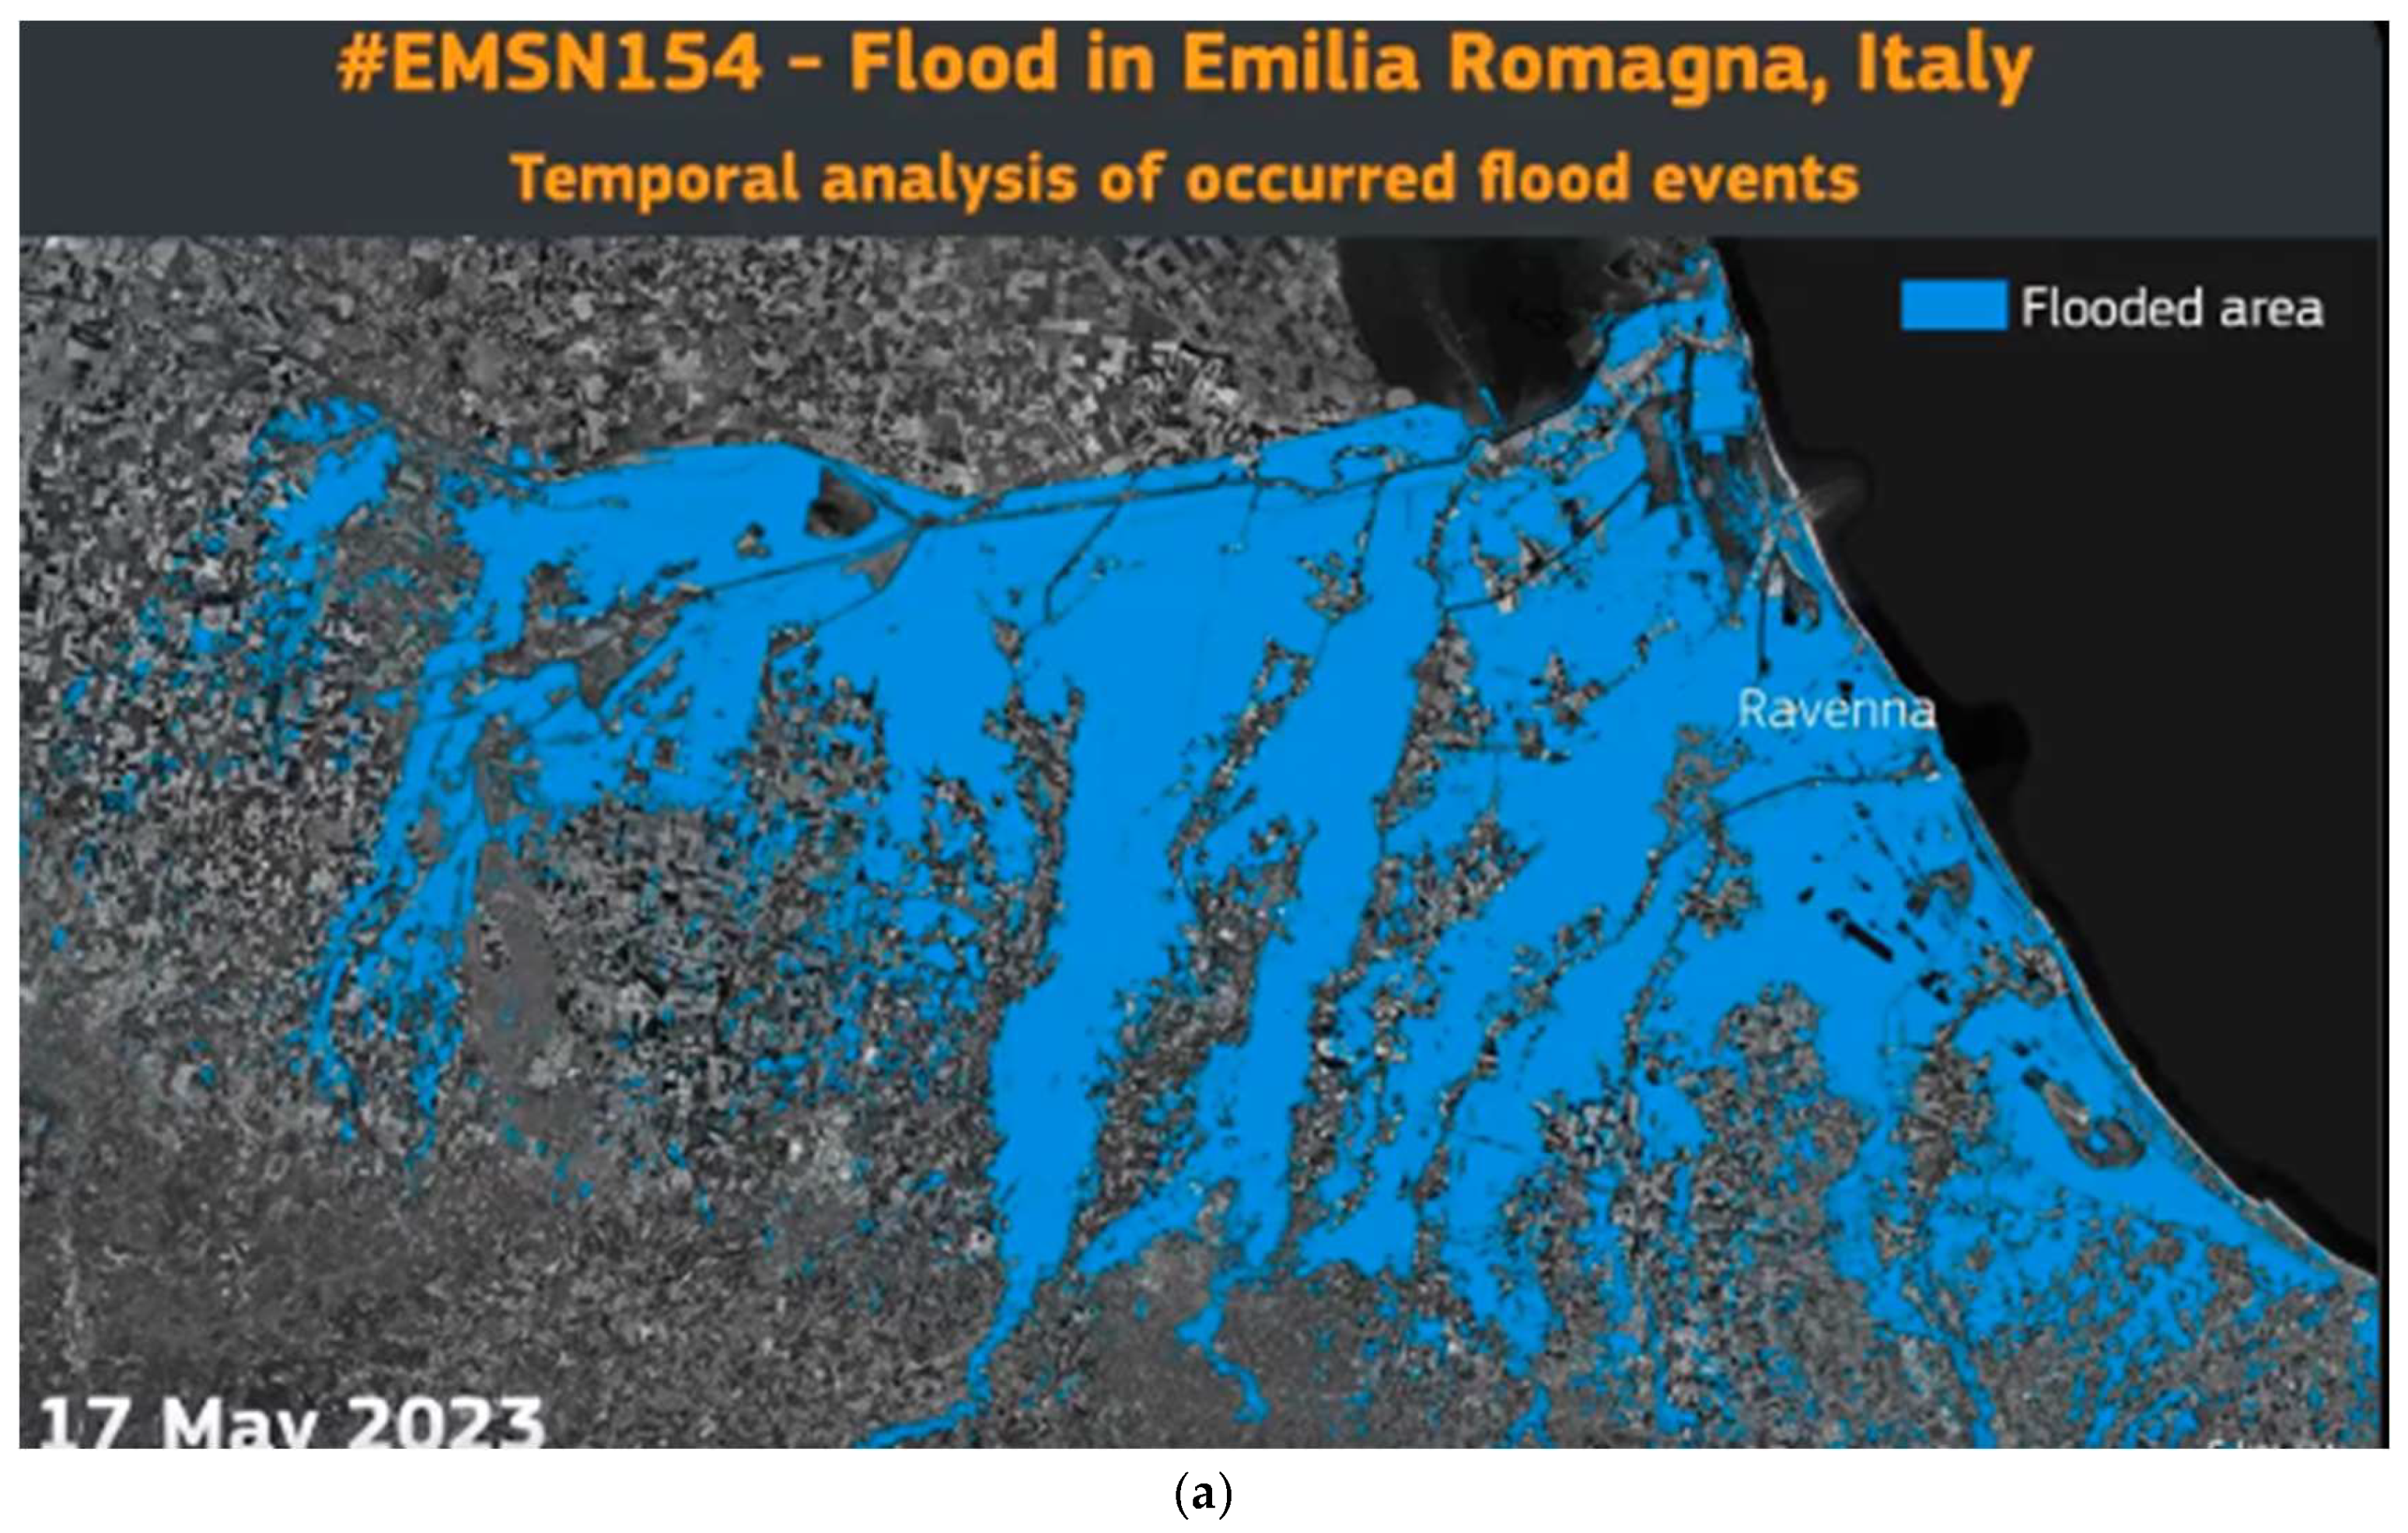
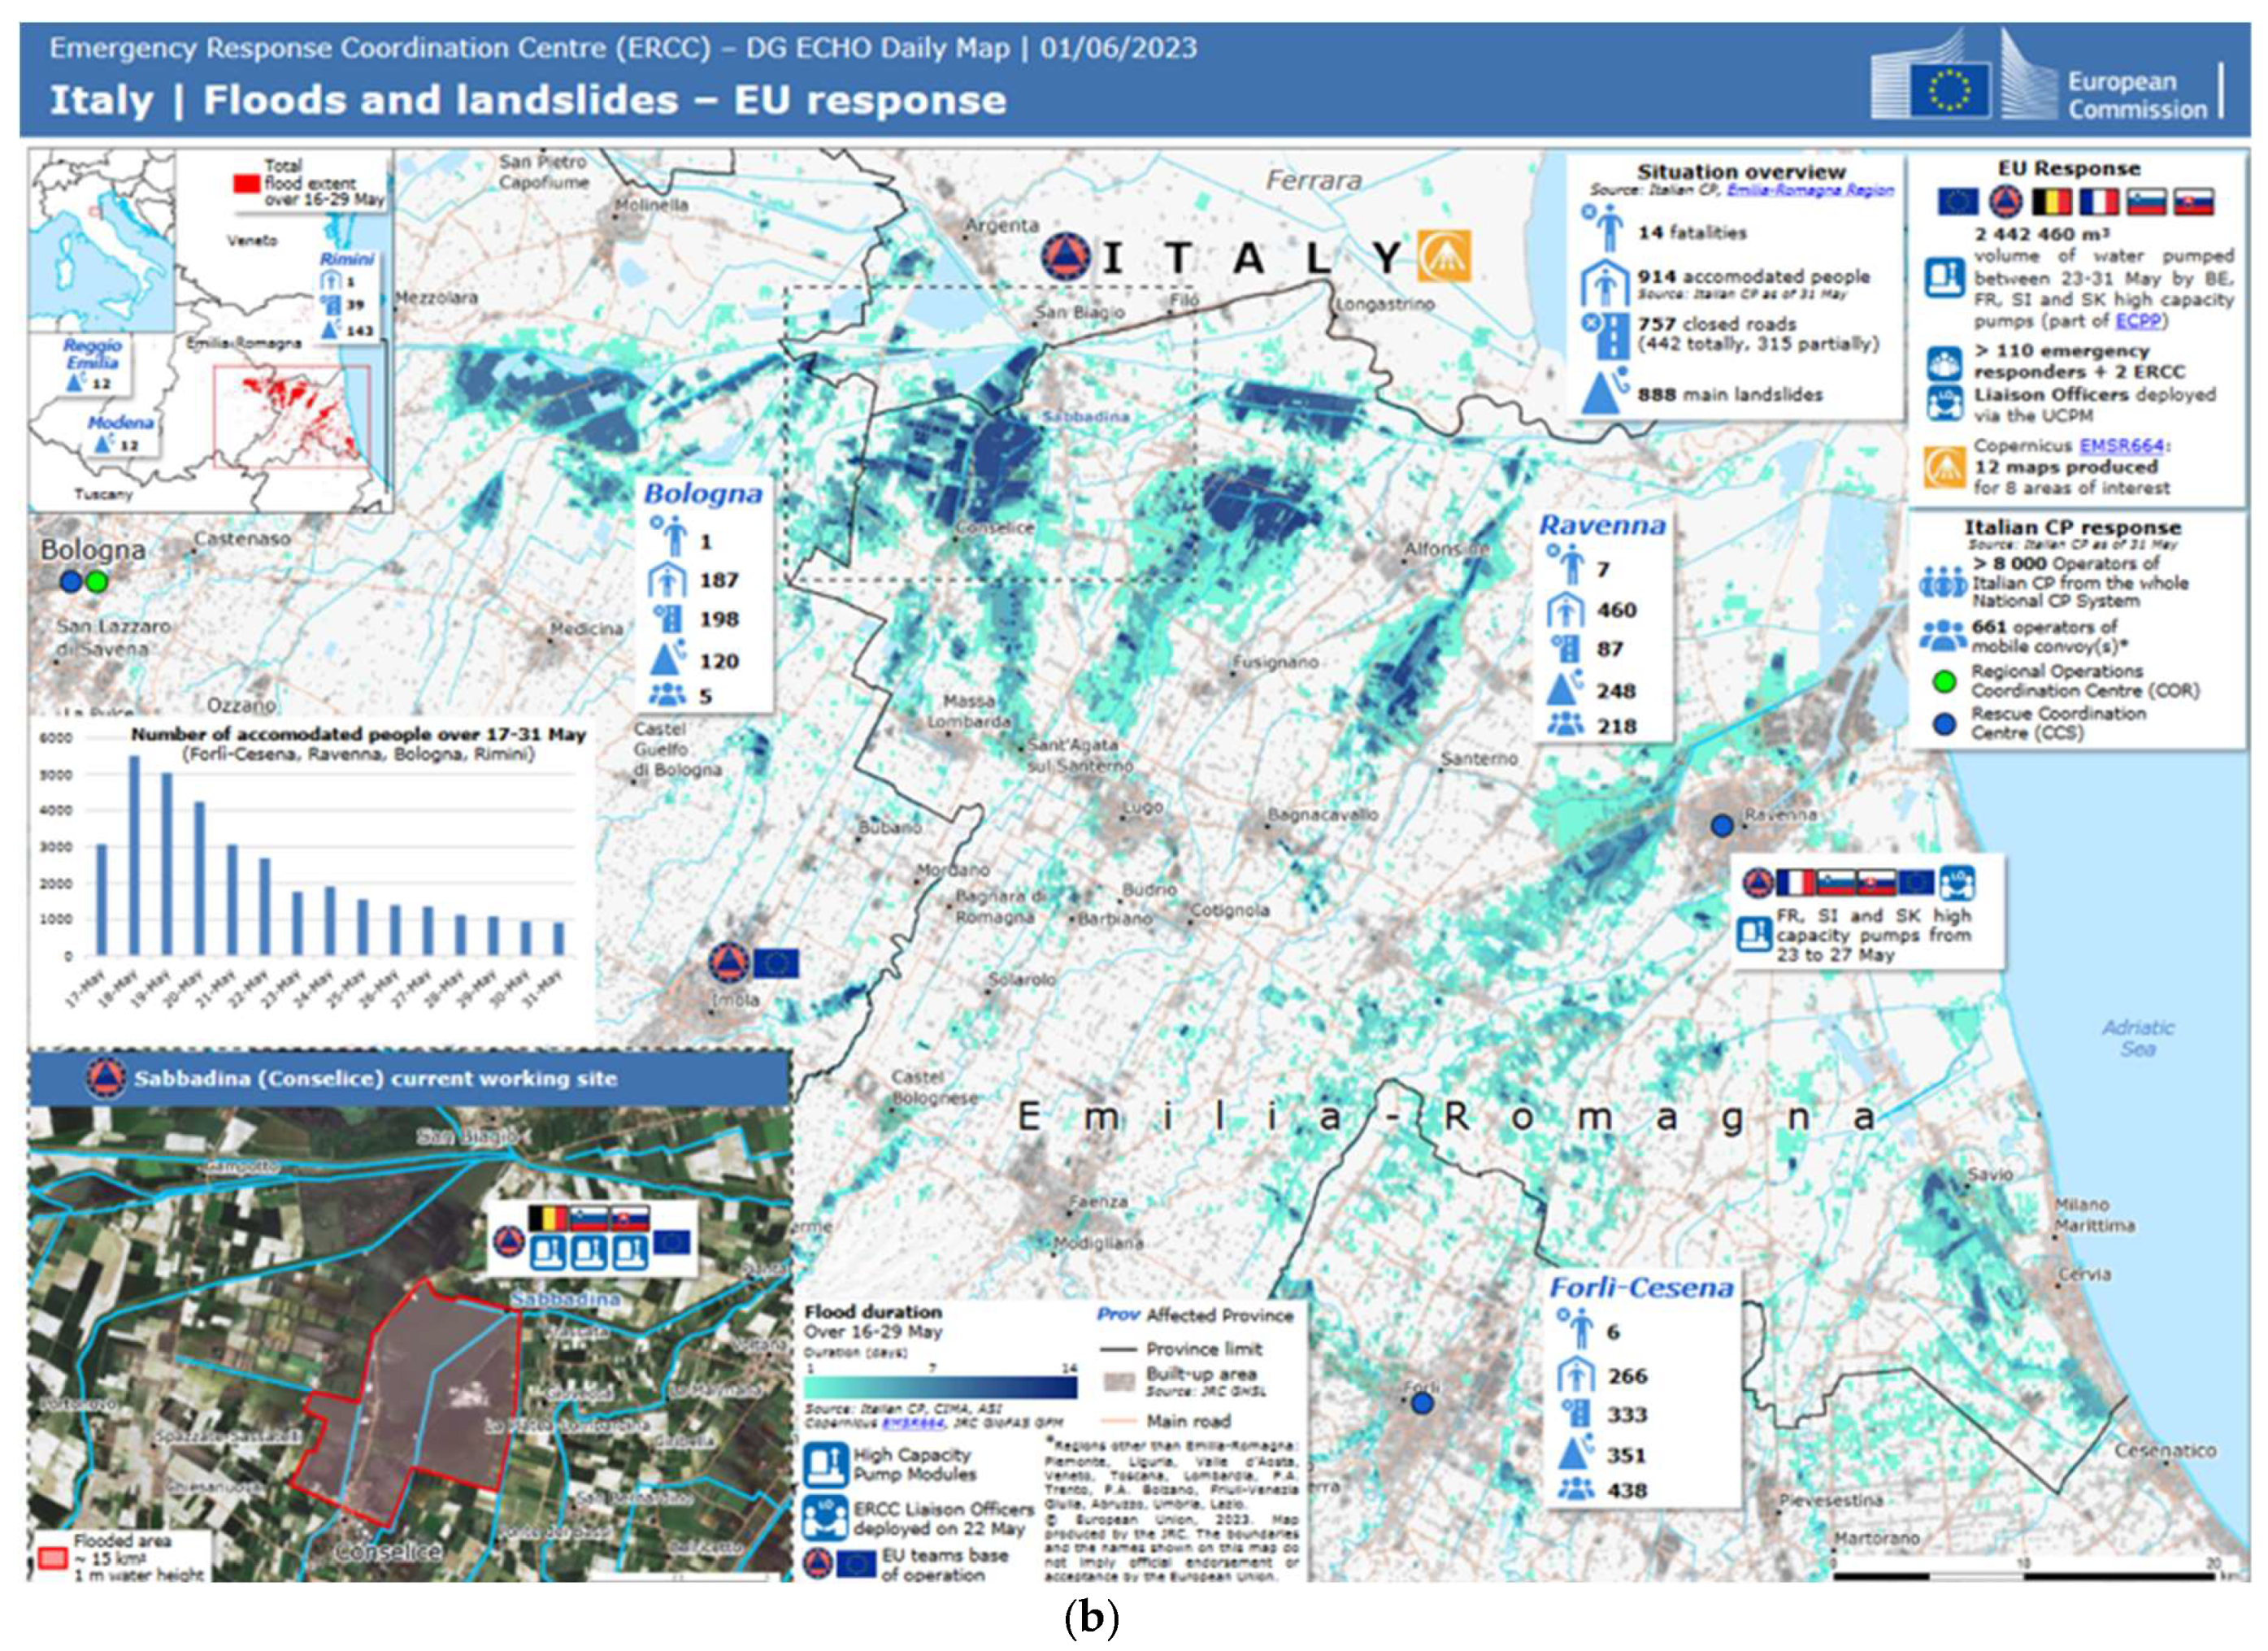
Figure 27 summarizes the previous comprehensive analysis of rainfall on the individual river basins in the area affected by the events. Following the precipitation levels listed in the previous paragraph, an almost continuous situation of floods has affected the entire area. Figure 28a visually shows the impact levels in terms of water present in the area, while the impacts and losses of human lives following the two episodes are summarized in Figure 28b.
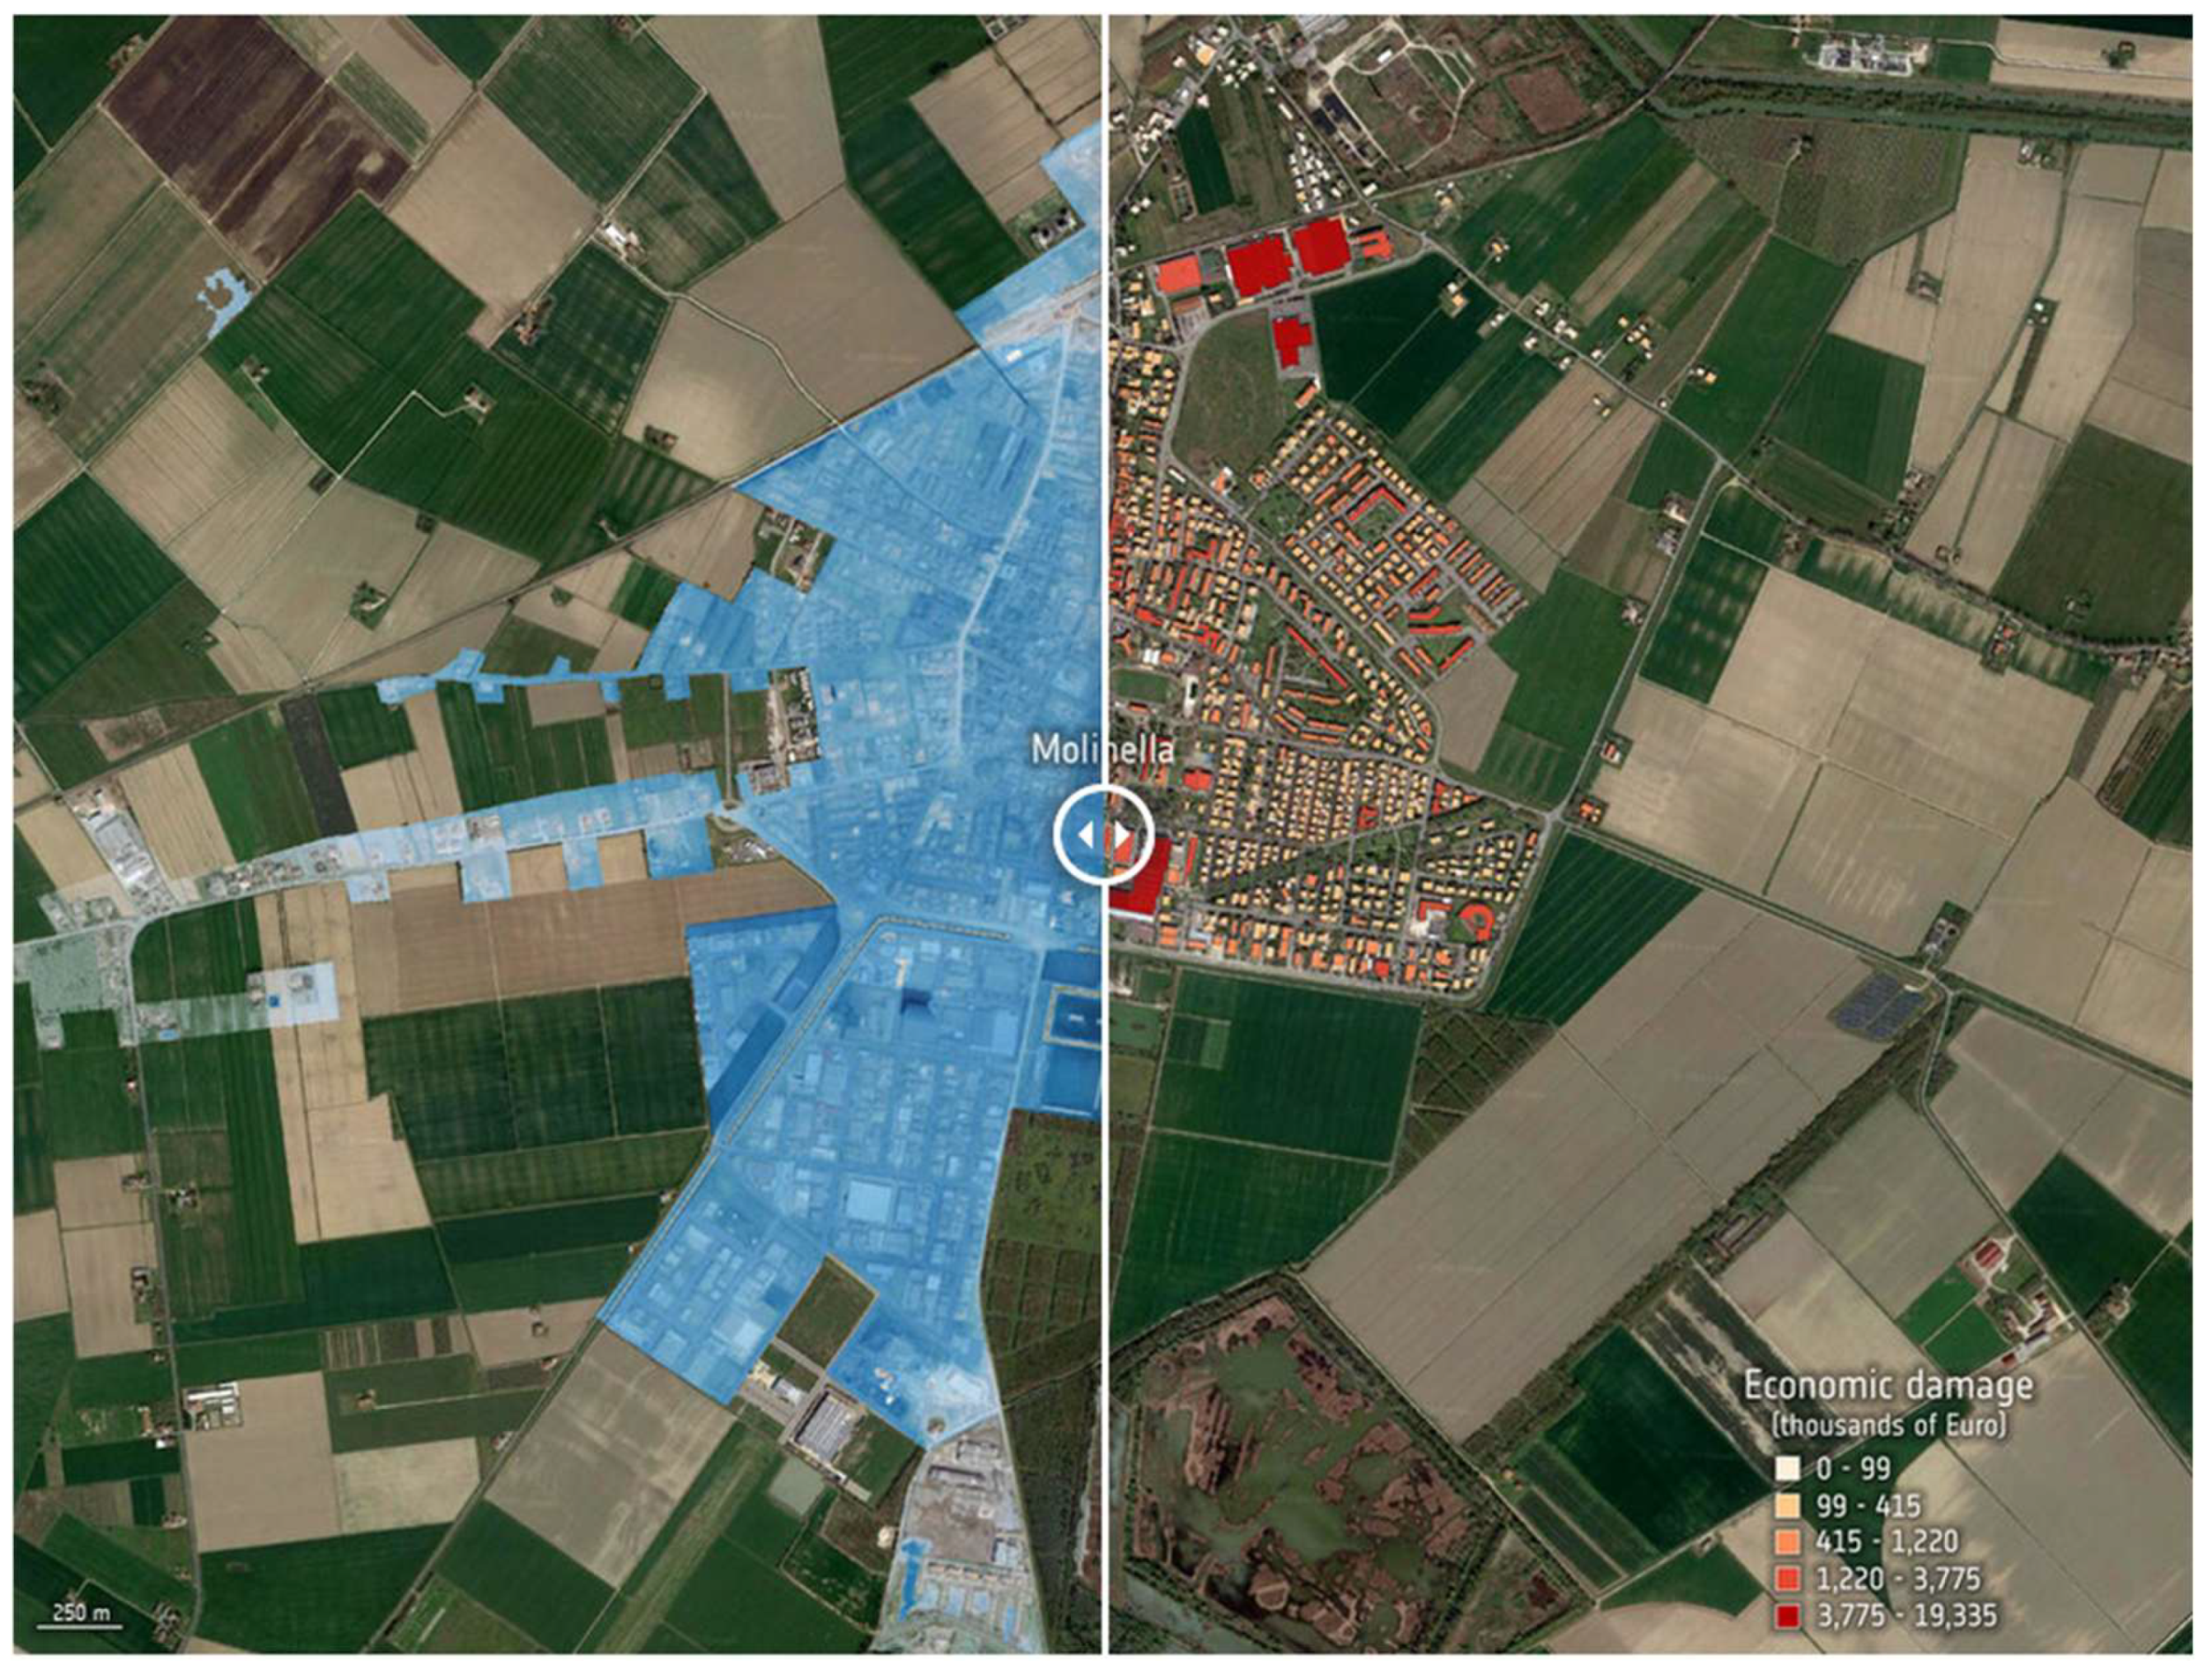
The images immediately show the size and drama of the impacts on an extremely urbanized area with a very high economic production value better known as the ‘Fruit Valley’. The following image shows for one of the hitten town (Molinella) the vastity of the impact on the city centre (Figure 29).
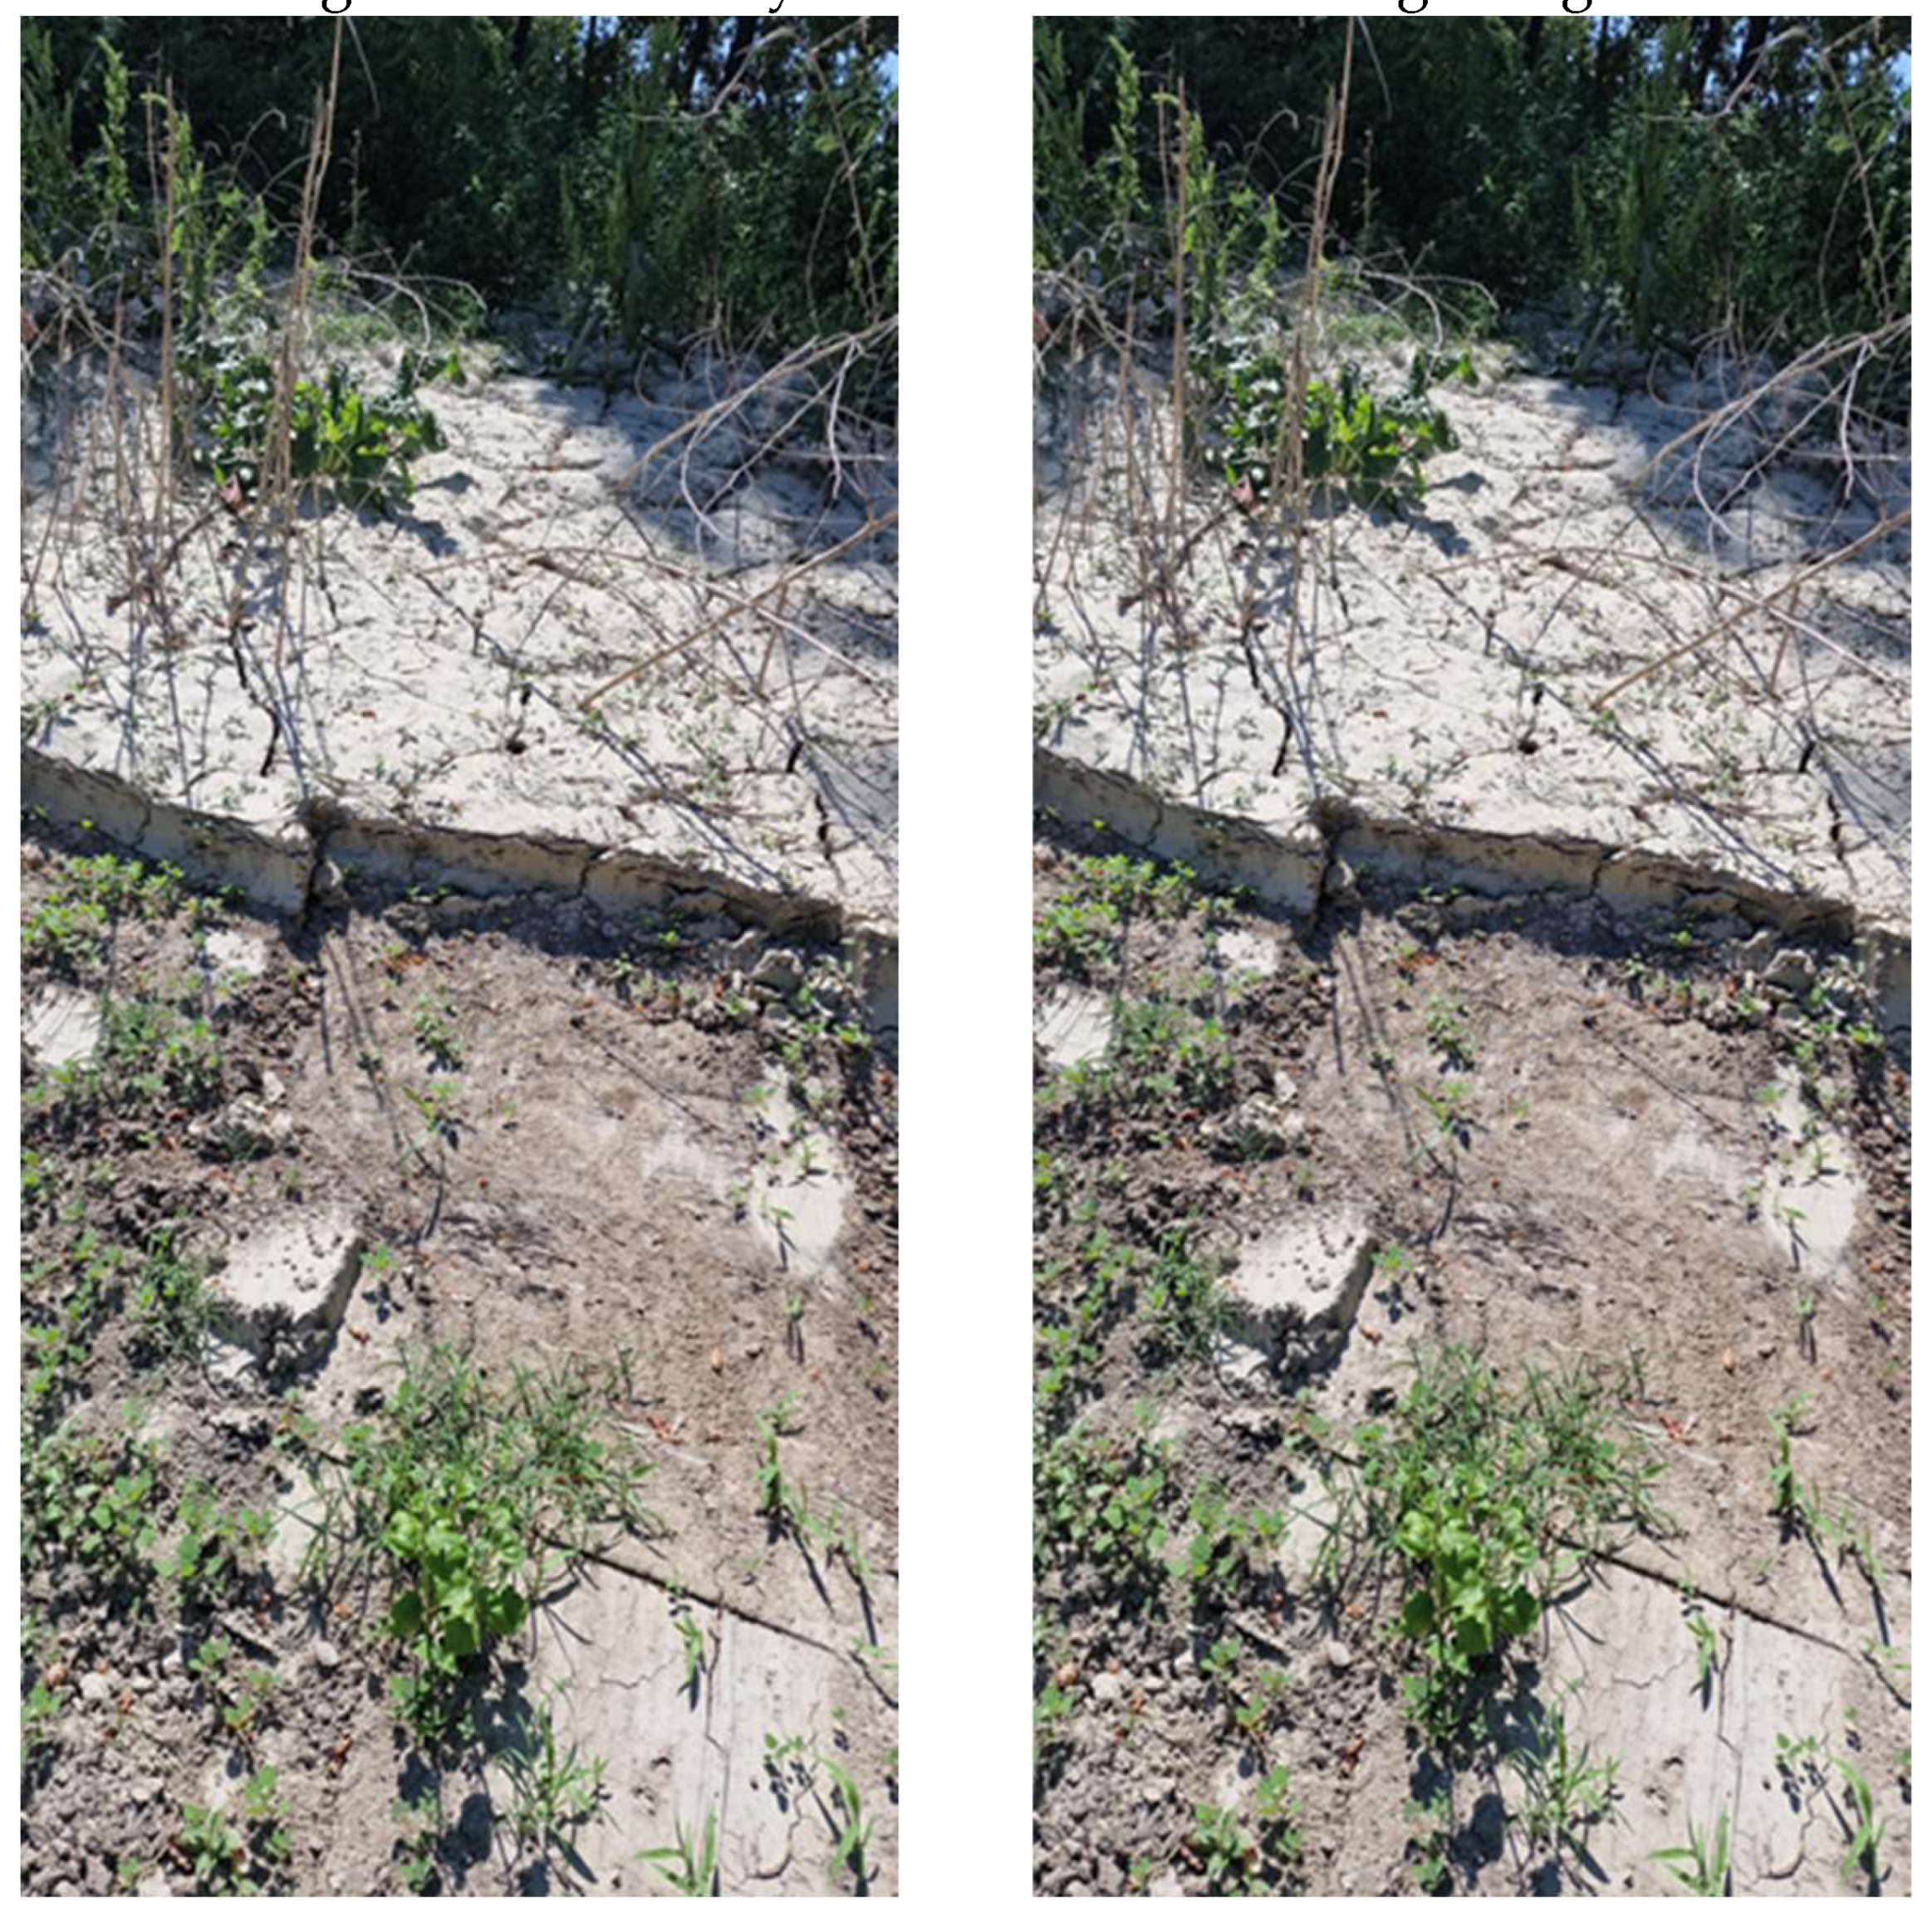
To understand how high, and compact, the transport of material caused by the flood was, Figure 30 shows a series of images taken directly in an area overlooking an agricultural cultivation.
Upstream of the transport of solid material it must be underlined that it is generated by landslide processes and gravitational movements of the slopes: Figure 31 shows how these processes have, and will, affected all the slopes by the precipitation events in unprecedented numbers [1]. The resulting impacts will have long-lasting effects on the entire territory, both territorial and economic.
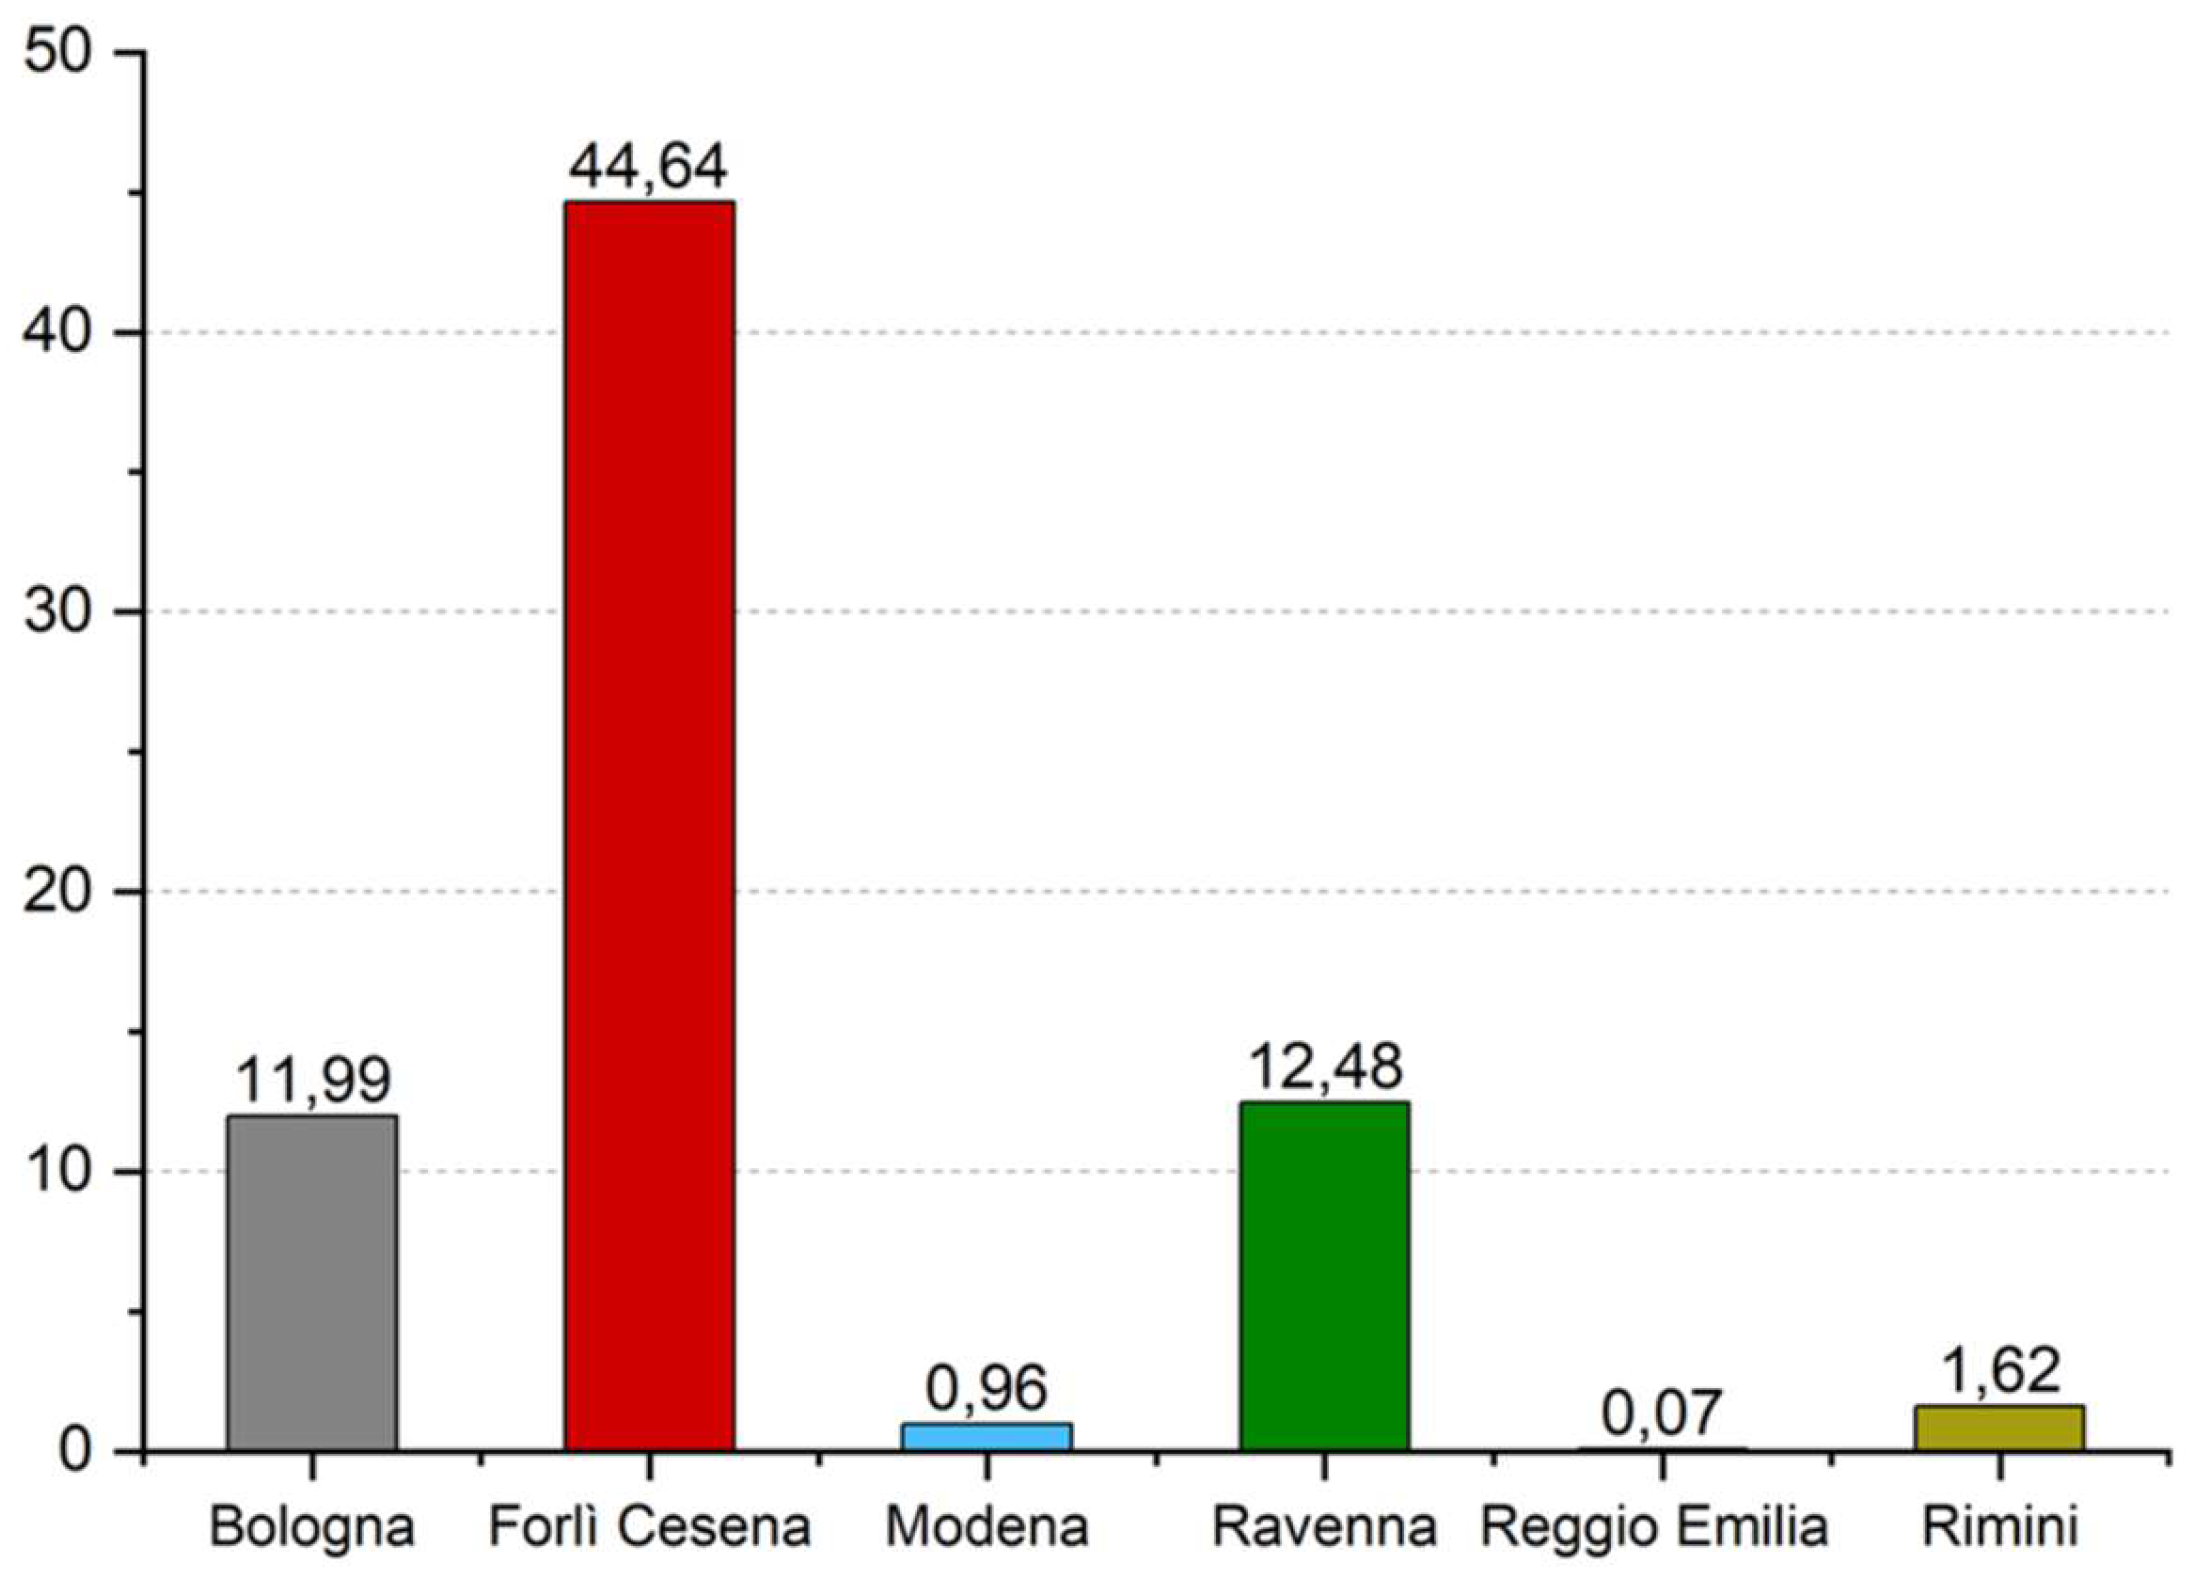
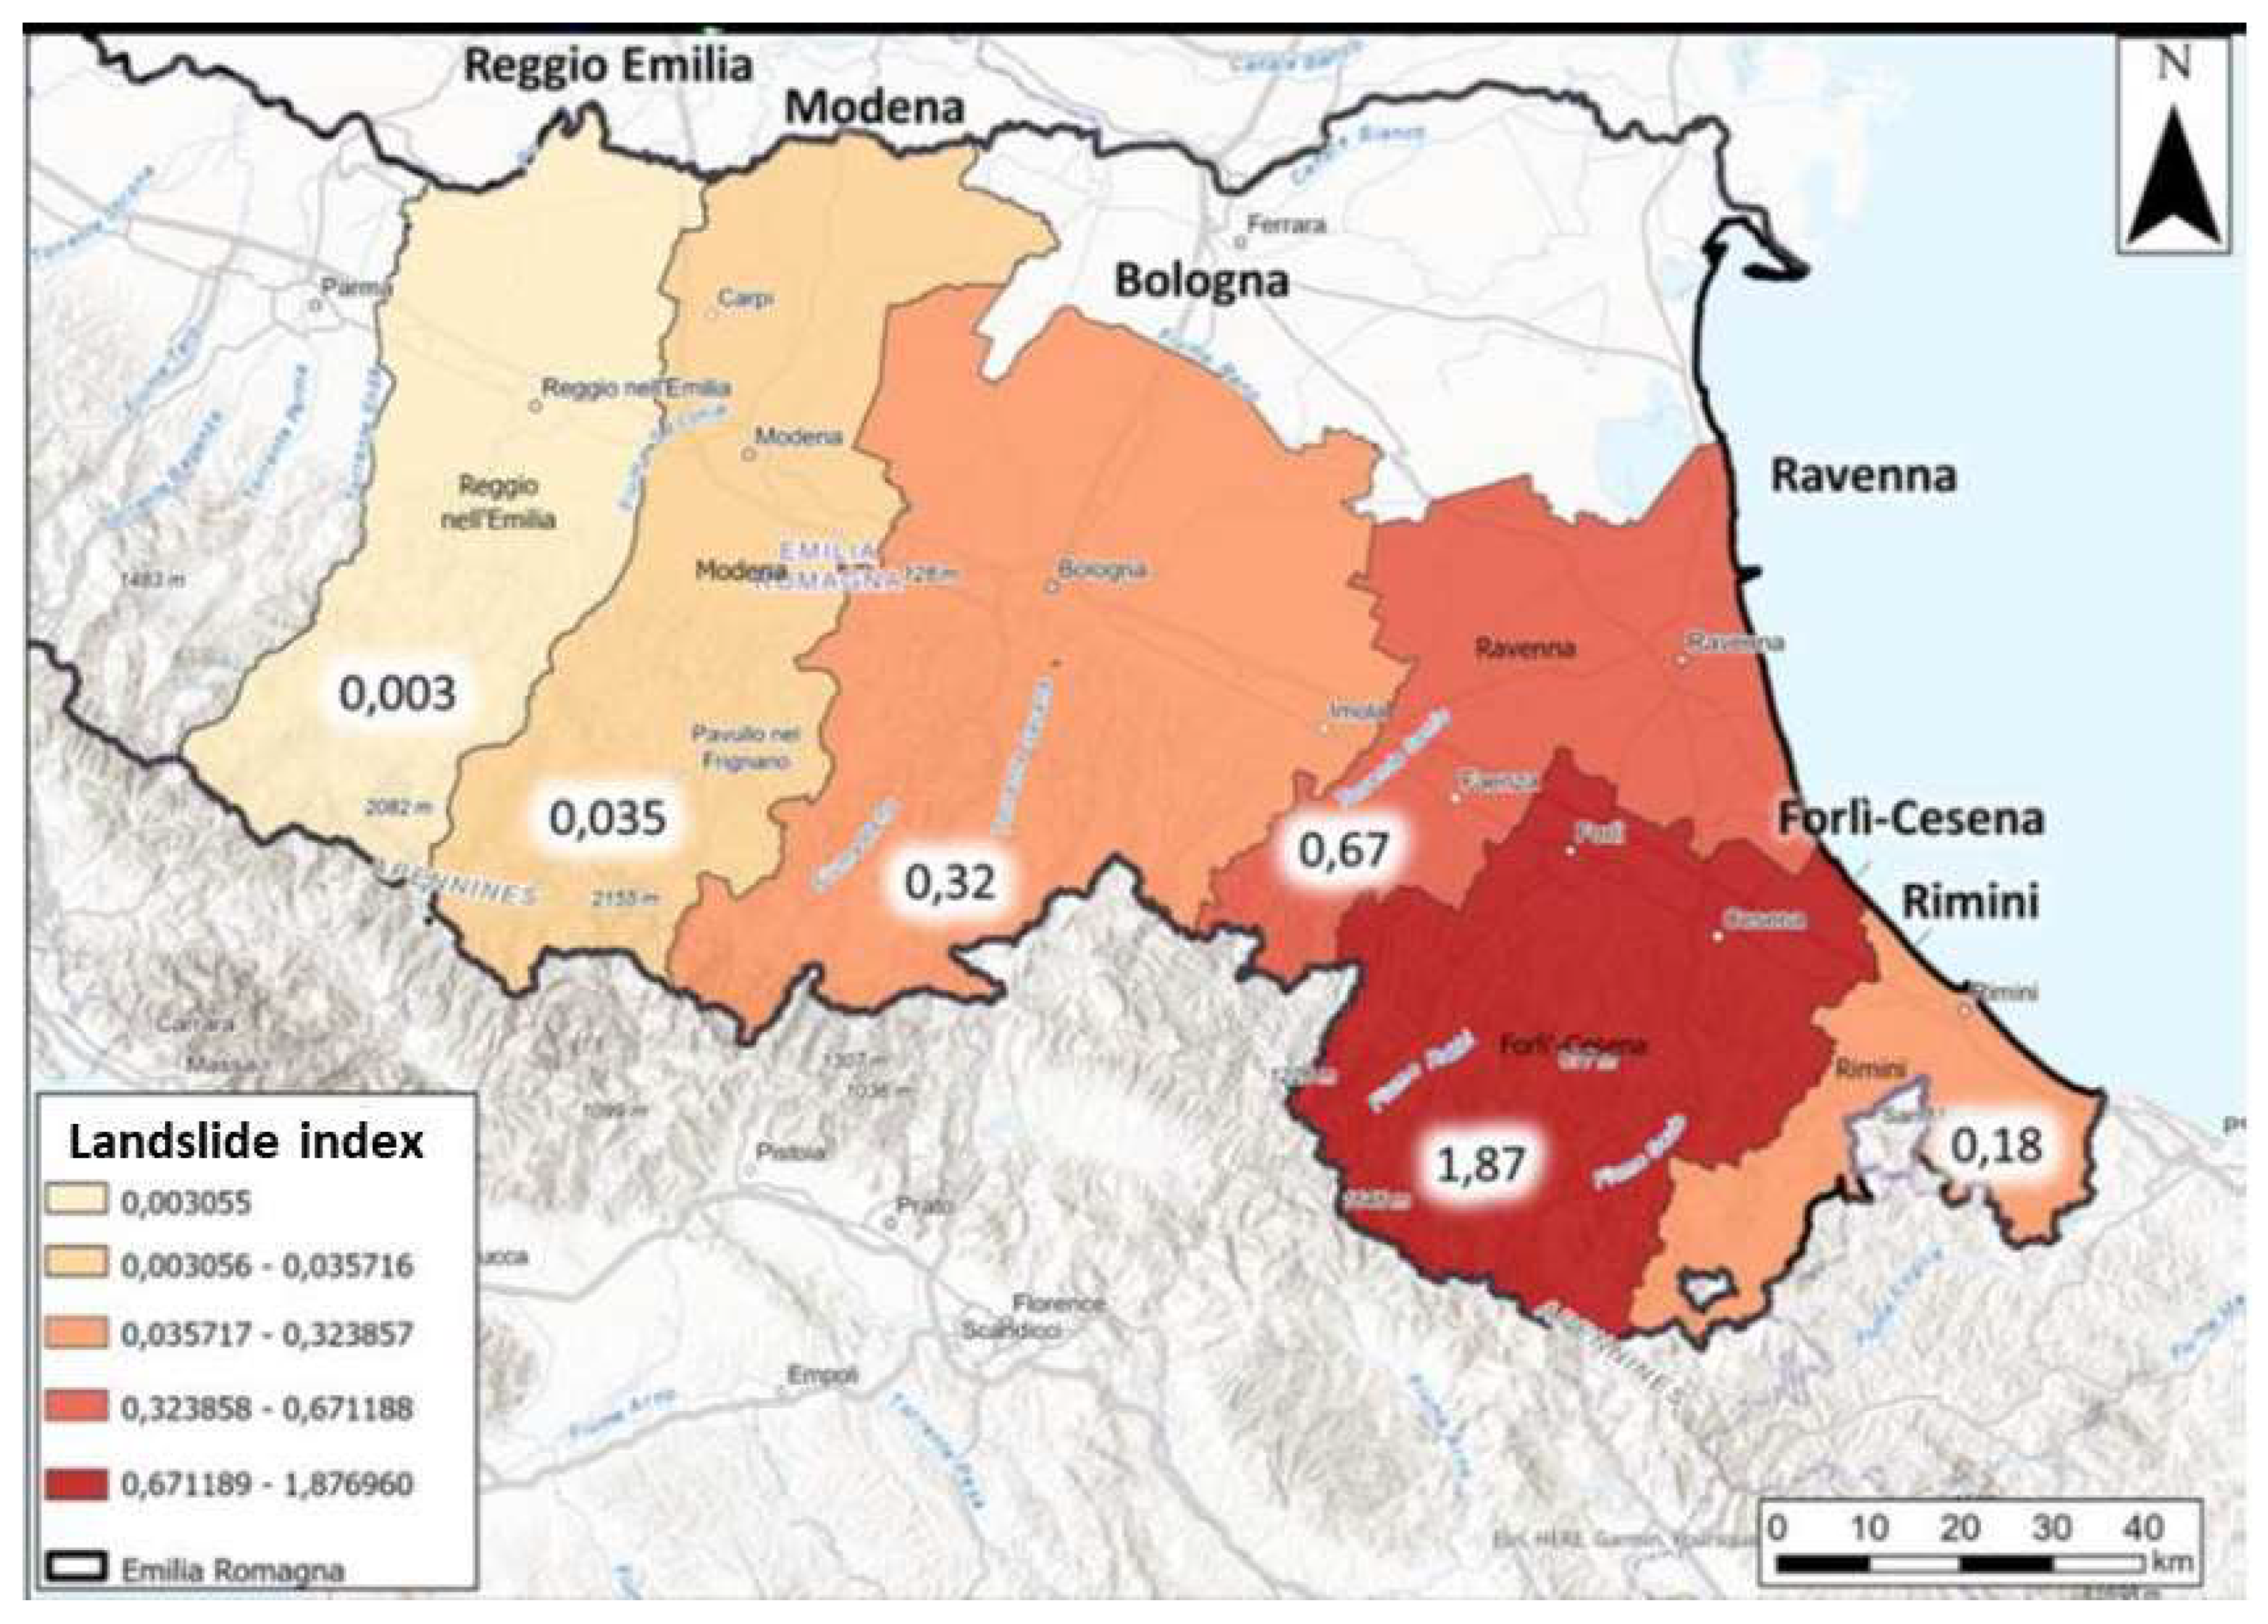
Figure 32 shows the distribution of landslide areas divided into percentages by province. It can be seen that the percentages are directly proportional to the respective landslide indices, expressed in Figure 33.
The flooding was exacerbated by the previous months of drought conditions which dried out soils and reduced their capacity to store water. According to Andrea Betti, the vice president of the farming organisation, Confagricoltura Ravenna, “The ground was dry due to the drought, cracks had formed and, as we know, dry ground becomes impermeable.” As the soil cannot absorb the rainwater, it travels across the ground – as Betti says, “destroying everything” [6].
On the back of ongoing damage assessments, the local authorities are anticipating economic losses to be in the billions of Euros. As there is an existing protection gap for flood coverage, the insurance industry is likely to bear only a smaller portion of the overall costs [7]. The farming organisation, Confagricoltura Ravenna, have made a preliminary estimate of about €1.5 billion ($1.6 billion USD) for damages to crops in the Emilia-Romagna region [10]. In a changing climate, businesses should act now to understand both current and future flood risk. Along with comprehensive climate change data, JBA offers probabilistic modelling and high-resolution hazard maps for all flood types in Italy.
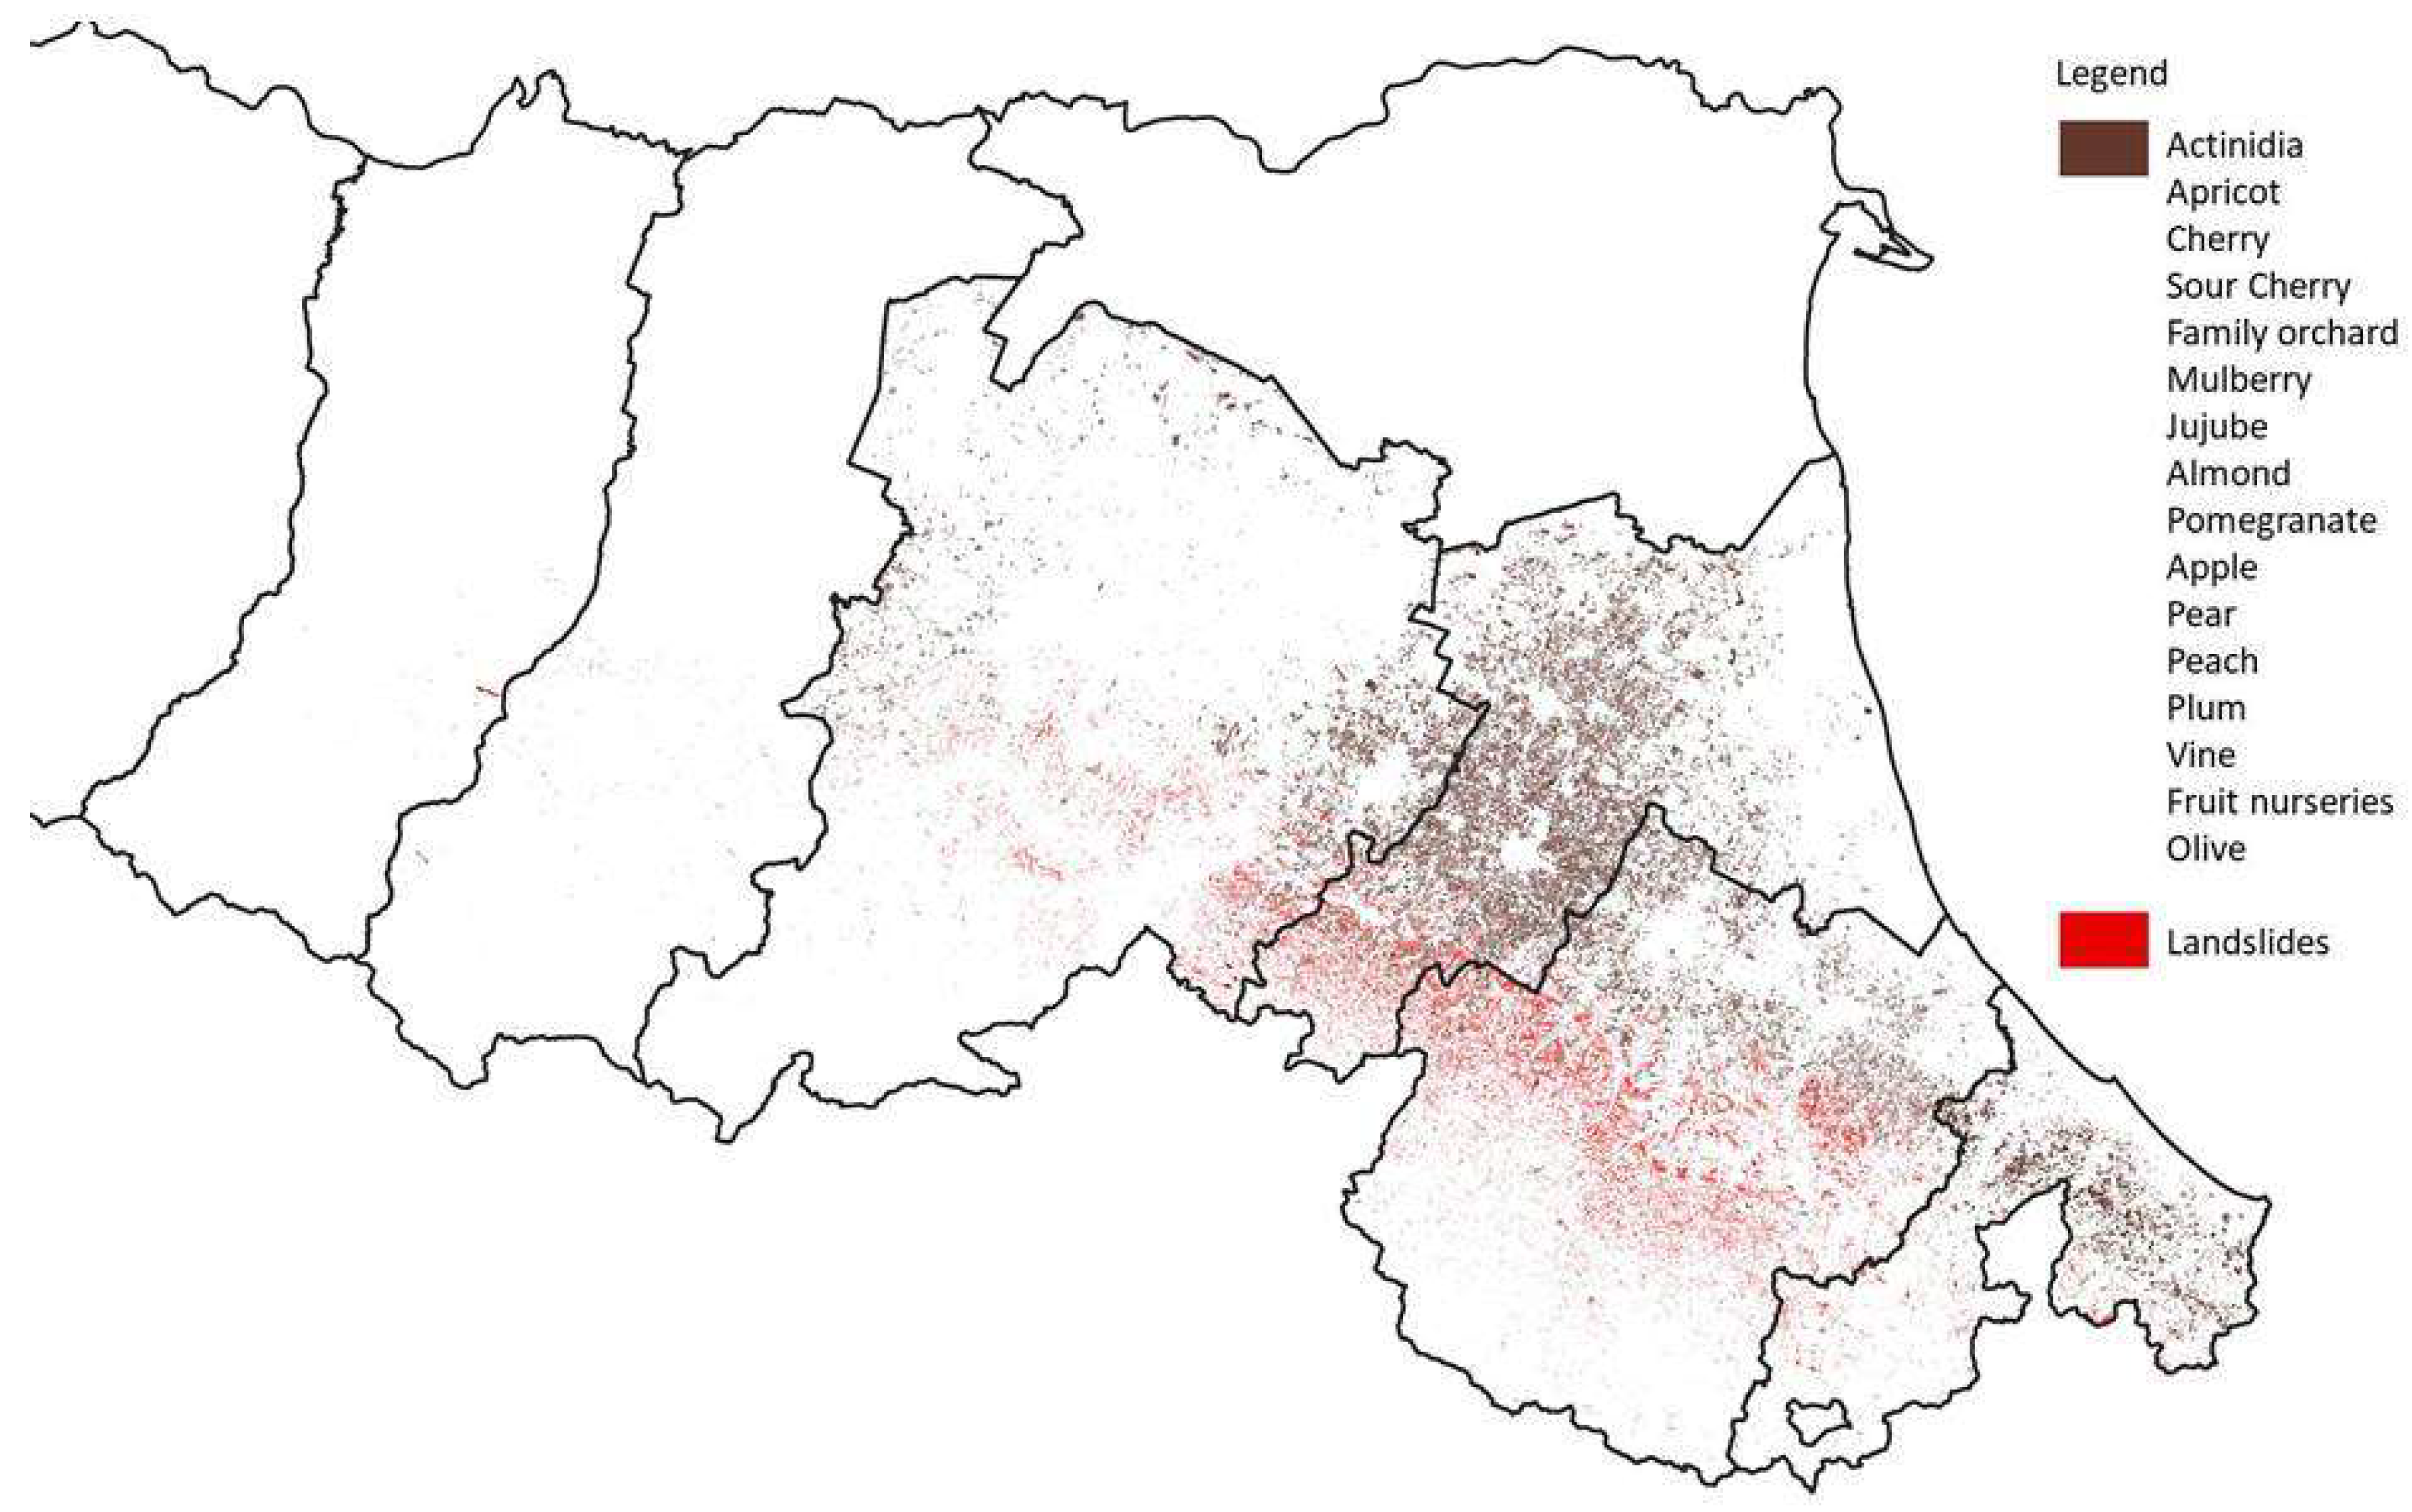
Figure 34 underscores the profound economic and qualitative value of the sole orchard production in the Fruit Valley. The region boasts a diverse array of agricultural businesses in the fruit sector, with a particularly high economic and qualitative value. Notably, a significant portion of the orchard production areas was affected by the landslide events in May 2023.
Due to its high traditional vocation, Emilia Romagna is one of the major contributors to the Italian agri-food-production, mainly fruits and fresh horticultural crops, olives, vines, nurseries together with field crops. Large flooding and some frost events were the main meteorological-climate events that in 2023 caused, after three consecutive successful years, a total economical reduction of -9%, reaching the value of 5,3 B Euros. Although part of this reduction (estimated in 500 M Euros) must be attributed to Ukraine conflict, the impact due to the flooding is out of discussion in terms of productive horticultural surfaces and yield [12].
In 2023, the regional reduction of Gross Marketable Production was almost exclusively due to the 17% losses of vegetable crop production, with details for each sectors sumarized in Table 2.
What is not made explicit by the reported numbers are the causes of such variations. As for cereals, oil seeds and protein crops, such reasons are exclusively linked to lower market prices, the reduction of fruit crops, oil and seedlings it is recognized to be induced by the extreme flooding events occurred in May.
Only economic data are mentioned here as reliable element to document the impact, as at the flooding time only short term impact on yield have been recorded, while the long-term impacts will arise and will be quantifiable only in these following years.
Such longer term impacts are in fact ascribable to the need to eliminate, change destination or eventually re-plant orchards that have been strongly damaged by water logging, being slack water and mug persisting in many fields for several days and even weeks.
Orchards, the qualifying elements of the Po Valley fruit production, largely recognized as one the high quality providers of the European fresh fruit supply, have proved to be vulnerable to water excess. Most rootstocks and cultivars are selected to be drought resistant and low water demanding instead of flooding resistant. Younger trees in many Ferrara, Ravenna areas reported serious root damages and need to be replaced, with considerable high economic and energy expenditures, thus leading to impressive long term effects both at farm and regional scales. Flooding is recognized to cause hypoxia (low-oxygen stress or oxygen deficiency stress) or anoxia, thus deprivating plans of a primary driver of many biogeochemical and microbial functions. Shifts in redox conditions have strong implications for nutrient cycling, organic matter fate, nitrogen cycling and bioavailability of many nutrients. Such major abiotic stress to fruit trees, that manifested in many cases and for particularly vulnerable specie (peach, stone fruits, and kiwi fruits) with yield reduction, are in fact responsible of cause adverse effects on cell division, cellular metabolism, energy consumption, transcriptional regulation, mineral uptake, and physiological variables including basic life functions (water potential, photosynthesis, hormone biosynthesis, carbohydrate mobilization, and reactive oxygen species generation/scavenging [13,14]. In addition to this, cultivated surfaces and trees carried off by the water current and the mug have to be considered, making in these cases damages much more direct and heavier.
It is then clear how pitfalls to Po Valley fruit production will persist in the incoming future, while research and innovation approaches (besides economic compensation put on place by local administration, European Community contribution, and Common Agricultural Policy actions) are working to produce more resistant genotypes, and suitable management techniques able to match with a wide range of water availability, unfortunately ranging from drought to flooding. Large strategical expectancies are reserved to adaptation, as cisgenic breeding, varietal selection, water containment and regulation tools as early warning locally tailored smart crop management and, in the longer term, to improving the mitigation capacity of agricultural productions.

3.3. Impacts on Landscape, Ecosystem Services and Urbanization

Forest and woodland cover occupies 28.4% of the regional territory and has increased by 34% compared to 1936 (Figure 35). This increase was mainly concentrated in hilly and mountainous areas, in the face of a gradual abandonment of agricultural land for the same areas, equal to approximately 73% compared to 1980. This phenomenon is highlighted by the average annual working hours per hectare, which is now 18, compared to 32 hours in 1980 [1].
Forests that are not adequately managed or abandoned during extreme rainfall events can generate significant damage on fluid soils: greater competition tends to reduce mechanical resistance by weakening the stand, with more significant mortality of the plant population. This increases the volume of uprooted stumps, which, if transported, can obstruct or damage the infrastructure present in the area. For riparian forests, they also protect the banks from erosion if they are well managed. On the other hand, using the river strips for cultivation purposes, the hydraulic role of the vegetation is lost, which, weakened, risks contributing to the mass of debris transported during the flood event. Reduced maintenance of the minor hydraulic network, terraces, and man-made structures (dry stone walls) also contributes to the increase in local instability and landslides.
From the latest Report (2023), Land consumption, territorial dynamics, and ecosystem services, drawn up by the National System for Environmental Protection (SNPA), the Emilia-Romagna Region is reconfirmed as one of the regions with the highest land consumption, with its impact on ecosystem services and landscape degradation. Net land consumption (understood as the increase in artificial land cover assessed through the balance between land consumption and the increase in agricultural, natural, and semi-natural areas due to recovery, demolition, dewaterproofing, renaturalization, or other actions capable of bringing the consumed soil back into a soil capable of ensuring the ecosystem services provided by natural soils) is equal to + 635 hectares in 2022 compared to 2021.
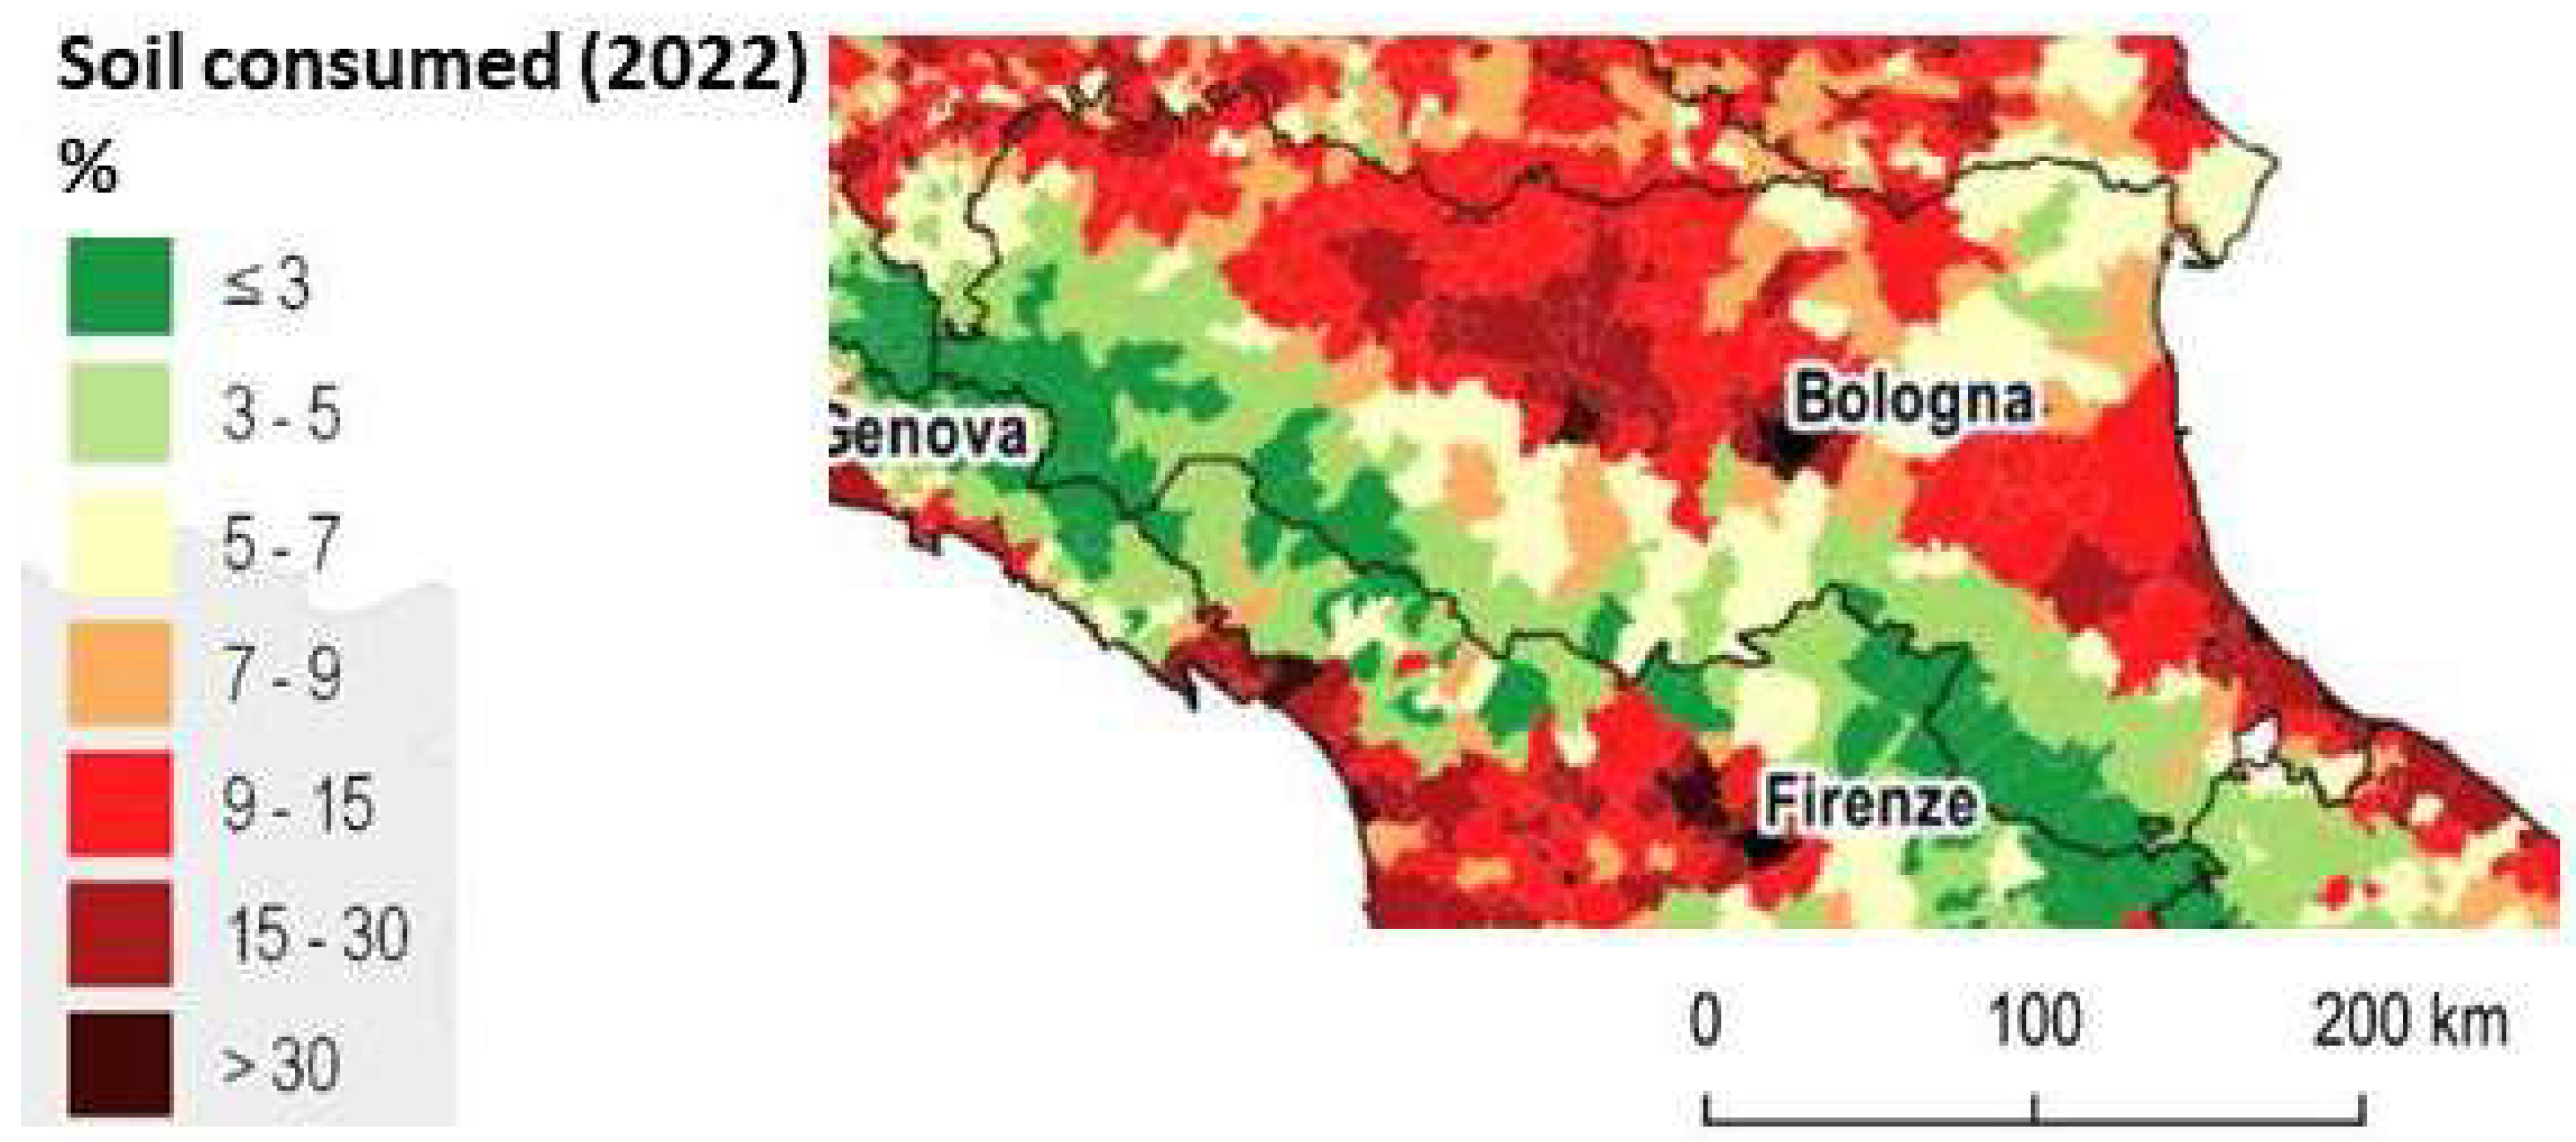
Provinces and Municipalities of the Emilian plain and those of the Adriatic coast (Figure 36) have a density of land consumption above the national average [15]. In addition, there is the concomitance of the level of hydraulic hazard in which 45% of the regional territory falls, i.e., the average level of danger P2 with a return time of 100-200 years, of the three levels recognized by the respective Legislative Decree [1]. The SNPA Report shows that the increase in artificial soil in areas of medium hydraulic hazard at the national level is approximately 917 hectares, of which 433 hectares are in Emilia-Romagna: the increase in land consumption in 2022 compared to the previous year in areas classified P2 was 36%.
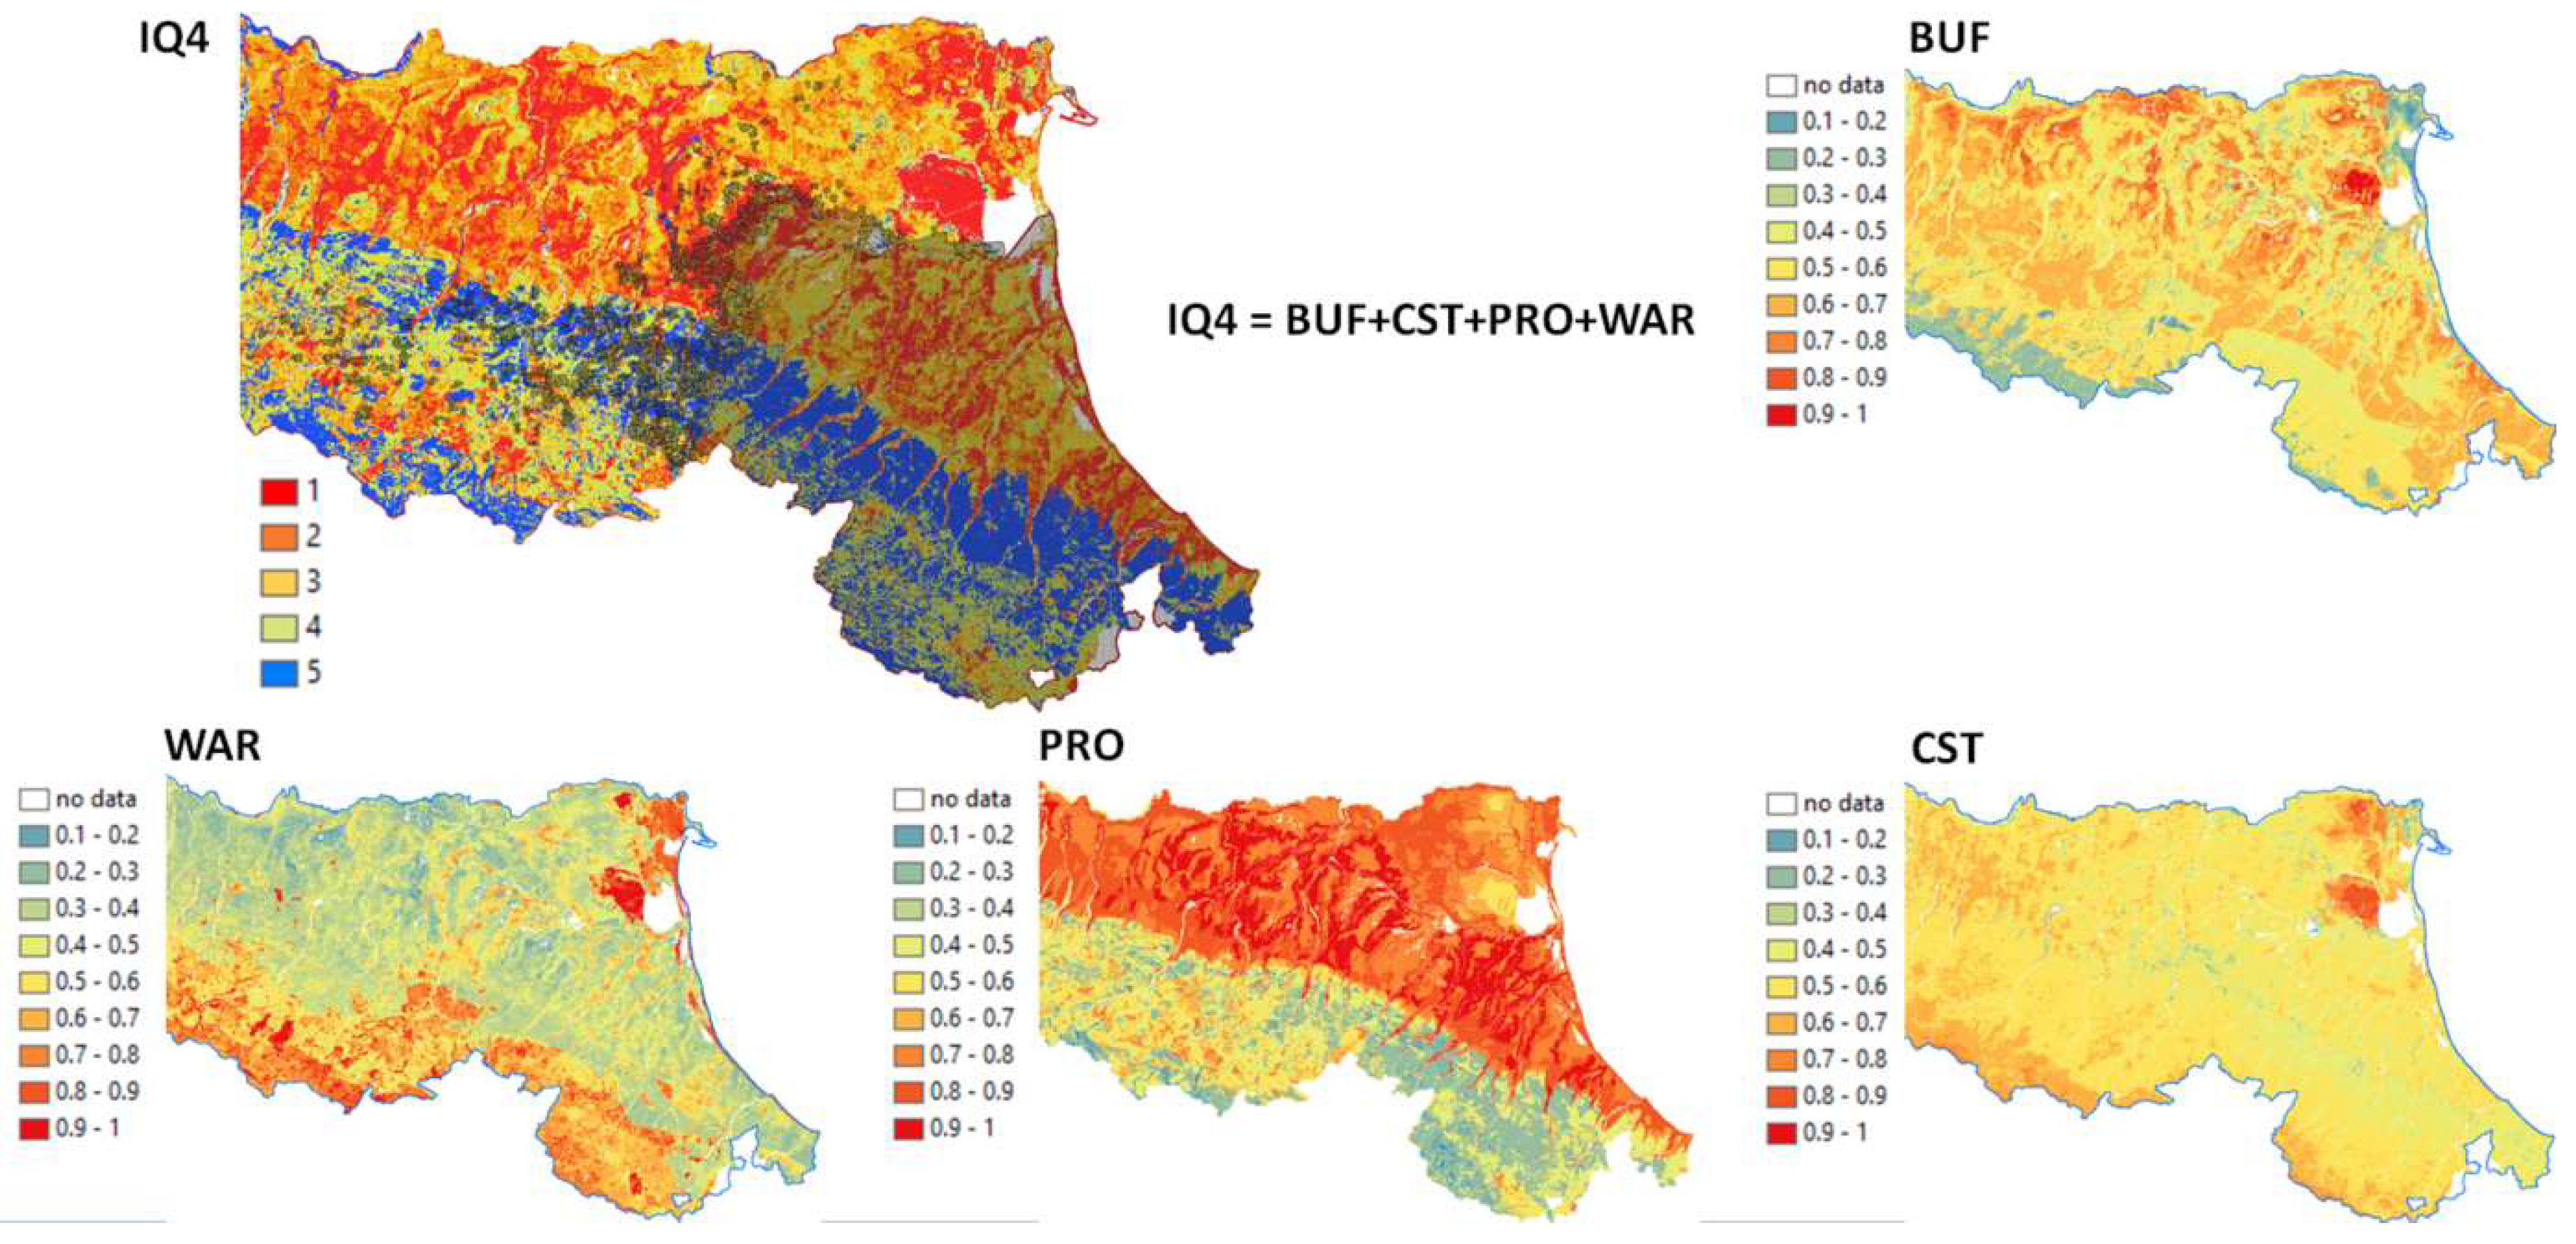
In 2023, the Emilia Romagna Region updated the Charter of Ecosystem Services of regional soils [16] to provide policymakers with documents representing the plurality of ecosystem services through a calibrated approach and conventionally recognized indicators. Some of these may be useful in the present study to understand how much has been temporarily lost (in the short and medium term) with the events of May 2023. In particular, the soil quality index “IQ4” provides a view of soil multifunctionality by summarizing the sum of four ecosystem services (indicators) such as water infiltration (WAR), food supply (PRO), current carbon stock (CST), and soil protective capacity (BUF). In the period represented (prior to 2023), the plain is very fertile, while there is a decrease in fertility continuing towards the Apennine areas. In any case, it should be considered that the Apennine belt, although not having high performance in terms of PRO, has very high values regarding biomass production. It is not represented in the IQ4 index but is still significant. The WAR service brings out the soils available to allow rainwater infiltration by regulating the runoff and recharging the aquifers: low values are found in the low alluvial plain and the delta part. Moderately high to high values pass from the lower to the middle Apennines up to the upper Apennines. In particular, we know this service has been completely canceled since the first event on May 1-3, which completely saturated the ground. The reason why the second event led to the collapse of the balance of many systems/ecosystems. The BUF protects the soils and highlights the areas most vulnerable to pollution linked to groundwater quality.
Figure 37. Representation of the IQ4 Soil Quality Index, given by the sum of ecosystem services water infiltration (WAR), food supply (PRO), current carbon stock (CST), and soil protective capacity (BUF), Source: Emilia-Romagna Region [16]. The area subject to the events of May 2023 is dotted in black.
Preprints 117129 g037
From an infrastructural point of view, the damage caused by the flooding of watercourses and landslides was significant. It involved the motorway, the primary and secondary roads, and the railway network. In the six provinces involved, 1950 road infrastructures were disrupted, i.e., 3.6% of the entire road layout of the six provinces: the most significant damage occurred on municipal roads (36.2% of the sections impacted), neighborhood roads for public use (35.7% of the sections) and private roads (18.5% of the sections). About the railway network, 14 landslides caused damage, in particular on the Bologna-Florence and Faenza-Florence sections: the first section was restored in a few days, the second suffered more significant damage and saw a long period of interruption of service to restore the structure. The landslides continued in the following days due to the settlement of the various types of land saturated with water, continuing to cause interruptions on the road networks, isolating the population and gradually increasing the number of displaced persons.
The water that poured into the inhabited centers generated interruptions of services and flooding of structures and buildings. Furthermore, they quickly filled the sewage systems and underground services, saturating them and leading to the spreading of the volumes of material contained in them. The high percentage of waterproofed surfaces characteristic of built-up areas has worsened the situation, contributing to the increase in runoff volumes and further favoring rapid runoff times without allowing water infiltration. A problem of health risk management in areas where stagnant water persisted also emerged in a short time, addressed through the dissemination of a health vademecum [17] drawn up by the Department of Public Health of the Ausl Romagna concerning the main indications to be put into practice in the clearing and cleaning operations in progress [18].
In the six provinces involved in the events described above, the real estate, civil and cultural, public and private heritage suffered significant damage: at least 15000 buildings flooded in the countryside, not to mention those in inhabited centers, which were also heavily affected. The damage depended on physical and non-physical actions and concerned the buildings’ structural parts, finishes, and the integrity of the buildings themselves. The most affected parts were the basement and basement floors, but in some areas (also based on the orography of the territory), they also affected the ground and raised floors. Several actions can cause damage to buildings, all of which occurred during and after the two exceptional events. Hydrodynamic actions – due to the force and speed of the water – which cause damage from dragging and breakthrough. Hydrostatic actions – due to capillary upwelling and lateral hydrostatic pressure – which can cause damage to foundations (up to collapse) and capillary rising phenomena and gradual degradation of the building material. Erosion actions – which can undermine foundations and consequently cause structural failure. The buoyancy actions, which act asymmetrically on the structure, depending on whether the construction type is asymmetrical or the subsoil of the building is heterogeneous – the saturated subsoil can reduce the bearing capacity of the soil and generate subsidence at the level of the foundations; Cracks and cracks can also be created on load-bearing walls. The actions of debris, erosion, and sedimentation are both basic and imply significant disposal costs (when possible). Then there are the non-physical, chemical, and biological contaminating actions, ranging from the pollution of flood water with industrial waste, detergents, dyes, sewage, vegetation, and microorganisms, up to the chemical aggression of materials and the formation of mold and fungi. All these actions described above have different temporal evolutions, and the actions for restoration must consider this aspect, as well as the possible reversibility of the damage [19].
Damage to movable and immovable cultural property belonging to cultural heritage concerns losses in terms of monumental plant specimens (parks and historic gardens), archaeological sites, and monumental buildings such as libraries, museums, and places of worship, with further damage to the movable property contained therein.

4. Discussion

While the meteorological causes and associated processes of extreme precipitation events may be clear, the attribution of their significant role in soil effects is a complex matter. It’s not straightforward to conclude that a part of the territory lacked the resilience to protect assets and lives. The forest areas have indeed suffered high impacts, leading to secondary effects such as river transport and flooding, due to actual structural failures of the specific ecosystem [20]. In many cases, the debris transported by the water caused the plugging of bridges, arches, or underpasses with subsequent flooding of large parts of the territories.
Many forest lands, either abandoned due to low productivity or extensively used by companies, led to a reduction in the care of the territory and the non-maintenance of minor hydraulic networks. The strong regional increase in forest cover, affected by these problems, exacerbated the effects and impacts of intense precipitation episodes. It’s crucial to reevaluate forest management techniques, particularly in sloped areas near alluvial plains, to adapt to these changing conditions.
From an atmospheric dynamics point of view, even if the events analyzed are significantly out of the ordinary, there is an extensive bibliography and centuries-old case history of flooding events [21,22,23,24,25,26]. Understanding these dynamics is crucial for interpreting the meteorological analysis and the series of events that rarely have the possibility of combining, such as the co-presence of a depression system and a flow of high humidity along the side of the Adriatic Sea. This understanding is key to determining whether episodes like those described can be increased and exacerbated by direct links with climate change, as some recent publications [27,28] attempt to answer. What has become extremely clear from these events is that we do not yet have sufficient knowledge not only to be able to exclude their reoccurrence but also to be able to reasonably predict what, in this case, are the ecological, social, and economic connections that risk coming impact in the short term but, above all, in the long term [29]. However, there is potential for change. Arrighi and Domeneghetti focused on the environmental impacts caused by these events and the related metrics [30]. Even the indicators helpful in describing ecosystem services [16] can potentially represent scenarios that simulate chain events (through the use of digital twins) to understand the impacts on the territory in order to understand which areas go into saturation before others and which may be more likely to accommodate prevention works, storage, and accumulation. It should be remembered that the phenomenon of flooding and drought is a two-faced Janus.
On the topic of social differentiation and flood impacts, Houston et al. [31] underscored how the disparities between social groups escalate with the duration of the impacts. This is especially true in the case of small fruit production companies, where the impacts of floods can be long-lasting, requiring the recovery of trees that take a substantial amount of time to bear fruit after replanting.
With regard to the factors influencing flood damage on buildings, Martina [19], in order to make a truthful and socially helpful estimate of the damage, highlights the importance of considering simultaneously the indicators of flood impact, the precautionary indicators, the characteristics of the building, and the characterization of the occupants of the building. The study shows that usually, only one of these factors is used in the estimate, which concerns only the hydraulic part, i.e., the hydrometric height. This structure could also be extended to estimate damages for companies, naturally updating the factors concerning precautions, the structure of the buildings, and the characterization of the components.
The meteorological events have highlighted the dense and subtle network of interrelationships, from hydraulic safety to the ecosystemic value of territorial structures, and the social and economic aspects. It is evident that even in regions with high economic value, this value can only be defended, maintained, and consolidated through the active supervision of the populations. This active involvement of the population is crucial in understanding the changes brought about by human presence and in implementing local policies with foresight. Moreover, the economic consequences are profound, as businesses face repair costs, decreased productivity, and potential closures, leading to job losses and financial strain on local communities. Rebuilding efforts will require substantial investments in infrastructure repair and agricultural revitalization to restore normalcy and stimulate economic recovery in the affected regions. The government and stakeholders must collaborate effectively to address these challenges and implement sustainable solutions for long-term resilience. Furthermore, some policies relating to the sustainable maintenance of forest and woodland areas, including local policy processes for maintaining the permanence of populations and activities, will have to be profoundly revised to guarantee the continuous supervision and stability of ecological systems and preserve them from abandonment.
An open perspective for dealing with this type of events is that of the WMO, a leading international organization in the field of meteorology, relating to the Early Warning 4 All initiative [32]. As reported by the Initiative, “A Multi-Hazard Early Warning System (MHEWS) is an integrated system that allows people to know that hazardous weather or climate events are on their way, and informs how governments, communities, and individuals can act to minimize impacts. MHEWS should be people-centered to empower those threatened by hazards to act in sufficient time and an appropriate manner, and must build on partnerships within and across relevant sectors.”. Thus, the path indicated for resolving situations of great impact, such as those generated by events like this one in Romagna, requires a multifactorial approach. This approach includes territorial monitoring policies, in-depth resource management, and the revision of territorial approaches. Crucially, it is supported by advanced forecast types, which play a key role in providing early warning to populations, thereby enhancing their safety and security.

5. Conclusions

The aftermath of the 2023 flood events in Emilia-Romagna has been profound and multifaceted. One of the immediate consequences has been the displacement of thousands of residents from their homes, resulting in a significant strain on emergency services and resources. The economic impact of the floods has been substantial, with losses in agriculture, infrastructure, and businesses crippling the affected regions. Bridges, roads, and buildings have been severely damaged, disrupting transportation networks and hindering access to crucial services. The agricultural sector has suffered significant losses with flooded fields, ruined crops, and livestock casualties, affecting the livelihoods of many farmers. The environmental repercussions are also severe, with widespread damage to ecosystems, wildlife, and water quality. Moreover, the psychological toll on individuals and communities cannot be understated, as many grapple with trauma, loss, and uncertainty about the future. As single persons, families, governments and organizations work towards recovery and resilience the longer-term implications of the 2023 flood events on the Region must be is crucially considered. This underscores the need for long-term planning and immediate action. A comprehensive approach to rebuilding infrastructure, implementing flood mitigation strategies, and enhancing emergency response systems is essential to prevent similar devastation in the future.

Author Contributions

Conceptualization, P.R., T.G., F.R., M.N. and L.C.; methodology, T.G., F.R. and P.R.; software, P.R.; validation, P.R. and M.F.; formal analysis, M.N., T.G., F.R. and M.F.; investigation, L.C., T.G. and F.R.; resources, L.C., T.G. and M.N.; data curation, P.R. and L.C.; writing—original draft preparation, T.G., F.R. and P.R.; writing—review and editing, L.C., T.G. and M.N.; visualization, L.C., T.G. and M.F.; supervision, T.G.; project administration, T.G. and F.R. . All authors have read and agreed to the published version of the manuscript.

Funding

The study was conducted and funded by the project “OptForEU - OPTimising FORest management decisions for a low-carbon, climate resilient future in Europe” Horizon Europe research and innovation program under grant agreement No. 101060554. Website: https://optforeu.eu/.

Acknowledgments

The authors wish to thank the architect Benedetta Caselli for the documentary support.

Conflicts of Interest

The authors declare no conflicts of interest.

References

  1. Brath, A., Casigli, N., Marani, M., Mercogliano, P., and Motta, R. (2023) Rapporto della Commissione tecnico-scientifica istituita con deliberazione della Giunta Regionale n.984/2023, al fine di analizzare gli eventi meteorologici estremi del mese di Maggio 2023. Regione Emilia-Romagna. pp.147 (in Italian).
  2. Fredi, P., Lupia Palmieri, E. (2017). Morphological Regions of Italy. In: Soldati, M., Marchetti, M. (eds) Landscapes and Landforms of Italy. World Geomorphological Landscapes. Springer, Cham. [CrossRef]
  3. Stefani M (2017) The Po Delta region: depositional evolution, climate change and human intervention through the last 5000 years. In: Soldati M, Marchetti M (eds) Landscapes and landforms of Italy. Springer, Cham, pp 193–202.
  4. Bondesan M., Giovannini A. (2004), Evoluzione geomorfologica della pianura costiera fra Codigoro e Comacchio (Ferrara), Annali dell’Università di Ferrara, sez. Scienze della Terra, 5, 3, pp. 27-38 (in Italian).
  5. Preti D. (1999) Carta Geologica di Pianura dell’Emilia Romagna, edizione 1999 – Regione Emilia Romagna (in Italian).
  6. CNN, 2023. Floods ruin crops and drown livestock in one of Italy’s gastronomic heartlands. Available online: https://edition.cnn.com/2023/05/21/europe/floods-ruin-crops-livestock-italy-intl/index.html (accessed on 23 May 2023).
  7. Reinsurance News, 2023. Massive flooding in Italy to cost billions, highlighting large insurance protection gap: Aon. [Online]. Available online: https://www.reinsurancene.ws/massive-flooding-in-italy-to-cost-billions-highlighting-large-insurance-protection-gap-aon/ (accessed on 23 May 2023).
  8. Rapporto degli eventi meteorologici di piena e di frana dell’1-4 maggio 2023, Arpae Emilia-Romagna - Struttura Idro-Meteo-Clima, Bologna, 03/06/2023.
  9. Rapporto degli eventi meteorologici di piena e di frana del 16-18 maggio 2023, Arpae Emilia-Romagna - Struttura Idro-Meteo-Clima, Bologna 07/07/2023.
  10. Flood Disaster Could Cost Italy €1.5 Billion in Damage to Crops. [Online]. 2023. Available online: https://www.bloomberg.com/news/articles/2023-05-19/flood-disaster-could-cost-italy-1-5-billion-in-damage-to-crops?leadSource=uverify%20wall (accessed on 23 May 2023).
  11. Regione Emilia-Romagna, Agenzia regionale per le erogazioni in agricoltura (AGREA) (in Italian). Available online: https://agreagestione.regione.emilia-romagna.it/agrea-file/UtilizziGrafici/2023/ (accessed on 27th August 2024 ).
  12. Mazzotti, V. Rapporto Agroalimentare 2023. Le azioni della Regione Emilia-Romagna (in Italian). 2023. Available online: https://agricoltura.regione.emilia-romagna.it/agricoltura-in-cifre/rapporto-agroalimentare/rapporto-2023/sistema-agroalimentare-emilia-romagna-rapporto-2023 (accessed on 27th August 2024 ).
  13. Fariborz H., Tie L., Shahid M.A, Schaffer B, Sarkhosh A,2023. Physiological, biochemical, and molecular responses of fruit trees to root zone hypoxia. Environmental and Experimental Botany, Vol 206, 105179, ISSN 0098-8472. [CrossRef]
  14. Kaizad F. Patel, Kenton A. Rod, Jianqiu Zheng, Peter Regier, Fausto Machado-Silva, Ben Bond-Lamberty, Xingyuan Chen, Donnie J. Day, Kennedy O. Doro, Matthew H. Kaufman, Matthew Kovach, Nate McDowell, Sophia A. McKever, J. Patrick Megonigal, Cooper G. Norris, Teri O’Meara, Roberta B. Peixoto, Roy Rich, Peter Thornton, Kenneth M. Kemner, Nick D. Ward, Michael N. Weintraub, Vanessa L. Bailey,2024. Time to anoxia: Observations and predictions of oxygen drawdown following coastal flood events, Geoderma, Vol.444, 116854, ISSN00167061. [CrossRef]
  15. Munafò, M. (a cura di), Consumo di suolo, dinamiche territoriali e servizi ecosistemici. Edizione 2023. Re-port SNPA 37/23, ISBN 978-88-448-1178-5, © Report SNPA, 37/23, Ottobre 2023 (in Italian). 2023. Available online: https://www.snpambiente.it/wp-content/uploads/2023/10/Rapporto_consumo_di_suolo_2023.pdf (accessed on 29th August 2024).
  16. Regione Emilia-Romagna, Carta dei servizi ecosistemici dei suoli della regione Emilia-Romagna - Note illustrative. pp. 42. Available online: https://ambiente.regione.emilia-romagna.it/it/geologia/suoli/suoli-pianificazione/servizi-ecosistemici-del-suolo (accessed on 27th August 2024).
  17. Regione Emilia-Romagna, Prime indicazioni e norme di comportamento per i cittadini residenti nelle zone alluvionate e per i volontari coinvolti (in Italian). Available online: https://salute.regione.emilia-romagna.it/notizie/regione/2023/maggio/25-03-2023-vademecum-sanitario-alluvione-rer.pdf/@@download/file/25.03.2023%20Vademecum%20sanitario%20alluvione%20RER.pdf (accessed on 29th August 2024).
  18. Regione Emilia-Romagna, Alluvione, ecco le raccomandazioni utili a cui attenersi per gestire il rischio sanitario nelle zone in cui permangono acque stagnanti a seguito degli eventi alluvionali dei giorni scorsi (in Italian). Available online: https://salute.regione.emilia-romagna.it/notizie/regione/2023/maggio/raccomandazioni-utili-gestire-il-rischio-sanitario (accessed on 29th August 2024).
  19. Martina. M., Le azioni dell’alluvione sui fabbricati civili ed i danni conseguenti. ISPRA, Workshop “Valutazione del rischio idraulico” (in Italian). Available online: https://www.isprambiente.gov.it/it/archivio/eventi/anno-2012/valutazione-del-rischio-idraulico-in-ambito-montano-ed-applicazione-della-direttiva-alluvioni-Bolzano-3-4-maggio-2012/documenti-presentati-1 (accessed on 29th August 2024).
  20. Brath, A., Alluvione in Emilia Romagna: Il Rapporto Tecnico. Ecoscienza 2, 2024 (in Italian).
  21. Sioni, F., Davolio, S., Grazzini, F., and Giovannini, L., Revisiting the atmospheric dynamics of the two century floods over north-eastern Italy. Atmospheric Res., 286 (2023).
  22. Antolini, G., Auteri, L., Pavan, V., Tomei, F., Tomozeiu, R., and Marletto, V. . A daily high-resolution gridded climatic data set for Emilia-Romagna, Italy, during 1961-2010. International Journal of Climatology, 2016. [CrossRef]
  23. Bertó, A., Buzzi, A., Zardi, D., A warm conveyor belt mechanism accompanying extreme precipitation events over north-eastern Italy Hrvatski meteorološki časopis, 40 (40) (2005), pp. 338-341.
  24. Persiano, S., Ferri, E., Antolini, G., Domeneghetti, A., and Pavan, V., Changes in seasonality and magnitude of sub-daily rainfall extremes in Emilia-Romagna (Italy) and potential influence on regional rainfall frequency extimation. J. Hydrology 32 (2020).
  25. Pistocchi, A., Calzolari, C., And Maluccelli, F., Soil sealing and flood risks in the plains of Emilia-Romagna. J. Hydrology, 4 (2015).
  26. Maluccelli, F., Certini, G., Scalenghe, R., Soil is brown gold in the Emilia-Romagna region, Italy. Land Use Policy, 39, 350-357.
  27. Dorrington, J., Wenta, M., Grazzini, F., Magnusson, L., Vitart, L., and Grams, C.M., Precursors and pathways: Dinamically informed extreme event forecasting demonstrated on the historic Emilia-Romagna 2023 flood. EGUsphere, 415 (2024).
  28. Barnes, C., Faranda, D., Coppola, E., Grazzini, F., Zachariah, M., Lu, C., Kimutai, J., Pinto, I., Mardighan Pereira, C., Sengupta, S., Vahlberg, M., Singh, R., Heirich, D, and Otto, F. E.L., Limite net role fro climate change in heavy spring rainfall in Emilia- Romagna. Imperial College, London, https://spiral.imperial.ac.uk/handle/10044/1/104550.
  29. Ecoscienza, Special number L’alluvione in Emilia Romagna. 5, 2023, pp. 90 (in Italian).
  30. Arrighi, C., and Domeneghetti, A., Brief communication: On the environmental impacts of the 2023 floods in Emilia-Romagna (Italy). Nat. Hazards Earth Syst. Sci. 24, 673-679. 2024.
  31. Houston, D. , Werritty, A., Ball, T., and Black, A., Environmental vulnerability and resilience: Social differentiation in short- and long-term flood impacts. Trans. Inst. Br. Geogr. 2021; 46, 102–119. [Google Scholar]
  32. WMO, Earfly warning 4 All Initiative. Available online: https://wmo.int/activities/early-warnings-all/wmo-and-early-warnings-all-initiative (accessed on 26th August 2024).
Figure 1. Geopotential, temperature, and wind analysis maps at 500 hPa from the IFS-ECMWF model at 12 UTC on May 2, 2023 (left) and at 12 UTC on May 3, 2023 (right) [8].
Preprints 117129 g001
Figure 2. a. Surface pressure fields 12 UTC 02/05/2023. Source: IFS-ECMWF. b. Geopotential at 700 hPa 12 UTC 02/05/2023. Source: GFS model.
Preprints 117129 g002aPreprints 117129 g002b
Figure 3. Anomalies in precipitable water (mm) at 12 UTC (left) and 18 UTC (right) 02/05/2023. Source: ECMWF ERA5 Reanalisys. Plot Meteologix.
Preprints 117129 g003
Figure 4. Synoptique composite image 12 UTC (left) e 18 UTC (right) 02/05/2023. Source: ECMWF ERA5 Reanalisys. Plot Meteologix.
Preprints 117129 g004
Figure 5. Wind speed and direction at 10 m in km/h 12 UTC 02/05/2024 Source: Europe Swiss HD Nowcast model meteologix.
Preprints 117129 g005
Figure 6. Radiosounding 12 UTC 02/05/2023, Station S. P. Capofiume (BO). Source: ARPAE network.
Preprints 117129 g006
Figure 7. Analysis of the geopotential, temperature and wind at 850 hPa 00 UTC 16/05/2023 (left) and at the surface 00 UTC 17/05/2023 (right). Source: IFS-ECMWF model and AMI [9].
Preprints 117129 g007
Figure 8. Humidity transport at 1000 hPa (lines) e TCW (colors) 00 (left) eand 15 (right) UTC 16/05/2023. Source: IFS-ECMWF elaboration eumetrain.org.
Preprints 117129 g008
Figure 9. Geopotential analysis 700 hPa (black lines) and IVT (colors and vectors) 06 UTC 16/05/2023. Source: GFS model.
Preprints 117129 g009
Figure 10. Anomalies in precipitable water (mm) 12 UTC (left) and 21 UTC (right) 16/05/2023. Source: ECMWF ERA5 Reanalisys. Plot Meteologix.
Preprints 117129 g010
Figure 11. Wind analysis at 10 m in km/h 08 UTC 16/05/2024. Source: Europe Swiss HD Nowcast model meteologix.
Preprints 117129 g011
Figure 12. Pseudo-sounding 18 UTC 16/05/2023 on Casola Valsenio (RA). Source: ERA-5 reanalysis, plot thundeR.
Preprints 117129 g012
Figure 13. Cumulated precipitation in the Idice basin events 1-3 and 16-17 May 2023. Source: ARPAE network.
Preprints 117129 g013
Figure 14. Cumulated precipitation in the Lamone basin events 1-3 and 16-17 May 2023. Source: ARPAE network.
Preprints 117129 g014
Figure 15. Cumulated precipitation in the Marecchia basin events 1-3 and 16-17 maggio 2023. Source: rete ARPAE.
Preprints 117129 g015
Figure 16. Cumulated precipitation in the Fiumi Uniti basin, events 1-3 and 16-17 maggio 2023. Source: rete ARPAE.
Preprints 117129 g016
Figure 17. Accumulated precipitation in the Montone basin events 1-3 and 16-17 May 2023. Source: ARPAE network.
Preprints 117129 g017
Figure 18. Cumulated precipitation in the Navile-Savena basin events 1-3 and 16-17 May 2023. Source: ARPAE network.
Preprints 117129 g018
Figure 19. Cumulated precipitation in the Ronco basin events 1-3 and 16-17 May 2023. Source: ARPAE network.
Preprints 117129 g019
Figure 20. Cumulated rainfall in the Samoggia basin events 1-3 and 16-17 May 2023. Source: ARPAE network.
Preprints 117129 g020
Figure 21. Cumulated precipitation in the Santerno basin events 1-3 and 16-17 May 2023. Source: ARPAE network.
Preprints 117129 g021
Figure 22. Cumulated precipitation in the Savio basin events 1-3 and 16-17 May 2023. Source: ARPAE network.
Preprints 117129 g022
Figure 23. Cumulated precipitation in the Senio basin events 1-3 and 16-17 May 2023. Source: ARPAE network.
Preprints 117129 g023
Figure 24. Cumulated rainfall in the Sillaro basin events 1-3 and 16-17 May 2023. Source: ARPAE network.
Preprints 117129 g024
Figure 25. Summary of average precipitation per basin; events 1-3 and 16-17 May 2023. Source: ARPAE network.
Preprints 117129 g025
Figure 26. Maximum cumulative rainfall in mm 1-3 and 16-17 May 2023. Source: ARPAE network.
Preprints 117129 g026
Figure 27. The whole Romagna basin with in black the rivers that flooded and in red the one which reached an attention level. Source: ARPAE Emilia-Romagna.
Preprints 117129 g027
Figure 28. a. The flooded area on 17th May 2023. Source: Copernicus EMS. b. The situation in terms of losses and impacts on 1st June 2023. Source: ERCC EU.
Preprints 117129 g028aPreprints 117129 g028b
Figure 29. Composite image of Molinella with the impact of flood on the territory and the economic losses for residential buildings. Source: ESA.
Preprints 117129 g029
Figure 30. Findings of thick muddy transport on agricultural areas. Source: T.Georgiadis personal collection.
Preprints 117129 g030
Figure 31. Landslides (in red) and the regional border (in black). Source: Emilia-Romagna Region [1].
Preprints 117129 g031
Figure 32. Distribution of the areal extension in km2 of landslides by Province [1].
Preprints 117129 g032
Figure 33. Distribution of the landslide index by Province [1].
Preprints 117129 g033
Figure 34. Distribution of the orchards systems in the flooded areas. Source: AGREA [11] [https://agreagestione.regione.emilia-romagna.it/agrea-file/UtilizziGrafici/2023/].
Preprints 117129 g034
Figure 35. Forest cover maps from 1936 and 2014, Regione Emilia-Romagna [1].
Preprints 117129 g035
Figure 36. Land consumed at municipal level, Source: ISPRA elaborations on SNPA cartography [15].
Preprints 117129 g036
Table 1. Additional precipitation episodes.
STATION m a.s.l. Prec. May 2023 mm Climate May mm Climate year mm
Trebbio (FC) 570 609,8 82,6 925,5
S. Cassiano (RA) 226 573,2 87,5 980,9
C. Valsenio (RA) 154 564,4 79,9 913,7
M.te Albano (RA) 480 530,0 83,3 920,8
Table 2. Variation of gross Marketable Production (GMP) in 2023 with respect to the previous year. Ri-elaborated by Mazzotti [12].
GMP 2022 GMP 2023 % VARIATION (2022/23)
FRUIT ORCHARDS 649,62 463,75 -28,6%
WINE 388,27 440,95 13,6 %
OTHERS (Olive oil etc) 36,9 19,16 -48,1%
CEREALS 835,36 583,54 -30,1%
POTATOES, HORTICOLTURAL CROPS 598,25 685,26 14,5%
INDUSTRIAL CROPS 132,55 110,72 -16,5%
OTHERS (seedlings, etc) 399,88 221,33 -44,7%
TOTAL CROP PRODUCTION 3040,86 2524,71 -17%
ANIMAL HUSBANDRY (TOTAL) 2839,98 2812,23 -1%
Disclaimer/Publisher’s Note: The statements, opinions and data contained in all publications are solely those of the individual author(s) and contributor(s) and not of MDPI and/or the editor(s). MDPI and/or the editor(s) disclaim responsibility for any injury to people or property resulting from any ideas, methods, instructions or products referred to in the content.
Copyright: This open access article is published under a Creative Commons CC BY 4.0 license, which permit the free download, distribution, and reuse, provided that the author and preprint are cited in any reuse.
Prerpints.org logo

Preprints.org is a free preprint server supported by MDPI in Basel, Switzerland.

Subscribe

© 2024 MDPI (Basel, Switzerland) unless otherwise stated